
A Study of the Influence of Fin Parameters on Porous-Medium Approximation

Abstract
1. Introduction
- To verify the accuracy of the PM approach in equivalently simulated fluid-flow and heat-transfer processes for straight fins and serrated fins by comparison with experimental results;
- To quantify the efficiency of the PM approach in saving computational time by comparing the simulation computation time;
- To explore the influence of the fin aspect ratio (a*) and different flow conditions (Re) on the flow calculations with the PM approach;
- To explore the influence of the afin-specific surface area (Asf) and porosity (γ) on the heat-transfer calculations with the PM approach.
2. Numerical Simulation
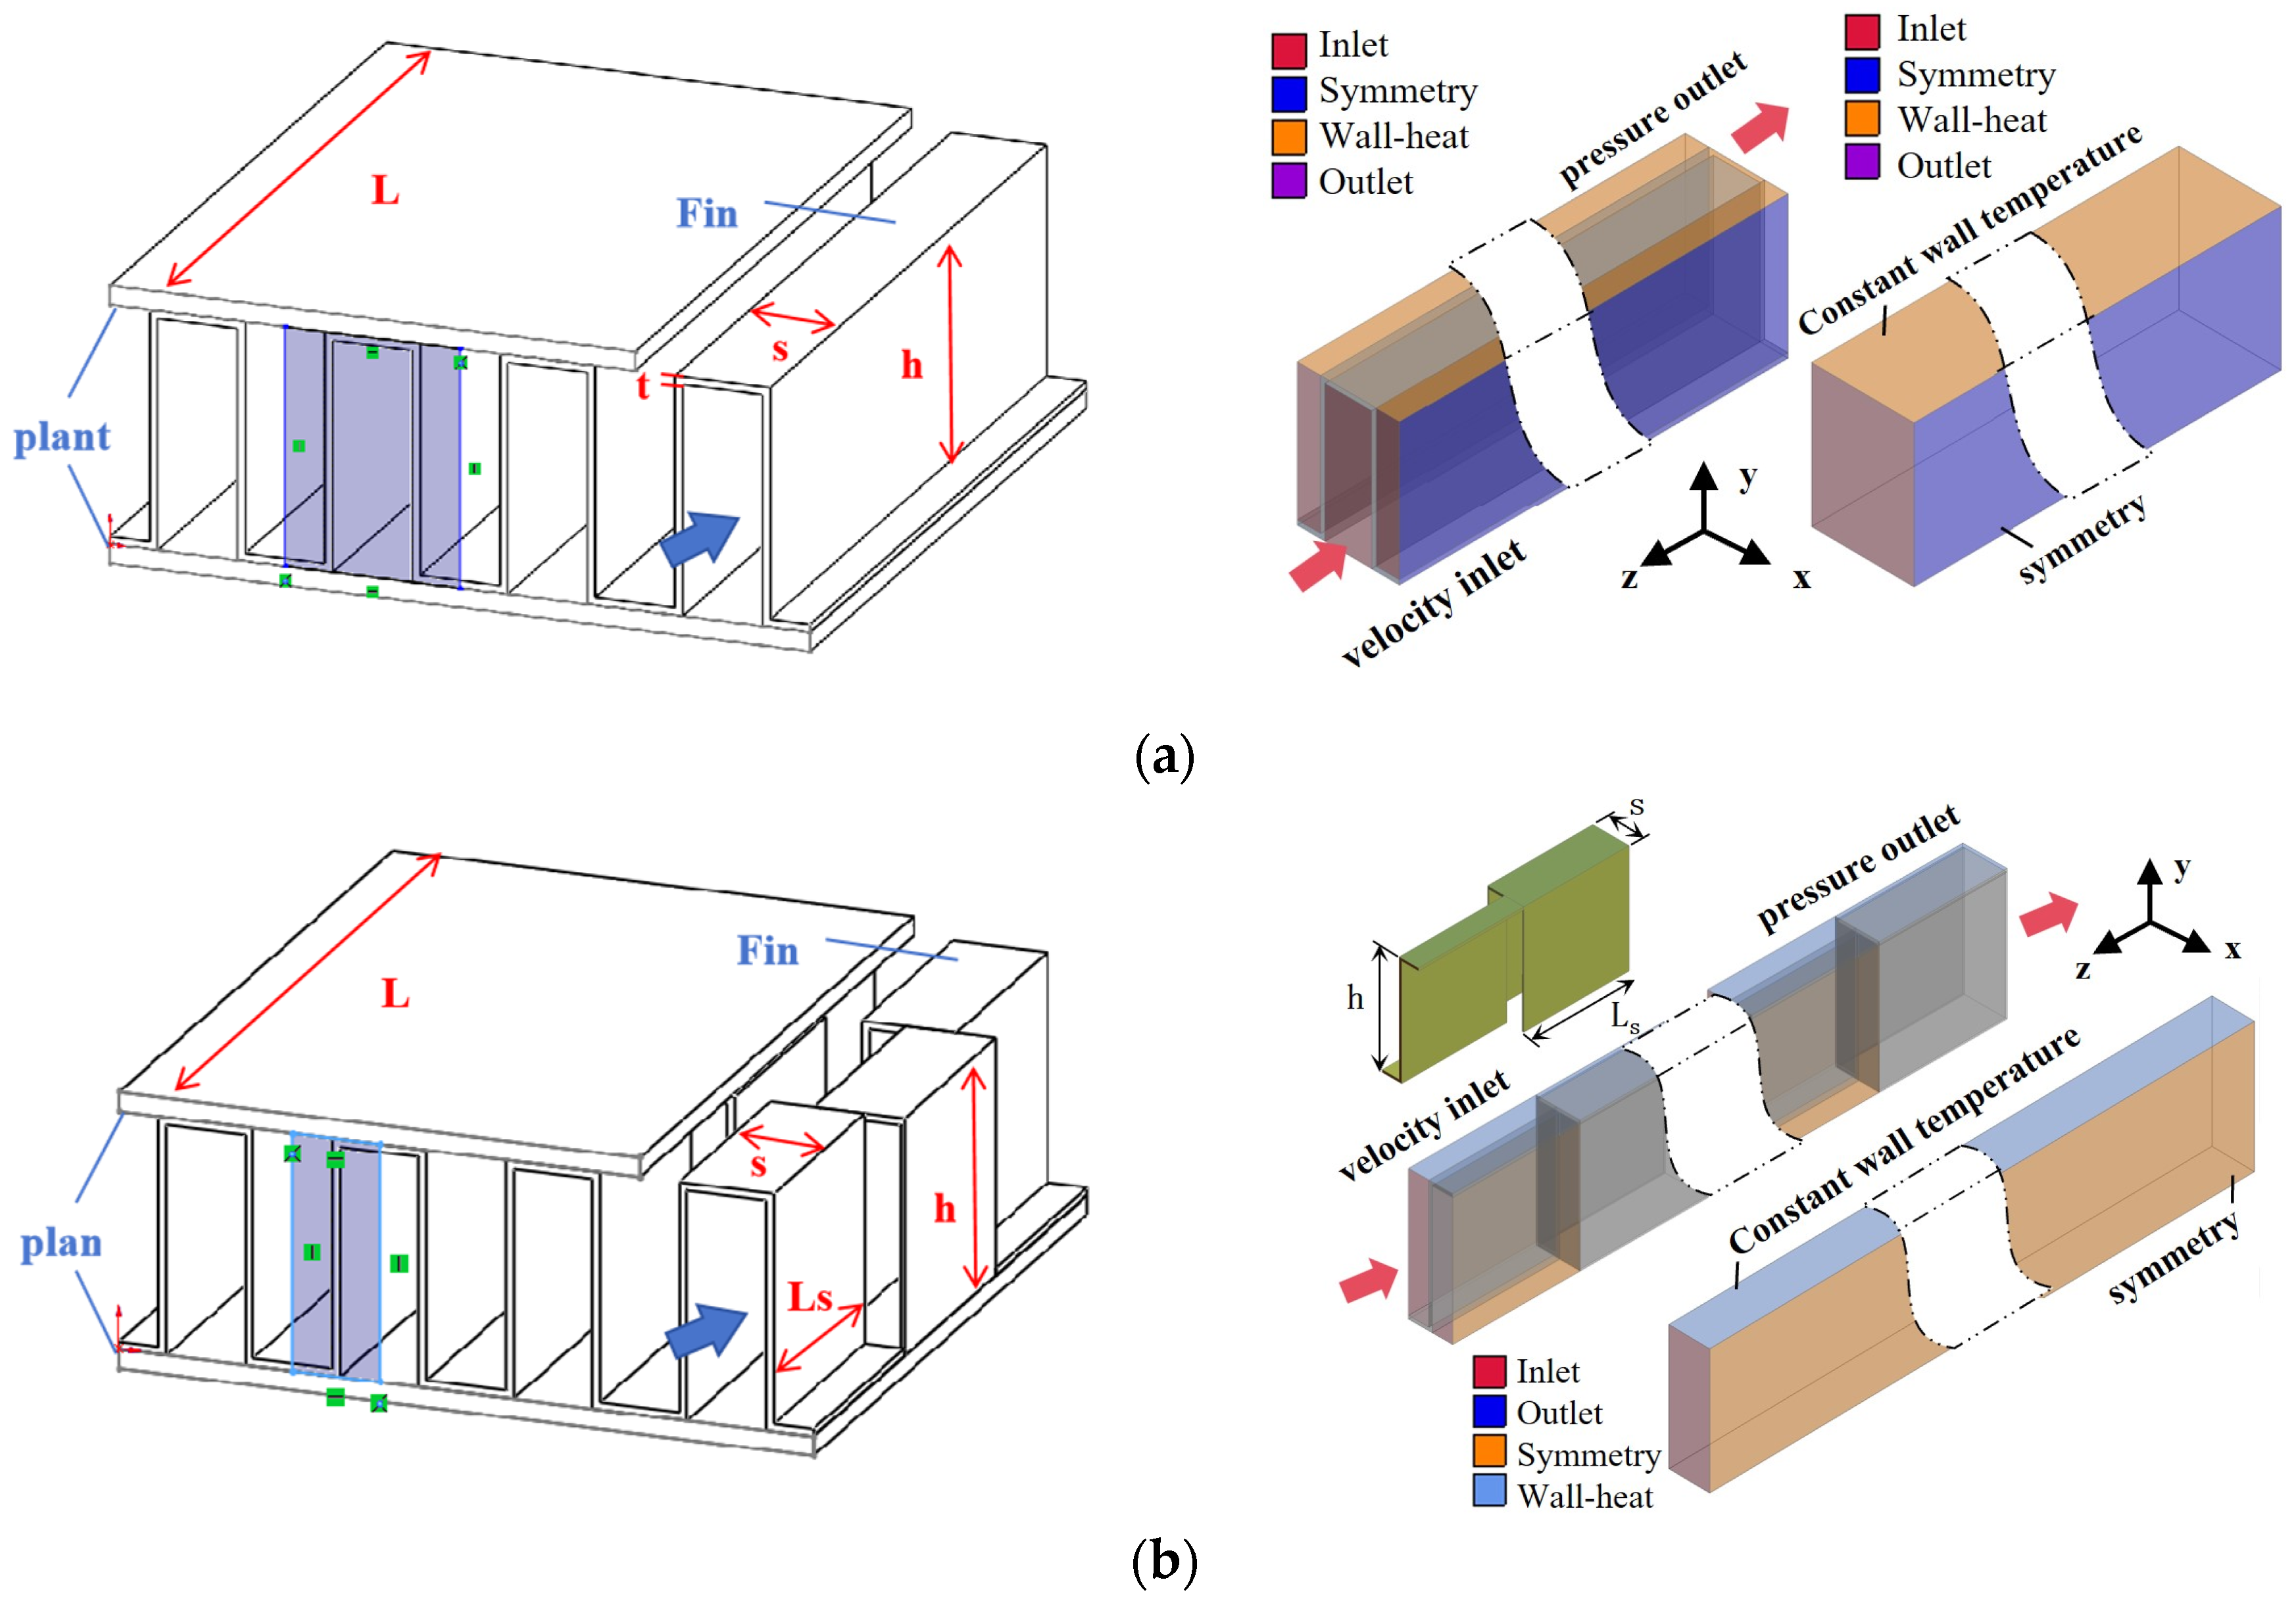
2.1. Physical Model
2.2. Initial and Boundary Conditions
- The study considers the fin models under stable conditions that reach dynamic equilibrium. Therefore, a steady-state model is employed, assuming homogeneous PM properties within the fin channel;
- The flow characteristics in adjacent channels are remarkably similar, and the fins are symmetrically distributed in the structure. This allows for the selection of representative units with symmetrical boundary conditions for simulation;
- The thickness of the straight plate is significantly smaller than the height of the fins, allowing us to disregard the straight plate’s thermal resistance;
- Radiation heat transfer is considered negligible.
2.3. Governing Equations
2.3.1. Momentum Equation
2.3.2. Momentum Equation
3. Model Validation
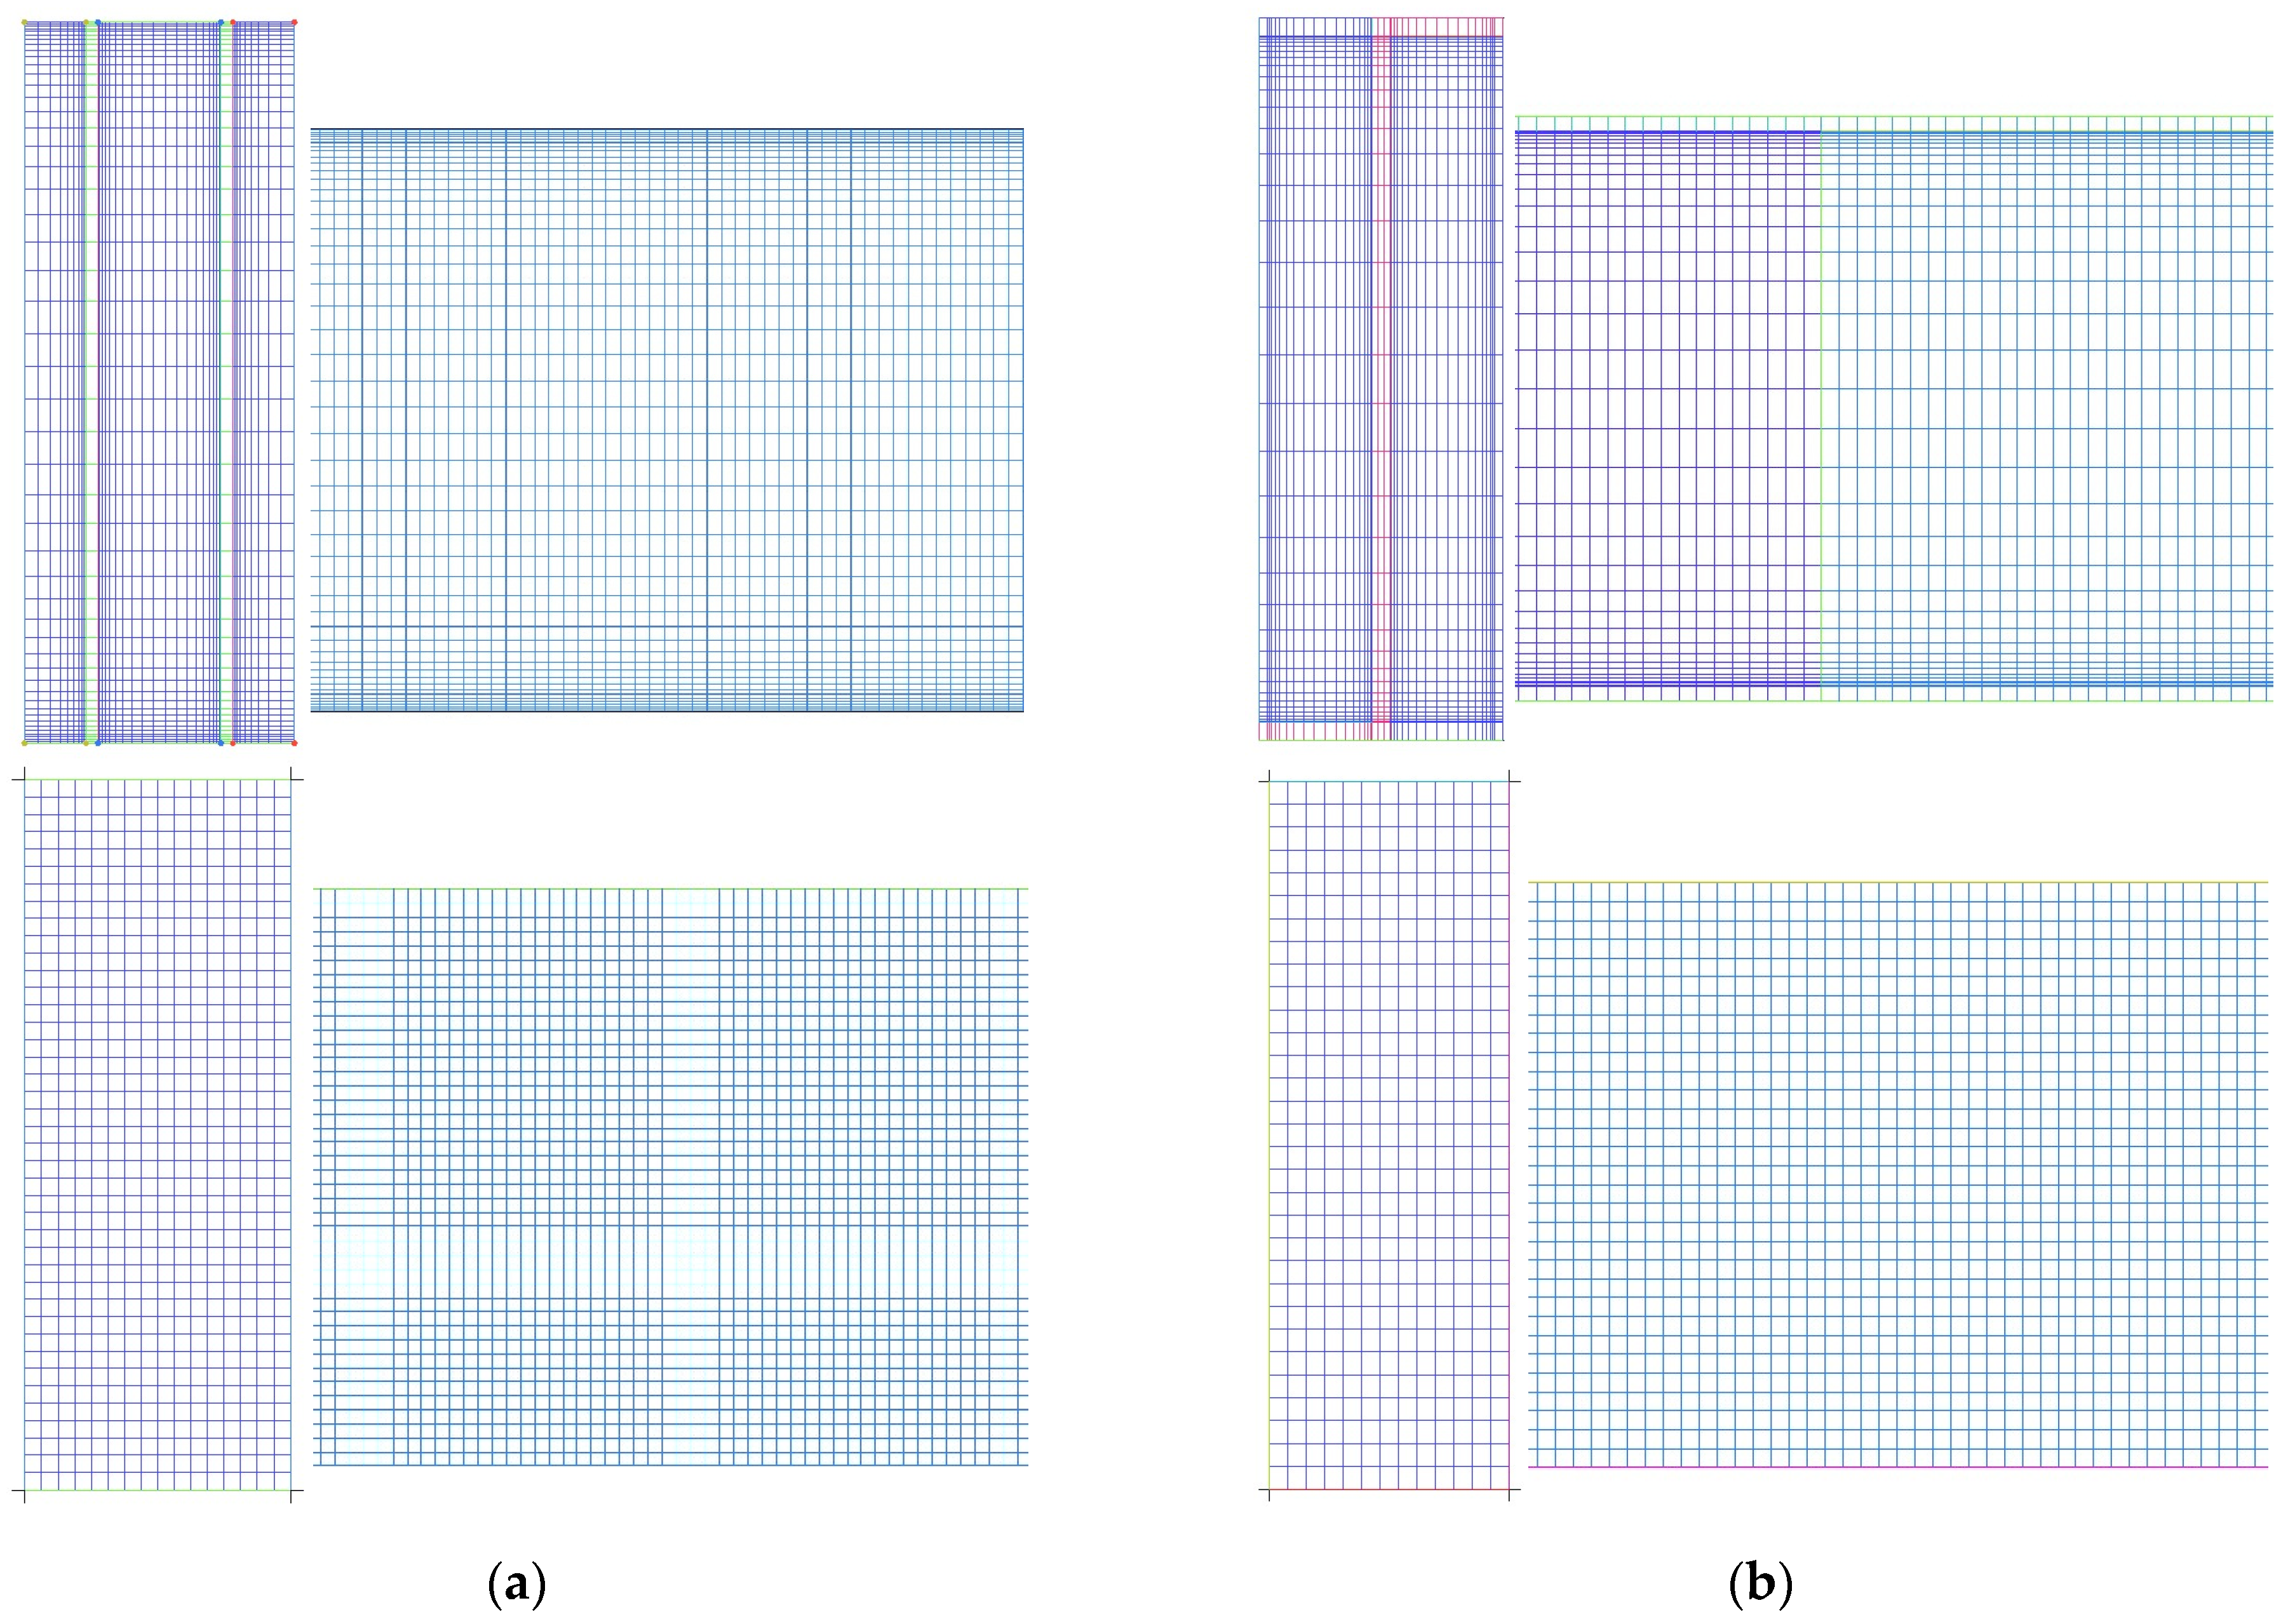
3.1. Grid-Independence Analysis
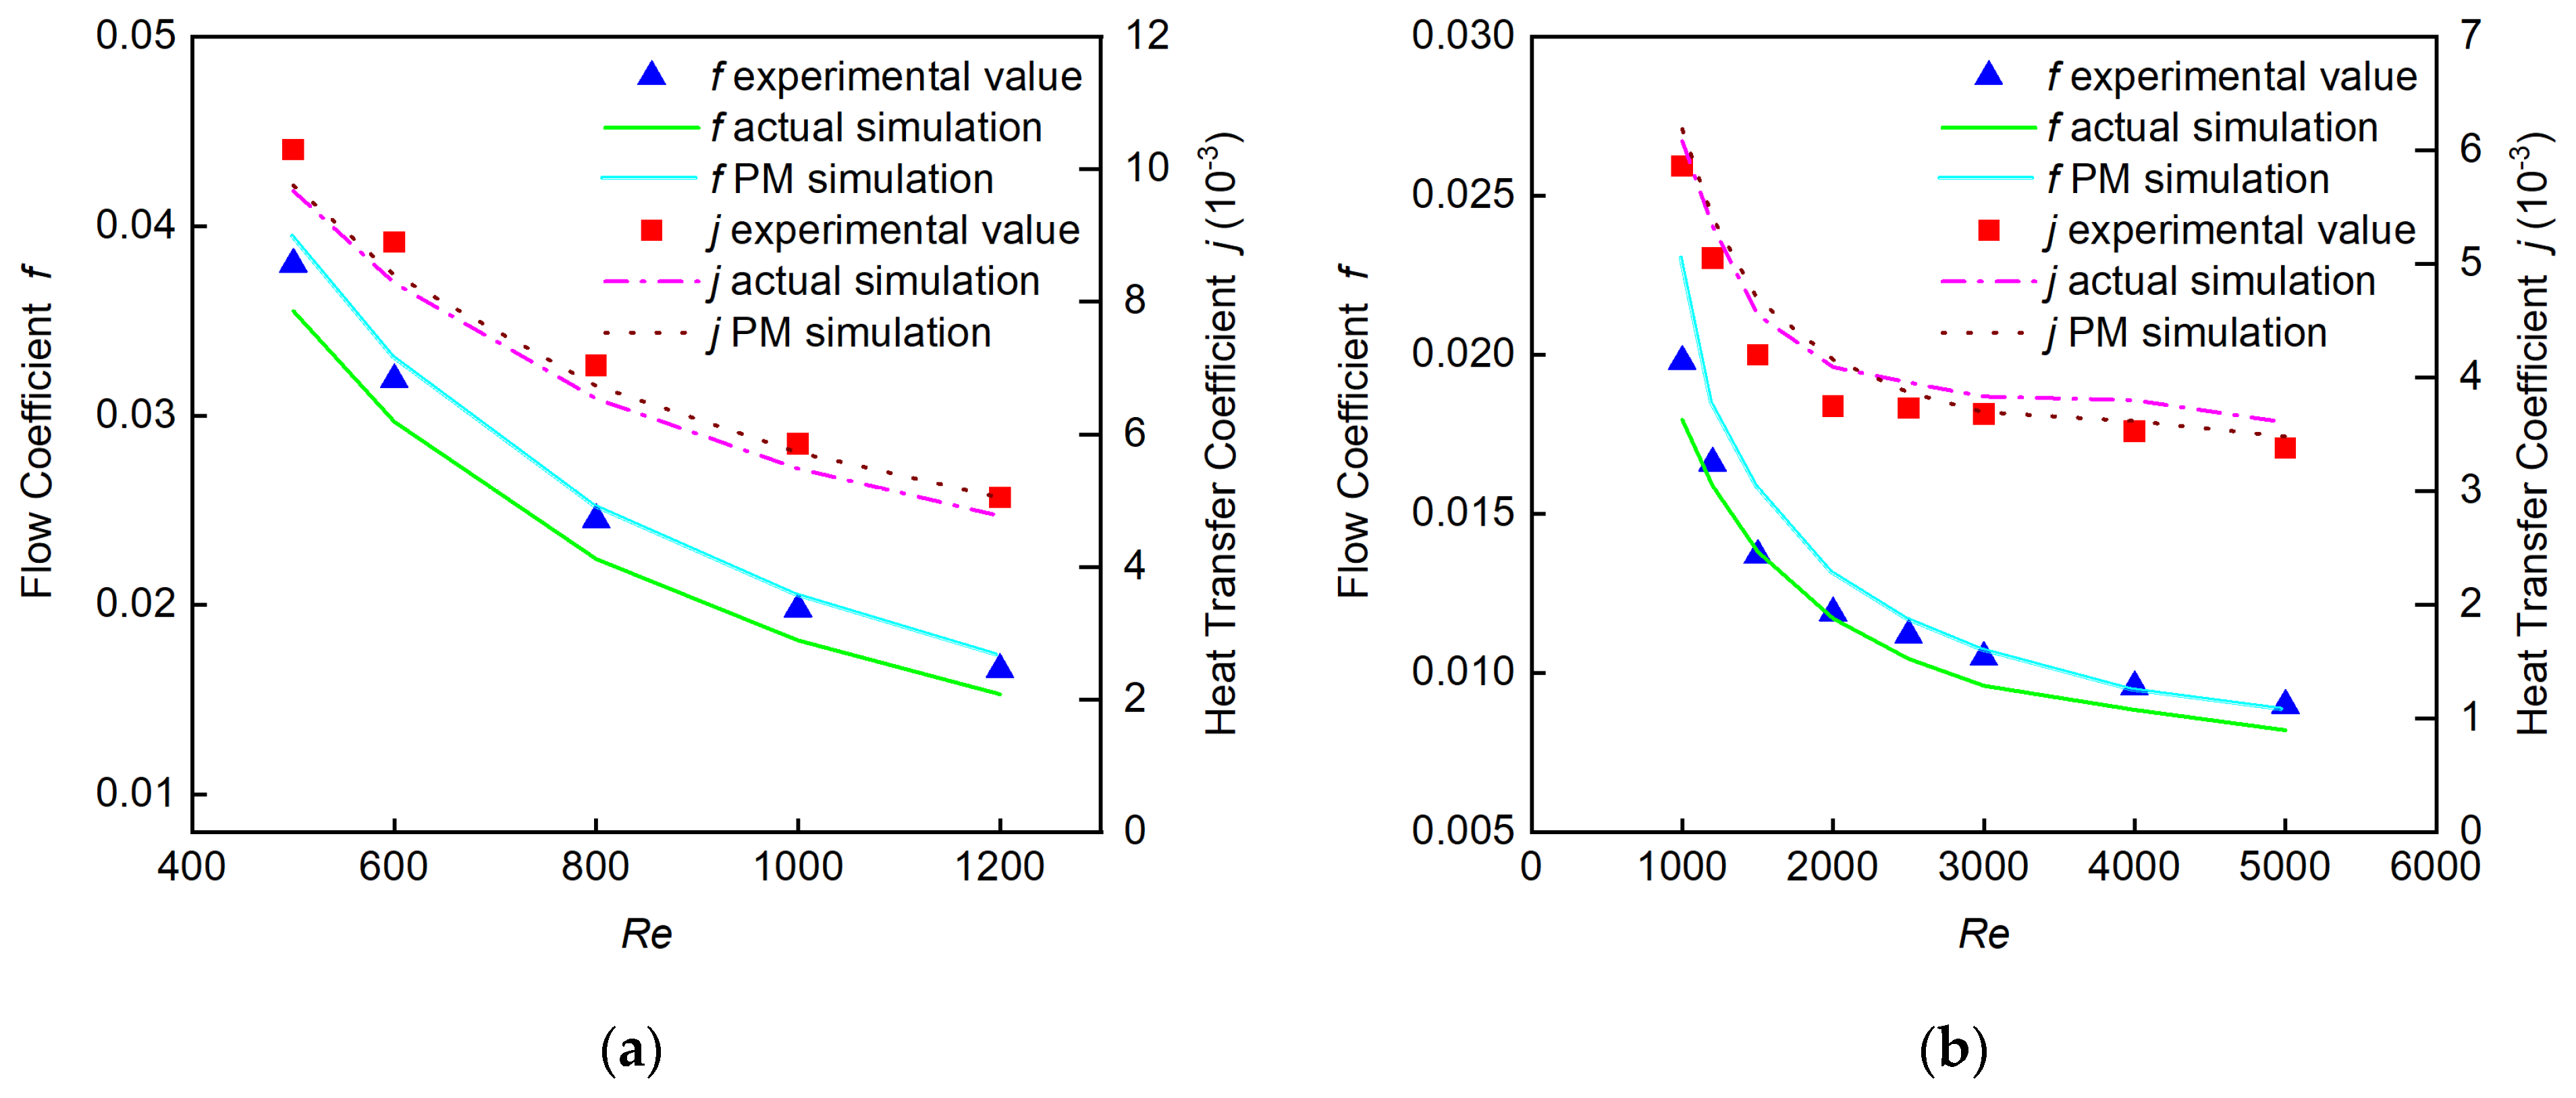
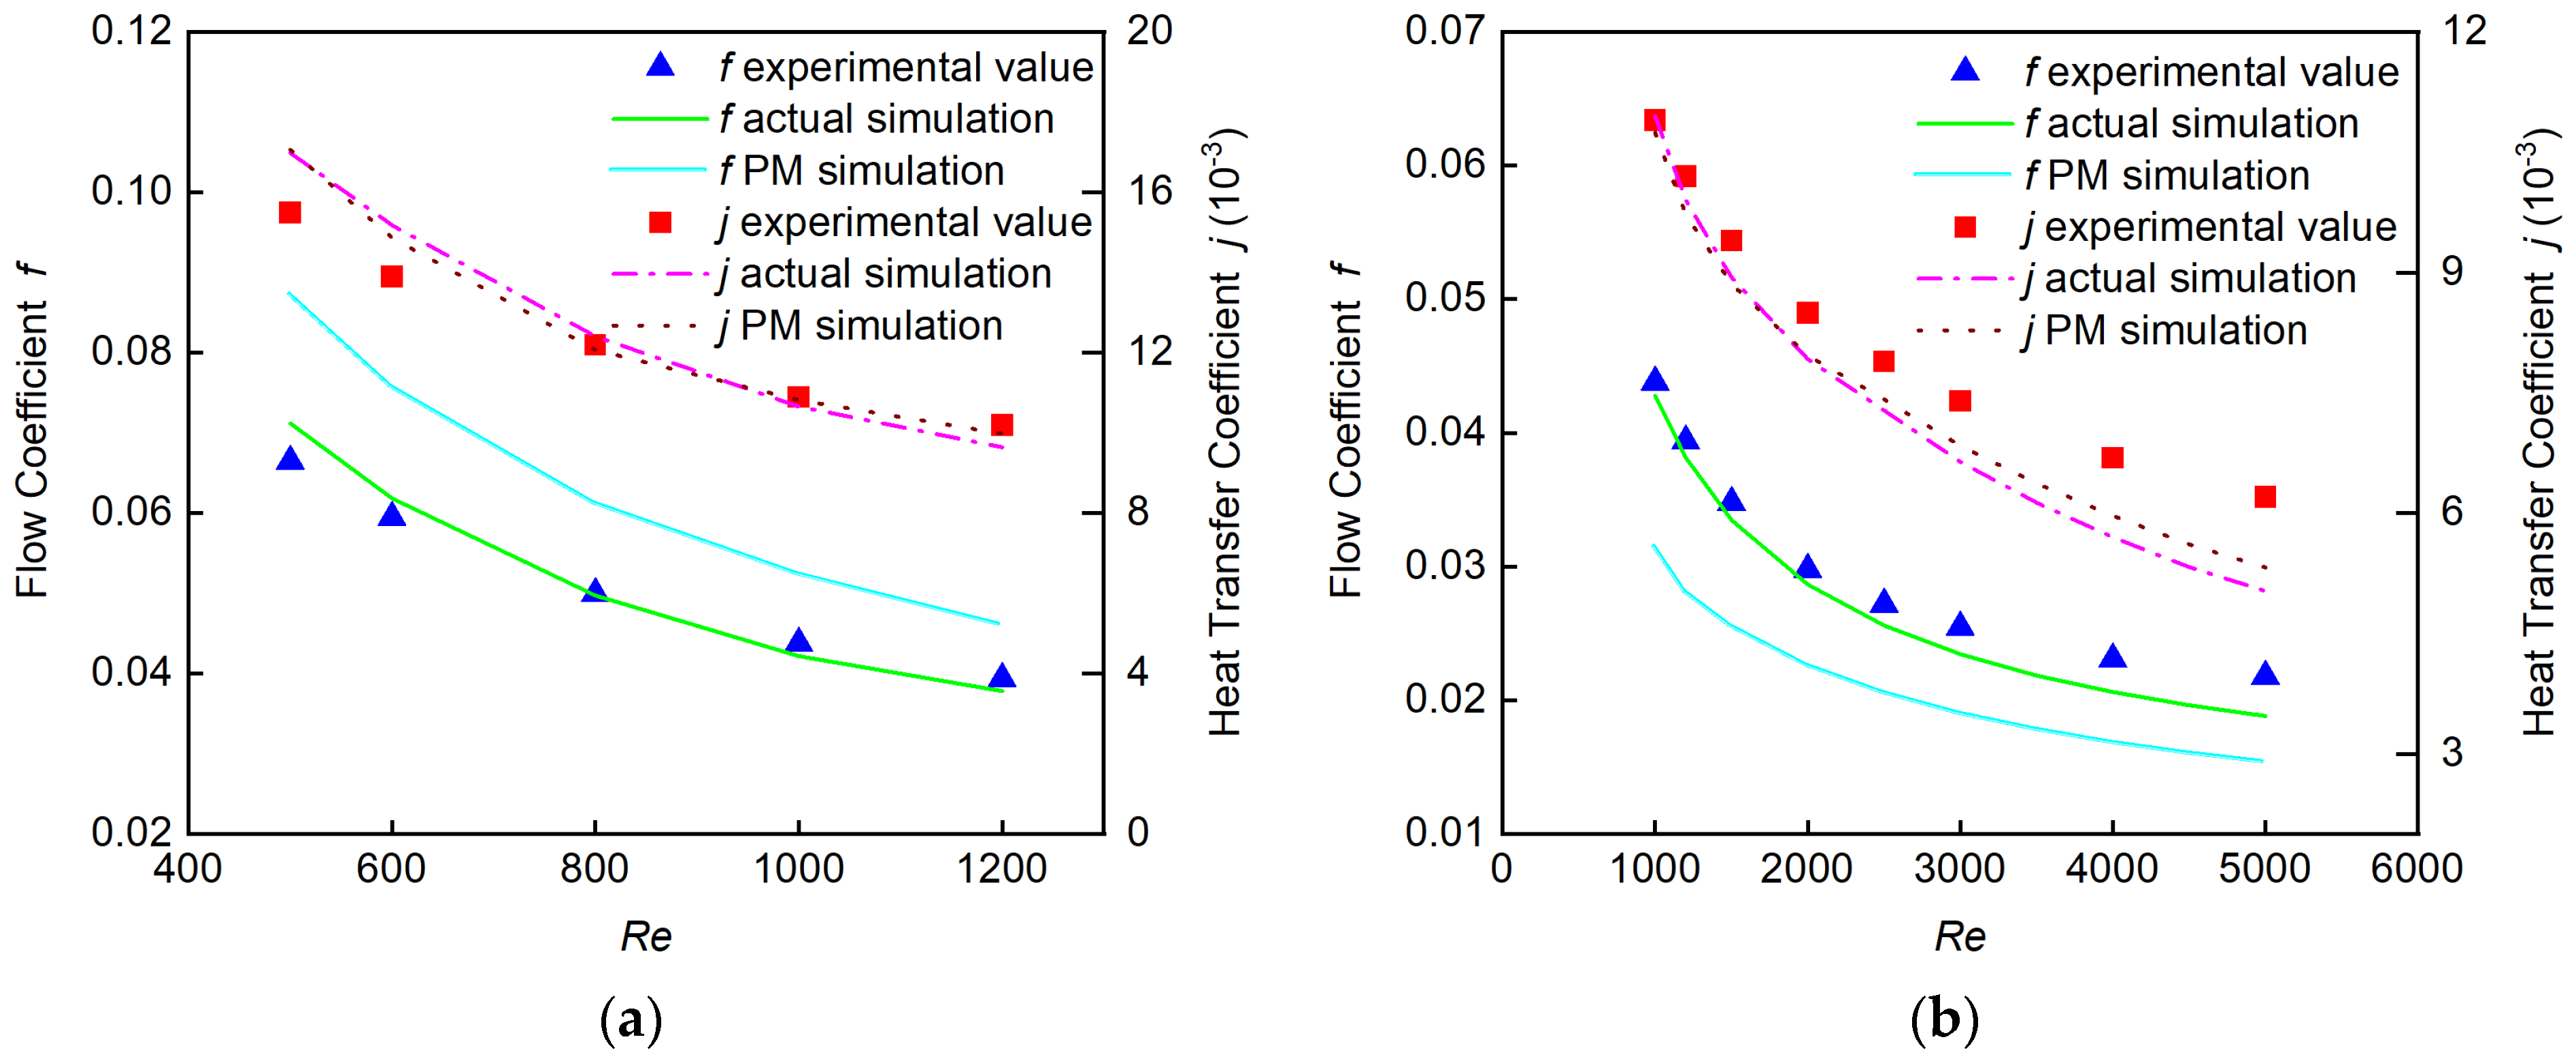
3.2. Model-Reliability Verification
3.3. Performance-Verification Analysis
4. Results and Discussion
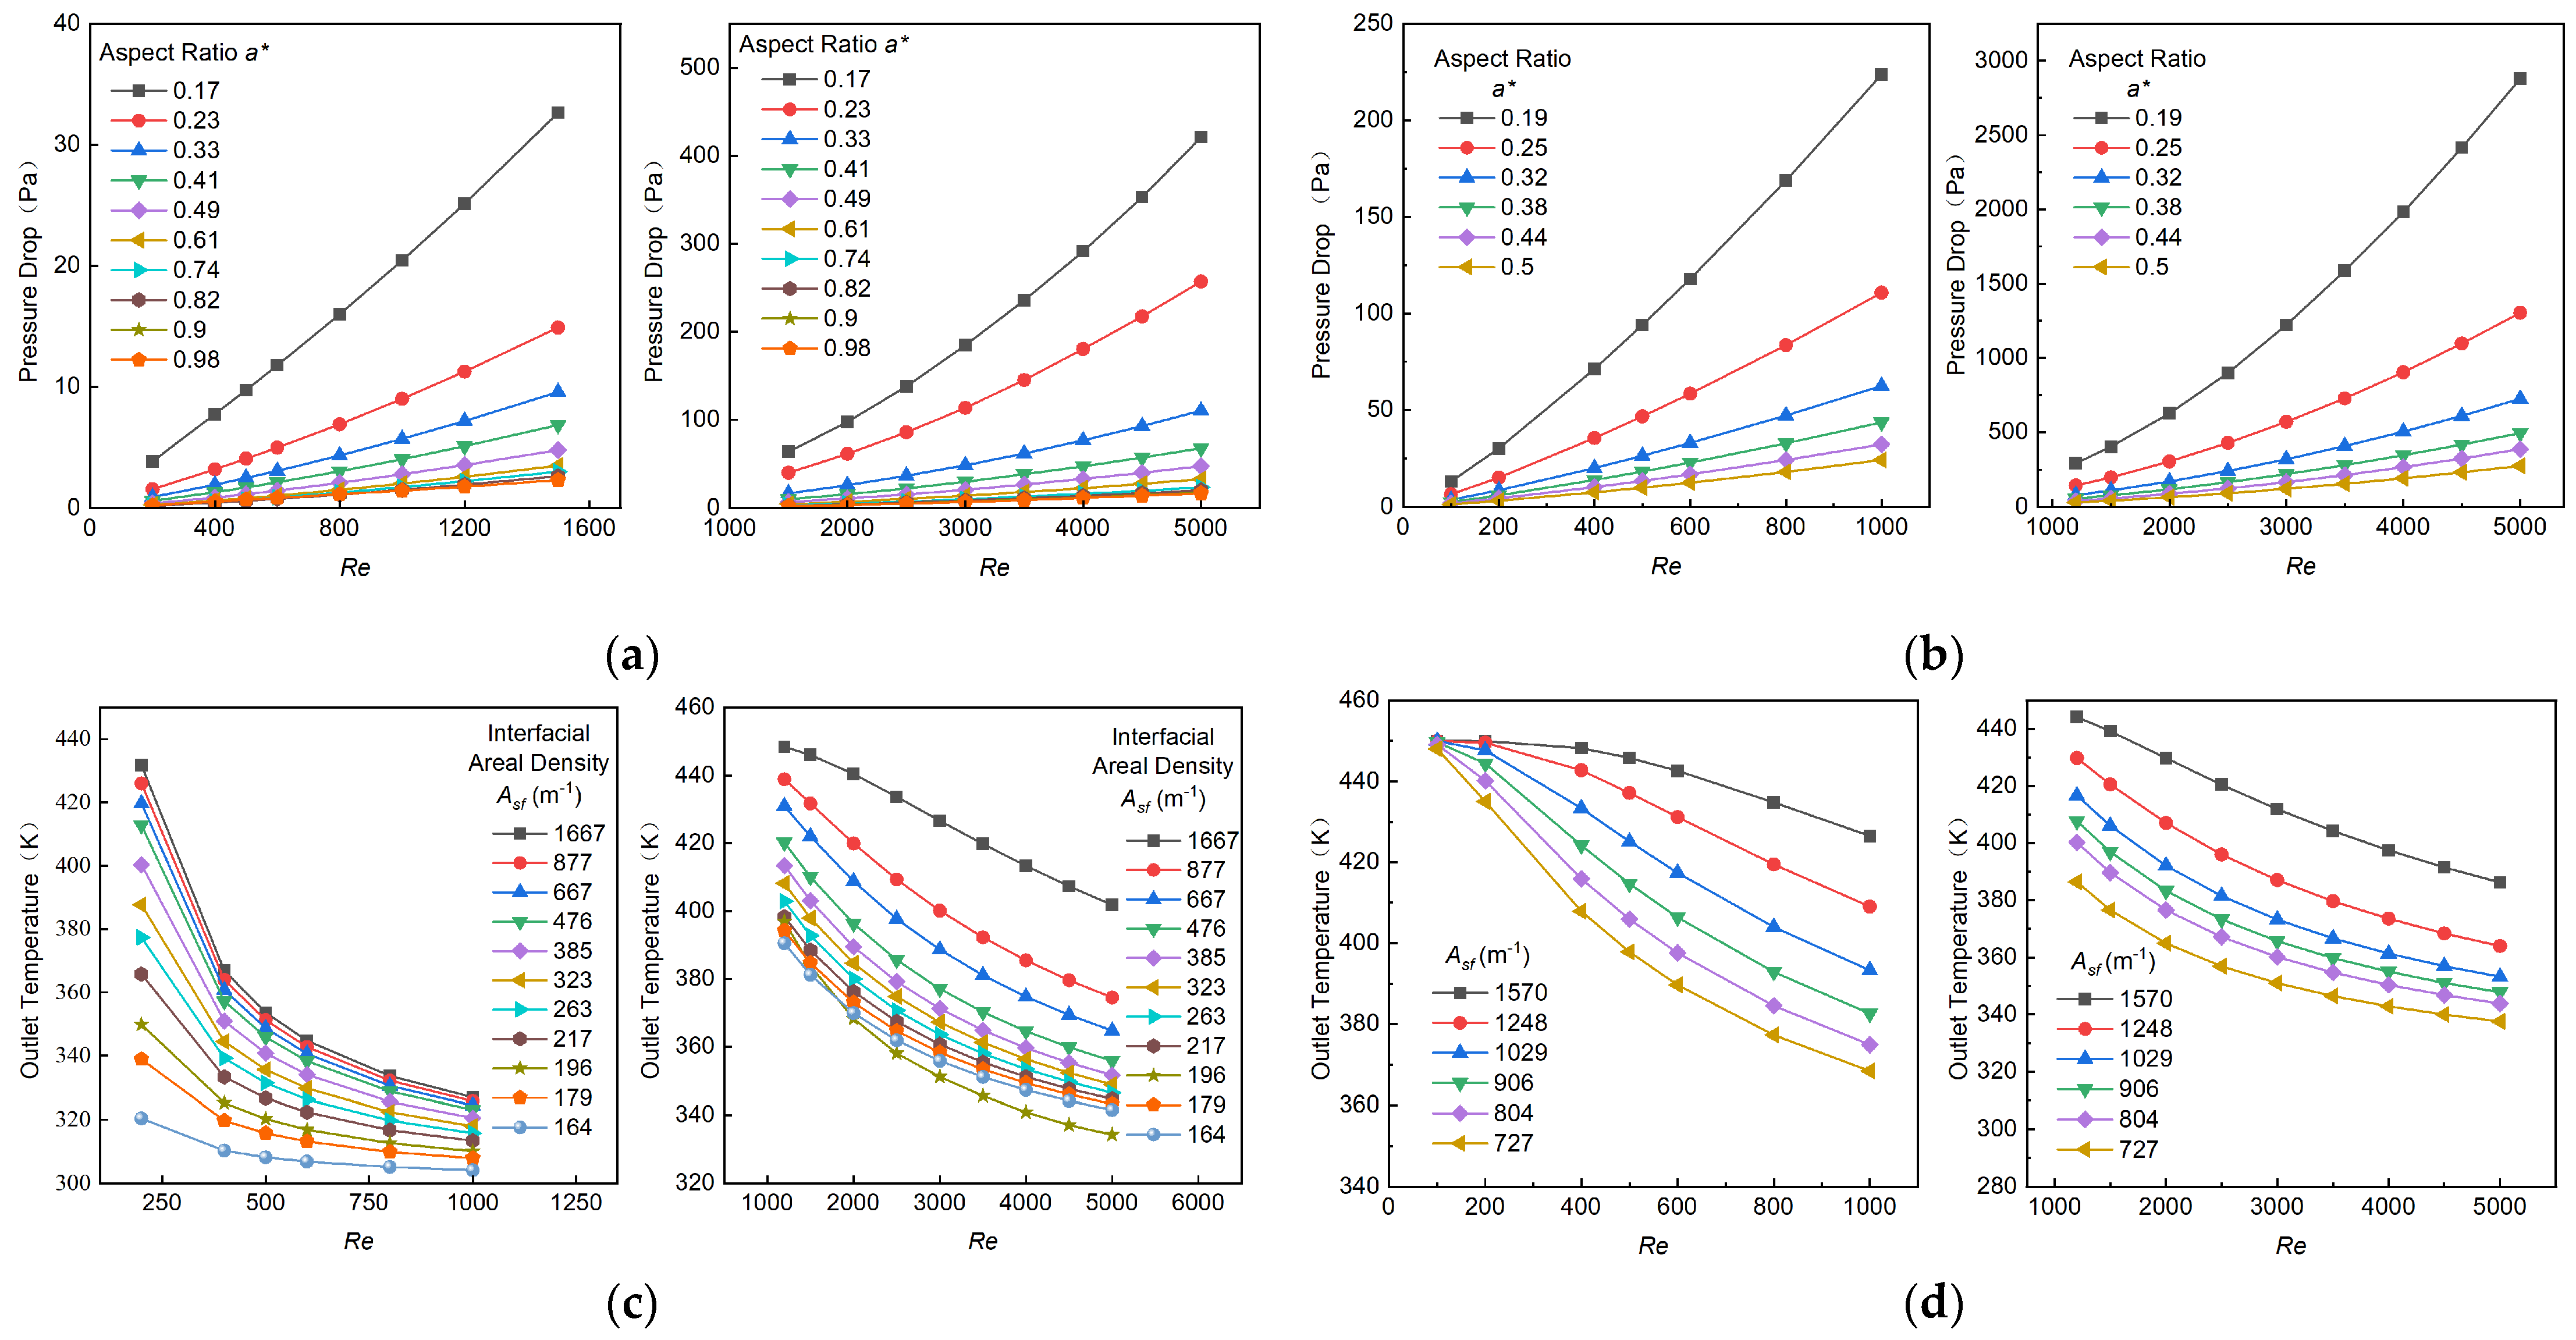
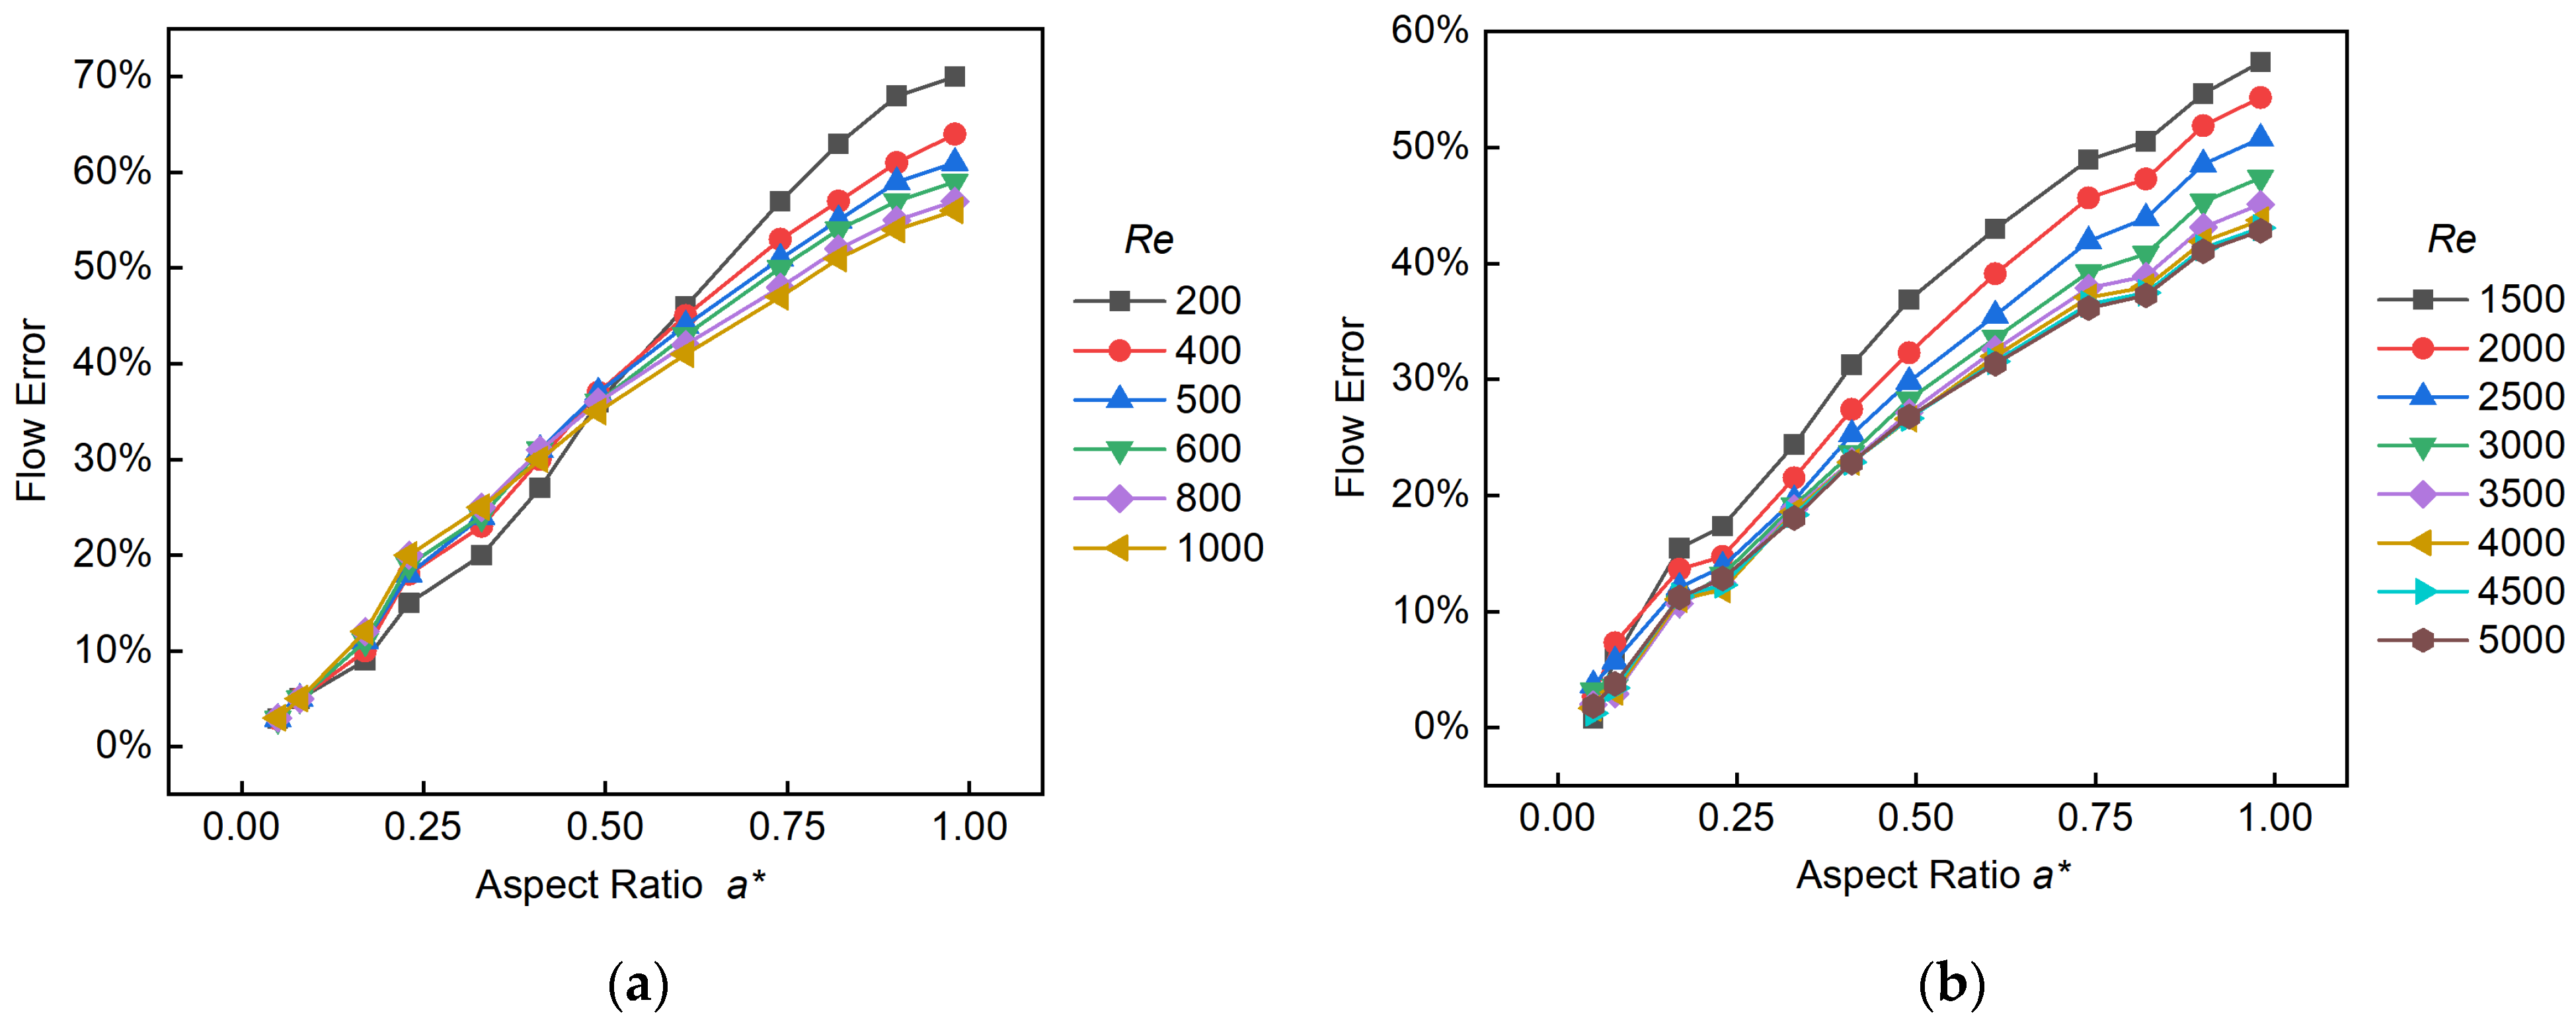
4.1. Effect of Geometric Parameters on Flow
4.1.1. Straight Fins

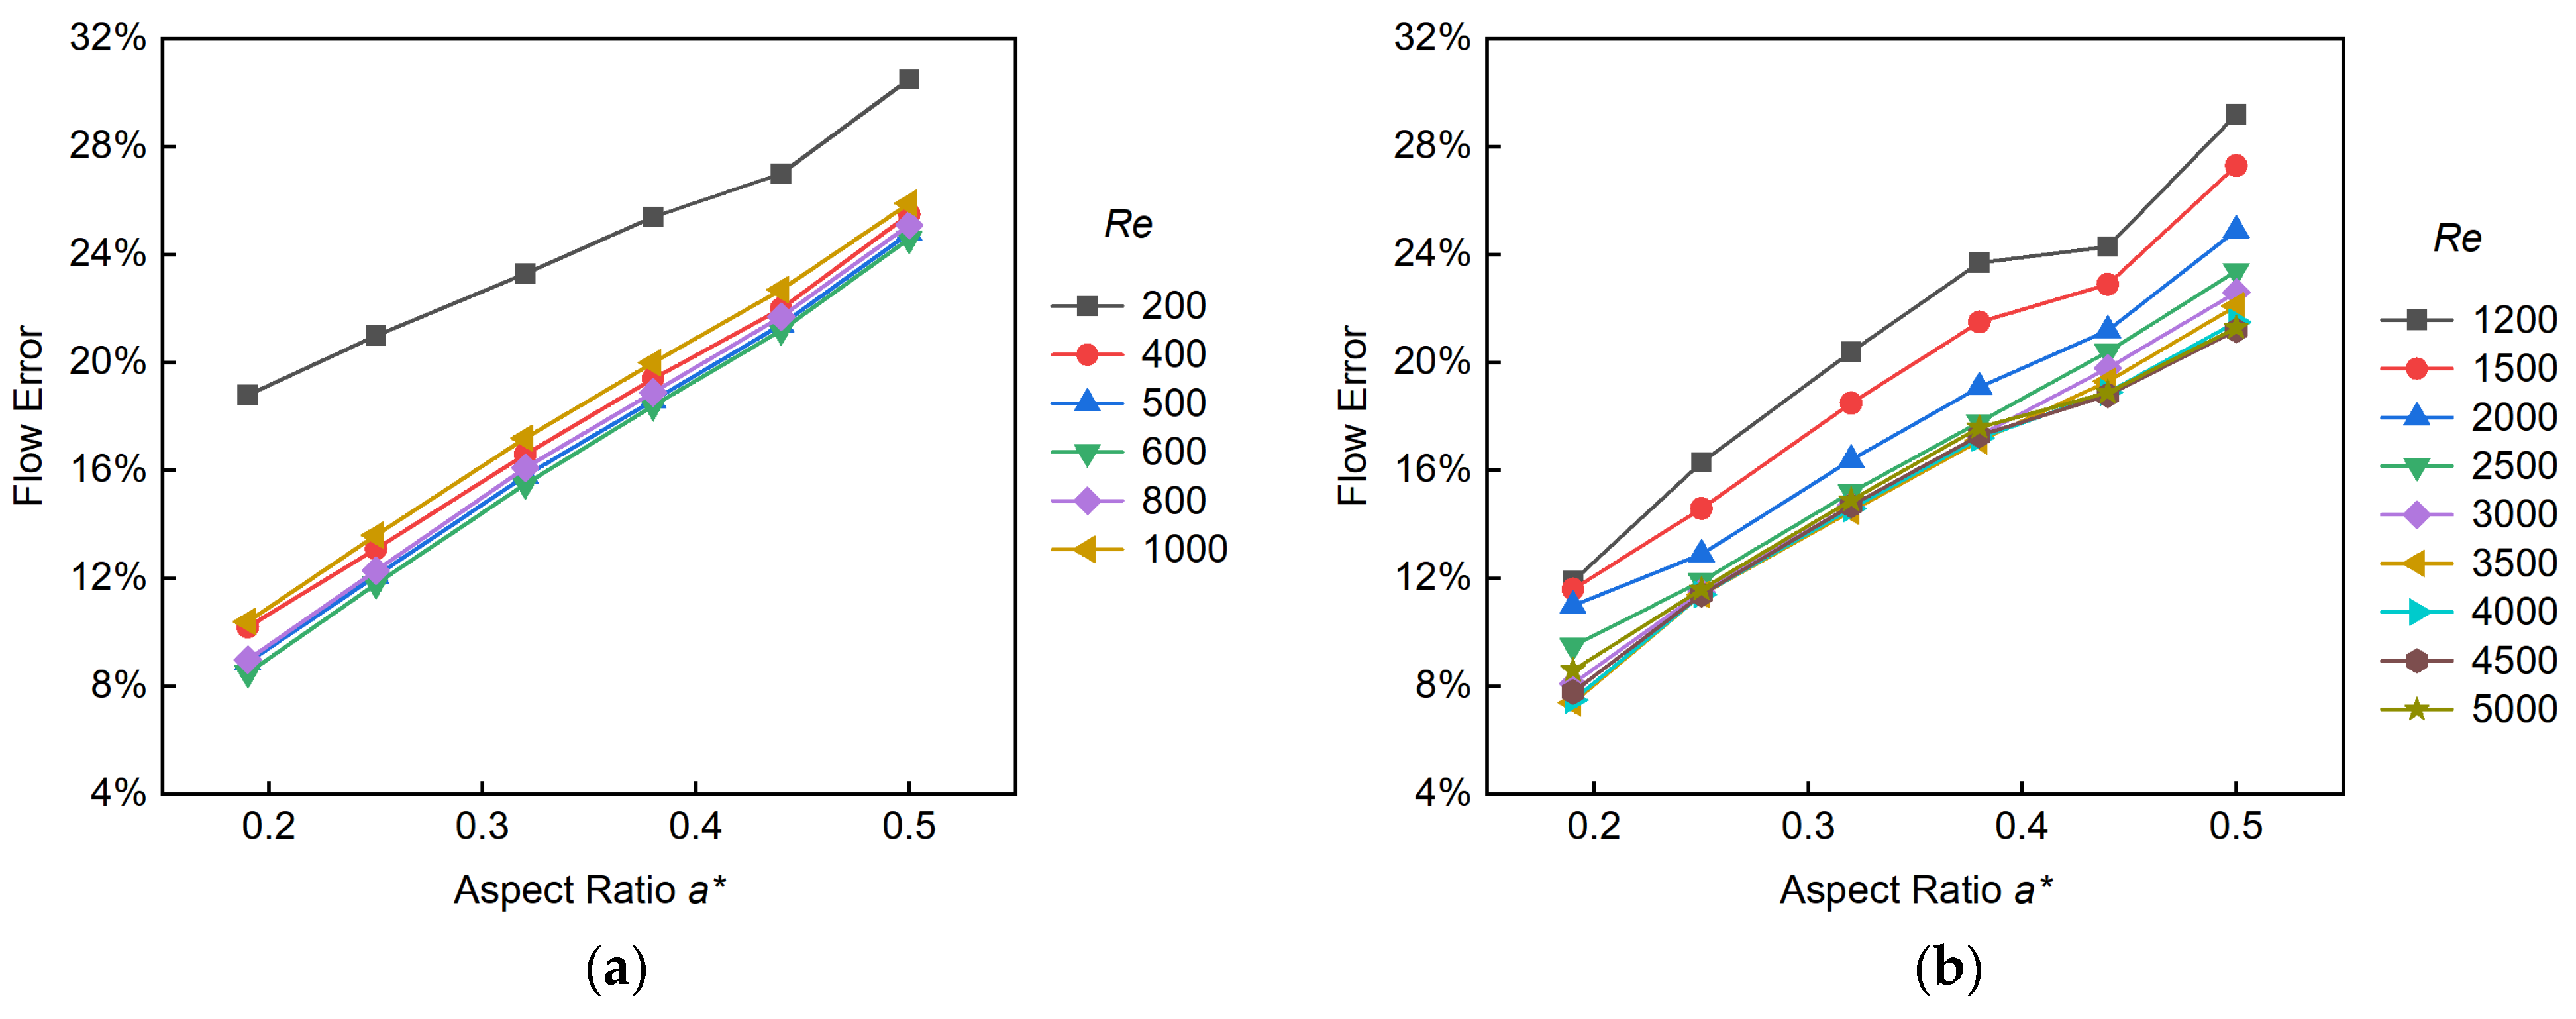
4.1.2. Serrated Fins

4.2. Effect of Geometric Parameters on Heat Transfer
4.2.1. Straight Fins


4.2.2. Serrated Fins
5. Conclusions
- 1.
- The flow errors () introduced by the application of the PM approach increase with an increase in the aspect ratio (a*). In the case of straight fins, under laminar and turbulent flow, can reach as high as 45% when a* is 0.98, whileremains below 5% for an a* value of 0.17.
- 2.
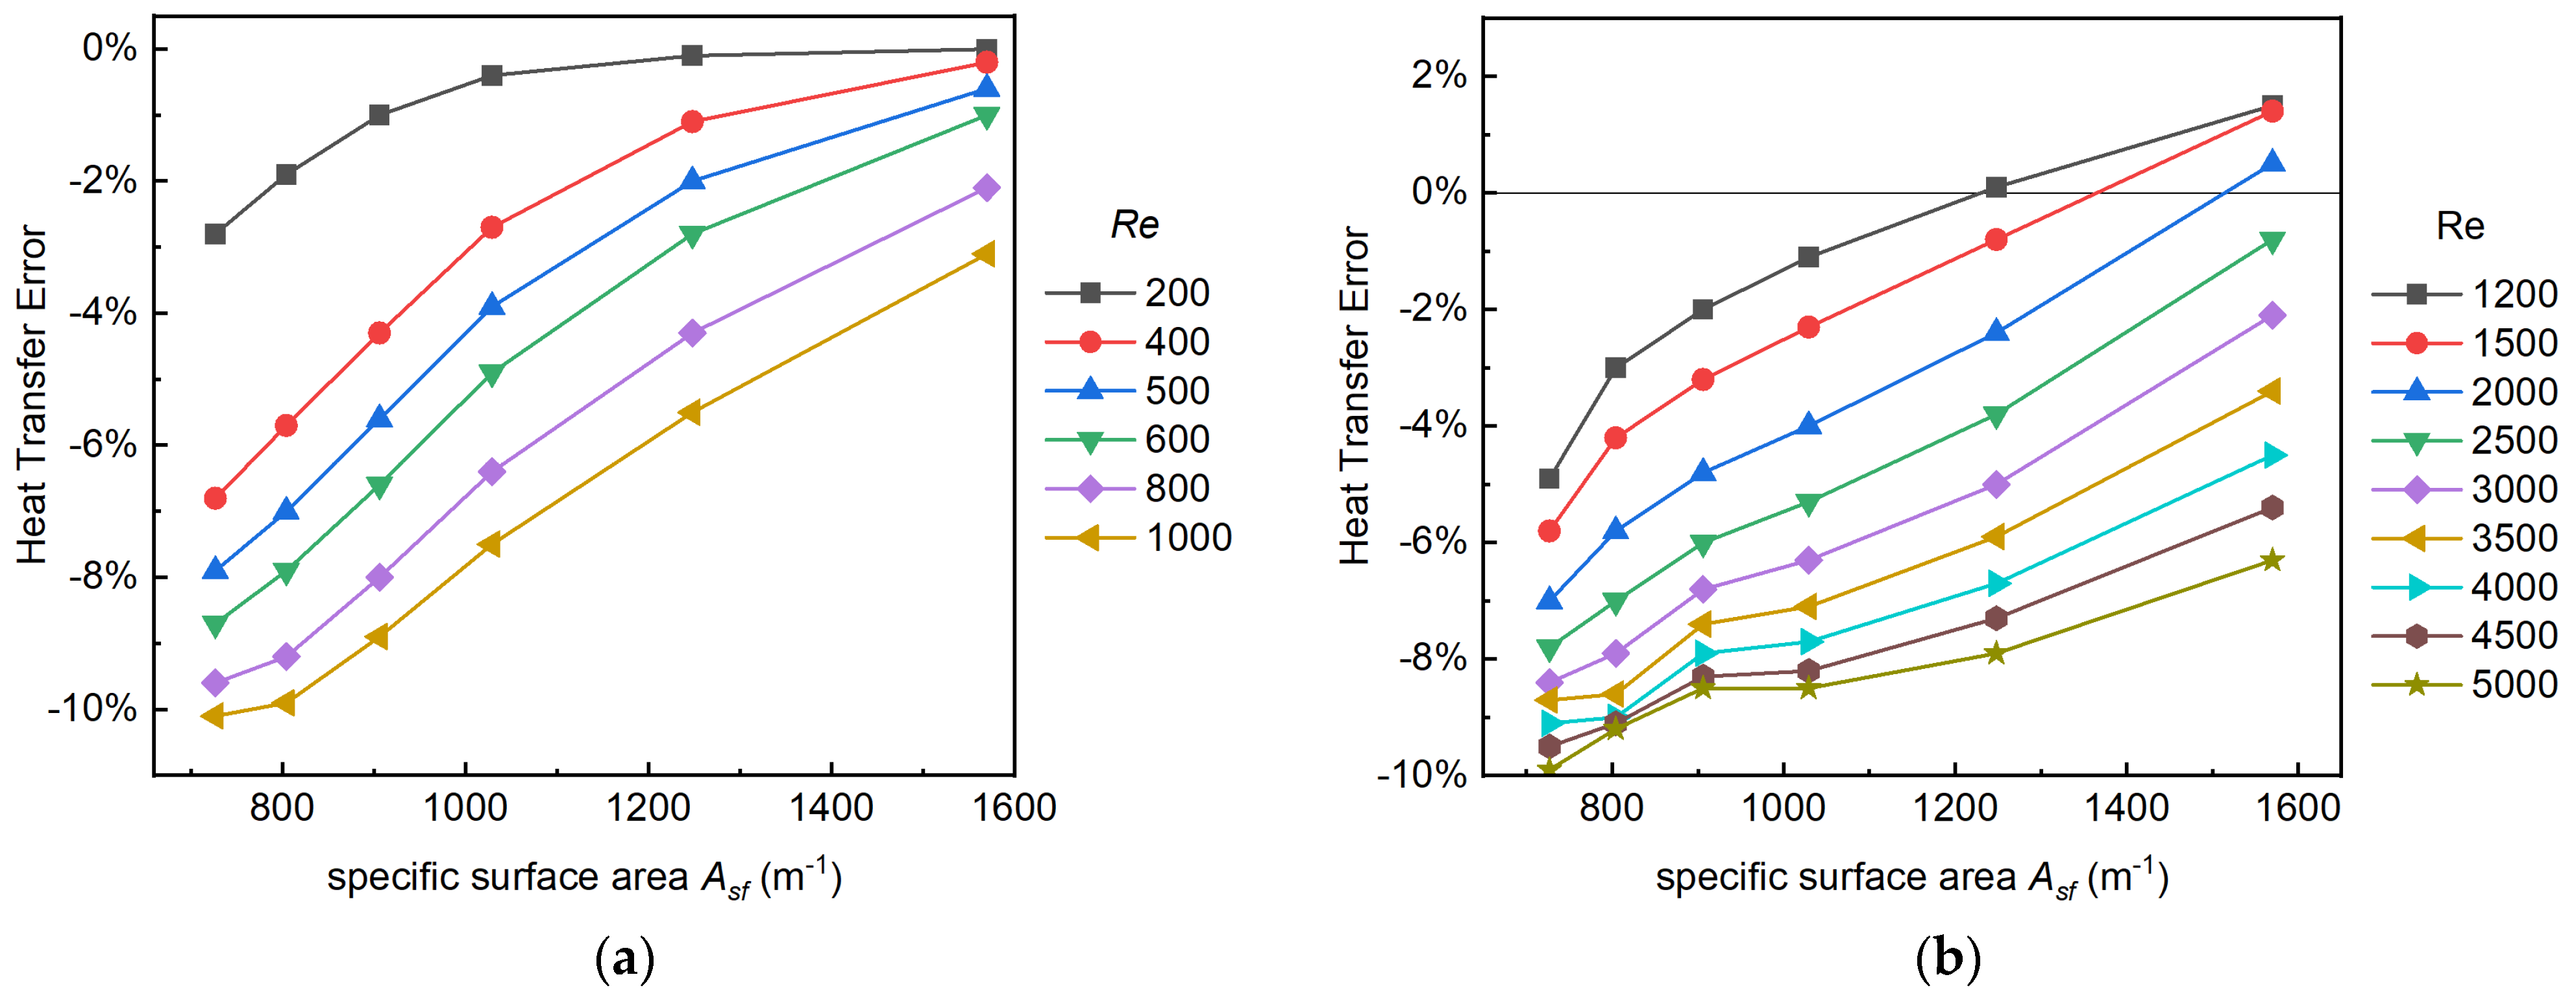
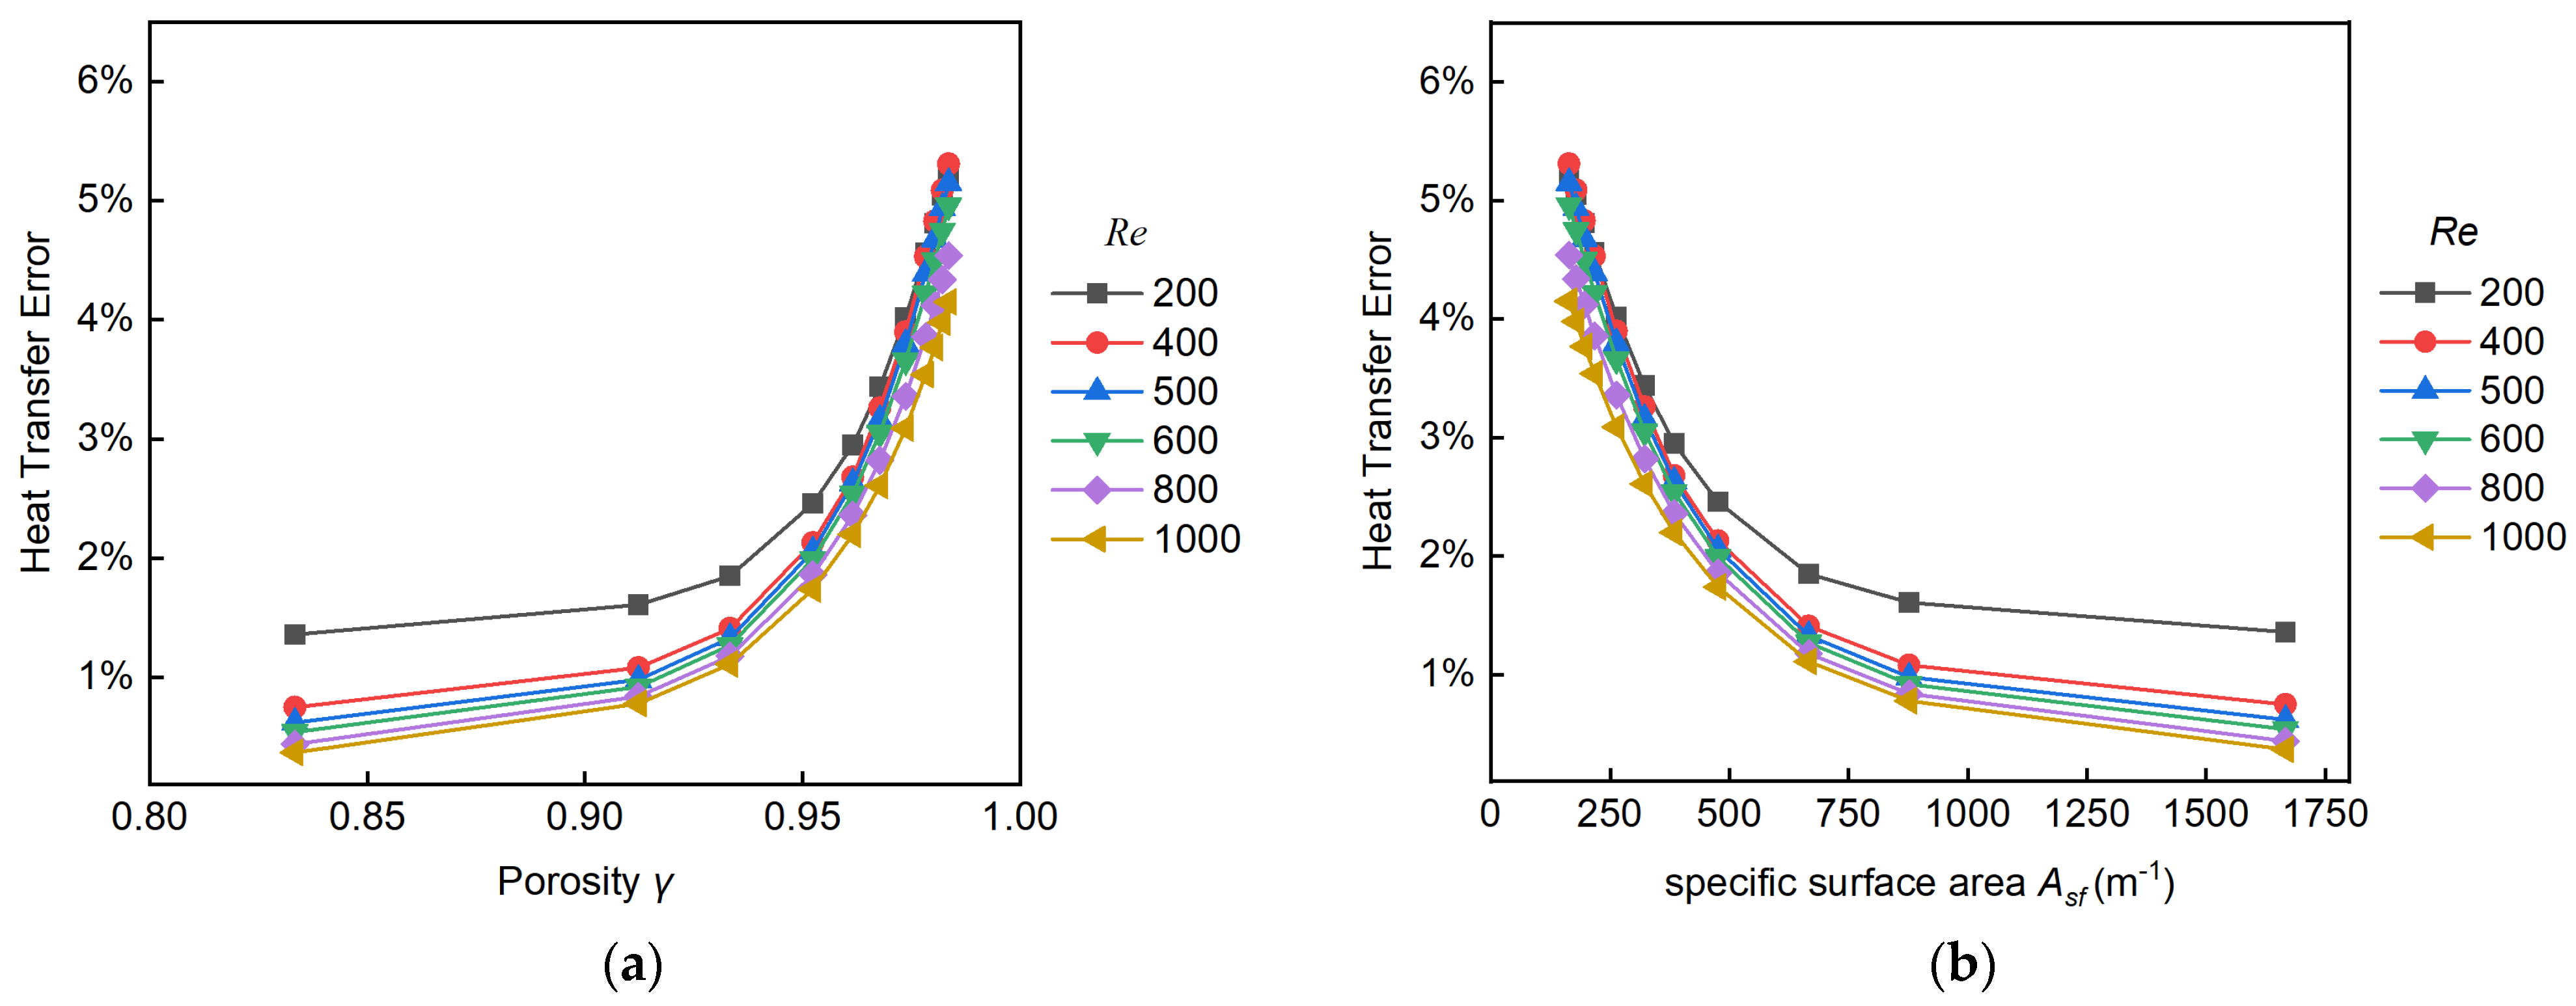
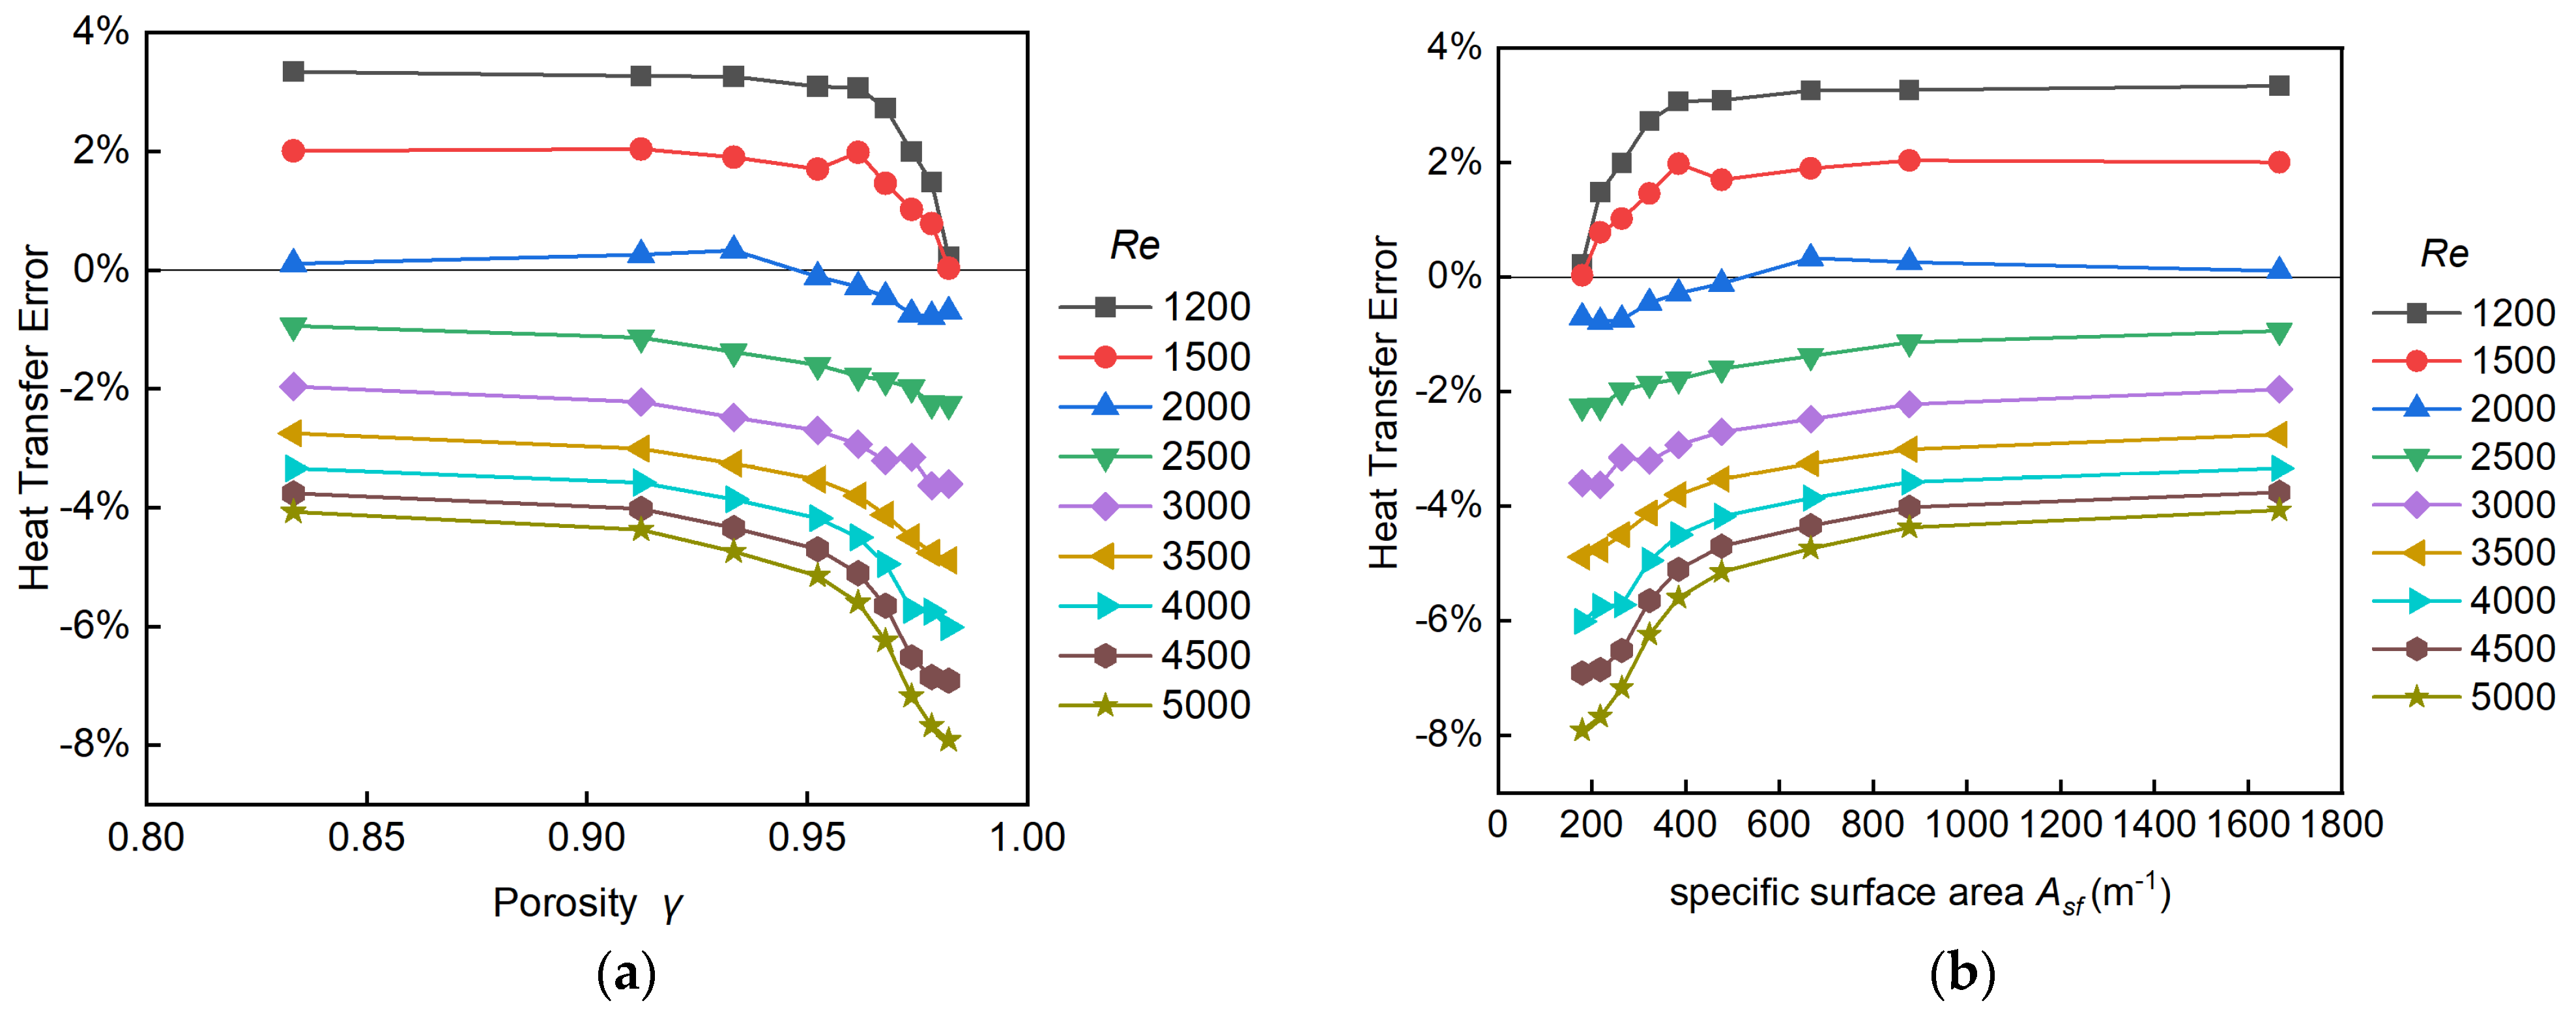
- The heat-transfer errors () introduced by the application of the PM approach increase with a decrease in Asf and an increase in . For both straight fins and serrated fins with a range of porosity from 0.8 to 1, is less than 15%.
- 3.
- For straight fins at 0 < a* < 0.17 in the laminar regime (200 < Re < 1000) and in the turbulent regime (1200 < Re < 5000), and for serrated fins at 0 < a* < 0.32 in the laminar regime (400 < Re < 1000) or at 0 < a* < 0.28 n the turbulent regime (2000 < Re < 5000), both andresulting from employing the PM approach are within the accepted range.
Author Contributions
Funding
Data Availability Statement
Conflicts of Interest
References
- Careri, F.; Khan, R.H.U.; Todd, C.; Attallah, M.M. Additive manufacturing of heat exchangers in aerospace applications: A review. Appl. Therm. Eng. 2023, 235, 121387. [Google Scholar] [CrossRef]
- Liu, Z.; Sun, M.; Huang, Y.; Li, K.; Wang, C. Investigation of heat transfer characteristics of high-altitude intercooler for piston aero-engine based on multi-scale coupling method. Int. J. Heat Mass Transf. 2020, 156, 119898. [Google Scholar] [CrossRef]
- Chen, M.; Sun, X.; Christensen, R.N. Thermal-hydraulic performance of printed circuit heat exchangers with zigzag flow channels. Int. J. Heat Mass Transf. 2019, 130, 356–367. [Google Scholar] [CrossRef]
- Ponangi, B.R.; Krishna, V.; Seetharamu, K.N. Performance of compact heat exchanger in the presence of novel hybrid graphene nanofluids. Int. J. Therm. Sci. 2021, 165, 106925. [Google Scholar] [CrossRef]
- Yoon, S.-J.; O’Brien, J.; Chen, M.; Sabharwall, P.; Sun, X. Development and validation of Nusselt number and friction factor correlations for laminar flow in semi-circular zigzag channel of printed circuit heat exchanger. Appl. Therm. Eng. 2017, 123, 1327–1344. [Google Scholar] [CrossRef]
- Vaisi, A.; Javaherdeh, K.; Moosavi, R. Condensation heat transfer performance in multi-fluid compact heat exchangers with wavy and strip fins. Int. J. Heat Mass Transf. 2022, 182, 121968. [Google Scholar] [CrossRef]
- Fang, W.; Chen, S.; Xu, J.; Zeng, K. Predicting heat transfer coefficient of a shell-and-plate, moving packed-bed particle-to-sCO2 heat exchanger for concentrating solar power. Energy 2021, 217, 119389. [Google Scholar] [CrossRef]
- Merchán, R.P.; Santos, M.J.; Medina, A.; Hernández, A.C. High temperature central tower plants for concentrated solar power: 2021 overview. Renew. Sustain. Energy Rev. 2022, 155, 111828. [Google Scholar] [CrossRef]
- Yang, J.; Ma, L.; Bock, J.; Jacobi, A.M.; Liu, W. A comparison of four numerical modeling approaches for enhanced shell-and-tube heat exchangers with experimental validation. Appl. Therm. Eng. 2014, 65, 369–383. [Google Scholar] [CrossRef]
- Pizzolato, A.; Sharma, A.; Maute, K.; Sciacovelli, A.; Verda, V. Multi-scale topology optimization of multi-material structures with controllable geometric complexity—Applications to heat transfer problems. Comput. Methods Appl. Mech. Eng. 2019, 357, 112552. [Google Scholar] [CrossRef]
- Ciuffini, A.; Scattina, A.; Carena, F.; Roberti, M.; Rivalta, G.T.; Chiavazzo, E.; Fasano, M.; Asinari, P. Multiscale computational fluid dynamics methodology for predicting thermal performance of compact heat exchangers. J. Heat Transf. 2016, 138, 071801. [Google Scholar] [CrossRef]
- Patankar, S.V.; Spalding, D.B. Computer analysis of the three-dimensional flow and heat transfer in a steam generator. In Numerical Prediction of Flow, Heat Transfer, Turbulence and Combustion; Pergamon: Oxford, UK, 1983; pp. 293–298. [Google Scholar]
- Prithiviraj, M.; Andrews, M.J. Comparison of a three-dimensional numerical model with existing methods for prediction of flow in shell-and-tube heat exchangers. Heat Transf. Eng. 1999, 20, 15–19. [Google Scholar]
- Hu, C.; Sun, M.; Xie, Z.; Yang, L.; Song, Y.; Tang, D.; Zhao, J. Numerical simulation on the forced convection heat transfer of porous medium for turbine engine heat exchanger applications. Appl. Therm. Eng. 2020, 180, 115845. [Google Scholar] [CrossRef]
- Moradi, I.; Karimipour, A.; Afrand, M.; Li, Z.; Bach, Q.-V. Three-dimensional numerical simulation of external fluid flow and heat transfer of a heat exchanger in a wind tunnel using porous media model. J. Therm. Anal. Calorim. 2020, 141, 1647–1667. [Google Scholar] [CrossRef]
- Man, Y.; Tong, J.; Wang, T.; Wang, S.; Xu, H. Study on Intermittent Microwave Convective Drying Characteristics and Flow Field of Porous Media Food. Energies 2022, 16, 441. [Google Scholar] [CrossRef]
- Torresi, M.; Saponaro, A.; Camporeale, S.M.; Fortunato, B. CFD analysis of the flow through tube banks of HRSG. In Turbo Expo: Power for Land, Sea, and Air; The ASME: Berlin, Germany, 2008; Volume 43178, pp. 327–337. [Google Scholar]
- William, T.S. An overview on rod-bundle thermal-hydraulic analysis. Nucl. Eng. Des. 1980, 62, 1–24. [Google Scholar]
- Ismail, L.S.; Ranganayakulu, C.; Shah, R.K. Numerical study of flow patterns of compact plate-fin heat exchangers and generation of design data for offset and wavy fins. Int. J. Heat Mass Transf. 2009, 52, 3972–3983. [Google Scholar] [CrossRef]
- Ahlinder, S. On Modelling of Compact Tube Bundle Heat Exchangers as Porous Media for Recuperated Gas Turbine Engine Applications; BTU Cottbus-Senftenberg: Brandenburg, Germany, 2006. [Google Scholar]
- Li, Z.; Ding, Y.; Liao, Q.; Cheng, M.; Zhu, X. An approach based on the porous media model for numerical simulation of 3D finned-tubes heat exchanger. Int. J. Heat Mass Transf. 2021, 173, 121226. [Google Scholar] [CrossRef]
- Zhu, Q.; Pishahang, M.; Caccia, M.; Kelsall, C.C.; LaPotin, A.; Sandhage, K.H.; Henry, A. Validation of the Porous Medium Approximation for Hydrodynamics Analysis in Compact Heat Exchangers. J. Fluids Eng. 2022, 144, 081403. [Google Scholar] [CrossRef]
- Lage, J.L.; Antohe, B.V. Darcy’s experiments and the deviation to nonlinear flow regime. J. Fluids Eng. 2000, 122, 619–625. [Google Scholar] [CrossRef]
- Wilson, L.; Narasimhan, A.; Venkateshan, S.P. Turbulent flow hydrodynamic experiments in near-compact heat exchanger models with aligned tubes. J. Fluids Eng. 2004, 126, 990–996. [Google Scholar] [CrossRef]
- Huang, Y.; Liu, Z.; Lu, G.; Yu, X. Multi-scale thermal analysis approach for the typical heat exchanger in automotive cooling systems. Int. Commun. Heat Mass Transf. 2014, 59, 75–87. [Google Scholar] [CrossRef]
- Liu, Y.; Yu, C.; Qin, S.; Wang, X.; Lou, J. Effect of transverse flow in porous medium on heat exchanger simulation optimization. Trans. Can. Soc. Mech. Eng. 2020, 44, 419–426. [Google Scholar] [CrossRef]
- Kays, W.M.; London, A.L. Compact Heat Exchangers; MEDTECH, Scientific International: New Delhi, IL, USA, 1984. [Google Scholar]
- Wen, J.; Yang, H.; Tong, X.; Li, K.; Wang, S.; Li, Y. Optimization investigation on configuration parameters of serrated fin in plate-fin heat exchanger using genetic algorithm. Int. J. Therm. Sci. 2016, 101, 116–125. [Google Scholar] [CrossRef]
- Yang, Y.; Li, Y. General prediction of the thermal hydraulic performance for plate-fin heat exchanger with offset strip fins. Int. J. Heat Mass Transf. 2014, 78, 860–870. [Google Scholar] [CrossRef]
- Lam, C.K.G.; Sharmahorst, K.A. Modified Form of the k-εModel for Predicting Wall Turbulence. J. Fluids Eng. 1981, 103, 456–460. [Google Scholar] [CrossRef]
- Liu, W.; Fan, A.; Huang, X. Theory and Application of Heat and Mass Transfer in Porous Media; Science Press: Beijing, China, 2006. [Google Scholar]
- Li, H.; Zhang, X.; He, F. Numerical simulation of fluid flow in porous media. J. Univ. Pet. Nat. Sci. Ed. 2000, 24, 111–116. [Google Scholar]
- Pan, H. Numerical Calculation of Darcy-Forchheimer Seepage in Porous Media. Ph.D. Thesis, Shandong University, Ji’nan, China, 2012. [Google Scholar]
- Patankar, S.V.; Liu, C.H.; Sparrow, E.M. Fully developed flow and heat transfer in ducts having streamwise-periodic variations of cross-sectional area. J. Heat Transf. 1977, 99, 180–186. [Google Scholar] [CrossRef]


| Fin Type | Aspect Ratio (a*) | Equivalent Diameter (De/mm) | Specific Surface Area (Asf/m−1) | Porosity ) |
|---|---|---|---|---|
| Straight Fins | 0.17 | 3.55 | 1667 | 0.91 |
| 0.23 | 4.55 | 877 | 0.93 | |
| 0.33 | 6.02 | 667 | 0.95 | |
| 0.41 | 7.09 | 476 | 0.96 | |
| 0.49 | 8.04 | 385 | 0.97 | |
| 0.61 | 9.21 | 323 | 0.97 | |
| 0.74 | 10.35 | 263 | 0.98 | |
| 0.82 | 10.99 | 217 | 0.98 | |
| 0.90 | 11.56 | 179 | 0.98 | |
| 0.98 | 12.09 | 164 | 0.98 | |
| Serrated Fins | 0.19 | 2.02 | 1570 | 0.86 |
| 0.25 | 2.56 | 1248 | 0.89 | |
| 0.32 | 3.09 | 1029 | 0.90 | |
| 0.38 | 3.48 | 906 | 0.91 | |
| 0.44 | 3.89 | 804 | 0.92 | |
| 0.50 | 4.26 | 727 | 0.93 |
| Straight Fins | Relative Error | Serrated Fins | Relative Error | ||
|---|---|---|---|---|---|
| Number of Grids | Pressure Drop (Pa) | Outlet Temperature (K) | Number of Grids | Pressure Drop (Pa) | Outlet Temperature (K) |
| 254,375 | 3.2% | 1.7% | 176,832 | 2.9% | 1.4% |
| 457,603 | 2.4% | 0.9% | 328,455 | 2.3% | 0.8% |
| 631,160 | 0.6% | 0.5% | 514,384 | 1.5% | 0.6% |
| 1,084,122 | 0.5% | 0.3% | 777,769 | 0.6% | 0.1% |
| 1,268,280 | −0.1% | 0.2% | 1,062,318 | 0.5% | 0.2% |
| 1,513,806 | 0.0% | 0.0% | 1,266,162 | 0.0% | 0.0% |
| Fin Type | Flow State | Maximum Relative Error between Actual Simulation and Experimental | Maximum Relative Error between PM Simulation and Experimental | ||
|---|---|---|---|---|---|
| Flow Factor f | Heat-Transfer Factor j | Flow Factor f | Heat-Transfer Factor j | ||
| Straight Fins | Laminar | 7.9% | 6.1% | 3.9% | 4.5% |
| Turbulent | 7.6% | 6.3% | 4.4% | 3.5% | |
| Serrated Fins | Laminar | 5.6% | 5.4% | 15.0% | 3.3% |
| Turbulent | 5.4% | 7.6% | 14.6% | 5.2% | |
Disclaimer/Publisher’s Note: The statements, opinions and data contained in all publications are solely those of the individual author(s) and contributor(s) and not of MDPI and/or the editor(s). MDPI and/or the editor(s) disclaim responsibility for any injury to people or property resulting from any ideas, methods, instructions or products referred to in the content. |
© 2024 by the authors. Licensee MDPI, Basel, Switzerland. This article is an open access article distributed under the terms and conditions of the Creative Commons Attribution (CC BY) license (https://creativecommons.org/licenses/by/4.0/).
Share and Cite
Tong, J.; Li, S.; Wang, T.; Wang, S.; Xu, H.; Yan, S. A Study of the Influence of Fin Parameters on Porous-Medium Approximation. Energies 2024, 17, 1133. https://doi.org/10.3390/en17051133
Tong J, Li S, Wang T, Wang S, Xu H, Yan S. A Study of the Influence of Fin Parameters on Porous-Medium Approximation. Energies. 2024; 17(5):1133. https://doi.org/10.3390/en17051133
Chicago/Turabian StyleTong, Junjie, Shuming Li, Tingyu Wang, Shuxiang Wang, Hu Xu, and Shuiyu Yan. 2024. "A Study of the Influence of Fin Parameters on Porous-Medium Approximation" Energies 17, no. 5: 1133. https://doi.org/10.3390/en17051133
APA StyleTong, J., Li, S., Wang, T., Wang, S., Xu, H., & Yan, S. (2024). A Study of the Influence of Fin Parameters on Porous-Medium Approximation. Energies, 17(5), 1133. https://doi.org/10.3390/en17051133