Article

Simulation Study on Temperature and Stress and Deformation on Encapsulated Surfaces under Spray Cooling

1
School of Energy and Power Engineering, Zhengzhou University of Light Industry, Zhengzhou 450007, China
2
Henan International Joint Laboratory of Energy Efficient Conversion and Utilization, Zhengzhou 450007, China
*
Author to whom correspondence should be addressed.
Energies 2024, 17(5), 1070; https://doi.org/10.3390/en17051070
Submission received: 3 February 2024 / Revised: 18 February 2024 / Accepted: 20 February 2024 / Published: 23 February 2024
(This article belongs to the Section J: Thermal Management)

Abstract

:
Spray cooling is an effective heat dissipation technology and is widely used in the heat dissipation of encapsulated structures, but most of the research has only focused on the heat transfer performance itself and has lacked the analysis of surface stress and deformation. In this paper, a thermal stress coupling model was established under spray conditions, and the influence of spray parameters such as the spray height, spray flow, and nozzle inclination on heat transfer, surface stress, and deformation were studied. The result indicated that the lower the surface temperature, the smaller the stress and deformation. What is more, there was an optimal spray height (15 mm) to achieve the best heat transfer, and the surface stress and deformation were also minimal at the same time which the values were 28.97 MPa and 4.24 × 10⁻³ mm, respectively. The larger the spray flow rate, the better the heat transfer effect and the smaller the surface stress and deformation. When the spray flow rate was 24.480 L/h, the minimum values of surface stress and deformation were 25.42 MPa and 3.89 × 10⁻³ mm, respectively. The uniformity of surface stress distribution could be effectively improved with the increase in flow rate. Compared to 10 and 15 degree nozzle inclination, when the nozzle was perpendicular to the cooling surface, the surface stress and deformation were minimal.

1. Introduction

With the development of science and technology, the degree of integration of electronic equipment is getting higher and higher. Heating power has increased rapidly [1,2], resulting in a sharp rise in heat source temperature [3,4]. Excessive temperature can cause the stress of the encapsulated structure to increase significantly. As a result, serious consequences such as encapsulated structure cracking, fatigue strength reduction, deformation, and even failure are caused [5,6]. The damage of the encapsulated structure could have a serious impact on the heat dissipation and performance stability of the heat source [7,8]. Dong et al. [9] found that under high temperature conditions, huge stress would cause the cracking of the electronic encapsulated structure sintered without a silver press. Xu et al. [10] found that under high temperature conditions, the fatigue life of three-dimensional stacked packaging structures rapidly declines. Wei et al. [3] found that higher stress causes the deformation of an insulated gate bipolar transistor (IGBT) structure to reach 450 μm.
Studies have found that there is a close relationship between stress, temperature, and temperature uniformity [11,12]. Stress tends to increase with the increase in temperature [13,14]. Lin et al. [15] found in an experiment that the stress of an integrated circuit (IC) encapsulated structure could reach 443.92 MPa at 165 °C. Zhong et al. [16] found in an experiment that the maximum stress in a pressure sensor encapsulated structure was as high as 204.86 MPa at 200 °C. On the other hand, temperature uniformity is also an important factor affecting the stress magnitude [17]. Chen et al. [18] found that when the temperature difference of an IGBT encapsulated structure decreased from 13.3 °C to 7.6 °C, the maximum stress decreased by 20.1%. Therefore, reducing the surface temperature of the encapsulated structure and improving the uniformity of the temperature distribution could effectively reduce the negative effects caused by stress. Natural cooling and heat dissipation could not meet the demand.
Spray cooling has the characteristics of a strong heat transfer ability, less working medium required, and good temperature uniformity [19,20]. Therefore, it is widely used for cooling high-temperature heat sources. Spray cooling has a strong heat transfer ability and can effectively reduce the surface temperature [21,22]. Rui et al. [23] found through experiments that under the same conditions, dual-nozzle spray cooling had more advantages than single-nozzle spray cooling, and the maximum temperature of the heating surface dropped by 11 °C. Bhuwanesh et al. [24] spray-cooled 800 °C steel pipes under natural convection heat transfer, and the average temperature was reduced to 30 °C. Bhatt et al. [25] spray-cooled 900 °C steel pipes under natural convection heat transfer, and the average temperature was reduced to 28 °C. Agnieszka et al. [26] through experiments spray-cooled a 100 W/cm2 high-temperature surface, and the temperature was only 92 °C.
In addition, spray cooling could effectively improve the uniformity of temperature when reducing the temperature. Xia et al. [27] found through experiments that when the spray height dropped from 24 mm to 6.8 mm, the high temperature wall temperature dropped rapidly, and the temperature uniformity was significantly improved. Yang et al. [28] found through numerical simulation that when the spray flow field just covered the heating surface, the temperature uniformity was the best. In the spray-cooling experiment, Zhao et al. [29] found that when the heat flux was 411.5 W/cm2, the temperature difference was only 21.7 °C. According to experiments, Rong et al. [30] found that increasing the number of nozzles could greatly improve the temperature uniformity of the cooled surface. Wu et al. [31] concluded through experiments that increasing the spray flow rate could reduce the surface temperature of the heat source and increase its surface temperature uniformity.
In summary, spray cooling can not only effectively reduce the surface temperature, but also improve the uniformity of the surface temperature. This is of great significance for improving the surface stress distribution. At present, there are relatively few research studies on surface stress based on spray cooling. Therefore, a thermal stress coupling model based on spray cooling is established in this paper. The effects of nozzle height, spray flow rate, and nozzle inclination on surface temperature, stress, and deformation are studied.

2. Numerical Simulation of Spray Cooling

2.1. Numerical Models

For spray cooling:
The simulated objects were the sprays and gases in the calculation domain. The mathematical models mainly included a continuous phase model, turbulent flow model, and discrete phase model.

2.1.1. Continuous Phase Model

The continuous phase model was used to simulate the gas phase and liquid film in the calculation domain. The governing equations of the continuous phase included mass, momentum, energy, and component transport equations, as shown in Formulas (1)–(4).
( ρ u ) = Δ m
where : the divergence; ρ : the continuous phase density; u : the velocity vector; and source item Δ m : the mass change caused by the evaporation of droplets and liquid films into the continuous phase.
+ ( ρ u u ) = p + + ρ g + Δ u
where t : the time; μ : the viscosity; p : the pressure; T : the transpose; g: the gravitational acceleration vector; and Δ u : continuous phase momentum change caused by a droplet.
( ρ T ) t + ( ρ u T ) = k eff c ρ T + Δ E
where T : the thermodynamic temperature; k eff : the effective heat transfer coefficient of the fluid, and = + k t ; k 1 : the heat transfer coefficient of the fluid; k t : the heat transfer coefficient caused by turbulence; c p : the specific heat capacity of the fluid at constant pressure; and Δ E : the continuous phase energy change caused by the droplet.
t ρ w f + ρ u w f = J f + S f
where w f : the mass fraction of component f , the two components were air and water vapor; J f : the diffusion flux vector of component f ; and S f : the source term for the increase in components due to evaporation.

2.1.2. Turbulence Model

The turbulence model was Realizable k - ε [32].
Transport equation
t ( ρ k ) + L x ρ k u 1 , x = L z μ + μ 1 σ k k L z + G k ρ ε
t ( ρ ε ) + L x ρ ε u L x = L z μ + μ t σ ε ε L z + ρ C 1 Δ ε ρ C 2 ε 2 k + u n ε
C 1 = max 0.43 , η η + 5
C 2 = n + 1 n
η = ( k / ε ) 2 E x z E x z
E x = 1 2 u 1 , z L x + u 1 , x L z
where u 1 , x : the horizontal velocity vector along the direction x ; u 1 , z : the horizontal velocity vector along the direction z ; u n : the vertical component velocity vector; L x : the displacement in the direction of x; L z : the displacement in the direction of z; μ t : turbulence viscosity; σ k and σ ε : the Prandtl numbers corresponding to the turbulent kinetic energy k and the dissipation rate ε ; Δ ε : the change in the turbulent energy dissipation rate; C 1 ,   η ,   E x z ,   G k : the turbulent kinetic energy caused by the mean velocity gradient; n : the decay exponent; and C 2 : a constant term with a value of 1.9.

2.1.3. Discrete Phase Model

The discrete phase model mainly included the droplet atomization model, droplet tracking model, and wall liquid film model, combined with the nozzle data used in the experimental system. In this study, the solid-cone atomization model in the discrete phase model (DPM) based on the Euler–Lagrange method was selected. The droplet tracking model predicted its motion trajectory by integrating the balance of forces on the droplet, which was described in the Lagrange coordinate system:
d u d d t = u u d τ r + g ρ d ρ ρ d
τ r = ρ d d d 2 3 μ 4 C d R e
C d = C dss ( 1 + 2.632 y )
R e   = ρ d d u d u μ
C d , s = 0.424 R e   >   1000 24 R e 1 + 1 6 R e 2 / 3 R e     1000
where u d : the velocity vector of the droplet; ρ d : the droplet density; u u d / τ r : the drag force per unit mass of the droplet; d d : the particle diameter; R e : the relative Reynolds number; and C d : the drag coefficient of the droplet, which was determined by the spherical droplet resistance coefficient C d , s and the constant y . When the droplet was spherical, y = 0. When the droplet was in a disk shape, y = 1. In this paper, the smooth particle resistance model was used to calculate C d .
The wall liquid film model was the Lagrange wall film model, and the mode of interaction between the droplet and the wall was determined by the droplet impact kinetic energy E (J) and the critical temperature Tcrit (K), as shown in Figure 1:
E = ρ d u n , d d d σ 1 min h 0 / d d , 1 + δ b / d d
δ dj = d d μ / ρ d u n , d
T crit   = T crit   * T sat  
where u n , d : the velocity vector in the direction of the vertical wall of the droplet; σ : the surface tension; h 0 : the liquid film thickness; δ bl : the boundary layer thickness; T crit   * : the critical temperature factor; and T sat : the droplet saturation temperature.
The heat and mass transfer of droplets were considered in the calculation [28]. In addition, during spray cooling, there is always an exchange of heat, mass, and momentum between the dispersed and continuous phases. Therefore, two-way coupling was used to solve the equations of the discrete and continuous phases alternately until the solutions of the two phases converged. Moreover, according to previous studies [28,33], atomized droplets followed the Rosin–Rammler distribution.
In this paper, the relationship between temperature and stress has been analyzed, so it was necessary to consider the stress relationship. In a three-dimensional Cartesian coordinate system, the stress and strain equations could be expressed as
ε x ε 0 = σ x E ν E σ y + σ z
ε y ε 0 = σ y E ν E σ z + σ x
ε z ε 0 = σ z E ν E σ x + σ y
where σ x , σ y , σ z : the stress in the x, y, z directions; ε : the stress strain; E : the Young’s modulus; and ν : the Poisson’s ratio. The effect of metal expansion on the thermal strain, which was ascribed to the temperature rise was considered:
ε 0 = α T T 0 = α Δ T
where α : the thermal expansion coefficient.

2.2. Geometric Models

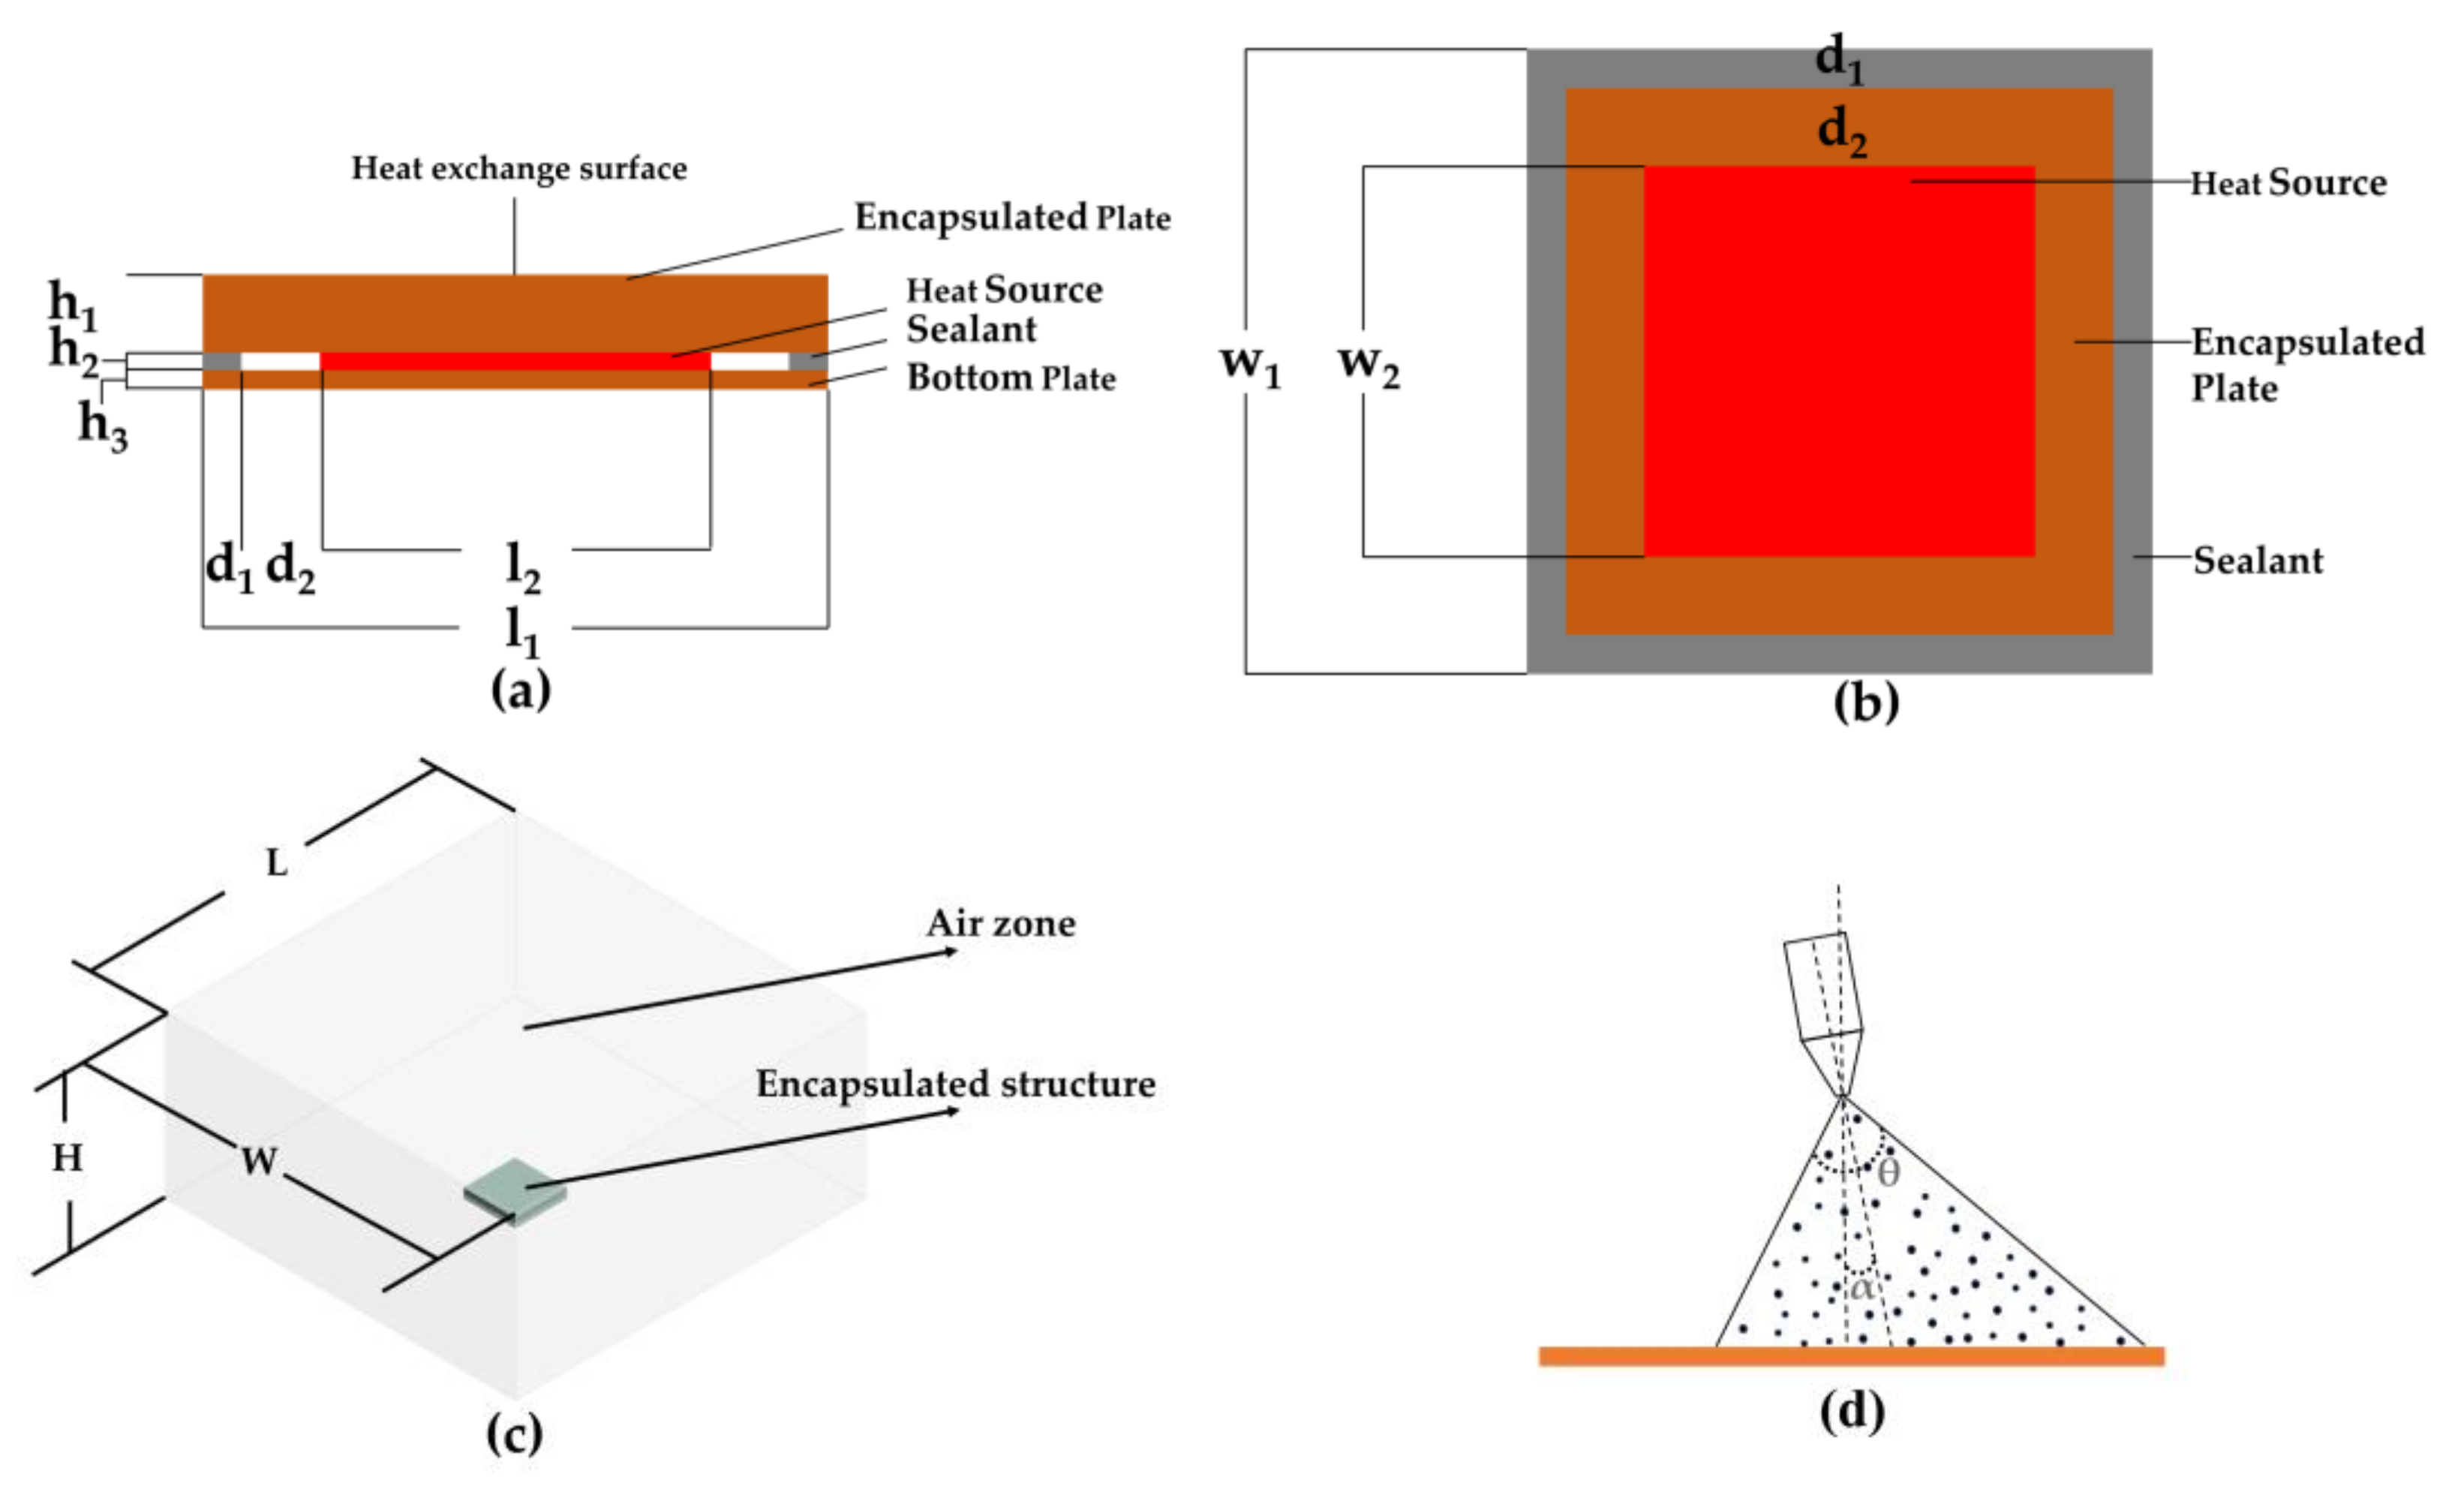
In order to be more similar to the actual situation, our encapsulated structure size settings were as follows: As shown in Figure 2, depicting the schematic of the encapsulated structure and spray cooling, l was the length, w was the width, and h was the thickness. And d1 represented the distance between the inside and outside of the sealant, while d2 represented the linear distance between the inside of the sealant and the heat source. The size of the encapsulated plate was l1 = 16 mm, w1 = 16 mm, and h1 = 2.0 mm. The size of the heat source was l2 = 10 mm, w2 = 10 mm, and h2 = 0.5 mm. In addition, as shown in Figure 2b, the sealant was evenly applied to the edge, and its size was d1 = 1.0 mm and d2 = 2.0 mm, and h3 = 0.5 mm. In Figure 2c, the air zone size was the W × L × H. The W was 108 mm, the L was 108 mm, and the H was 50 mm. The physical parameters of the encapsulated structure material were shown in Table 1.

2.3. Initial Boundary Conditions and Assumed Condition

In order to be closer to the experiment, we set the initial boundary in the text: a solid-cone nozzle was used for spray cooling. The environmental pressure was 1.01 × 10⁵ Pa, the acceleration of gravity was 9.81 m/s2, and the droplet time step size was 10−5 s. The top surface of the air zone was the velocity inlet, the bottom surface of the air zone was the non-slip wall boundary, and the side of the air zone was the pressure outlet. The encapsulated structure wall settings are shown in the Figure 2a. The top surface of the encapsulated structure was coupled with the fluid domain, and a liquid film was formed for heat transfer during the spray process. The heat source was fixed to the bottom plate and provided uniform heat flow to the encapsulated plate. The contact area between the sealant and the encapsulated plate and the bottom plate was a restricted area, and the sealant did not separate from the confined area.
Assumed condition: the thermal conductivity, Young’s modulus, thermal expansion coefficient, and other physical properties did not change with temperature. Due to the low thermal conductivity of air, the effect on the temperature was very small; thus, the effect of air was ignored in this model.

2.4. Simulation Flow Chart and Calculate Parameter Setting

The heat source and encapsulated structure were under heat conduction, and the surface of the encapsulated plate and droplets were under heat convection. Due to the low temperature, thermal radiation could be ignored. And the numerical simulation flowchart is shown in Figure 3.

2.5. Grid-Independence and Model Validation

As shown in Figure 4a, an unstructured grid was used. Six different numbers of grids were selected for numerical verification, and the data of Liu [34] were cited. And the average temperature of the top surface of the encapsulated plate was compared. We selected the solid-cone nozzle, the working fluid was water, the temperature was 15 °C, the flow rate was 20.988 L/h, the flow velocity was 33.15 m/s, the nozzle angle was 60.06°, the average droplet diameter was 40.94 μm, and the nozzle inclination was 0°. And the results showed that 100 × 104 grids were suitable.
As shown in Figure 4b, data from reference Wang [35] were used to verify the reliability of the model. The nozzle height was 8.67 mm, the velocity was 28.60 m/s, the spray cone angle was 60°, the water temperature 20 °C, the average droplet diameter was 85.30 μm, and the flow rate was 4.95 L/h. The results showed that the maximum error was less than 10%, so the numerical calculation could continue.
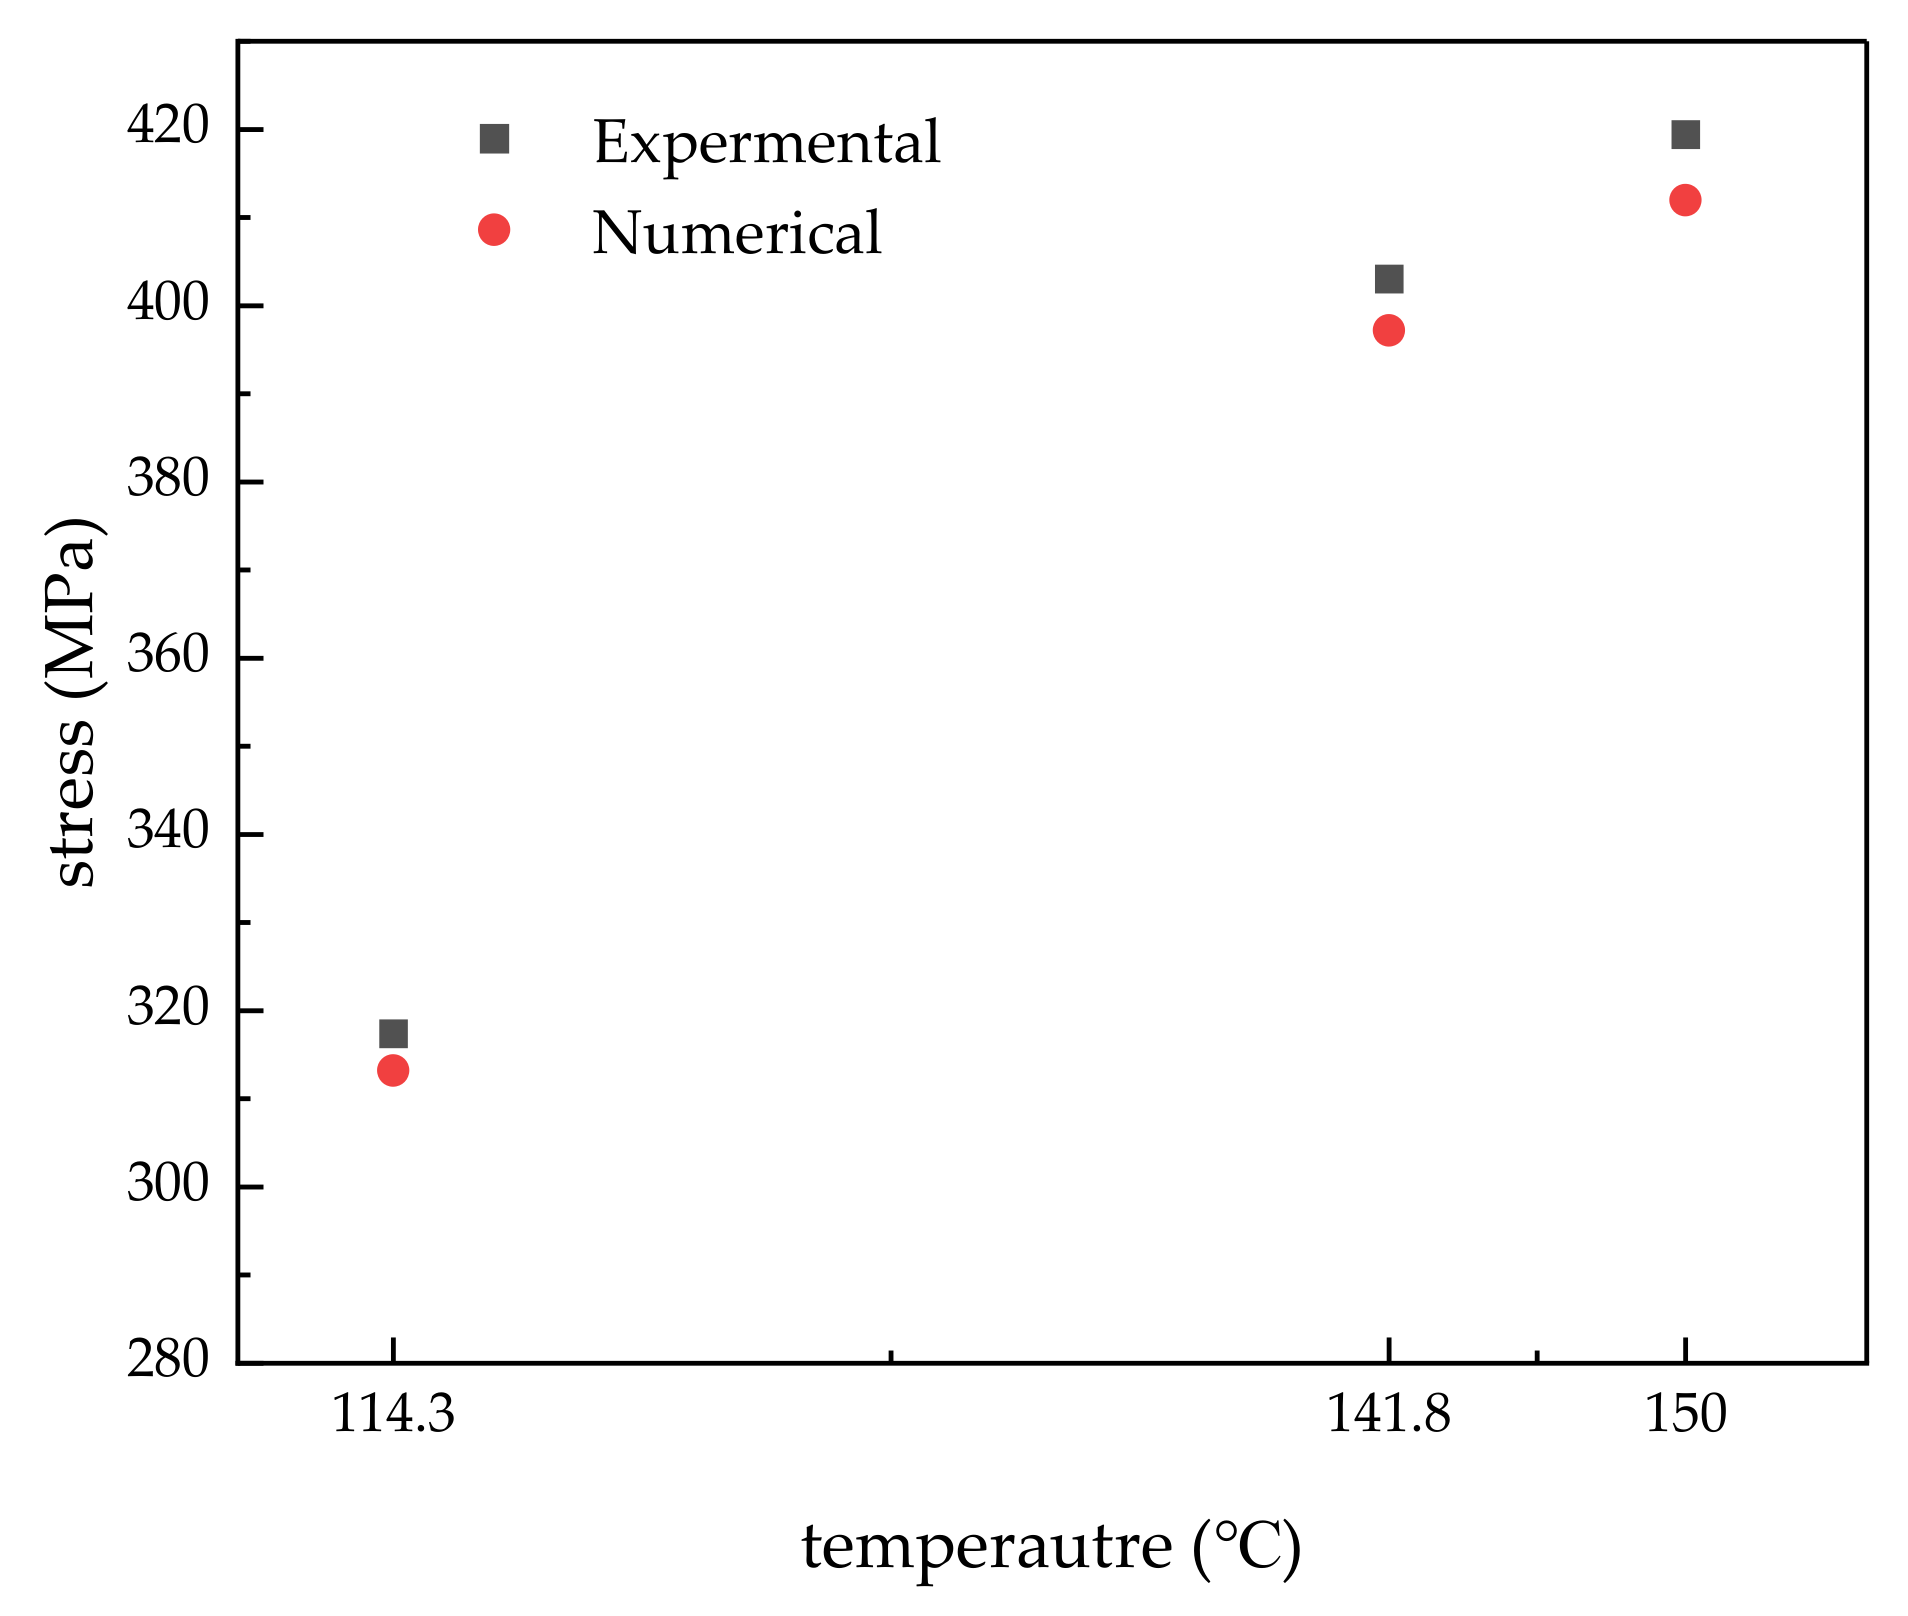
As shown in Figure 5, according to the model assembly encapsulated structure, d1 = 3 mm and d2 = 0 mm were set, and experiments were carried out. It was found that the maximum error between the numerical simulation results and experimental results was less than 10%, and the numerical simulation could continue.

3. Analysis of Results

3.1. Effect of Spray Height on Surface Temperature, Stress, and Deformation of Encapsulation Structure

In this section, we used data from Case 2, Case 4, and Case 5 in Table 2.

3.1.1. Effect of Spray Height on Surface Temperature

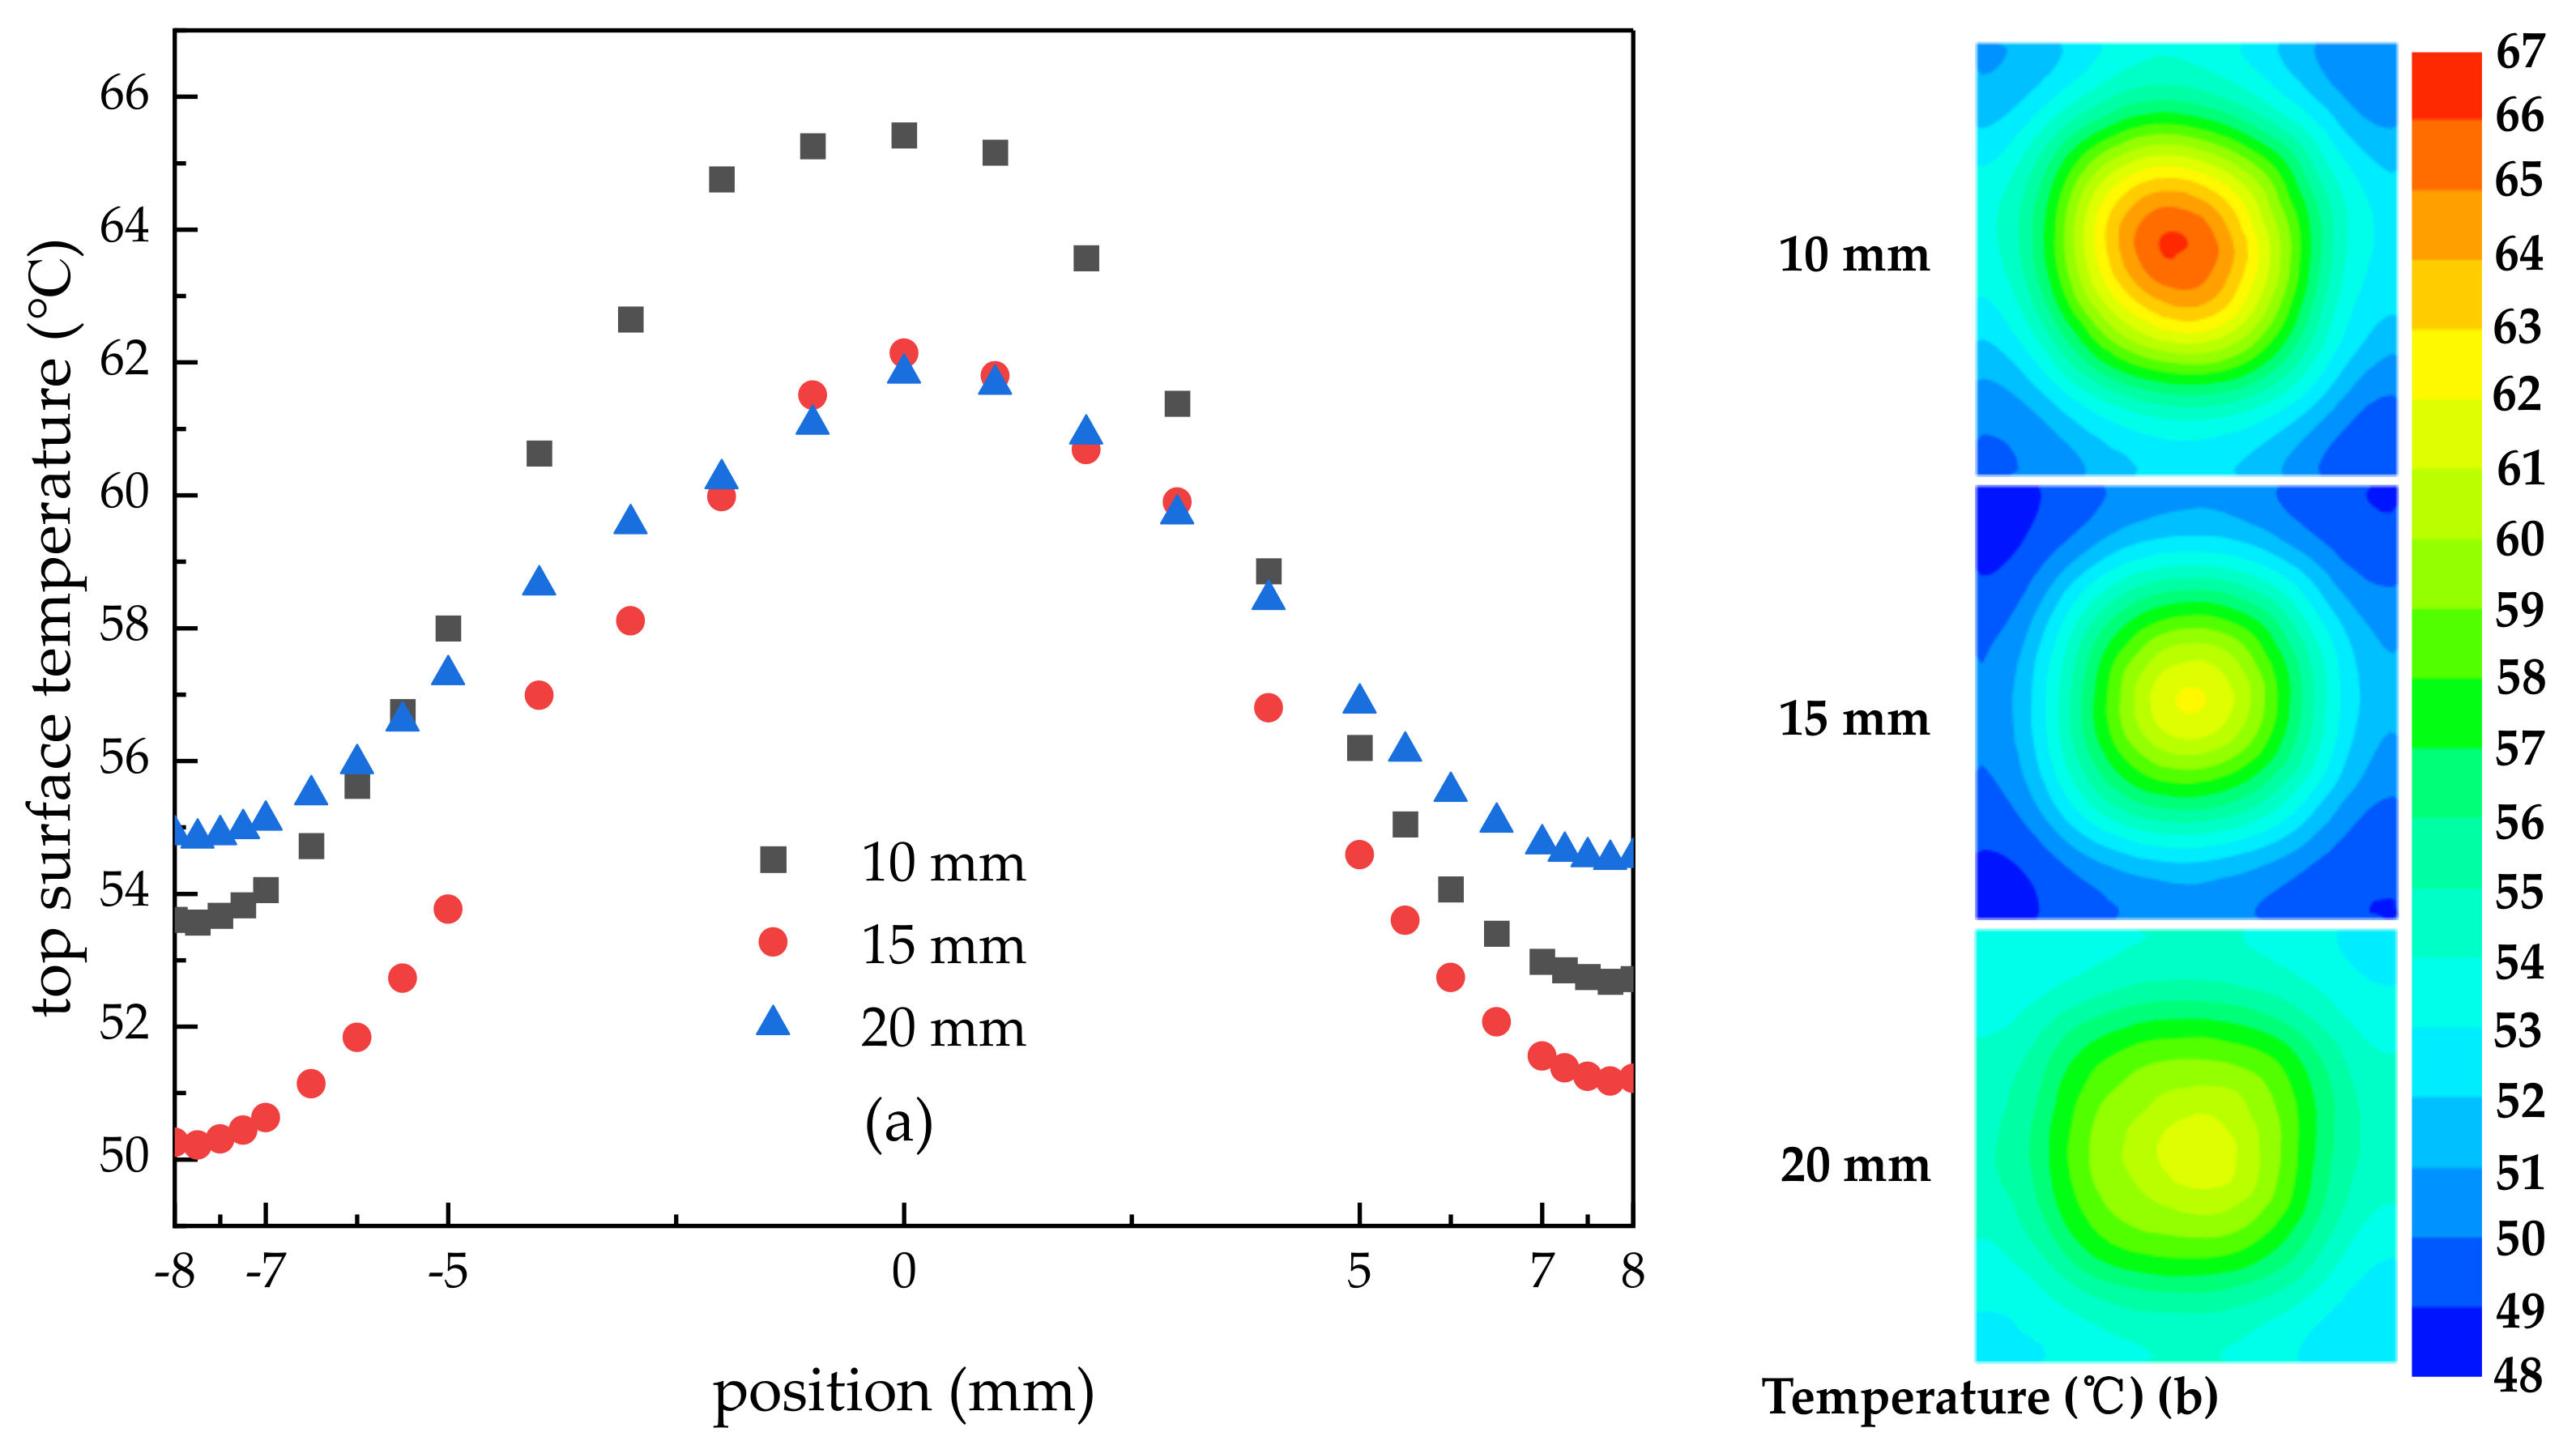
Figure 6a,b show the temperature diagram of the surface center line and the temperature distribution cloud diagram of the entire surface at different heights, respectively. And there was an optimal spray height, which had the same trend compared with the experimental results of Wan et al. [36]. As shown in Figure 6a, in the area between −5 mm and 5 mm on the surface centerline, when the spray height was 10 mm, the surface temperature was the highest, while the temperature was the lowest when the spray height was 15 mm. However, the temperature was the highest when the spray height was 20 mm, and the temperature was the lowest when the spray height was 15 mm within the area between −8 mm and −5 mm on the surface centerline, as well as between 5 mm and 8 mm. Furthermore, overall, at different heights, the distribution of temperature on the centerline showed the same trend of high temperature in the middle and low temperature on both sides. This was because the heat source was a local heat source, and the heat flow concentrated in the middle region (−5 mm to 5 mm), which made the middle temperature high and the edge temperature low. In addition, the change in spray height affected the thickness, speed, and spread of the liquid film on the cooling surface, and then affected the heat dissipation effect of the surface. When the spray height was 10 mm, the liquid film formed by the spray droplets spread poorly on the surface, and the thickness of the liquid film in the central area was large, and the heat transfer effect was poor, and the highest and lowest temperatures on the centerline were 65.42 °C and 52.68 °C, respectively. With the increases in spray height, the range of droplets hitting the surface increased, the thickness of liquid film in the central area decreased, and the spreading of liquid film on the surface became better. When the height was 15 mm, the impact range of droplets almost covered the entire surface, and the heat dissipation at the edge was good, the heat transfer effect was good, and the highest and lowest temperatures on the centerline were 62.14 °C and 50.22 °C, respectively. But when the height continued to increase to 20 mm, the impact range of the droplets exceeded the cooling surface, and some droplets did not hit the surface, resulting in a decrease in the number of effective droplets participating in heat dissipation and a suppression of heat transfer efficiency. When the nozzle height was 20 mm, the maximum and minimum temperatures on the centerline were 61.84 °C and 54.52 °C, respectively. This shows that there was an optimal spray height to achieve the best heat transfer effect. What is more, when the spray height was 10 mm, 15 mm, and 20 mm, the surface temperature difference ΔT was 12.74 °C, 11.92 °C, and 7.32 °C, respectively, which indicated that with the increase in spray height, the uniformity of surface temperature improved. This conclusion could also be obtained from the temperature field cloud picture in Figure 6b.

3.1.2. Effect of Spray Height on Surface Stress and Deformation

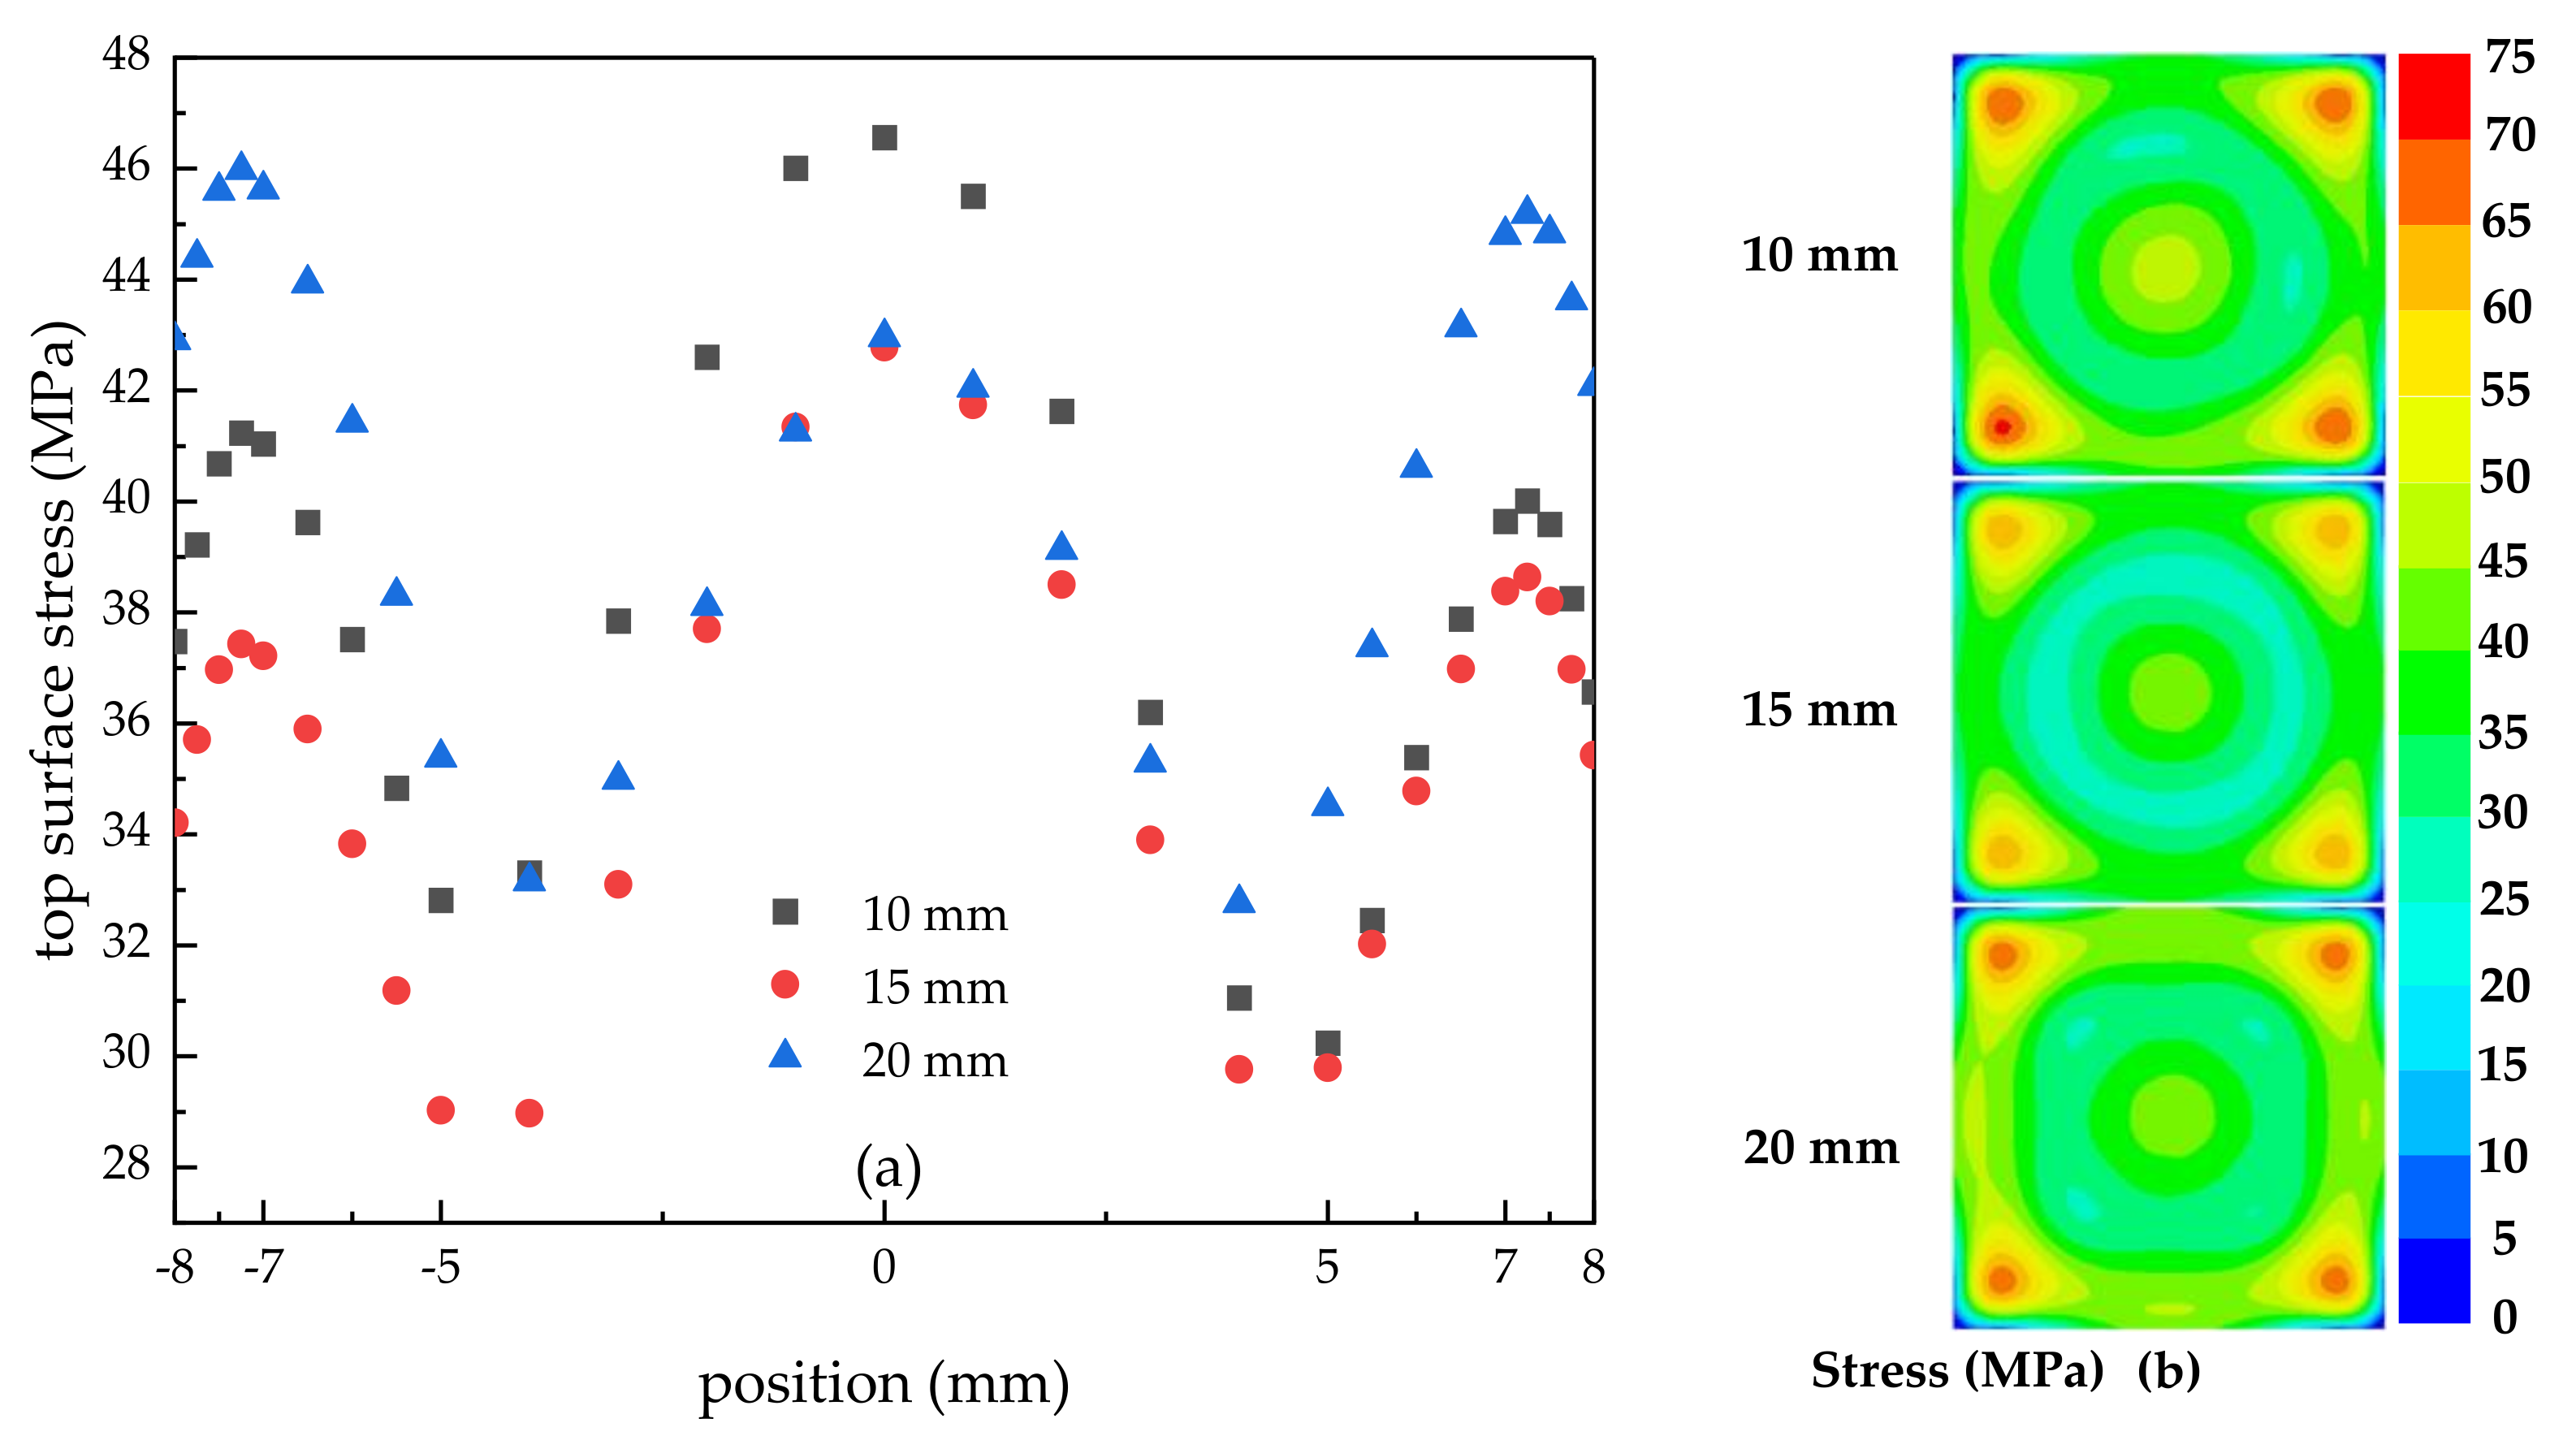
Figure 7 shows the stress distribution on the surface at different heights. As shown in Figure 7a, the stress showed the same trend along the centerline at different heights. And it was consistent with the change in temperature; that is, the higher the temperature, the greater the stress. In the central area (from −5 mm to 5 mm), although there were no constraints, there was a significant local heat flow, and the stress was mainly generated by high temperature. Meanwhile, due to the presence of constraints, higher stresses were generated at the edges (−8 mm to −7 mm and 7 mm to 8 mm), while in other areas, the stress was relatively small due to the lack of direct influence of heat flow and constraints. Therefore, a staggered distribution of peaks and valleys for stress appeared on the surface centerline. When the nozzle height was 15–20 mm, the stress at the center of the encapsulated plate was relatively close, which was almost consistent with the temperature distribution trend. This indicated that the temperature distribution had a significant impact on the stress distribution. As the nozzle height increased, the minimum stress on the centerline showed significant changes, which were 30.24 MPa, 28.97 MPa, and 32.76 MPa, respectively. What is more, when the spray height was 10 mm, 15 mm, and 20 mm, the maximum stress difference on the surface centerline was 16.32 MPa, 13.81 MPa, and 13.22 MPa, respectively, which indicated that with the increase in spray height, the uniformity of stress also improved. Additionally, as shown in the cloud in Figure 7b, stress concentration occurred in the four corner areas. This is because intersecting edges could cause stress to accumulate, resulting in a rapid increase in local stress. However, when the spray height was 15 mm, the stress significantly reduced due to the best heat dissipation effect.
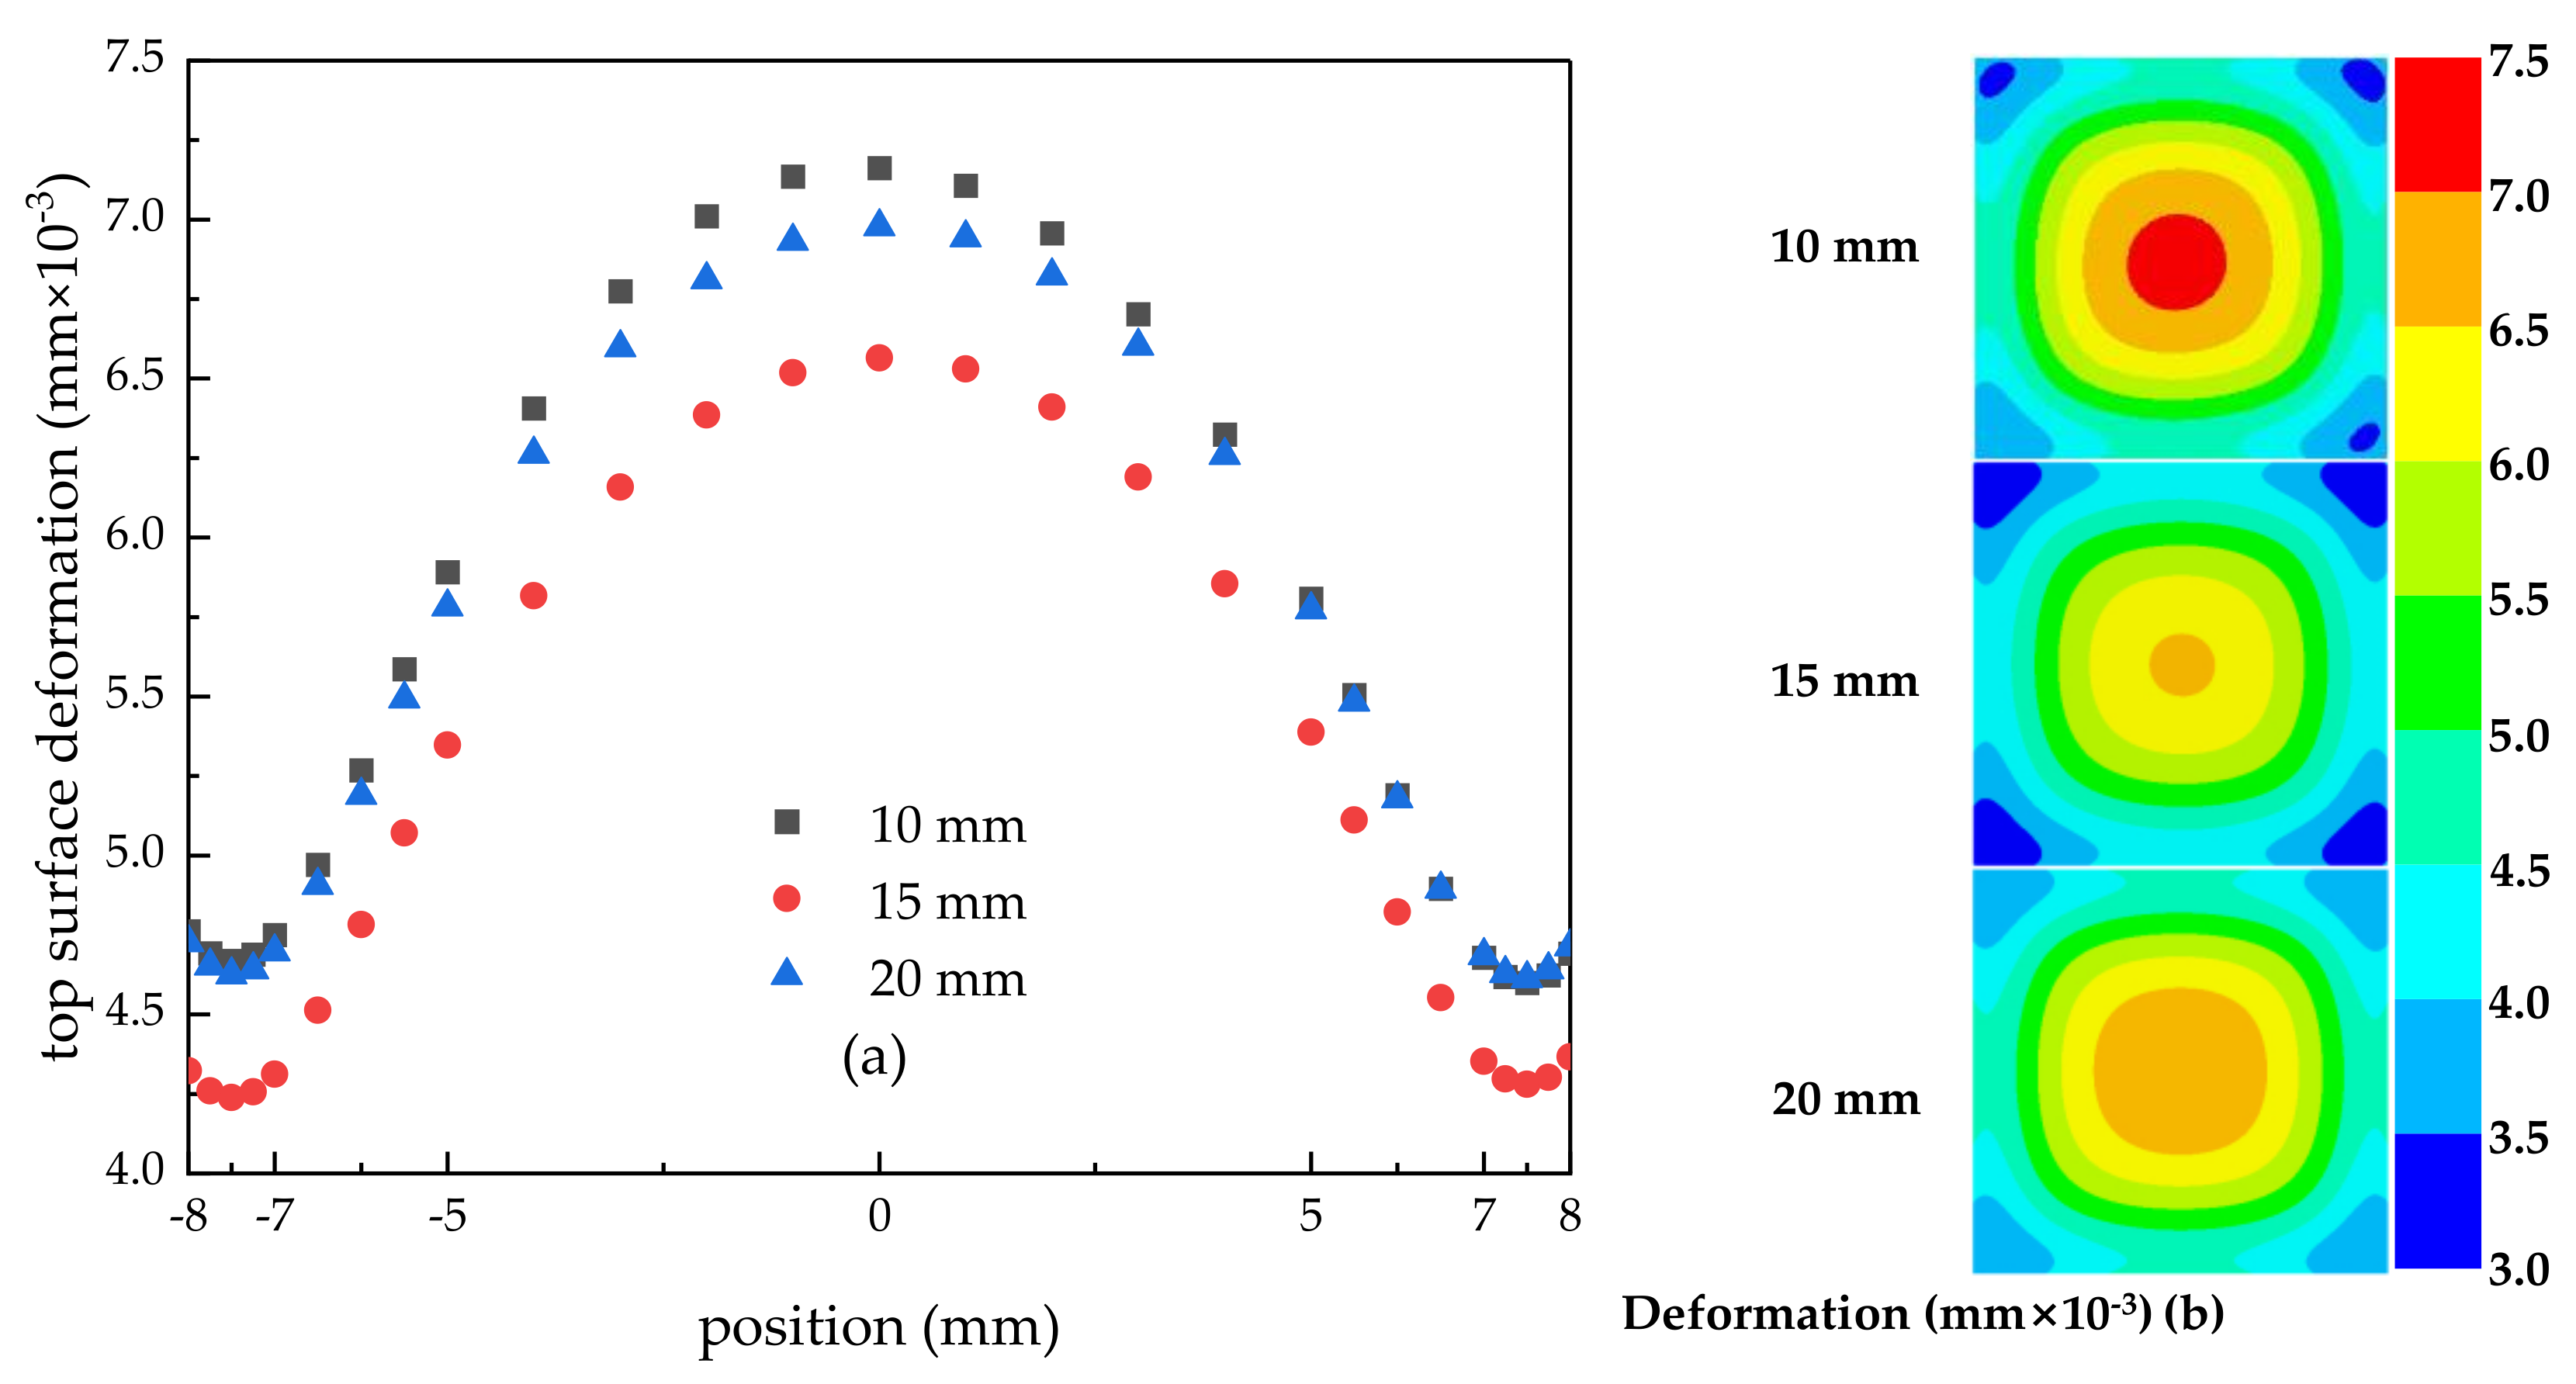
Figure 8 shows the deformation of the surface centerline at different heights (Figure 8a), as well as the distribution cloud picture of the entire surface deformation at different heights (Figure 8b). As shown in Figure 8a, at different heights, the deformation amount showed the same trend along the surface centerline; that is, in the unconstrained zone (−7 to 7 mm), the deformation amount was relatively large due to the influence of a high-temperature heat source. However, the edge region was constrained, resulting in a smaller amount of deformation. In addition, due to the influence of spray cooling, the better the heat dissipation effect, the smaller the surface deformation. And due to the concave phenomenon in the constraint area, it would cause a local decrease in the lifespan of the encapsulated plate. And the concave area also generated significant stress, as shown in Figure 8.
When the spray height was 10 mm, the heat transfer effect was relatively poor, and the maximum and minimum deformation on the centerline were 7.16 × 10⁻³ mm and 4.60 × 10⁻³ mm, respectively; however, when the spray height was 15 mm, the heat transfer effect was significantly improved, and the maximum and minimum deformation on the centerline reduced to 6.56 × 10⁻³ mm and 4.24 × 10⁻³ mm, respectively. In addition, when the nozzle height was 20 mm, the maximum and minimum deformations were 6.98 × 10⁻³ mm and 4.61 × 10⁻³ mm, respectively. And when the heights were 10, 15, and 20 mm, the maximum and minimum deformation differences were 2.56 × 10⁻³ mm, 2.33 × 10⁻³ mm, and 2.36 × 10⁻³ mm, respectively.

3.2. Effect of Spray Flow on Surface Temperature, Stress, and Deformation of Encapsulation Structure

In this section, we used data from Case 1, Case 2, and Case 3 in Table 2.

3.2.1. Effect of Spray Flow on Surface Temperature

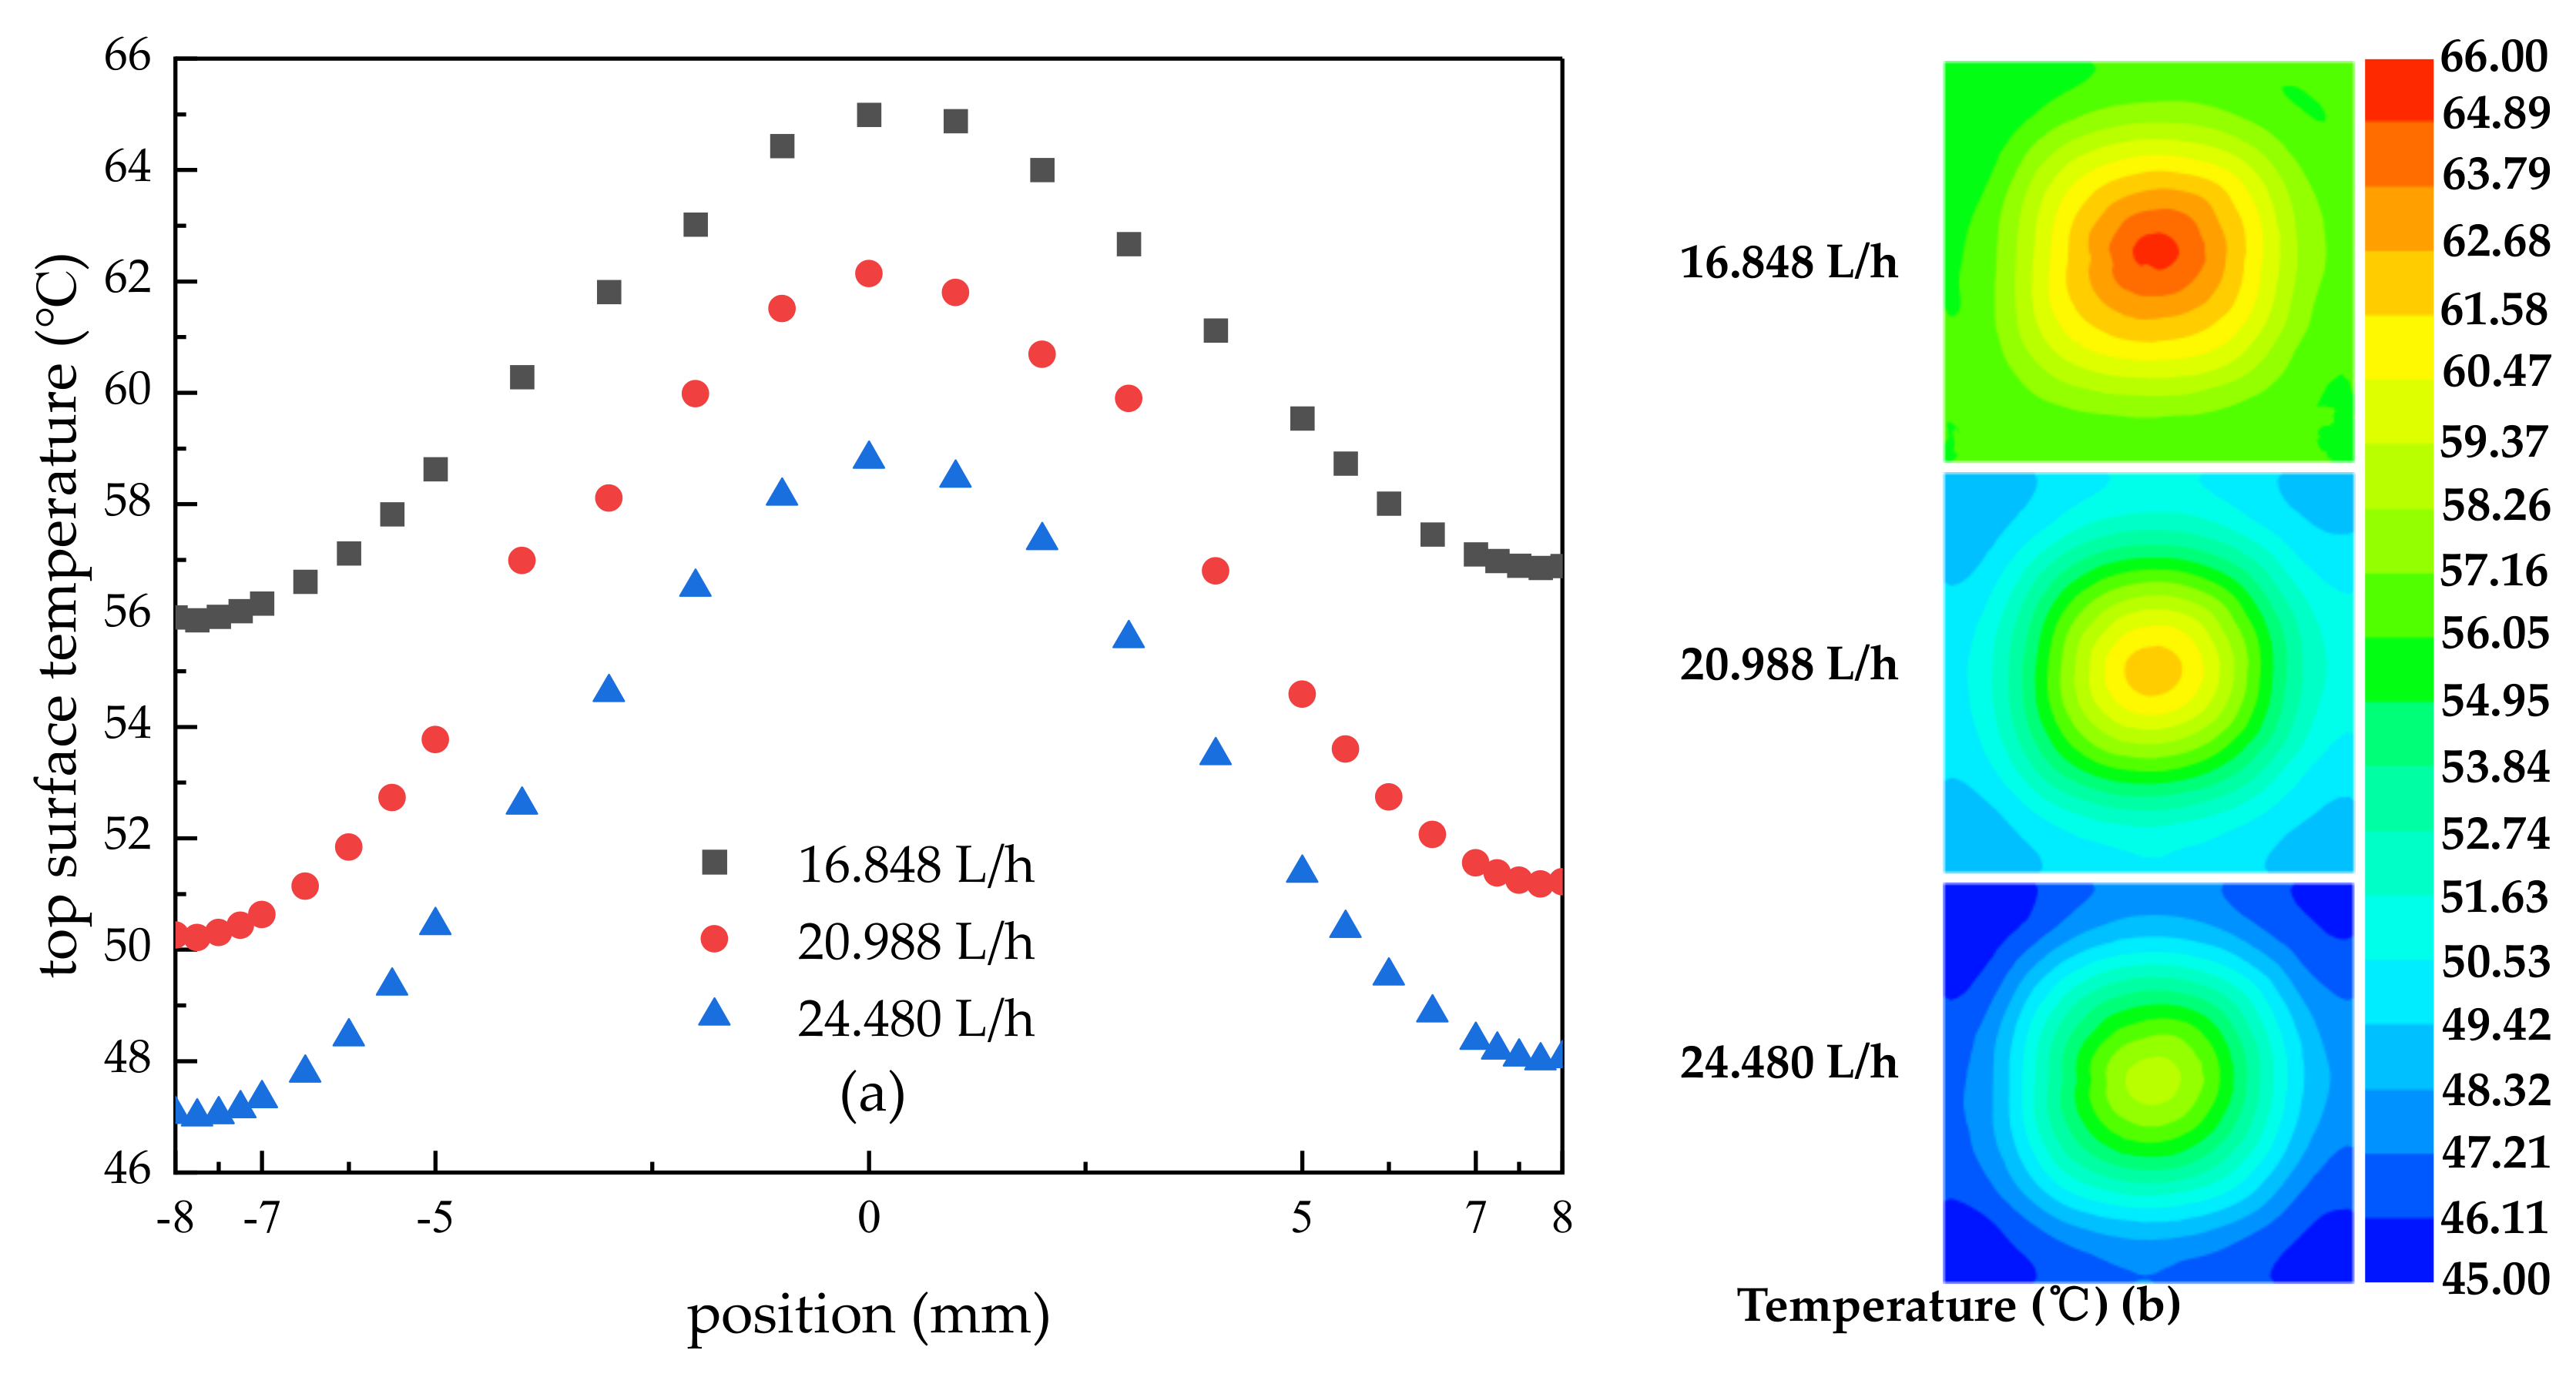
Figure 9 shows the temperature distribution of the surface centerline (Figure 9a) and the temperature distribution cloud picture of the entire surface under different flow rates (Figure 9b). The results were compared with the work of Liu et al. [37] and it was found that the trend of temperature change remained consistent. As shown in Figure 9a, the greater the flow rate, the better the heat dissipation effect and the lower the surface temperature. The reason was that the number and speed of droplets increased in the spray flow field, and the flow rate of the liquid film on the surface increased with the increase in the flow rate, which ultimately led to an improvement in the heat exchange capacity. However, the increase in the flow rate induced an increase in the temperature difference. When the flow rates were 16.848 L/h, 20.988 L/h, and 24.480 L/h, the maximum temperature were 64.99 °C, 62.14 °C, and 58.81 °C, and the maximum temperature difference values were 9.07 °C, 11.92 °C, and 11.81 °C, respectively. This indicated that although increasing the flow rate could effectively reduce the surface temperature, it had a certain inhibitory effect on temperature uniformity. The possible reason was that when the flow rate was high, the thickness of the liquid film in the edge area was thinner, the liquid film velocity was higher, and the renewal speed was faster. The cooling effect of the edge area was stronger than that of the middle heat source area, resulting in a lower temperature in the edge area and a decrease in temperature uniformity.

3.2.2. Effect of Spray Flow on Surface Stress and Deformation

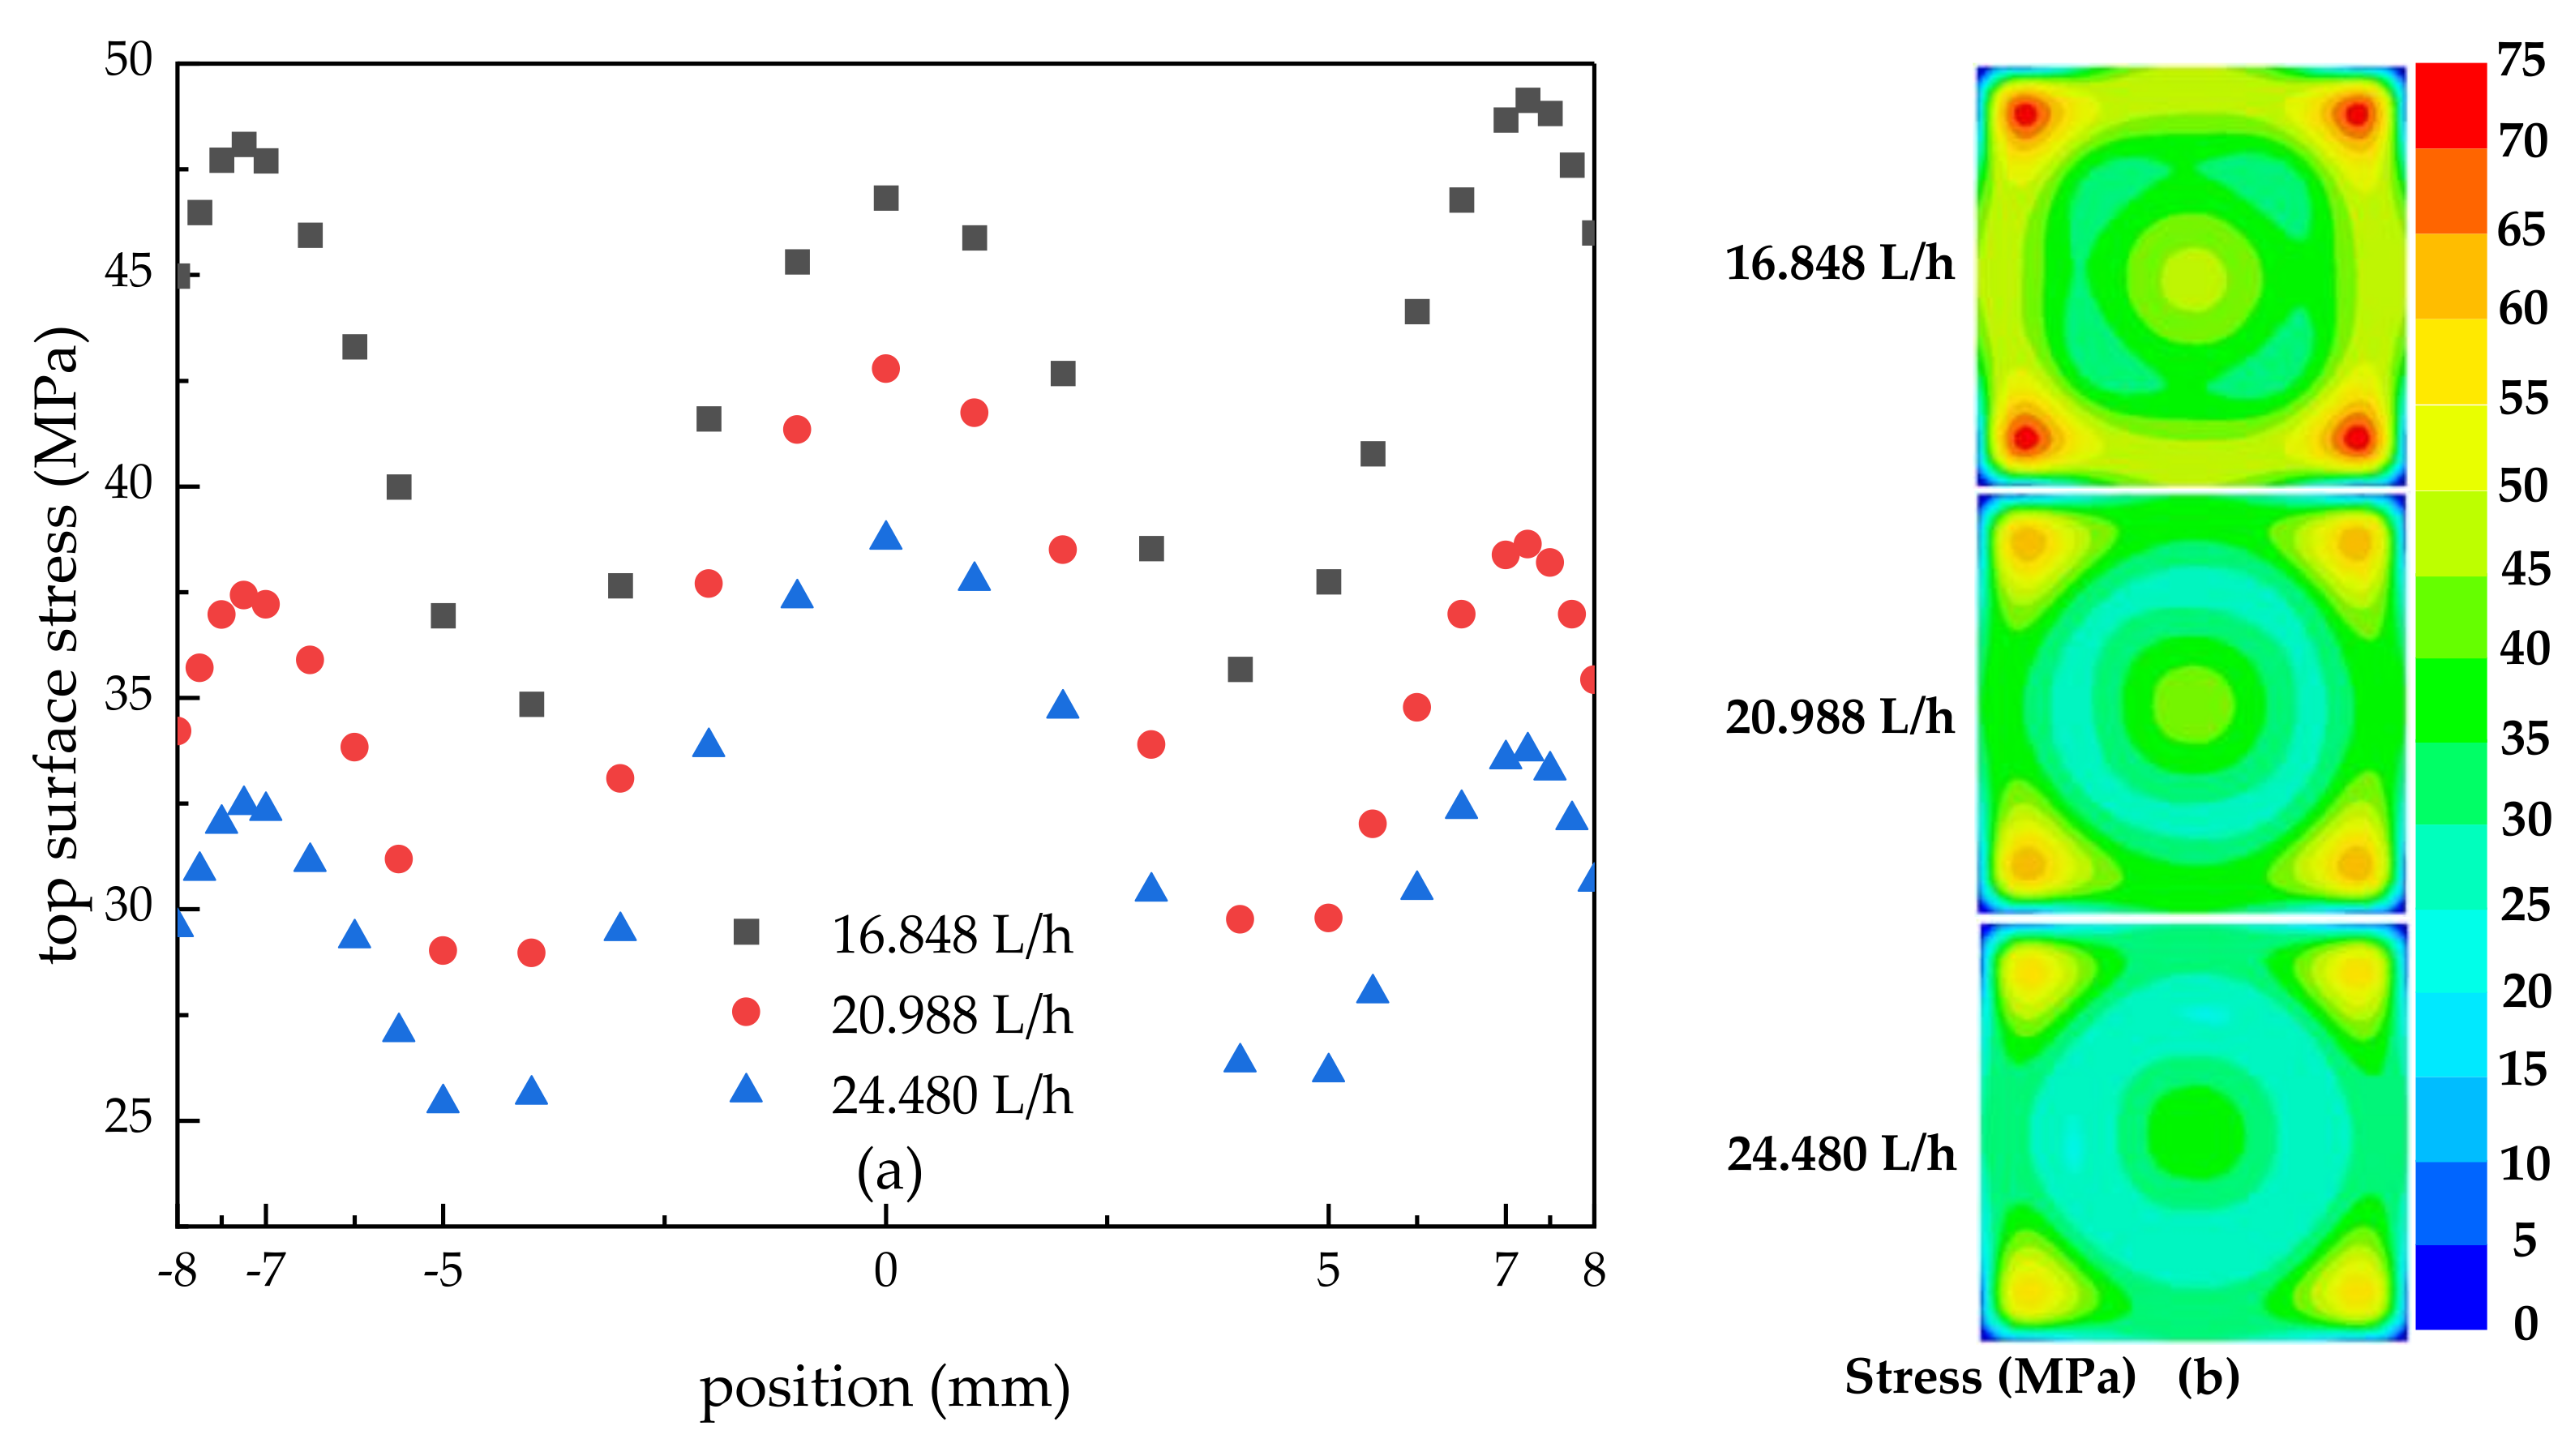
Figure 10 shows the stress distribution of the surface centerline (Figure 10a) and the stress distribution cloud picture of the entire surface under different flow rates (Figure 10b). As shown in Figure 10a, overall, the larger the flow rate, the smaller the surface stress. Due to the influence of edge constraints and heat flow in the central region, the stress also showed a staggered distribution of “peaks” and “valleys” on the entire surface centerline. In addition, with the increase in spray flow rate, the maximum and minimum stress differences gradually decreased, which were 14.28 MPa, 13.81 MPa, and 11.33 MPa, respectively. And the maximum stress was 49.14 MPa, 42.78 MPa, and 38.74 MPa, respectively. This indicated that increasing the flow rate could not only reduce the stress but also improve the uniformity of stress distribution. In addition, increasing the spray flow could effectively reduce the stress around the corners of the encapsulated plate and increase the service life of the encapsulated structure.
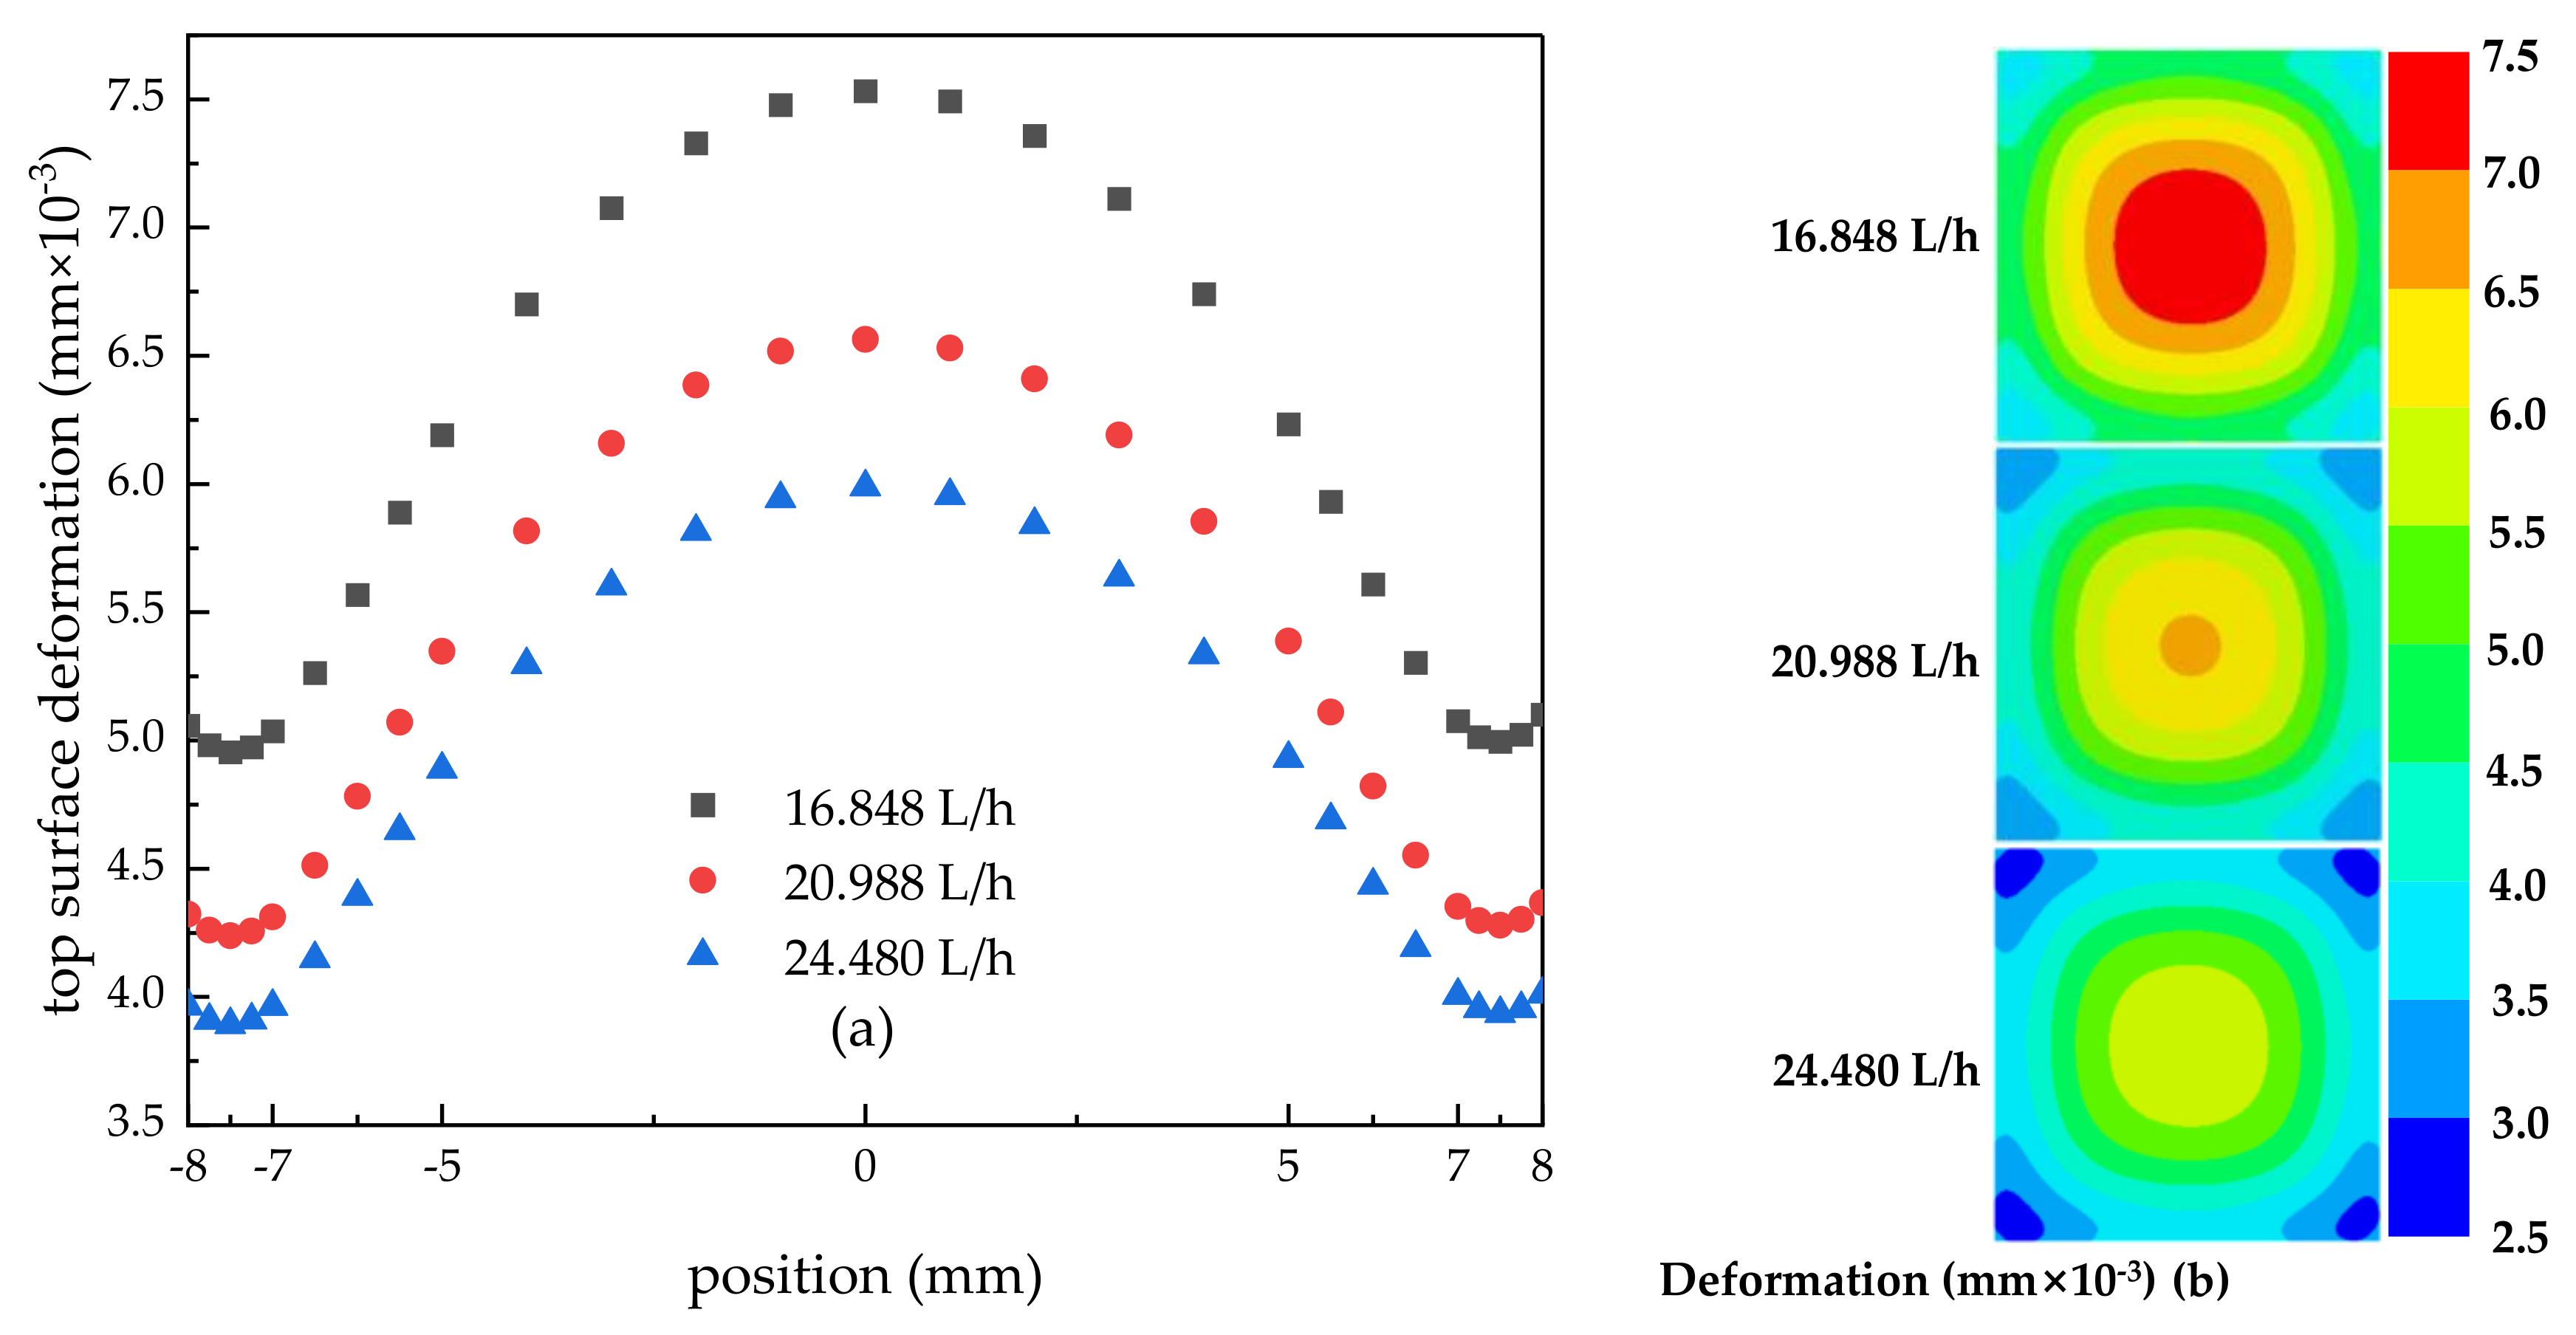
Figure 11 shows the deformation of the surface centerline at different flow rates (Figure 11a), as well as the distribution cloud picture of the entire surface deformation at different flow rates (Figure 11b). As shown in Figure 11a, under different flow rates, the deformation amount showed the same trend along the surface centerline; that is, in the unconstrained zone, the deformation amount was relatively large due to the influence of a high-temperature heat source. However, the edge region was constrained, resulting in a smaller amount of deformation. In addition, the larger the flow rate, the better the surface heat dissipation effect and the smaller the surface deformation. When the spray flow rate was 16.848 L/h, the heat transfer effect was relatively poor, and the maximum and minimum deformation on the centerline were 7.53 × 10⁻³ mm and 4.95 × 10⁻³ mm, respectively; however, when the spray flow rate was 24.480 L/h, the heat transfer effect was significantly improved, and the maximum and minimum deformation on the centerline reduced to 5.99 × 10⁻³ mm and 3.89 × 10⁻³ mm, respectively. And with the increase in flow rate, the deformation differences were 2.58 × 10⁻³ mm, 2.33 × 10⁻³ mm, and 2.10 × 10⁻³ mm, respectively. It could be seen from Figure 11a,b that increasing the spray flow rate was conducive to reducing the surface deformation of the encapsulated plate and improving the deformation uniformity.

3.3. Effect of Nozzle Inclination on Surface Temperature, Stress, and Deformation of Encapsulation Structure

In this section, we used data from Case 2, Case 6, and Case 7 in Table 2. In the Figure 2d, α was the nozzle inclination angle.

3.3.1. Effect of Nozzle Inclination on Surface Temperature

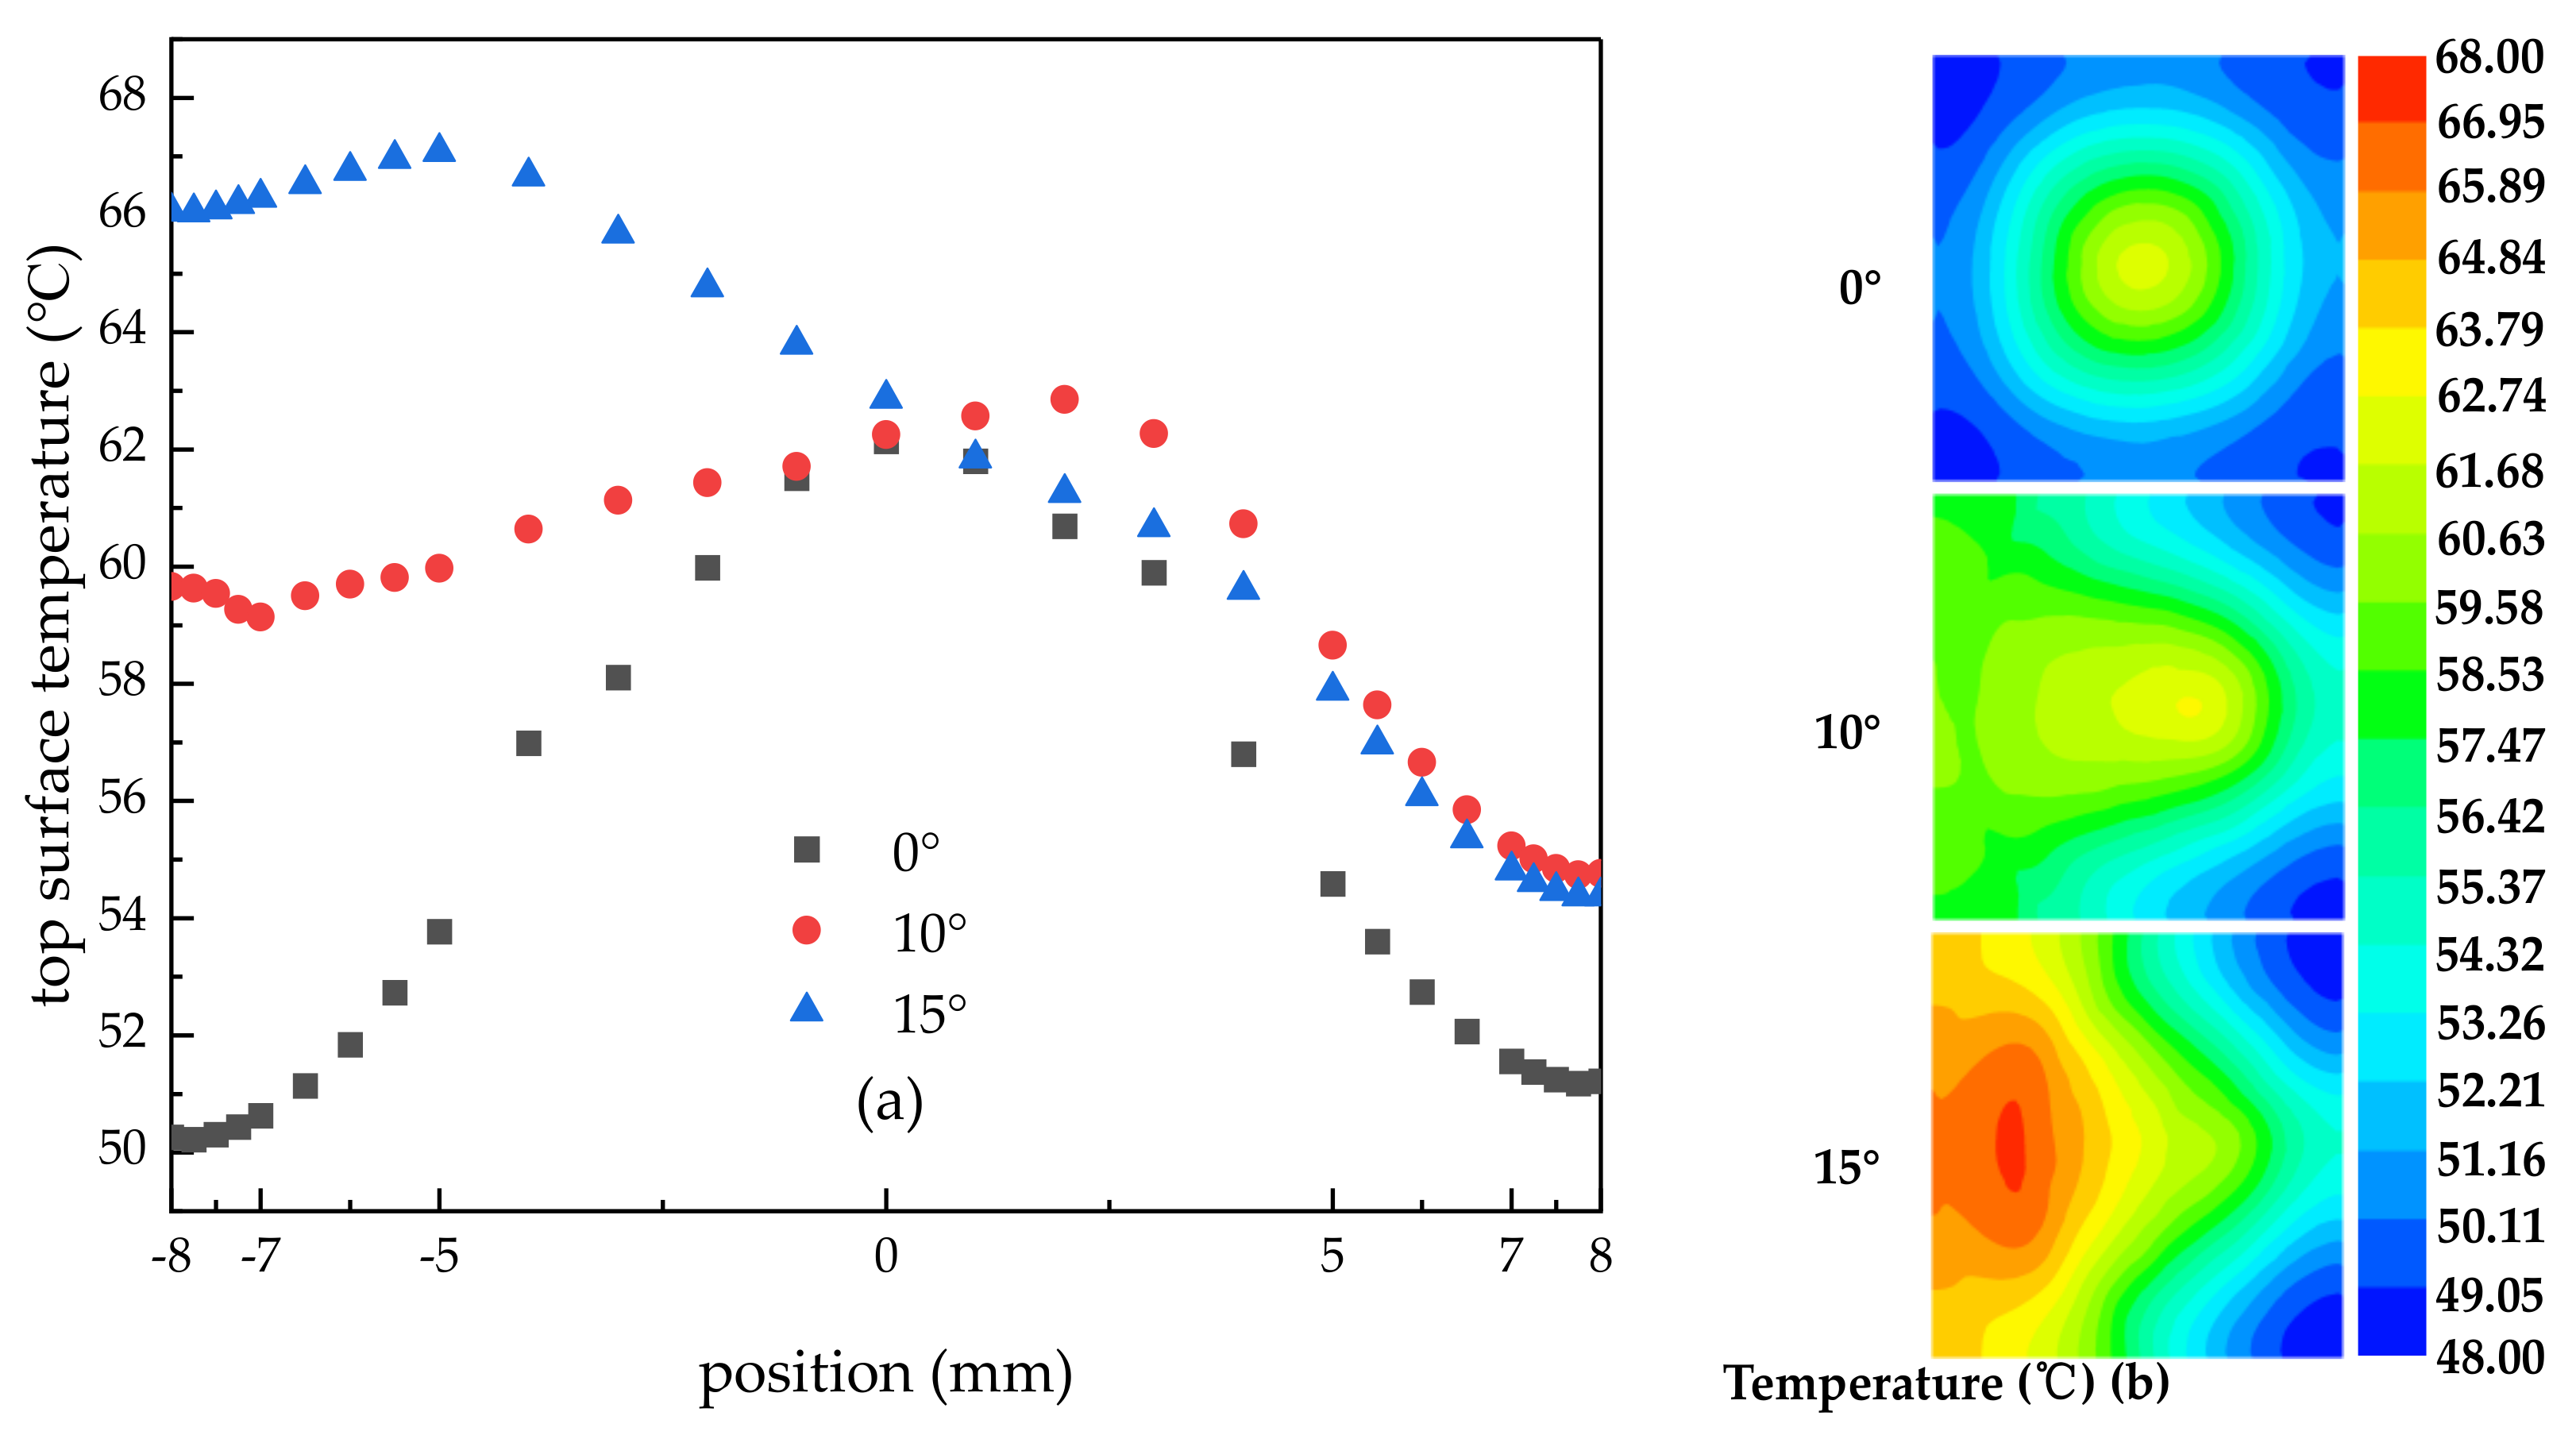
Figure 12 shows the surface centerline temperature distribution (Figure 12a), as well as the temperature cloud picture of the entire surface at different nozzle inclination angles (Figure 12b). As shown in the figure, when the nozzle inclination angle was 0 degrees, the heat dissipation effect was the best and the surface temperature was the lowest. As the inclination angle of the nozzle increased, a certain accumulation of liquid film occurred on the left side of the cooling surface, which meant that the thickness of the liquid film increased and the speed decreased, resulting in a decrease in heat transfer efficiency and an increase in temperature. On the right side of the cooling surface, the increase in the inclination angle caused some liquid to flow away directly which meant that these liquids did not exchange heat with the cooling surface in time, so that the heat transfer effect was suppressed to a certain extent. When the inclination was 15 degrees, the temperature on the right side of the cooling surface was lower than that at 10 degrees, due to the enhancement of its scouring effect. In addition, when the inclination angles of the nozzle were 0 degrees and 15 degrees, the temperature difference on the centerline was 11.92 °C, 8.11 °C, and 12.7 °C, respectively, and it showed that slightly increasing the nozzle inclination angle could improve the temperature uniformity.

3.3.2. Effect of Nozzle Inclination on Surface Stress and Deformation

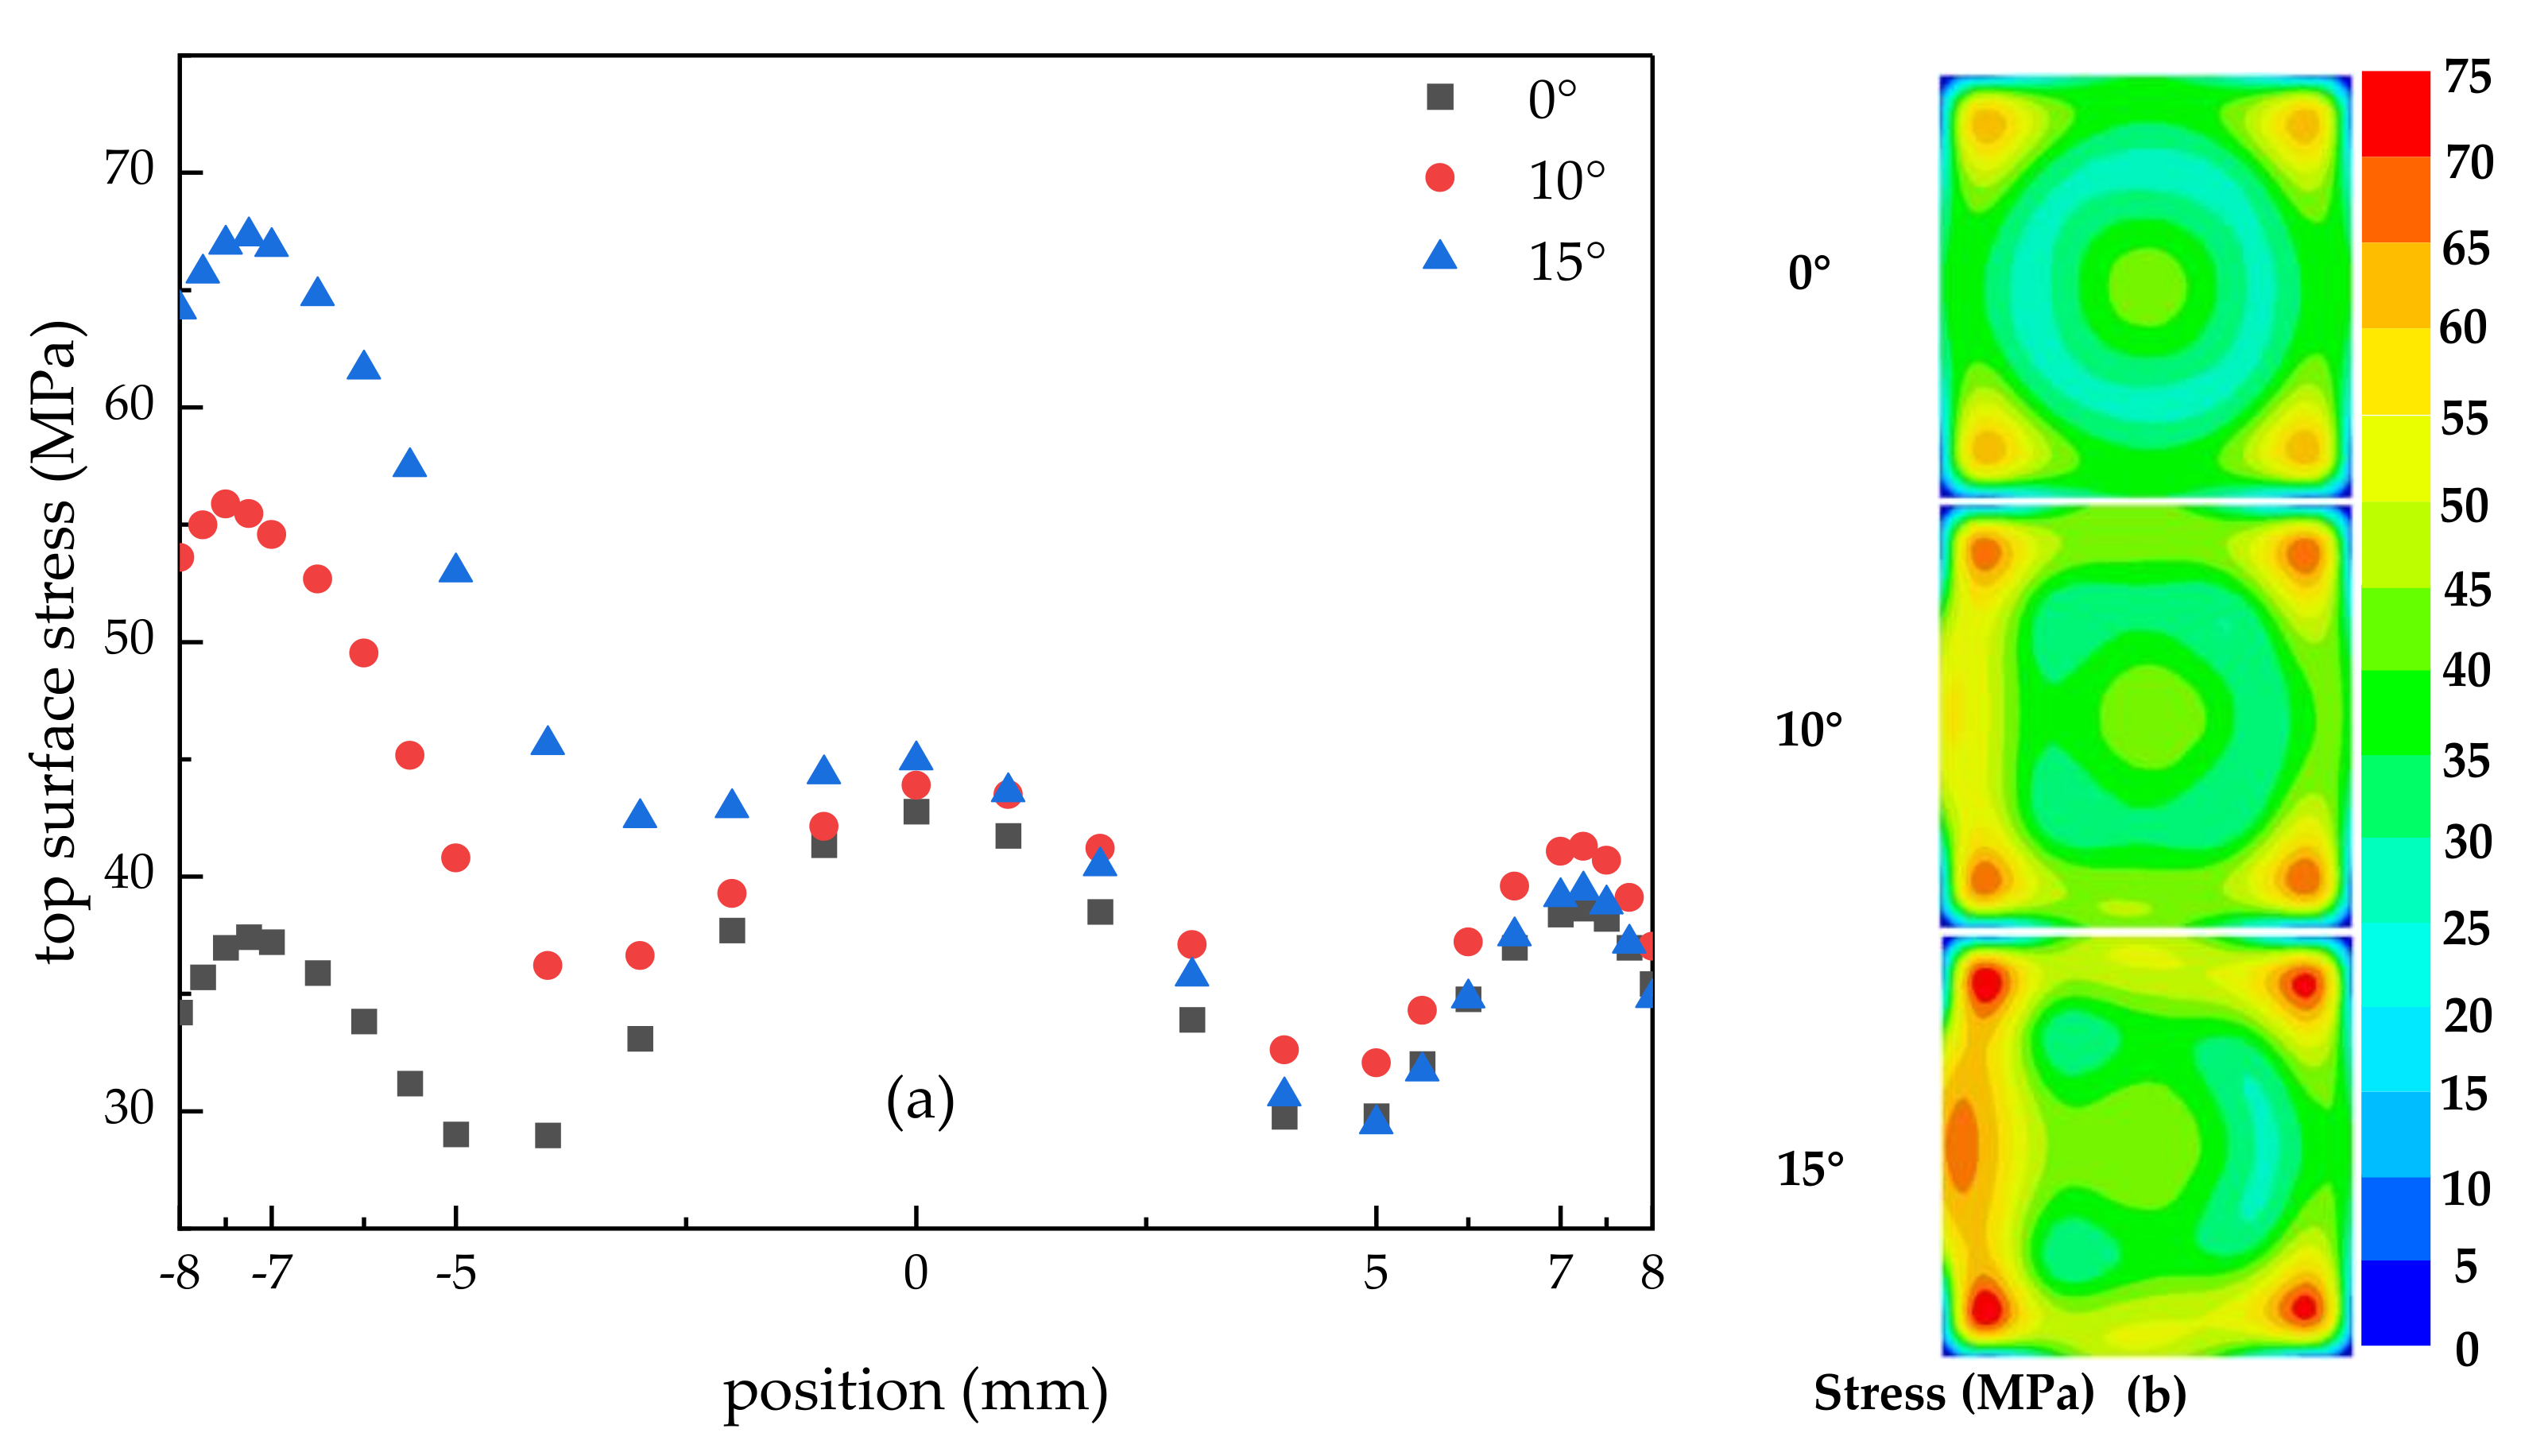
Figure 13 shows the stress distribution on the surface at different nozzle inclination angles. As shown in Figure 13a, the stress showed the same trend along the centerline at different nozzle inclination angles. And it was consistent with the change in temperature; that is, the higher the temperature, the greater the stress. In addition, as the nozzle inclination angle increased, the difference between the maximum and minimum stresses on the centerline also significantly increased, with values of 13.81 MPa, 23.82 MPa, and 37.84 MPa, respectively. In addition, it can be seen from Figure 13b that increasing the nozzle inclination angle not only increased the stress on the left edge of the encapsulated plate, but also caused the increase in the stress on other edge parts. This could reduce the working life of the encapsulated plate.
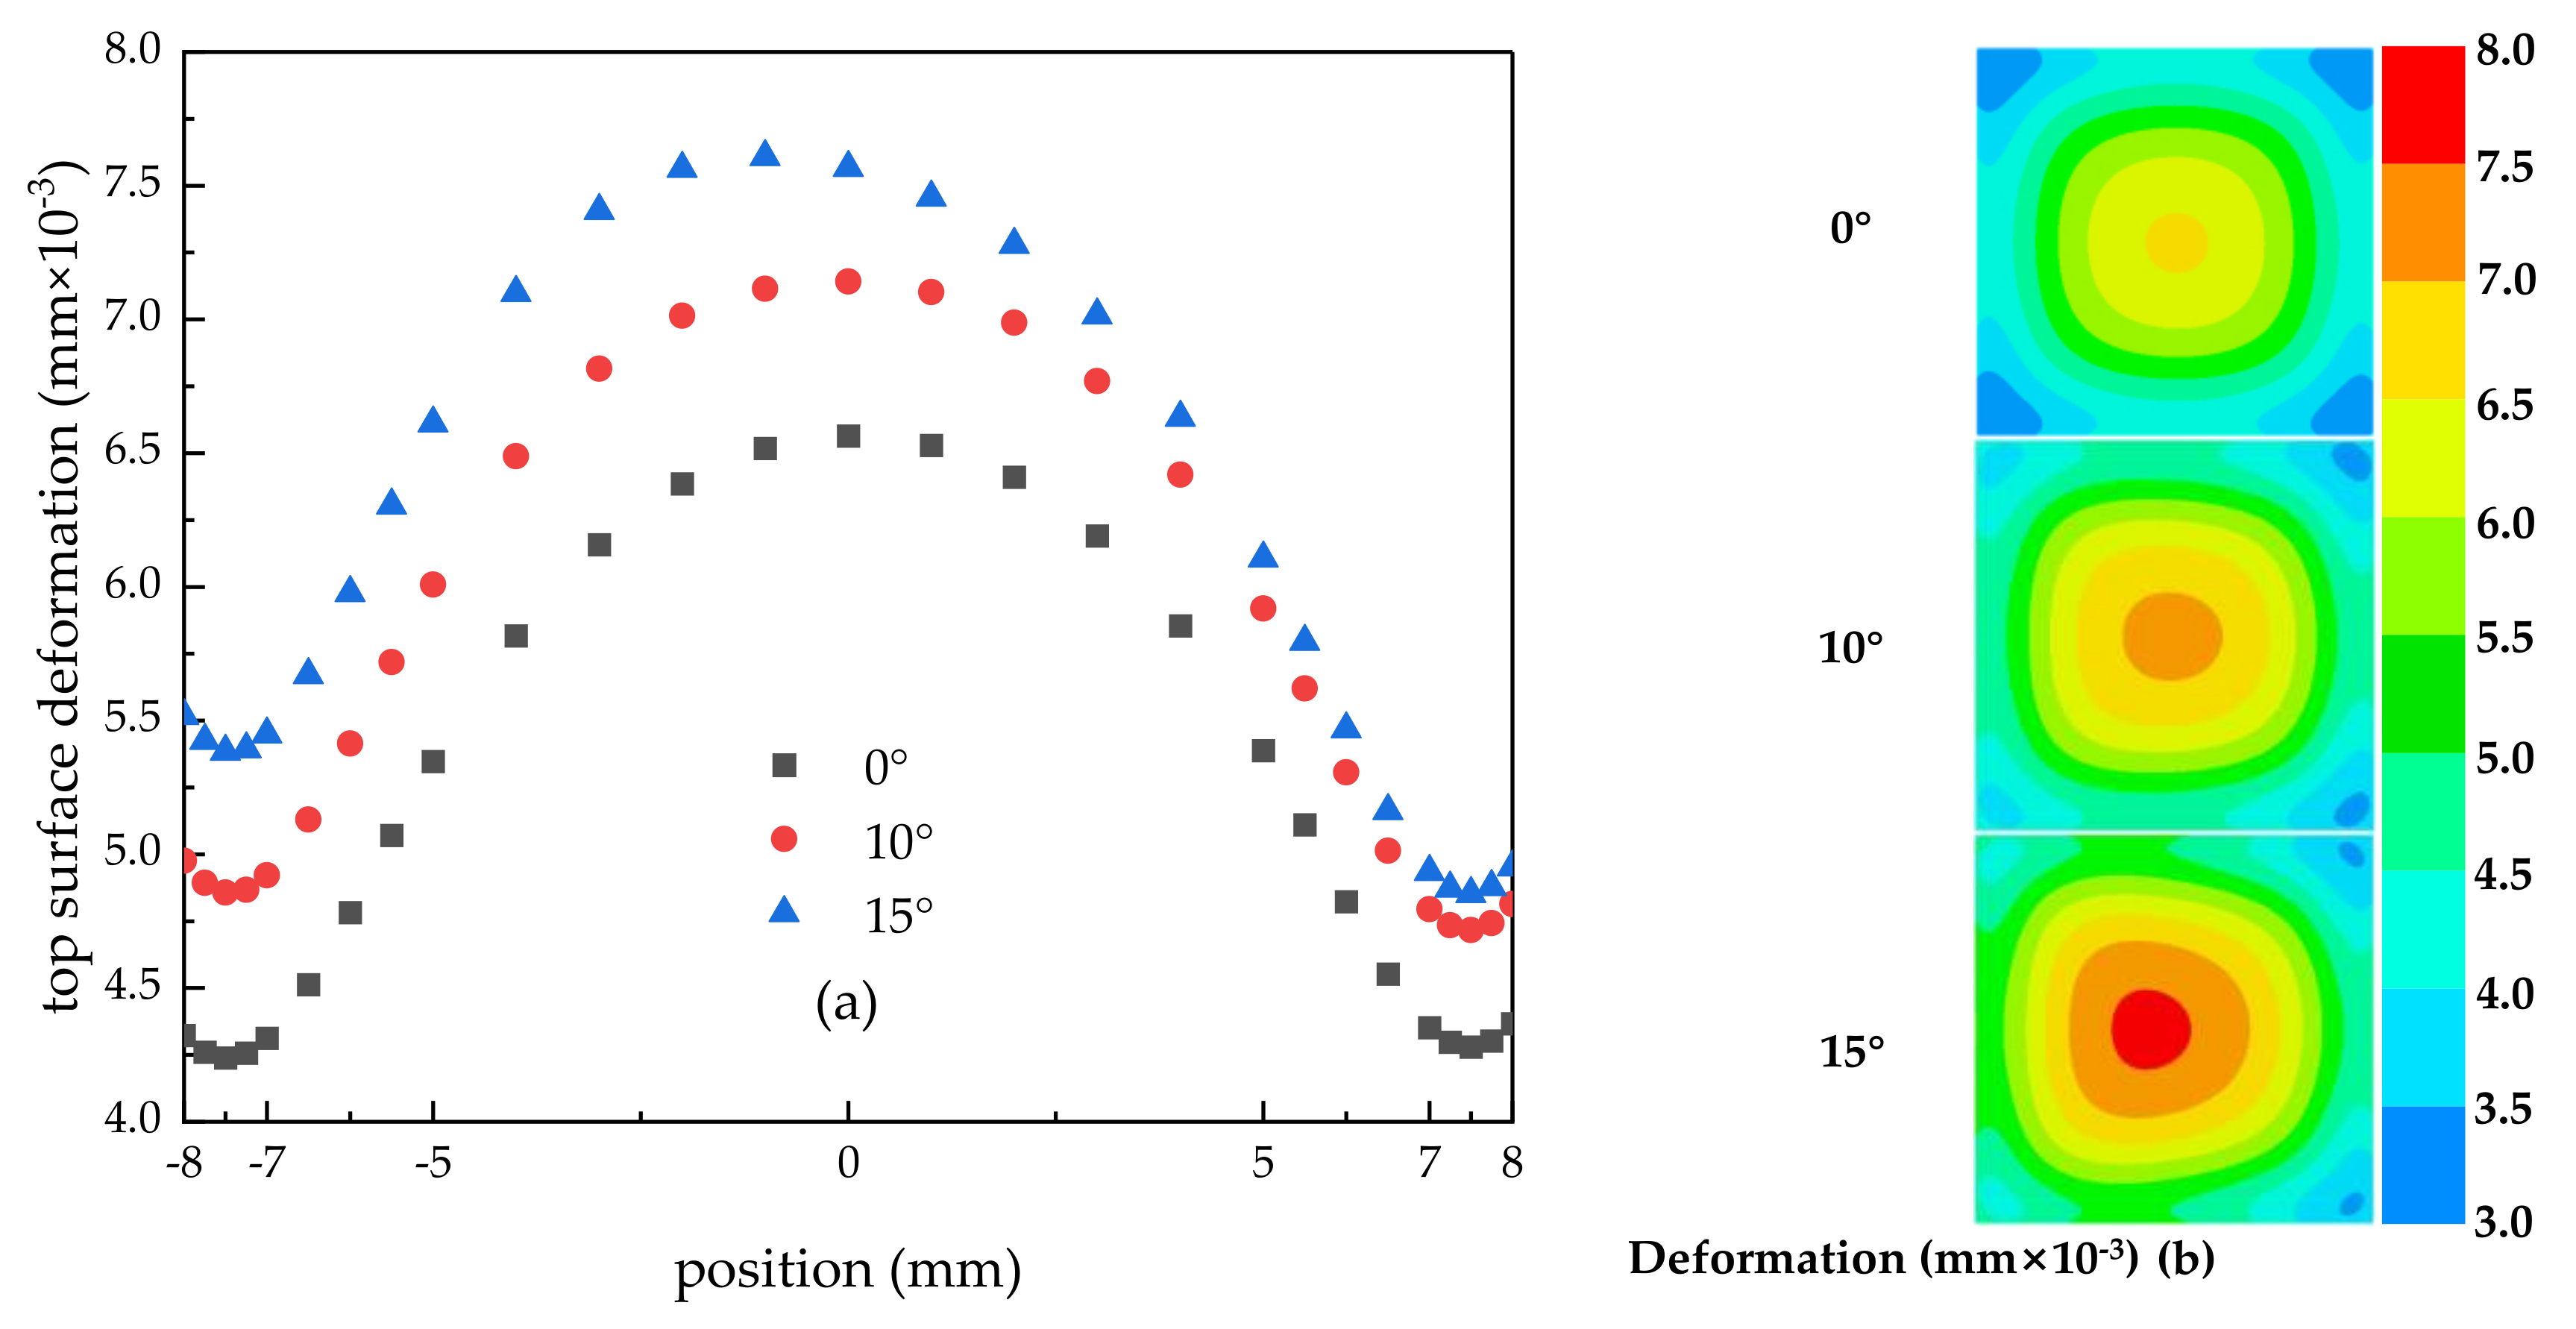
Figure 14 shows the deformation of the surface centerline at different nozzle inclination angles (Figure 14a), as well as the distribution cloud picture of the entire surface deformation at different nozzle inclination angles (Figure 14b). As shown in Figure 14a, under different nozzle inclination angles, the deformation amount showed the same trend along the surface centerline; that is, in the unconstrained zone (−7 to 7 mm), the deformation amount was relatively large due to the influence of a high-temperature heat source. However, the edge region was constrained, resulting in a smaller amount of deformation. In addition, the smaller the nozzle inclination, the better the heat dissipation effect and the smaller the surface deformation. When the spray inclination was 15o, the heat transfer effect was relatively poor, and the maximum and minimum deformation on the centerline were 7.61 × 10⁻³ mm and 4.85 × 10⁻³ mm, respectively; however, when the spray inclination was 0°, the heat transfer effect was significantly improved, and the maximum and minimum deformation on the centerline reduced to 6.56 × 10⁻³ mm and 4.24 × 10⁻³ mm, respectively. As the inclination angle increased, the deformation differences were 2.33 × 10⁻³ mm, 2.42 × 10⁻³ mm, and 2.75 × 10⁻³ mm, respectively, and the maximum deformation position moved towards the left side of the surface.

4. Conclusions

In this paper, a thermal stress coupling model was established under spray conditions, and the influence of spray parameters such as spray height, spray flow, and nozzle inclination on heat transfer, surface stress, and deformation were studied. The conclusions were as follows:
(1)
When the spray height was 10 mm, the liquid film formed by the spray droplets spread poorly on the surface, the thickness of the liquid film in the central area was large, the heat transfer effect was poor, and the highest and lowest temperatures were 65.42 °C and 52.68 °C, respectively. With the increase in spray height, the range of droplets hitting the surface increased, the thickness of liquid film in the central area decreased, and the spreading of liquid film on the surface became better. When the height was 15 mm, the impact range of droplets almost covered the entire surface, and the heat dissipation at the edge was good, the heat transfer effect was poor, and the highest and lowest temperatures were 62.14 °C and 50.22 °C, respectively. But when the height continued to increase to 20 mm, the impact range of the droplets exceeded the cooling surface, and some droplets did not hit the surface, resulting in a decrease in the number of effective droplets participating in heat dissipation and a suppression of heat transfer efficiency. When the nozzle height was 20 mm, the maximum and minimum temperatures were 61.84 °C and 54.52 °C. This shows that there was an optimum spray height to achieve the best heat transfer effect. In addition, the lower the temperature, the smaller the surface stress and deformation. And with the increase in spray height, the uniformity of the surface temperature and stress distribution were improved.
(2)
With the increase in flow rate, the heat transfer effect was enhanced, and the surface maximum temperature increased, which the values were 55.92 °C, 50.22 °C, and 47 °C, respectively. In addition, the temperature difference increased with values of 9.07 °C, 11.92 °C, and 11.81 °C; however, the stress differences decreased with values of 14.28 MPa, 13.81 MPa, and 11.33 MPa, respectively, and this indicated that although the increase in flow rate reduced the temperature uniformity, stress uniformity values were improved.
(3)
With the increase in nozzle inclination, the heat transfer performance deteriorated, the stress and deformation also increased, and the maximum deformation position moved. However, when the nozzle inclination angle was 0 degrees, the heat dissipation effect was the best and the surface temperature and the stress and deformation were the lowest. This was because as the inclination angle of the nozzle increased, a certain accumulation of liquid film occurred on the left side of the cooling surface, which the thickness of the liquid film increased and the speed decreased, resulting in a decrease in heat transfer efficiency and an increase in temperature. On the right side of the cooling surface, the increase in the inclination angle caused some liquid to flow away directly which meant that these liquids did not exchange heat with the cooling surface in time, so that the heat transfer effect was suppressed to a certain extent. The deterioration of heat transfer resulted in an increase in surface stress and deformation.
(4)
On the whole, in this paper, the heat transfer is non-boiling heat transfer, the temperature is low, and the surface of the encapsulated structure is a plane; however, with the increase in temperature, the heat transfer becomes a boiling state, the heat transfer process becomes more complicated, and thus the establishment of the thermal stress–force coupling model of this process will be a challenge for future work. In addition, in order to enhance heat dissipation, when the rib surface is used as the surface of the encapsulated structure, it will be another challenge for modeling and experimentation.

Author Contributions

Conceptualization, Y.P. and Z.N.; methodology, Y.P. and Z.N.; software, Y.P. and Z.N.; validation, Y.P. and Z.N.; formal analysis, Y.P. and Z.N.; investigation, Y.P. and Z.N.; resource, Y.P., S.Z., T.Q. and C.L.; data curation, Y.P. and Z.N.; writing—original draft, Y.P. and Z.N.; writing—review and editing, Y.P. and Z.N.; visualization, Y.P. and Z.N.; supervision, Y.P. and Z.N.; project administration, Y.P., S.Z., T.Q. and C.L.; funding acquisition, Y.P., S.Z., T.Q. and C.L. All authors have read and agreed to the published version of the manuscript.

Funding

This work was supported by the National Natural Science Foundation of China (52206122), Henan Provincial Key Research and Development and Promotion Special Projects (232102321087, 222102320300, 232102321086).

Data Availability Statement

Data have been included in the paper, and the authors can be further contacted if necessary.

Conflicts of Interest

The authors declare no conflicts of interest.

Nomenclature

u Velocity vector m·s−1
Δ m Mass change caused by the evaporation of droplets and liquid films into the continuous phase, kg·m−3·s−1
t Time, s
p Pressure, Pa
gGravitational acceleration vector, m·s−2
Δ u Continuous phase momentum change caused by a droplet, N·m−3
T Thermodynamic temperature, K
k eff   Effective heat transfer coefficient of the fluid, W·m−2·K−1
k 1 Heat transfer coefficient of the fluid, W·m−2·K−1
k t Heat transfer coefficient caused by turbulence, W·m−2·K−1
c p Specific heat capacity of the fluid at constant pressure, J·kg−1·k−1
Δ E Continuous phase energy change caused by the droplet, W·m−3
f Component about air and water vapor
w f Mass fraction of component f
J f Diffusion flux vector of component f , kg·m−3·s−1
S f Source term for the increase in components due to evaporation, kg·m−3·s−1
u 1 ,   x Horizontal velocity vector along the direction x, m·s−1
u 1 ,   z Horizontal velocity vector along the direction z, m·s−1
u n Vertical component velocity vector, m·s−1
L x Displacement in the direction of x, m
L z Displacement in the direction of z, m
n Decay exponent
u d Velocity vector of the droplet, m·s−1
ρ d Droplet density, kg·m−3
d d Particle diameter, m
ReRelative Reynolds number
u n , d Velocity vector in the direction of the vertical wall of the droplet, m·s−1
h 0 Liquid film thickness, m
δ bl Boundary layer thickness, m
T crit   * Critical temperature factor
T sat   Droplet saturation temperature, K
E Young’s modulus, Pa
Greek letters
ρ Continuous phase density, kg·m−3
μ Viscosity, Pa·s
μ t Turbulence viscosity, Pa·s
σ k Prandtl numbers corresponding to the turbulent kinetic energy k
σ ε Prandtl numbers corresponding to the dissipation rate ε
Δ ε Change in the turbulent energy dissipation rate
σ Surface tension, N·m−1
σ x Stress in the x direction, Pa
σ y Stress in the y direction, Pa
σ z Stress in the z direction, Pa
ε Stress strain
ν Poisson’s ratio
α Thermal expansion coefficient, K−1

References

  1. Tripathy, K.; Bhattacharjee, M. Stretching Mode Deformation Analysis for an Elastomeric Encapsulation-Assisted Stable Flexible Electronic Substrate. Flex. Print. Electron. 2023, 8, 025002. [Google Scholar] [CrossRef]
  2. Salahouelhadj, A.; Gonzalez, M.; Vanstreels, K.; Van der Plas, G.; Beyer, G.; Beyne, E. Analysis of Warpage of a Flip-Chip BGA Package under Thermal Loading: Finite Element Modelling and Experimental Validation. Microelectron. Eng. 2023, 271–272, 111947. [Google Scholar] [CrossRef]
  3. Sun, W.; Wang, L.; Zhu, N.; Xin, J.; Luo, Y.; Jiang, X.; Fan, G.; Chen, M. Characterization of Packaging Warpage, Residual Stress and Their Effects on the Mechanical Reliability of IGBT Power Modules. Eng. Fail. Anal. 2023, 152, 107517. [Google Scholar] [CrossRef]
  4. Zhong, K.; Wang, H.; Wang, J.; Xu, Y. Effect of Heating Power on Ball Grid Array Thermal Shock Reliability for a Fanout Package. J. Electron. Packag. 2024, 146, 011002. [Google Scholar] [CrossRef]
  5. Zhang, X.; Meng, H.; Wang, H.; Guo, F. Effect of Thermal Misfit Stress on Steam-Driven Delamination in Electronic Packages. Eng. Fract. Mech. 2018, 194, 61–72. [Google Scholar] [CrossRef]
  6. Li, M.; Tudor, J.; Torah, R.; Beeby, S. Stress Analysis and Optimization of a Flip Chip on Flex Electronic Packaging Method for Functional Electronic Textiles. IEEE Trans. Compon. Packaging Manuf. Technol. 2018, 8, 186–194. [Google Scholar] [CrossRef]
  7. Tsai, M.-Y.; Liu, C.-M.; Wang, Y.-W.; Liu, H.-Y. Effects of Metal Frame and Adhesive on Thermally-Induced Warpage and Stress of 2.5D Packages: Experimental and Numerical Studies. IEEE Trans. Device Mater. Reliab. 2018, 18, 450–455. [Google Scholar] [CrossRef]
  8. Zhang, H.; Dai, J.; Cao, Y.; Zhang, Y.; Bao, M.; Yin, Y. A First-Principles Study of the Mechanical and Physical Properties of Ni3Snx Intermetallic Compounds for High-Temperature Power Device Packaging. Intermetallics 2024, 164, 108112. [Google Scholar] [CrossRef]
  9. Kim, D.; Kim, M.-S. Macroscale and Microscale Structural Mechanisms Capable of Delaying the Fracture of Low-Temperature and Rapid Pressureless Ag Sintered Electronics Packaging. Mater. Charact. 2023, 198, 112758. [Google Scholar] [CrossRef]
  10. Xu, X.; Liu, Y.; Su, Y.; Sun, C.; Xue, Y.; Ju, L.; Zhang, S. Fatigue Behavior of 3D Stacked Packaging Structures under Extreme Thermal Cycling Condition. Mem. Mater. Devices Circuits Syst. 2023, 4, 100032. [Google Scholar] [CrossRef]
  11. Zhong, L.; Liu, W.; Sun, Y.; Wang, F.; Chen, S.; Sun, Q.; Liu, Y.; Yuan, C.; Li, X.; Fei, G. Electrically Assisted Stereolithography 3D Printing of Graded Permittivity Composites for In-Situ Encapsulation of Insulated Gate Bipolar Transistors (IGBTs). Mater. Des. 2023, 233, 112220. [Google Scholar] [CrossRef]
  12. Walsh, K.; Gorji, N.E. 3D CT Scan Metrology for Solder Void Formation Analysis in Ball Grid Array Electronic Chips. Results Phys. 2024, 56, 107233. [Google Scholar] [CrossRef]
  13. Ueda, N.; Watanabe, H. Characterization of Packaging-induced Stress Distributions for Small-scale Silicon Chips. IEEJ Trans. Electr. Electron. Eng. 2020, 15, 1236–1241. [Google Scholar] [CrossRef]
  14. Gan, C.L.; Chung, M.-H.; Lin, L.-F.; Huang, C.-Y.; Takiar, H. Evolution of Epoxy Molding Compounds and Future Carbon Materials for Thermal and Mechanical Stress Management in Memory Device Packaging: A Critical Review. J. Mater. Sci. Mater. Electron. 2023, 34, 2011. [Google Scholar] [CrossRef]
  15. Lin, M.-Y.; Zeng, Y.-J.; Hwang, S.-J.; Wang, M.-H.; Liu, H.-P.; Fang, C.-L. Warpage and Residual Stress Analyses of Post-Mold Cure Process of IC Packages. Int. J. Adv. Manuf. Technol. 2023, 124, 1017–1039. [Google Scholar] [CrossRef]
  16. Jin, Z.; Tian, J.; Tang, X.; Li, J. Simulation and Reliability Testing of Leadless Package High-Temperature Pressure Sensor. Microelectron. J. 2022, 129, 105568. [Google Scholar] [CrossRef]
  17. Han, L.; Liang, L.; Zhao, Z.; Chen, Z.; Kang, Y. Optimized Design of Chips Layout in Press-Pack IGBT Module. In Proceedings of the 2019 21st European Conference on Power Electronics and Applications (EPE ’19 ECCE Europe), Genova, Italy, 3–5 September 2019. [Google Scholar]
  18. Chen, Y.; Li, B.; Wang, X.; Yan, Y.; Wang, Y.; Qi, F. Investigation of Heat Transfer and Thermal Stresses of Novel Thermal Management System Integrated with Vapour Chamber for IGBT Power Module. Therm. Sci. Eng. Prog. 2019, 10, 73–81. [Google Scholar] [CrossRef]
  19. Wang, J.-X.; Li, Y.-Z.; Zhong, M.-L.; Zhang, H.-S. Investigation on a Gas-Atomized Spray Cooling upon Flat and Micro-Structured Surfaces. Int. J. Therm. Sci. 2021, 161, 106751. [Google Scholar] [CrossRef]
  20. Liu, N.; Yu, Z.; Liang, Y.; Zhang, H. Effects of Mixed Surfactants on Heat Transfer Performance of Pulsed Spray Cooling. Int. J. Heat Mass Transf. 2019, 144, 118593. [Google Scholar] [CrossRef]
  21. Wang, C.; Xu, R.; Jiang, P. Numerical Study on Spray Cooling of Aircraft Equipment Cabin. Appl. Therm. Eng. 2024, 239, 122086. [Google Scholar] [CrossRef]
  22. Zhao, Y.; Gong, S.; Yang, Q.; Xuan, Z.; Li, W.; Xie, L.; Liu, L.; Ge, M. Experimental Investigation of Heat Transfer Performance in Gas-Atomized Spray Cooling. Int. J. Heat Mass Transf. 2024, 218, 124768. [Google Scholar] [CrossRef]
  23. Zhang, R.; Li, Z.; Zhang, Y.; Chen, D.; Yuan, G.; Duan, F. Numerical Simulation of Multi-Array Spray Cooling for Hot Rolled Seamless Steel Pipes. Int. J. Heat Mass Transf. 2024, 221, 125017. [Google Scholar] [CrossRef]
  24. Kumar, B.; Kumar, R.; Gupta, A. Spray Cooling of Vertical Inline Horizontal Tubes. Nucl. Eng. Des. 2023, 407, 112310. [Google Scholar] [CrossRef]
  25. Bhatt, N.H.; Lily; Raj, R.; Varshney, P.; Pati, A.R.; Chouhan, D.; Kumar, A.; Munshi, B.; Mohapatra, S.S. Enhancement of Heat Transfer Rate of High Mass Flux Spray Cooling by Ethanol-Water and Ethanol-Tween20-Water Solution at Very High Initial Surface Temperature. Int. J. Heat Mass Transf. 2017, 110, 330–347. [Google Scholar] [CrossRef]
  26. Cebo-Rudnicka, A.; Malinowski, Z. Identification of Heat Flux and Heat Transfer Coefficient during Water Spray Cooling of Horizontal Copper Plate. Int. J. Therm. Sci. 2019, 145, 106038. [Google Scholar] [CrossRef]
  27. Xia, Y.; Gao, X.; Li, R. Management of Surface Cooling Non-Uniformity in Spray Cooling. Appl. Therm. Eng. 2020, 180, 115819. [Google Scholar] [CrossRef]
  28. Yang, T.; Zhang, W.; Wang, J.; Liu, C.; Yuan, M. Numerical Investigation on Heat Transfer Enhancement and Surface Temperature Non-Uniformity Improvement of Spray Cooling. Int. J. Therm. Sci. 2022, 173, 107374. [Google Scholar] [CrossRef]
  29. Zhao, X.; Yin, Z.; Zhang, B.; Yang, Z. Experimental Investigation of Surface Temperature Non-Uniformity in Spray Cooling. Int. J. Heat Mass Transf. 2020, 146, 118819. [Google Scholar] [CrossRef]
  30. Xue, R.; Lin, X.; Ruan, Y.; Chen, L.; Hou, Y. Cooling Performance of Multi-Nozzle Spray with Liquid Nitrogen. Cryogenics 2022, 121, 103389. [Google Scholar] [CrossRef]
  31. Wu, T.; Wang, C.; Hu, Y.; Fan, X.; Fan, C. Research on Spray Cooling Performance Based on Battery Thermal Management. Int. J. Energy Res. 2022, 46, 8977–8988. [Google Scholar] [CrossRef]
  32. Shih, T.-H.; Liou, W.W.; Shabbir, A.; Yang, Z.; Zhu, J. A New K-ϵ Eddy Viscosity Model for High Reynolds Number Turbulent Flows. Comput. Fluids 1995, 24, 227–238. [Google Scholar] [CrossRef]
  33. Liu, H.; Chen, H.; Cai, C.; Jia, M.; Yin, H. Numerical Investigation on the Unsteady Spray Cooling of High Temperature Steel Plate. Int. J. Heat Mass Transf. 2019, 143, 118342. [Google Scholar] [CrossRef]
  34. Liu, H.; Cai, C.; Yin, H.; Luo, J.; Jia, M.; Gao, J. Experimental Investigation on Heat Transfer of Spray Cooling with the Mixture of Ethanol and Water. Int. J. Therm. Sci. 2018, 133, 62–68. [Google Scholar] [CrossRef]
  35. Wang, Y.Q.; Liu, M.H.; Liu, D.; Xu, K. Experiment Study on Non-Boiling Heat Transfer Performance Spray Cooling for High-Power Laser. Chin. J. Lasers 2009, 36, 1973–1978. [Google Scholar] [CrossRef]
  36. Wan, H.; Liu, P.J.; He, G.Q.; Xue, Z.R.; Qin, F.; Li, W.Q. Experimental and Numerical Studies on the Spray Cooling of Deionized Water in Non-Boiling Regime. Case Stud. Therm. Eng. 2023, 44, 102834. [Google Scholar] [CrossRef]
  37. Liu, L.; Wang, X.; Ge, M.; Zhao, Y. Experimental Study on Heat Transfer and Power Consumption of Low-Pressure Spray Cooling. Appl. Therm. Eng. 2021, 184, 116253. [Google Scholar] [CrossRef]
Figure 1. After the droplet hits the wall.
Energies 17 01070 g001
Figure 2. Spray-cooling diagram of the encapsulated structure. (a) Sectional view of the encapsulated structure; (b) Internal schematic of the encapsulated structure; (c) The general diagram; (d) Schematic diagram of spray cooling.
Energies 17 01070 g002
Figure 3. Simulation flow chart.
Energies 17 01070 g003
Figure 4. Grid-independence and model validation. (a) Grid independence verification of spray cooling; (b) Verification of spray cooling model.
Energies 17 01070 g004
Figure 5. Stress model verification.
Energies 17 01070 g005
Figure 6. Temperature profile at different nozzle heights. (a) Temperature distribution on the centerline; (b) Cloud map of temperature distribution on the surface.
Energies 17 01070 g006
Figure 7. Stress distribution at different nozzle heights. (a) Stress distribution on the centerline; (b) Cloud map of stress distribution on the surface.
Energies 17 01070 g007
Figure 8. Deformation distribution at different nozzle heights. (a) Deformation distribution on the centerline; (b) Cloud map of deformation distribution on the surface.
Energies 17 01070 g008
Figure 9. Temperature distribution at different flow rates. (a) Temperature distribution on the centerline; (b) Cloud map of temperature distribution on the surface.
Energies 17 01070 g009
Figure 10. Stress distribution at different flow rates. (a) Stress distribution on the centerline; (b) Cloud map of stress distribution on the surface.
Energies 17 01070 g010
Figure 11. Deformation distribution at different flow rates. (a) Deformation distribution on the centerline; (b) Cloud map of deformation distribution on the surface.
Energies 17 01070 g011
Figure 12. Temperature distribution at different nozzle inclination angles. (a) Temperature distribution on the centerline; (b) Cloud map of temperature distribution on the surface.
Energies 17 01070 g012
Figure 13. Stress distribution at different nozzle inclination angles. (a) Stress distribution on the centerline; (b) Cloud map of stress distribution on the surface.
Energies 17 01070 g013
Figure 14. Deformation distribution under different nozzle inclination angles. (a) Deformation distribution on the centerline; (b) Cloud map of deformation distribution on the surface.
Energies 17 01070 g014
Table 1. Table of physical parameters of materials.
Thermal   Conductivity / λ (W/m·K)Young’s Modulus/E (MPa) Thermal   Expansion   Coefficient / α (K−1) Poisson s   Ratio / μ
Encapsulated plate4011.26 × 1051.674 × 10−50.345
Heat source203107.2 × 10−60.2
Sealant0.46082.93 × 1064.5 × 10−50.03
Table 2. Spraying parameters.
Case 1Case 2Case 3Case 4Case 5Case 6Case 7
Heat flux (W/cm2)150150150150150150150
Working fluidWaterWaterWaterWaterWaterWaterWater
Nozzle height (mm)15151510201515
Flow rate (L/h)24.48020.98816.84820.98820.98820.98820.988
Velocity (m/s)37.4633.1528.6233.1533.1533.1533.15
Nozzle angle (°)61.3260.0658.4360.0660.0660.0660.06
Average droplet diameter
(μm)
38.8840.9443.8340.9440.9440.9440.94
Temperature (°C)15151515151515
Nozzle inclination (°)000001015
Disclaimer/Publisher’s Note: The statements, opinions and data contained in all publications are solely those of the individual author(s) and contributor(s) and not of MDPI and/or the editor(s). MDPI and/or the editor(s) disclaim responsibility for any injury to people or property resulting from any ideas, methods, instructions or products referred to in the content.