Article

Experimental Investigations on the Thermal Characteristics of Domestic Convectors

School of Engineering, Robert Gordon University, Aberdeen AB10 7GJ, UK
*
Author to whom correspondence should be addressed.
Energies 2024, 17(5), 1017; https://doi.org/10.3390/en17051017
Submission received: 22 December 2023 / Revised: 7 February 2024 / Accepted: 19 February 2024 / Published: 21 February 2024
(This article belongs to the Section J: Thermal Management)

Abstract

:
Better understanding of local thermal characteristics of domestic convectors could play a crucial role in reducing energy consumption for space heating and decarbonizing the economy. The current study evaluates the impact of varying water inlet temperature and flowrate on the local surface temperature of domestic convectors through extensive empirical investigations. Experiments are performed using a custom-made test-rig featuring a 400 mm × 600 mm Type 11 convector within a large and well-ventilated environment, minimizing the thermal influence of the surrounding space on the thermal behavior of the convector. Infrared thermography (IR) is used to acquire local surface temperature data for further analysis. Based on the results obtained, it has been observed that the inlet water temperature has a negligible effect on thermal characteristics of the convector while increasing the flowrate substantially decreases the time required for the convector to reach maximum surface temperature. Based on the numerical data, an analytical model for average surface temperature has been developed using multiple variable regression analysis, demonstrating a prediction accuracy of >90% compared with the experimental data. A detailed understanding of the heating behavior exhibited by domestic convectors has led to a better understanding of the local thermal characteristics, while the prediction model can be used to develop machine learning algorithms to install better flow control techniques for efficient space heating.

1. Introduction

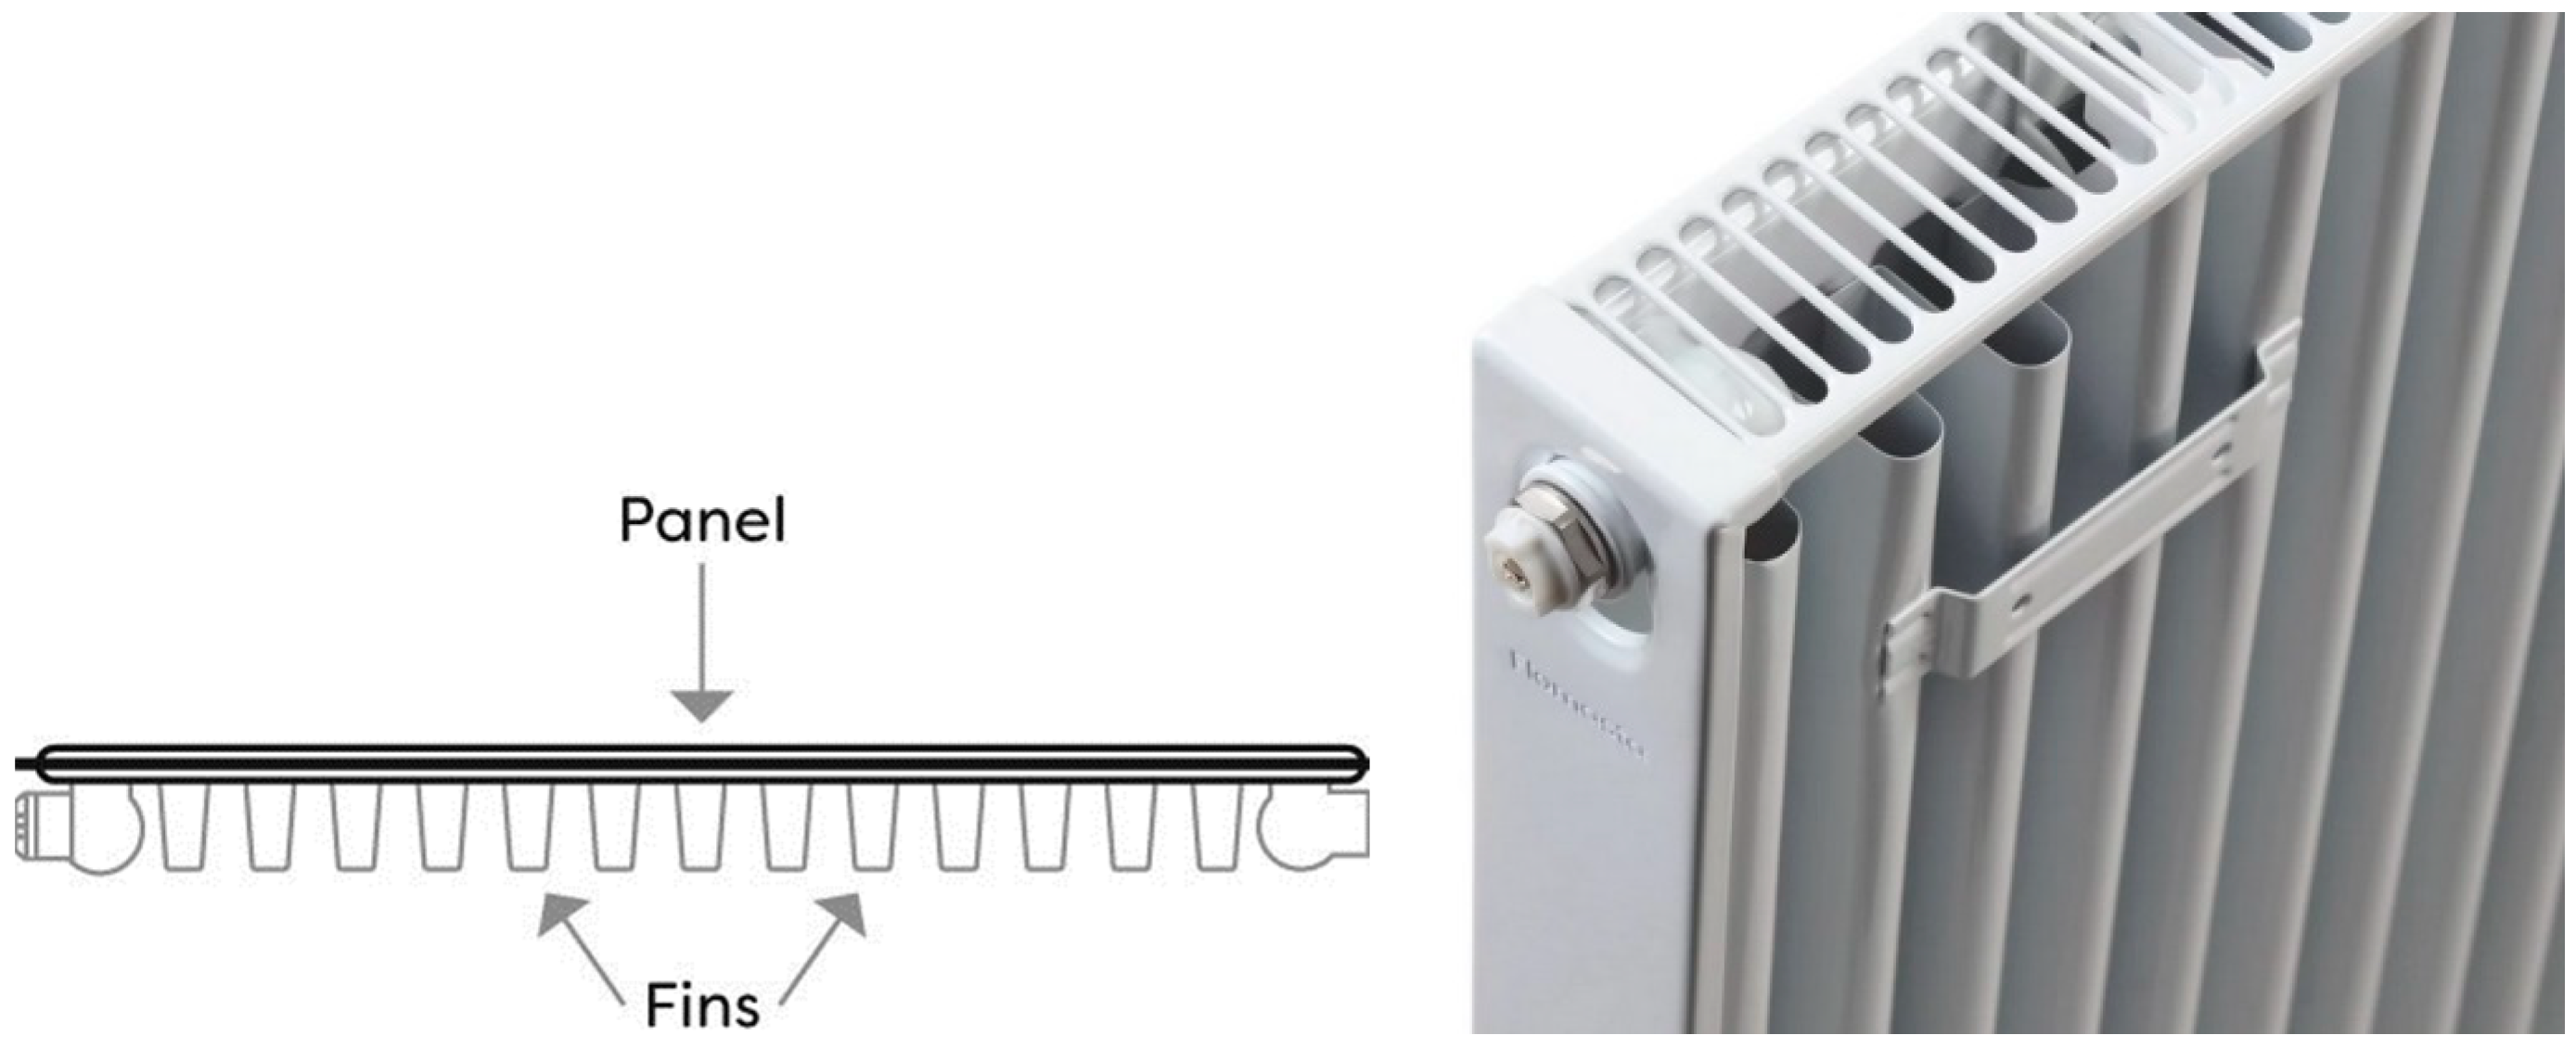
Convectors are heat exchangers used around the globe for space heating. Domestic convectors are categorized as type 11, type 21, and type 22 convectors. The first number in the sequence represents the number of panels and the second denotes the sets of fins; type 11 has 1 panel and 1 set of fins [1,2,3], as shown in Figure 1. With the ever-increasing cost of space heating, interest in understanding the local thermal characteristics of domestic convectors has risen with the aim to optimize their thermal performance through various means, such as temperature control, flow control, and alternative fuels, etc. For example, the use of geothermal water for space heating could potentially replace conventional boilers. However, commercially viable technologies extract water at about 55 °C [4,5], while the temperature of water in conventional boilers is in the range of 80 °C. Thus, the question arises of how domestic convectors would behave under significantly different inlet water temperatures and flow rates, and whether purposefully reducing water inlet temperature from the boiler can be a viable option. The current study aims to understand this aspect of domestic convectors’ thermal behavior.
Many efforts have been made to improve the thermal performance of domestic convectors. Calisir et al. [6] and Embaye et al. [7] investigated the effects on energy consumption of pulsed flow input for type 10 and type 11 domestic convectors. They argue that constant flow operating conditions are not the most energy-efficient method for achieving optimal heating performance, rather they present evidence for enhanced performance resulting from pulsed flow condition. Computational Fluid Dynamics (CFD) has been used to analyze the local flow characteristics within the convectors. Marchesi et al. [8] conducted an experimental study into the thermal performance of different convector types and installation configurations. They investigated the heating characteristics of both traditional cast iron and modern finned aluminum convectors under a variety of hydraulic connection locations, flowrates, and wall mounting locations. The results obtained clearly show that finned aluminum convectors are thermally more efficient than cast iron convectors. Dzierzgowski [9] highlighted the shortcomings of EN-442 [1], identifying an underprediction of up to 22.3% in thermal output from a traditional cast iron convector design using low flowrates. Three different convector styles were tested (cast iron elements, plate convectors, and finned convectors), with a wide range of flowrates and inlet temperatures. The results are compared to the predicted output calculated using EN-442, before a new extended heat transfer model for the convectors is developed and the results compared. Gritzki et al. [10] conducted a study on the relevance of the standard EN-442 as the commonly accepted guidance on convector performance, stating that the ability of the standard for predicting thermal output of type-22 convectors deteriorated considerably when considering lower flowrates.
Aydar and Ekmeci [11] used CFD analyses to estimate the thermal efficiency of type 22 convectors. They altered the inlet-outlet configurations and studied the variations in heating behavior that could be achieved by changing the flow direction. Beck et al. [12] investigated the possibility of improving the thermal output of domestic convectors by including high emissivity sheets between the opposing panels of a non-finned double panel convector. They compared the heat output from a conventional finned double panel convector with the novel concept. They argued that fins add additional manufacturing cost and complexity, along with being susceptible to fouling by dust, greatly reducing the thermal output. Calisir et al. [13] studied the influence of geometrical dimensions on convector thermal output. They considered the effect of height, wall thickness, trapezoidal height, distance between opposing convectors, convector tip width, vertical location of convector, and cut-off ratio. The results indicated that the heat output could be increased by adding material thickness and overall panel height, but the added materials may be detrimental for financial reasons. The purpose of their study was to inform and provide guidance on the changes required to increase heat transfer for current domestic convectors. Myhren and Holmberg [14] analyzed the role of internal fins on the convective capabilities of ventilation convectors. They carried out a number of numerical investigations focused on the maximum convective heat transfer available from a ventilator convector. Ploskic and Holmberg [15] developed an analytical model for the heat output of radiant skirting heaters to justify and improve the use of such devices.
It is clear from the review of the published literature that although many numerical and experimental studies have been carried out on domestic convectors, there is a lack of a systematic set of investigations that clearly demonstrates the effects of varying inlet water temperature and flowrate on the local thermal characteristics of domestic convectors. This study aims to bridge this gap through an extensive experimental scheme to not only better understand the local thermal behavior of domestic convectors, but to also develop a novel prediction model for the average surface temperature of the convectors that can be easily integrated into a machine learning algorithm to better control process parameters for enhanced thermal efficiency of the convectors and reduced energy consumption.

2. Methodology

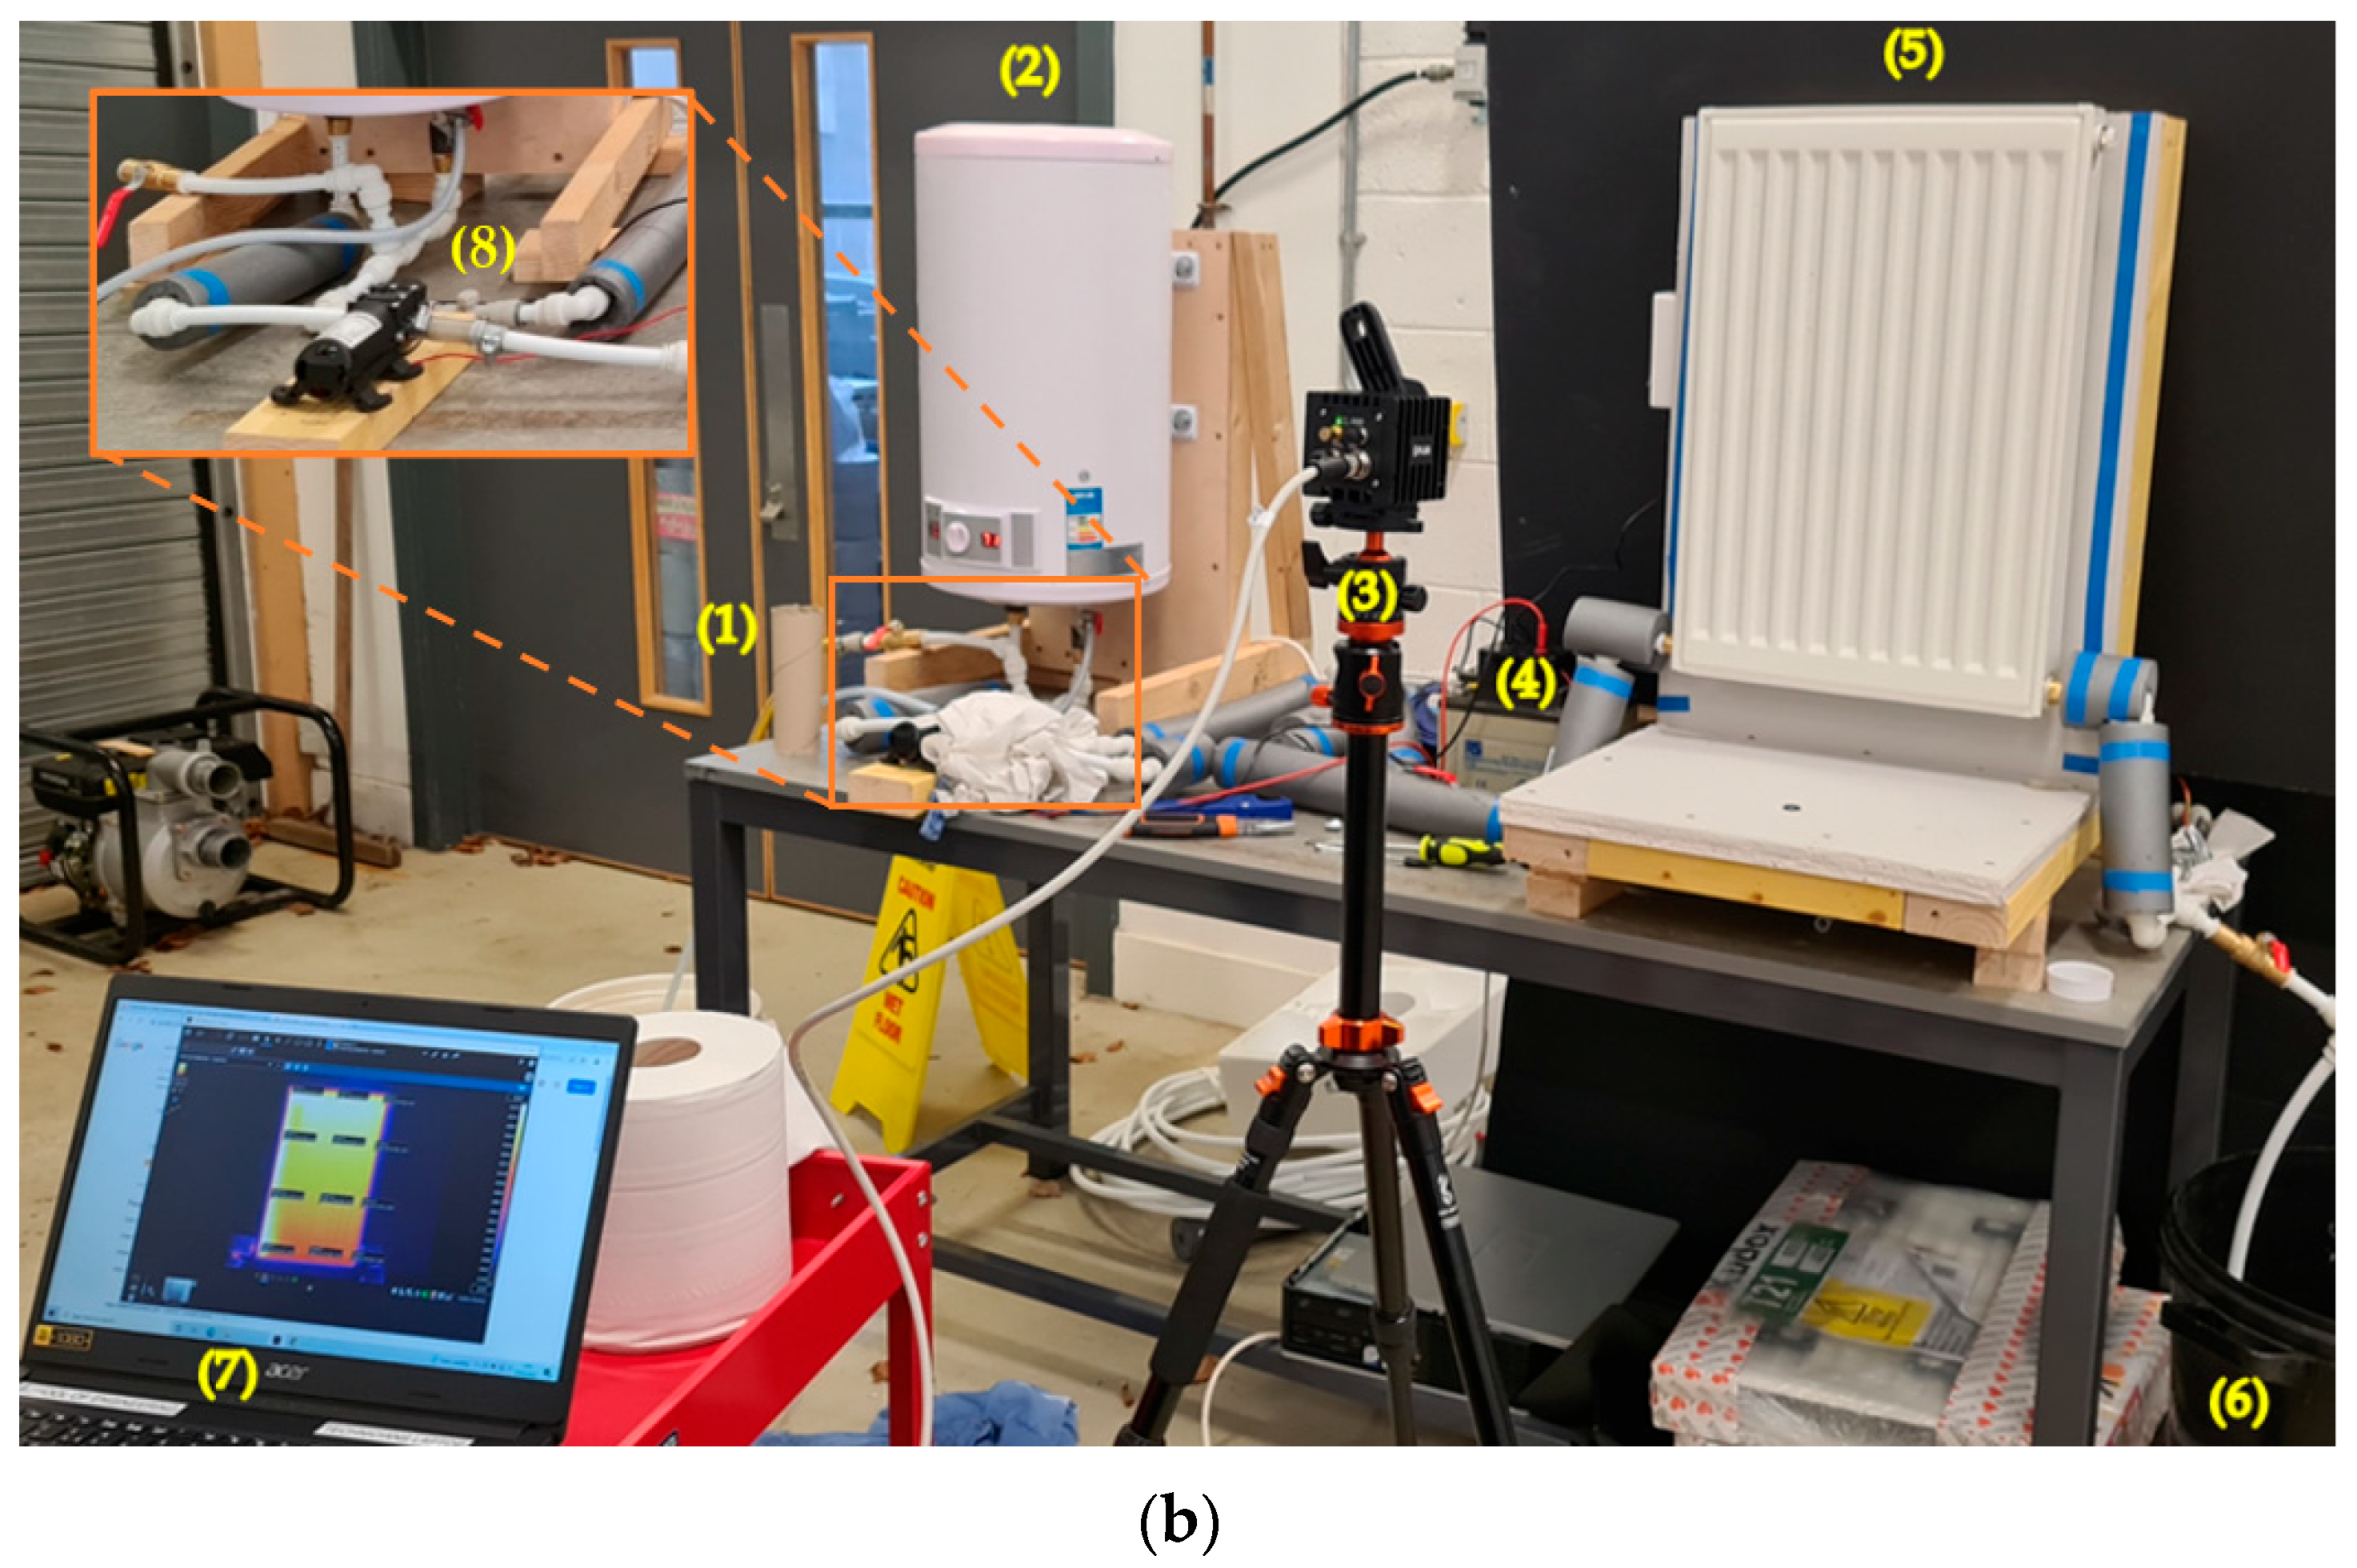
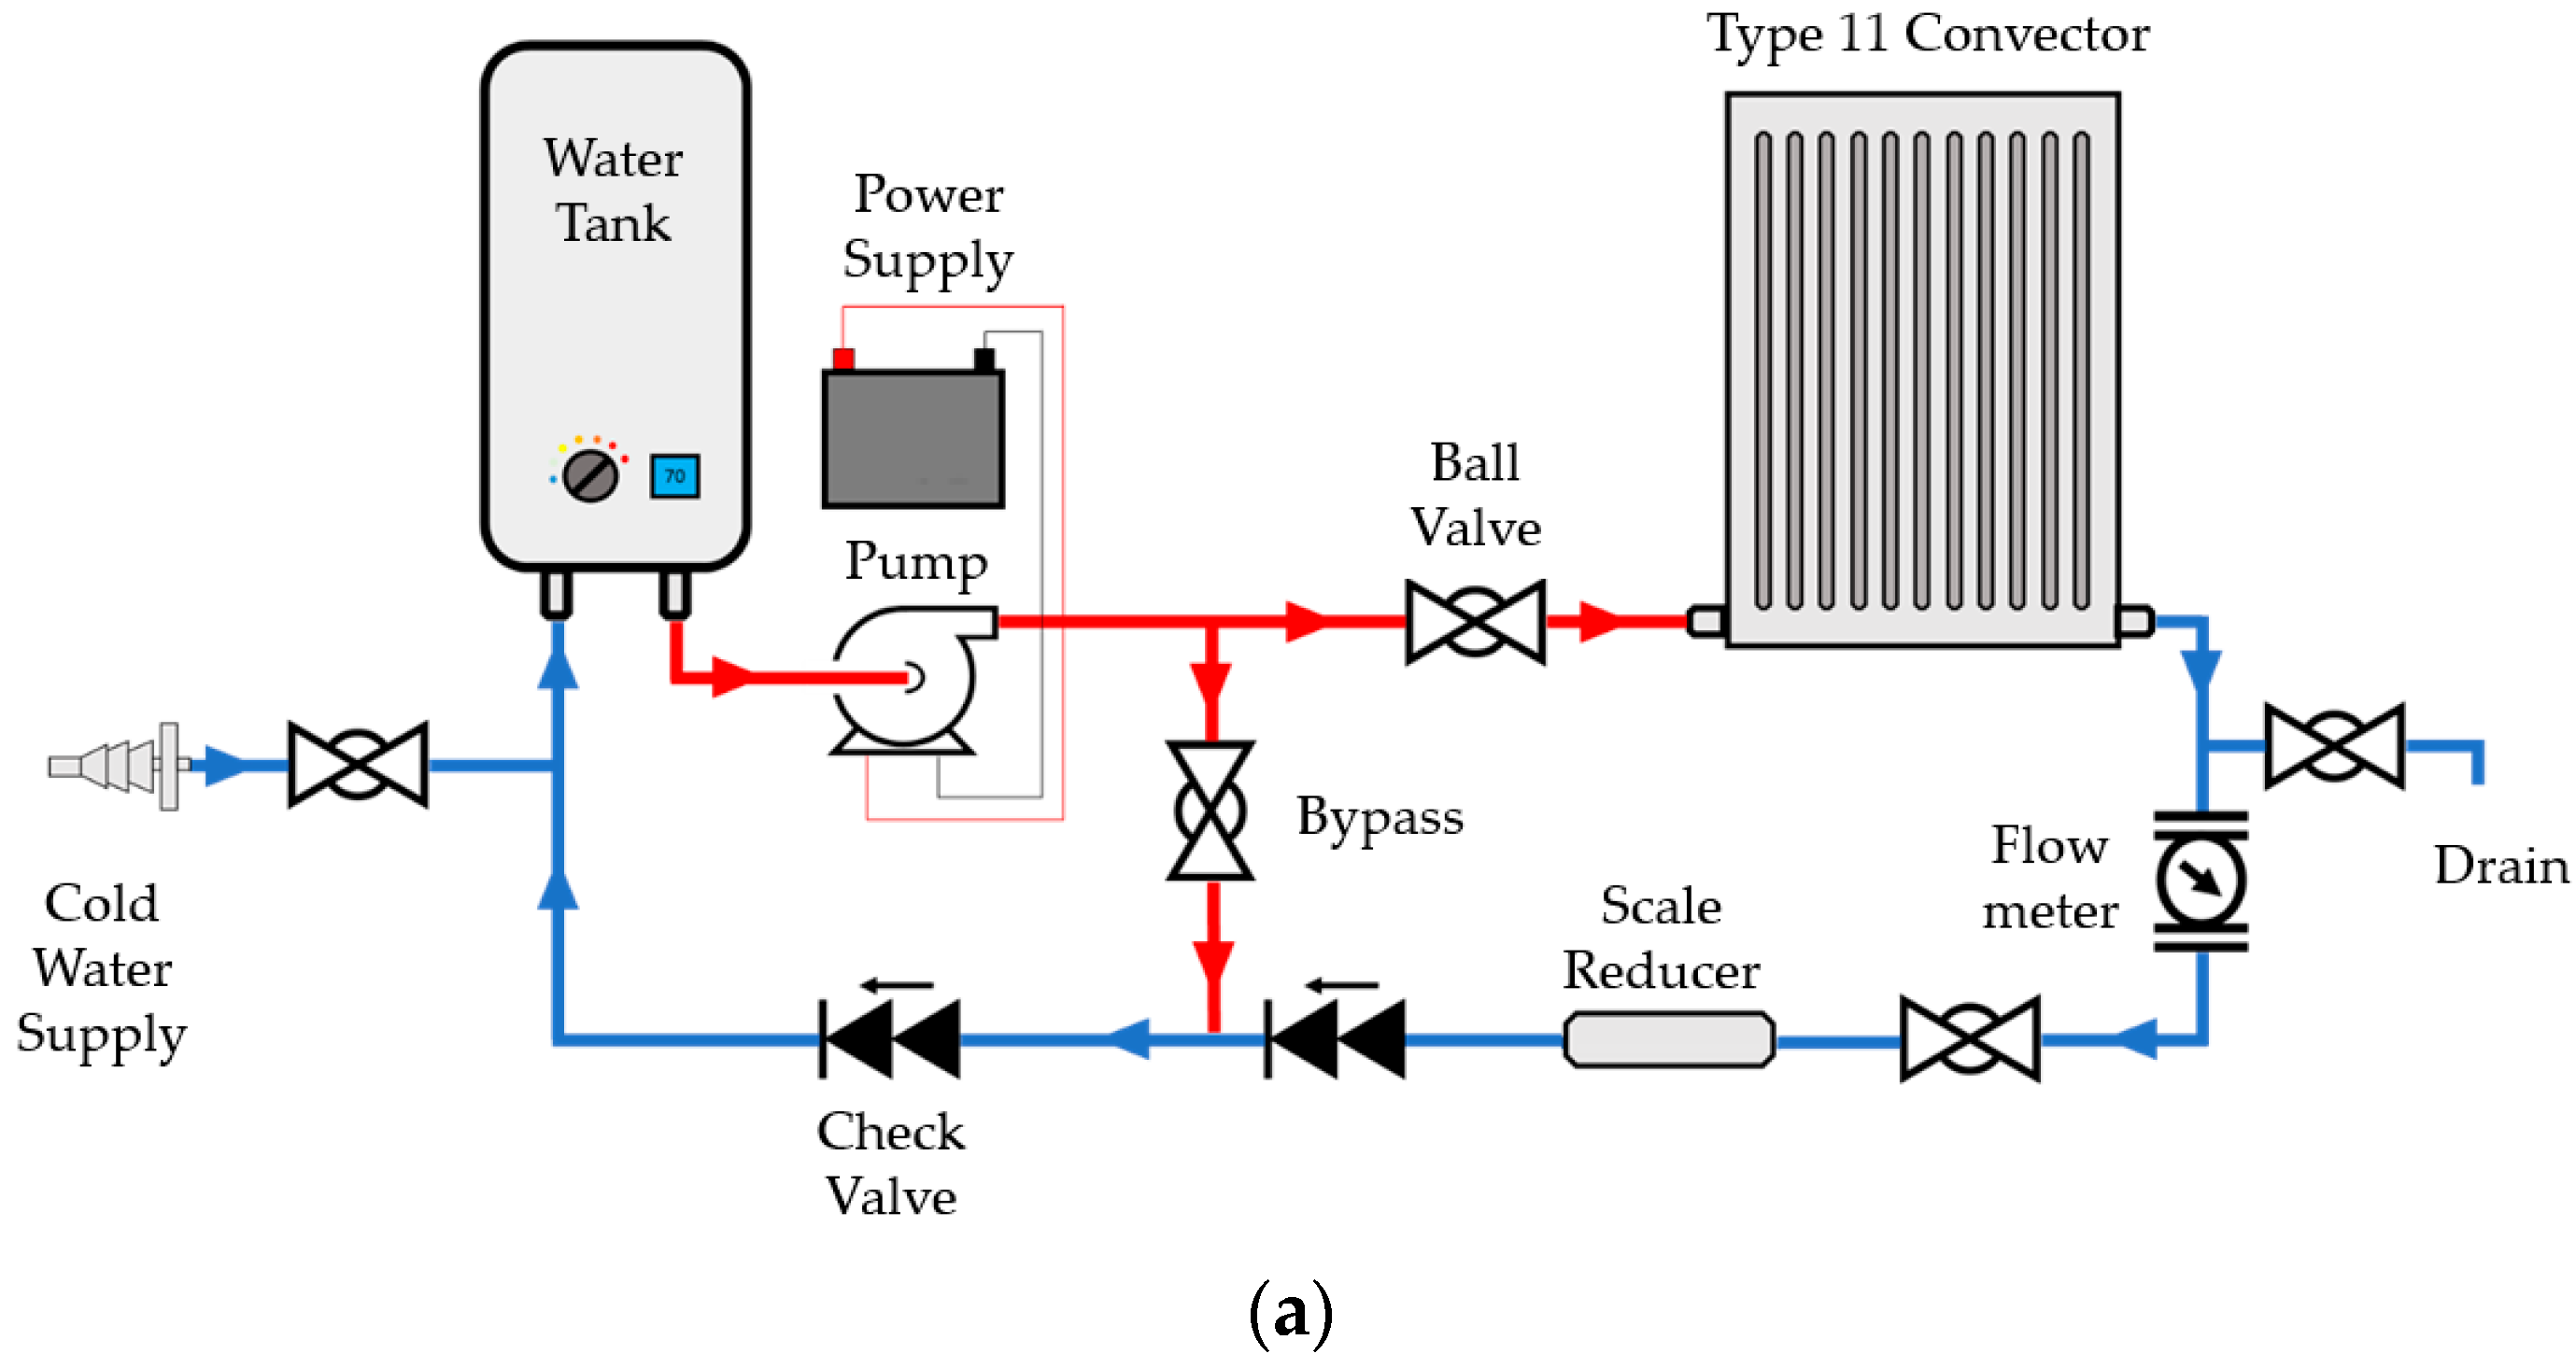
A bespoke test rig has been developed to fulfil the objectives of this study. The schematic of the test rig is shown in Figure 2a. The test rig comprises of a 50 L water storage tank integrated with an immersion heater which is powered by a battery, a thermostat to regulate water temperature from the tank, a pump and a flowmeter to regulate water flowrate from the tank, and a 400 × 600 mm type 11 aluminum domestic convector. A bypass flowline has been added to the system to divert excess water flowrate back into the tank. The test rig developed based on the schematic is shown in Figure 2b. The test rig has been developed in accordance with BS EN 442-1:2014 Part 1: technical specifications and requirements 2014 [1]. A FLIR A50 smart sensor camera has been used for infrared thermography (IR) [16], i.e., to capture thermal images of the front surface of the convector. The thermal camera has a least count of 0.01 °C for temperature and 0.03 s for time (frame rate). The thermal camera is connected to a laptop with image processing software installed to carry out thermal analysis of the images captured. The platform on which the convector is installed is made out of wood with a reflective aluminum sheet at the back. The pump delivers hot water from the tank to the convector. Using the two ball valves integrated into the hot side of the loop, the flow through the convector can be regulated to achieve the desired mass flowrate. The fluid passing through the convector then flows through the inline flow meter and scale reducers, before joining the bypass loop, downstream from the first non-return valve, eliminating back-pressure in the convector. The mixed flow from the convector and bypass loop then passes through a second non-return valve which isolates the rest of the system from back-flow during the system filling procedure. The system is filled and topped-up with fresh water using the fill point on the far left of the schematic, controlled by another ball valve. Finally, a ball valve operated drain point is included downstream of the convector to allow for easy emptying and modification of the rig, should it be required.
The components are arranged in a way to ensure that the difference in elevation between the top of the tank and the top of the convector was minimized, reducing the hydraulic head required from the pump to achieve the desired flowrate through the loop. As the test rig is designed as a closed loop system, the cold water inlet is repurposed to become the return flow inlet for water coming from the convector. A dedicated fill point for the system is installed using a T-piece, directly upstream of the tank inlet, with a non-return valve, to ensure that the cold water enters the tank directly and does not circulate through the system. Pipe lagging is added to the exposed PEX pipes to insulate them from the cool ambient conditions and minimize any temperature drop observed between the tank thermostat and the inlet temperature to the convector. The thermal camera is positioned on a tripod to ensure that it is directly aligned with the center of the convector front surface to minimize distortion and variance in the results. The tripod is placed 1.3 m from the convector front surface and the focus of the camera is adjusted appropriately. A large corrugated black plastic board has been placed behind the convector platform. This is because it was observed that the camera was also detecting heat emitted from the overhead lights at the far end of the room. The black corrugated board therefore acts as an insulator and provides a thermally neutral backdrop [17].

Scope of Work

In total, 6 experiments are conducted as summarized in Table 1. The baseline experiment is the first one in the table, i.e., water temperature of 70 °C and flowrate of 0.5 lpm to the convector. These are the conventional process parameters set in domestic settings. In order to analyze the effects of inlet water temperature, temperature setting (Tset) of 60 °C and 50 °C have been considered. Water temperature lower than 50 °C is not feasible for space heating. In order to analyze the effects of the flowrate of water, flowrates ( m ˙ ) of 1, 1.7 and 2.4 lpm have been considered. A flowrate of more than 2.5 lpm is not considered feasible for domestic purposes.
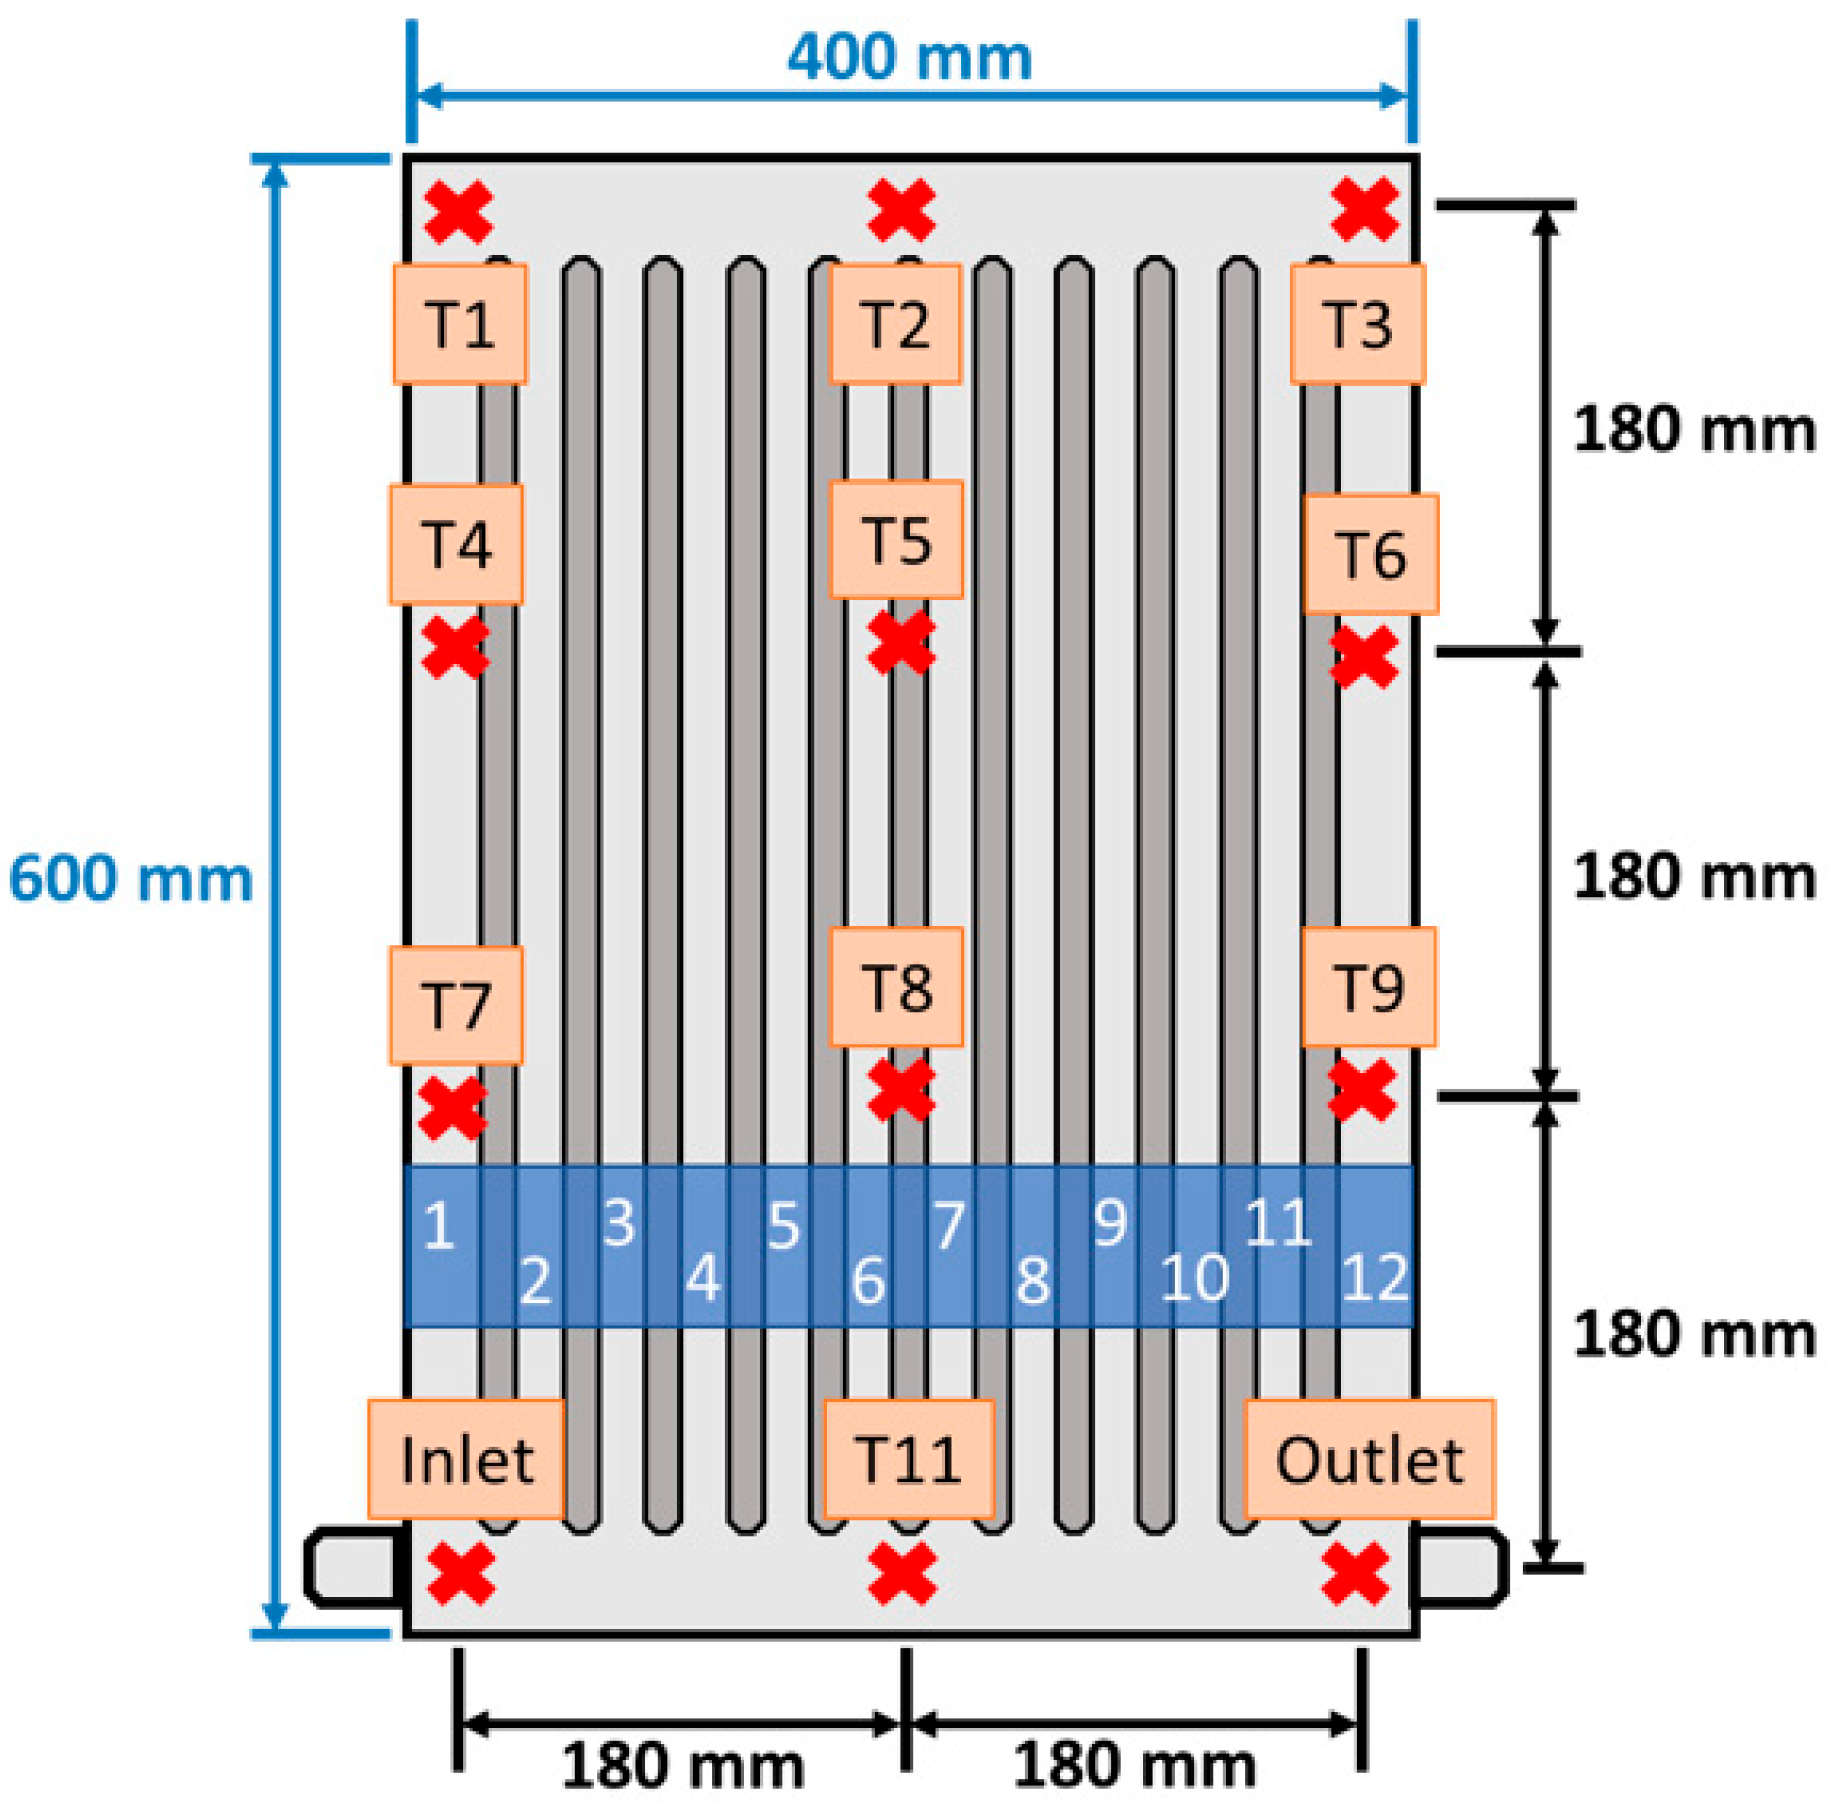
In order to ensure that the results are comparative from the different experiments performed, local temperature values at 12 different locations on the front surface of the convector have been recorded. These data points are shown in Figure 3 and have been chosen such that the distance between the points is equal in both the vertical and horizontal directions. As the convector’s dimensions are 400 × 600 mm, this results in an arrangement of 4 data points in the vertical direction and 3 data points in the horizontal direction, with 180 mm distance between neighboring points.

3. Results and Discussion

3.1. Thermal Characteristics of a Domestic Convector

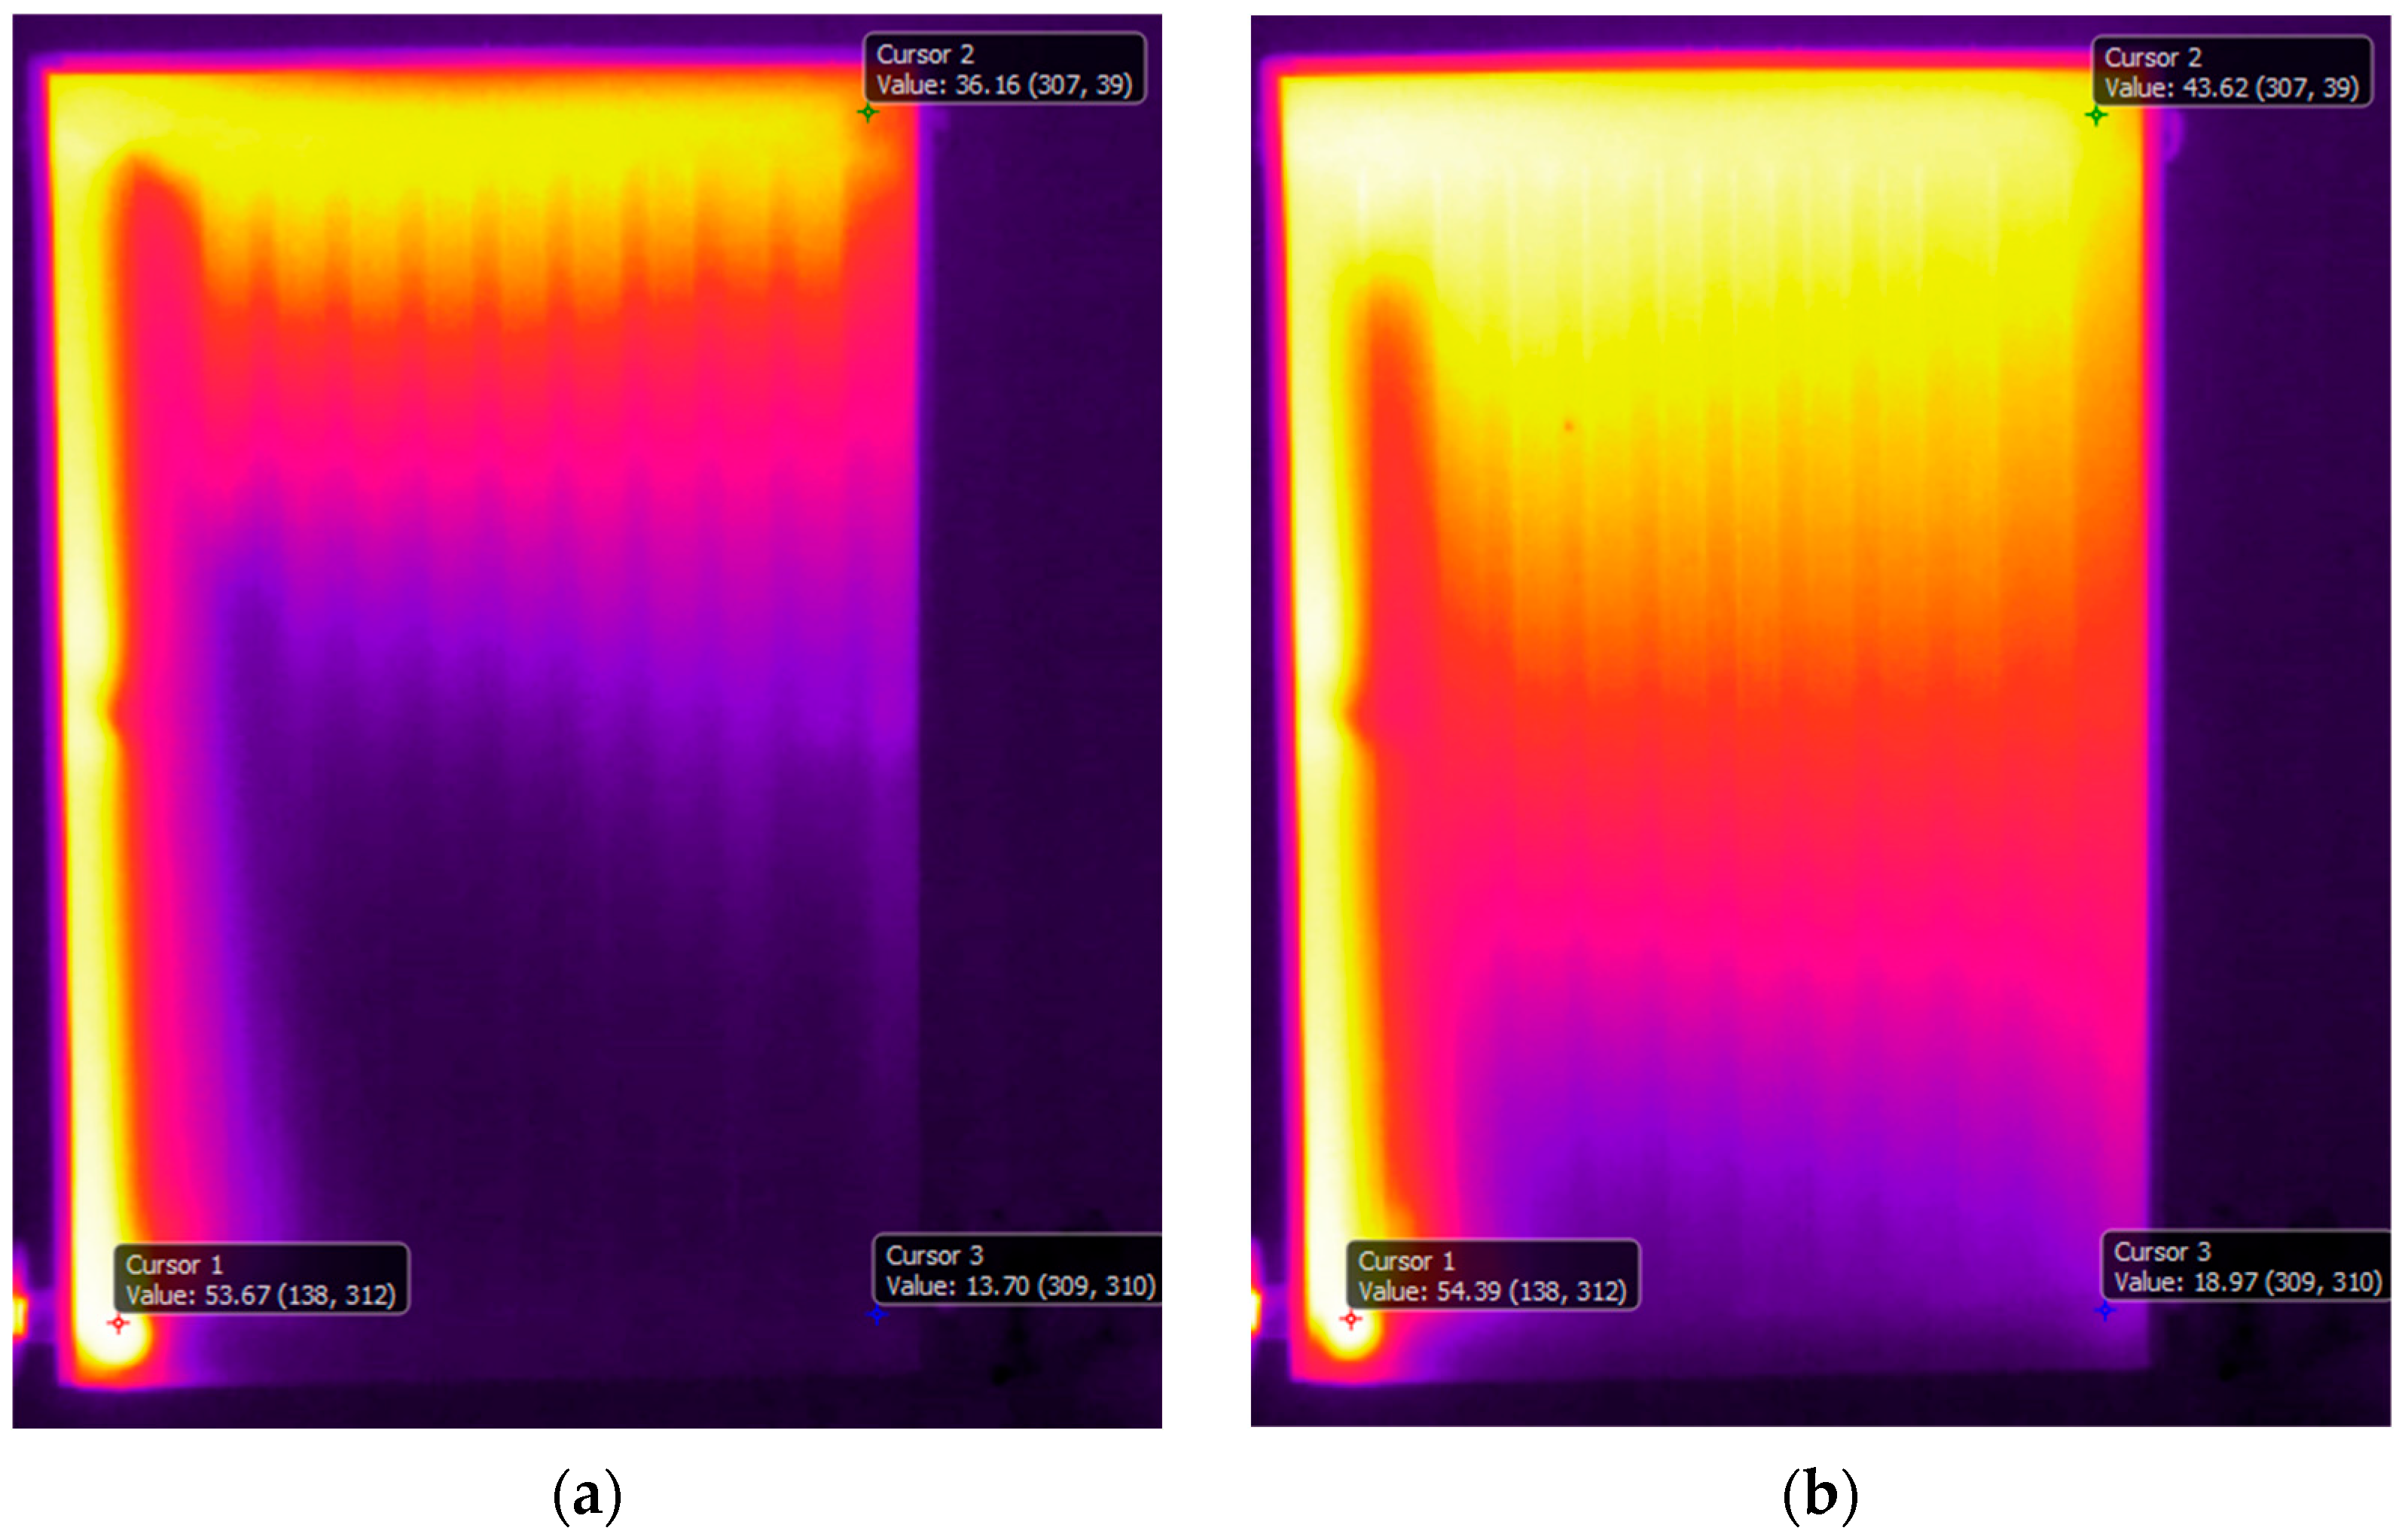
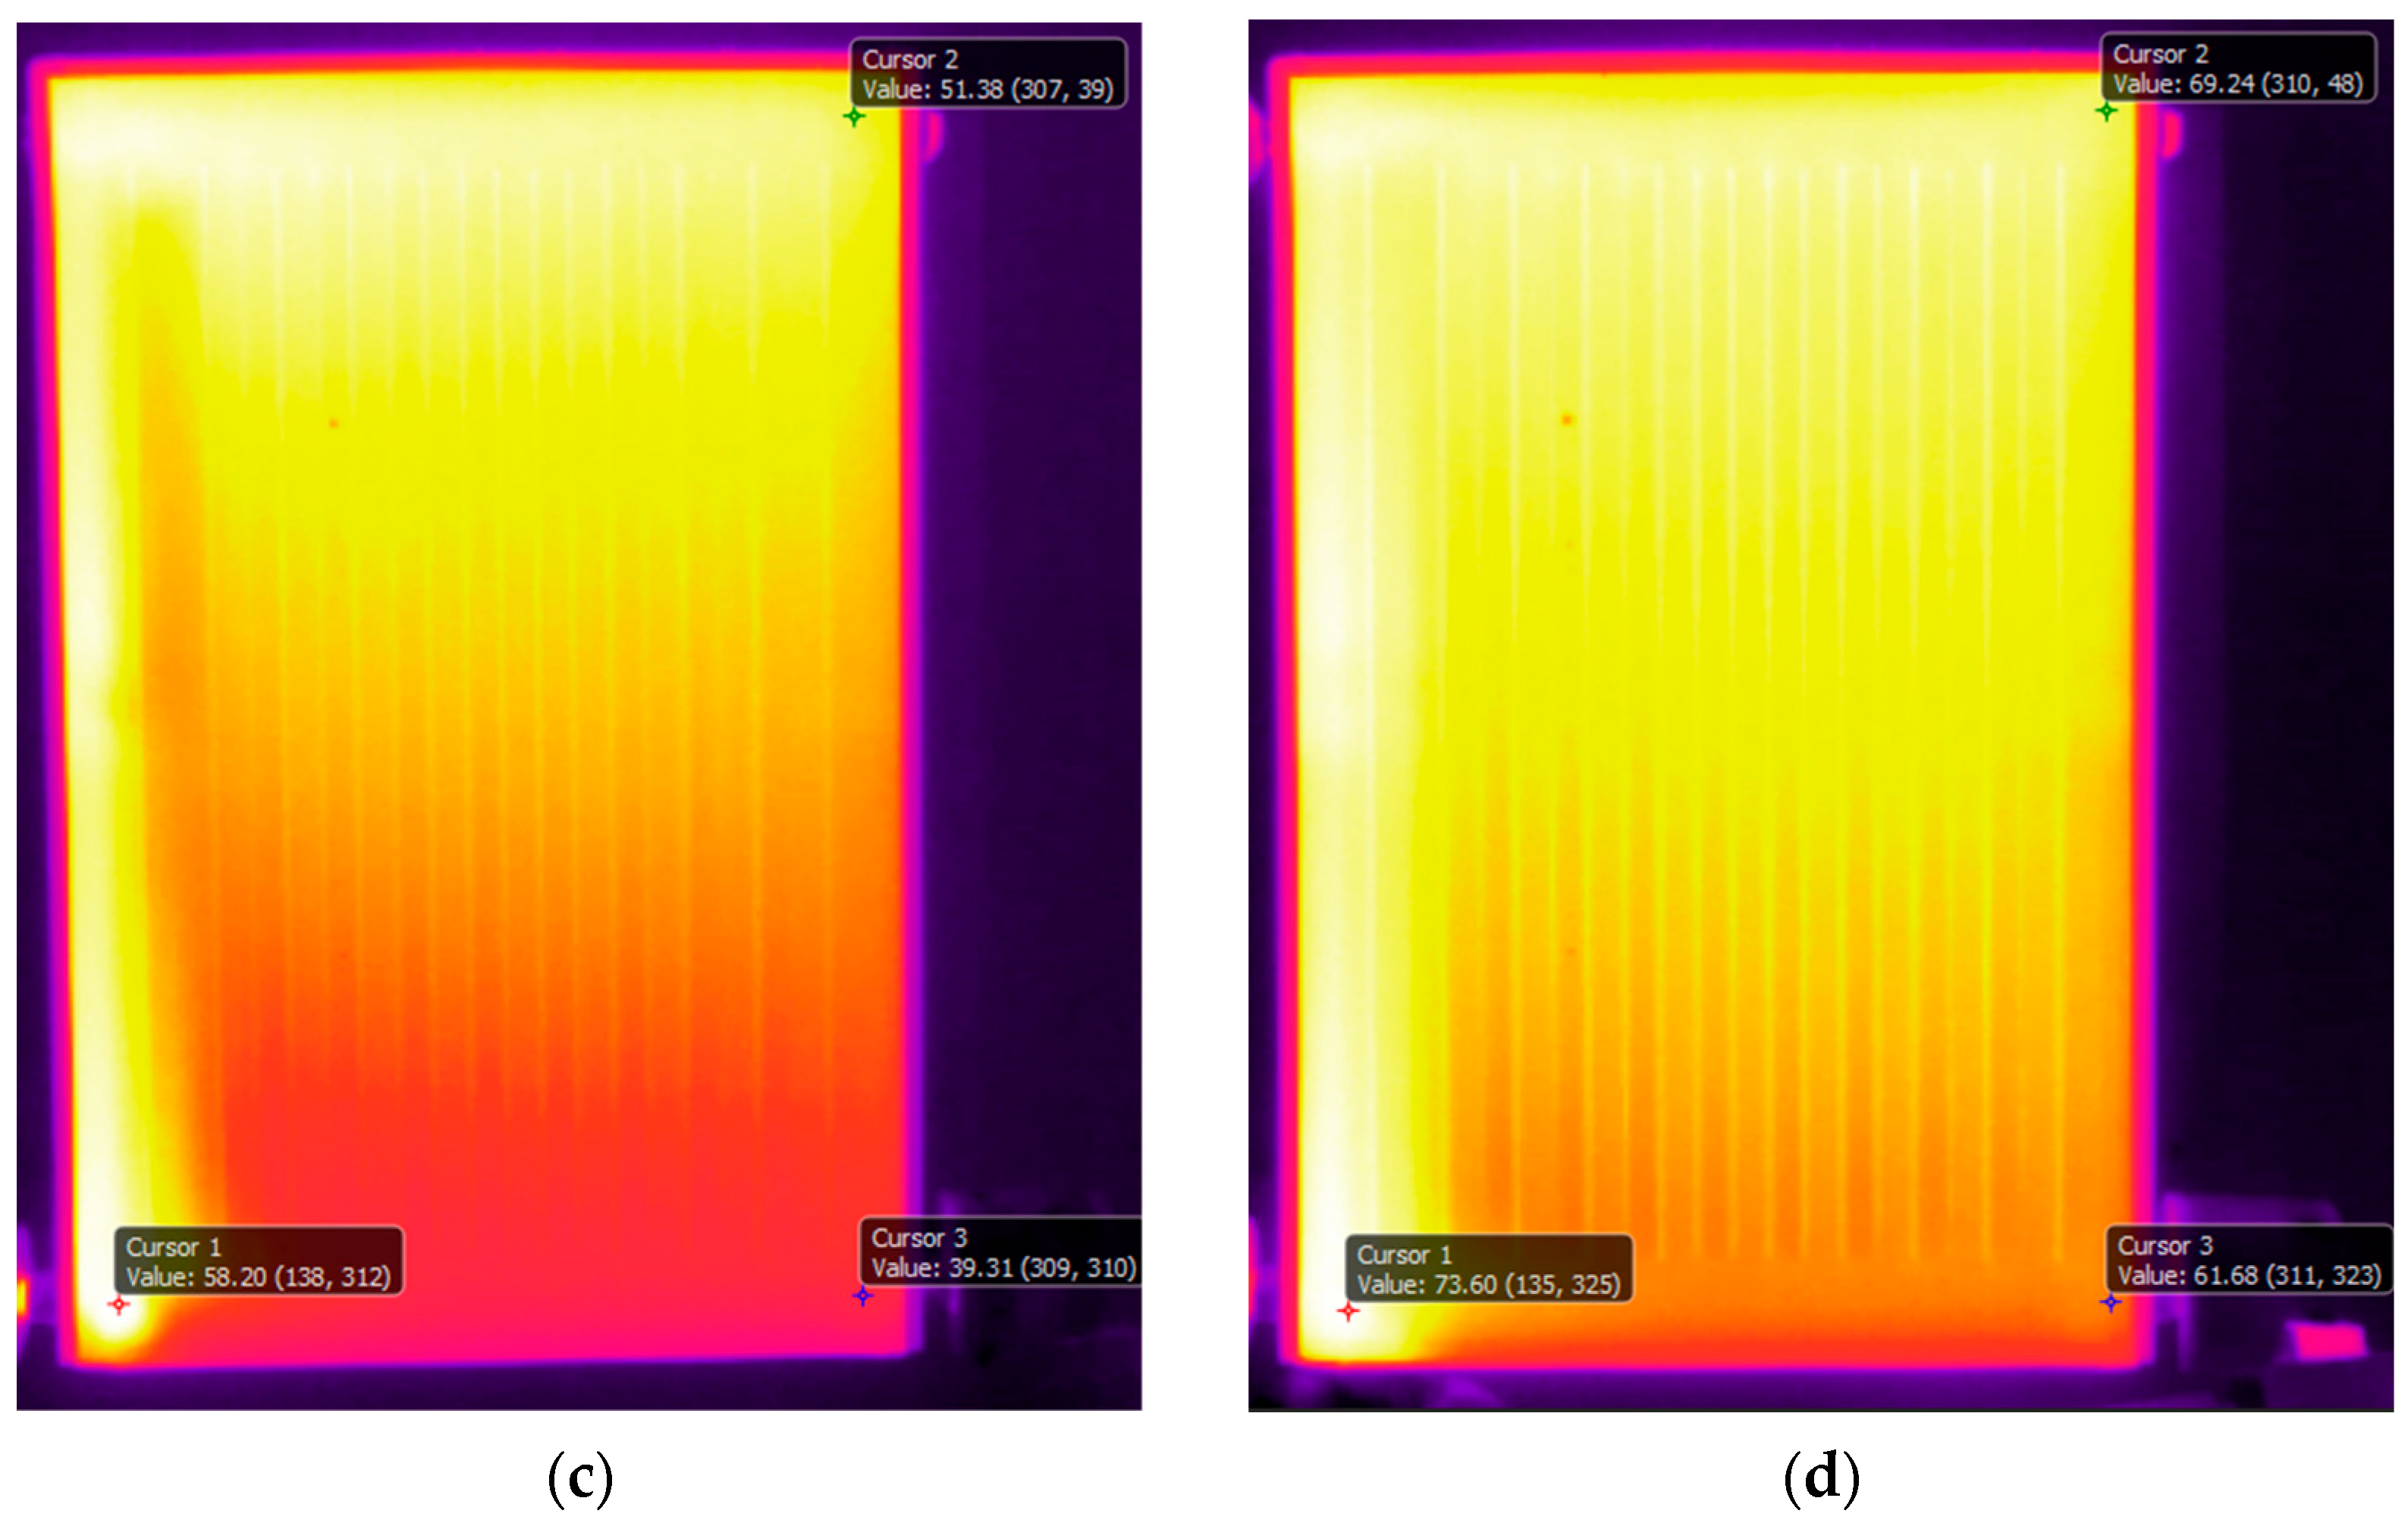
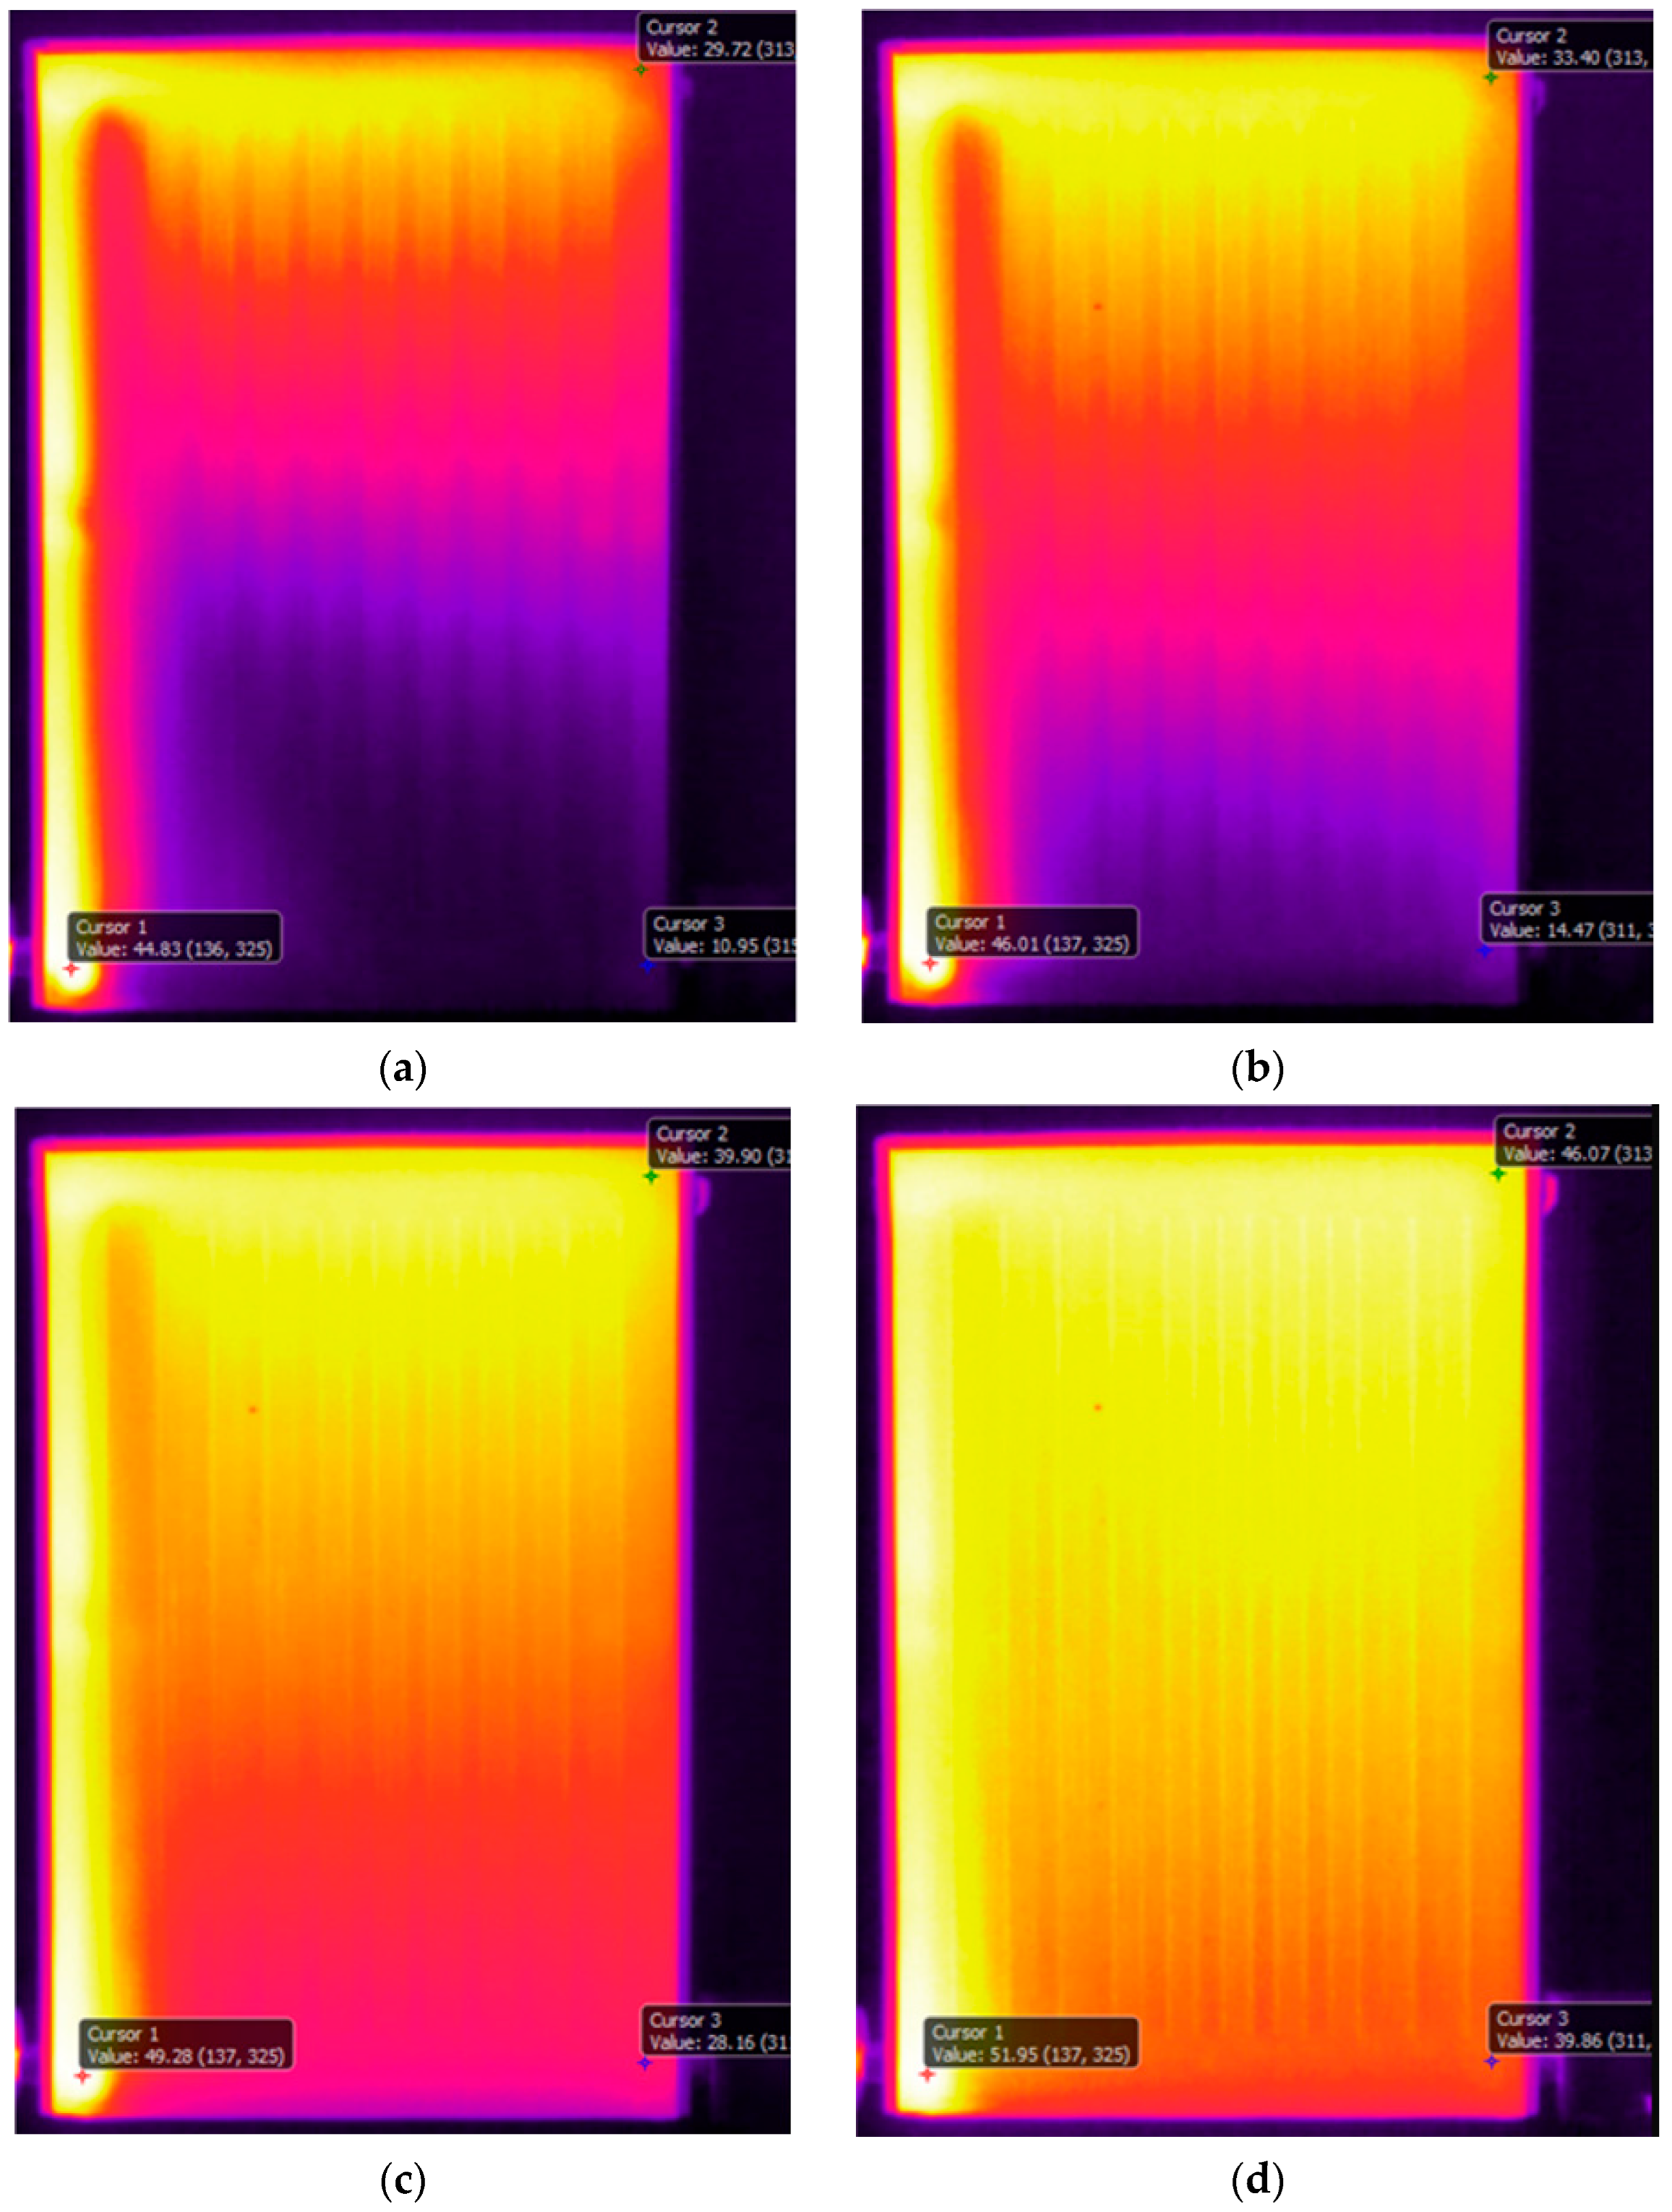
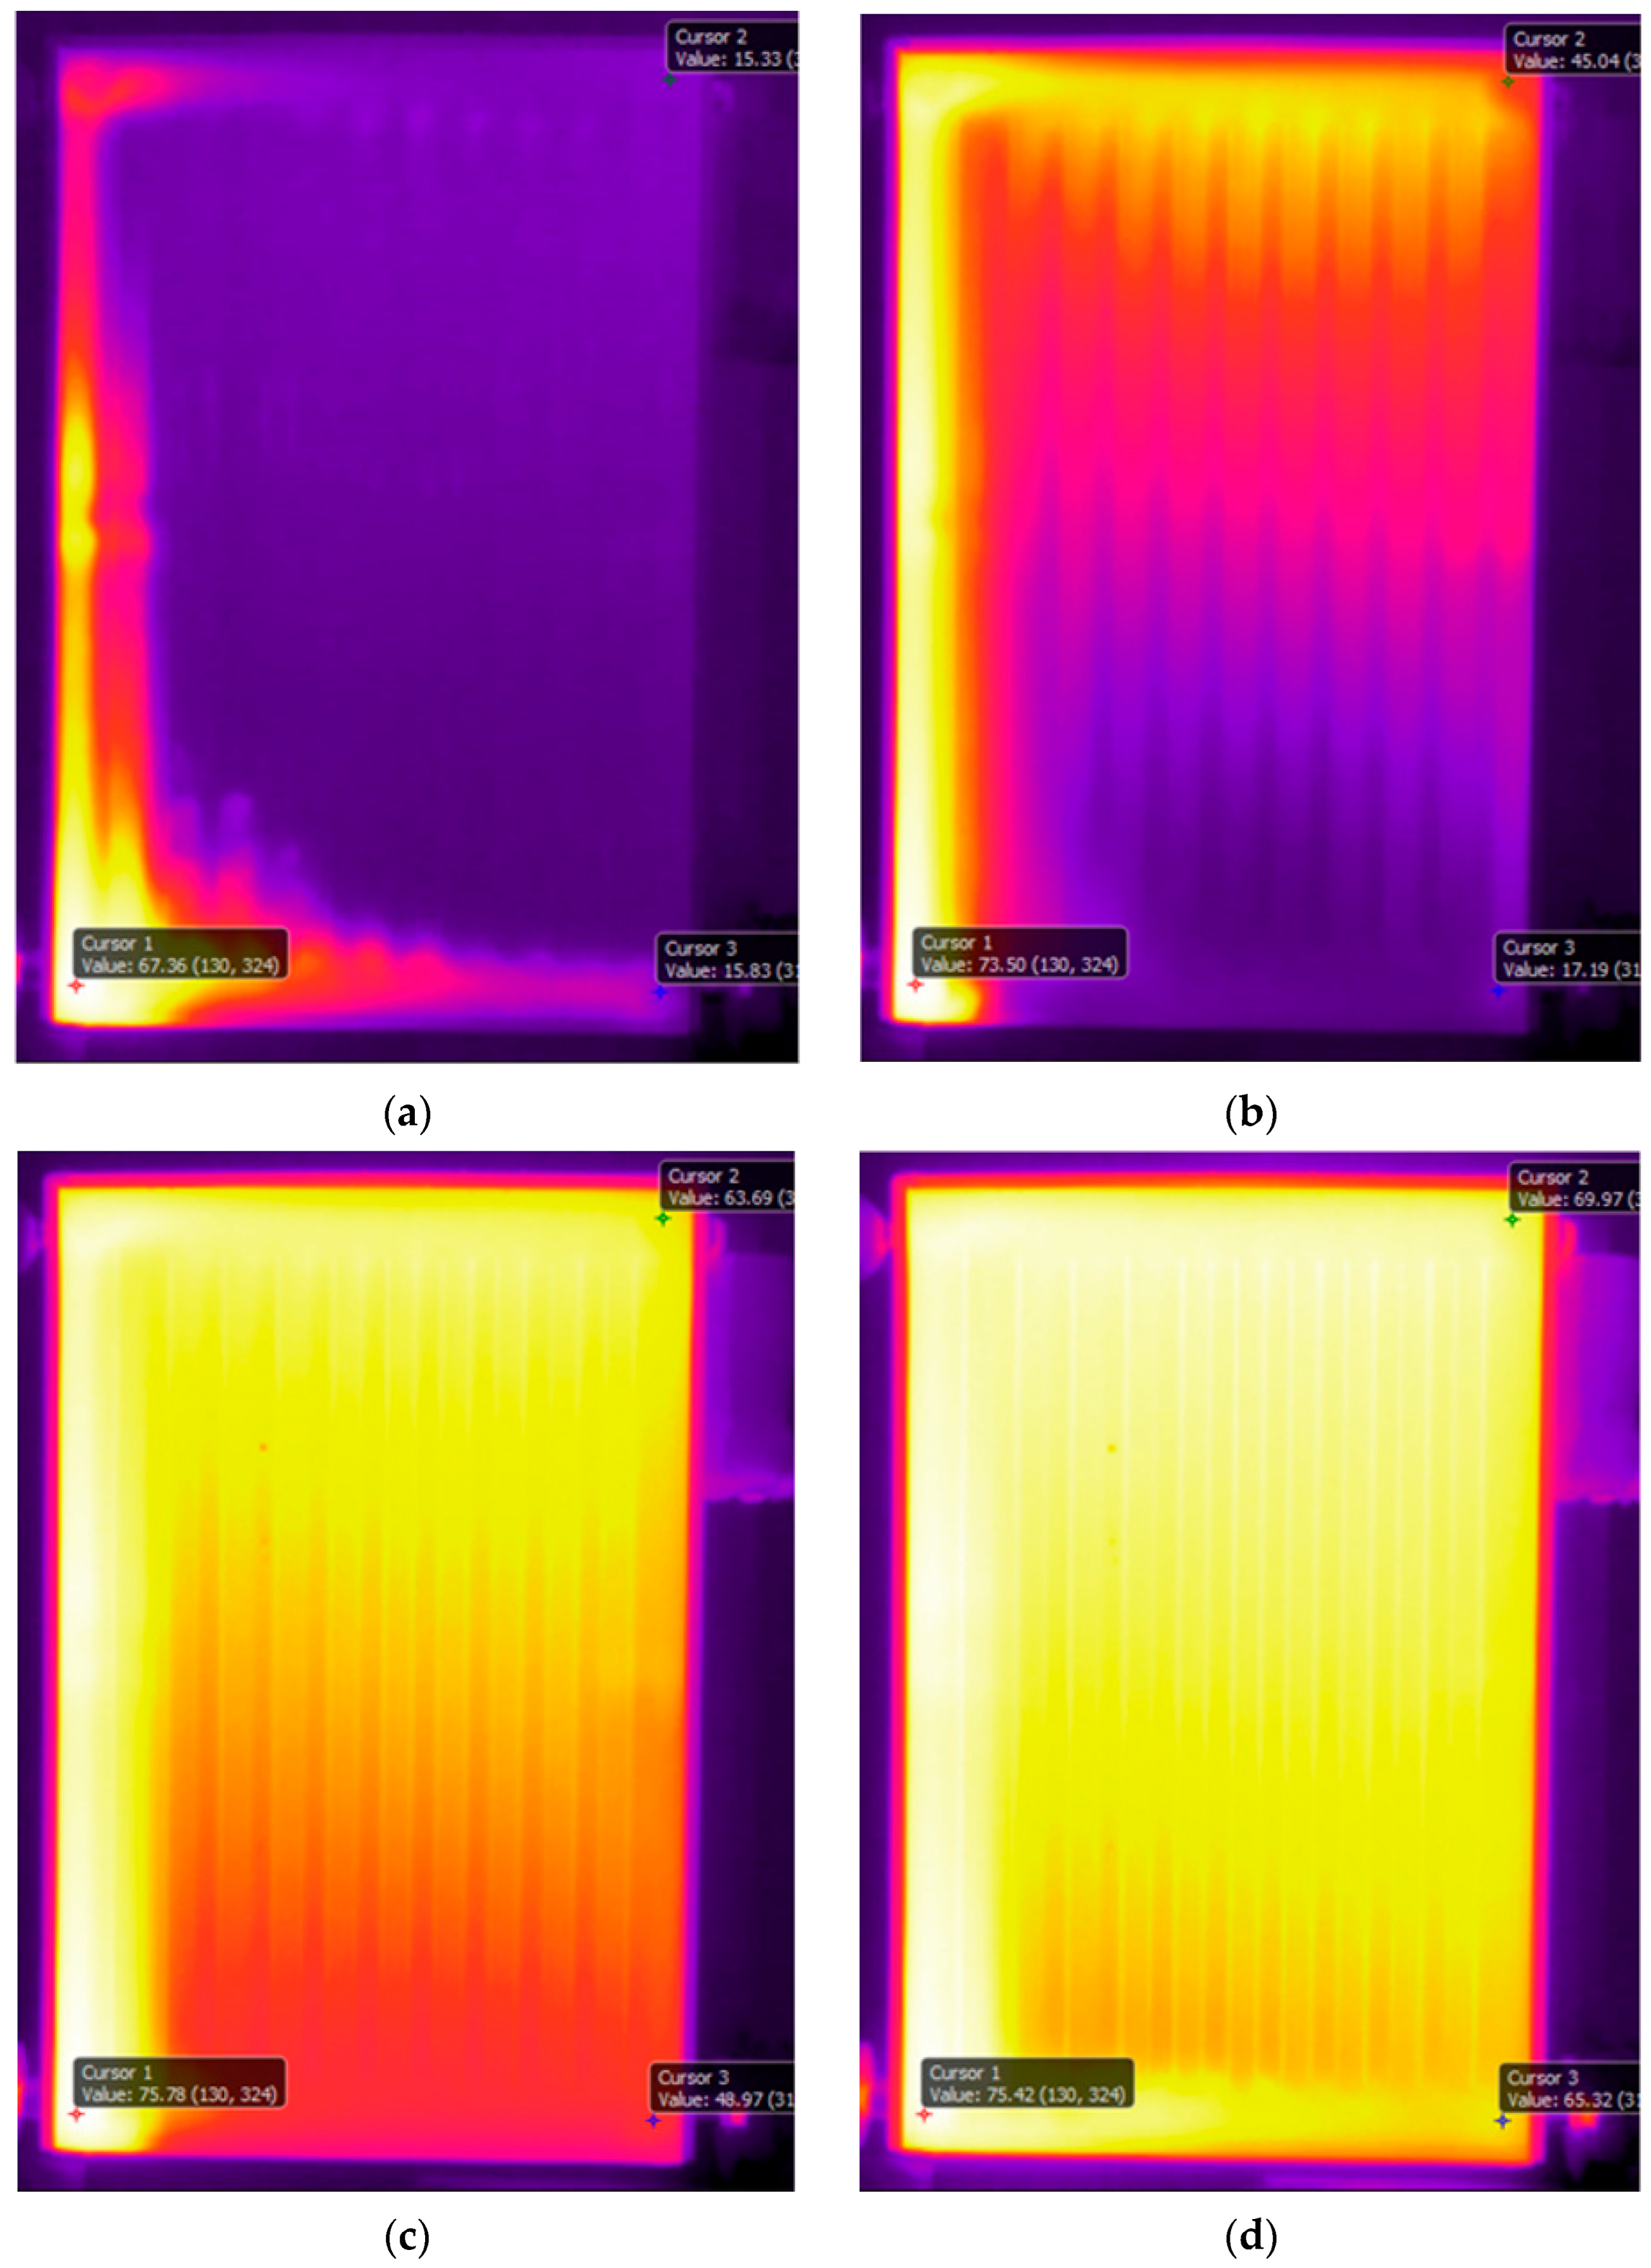
The results obtained for the baseline experiment (experiment 1) are presented in this section with the aim to analyze and better understand the thermal characteristics of a domestic convector using both qualitative and quantitative methods. Figure 4 depicts the temperature variations on the front surface of the convector at different time instants, where t = 0 represents that the hot water start entering the convector at Tset of 70 °C and m ˙ of 0.5 lpm. It is noteworthy that throughout this study, the hot water enters the convector at bottom left corner and exits from bottom right corner of the convector. Moreover, in all the thermal images presented in this study, local instantaneous temperature at three different locations is shown, i.e., near the entry, top right corner and exit of the convector. The rationale behind choosing these specific locations is that maximum and minimum temperatures are expected at the entry and exit of the convector, while the farthest point from the entry is top right corner of the convector.
It can be seen in Figure 4a, which is captured at t = 1.3 min, that hot water propagates vertically upwards through channel 1 (shown in Figure 2) and then from the top channel, it starts descending into channels 3–11. This is contrary to popular belief that the convector starts heating from the bottom. This flow behavior within the convector is attributed to the thermal buoyancy of the flow which forces hot water to accumulate at the top of the convector and thus, the thermal energy dissipation is significantly more from the top of the convector. The maximum surface temperature recorded is 53 °C near the entry to the convector, while the temperature near the exit of the convector is 14 °C. The surface temperature recorded near the top right corner of the convector is 36 °C. Only after t = 2.5 min, water starts descending into channels 2 and 12, as shown in Figure 4b. The potential reason for the delay in the flow of water through channels 2 and 14 is the sudden change in flow direction (for channel 2) and higher flow resistance initially (for channel 12). There is little change in the temperature near the entry, while the temperature near the top right corner and the exit have increased by 7 °C and 5 °C, respectively. Going further in time to t = 6.4 min (Figure 4c), it can be seen that the entry temperature has risen by only 4 °C, while the temperature at the top right corner and at the exit have increased further by 8 °C and 20 °C. This clearly shows how domestic convectors warm up. Initially, hot water upon entering the convector rises upward and then descends into the different channels. While this happens, there is no build up of thermal energy anywhere in the convector and the hot water is still replacing the cold water present in the convector. Once the cold water has been completely replaced by hot water, temperatures across the convector start rising significantly (see Figure 4d at t = 17.8 min). The entry temperature rises to 72 °C, the top corner temperature rises to 70 °C and the exit temperature rises to 62 °C. Thus, the region of the highest thermal energy dissipation on the surface of the convector is an L-shaped area going from the convector entry to the top right corner.
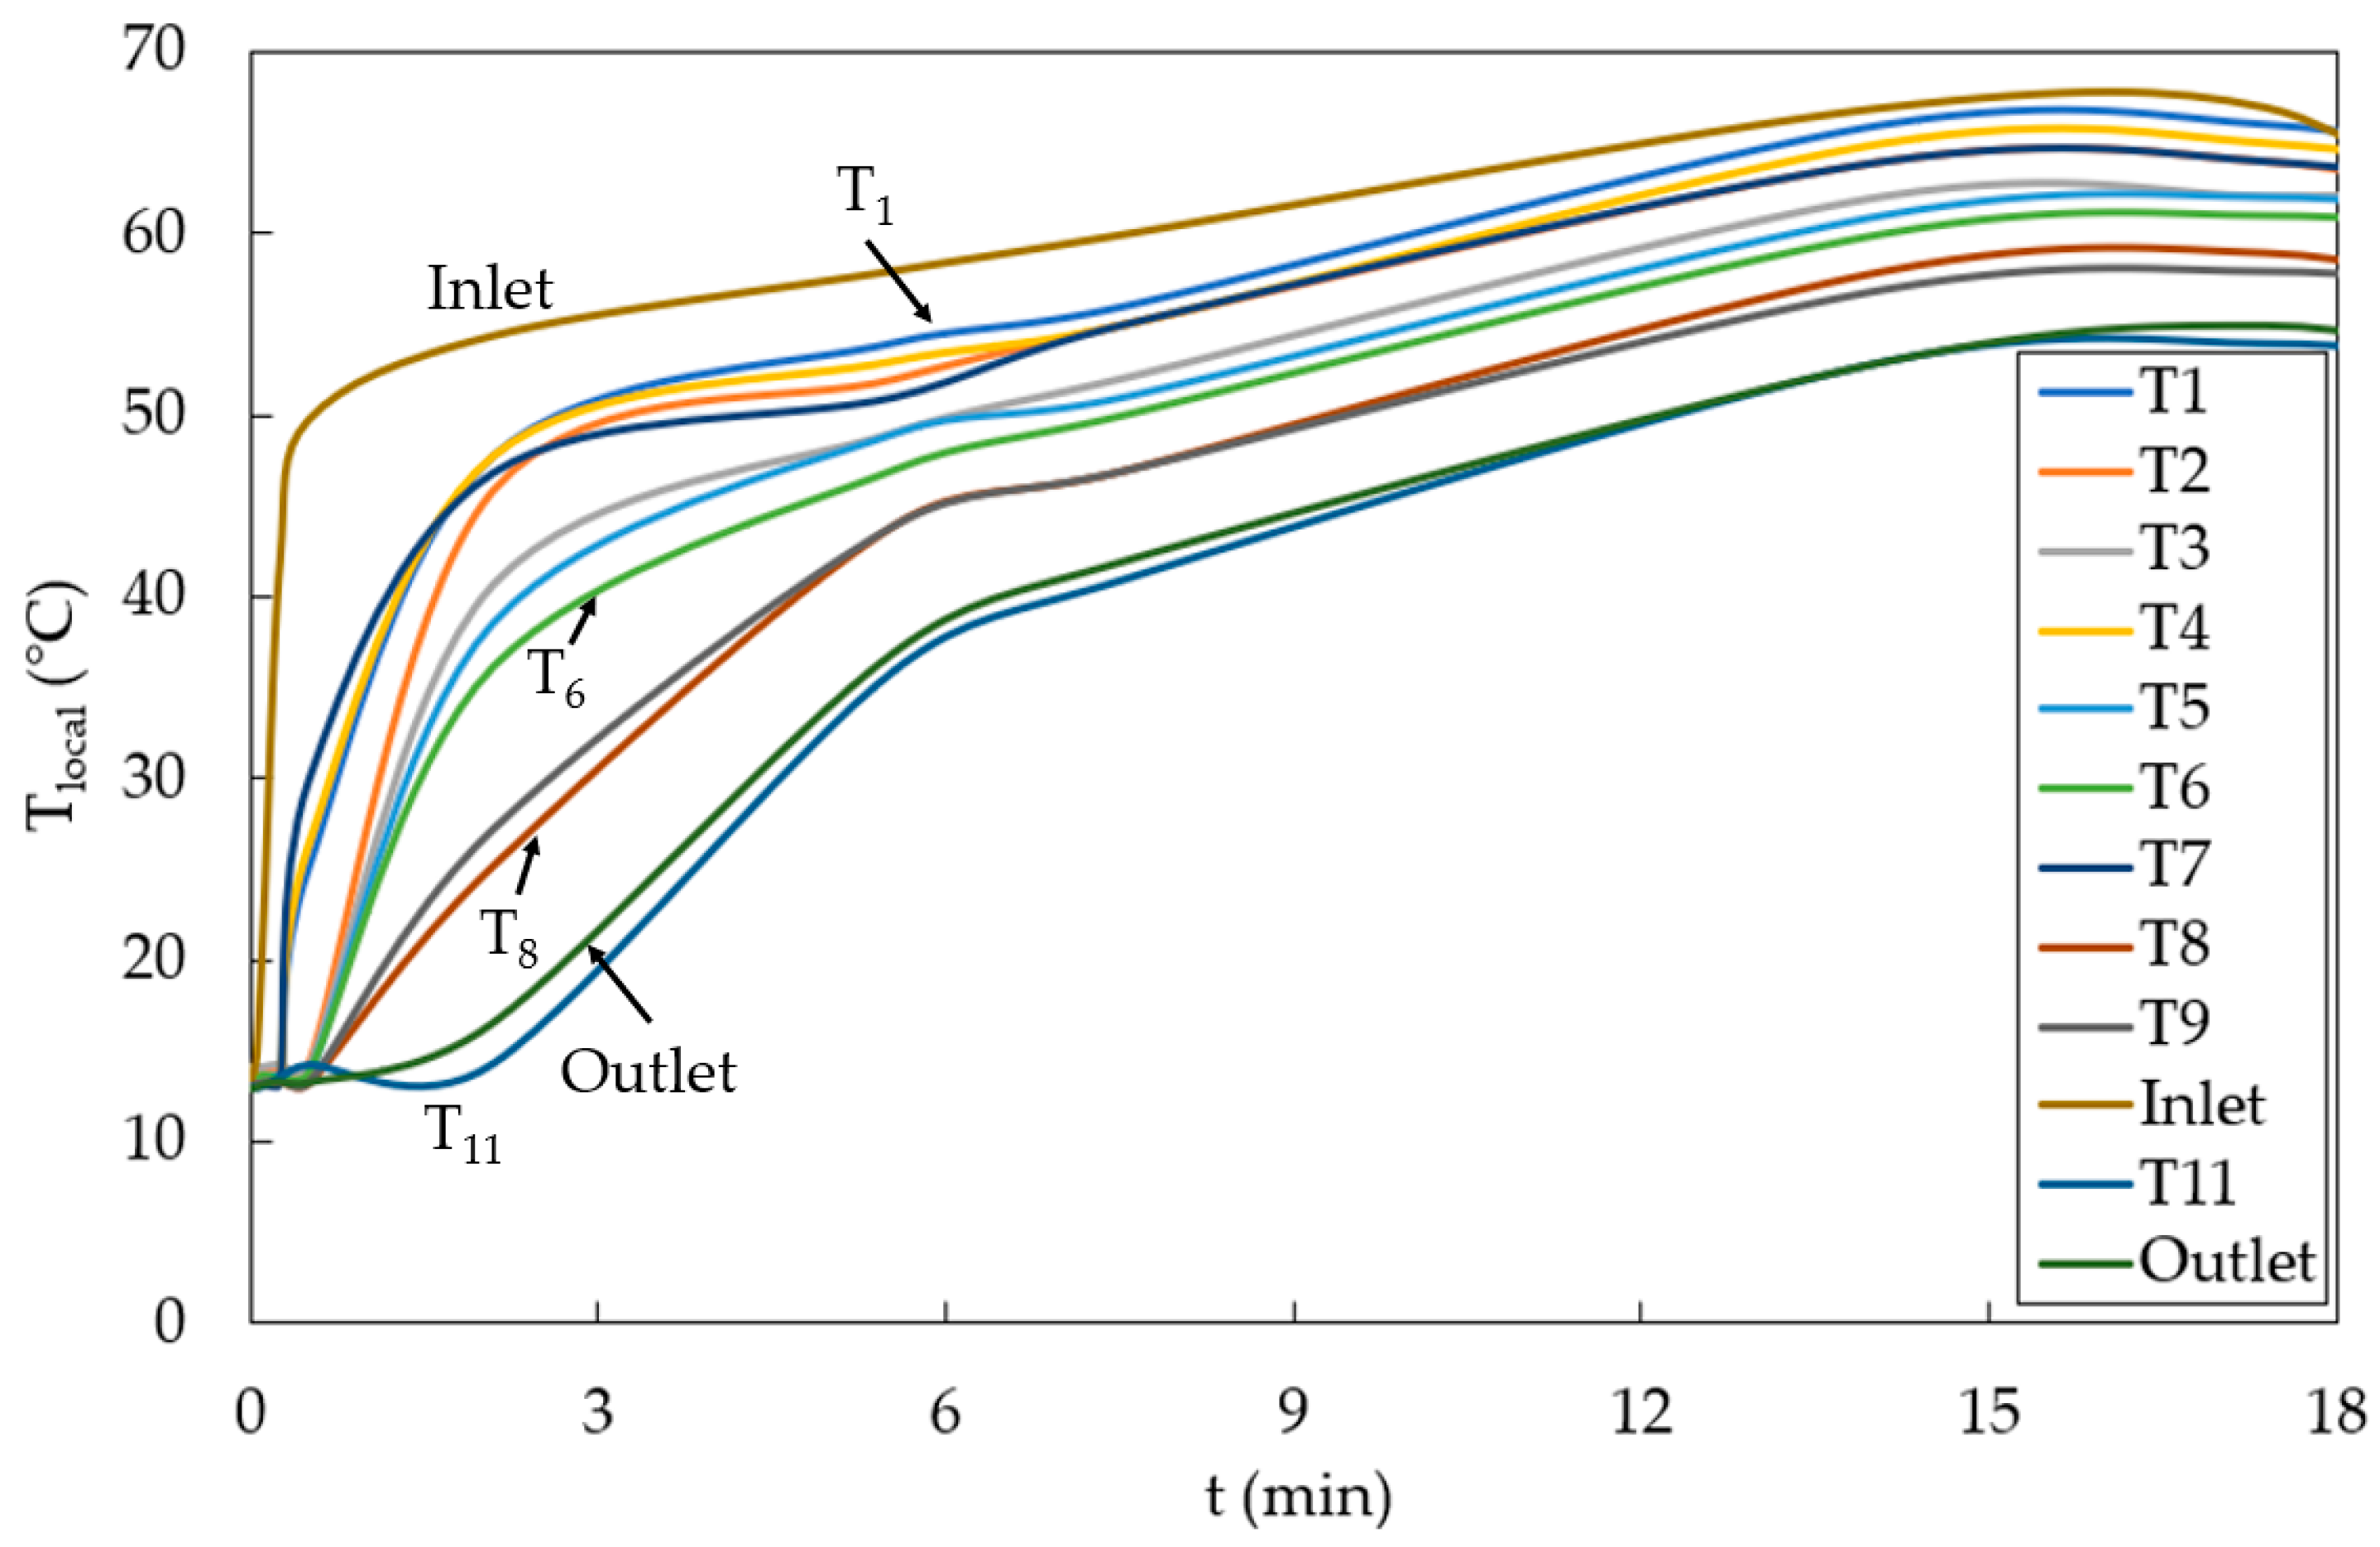
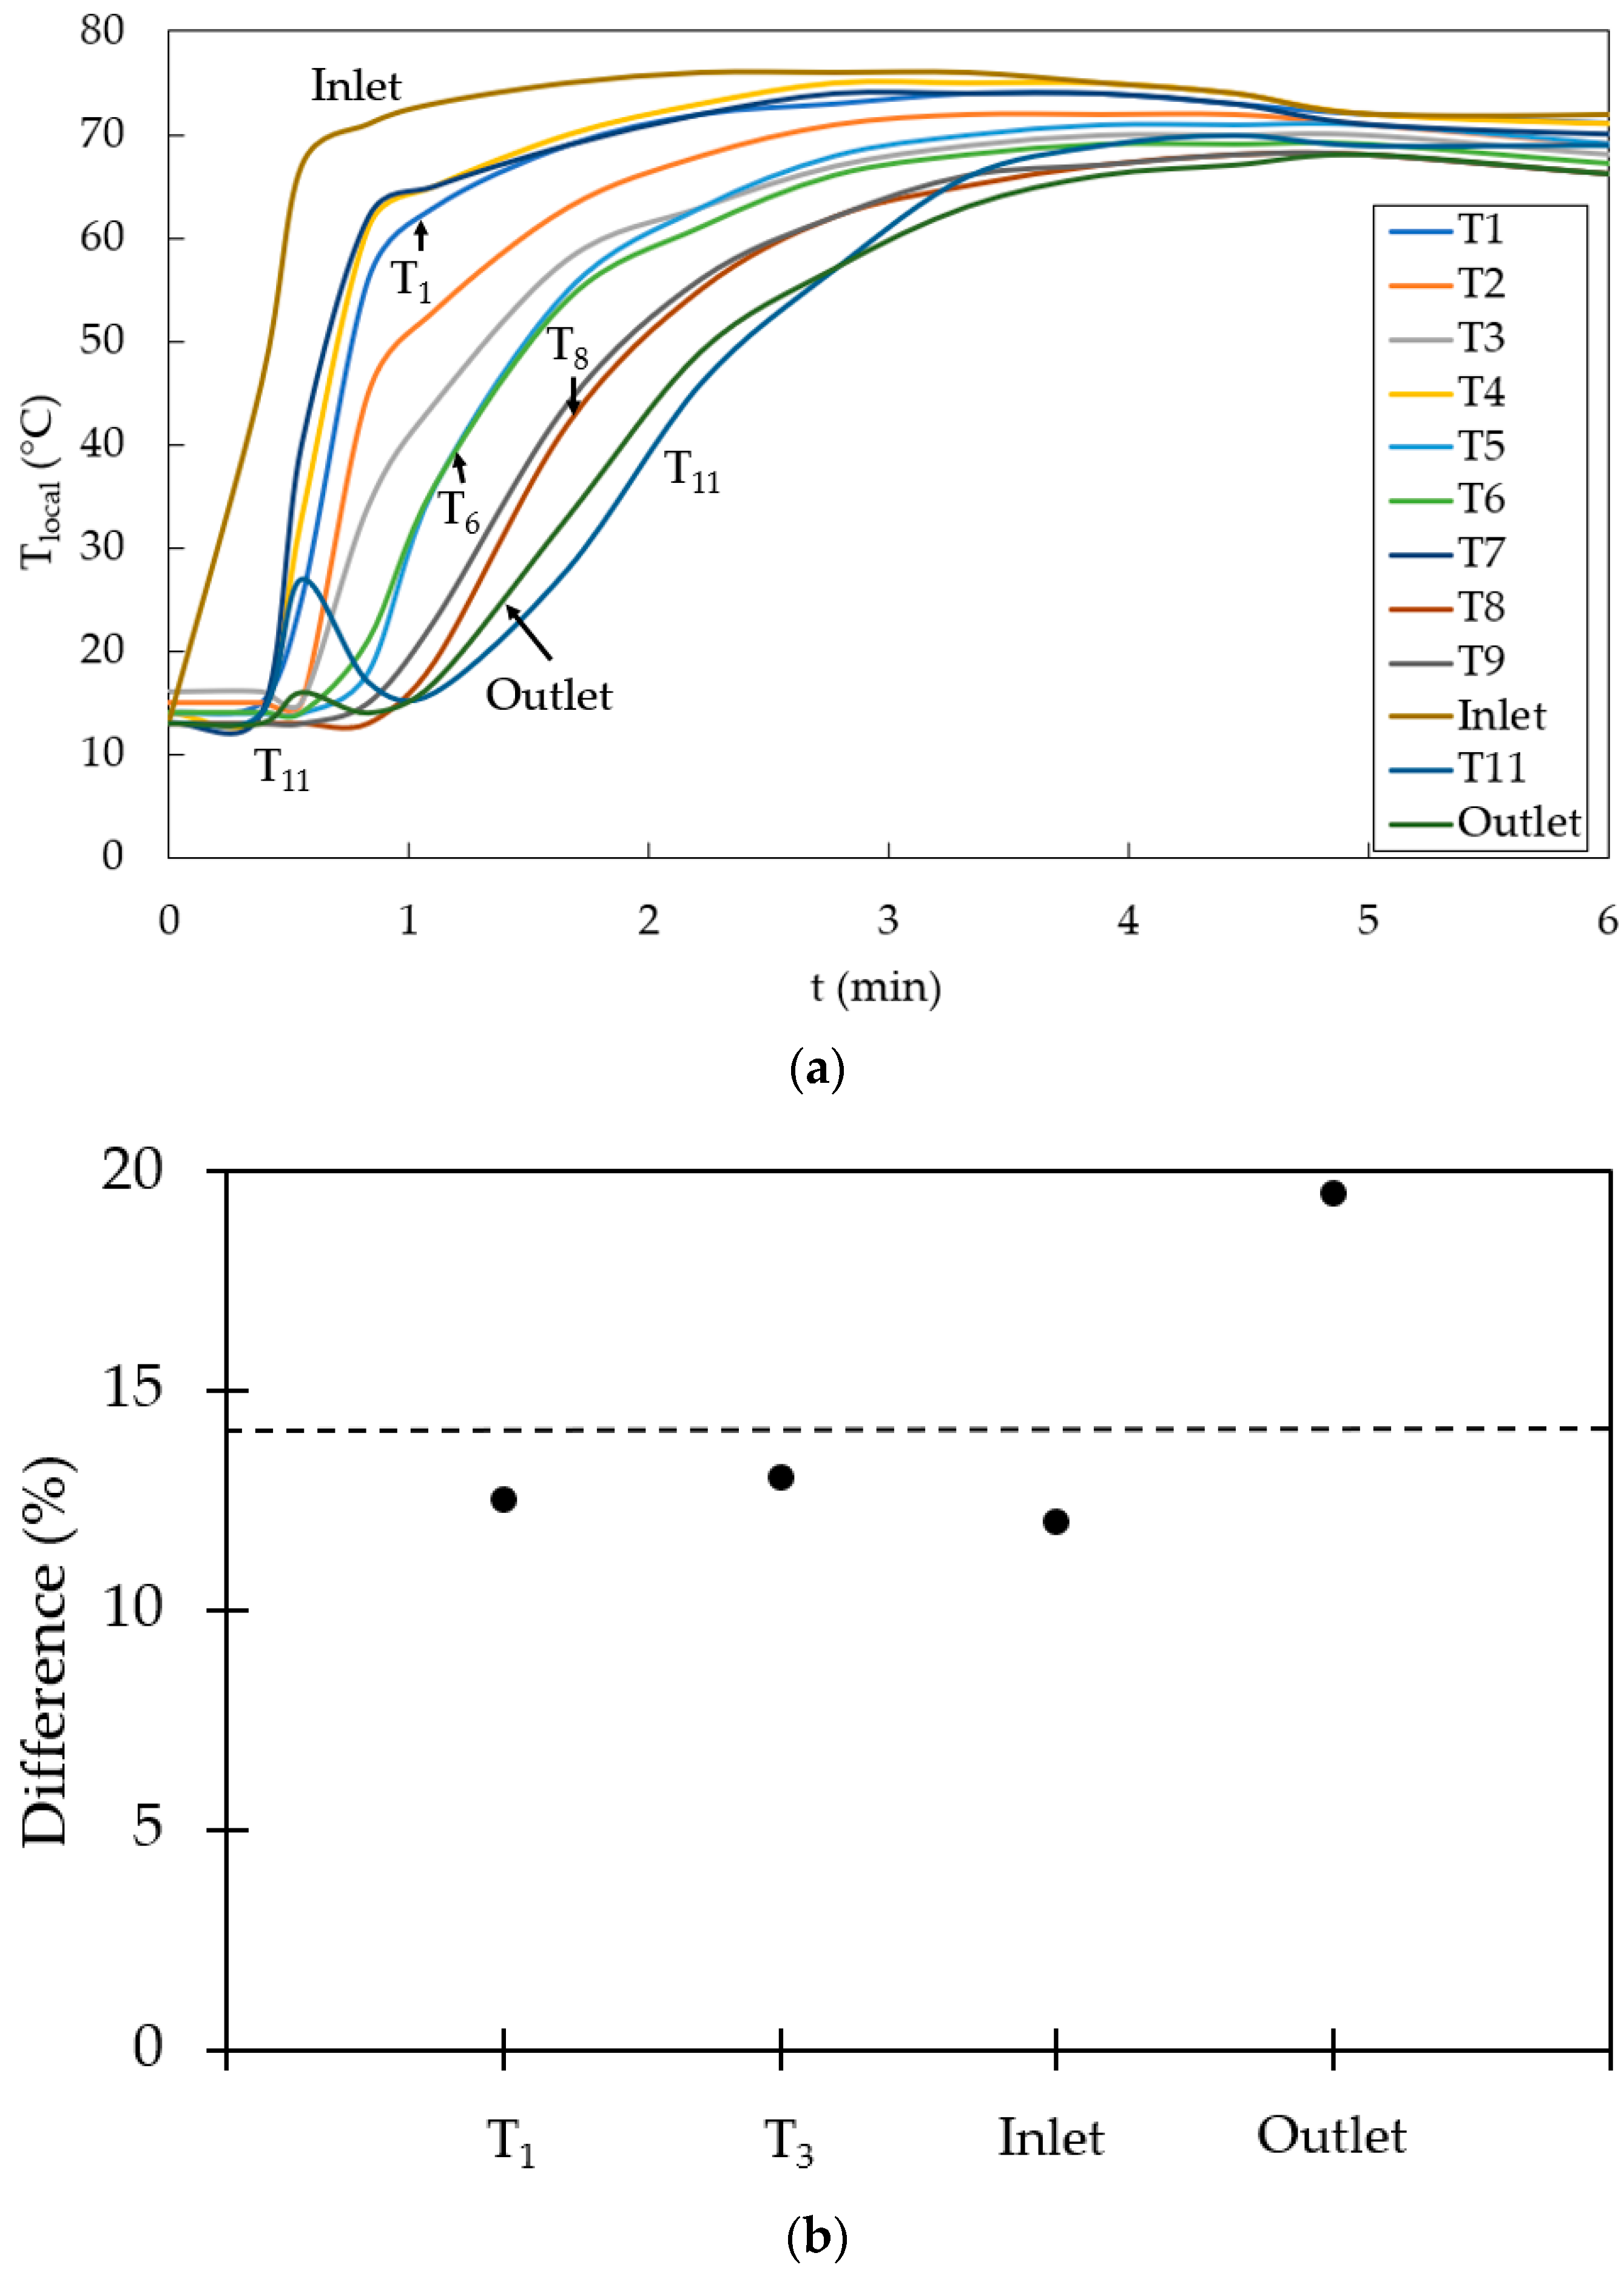
As mentioned earlier, local surface temperature data has been analyzed at 12 points, i.e., T1–T11, Inlet and Outlet (as shown in Figure 3). This local temperature data are depicted in Figure 5 where each curve represents one data point on the front surface of the convector. As expected, the temperature at the inlet is the highest and at the outlet it is the lowest, while the rest of the curves are in between these two. At the inlet, the temperature rises sharply to 50 °C as hot water at Tset = 70 °C enters the convector. The rate of increase in the temperature decreases gradually till the maximum temperature is achieved. Similar trends are observed for all other data points as well except those points which are at the bottom horizontal flow channel (T11 and Outlet). Data points which are closer to the inlet (T1, T4 and T7) depict a steeper initial temperature gradient, compared to those points which are farther away from the inlet (T3, T6 and T9). An interesting observation is that the final/maximum temperature reached at a particular point on the surface of the convector depends on the initial temperature gradient experienced at that point. Thus, the point near the entry of the convector (depicting steepest gradient) reaches the highest temperature (68 °C) anywhere on the surface of the convector. This is followed by points T1 (67 °C), T4 (66 °C) and T7 (65 °C) which are vertically in line with the inlet point (in vertical channel 1). The maximum temperature achieved at points T2, T5 and T8, which are in between vertical channels 6 and 7, is 65 °C, 63 °C and 60 °C, respectively. The maximum temperature recorded at points T3, T6 and T9 are 63 °C, 62 °C and 59 °C. Lastly, the maximum temperature achieved at T11 and the Outlet are 55 °C and 56 °C. Thus, the temperature difference between the Inlet and Outlet points is 12 °C. Another observation from this analysis is that when going from left to right in Figure 3 (i.e., away from the entry of the convector), the temperature decreases such that the temperature difference between T1 and T2 (and between T2 and T3) is 2 °C, while between T4 and T5 is 3 °C, and between T7 and T8, it is 5 °C. Thus, the temperature difference decreases going away from the entry of the convector.
It is noteworthy here that as only the surface temperature of the convector has been recorded and analyzed in this study, the effects of the external environment such as the room temperature, etc. have not been considered. This also means that energy dissipation estimation from the convector surface to the ambient air is not included in this study. However, the authors are planning to build a control chamber through which the environmental conditions could be controlled. After a comprehensive local thermal characterization of a domestic convector heating process for a baseline scenario, parametric studies on the effects of inlet water temperature and flowrate are presented in the following sub-sections.

3.2. Effect of Inlet Water Temperature

The results for experiment 3, i.e., Tset = 50 °C and m ˙ = 0.5 lpm, are presented in Figure 6 and Figure 7, in order to investigate the effect of lowering inlet water temperature on the local thermal characteristics of the domestic convector, especially in comparison with higher inlet water temperature presented in the previous section. As mentioned earlier in this study, the aim here is to explore the feasibility of using lower inlet water temperature for space heating purposes so that the emissions and the carbon footprint of domestic boilers can be reduced, along with the feasibility of using alternative/renewable sources of energy, like geothermal water, for heating purposes.
Figure 6 depicts local temperature variations on the front surface of the domestic convector at Tset = 50 °C and m ˙ = 0.5 lpm, i.e., this flowrate is what is conventionally set in domestic boilers; however, the inlet water temperature is 20 °C lower. Firstly, as the caption of the figure indicates, the time taken by the convector to reach its maximum temperature is 10.3 min, which in the case of Tset = 70 °C, is 17.8 min. This is expected as Tset is lower and thus, for the same flowrate, the convector takes less time to heat-up. Now examining Figure 6a–d, it is clear that the qualitative thermal trends are the same as observed in case of Tset = 70 °C, i.e., the water rises in channel 1 and then initially descends through channels 3–11, while the temperature recorded near the entry and exit of the convector keeps on increasing. The local thermal trends are also very similar to the previous case, suggesting that there is no significant difference in the heating pattern of the convector when the inlet water temperature is lowered, which is helpful to what this study is aiming to achieve, i.e., a sustainable and more energy efficient way of space heating using conventional domestic convectors, with the potential to use geothermal energy as the heat source.
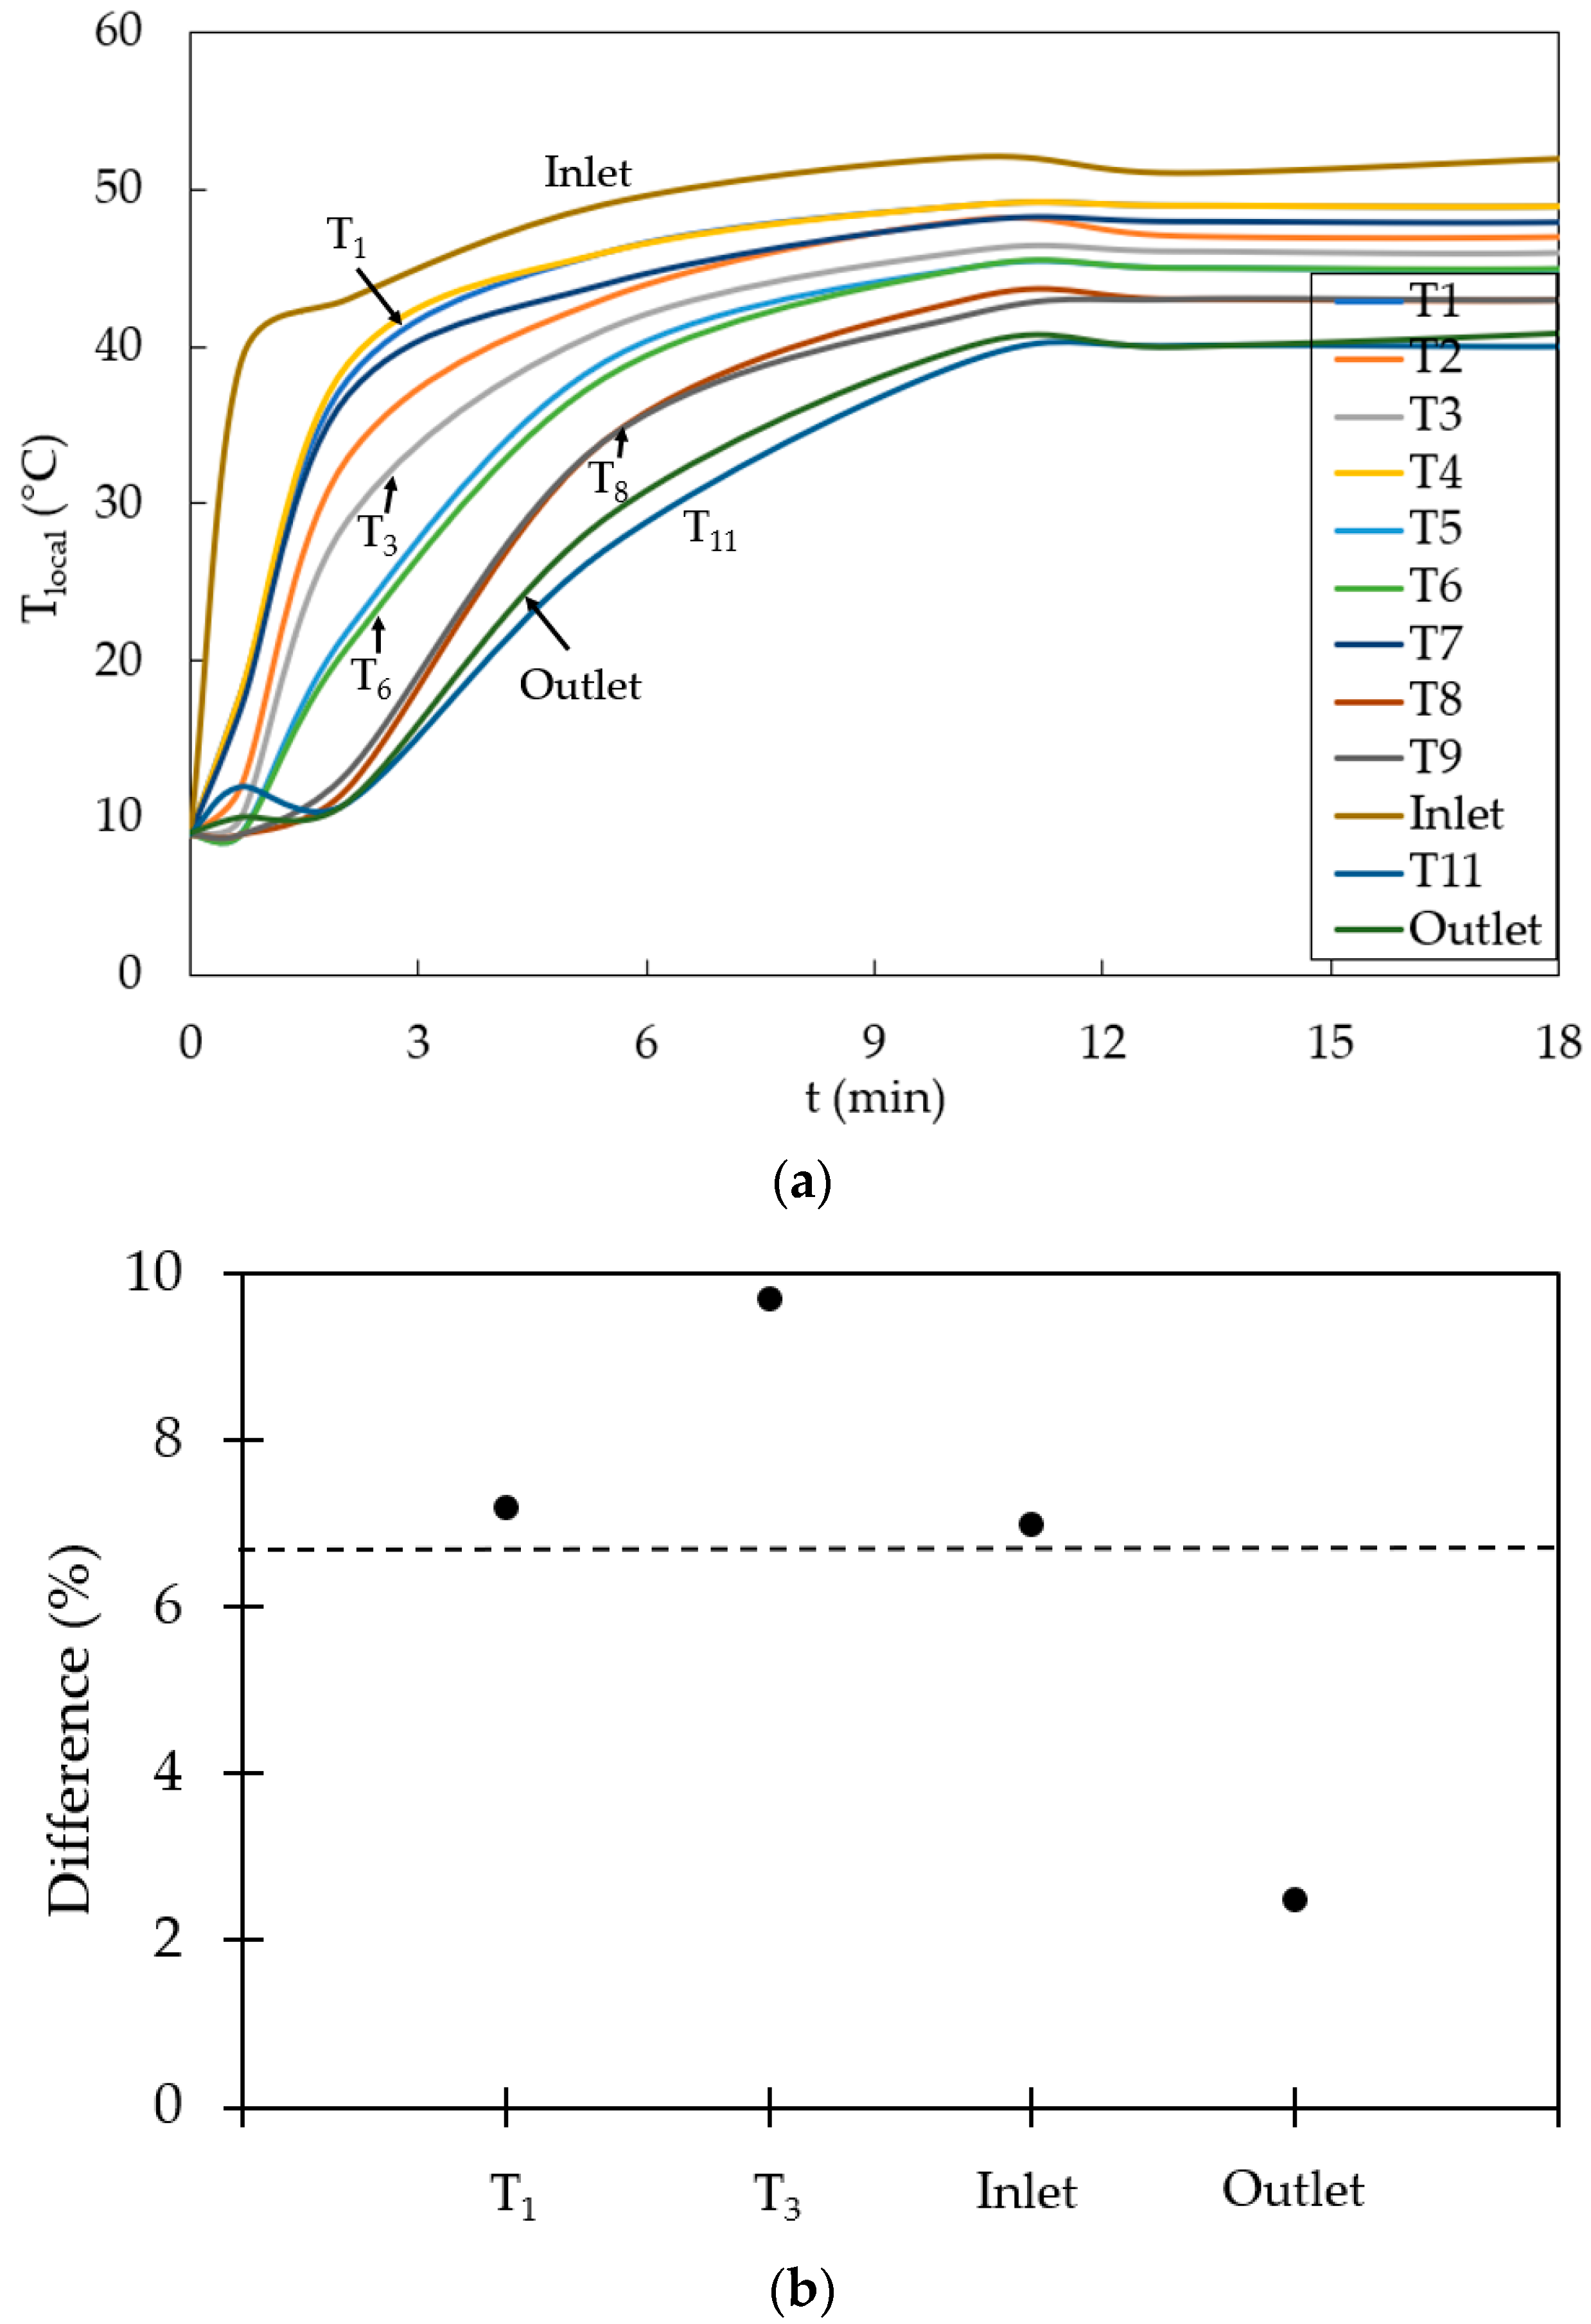
With similarities in local qualitative thermal behavior between Tset = 70 °C and Tset = 50 °C, it is naturally expected that there will be significant quantitative similarities as well, which are depicted in Figure 7a. A direct comparison between Figure 5 and Figure 7 is difficult because the Tset are different; in order to confirm the hypothesis that there is no significant difference in the thermal behavior of domestic convectors when inlet water temperature changes, data from both of these figures has been non-dimensionalised against its own Tset, while time has been non-dimensionalised against the time taken by the convector to reach the maximum temperature. The difference in these normalized temperatures between the two cases, as defined below, is shown in Figure 7b for the four corners of the convector, i.e., T1, T3, Inlet and Outlet. This has been shown for the normalized time (t/tmax) of 1, i.e., when the convector reaches its peak temperature. It can be seen that the local temperature differences between the two cases under discussion is less than 10% anywhere on the convector surface, with an average difference of 6.6%, which confirms that there is no statistically significant thermal performance difference between Tset = 50 °C and Tset = 70 °C.
D i f f e r e n c e ( % ) = T s e t 50 50 T s e t 70 70 T s e t 70 70   × 100
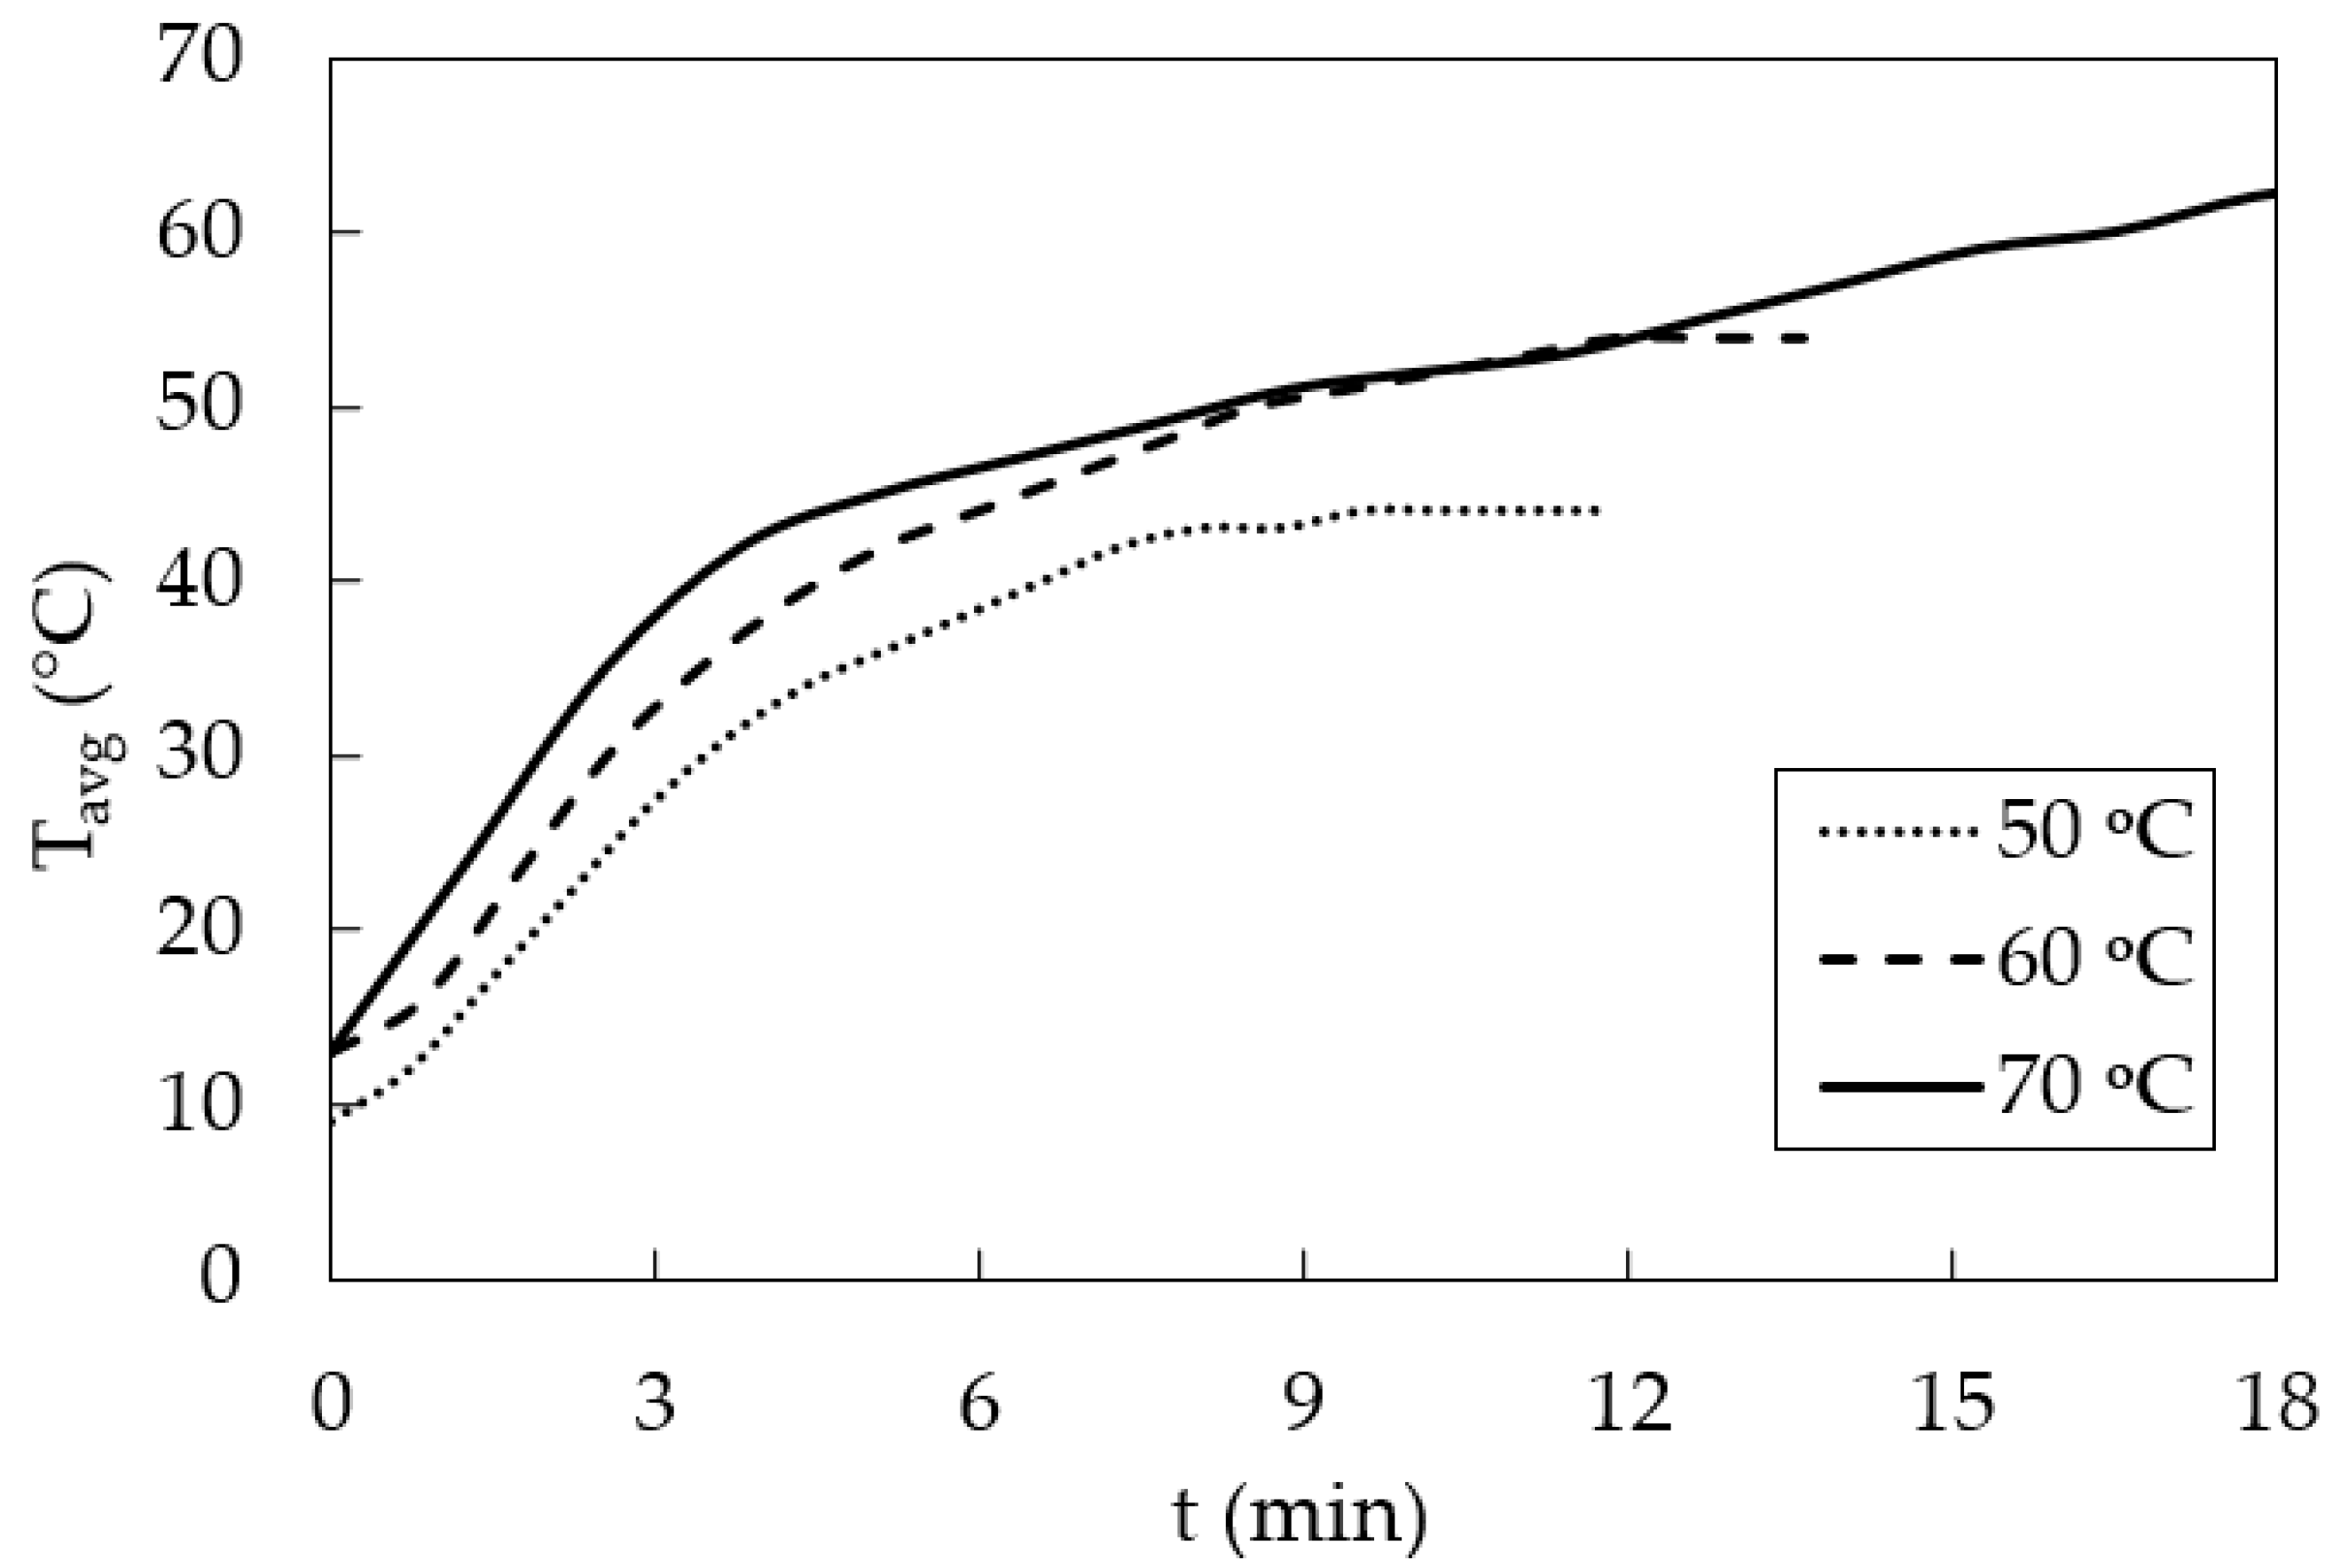
In order to capture the effect of varying inlet water temperature on the thermal characteristics of domestic convectors further, Figure 8 depicts the average front surface temperature of the convectors at Tset = 50 °C, Tset = 60 °C and Tset = 50 °C, where the average front surface temperature is simply the statistical average of T1–T11, and the Inlet and Outlet temperature at any given instance. It can be seen that when Tset is lower, the maximum surface temperature attained by the convector is proportionally lower. Moreover, for lower Tset, the time taken by the convector to reach its peak temperature is also proportionally lower. Although both these observations have been made earlier as well, the data presented in Figure 8 will be used later in this study to develop a prediction model for the average surface temperature of the convector.

3.3. Effect of Inlet Mass Flow Rate

The results for experiment six, i.e., Tset = 70 °C and m ˙ = 2.4 lpm, are presented in Figure 9 and Figure 10, in order to investigate the effect of increasing the mass flowrate of water passing through the domestic convector on its thermal characteristics. There are some noticeable differences compared to the aforementioned investigations in this study. Firstly, the time taken by the convector to reach its maximum temperature is significantly lower, i.e., 3.9 min, compared with 17.8 min when the flowrate is 0.5 lpm. Secondly, as shown in Figure 9a, at the start of the heating cycle, as the water pressure is considerably higher, hot water rushes into the bottom flow channel. Meanwhile, it rises in vertical channel 1, followed by descent through vertical channels 3–11 (Figure 9b). By this time, the surface temperature near the entry of the convector has already reached 73.5 °C, while the temperature at location T3 and near the outlet are still quite low (45 °C and 17 °C, respectively). In the next 0.8 min, the surface temperature at T3 sharply increases to 63 °C. Thus, it is evident from Figure 9 that the thermal characteristics of the domestic convector vary as the mass flowrate of the water changes. In order to ascertain this, quantitative thermal analysis is required.
Figure 10a depicts the time history of the local surface temperature during the heating cycle for Tset = 70 °C and m ˙ = 2.4 lpm. In comparison with Figure 4, it seems that there is not much difference between the two cases apart from the fact that the time taken to reach maximum temperature is lower in the case of m ˙ = 2.4 lpm. Upon careful examination, a significant difference between the two figures can be spotted, i.e., in Figure 5, even at the end of the heating cycle, there was a noticeable difference in the local surface temperature recorded at different locations on the front surface of the convector. In the case of m ˙ = 2.4 lpm (Figure 10a), the maximum temperature recorded at different points is not far away from each other. For example, in the case of m ˙ = 0.5 lpm, the maximum temperature recorded near the outlet of the convector at the end of the heating cycle was around 50 °C, while for m ˙ = 2.4 lpm, it was above 65 °C. It must be reminded here that Tset remains the same as in Figure 4 and Figure 10a, i.e., 70 °C.
In order to confirm that the thermal characteristics of the domestic convectors change by changing the inlet mass flowrate of water, the percentage difference in the non-dimensionalised local surface temperature at the four corners of the convector, at t/tmax of 1, has been plotted in Figure 10b. It can be seen that the local temperature differences between m ˙ = 2.4 lpm and m ˙ = 0.5 lpm is more than 10% on the convector surface, with an average difference of 14.25%, which confirms that there is are statistically significant thermal performance differences between the two cases.
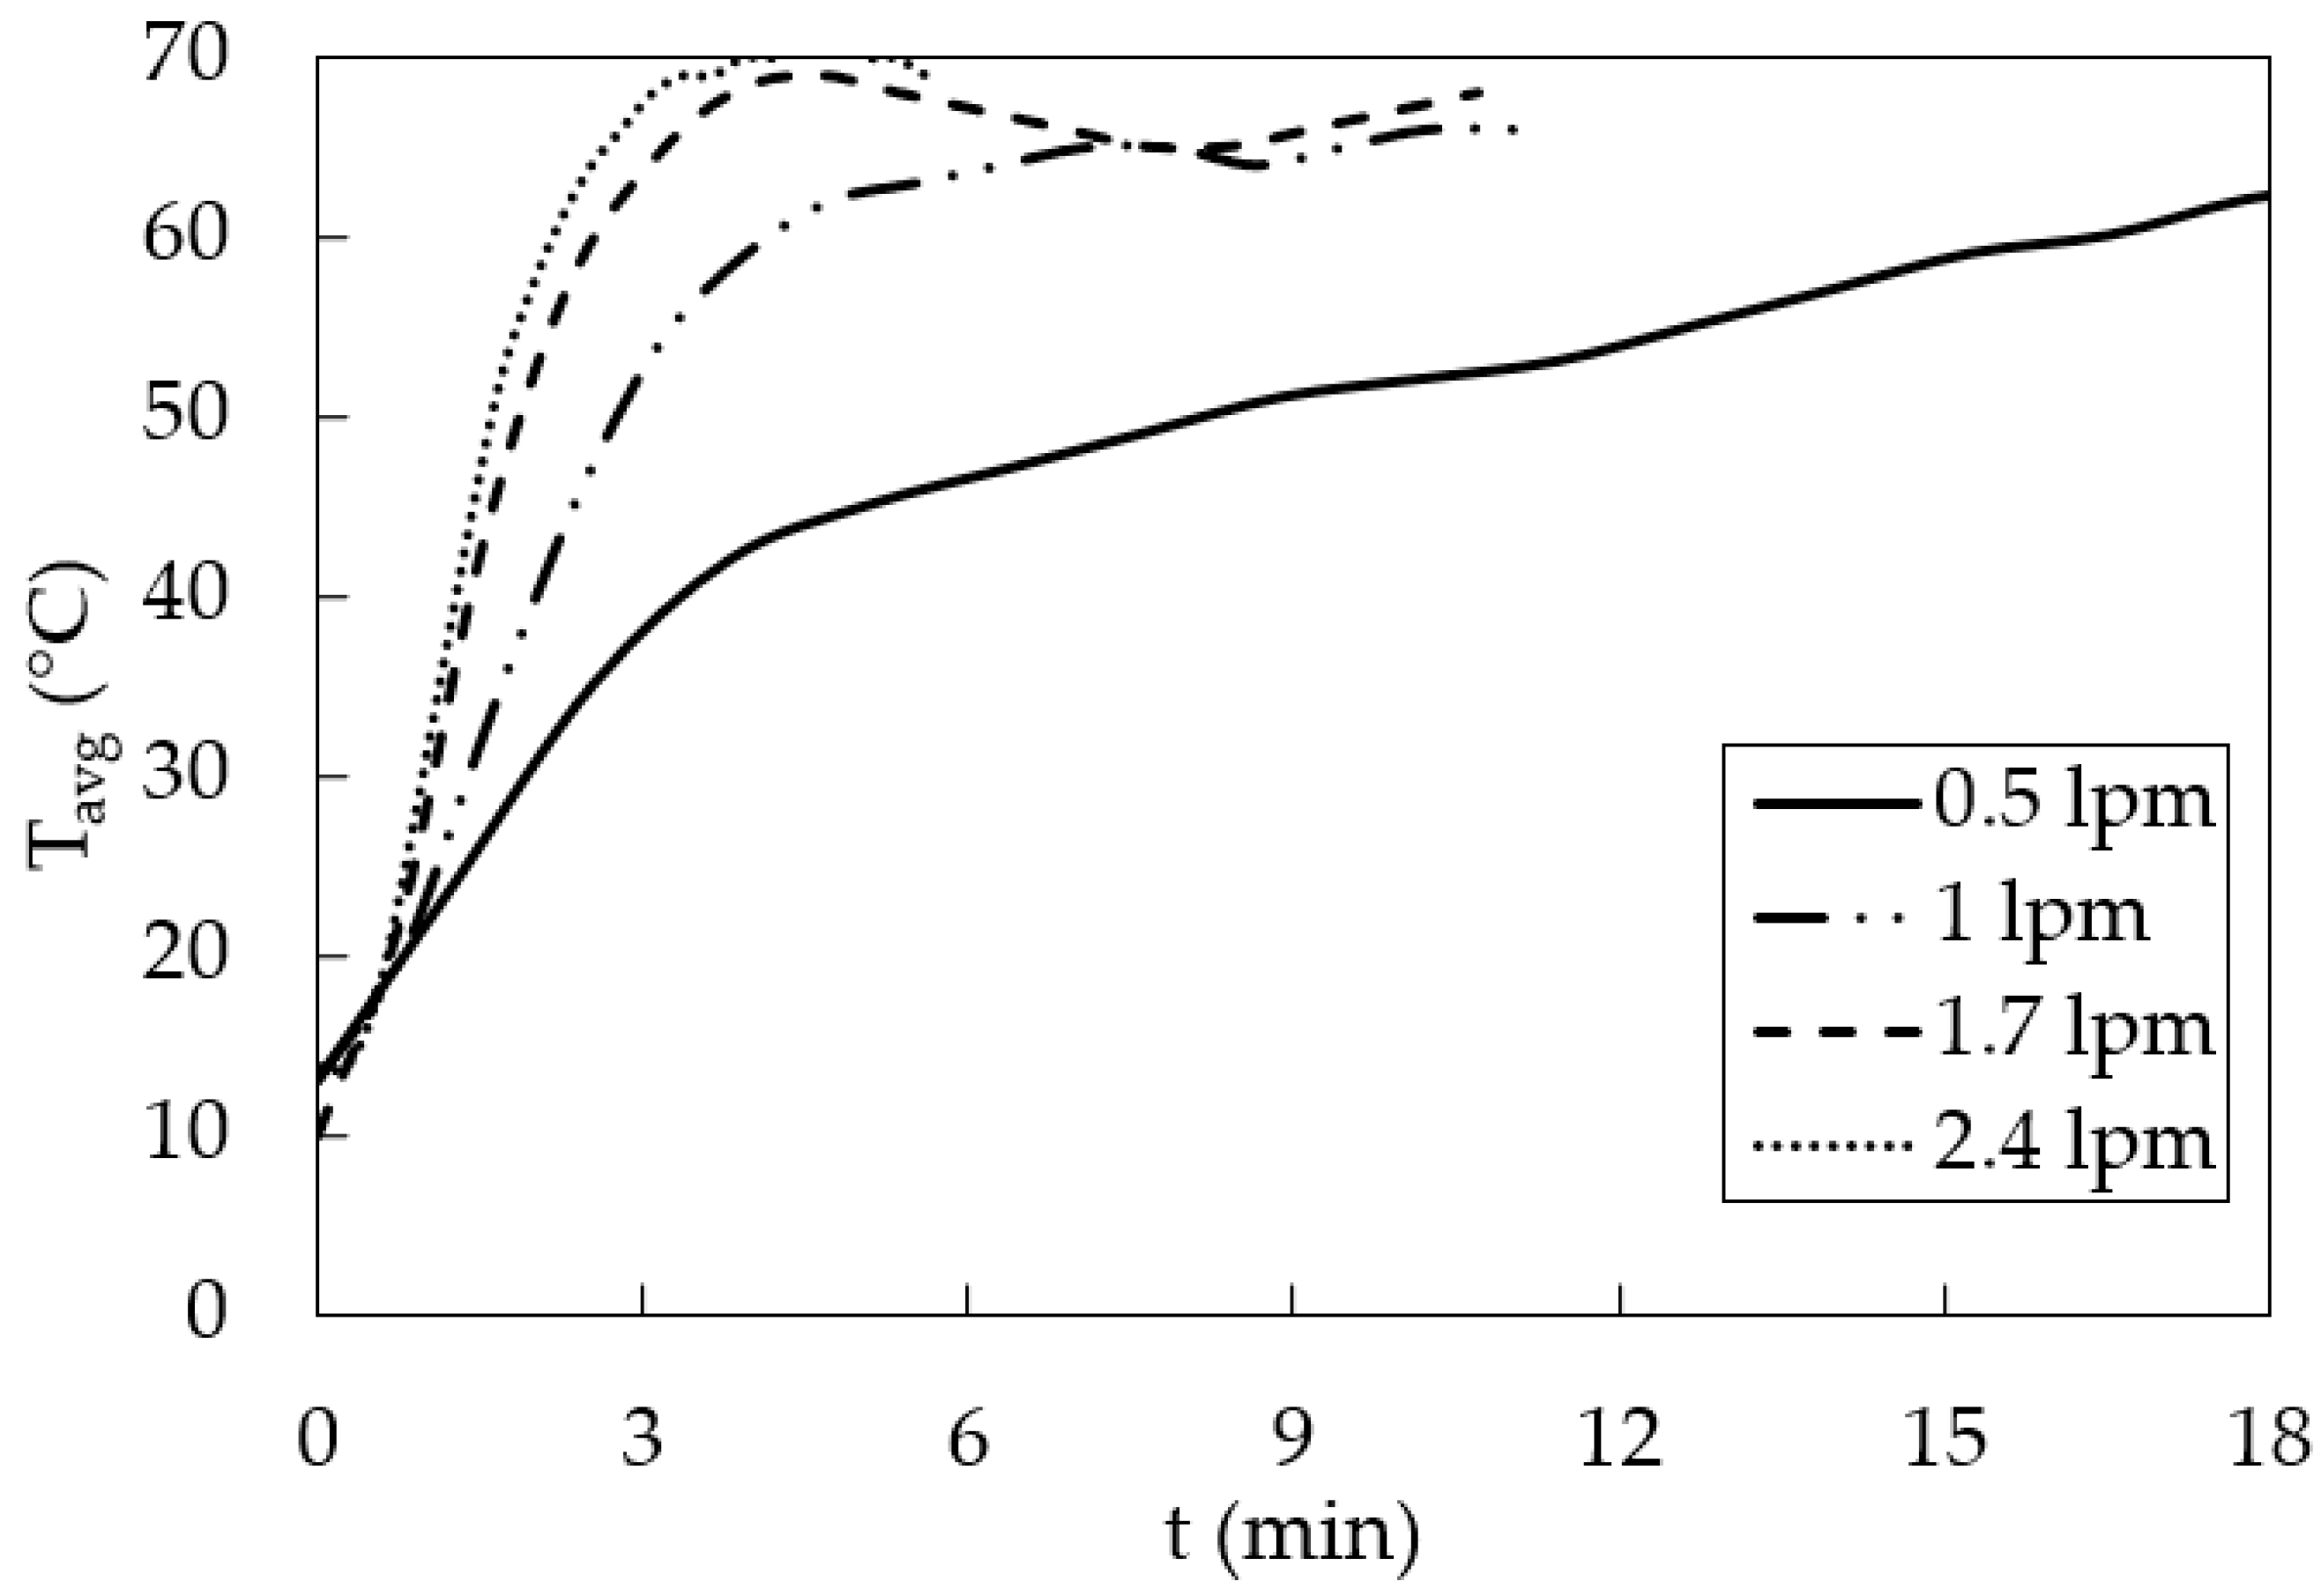
Considering the holistic view, Figure 11 depicts the variations in the average front surface temperature of the convector for different water mass flowrates considered in this study. Firstly, it can be seen that as the mass flowrate of water increases, the time taken by the convector to reach the maximum temperature decreases. Secondly, as the mass flowrate increases, the average surface temperature curves shift upwards in the figure, again indicating quick heat up of the convector. Another observation is that when the mass flowrate is 0.5 lpm, the average surface temperature does not reach 70 °C. This is because the data are shown for 18 min only; if the curves were plotted for a longer time period, the curve representing 0.5 lpm would reach 70 °C. The experimental investigations carried out in the present study did not consider a controlled environment through which the rate of energy dissipation to ambient air could be controlled and estimated, leading to a further reduction in the time to reach the steady-state thermal conditions and thus aiding in further dynamic thermal behavior analyses. However, it does provide a basis for potential integration of renewable energy resources, like geothermal energy, to be used for space heating purposes, leading to a reduction in the emissions from burning natural gas and a more sustainable heating system.

3.4. Novel Model for Predicting Thermal Characteristics of Domestic Convectors

When analyzing the relationship between dependent and independent variables, there are a variety of statistical approaches that can be used to understand the correlation between these variables [18,19]. One such approach that is being utilized here is Multiple Variable Regression Analysis (MVRA), which is a high-order technique [20,21]. The independent (predictor) variables are weighted relative to their contribution to the final predicted value, known as the response variable [22]. This allows for the analysis of data sets from multiple time series, leading to a predictive model for the response.
After carrying out a detailed local thermal characterization of a domestic convector, adequate data have been obtained in order to develop a prediction model for the average surface temperature of the convector. For this purpose, a multiple variable regression analysis has been carried out on the average surface temperature data presented in Figure 8 and Figure 11.
In this study, the predictor variable is Tavg while the response variables are Tset, m ˙ and time (t). Based on Tavg data, the prediction model is developed, which can be expressed as follows:
T a v g = 2 t m ˙ 1.95 T s e t 3
Certain checks need to be carried out in order to ascertain the validity of this prediction model. Firstly, we carry out a general test based on the observations made in Figure 8 and Figure 11. It has been discussed that as time increases, the average surface temperature of the convector increases because the water heats up the convector surface. This can be seen in the prediction model; the time (t) is in the numerator. Thus, the dissipation of thermal energy to the environment is proportional to time. It has also been discussed that as Tset increases, Tavg also increases (Figure 8). Tset in the prediction model is again a numerator. Lastly, based on Figure 11, as the mass flowrate of water increases, although the final/maximum average surface temperature is the same for the same Tset, at any given time instance (t), because of the gradients of Tavg curves, Tavg is higher. Thus, the mass flowrate is also in the numerator. Thus, generally speaking, it seems that the prediction model developed here is in line with the trends observed in this study. It must be noted that as t increases, and correspondingly, thermal energy is dissipated to the environment, the temperature of the space increases. This will result in a reduction of the temperature difference between the convector surface and the space, which will result in a reduction in the thermal energy dissipation to the environment. Thus, the temperature of the ambient environment is also a potential factor contributing towards space heating.
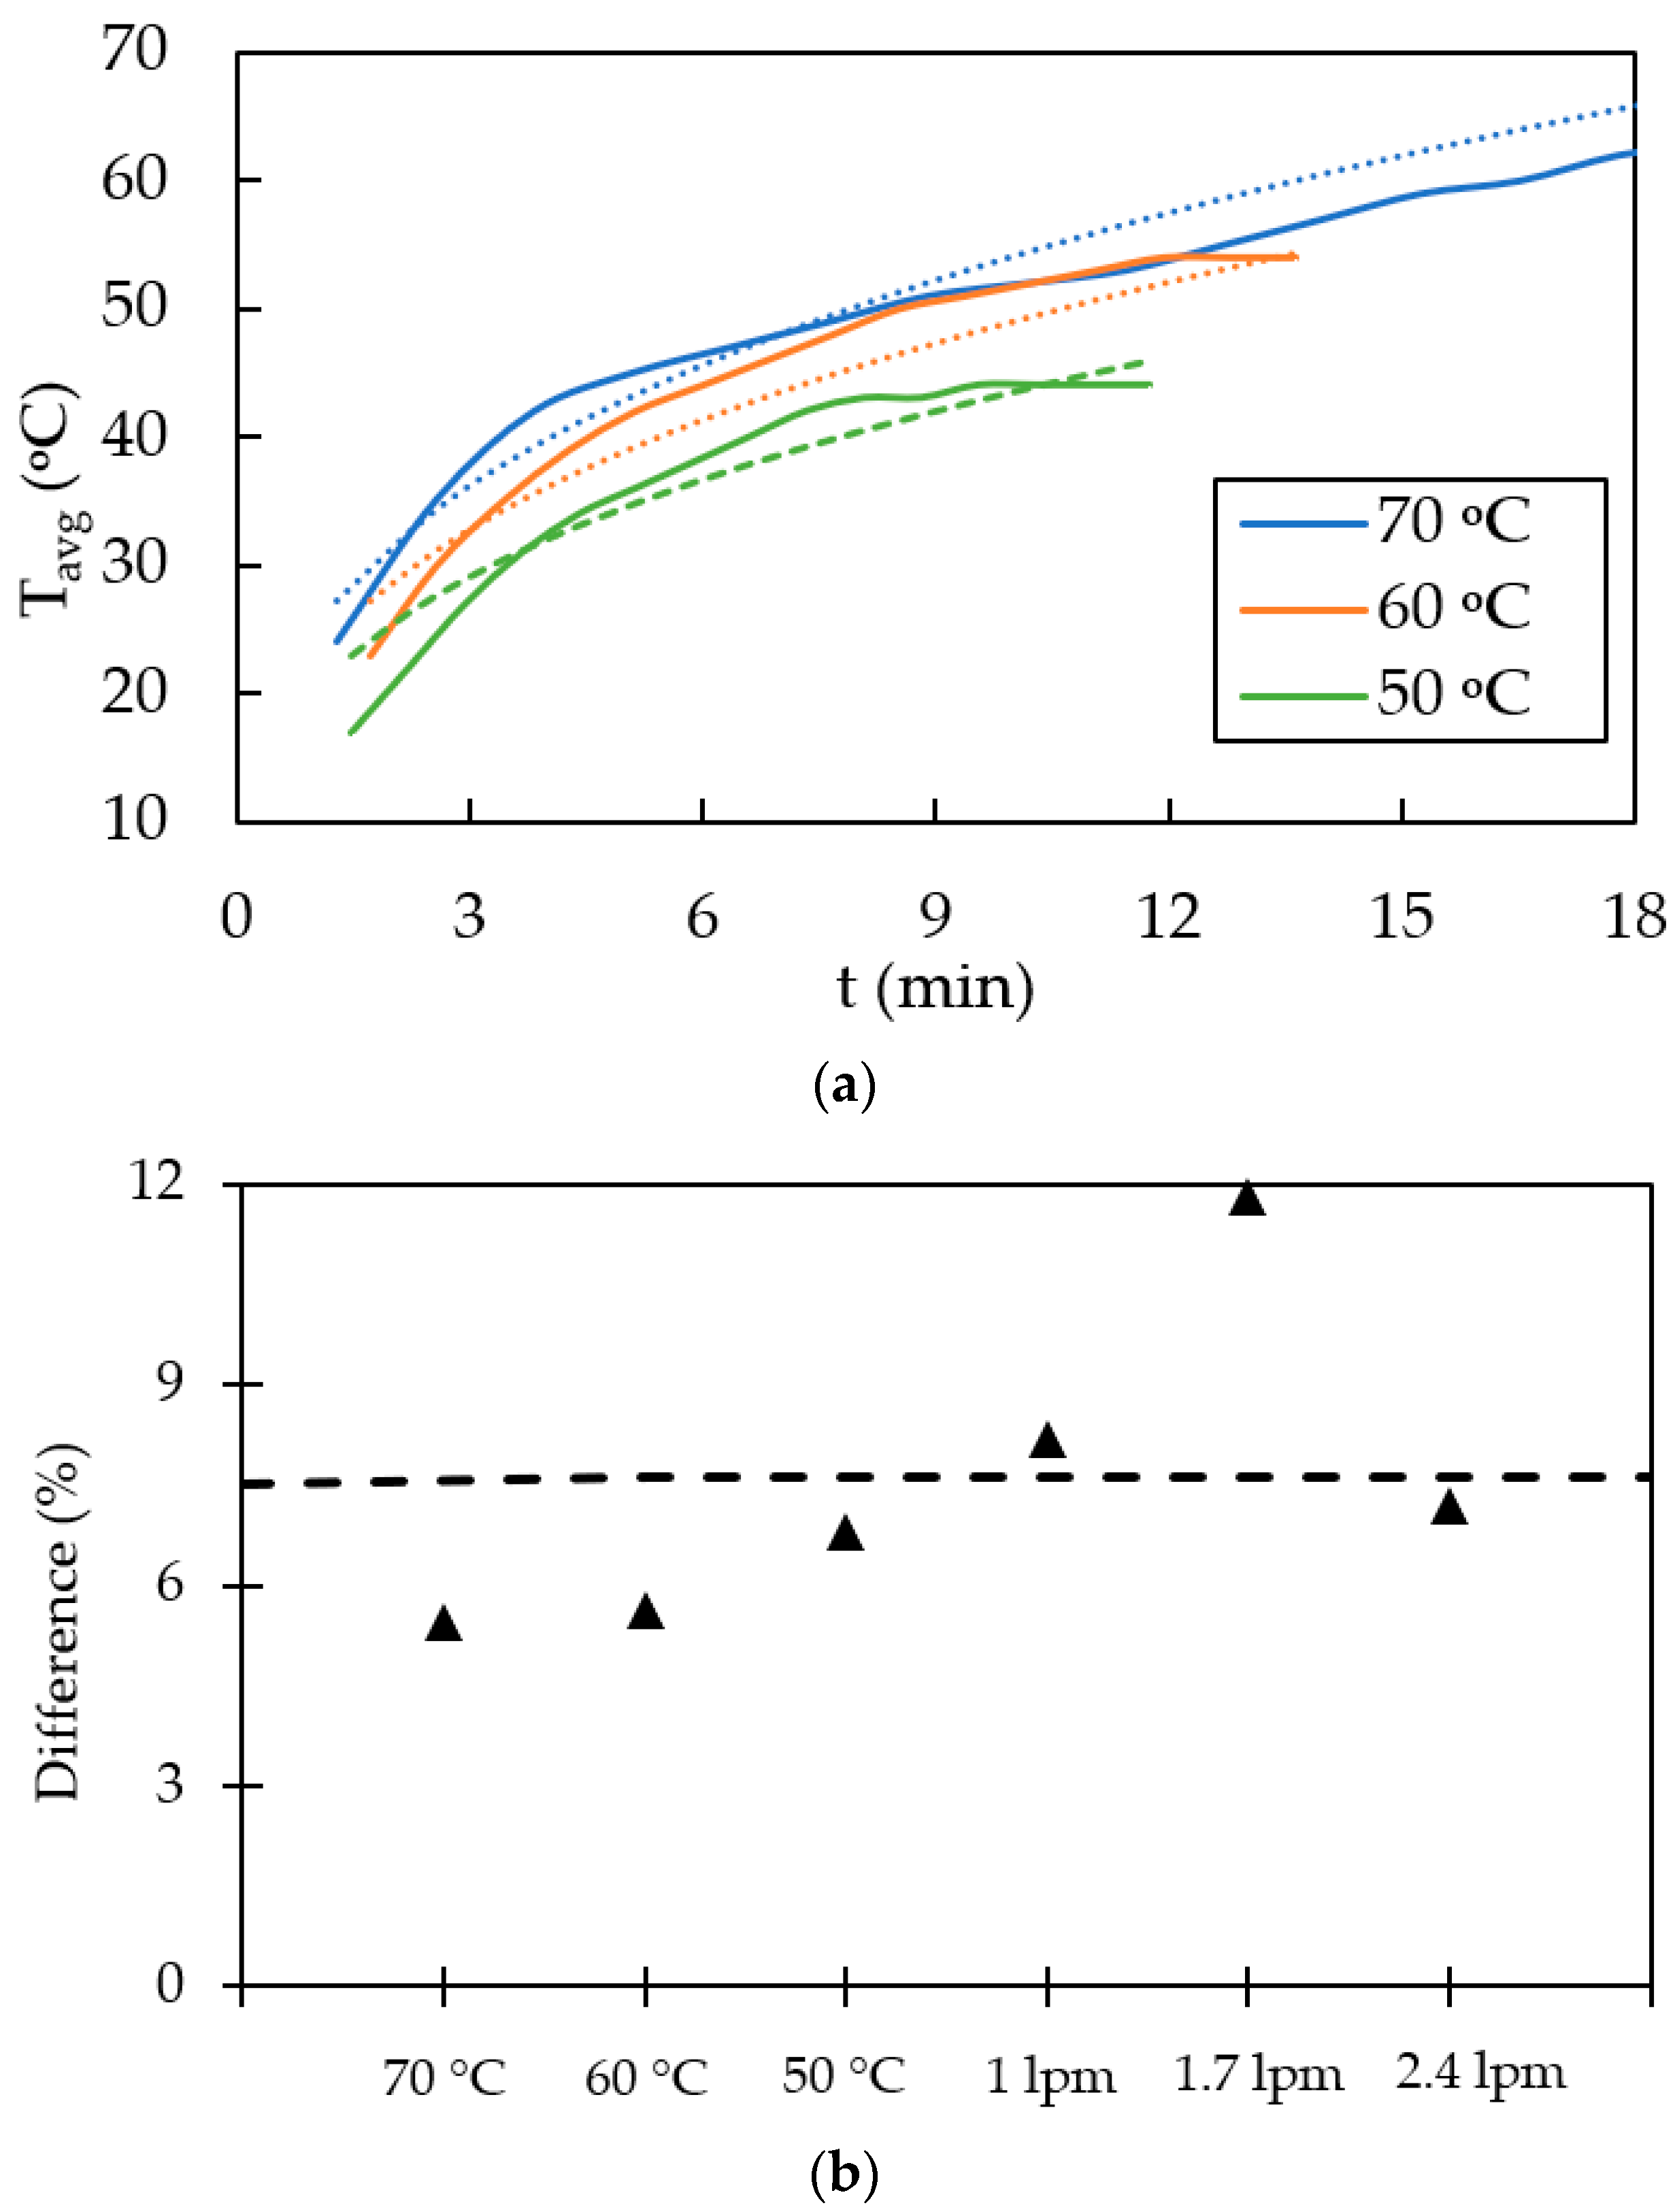
In order to validate the prediction model quantitatively, Tavg curves for Tset = 50 °C, 60 °C and 70 °C have been drawn and compared against the curves shown in Figure 8. This comparative data analysis is presented in Figure 12a. It can be clearly seen that the predicted Tavg matches closely with the recorded/calculated Tavg. Quantifying the differences between the calculated and predicted Tavg values, and also considering the effect of changing the mass flowrate of water passing through the convector, Figure 12b depicts the percentage difference, as defined in Equation (1), between them. It can be seen that the average difference between the predicted and calculated Tavg is 7.6% considering all the cases considered in the present study, thus confirming the validity of the developed prediction model.
It must however be noted that the results presented in this study are limited to (i) the range of parameters considered, (ii) the environmental conditions considered, (iii) the single panel convectors, and (iv) the heating cycle of the convectors only. It is envisaged that future investigations will include multiple convector types, more controlled environmental conditions and a broader range of flow and thermal parameters. Moreover, energy efficiency and sustainability analyses are also part of the future work.
4. Conclusions

Thermal characterization of domestic convectors has been carried out in the present study using infrared thermography. A bespoke test rig has been built for this purpose, fitted with a type 11 convector. Local temperature variations on the front surface of the convector have been recorded during the heating cycle of the convector. The effects of varying the water inlet temperature and mass flowrate have been investigated. Based on the results obtained, it can be concluded that as hot water enters a domestic convector, it rises to the top before descending through the different vertical flow channels, thus, convector heating takes place from top to bottom. It has been further observed that varying inlet water temperature has an insignificant effect on the thermal characteristics of the convector apart from the fact that the maximum surface temperature to be attained differs. Meanwhile, varying the water inlet mass flowrate has a profound effect on both the local and global thermal characteristics of domestic convectors. Increasing the mass flowrate of water substantially decreases the time taken by the convector to reach its maximum temperature. Based on these observations, a novel prediction model has been developed for the average surface temperature of the convector as a function of inlet temperature, mass flowrate and time. The developed model has been validated against the recorded data, demonstrating an accuracy of more than 90%. This prediction model can be used to develop novel machine learning tools for optimal flow control and energy efficient space heating.

Author Contributions

Conceptualization, T.A. and A.K.; methodology, T.A., D.G., J.O. and R.G.M.; formal analysis, D.G., J.O. and R.G.M.; investigation, D.G., J.O. and R.G.M.; resources, T.A. and A.K.; data curation, D.G., J.O., R.G.M. and T.A.; writing—original draft preparation, T.A., D.G., J.O. and R.G.M.; writing—review and editing, T.A. and A.K.; supervision, T.A. and A.K.; funding acquisition, D.G., J.O. and R.G.M. All authors have read and agreed to the published version of the manuscript.

Funding

This research received no external funding.

Data Availability Statement

Data are contained within the article.

Conflicts of Interest

The authors declare no conflicts of interest.

References

  1. BSI Standard EN-442; Convectors Part 1: Technical Specifications and Requirements. British Standards Institute: London, UK, 2014.
  2. Calisir, T.; Yazar, H.O.; Baskaya, S. Evaluation of flow field over panel radiators to investigate the effect of different convector geometries. J. Build. Eng. 2021, 33, 101600. [Google Scholar] [CrossRef]
  3. Shati, A.K.A.; Blakey, S.G.; Beck, S.B.M. The effect of surface roughness and emissivity on radiator output. Energy Build. 2011, 43, 400–406. [Google Scholar] [CrossRef]
  4. Ganesh, G.A.; Sinha, S.L.; Verma, T.N. Numerical simulation for optimization of the indoor environment of an occupied office building using double-panel and ventilation radiator. J. Build. Eng. 2020, 29, 101139. [Google Scholar] [CrossRef]
  5. Beck, S.B.M.; Blakey, S.G.; Chung, M.C. The effect of wall emissivity on radiator output. Build. Serv. Eng. Res. Technol. 2001, 3, 185–194. [Google Scholar] [CrossRef]
  6. Calisir, T.; Baskaya, S.; Yazar, H.O.; Yucedag, S. Experimental investigation of panel convector heat output enhancement for efficient thermal use under actual operating conditions. Eur. Phys. J. 2015, 92, 02010. [Google Scholar]
  7. Embaye, M.; Al-Dadah, R.; Mahmoud, S. Thermal performance of hydronic convector with flow pulsation—Numerical investigation. Appl. Therm. Eng. 2015, 80, 109–117. [Google Scholar] [CrossRef]
  8. Marchesi, R.; Fabio, R.; Claudio, T.; Fausto, A.; Gino, C.; Marco, D.; Giorgio, F. Experimental analysis of convectors’ thermal output for heat accounting. Therm. Sci. 2019, 23, 989–1002. [Google Scholar] [CrossRef]
  9. Dziergowski, M. Verification and Improving the Heat Transfer Model in Convectors in the Wide Change Operating Parameters. Energies 2021, 14, 6543. [Google Scholar] [CrossRef]
  10. Gritzki, R.; Felsmann, C.; Gritzki, A.; Livonen, M.; Naumann, J. Can we still trust in EN 442: New Operating Definitions for Convectors—Part 1: Measurements and Simulations. REHVA 2021, 1, 46–53. [Google Scholar]
  11. Aydar, E.; Ekmekci, I. Thermal Efficiency estimation of the Panel type Radiators with CFD Analysis. J. Therm. Sci. Technol. 2012, 32, 63–71. [Google Scholar]
  12. Beck, S.; Grinsted, S.; Blakey, S.; Worden, K. A novel design for panel convectors. Appl. Therm. Eng. 2003, 24, 1291–1300. [Google Scholar] [CrossRef]
  13. Calisir, T.; Yazar, H.O.; Baskaya, S. Determination of the effects of different inlet-outlet locations and temperatures on PCCP panel convector heat transfer and fluid flow characteristics. Int. J. Therm. Sci. 2017, 121, 322–335. [Google Scholar] [CrossRef]
  14. Myhren, J.; Holmberg, S. Improving the thermal performance of ventilation convectors—The role of internal convection fins. Int. J. Therm. Sci. 2011, 50, 115–123. [Google Scholar] [CrossRef]
  15. Ploskic, A.; Holmberg, S. Performance evaluation of radiant baseboards (skirtings) for room heating—An analytical and experimental approach. Appl. Therm. Eng. 2014, 62, 382–389. [Google Scholar] [CrossRef]
  16. FLIR A50 Smart Sensor. Available online: https://www.flir.co.uk/products/a50_a70-smart-sensor/?vertical=rd+science&segment=solutions (accessed on 26 January 2024).
  17. Asim, T.; Zala, K.; Mishra, R.; Conor, F.; Conor, S.; Mian, N.; Nsom, B. Thermal characterization of commercial electric radiators. Intern. J. Cond. Monit. Diagn. Eng. Manag. 2019, 22, 27–31. [Google Scholar]
  18. Freegah, B.; Asim, T.; Albarzenji, D.; Pradhan, S.; Mishra, R. Effect of the shape of connecting pipes on the performance output of a closed-loop hot water solar Thermo-syphon. In Proceedings of the 3rd International Workshop and Congress on eMaintenance, Lulea, Sweden, 17–18 June 2014. [Google Scholar]
  19. Freegah, B.; Asim, T.; Mishra, R. Computational Fluid Dynamics based Analysis of a Closed Thermo-Siphon Hot Water Solar System. In Proceedings of the 26th International Congress on Condition Monitoring and Diagnostic Engineering Management, Helsinki, Finland, 11–13 June 2013. [Google Scholar]
  20. Hoque, S.; Farouk, B.; Haas, C.N. Multiple Linear Regression Model Approach for Aerosol Dispersion in Ventilated Spaces Using Computational Fluid Dynamics and Dimensional Analysis. J. Environ. Eng. 2010, 136, 638–649. [Google Scholar] [CrossRef]
  21. He, Y.; Kou, F.; Wang, X.; Zhu, N.; Song, Y.; Chu, Y.; Shi, S.; Liu, M.; Chen, X. Hybrid model combining multivariate regression and machine learning for the rapid prediction of interior temperatures affected by thermal diodes and solar cavities. Build. Environ. 2022, 211, 108723. [Google Scholar] [CrossRef]
  22. Olive, D. Multiple Linear Regression. Linear Regression; Springer: Berlin/Heidelberg, Germany, 2016; pp. 17–83. [Google Scholar]
Figure 1. Type 11 domestic panel convector.
Energies 17 01017 g001
Figure 2. Domestic convector test rig (a) schematic and (b) experimental setup [(1) Cold water inlet (2) Water Tank (3) Thermal Camera (4) Power Supply (5) Domestic Convector (type 11) (6) Drain (7) PC with Software (8) Water Pump].
Energies 17 01017 g002aEnergies 17 01017 g002b
Figure 3. Local surface temperature data recording points on the domestic convector.
Energies 17 01017 g003
Figure 4. Variations in the local temperature on the front surface of the domestic convector at Tset = 70 °C and m ˙ = 0.5 lpm after (a) 1.3 min (b) 2.5 min (c) 6.4 min and (d) 17.8 min.
Energies 17 01017 g004aEnergies 17 01017 g004b
Figure 5. Variations in the local temperature on the front surface of the domestic convector at Tset = 70 °C and m ˙ = 0.5 lpm.
Energies 17 01017 g005
Figure 6. Variations in the local temperature on the front surface of the domestic convector at Tset = 50 °C and m ˙ = 0.5 lpm after (a) 2.2 min (b) 2.9 min (c) 5.1 min and (d) 10.3 min.
Energies 17 01017 g006
Figure 7. (a) Variations in the local temperature on the front surface of the domestic convector at Tset = 50 °C and m ˙ = 0.5 lpm and (b) difference in the normalized temperature between Tset = 50 °C and Tset = 70 °C.
Energies 17 01017 g007
Figure 8. Effect of varying Tset on the average surface temperature of the domestic convector at m ˙ = 0.5 lpm.
Energies 17 01017 g008
Figure 9. Variations in the local temperature on the front surface of the domestic convector at Tset = 70 °C and m ˙ = 2.4 lpm after (a) 0.3 min, (b) 1.4 min, (c) 2.2 min, and (d) 3.9 min.
Energies 17 01017 g009
Figure 10. (a) Variations in the local temperature on the front surface of the domestic convector at Tset = 70 °C and m ˙ = 2.4 lpm. (b) Difference in the normalized temperature between m ˙ = 2.4 lpm and m ˙ = 0.5 lpm.
Energies 17 01017 g010
Figure 11. Effect of varying m ˙ on the average surface temperature of the domestic convector at Tset = 70 °C.
Energies 17 01017 g011
Figure 12. (a) Comparison of Tavg between the recorded and predicted values. (b) Difference in the predicted and calculated Tavg values.
Energies 17 01017 g012
Table 1. Experiments conducted on the domestic convector.
Inlet Water Temperature (Tset); °CMass Flowrate of Water ( m ˙ ); lpm
700.5
600.5
500.5
701.0
701.7
702.4
Disclaimer/Publisher’s Note: The statements, opinions and data contained in all publications are solely those of the individual author(s) and contributor(s) and not of MDPI and/or the editor(s). MDPI and/or the editor(s) disclaim responsibility for any injury to people or property resulting from any ideas, methods, instructions or products referred to in the content.