Article

Preparation of Samples for the Study of Rheological Parameters of Digested Pulps in a Bioreactor of an Agricultural Biogas Plant

1
Institute of Environmental Engineering, Wrocław University of Environmental and Life Sciences, ul. Norwida 25, 50-375 Wrocław, Poland
2
Department of Hydraulic and Sanitary Engineering, Poznan University of Life Sciences, ul. Wojska Polskiego 28, 60-637 Poznan, Poland
3
Department of Biosystems Engineering, Poznan University of Life Sciences, ul. Wojska Polskiego 28, 60-637 Poznan, Poland
*
Author to whom correspondence should be addressed.
Energies 2024, 17(4), 965; https://doi.org/10.3390/en17040965
Submission received: 19 January 2024 / Revised: 12 February 2024 / Accepted: 12 February 2024 / Published: 19 February 2024
(This article belongs to the Section A: Sustainable Energy)

Abstract

:
The studies of the rheology of digested pulp from agricultural biogas plants have often been fragmentary and non-standardised due to their complexity and time-consuming nature. As a result of measurements, it was possible to develop a procedure and range of measurements for the correct determination of the parameters of the carrier substance. The applicability of the coaxial cylinder measurement system was demonstrated for assessing the rheological parameters of digested pulp from a fermenter that utilises agricultural biomass. To determine the characteristics of solid particles, the Zingg diagram was used, inter alia, allowing the comparison of particles from each fraction. The analysis of the shape and size of solid particles may help to describe the onset of motion of this phase, flow type, or sedimentation type. The authors propose a completely new research approach to obtain an appropriate, repeatable test conditions of medium, which is the carrier liquid from the biogas plant reactor. The proposed methodology and the scenario of the entire study make it possible to achieve scalable and comparable test results in any laboratory. The proposed solution eliminates the influence of most external factors on the sample and rheological measurements, and the effectiveness of the presented procedure was confirmed in tests.

1. Introduction

Because of environmental and sustainability issues, renewable energy sources are becoming increasingly important [1,2,3]. In the structure of renewable energy production in Poland, biomass energy production is of growing significance [4,5]. Biogas plants are the steadiest sources of renewable energy, as they convert the chemical energy in biomass into biogas and further into electricity and heat through the methane fermentation process [6,7]. This makes them the only renewable energy sources (RES) that are completely independent of the time of day, weather, lack of precipitation, or season. Thanks to the possibility of collecting and converting biogas into electricity and heat, they can play an important role in stabilising local power and heating systems, and their position in the perspective of the policies of European Green Deal, Fit for 55, and REPowerEU, among others, will be becoming even more prominent [1,8,9].
Owing to the use of a variety of types of biomass, energy generation in biogas plants is much more complicated than in other types of RES such as photovoltaics, wind, or hydroelectric power plants [10]. The reason for that is the very large variety of substrates being used, which even within the same group (e.g., silage) may differ significantly in individual physical and chemical parameters, which is reflected in the course and efficiency of the biogas production process [10,11,12]. The efficiency of the fermentation process is even more strongly influenced by the way the digested pulp is stirred in the digesters of the biogas plant. As it turns out, in the nearly 20 thousand biogas plants operating in Europe, it is inefficient stirring that is often the cause of the greatest technical problems [13]. Stirring of the digested pulp, on the one hand, is energy-intensive with excessive stirring reducing fermentation efficiency [7,14,15,16,17]. On the other hand, insufficient stirring can decrease biogas plant efficiency and can even result in failure due to the formation of bottom sludge and thick and hard scum on the surface of the fluid (Figure 1).
Designing the fermenters and selecting the correct, efficient method of stirring requires consideration of the physical properties of the digested pulp, as these in particular (in addition to the geometry of the tank) affect the speed and rate of stirring, as well as the distribution, shape and number of stirrers [18,19,20].
In many cases, a biogas plant’s operation is further optimised based on ongoing measurements of fermentation parameters such as dry matter and organic dry matter content, pH, ammoniacal nitrogen content or the FOS/TAC ratio. However, even a constant analysis of these parameters is not sufficient to ensure the high performance of a biogas plant with an inadequately designed stirring system. During anaerobic digestion, the substrate must be stirred to avoid sedimentation or flotation of the substrate, while ensuring maximum gas production with minimum power consumption [18].
Some results from recent studies indicate that even as much as 50% of internally consumed electricity is used for stirring processes [21] with even less than 50% of the total volume of the fermenter being effectively stirred [22,23]. Some researchers claim that even as much as 70% of electricity can be saved if the stirring system is properly designed and operated [24].
The identification of optimal stirring methods should take into account the rheological properties of the digested pulp [25,26]. The literature reports a number of studies of digested pulp from agricultural biogas plants that approach its rheological properties most often by means of a power law model, in which the consistency constant and flow index were fitted to particular experimental data sets. However, these values may not be valid for apparently similar cases and cannot be easily transferred to other conditions due to the varying content and characteristics of solid particles. This concerns particle shape and particle size distribution (particle quantity, particle size and the associated particle size distribution). In particular, variations within the shapes of particles can cause rheological parameters to change by orders of magnitude [27,28,29]. Studies have shown that both the measurement conditions (e.g., temperature) and the measurement range of the deformation gradient, as well as the equipment used, must be clearly defined in order to determine rheological parameter values [27].
The rheological properties of a substance are defined by a description of the deformation under shear stress. The known experimental techniques for the determination of rheological properties include the study of substances with a high content of solid particles taking into account their heterogeneity in terms of particle structure and size [30,31]. This is particularly important for complex organic or biological fluids. Research problems, in this case, include the resolution/range of the measured stress and deformation, the inertia of the instrument (if stress and deformation are measured at the same boundary), the inertia of the fluid and possibly secondary flows, surface tension, slip at boundaries, sample underfill or overfill, gap size, or sample inhomogeneity due to settling, migration or rheotaxis [32,33].
The macro approach used in many studies [34,35] involves determining the rheological properties of the digested pulp for all components together, i.e., without a separate analysis of the effects of individual particle groups and fractions. On the other hand, particles, depending on their proportion in the mixture, shape, and size, can significantly affect the rheological parameters.
Conventional viscosity measuring devices such as capillary viscometers and rotational rheometers and torsion viscometers can be used to test the carrier fluid, depending on the particle size. The use of many classical methods known from the food and pharmaceutical industries is impractical with large particles dispersed in the carrier fluid, which get jammed in the measuring slits of rheometers [27]. Such rheometers offer no possibility to test digested pulp taken from the fermenter if it is not treated prior to testing. Such treatment in many studies consisted of separating large-sized particles on sieves or in a centrifuge, or crushing them (e.g., in mills) to enable reproducible results within measurement campaigns [27]. The maximum particle size determines the performance of rheological tests in conventional instruments, and different recommendations for particle size can be found in the literature. It is recommended to leave a particle size of no more than 0.44 mm (after grinding), 7 mm (after sieving) with [36] recommending limiting the particle size to a maximum of 1.7 mm. According to Mezger, particle size should not exceed 10% of the measuring slit width in a slit rheometer [37]. Brehmer and Kraume [37] recommend eliminating solid particles to less than 6% of the solution volume, as they otherwise transfer part of the shear stress from the fluid, through friction, to the walls of the rotameter, causing overestimation of resistance and thus inaccurate determination of the rheological parameters. Brehmer and Kraume [37] also point out that long fibrous particles get wrapped around the vane shaft preventing precise measurement in a rheometer with a large slit. The adhesion of digested pulp particles to the walls is also a problem in other measurement methods, which are only theoretically less sensitive to particles of a few mm in size. In practice, particles adhering to the internal components deform the surface, and therefore, the calculated deformation–torque relationships are falsified.
Measuring the properties of carrier fluid including large particles requires the use of rheometers that allow the particles to move freely in the carrier fluid [27]. They include ball measuring system (BMS) viscometers [35,38], large-scale rheometers, pipe rheometers, and mixing rheometers with a helical stirrer, which are based on the concept of Metzner and Otto. The indicated methods for determining rheological parameters with particles require the determination of correlation parameters for specific particles suspended in the carrier fluid. This is a parameter that is difficult to achieve considering the wide variety of substrates used in agricultural biogas plants.
Non-ideal conditions can translate into misinterpretations of the results, such as the observation of spurious dilution and thickening under shear for a fluid that is in fact a Newtonian fluid in the range of test conditions [39]. Avoiding spurious data is a major challenge for complex fluids in general, and in particular for biological fluids [40]. A number of papers have provided examples of shear stress measurement errors depending on the deformation gradient [41]. These include the experimental limitations of measuring shear stress values [42]. Such limitations are particularly true in the measurement of complex biological fluids, as they often contain colloidal, low-viscosity substances and may even exhibit activity (such as floating microalgae) or have surface-active components that modify the liquid–air interface [32].
Knowledge of the parameters of the hydrated biomass involved in anaerobic digestion is an important factor in optimising the production process of biogas as one of the key feedstocks in the energy transition based on renewable resources [2,3]. In particular, it is difficult to characterise the rheological parameters of digested pulps [43] with high total solid content [44] and their behaviour at different temperatures [45]. The very issue of investigating the rheological properties of organic sludge, in the opinion of many authors, appears to be crucial in terms of describing the behaviour of the sludge during its treatment process [46,47].
To date, direct studies of the rheology of sludge and carrier material from biogas plants have been limited due to, among other things, low availability of facilities and digested pulp material making it difficult to test on actual biomass [48]. Occasional studies have analysed tracer dispersion [49,50] to identify closed loop flows and to estimate the size of biomass scum stagnation zones. However, these studies are too complex and time-consuming to be carried out during stirring in plants in real-life settings [8].
This paper aims to present a methodology for assessing the rheological parameters of digested pulp from an agricultural biogas plant, where, as a result of previous measurements, it has been possible to develop a procedure and range of measurements to correctly determine the rheological parameters of selected models of digested pulp. A literature analysis has shown that there is no structured procedure for measuring the rheological properties of carrier fluid in a bioreactor. And the available procedures [51] are basically concerned with determining the quality of the fermentation capacity of the organic matter. The research was aimed at solving the problem encountered by our research team, i.e., the lack of repeatability of results during rheological tests of the bioreactor carrier liquid. Based on experience, the research procedure presented in this publication was implemented. The methodology proposed and the scenario of the entire study will enable scalable and comparable test results to be achieved in any laboratory. The proposed solution eliminates the influence of most external factors on the sample and rheological measurements, and the effectiveness of the presented procedure was confirmed in tests.

2. Test Object—Agricultural Biogas Plant

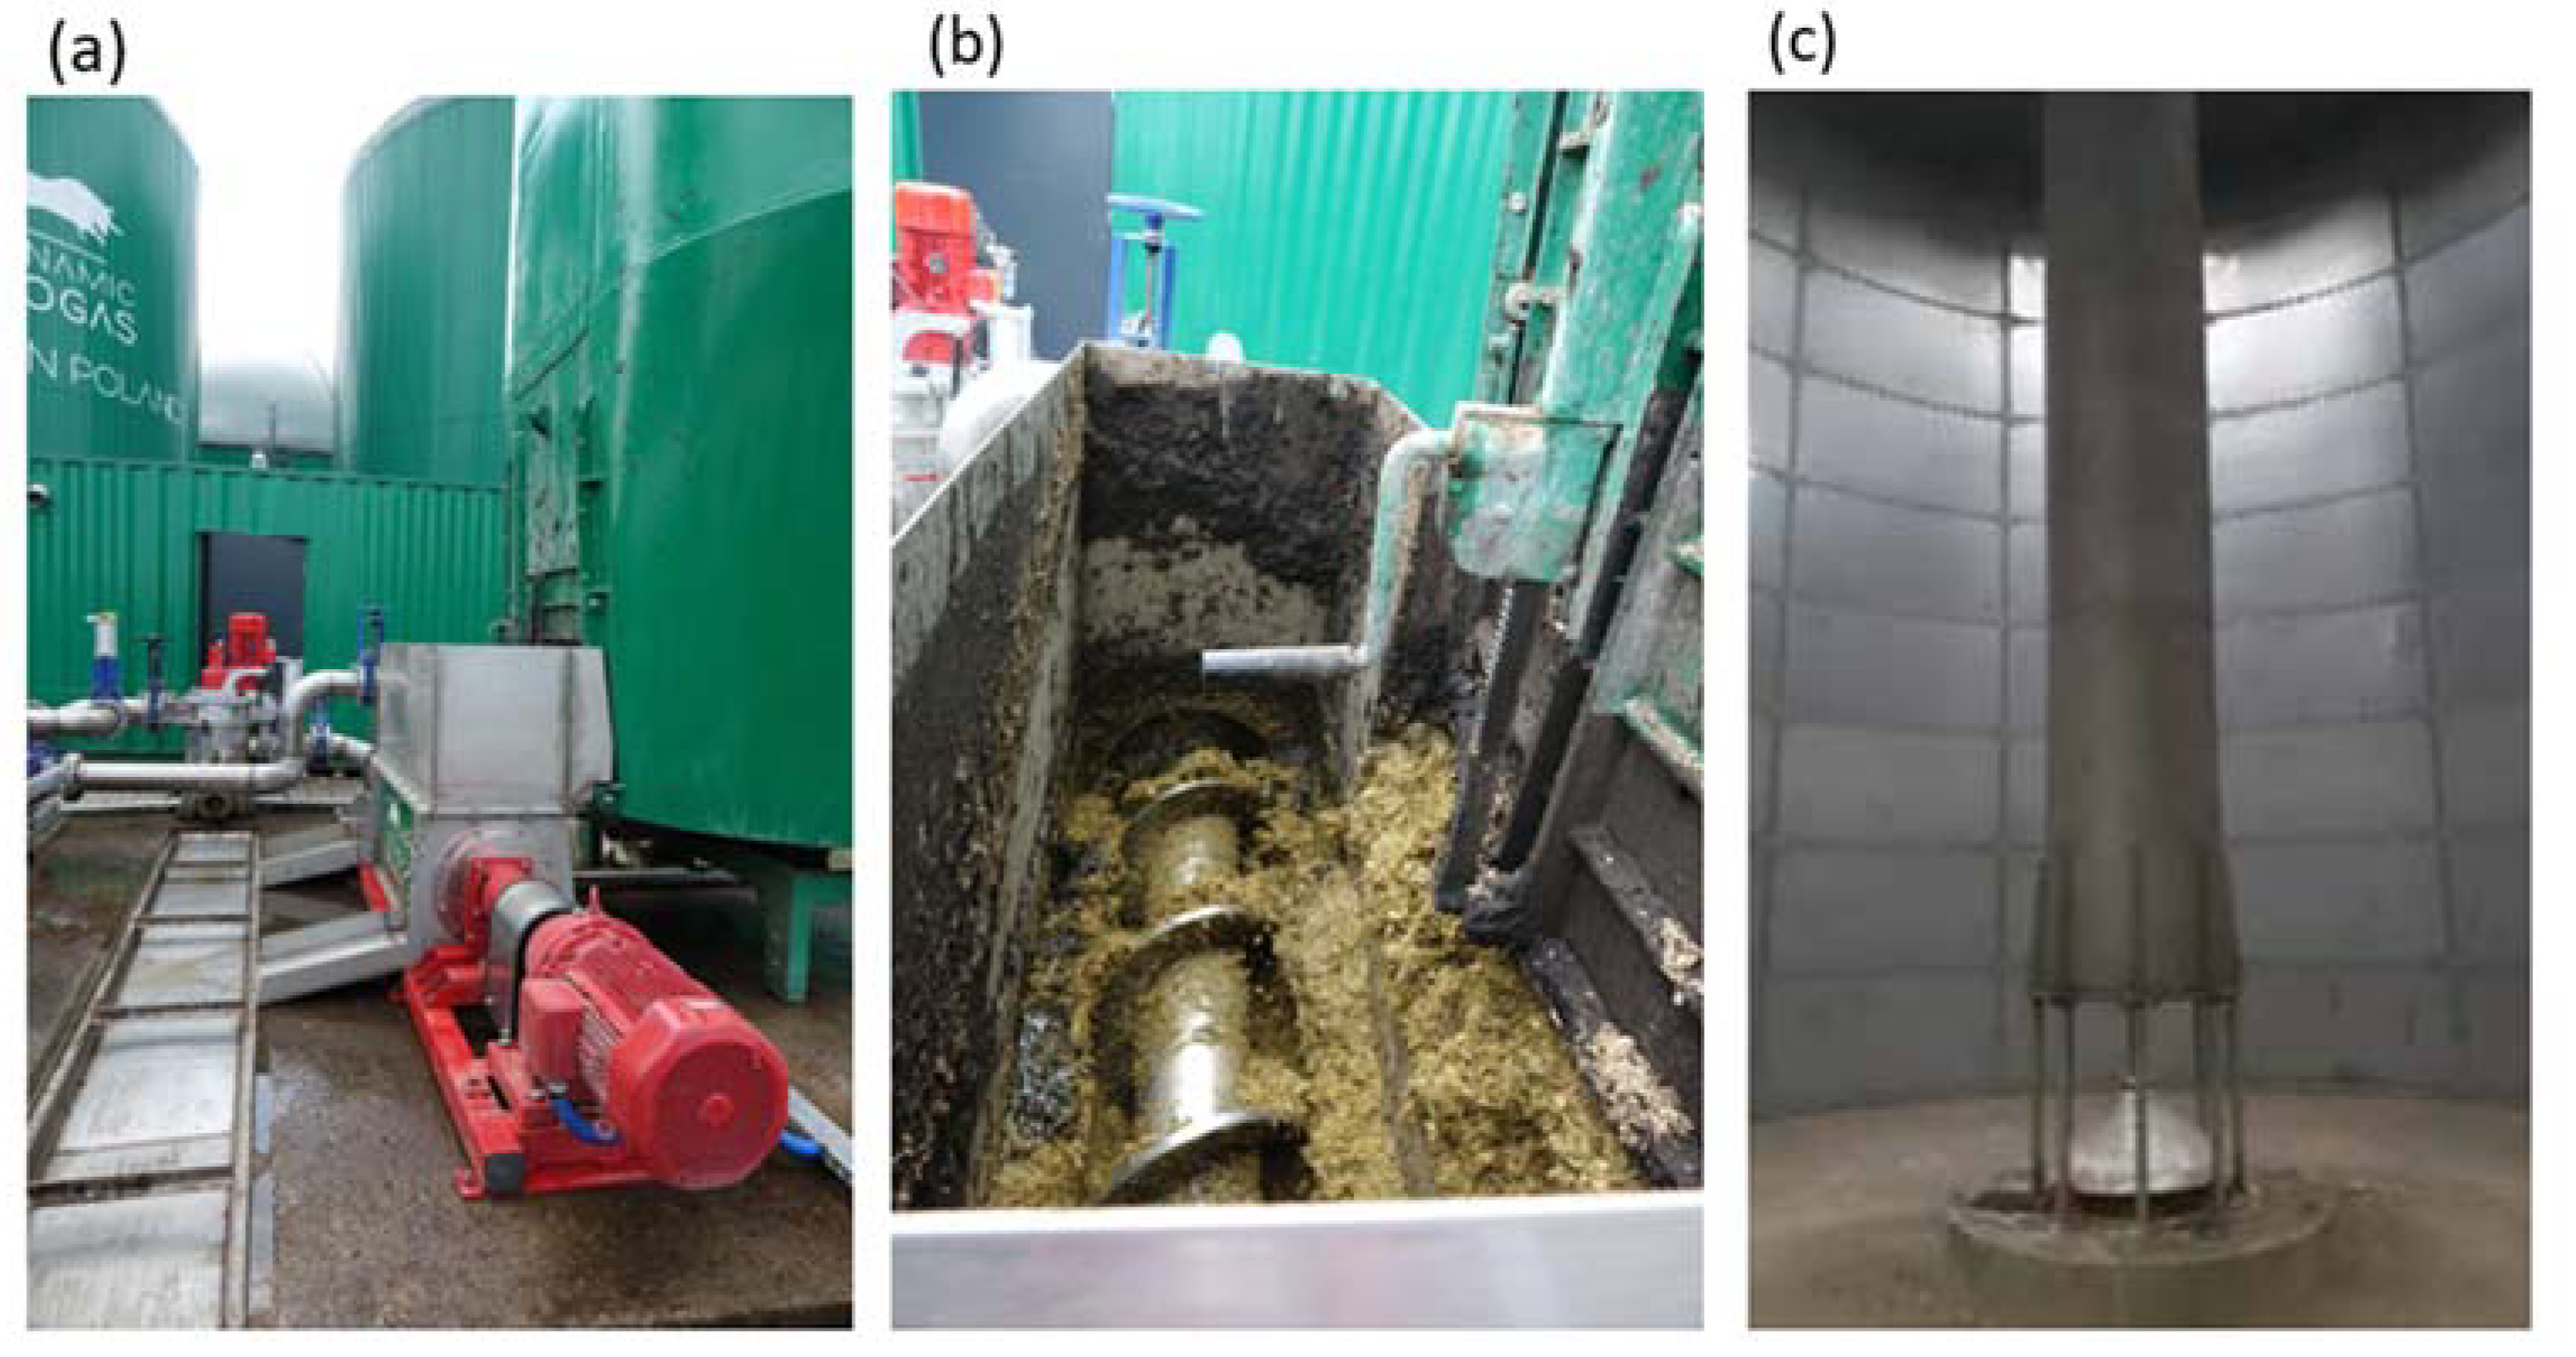
The test object was digested pulp from an agricultural biogas plant at the Agricultural and Orchard Experimental Farm in Przybroda (Poland, Wielkopolska Province). The facility belongs to the Poznań University of Life Sciences (Figure 2). The total installed capacity of the plant is 0.499 MW, with an annual production capacity of up to 4200 MW. The biogas plant was commissioned in 2019. The fermentation technology used here offers high efficiency in the process of biogas production. It also enables the use of a very wide range of substrates from agriculture and processing. This is made possible by a very low failure rate, which is ensured among other things by a fail-safe stirring system with a single central stirrer (Figure 3a–c). The entire structure is modular, based on bolted-on-site stainless steel tanks.
The fermentation tanks (two—No. 1 and No. 2) are cylindrical, vertical steel tanks with wall heating. The operating system (at that time) was a single-stage, two-chamber system, working with a post-fermentation tank (hence the recirculated overlying fraction to the macerator described above). In the central part there is a propeller-type vertical mixer, enabling the suction of the near-surface layer into the interior of the duct and transport towards the bottom (Figure 3a–c). This solution contributes to very good mixing of the reactor contents, without the formation of the so-called dead zones.
At the centre of the digestion tanks there are vertical pipes in which propeller stirrers are installed to force the digested pulp to flow. Substrates are fed every hour into Fermenter No. 1, and at the same time, an equivalent amount of digested pulp from Fermenter No. 1 is pumped into Fermenter No. 2 and from Fermenter No. 2 into the digested pulp tank. The average length of time the substrate remains in Fermenter No. 1 is 18–24 days, similarly in Fermenter No. 2. It should be emphasised that all pumping operations, from the liquid substrate preliminary tank to the return of the digested pulp to the macerator, are carried out using only one, very easily accessible and quickly replaceable pump. Unlike typical biogas plants, the digested pulp tank is equipped with a heating system that maintains the temperature of the digested pulp at a minimum of 20 °C (in practice 38–42 °C).
The operation of the biogas plant is based on the production of biogas as a result of the decomposition of available organic waste (on average 30.7 tons per day), the majority of which is (in variable proportions): distillery stillage—approx. 40%; turkey slaughterhouse sludge—approx. 20%; distillery syrup—approx. 15%; and stomach contents—approx. 10%. Other waste—defective products or waste: feed, chaff, residues from plant food production and slurry and/or manure—represents a total of approx. 15%.
The above-mentioned substrates are transferred to the dosing unit, which is equipped with a macerator that allows the grinding of the solid fraction and its homogenization in combination with the liquid fraction (recirculation of liquid digestate). This solution enables easy pumping of substrates (average dry matter content around 12%) and intensifies biotechnological processes in fermenters (initial inoculation with microorganisms).

3. Inspiration for Research

The first study of the rheological parameters of the fermenting digested pulp of the Przybroda biogas plant was carried out in 2021 by scientific teams from the University of Life Sciences in Poznań and the Wrocław University of Environmental and Life Sciences. The original intention of the authors was to obtain the rheological parameters of the fermenting digested pulp in order to carry out later studies of model reactors using computational fluid dynamics (CFD). The use of CFD computational techniques, taking into account the properties of the non-Newtonian fluid, gives a chance for energy optimization of the fermenting digested pulp mixing conditions in the reactors.
The study was conducted in cycles under different configurations of sample preparation, temperature, concentration, and the age and storage of the sample. In the interpretation of the flow curves of the collected samples, a very serious problem was encountered regarding the repeatability of the results. Strong influences were observed for the following factors: age of sample, volume of sample taken, heating time, transport time, storage time, storage temperature, sample-forming particle size, and sample preparation.
The flow curves obtained during the measurements were described by three selected models (Table 1) [52], i.e., the two-parameter Bingham model and the Ostwald–de Waele model, as well as the three-parameter Herschel–Bulkley model. Selected models are most often used in CFD studies of non-Newtonian fluids. The tested fluid is non-Newtonian, so the Newtonian model could not be used to describe the flow. Rheological parameters were calculated for real flow curves using the least squares method.
For example, Table 2 presents the results of fitting the parameters of the selected rheological models to the results of flow curves of samples from Fermenter No. 2 and the lagoon from the two measurement campaigns carried out on 12 June 2021 and 13 June 2021. It was expected to obtain similar results of rheological parameters due to the similar composition of the fermentation pulp and operating conditions of the bioreactors. During the test, the same sample temperature was used as in the bioreactor, i.e., 32 °C, but very different results were obtained for the rheological parameter values of the selected models. The results were compared by determining the relative percentage error.
The largest differences for the values of the rheological parameters were obtained for the samples taken from Fermenter No. 2. For the Bingham model, the flow limit value differed by a percent error (PE) of about 65%, and for the Ostwald–de Waele model, the viscosity of the Bingham model differed by 60%. The value of the solid consistency differed by about 80% and the flow index by 67%. In contrast, the determined parameter values of the Herschel–Bulkley model differed by 287% for the flow limit, 99% for solid consistency, and 138% for flow index. The relative error value for the samples taken from the lagoon was approximately a half of that.
Table 1 shows the values of the parameters for evaluating the fit of the rheological model to the flow curve, i.e., coefficient of determination R2, mean absolute error (MAE) and mean absolute percentage error (MAPE). Maximum R2 values were obtained with the description of the lagoon sample for the second measurement campaign, where a value of approximately 0.98 was obtained. In contrast, the lowest values for the parameter were obtained for the second campaign of samples from Fermenter No. 2, i.e., 0.88. The mean absolute error (MAE) did not exceed 3.5 Pa, while the mean absolute percentage error (MAPE) was 21% for all analysed samples.
The parameters describing the fit of the models to the flow curves demonstrate the high quality of the fit of the rheological models to the measured flow curves, and the scatter in the results is most likely due to factors that were not identified during sample collection, transport, storage, and preparation. Adherence to the study procedures described in this publication is believed by the authors to eliminate factors that may have caused a significant discrepancy in the results. One of the most important conclusions from the analysis of the parameter value results of the selected rheological models is the strongly non-Newtonian nature of the tested fluids. Problems with comparing the values of the rheological parameters of the models describing the flow curves and the lack of certainty about the parameters affecting the experimental results led the two scientific teams to systematise the process of describing the rheological properties of the digested pulp, based on previous experience.
Digested pulp can be described as a hydromixture (suspension) consisting of solid particles suspended in a liquid. In fluid mechanics, in general, there is two-phase or multiphase flow: a liquid phase (liquid and/or gas) and a solid phase. When solid particles are evenly distributed within the suspension volume, it is considered homogeneous, and otherwise heterogeneous. Hydromixture can exhibit rheological behaviour similar to a Newtonian fluid or display various non-Newtonian rheological properties [53]. The flow of such a mixture depends on various factors: flow direction, conduit dimensions, flow velocity, particle size, particle size distribution, particle density, particle shape, and solid concentration [54]. Also, the properties of the fluid–particle interface and phase boundaries, which are determined by the liquid and solid composition, should be taken into account. Particles smaller than 75 μm can affect the rheological properties of the carrier fluid. Particles larger than this criterion do not affect the rheological properties of the carrier fluid and are only transported by it. The critical particle size range for particles forming a hydromixture falls within 50–75 μm [55,56,57]. Therefore, the proposed methodology includes the separation of particles larger than 75 μm from the carrier fluid.

4. Proposed Methodology

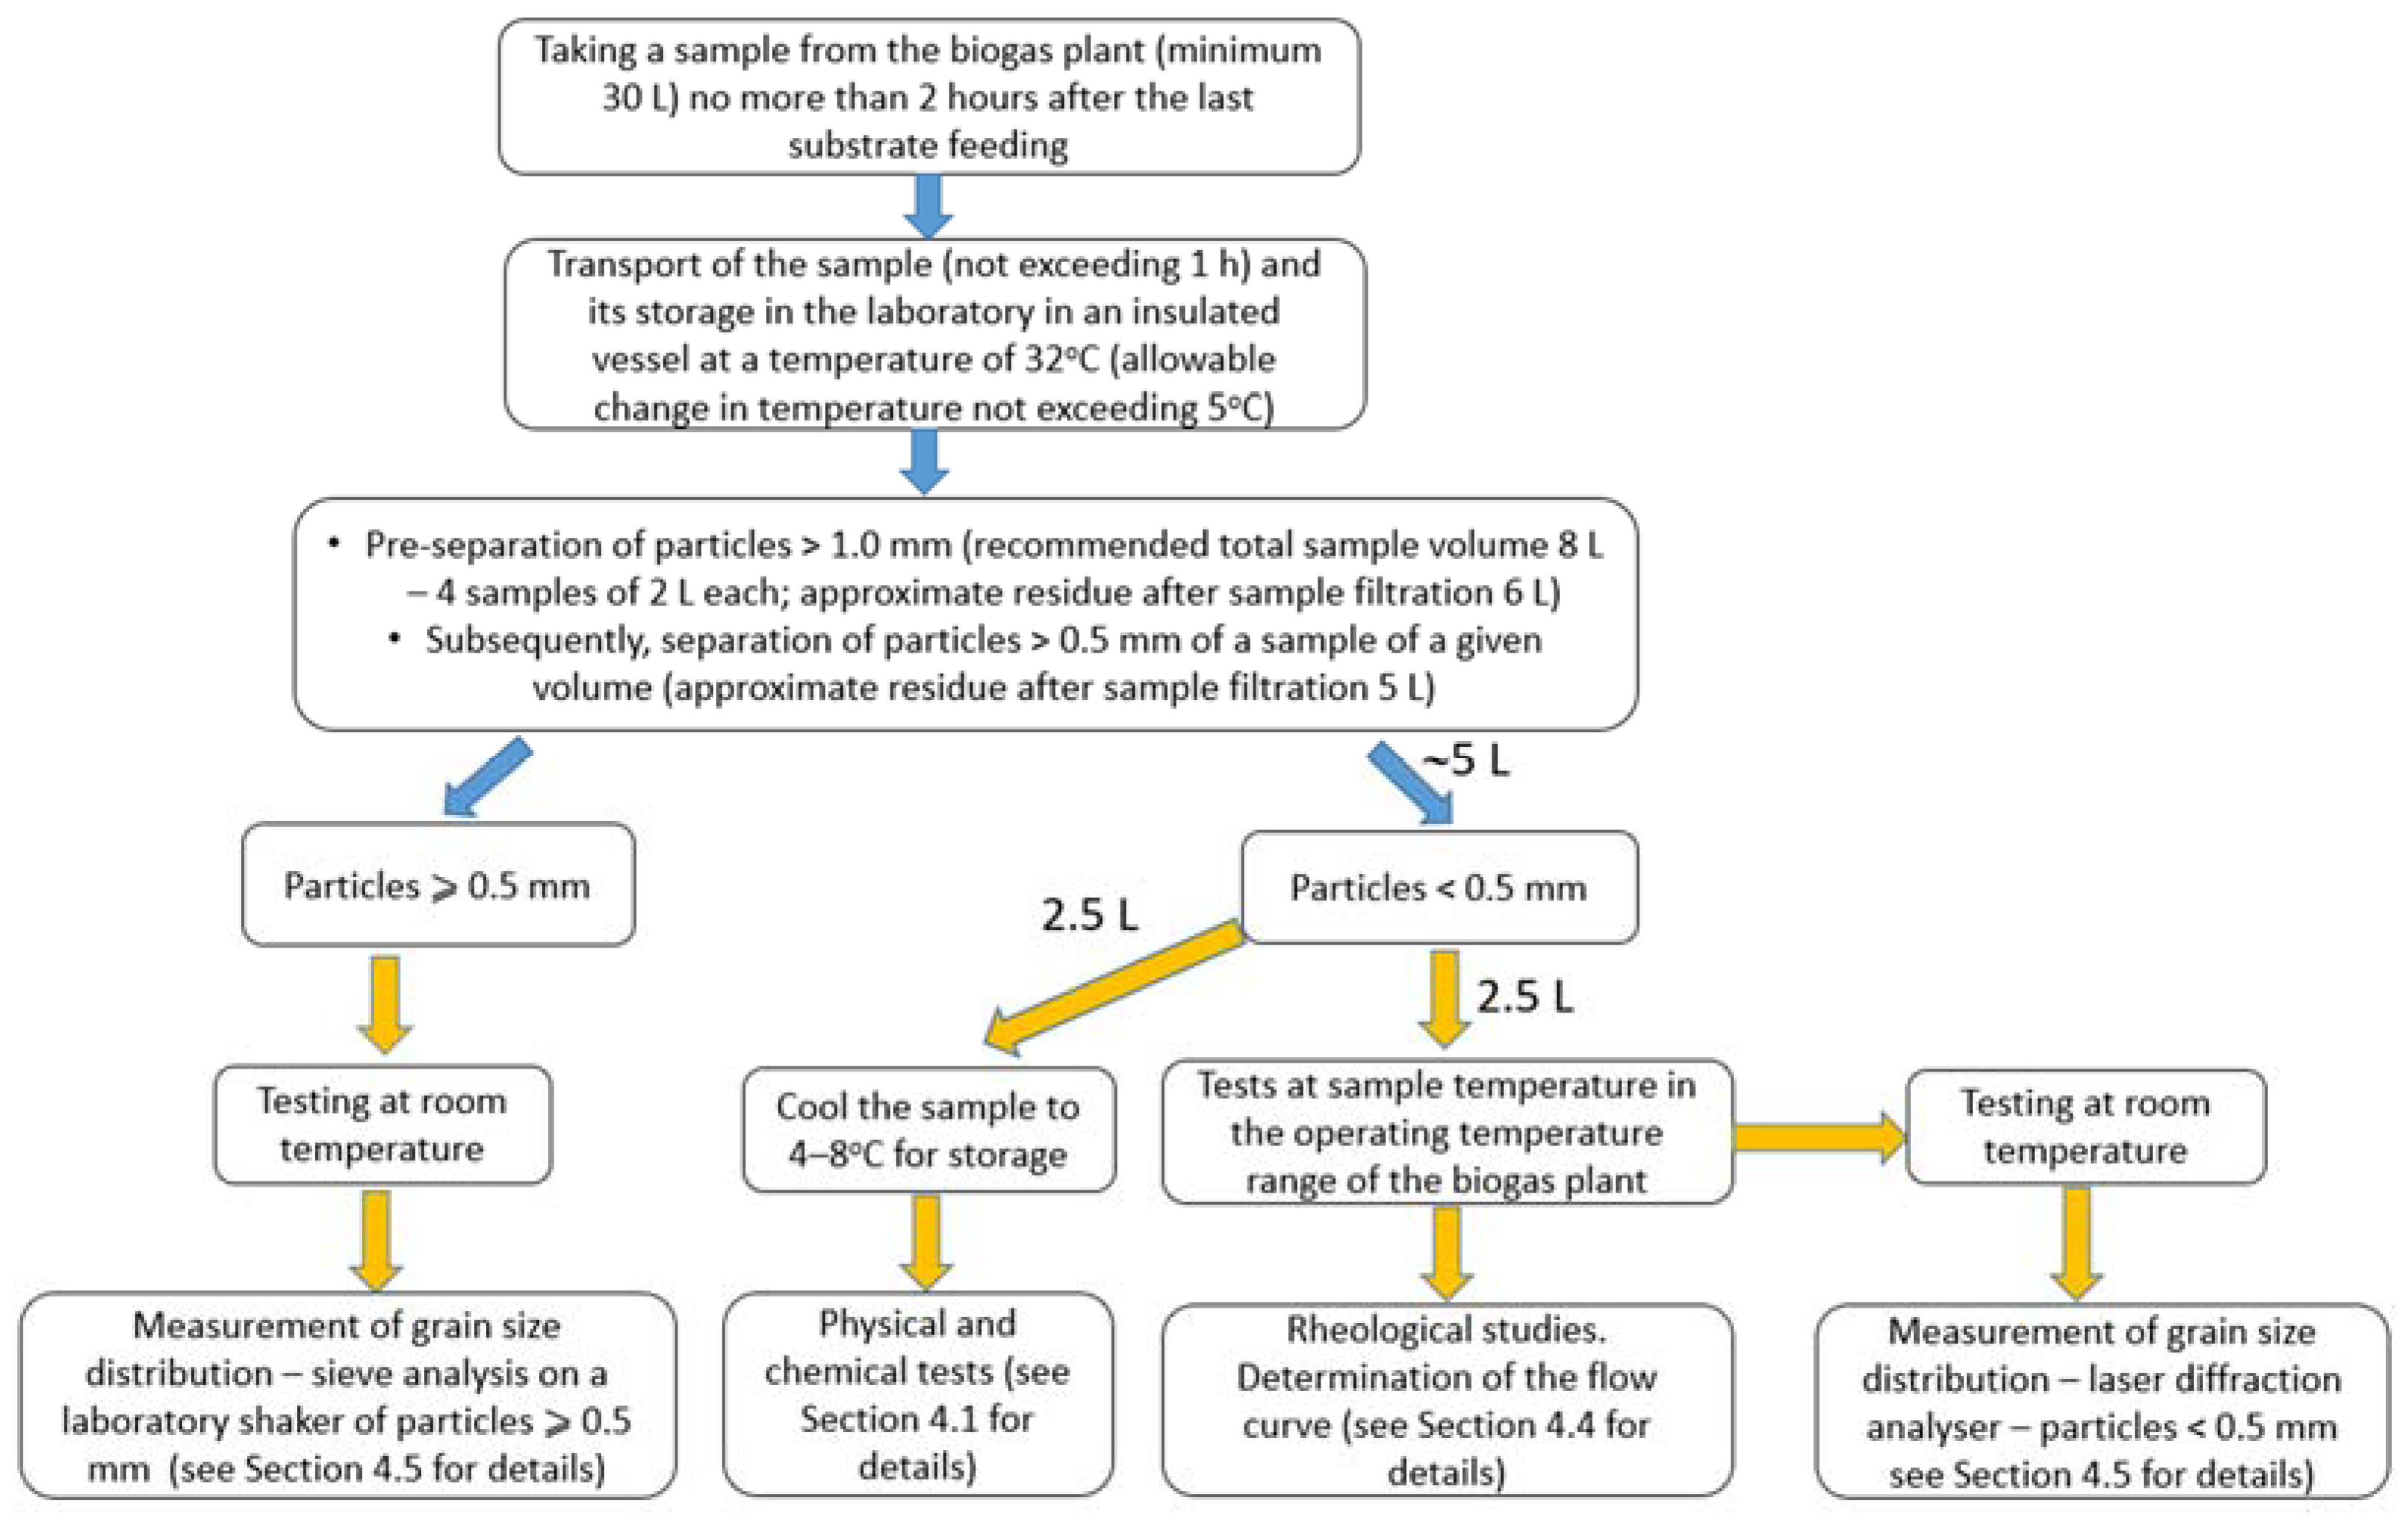
Sample collection, sample transport, sample preservation and sample preparation are integral to the testing of digested pulp (content of digestion tank), including its rheological characteristics, and have a decisive impact on the quality of the results. It is not possible here to define a comprehensive, detailed standard procedure covering all types of test samples—instead, a pragmatic approach has to be found, which will depend on the type of material to be tested and the objectives set for the test. The individual steps for the handling of the collected digested pulp samples are shown in Figure 4, while the detailed handling is described in the subsections below.

4.1. Collection and Transport

The concept for the collection and preparation of appropriate samples of the substance, i.e., digested pulp, from a fermenter tank operated at an agricultural biogas plant is presented below. It describes the basic technical equipment required for proper sampling and the basic principles to be followed in preparing and documenting sample collection. In addition, the rules to be followed during the preservation and transport of samples to the test site are described, as well as the necessary preparatory procedures and the necessary equipment, as well as the documentation of the preparatory stage.
The aim of sampling must be to obtain a fully representative sample, the characteristics of which will be typical of the digested pulp as a whole in terms of average substance content and physical (rheological) parameters. At the pre-sampling stage, it is necessary to define, among other things, the following: the purpose and scope of sampling, the place of sample collection, the time needed for sampling, the maintenance and transport of samples, and the required health and safety measures. Clean equipment and instruments, as well as transport containers made of materials that do not affect the digested pulp (e.g., PE, stainless steel or glass), should be used for sampling. In order to exclude chemical and physical changes in the samples associated with the lapse of time, transport containers should be used which, as far as possible, prevent the influence of air, light, temperature, moisture, etc. The sample container should be properly labelled—basic information should be included on the waterproof label: sample number and type, date (time) and place of sampling, name of the person taking the sample.
As part of the study, it is also important to determine the minimum volume of drained digested pulp prior to sampling, minimum sample volume, container preparation, minimum temperature drop, and maximum time for transport to the laboratory. The next steps of the sampling and transport procedure are as described below:
  • Take a sample from the sampling pipe after draining a volume of digested pulp equivalent to twice the volume of the sampling pipe.
  • Collect the sample into a sealed, thermally insulated container with a working volume of 30 dm3.
  • Take the sample to an isolation chamber for transport.
  • Transport the sample to the analysis site under constant temperature conditions.
  • Carry the sample for no more than 1 h after collection (alternatively, through a check valve, release the accumulated gases into a container to measure the volume of produced (released) gases).
  • The sample should not change its temperature by more than 5 °C.
  • After delivery to the test site, take intermediate samples to determine the parametric characteristics of the digested pulp, i.e., the following:
    • pH value;
    • temperature;
    • dry matter content;
    • organic dry matter content;
    • C/N ratio;
    • ammonium nitrogen content;
    • granulometric characteristics (during rheological studies);
    • qualitative characteristics (optionally as supplementary data, e.g., total protein, crude fat, crude fibre, fatty acid profile, and mineral composition).

4.2. Storage of Samples

The method of storing the sample in the laboratory, the maximum storage time, and the determination of the sample’s shelf-life are defined in the following sections:
  • The sample for testing should be taken from the transport container in the required portion for further analysis.
  • The sample should be vigorously stirred for about 20 s using, for example, a twin-bladed construction stirrer with a diameter of 60 to 80 mm. The stirrer’s rotational speed should be maintained within the range of 1400 rpm. There must be clearly visible movement during stirring. The entire volume of the sample should be stirred. If possible, several “subsamples” (components of an aggregate sample) should be taken at several locations in the tank and at several depths before stirring is completed. These samples should then be added together to form the aggregate sample.
  • The sample for indirect testing should be cooled to 4–8 °C.
  • Samples for the actual rheological tests should be maintained at a constant temperature, the same as how they were delivered to the research unit.
  • The sample is suitable for testing for a maximum of 8 h due to the processes involved.

4.3. Preparation of Samples for Rheological Measurements

The proposed procedure for preparing and storing samples for rheological measurements is outlined in the following steps:
  • A tank with a volume of about 30 dm3, containing the sample taken from the reactor, should be placed in an incubator at a temperature of 32 °C. The sample should be vigorously stirred for about 20 s using a twin-bladed construction stirrer with a diameter of 60 to 80 mm. The stirrer’s rotational speed should be maintained within the range of 1400 rpm. There must be clearly visible movement during stirring and the stirring must involve the entire volume of the sample.
  • Samples of approximately 2 dm3 in volume should be collected each time. Sample collection should be repeated four times.
  • About 6 dm3 of digested pulp should be separated using a 1.0 mm sieve. When separating particles larger than the mesh, the sample should be moved across the sieve in a circular motion, pressing it gently against the mesh. The process of separating the carrier fluid from particles larger than 1.0 mm should continue until the liquid ceases to flow through the sieve and no liquid appears on the surface of the grouped solid particles.
  • After passing the sample through the 1.0 mm sieve, the sample is then separated using a sieve with a # 0.5 mm mesh. The sample should be gently moved across the sieve to separate particles larger than the mesh until visible liquid ceases to appear on the surface of the separated particles. The volume of the prepared sample should be about 5 dm3.
  • The sample should be placed in a covered container that is protected from excessive evaporation, and should be stored in an incubator at a temperature of 32 °C.
  • The durability and suitability for rheological measurements of the sample are estimated to be about 8 h.
  • The sample for rheological measurements is about 1 dm3, while 2.5 dm3 is needed to determine the mass concentration. The sample of about 1.5 dm3 serves as an averaging volume and reserve volume.
  • After completion of the measurements, i.e., up to 8 h after separation of the fractions above 0.5 mm, three samples should be prepared for concentration measurements.
Two approaches were adopted during the research. The first approach involved preparing a sample taken from the incubator (approximately 0.25 dm3) just before the rheological test, separating the particles using a # 0.5 mm sieve, and conducting further tests. It was assumed that such a freshly prepared sample would yield the most reliable results. However, no reliable reproducibility of results was achieved during the research. It is most likely that each time a new sample is separated on the sieve, the samples differ from each other, which is reflected in the rheological instability of the results with respect to temperature.
The second approach involved preparing about five litres of digested pulp after passing it through the # 0.5 mm sieve and conducting tests on such a prepared volume. Naturally, the test sample was stored in the incubator. The second approach yielded a higher reproducibility of results, which resulted in the decision to adopt the presented methodology.

4.4. Procedure for Flow Curve Measurements

Tests on the rheological properties of fluids aim to determine the sample’s response to applied stress, most commonly shear stress. Measurement techniques can be divided into two fundamental groups: rheometers and viscometers [58]. The most accurate technique for assessing the rheological parameters of digested pulps would be the use of a large-diameter pipe rheometer. However, this system requires significant effort and time, and is only available in specialist laboratories.
After the analysis of available measurement techniques and methods employed by other researchers on biologically active fluids, the choice was made to opt for the commonly used rotational rheometer technique [59]. Two basic measurement techniques can be used for describing the pseudo-flow curve of the sample: controlled shear rate (CR) or controlled shear stress (CS) [60]. The use of a rotational rheometer is a compromise between measurement quality, accuracy, and the availability of equipment in laboratories.

Measurement Procedure for the Prepared Sample’s Flow Curve

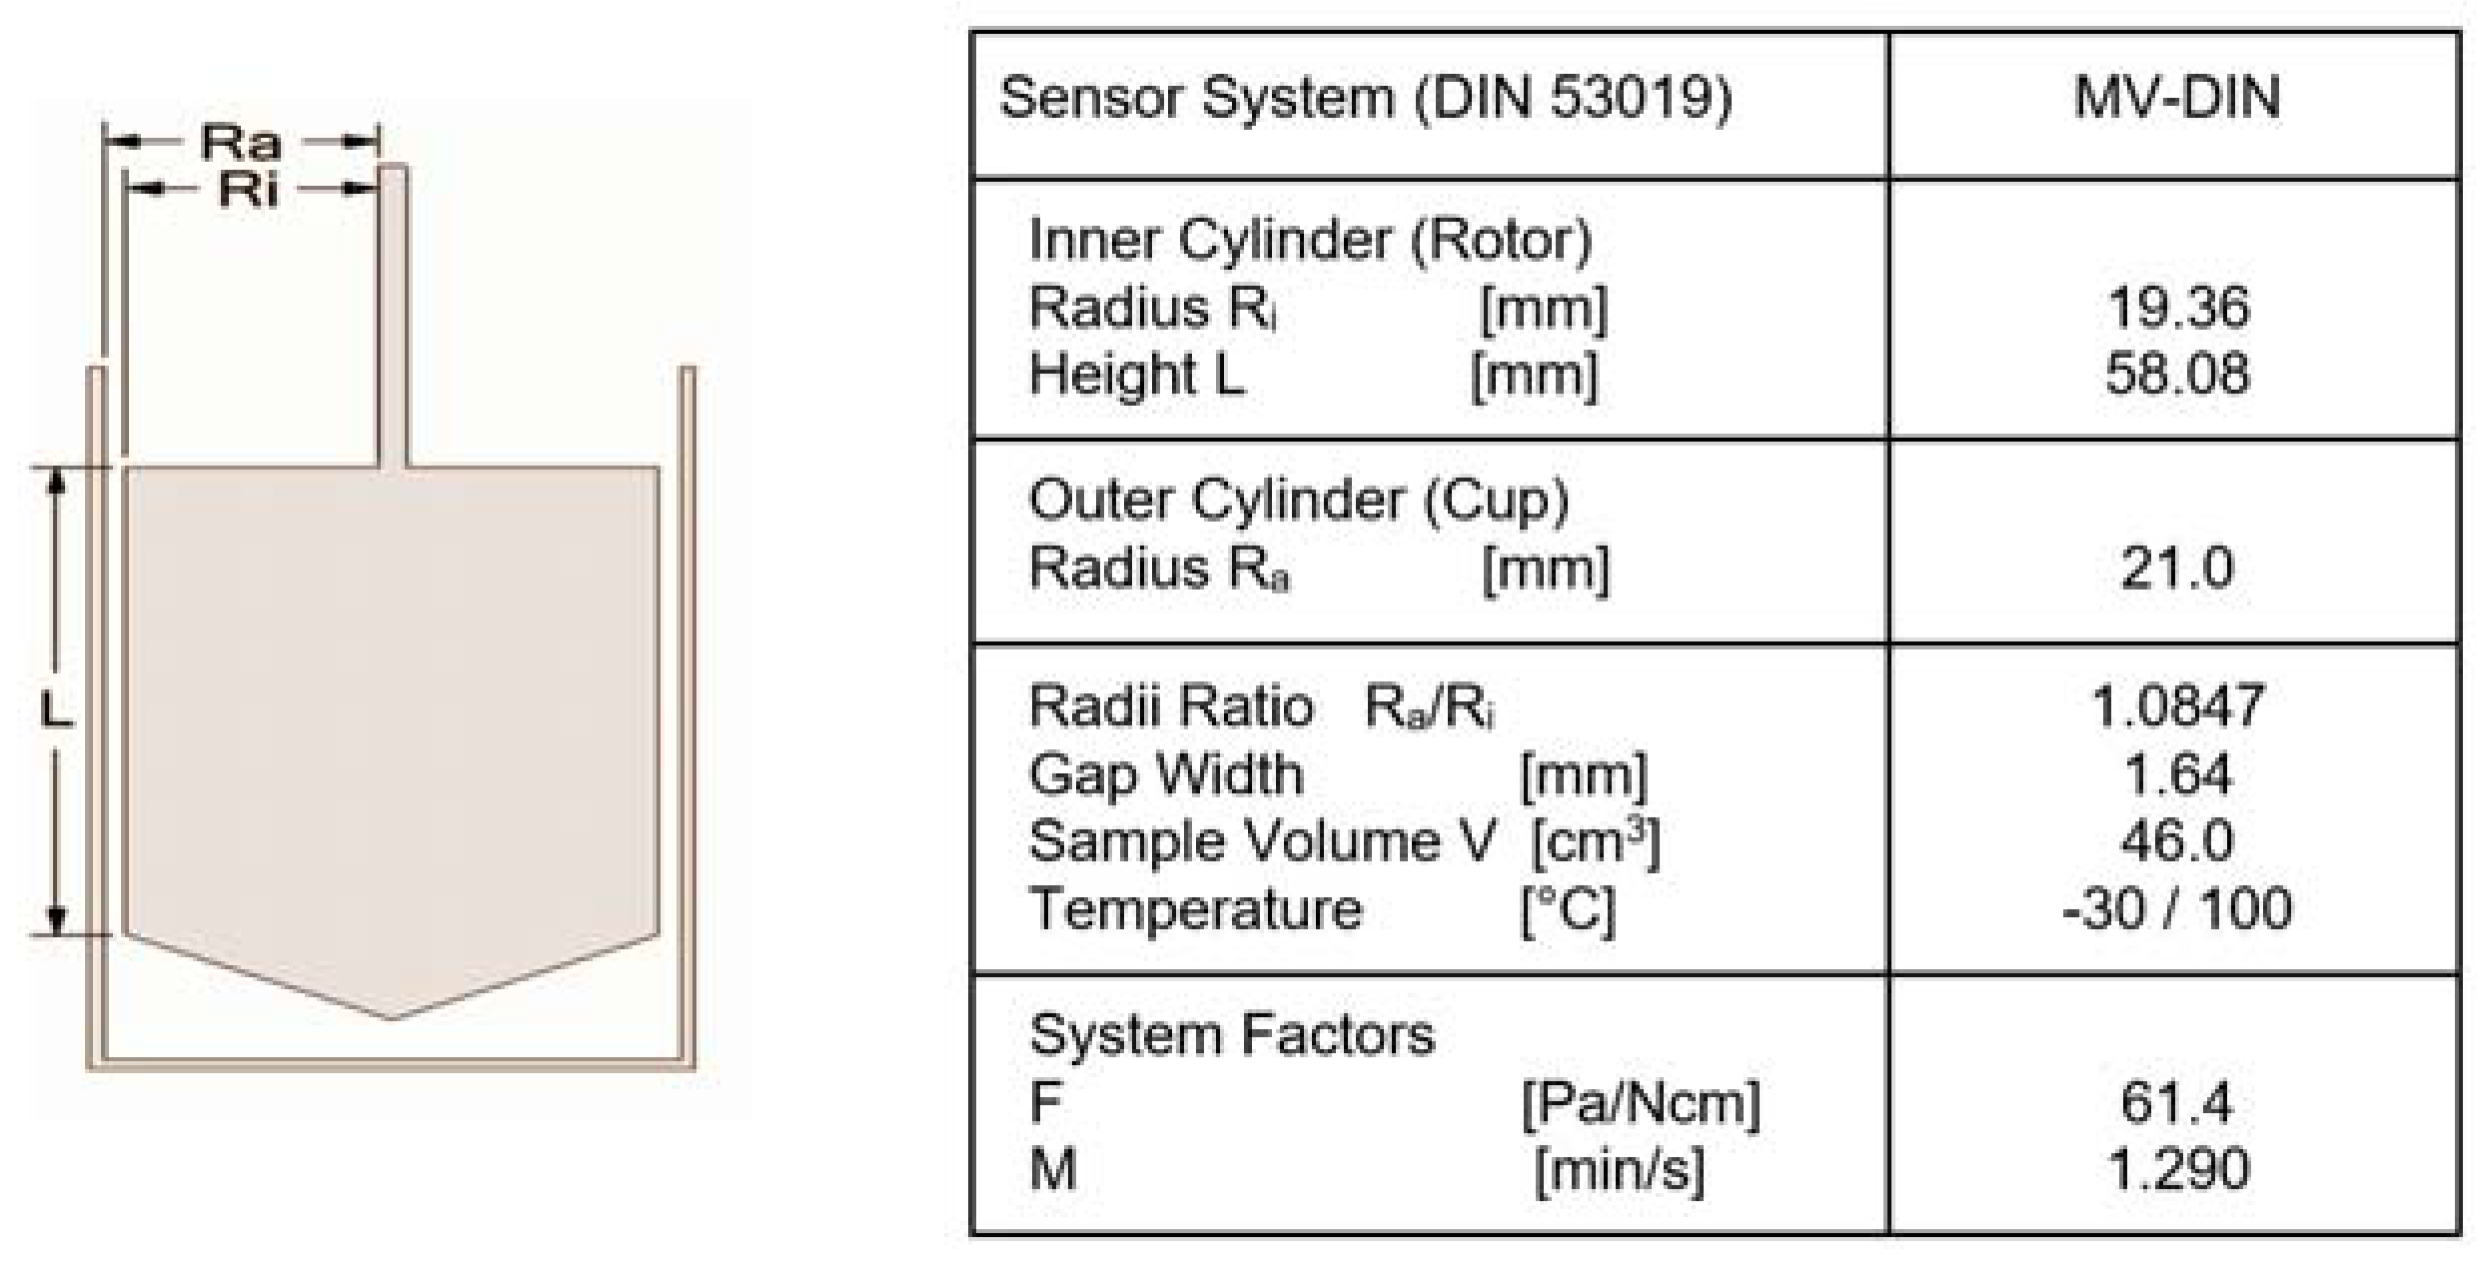
It is necessary to use a cylinder–vane shaft assembly with a gap size of not less than approximately 1.7 mm, which gives an acceptable particle size to gap width ratio of about 1:10 [61] since after passing the sample through the 0.5 mm sieve, its hydraulic diameter d90 is about 0.170 mm resulting in a ratio of 1:15; proposed measurement sets include MV2 (Figure 5) or DIN 53019 [62] (Figure 6). The system that was adopted for the research is commonly used Haake system, which is one of the coaxial systems for rotational rheometers. Alternatively, the DIN 53019 [62] MV-DIN system can be applied as well (Figure 6).
Measurements are conducted at the operating temperature of the bioreactor, which in this case is 32 °C. The proposed procedure for rheological measurements is outlined in the following steps:
  • Set the desired temperature in the thermostat bath system and wait for the temperature to reach the set point (due to thermal inertia, it may take a considerable amount of time to reach the desired temperature; ensure that the heated bath temperature is achieved before removing the sample from the incubator to avoid unnecessary sample aging).
  • Remove the container with approximately 5 dm3 of the sample from the incubator after passing the sample through the 0.5 mm sieve. Shake the entire volume of the sample for about 20 s to stir any potential sediments that may have settled at the bottom of the container.
  • Extract a sample and fill the rotational rheometer’s cylinder with a sample volume of 0.05–0.10 dm3.
  • Place the sample-filled cylinder in the rheometer’s temperature control system using the thermostat bath system.
  • Perform a direct and continuous temperature measurement of the sample in the cylinder until the desired temperature is reached. During heating or cooling of the sample, cover the measurement cylinder with a damp material to reduce evaporation and concentration changes.
  • Measure the flow curve in the deformation gradient range of 0–200 1/s with steps of 2–3 1/s increment.
  • Perform a direct temperature measurement after obtaining the flow curve. If the sample temperature has changed by more than 2 °C, the measurement should be repeated.
  • Empty, clean, and dry the measurement cylinder. Repeat the measurement three times.
Specific notes:
-
The temperature of the sample before and after the test should be measured directly by placing the thermometer head in the sample.
-
During temperature changes (reaching the heated bath temperature), the samples should be protected from drying out.
-
The results should be interpreted immediately after the measurement to identify any gross errors and repeat the measurement if needed.
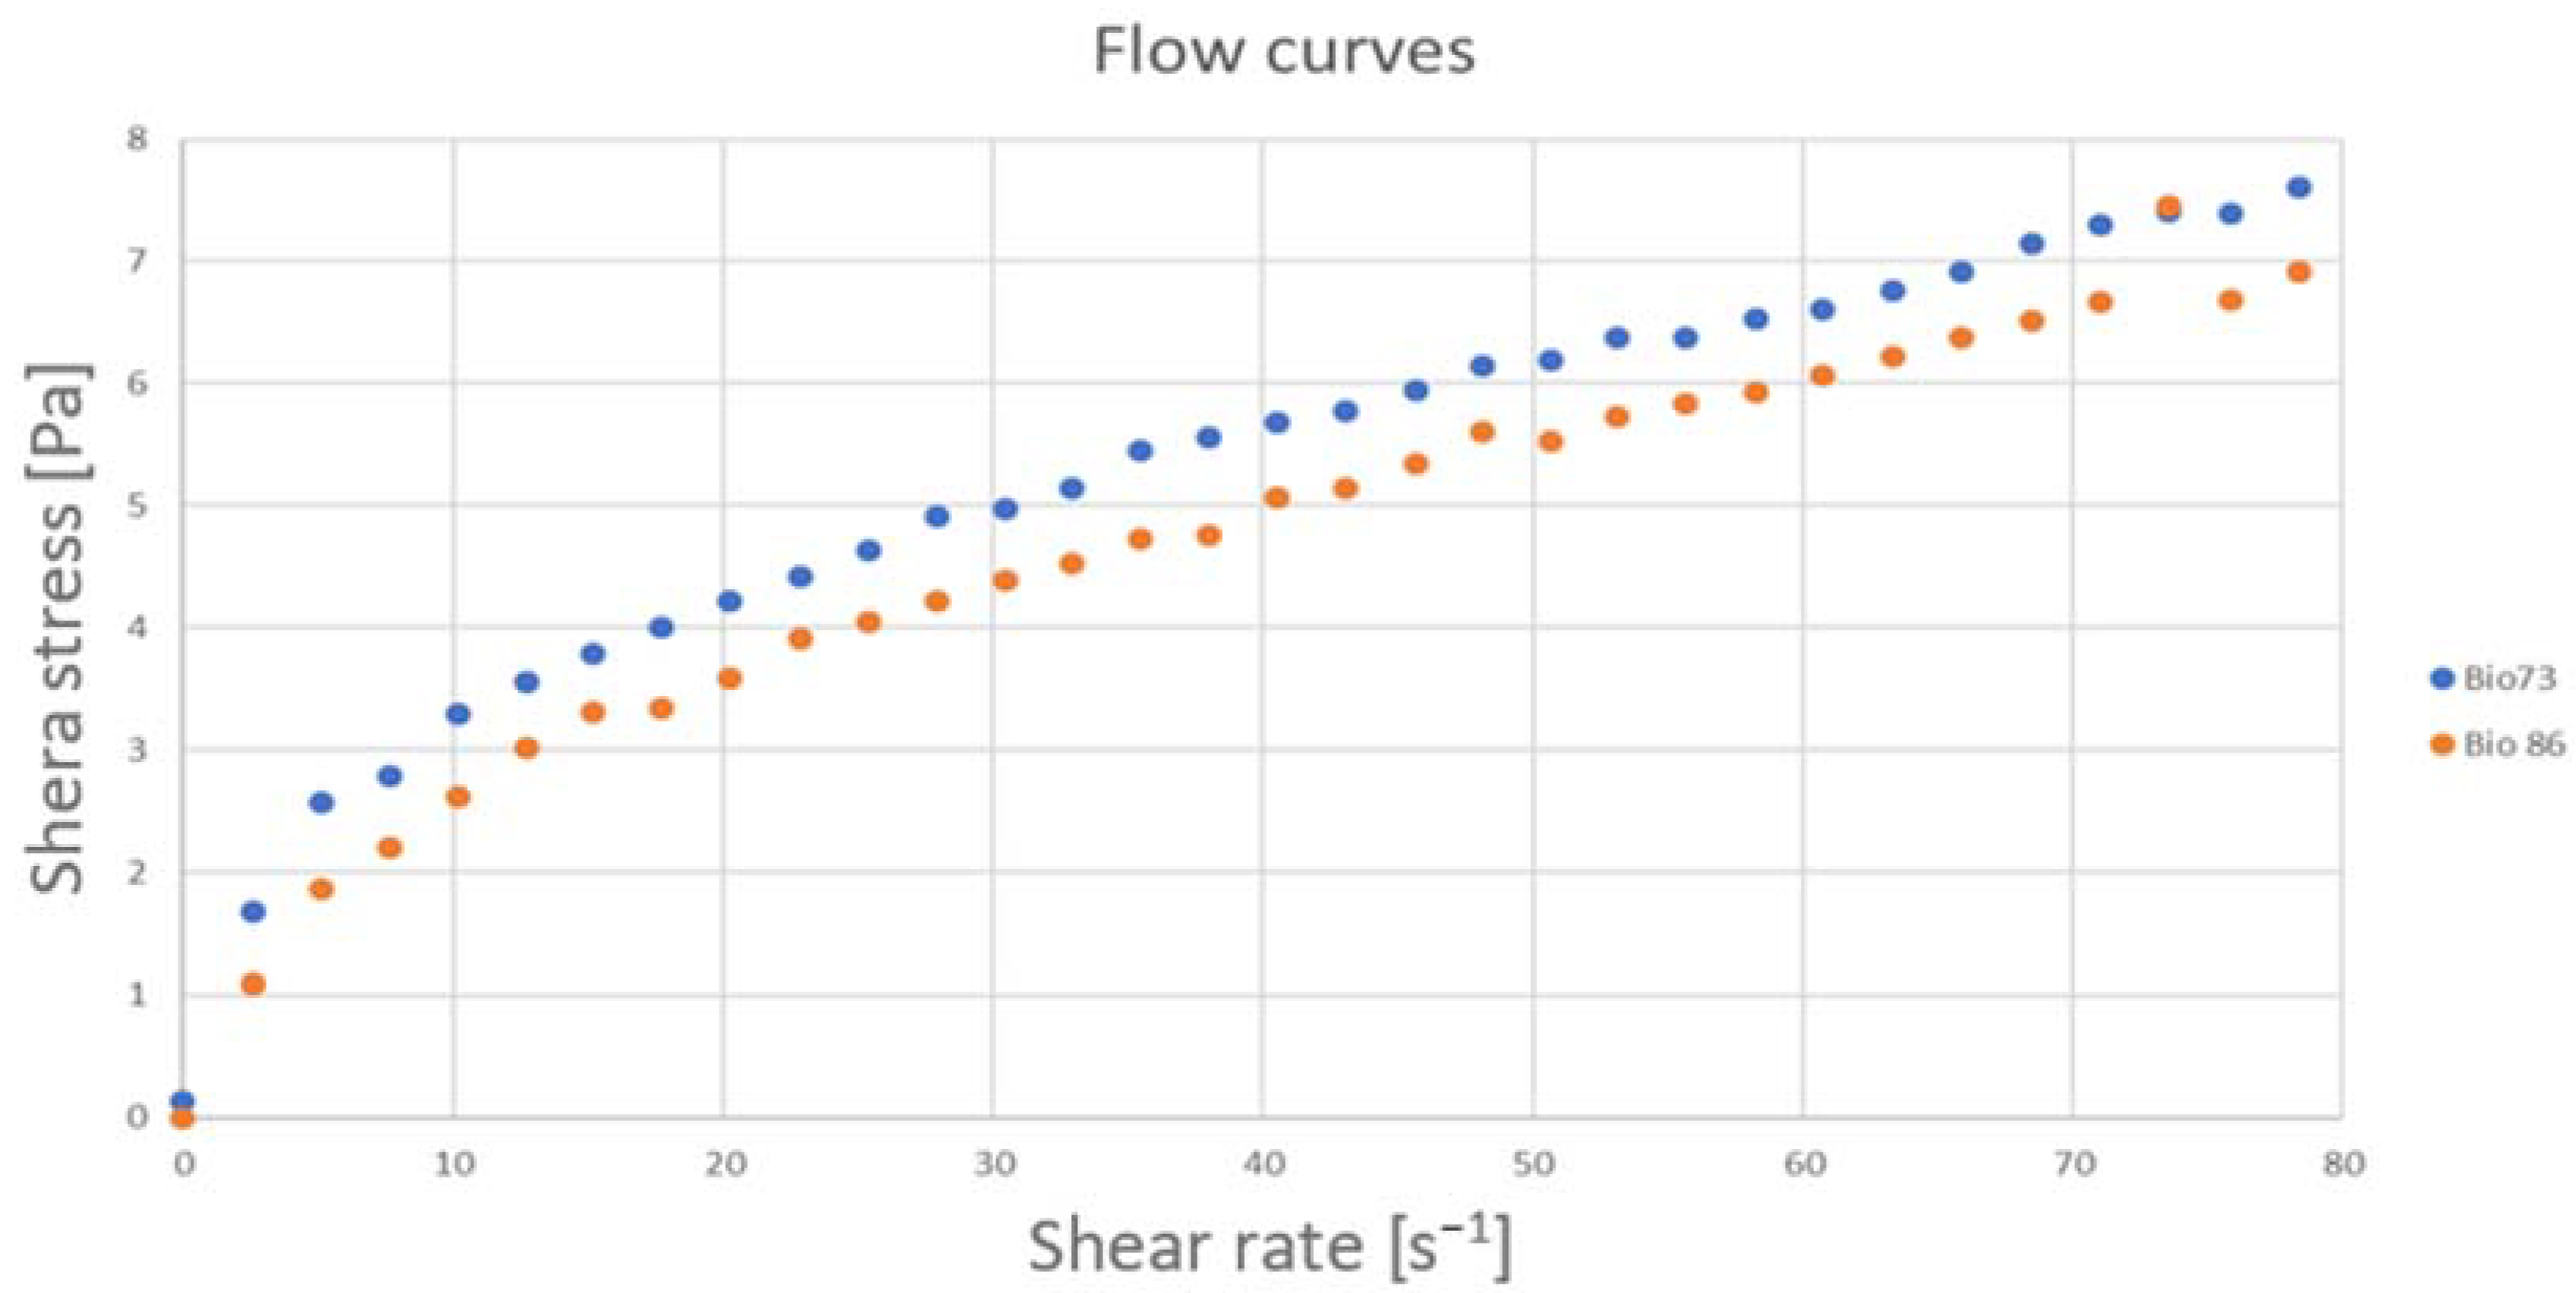
The chart (Figure 7) shows exemplary shear results of the digested pulp sample from the biogas plant, which was taken from the lagoon during two measurement campaigns conducted on 12 June 2021 and 13 June 2021. The results are shown as pseudo-flow curves of the deformation gradient as a function of shear stress. The chart displays a discrepancy in the flow curve profiles. The expected behaviour is that the sample responses would align throughout the entire analysed range of stresses, given that the samples were taken one day apart and should theoretically be identical according to the authors. However, considering that the shape and size of substrate particles may change due to the daily replenishment of biomass, it is possible to correctly interpret the dependencies obtained. This also indicates the need for ongoing assessment of the digested pulp parameters [63,64].

4.5. Particle Characteristics of the Feed

4.5.1. Particle Size Distribution Curve

Solid particles extracted from the digested pulp of the biogas plant in Przybroda were collected on 10 February and 11 February 2023. It was decided to partition the carrier fluid and solid particles using a sieve with a # 0.5 mm mesh. The use of a finer mesh led to immediate sieve clogging. The partition of particles on a 0.5 mm sieve was considered an appropriate compromise between the division criterion and ease of implementation in the laboratory. Particle size distribution for particles smaller than 0.5 mm was determined using laser diffraction analysis, while larger particles were analysed using sieve analysis on a laboratory shaker.
The granulometric composition was measured using a Mastersizer 2000 instrument (Malvern Instruments, Malvern, UK). Samples were prepared and dispersed to the appropriate volume concentration (5–10%) in distilled water using a Hydro 2000MU accessory (Malvern Panalytical, Westborough, MA, USA). The Mastersizer 2000 employs laser technology to detect light scattering by particles through an optical unit consisting of multiple sensors. This method is commonly used in studies involving hydromixtures composed of clay and dust particles [65].
Figure 8 shows the particle size distribution of five samples for particles smaller than 0.5 mm. The hydraulic diameters fall within the following ranges: d10 (2–6 µm), d50 (25–35 µm), d90 (150–180 µm). The samples exhibit the presence of particles where 75% of them are smaller than 63 µm (hydraulic diameter of the carrier fluid is d70 = 0.06 mm). No particles larger than 500 µm were detected in the prepared samples, ensuring the absence of wedge effect in the gap of the employed DIN rotational rheometer setup.
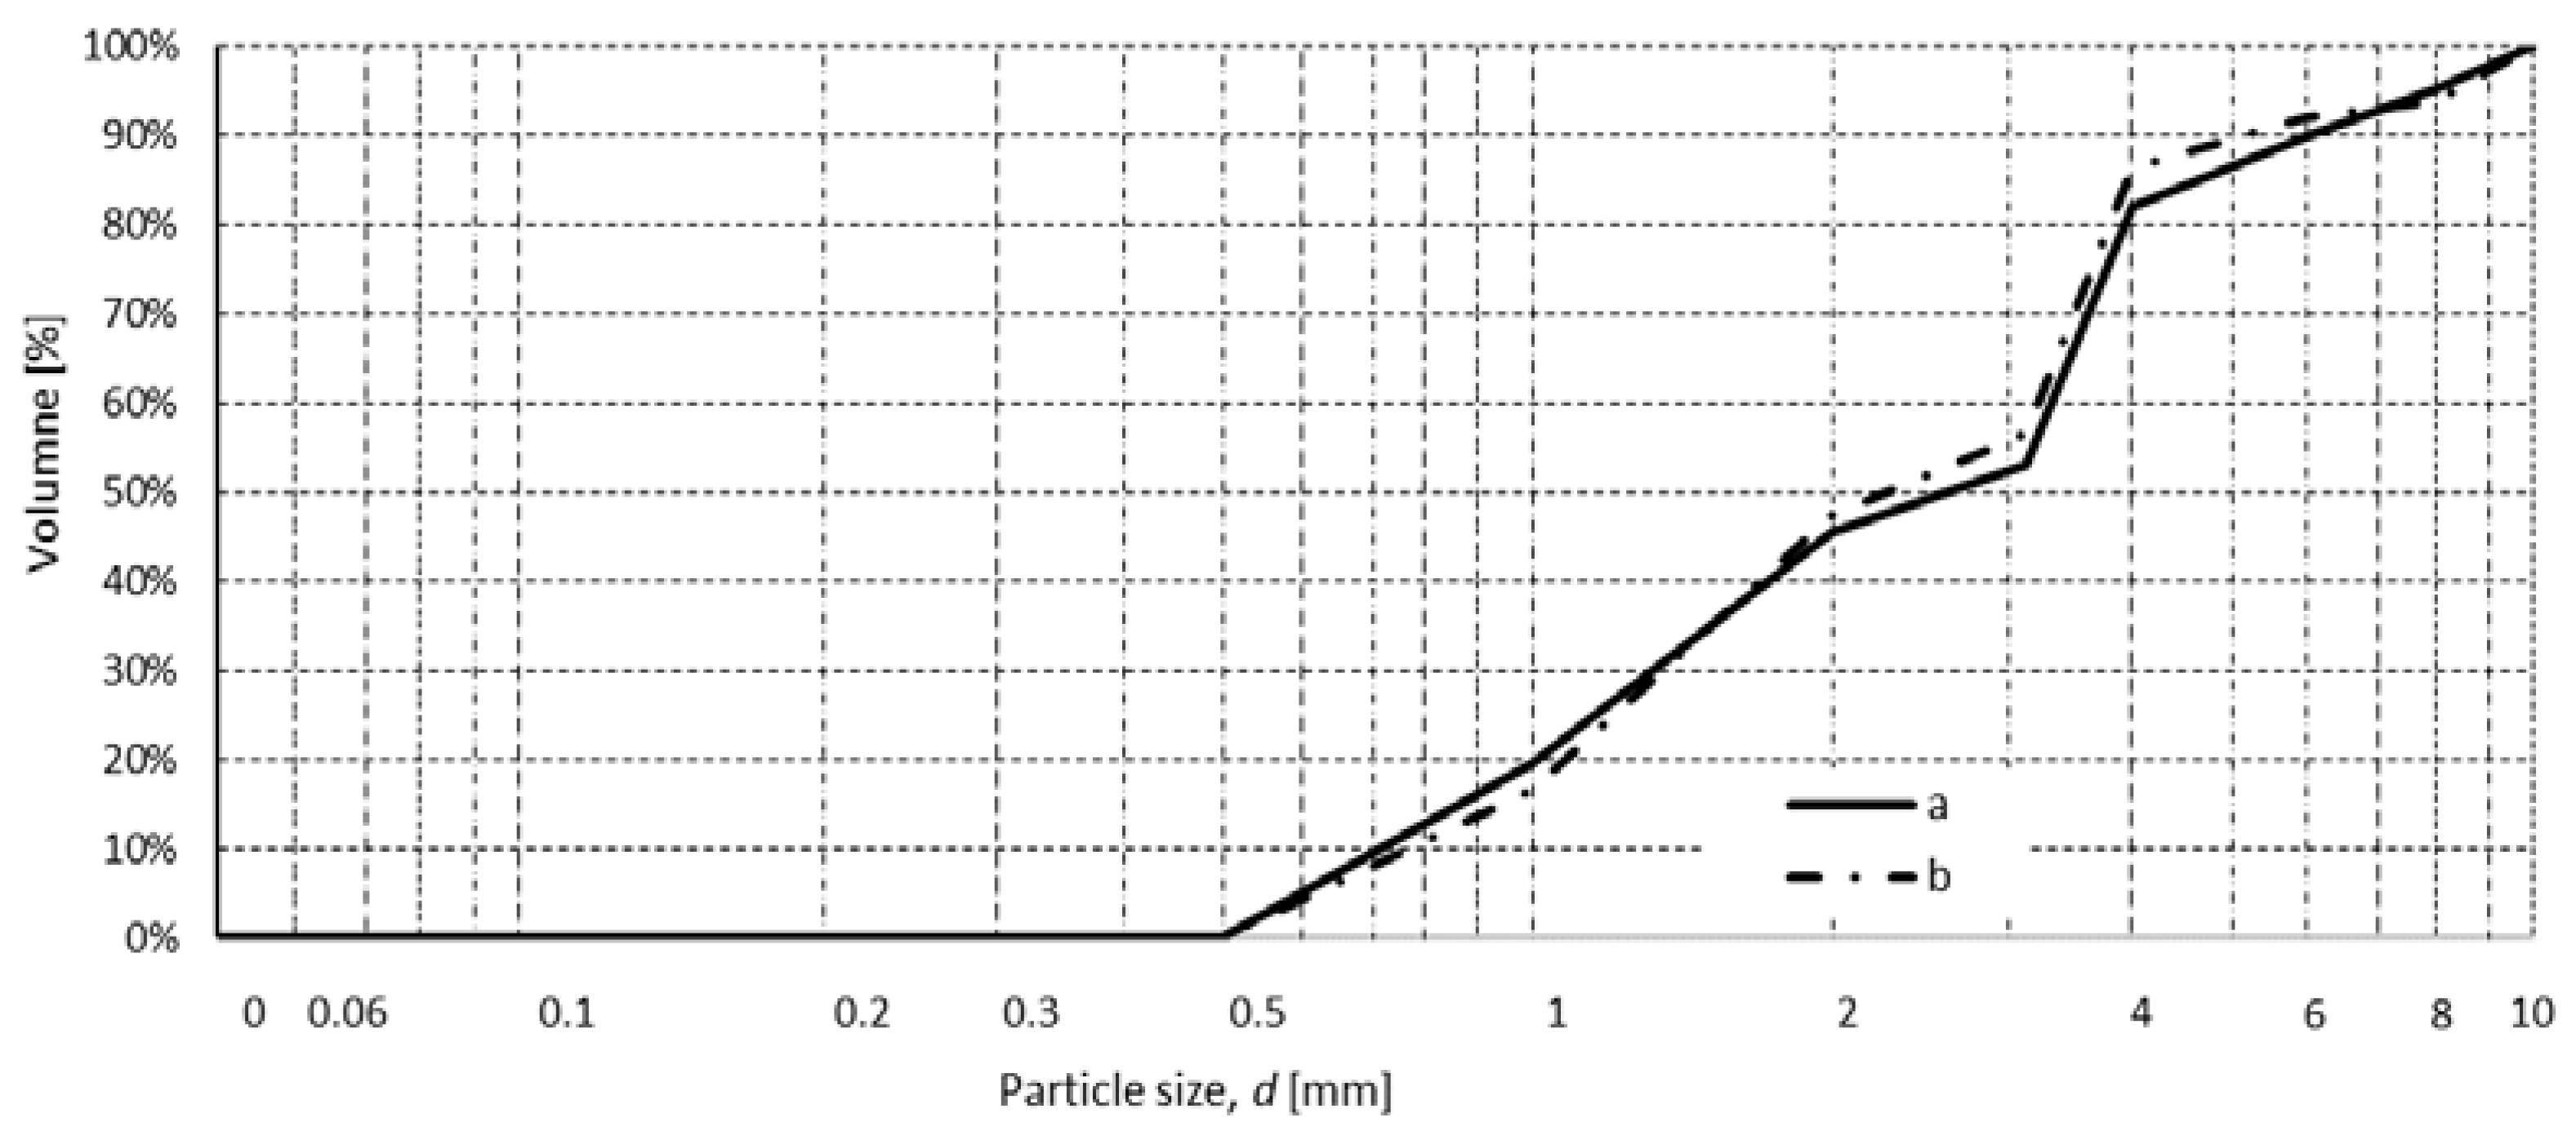
The sieve analysis of digested pulp particles larger than 0.5 mm was carried out with a Multiserw-Morek shaker (Sieve shaker LPzE-2e, Multiserw-Morek, Brzeznica, Poland), using sieves with standardised square mesh sizes: # 16, 10, 8, 6, 4, 3.15, 2, and 1 mm. The feed sample was not dried before the sieve analysis, as the shaking was performed in wet conditions. The material remaining on the sieves was dried, then weighed, and then the percentage contribution of each fraction was calculated using the formula:
S i = m s i m s · 100 %
where the following are defined:
msi—mass of particles remaining on the sieve,
ms—total mass of particles taken for analysis.
The grain size distribution chart for particles larger than 0.5 mm from the digested pulp of the Przybroda biogas plant is shown in Figure 9. The grain size distribution curves for both samples are quite similar, with differences in the proportion of individual fractions not exceeding ±3%.
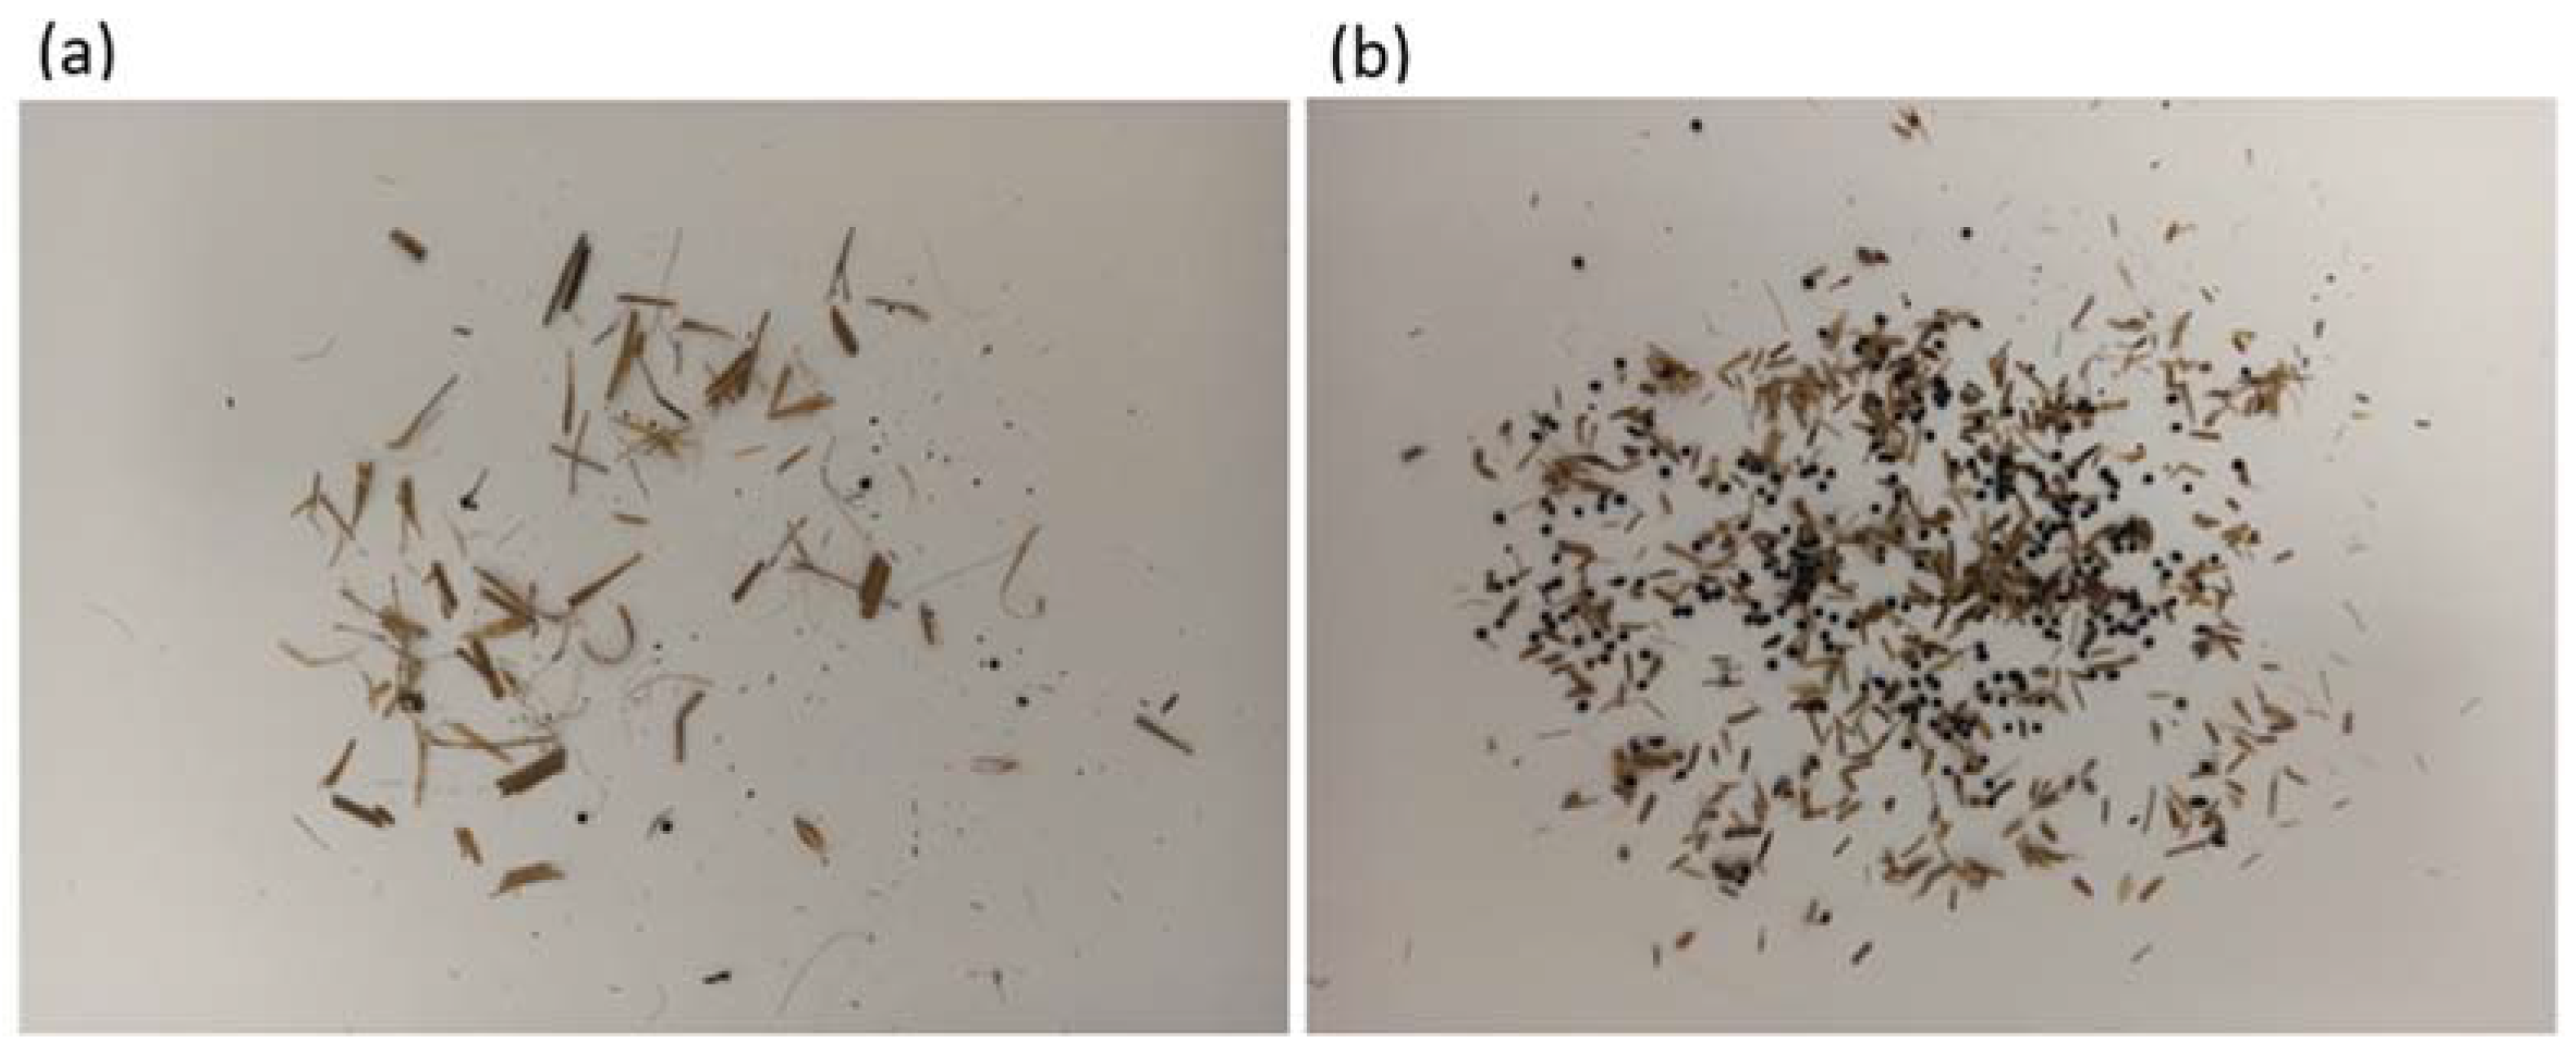
Dry residues of each fraction were spread out on a sheet of paper, photographed, and subjected to distribution analysis of particle shape. Figure 10 illustrates the particles retained at # 10 mm and # 2 mm.

4.5.2. Distribution of Particle Shapes

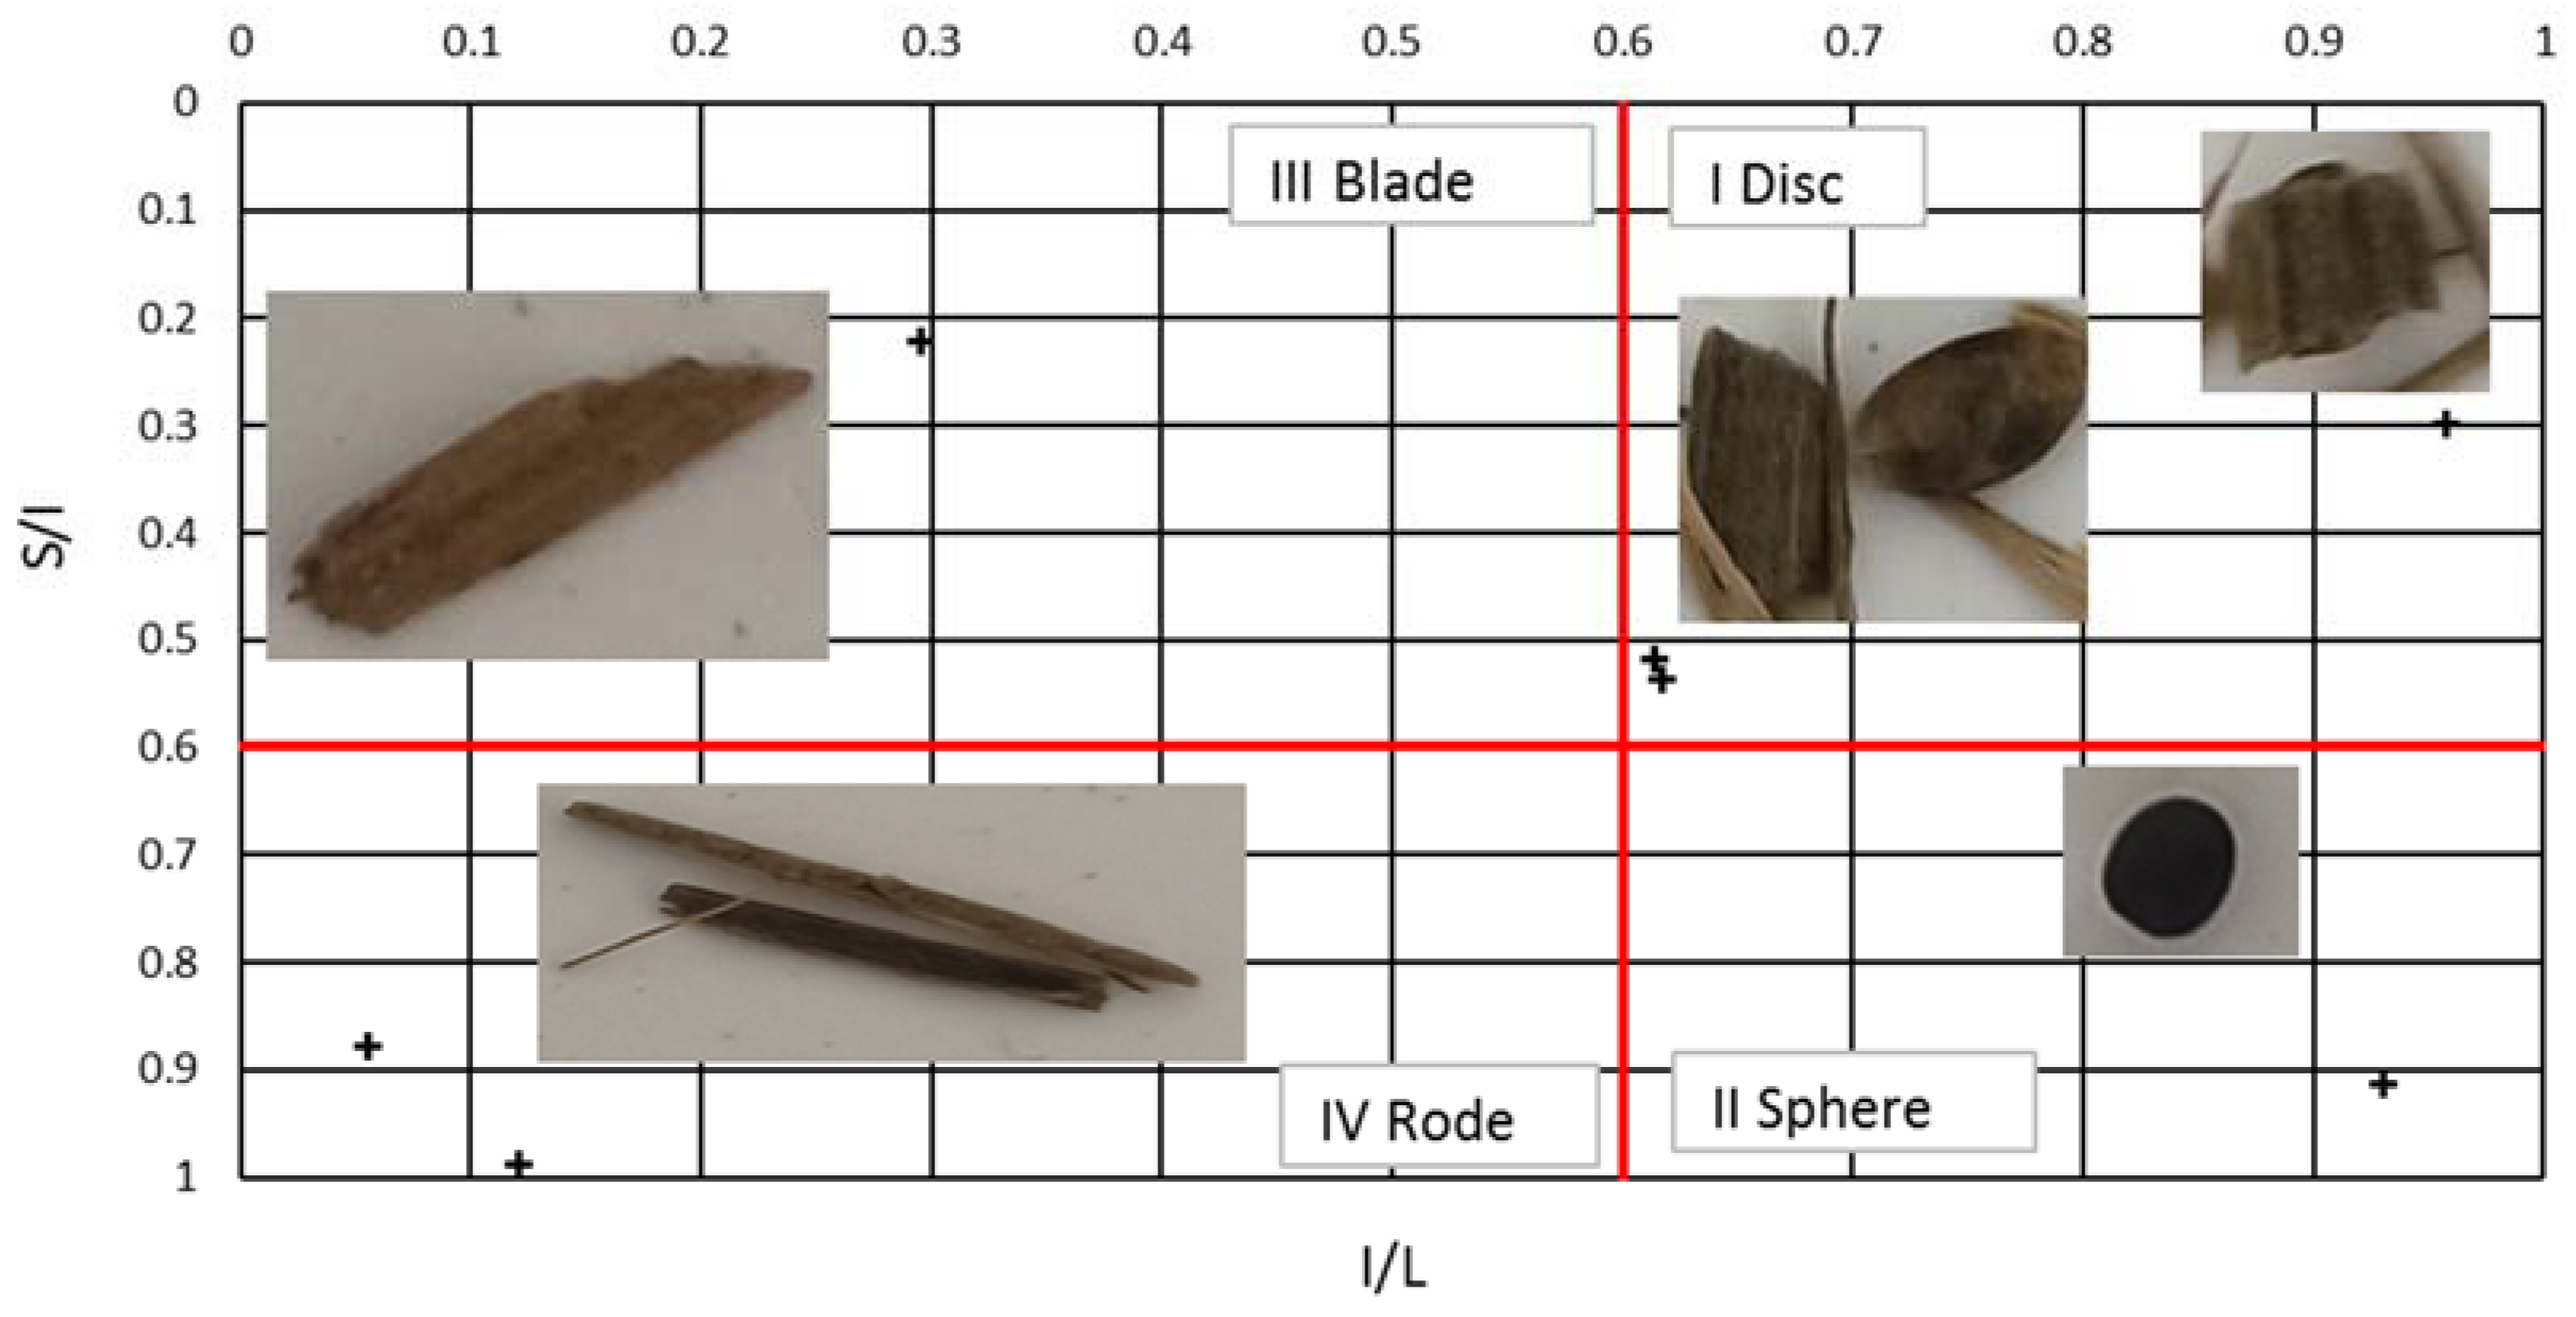
Solid particle characteristics: shape and size of particles may help to describe the onset of motion of this phase, flow type or sedimentation type [66,67,68,69]. The particle description follows the methodology presented by Blott and Pye [70] and Szabó and Domokos [71], developing earlier works by Zingg [72] and Sneed and Folk [73] (Figure 11). Three mutually perpendicular dimensions were determined for each particle: L—longest; I—intermediate; S—shortest.
Measurements of characteristic particle dimensions were taken while editing photographs on a computer monitor [74]. The characteristic dimensions L, I, and S enabled the arrangement of particles from each fraction on the Zingg diagram and the triangular diagram. Figure 12 illustrates the Zingg diagram for selected fractions: # 10 mm and # 2 mm.
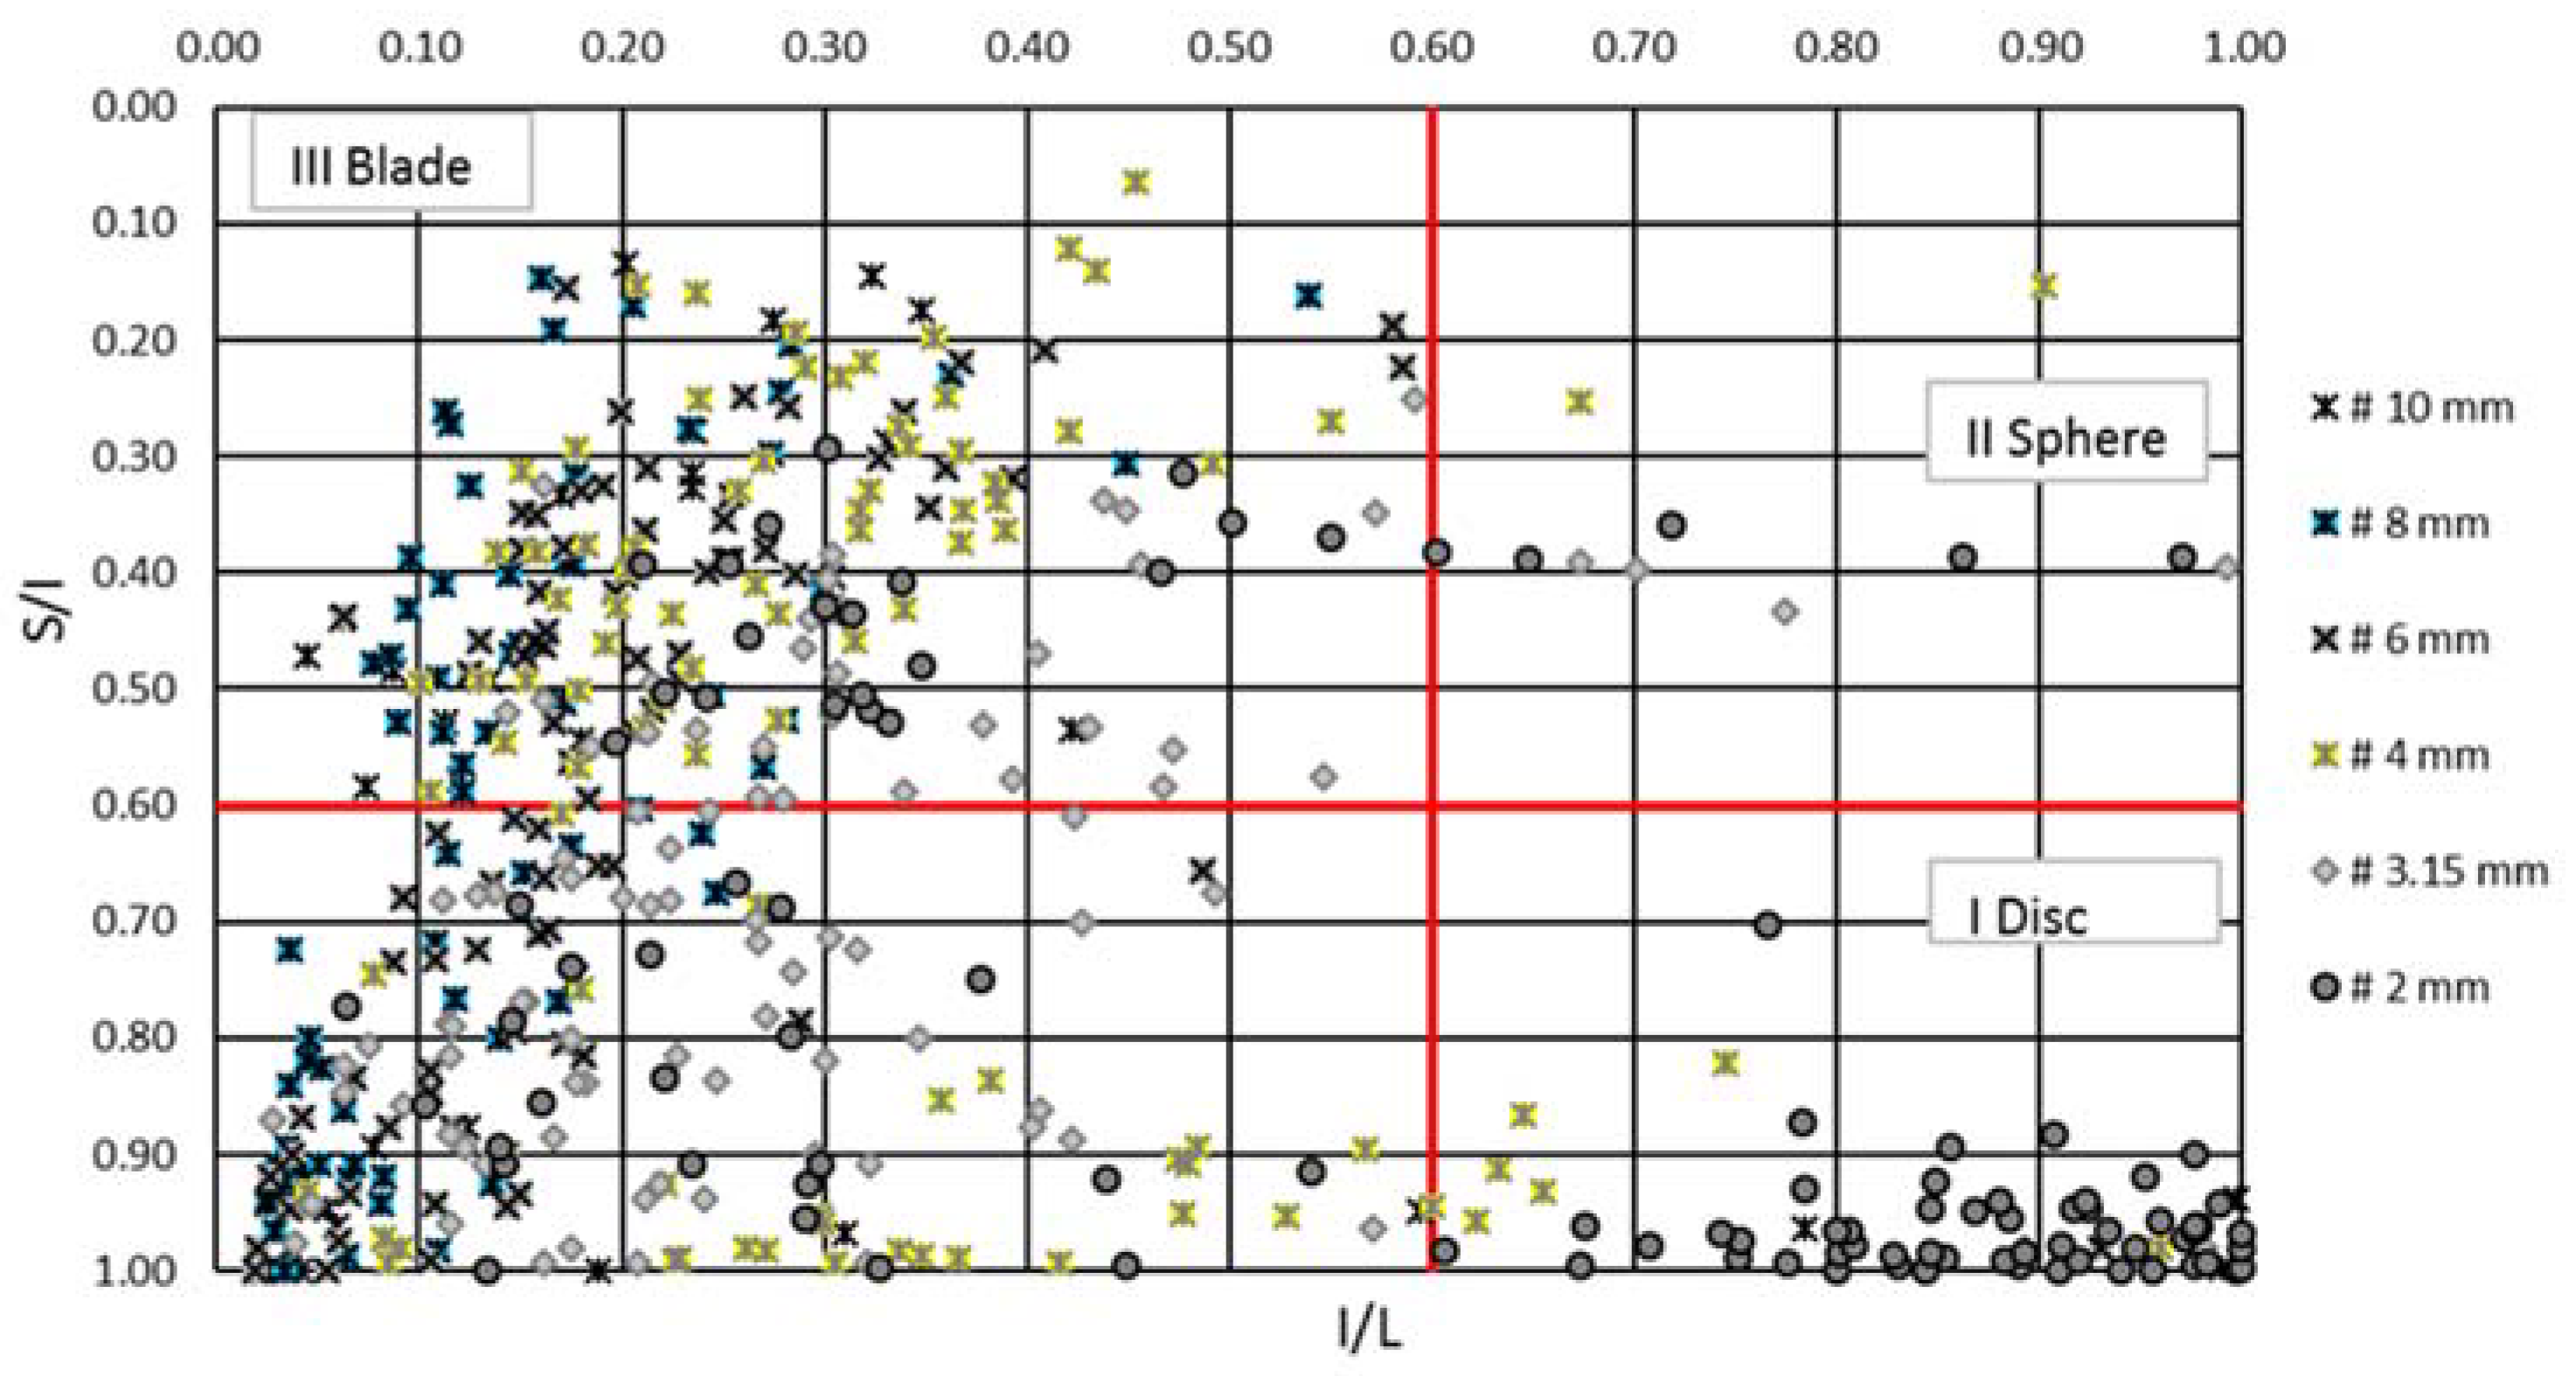
In particle fractions #10 mm–#3.15 mm, there is a similar frequency of distinguished shapes. The highest numbers are found in Class IV (rods) and Class III (blades), while the contribution of the other shapes is minor, not exceeding 10%. However, in the finest fraction #2 mm, more than 53% of the particles are spherical (Class II).
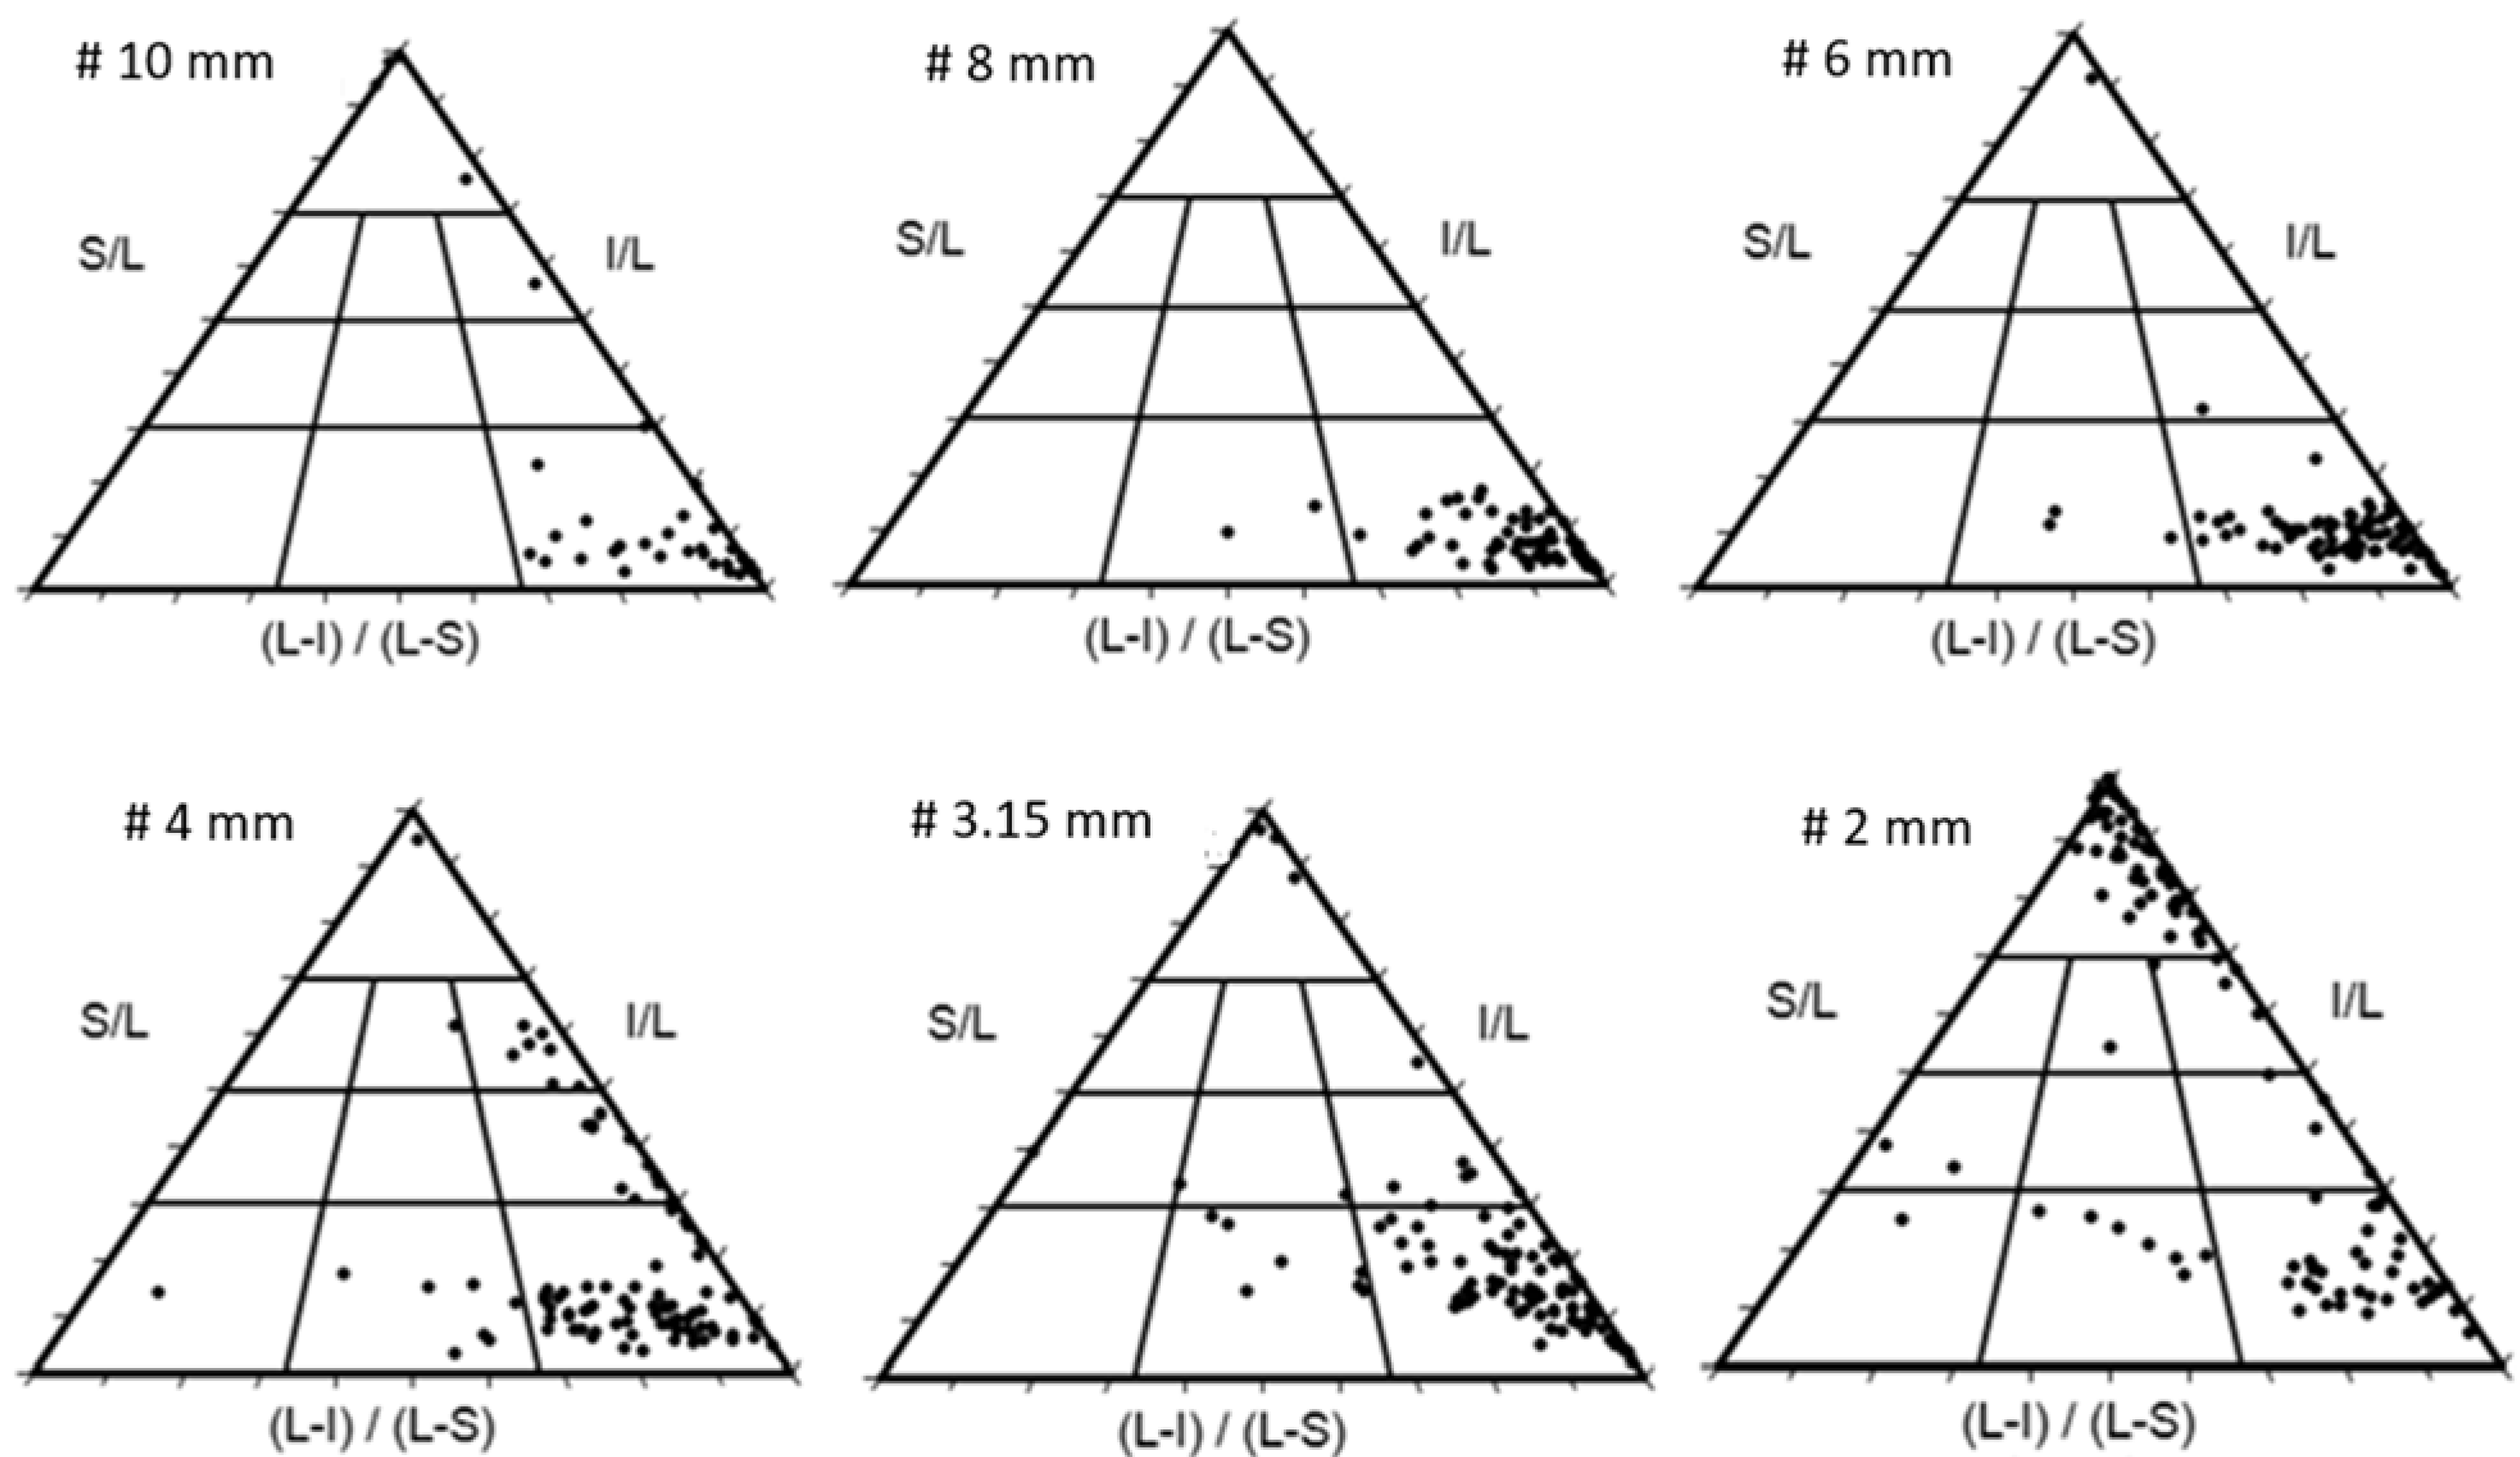
The triangular diagram expands the shape classification from 4 to 10 classes. The preparation of such a diagram does not require additional measurements and is easy with the Excel-based application developed by Graham [75,76]. Table 3 shows the percentage distribution of different shapes across all fractions, and Figure 13 shows the results in diagrammatic form.

5. Discussion of Results

In the presented study, digested pulp was attempted to be described as a multiphase fluid: water–solid particles. In the processes of preparing digested pulp, solid particles are initially comminuted and stirred with water to increase the specific surface area, which is significant as a source of nutrition for bacteria. However, despite these processes, the size and shape of solid particles vary. The solid particles were analysed in two groups: smaller and larger, with the separation boundary set at the mesh size of # 0.5 mm. The smaller particles with an equivalent diameter of d70 = 0.06 mm determine the rheological properties of carrier fluid. The remaining particles move with the fluid but under certain conditions settle and accumulate in various locations within the tank. A proper understanding of the properties of digested pulp facilitates the accurate planning of experiments on a physical or mathematical model. Conducting simulations and analysing the results can be employed in the design of digestion tanks, enabling more efficient stirring of digested pulp with lower energy consumption and increased energy efficiency of the overall process.
The rheological aspects in digestion chambers of biogas plants fuelled by highly heterogeneous substrates have not been extensively addressed to date or have only been sporadically examined in studies conducted by stirrer manufacturers, whose results are generally preliminary and partial. Meanwhile, issues related to proper stirring are incredibly important from the perspective of optimal fermentation management.
The rheological behaviour of digested pulp with a significant content of coarse-grained biomass (including lignocellulosic biomass) remains an open question. Although individual studies using methods such as a slump test, Bostwick consistometer, and shear device can be found [77], there is no consistent methodology for conducting rheological studies on digested pulp from full-scale systems.
Publications [35,36] focused on the rheological properties of digested pulp highlight the transport, preparation, and storage of samples in accordance with the VDI 4630 standard [51]. Handling digested pulp samples according to the procedures outlined in the VDI 4630 standard [51] can distort the results of studies on rheological properties. Employing preparatory procedures to obtain a homogeneous sample may alter the rheological properties of carrier fluid through greater fragmentation of organic substance than that occurring in the fermenter. The VDI 4630 standard [51] assumes that since digested pulp is stirred in the reactor, additional stirring will not significantly change its physicochemical properties. In reality, however, it can alter the rheological properties. Stirring several samples taken from different locations within the reactor to homogenise the sample composition according to the VDI 4630 standard [51] can provide characteristics of the stirred sample rather than representing the actual material in the reactor. If samples taken from various reactor locations exhibit different physical and biochemical properties, they are even more likely to demonstrate distinct rheological characteristics. Stirring such samples and homogenising through stirring can result in rheological properties that do not occur anywhere within the reactor volume. Such rheological properties would be exhibited by digested pulp if it were thoroughly stirred in the reactor, and in actual reactors there may be zones, e.g., above the bottom, below the free surface, where the digested pulp will have different rheological properties. This applies almost exclusively to digestion tanks in which stirring occurs asymmetrically throughout the tank volume. Specifically, it pertains to digestion chambers typical of biogas plants, where stirring is carried out using 2–4 stirrers positioned on/near the sidewall of the fermenter. In the case of the Przybroda biogas plant in question, the study used biogas plants with fermenters equipped with a vertical tube stirrer, which ensures symmetrical, homogeneous, and highly efficient stirring of the entire volume of the digestion tank. Consequently, regardless of the sampling location within the tank, the sample will possess the same parameters.
The procedure specified in the VDI 4630 standard [51] for particle comminution to sizes smaller than 10 mm also contributes to changing the proportions of particles of certain sizes. Homogenisation results in a reduction in large particles (aggregates) in favour of a large number of particles. Such action influences the rheological parameters of carrier fluid. In rheological studies, it is more appropriate to separate individual fractions and determine the influence of each on rheological parameters rather than standardising particle sizes.
An analogy can be used for the pretreatment of substrates prior to feeding them into the reactor to demonstrate how much of a difference the comminution—homogenisation of the substrate—can make. Several studies proved that mechanical breakdown and consequently, particle size reduction, lead to decreased viscosity [25,77,78,79,80]. Researchers comparing digested pulp from biogas plants with and without mechanical treatment found viscosity deviations of up to 52.5% [81]. Similarly, based on the presented research, it can be assumed that comminution can significantly impact the rheological parameters of samples.
On the other hand, the use of methods based on sieving digested pulp, like homogenisation, proves to be a questionable solution. Some studies [80,81] revealed that the effect of particle size on flow is more noticeable at higher solid substance contents. Therefore, reducing the number of solid particles or entirely removing them alters the flow characteristics of digested pulp and its viscosity. This implies that sieving affects the rheological behaviour of digested pulp, and rheological results can only be meaningfully compared with results obtained from untreated digested pulp within a very limited range [37,58,80,81,82]. Consequently, it is suggested separating individual fractions and determining the influence of each on rheological parameters, rather than standardising particle sizes, as suggested by the VDI 4630 standard [51].
As shown by the presented research, the prolonged transport and storage of samples alter the rheological properties of digested pulp. Stopping biological processes by lowering the sample temperature to storage temperature to 4 °C, and subsequently restarting them by heating the sample, does not necessarily result in the restoration of the physical and biochemical parameters affecting the rheological properties of digested pulp. It should be assumed that such restoration is relatively unlikely or will only occur after a certain period (but determining an appropriately long period also seems quite unrealistic). Therefore, further research is required on the impact of sample storage conditions on rheological properties.
The developed procedure (sampling, transport, storage, preparation for rheological measurements, and the measurements themselves) heavily considers the specificity of the examined material (digested pulp), which ages due to biological activity and temperature changes (samples of collected digested pulp are usually at 38–40 °C). The procedure was designed to ensure that the laboratory-tested sample closely matches the parameters of the sample at the time of collection from the biogas plant fermenters. Samples of digested pulp or composted material intended for typical physical and chemical analyses should be rapidly cooled using existing methodologies, delivered to the laboratory, and placed in a refrigerator at temperatures between 0–4 °C. This is performed to halt biological activity and any biochemical processes [83]. Bacteria influence the rheological parameters of fluid without altering its structure from homogenous to heterogeneous [84,85,86]. However, in the developed methodology described in the study, maintaining the parameters of the collected digested pulp is crucial, as it is assumed that there is an effect of bacterial activity on its rheological properties.
In the analysis of the shapes of solid particles larger than 0.5 mm, methods used in sedimentology or for describing riverbeds were successfully applied. However, unlike mineral particles, it should be noted that the majority of digested pulp particles have an elongated shape (Classes III and IV) and fewer are rounded or spherical (Class II or I), which is effectively illustrated by the Zingg diagram (Figure 14).
The analysis of photographs allows the association of characteristic shapes and plant components within the digested pulp. Rounded parts correspond to seeds, while elongated parts represent plant stem fragments or grass leaves (Figure 15).
The use of the triangular diagram and the application developed by Graham [75] enables assigning one of ten distinguished shapes to digested pulp particles and presenting the results in a comprehensible manner (Figure 16).
The rheological properties of digested pulp can be determined for carrier fluid after the prior separation of larger solid particles from the mixture. The analysis of rheological properties of carrier fluid makes it possible to separate out the influence of solid particles (e.g., fibrous particles), which will depend on the qualitative composition and quantitative contribution. The effect of solid particles on the rheological properties of digested pulp can then be determined for a defined substrate composition. This approach, with describing the rheological parameters of the carrier liquid and then modifying the properties depending on the granulometric composition of larger particles, is partially justified due to computational techniques using numerical fluid dynamics (CFD). There are two ways (approaches) for determining the rheological properties of fermentation pulp: The first is one in which the influence of individual components, i.e., carrier liquid and solid particles, on the rheological properties is not isolated. The second method (approach) takes into account the rheological properties of the carrier liquid and the complementary (complementary) influence of solid particles. It is expected that the second method will enable selective consideration of the bioreactor feed on the overall rheological properties. The significant share of particles, also with non-spherical shapes, indicated in the article indicates the need to take into account numerical models for non-Newtonian fluids with particle tracking, such as CFD-DEM [87,88,89] and DEM-MPS [90].

6. Conclusions

Previous studies on the rheology of sludges and digested pulp from agricultural biogas plants were limited and scarce, partly due to the availability of installations. Another issue was the post-fermentation material itself, which hindered research on actual biomass. These studies are complex and time-consuming enough to be conducted during stirring. On the other hand, parameters and relationships (e.g., temperature-related) are crucial from the perspective of optimising processes in bioreactors. There is also a lack of a structured methodology for such research.
Previous research revealed a serious issue related to result reproducibility. The following factors strongly influenced measurement outcomes: sample age, sampled volume, heating time, transport time, storage time, storage temperature, sample-forming particle size. Given the variability of substrates, it can generally be assumed that their properties will change materially, spatially, and temporally. These changes reflect their homogeneous/nonhomogeneous or heterogeneous structures, knowledge of which is fundamentally important for quality sample collection.
In the literature, it is possible to find attempts to study the rheology of digested pulp using methods designed for Newtonian fluids, which digested pulp is not. Due to the fibrous structure of digested pulp and large particles affecting measurement conditions, certain rheometer designs are unsuitable for application.
Taking into account the outlined research problem, this paper aims to present a methodology for assessing the rheological parameters of digested pulp from an agricultural biogas plant, where, as a result of previous measurements, it has been possible to develop a procedure and range of measurements to correctly determine the rheological parameters of digested pulp. The applicability of the coaxial cylinder measurement system was demonstrated for assessing the rheological parameters of digested pulp from a fermenter that utilises agricultural biomass. The Zingg diagram was used, among other methods, for determining the characteristics of solid particles, allowing the comparison of particles from each fraction. The analysis of the shape and size of solid particles may help to describe the onset of motion of this phase, flow type, or sedimentation type.
The methodology proposed and the scenario of the entire study allowed scalable and comparable test results to be achieved in any laboratory. Conducted and repeated experiments revealed that the use of the presented procedure in the paper makes it possible to obtain reliable, reproducible results.

Author Contributions

Conceptualization T.K., M.G. and J.D.; methodology, M.G., P.Z., T.K. and J.M.; validation, M.G., P.Z. and R.M.; formal analysis, M.P., W.C. and J.M.; investigation, M.G., J.M. and R.M.; resources, J.D.; data curation, M.G., P.Z., J.M. and J.D.; writing—original draft preparation, M.G., T.K., J.M., W.C. and P.Z.; writing—review and editing, W.C. All authors have read and agreed to the published version of the manuscript.

Funding

This research was funded by “Publication was co-financed within the framework of the Polish Ministry of Science and Higher Education’s program: “Regional Excellence Initiative” in the years 2019–2023 (No. 005/RID/2018/19)”, with financing amount 12,000,000.00 PLN.

Data Availability Statement

The original contributions presented in the study are included in the article, further inquiries can be directed to the corresponding author.

Conflicts of Interest

The authors declare no conflict of interest. The funders had no role in the design of the study; in the collection, analyses, or interpretation of data; in the writing of the manuscript; or in the decision to publish the results.

Abbreviations

BMSBall measuring system
CFDComputational fluid dynamics
CRControlled shear rate
CS Controlled shear stress
DEMDiscrete element method
MAEMean absolute error
MAPEMean absolute percentage error
MPSMoving particle semi-implicit
RESRenewable energy sources
PEPercentage error

References

  1. Alao, M.A.; Popoola, O.M.; Ayodele, T.R. Waste-to-energy nexus: An overview of technologies and implementation for sustainable development. Clean Energy Syst. 2022, 3, 100034. [Google Scholar] [CrossRef]
  2. Kałuża, T.; Hämmerling, M.; Zawadzki, P.; Czekała, W.; Kasperek, R.; Sojka, M.; Mokwa, M.; Ptak, M.; Szkudlarek, A.; Czechlowski, M.; et al. The hydropower sector in Poland: Historical development and current status. Renew. Sustain. Energy Rev. 2022, 158, 112150. [Google Scholar] [CrossRef]
  3. Kałuża, T.; Hämmerling, M.; Zawadzki, P.; Czekała, W.; Kasperek, R.; Sojka, M.; Mokwa, M.; Ptak, M.; Szkudlarek, A.; Czechlowski, M.; et al. The hydropower sector in poland: Barriers and the outlook for the future. Renew. Sustain. Energy Rev. 2022, 163, 112500. [Google Scholar] [CrossRef]
  4. Mazurkiewicz, J. Energy and Economic Balance between Manure Stored and Used as a Substrate for Biogas Production. Energies 2022, 15, 413. [Google Scholar] [CrossRef]
  5. Pochwatka, P.; Kowalczyk-Juśko, A.; Sołowiej, P.; Wawrzyniak, A.; Dach, J. Biogas plant exploitation in a middle-sized dairy farm in Poland: Energetic and economic aspects. Energies 2020, 13, 6058. [Google Scholar] [CrossRef]
  6. Czekała, W. Agricultural Biogas Plants as a Chance for the Development of the Agri-Food Sector. J. Ecol. Eng. 2018, 19, 179–183. [Google Scholar] [CrossRef] [PubMed]
  7. Kozłowski, K.; Mazurkiewicz, J.; Chełkowski, D.; Jeżowska, A.; Cieślik, M.; Brzoski, M.; Smurzyńska, A.; Dongmin, Y.; Wei, Q. The effect of mixing during laboratory fermentation of maize straw with thermophilic technology. J. Ecol. Eng. 2018, 19, 93–98. [Google Scholar] [CrossRef]
  8. Annas, S.; Jantzen, H.-A.; Scholz, J.; Janoske, U. A scale-up strategy for the fluid flow in biogas plants. Chem. Eng. Technol. 2018, 41, 739–746. [Google Scholar] [CrossRef]
  9. Czekała, W.; Jasiński, T.; Grzelak, M.; Witaszek, K.; Dach, J. Biogas Plant Operation: Digested pulp as the Valuable Product. Energies 2022, 15, 8275. [Google Scholar] [CrossRef]
  10. Kowalczyk-Juśko, A.; Pochwatka, P.; Zaborowicz, M.; Czekała, W.; Mazurkiewicz, J.; Mazur, A.; Janczak, D.; Marczuk, A.; Dach, J. Energy value estimation of silages for substrate in biogas plants using an artificial neural network. Energy 2020, 202, 117729. [Google Scholar] [CrossRef]
  11. Westerholm, S.B.M.; Qiao, W.; Mahdy, A.; Xiong, L.; Yin, D.; Fan, R.; Dach, J.; Dong, R. Enhanced methanogenic performance and metabolic pathway of high solid anaerobic digestion of chicken manure by Fe2+ and Ni2+ supplementation. Waste Manag. 2019, 94, 10–17. [Google Scholar] [CrossRef]
  12. Yu, Q.; Liu, R.; Li, K.; Ma, R. A review of crop straw pretreatment methods for biogas production by anaerobic digestion in China. Renew. Sustain. Energy Rev. 2019, 107, 51–58. [Google Scholar] [CrossRef]
  13. Jurgutis, L.; Šlepetienė, A.; Šlepetys, J.; Cesevičienė, J. Towards a Full Circular Economy in Biogas Plants: Sustainable Management of Digested pulp for Growing Biomass Feedstocks and Use as Biofertilizer. Energies 2021, 14, 4272. [Google Scholar] [CrossRef]
  14. Satjaritanun, P.; Khunatorn, Y.; Vorayos, N.; Shimpalee, S.; Bringley, E. Numerical analysis of the mixing characteristic for napier grass in the continuous stirring tank reactor for biogas production. Biomass Bioenergy 2016, 86, 53–64. [Google Scholar] [CrossRef]
  15. Ghanimeh, S.A.; Al-Sanioura, D.N.; Saikaly, P.E.; El-Fadel, M. Correlation between system performance and bacterial composition under varied mixing intensity in thermophilic anaerobic digestion of food waste. J. Environ. Manag. 2018, 206, 472–481. [Google Scholar] [CrossRef] [PubMed]
  16. Lindmark, J.; Thorin, E.; Fdhila, R.B.; Dahlquista, E. Effects of mixing on the result of anaerobic digestion: Review. Renew. Sustain. Energy Rev. 2014, 40, 1030–1047. [Google Scholar] [CrossRef]
  17. Huang, Y.K.; Dehkordy, F.M.; Li, Y.; Emadi, S.; Bagtzoglou, A.; Li, B.K. Enhancing Anaerobic Fermentation Performance Through Eccentrically Stirred Mixing: Experimental and Modeling Methodology. Chem. Eng. J. 2018, 334, 1383–1391. [Google Scholar] [CrossRef]
  18. Annas, S.; Elfering, M.; Jantzen, H.-A.; Scholz, J.; Janoske, U. Experimental analysis of mixing-processes in biogas plants. Chem. Eng. Science. 2022, 258, 11776. [Google Scholar] [CrossRef]
  19. Chang, C.-C.; Kuo-Dahab, C.; Chapman, T.; Mei, Y. Anaerobic digestion, mixing, environmental fate, and transport. Water Environ. Res. 2019, 91, 1210–1222. [Google Scholar] [CrossRef]
  20. Singh, B.; Szamosi, Z.; Siménfalvi, Z. Impact of mixing intensity and duration on biogas production in an anaerobic digester: A review. Crit. Rev. Biotechnol. 2020, 40, 508–521. [Google Scholar] [CrossRef]
  21. Naegele, H.J.; Lemmer, A.; Oechsner, H.; Jungbluth, T. Electric energy consumption of the full-scale research biogas plant” unterer lindenhof”: Results of longterm and full detail measurements. Energies 2012, 5, 5198–5214. [Google Scholar] [CrossRef]
  22. Low, S.C.; Eshtiaghi, N.; Slatter, P.; Baudez, J.-C.; Parthasarathy, R. Mixing characteristics of sludge simulant in a model anaerobic digester. Bioproc. Biosyst. Eng. 2016, 39, 473–483. [Google Scholar] [CrossRef] [PubMed]
  23. Jobst, K.; Lomtscher, A.; Deutschmann, A.; Fogel, S.; Rostalski, K.; Stempin, S.; Brehmer, M.; Kraume, M. Optimierter Betrieb von Rührsystemen in Biogasanlagen. In Biogas in der Landwirtschaft: Stand und Perspektiven; KTBL: Darmstadt, Germany, 2015; pp. 140–150. Available online: https://www.ktbl.de/fileadmin/user_upload/Artikel/Energie/Biogastagung/11508.pdf (accessed on 2 January 2024).
  24. Lemmer, A.; Naegele, H.-J.; Sondermann, J. How Efficient are Agitators in Biogas Digesters? Determination of the Efficiency of Submersible Motor Mixers and Incline Agitators by Measuring Nutrient Distribution in Full-Scale Agricultural Biogas Digesters. Energies 2013, 6, 6255–6273. [Google Scholar] [CrossRef]
  25. Hernandez-Shek, A.; Mottelet, S.; Peultier, P.; Pauss, A.; Ribeiro, T. Development of devices for the determination of the rheological properties of coarse biomass treated by dry anaerobic digestion. Bioresour. Technol. Reports. 2021, 15, 100686. [Google Scholar] [CrossRef]
  26. Šafarič, L. Anaerobic Digester Fluid Rheology and Process Efficiency. Interactions of Substrate Composition, Trace Element Availability, and Microbial Activity, Linköping Studies in Arts and Science No. 768 Faculty of Arts and Sciences, Linköping. 2019. Available online: https://www.diva-portal.org/smash/get/diva2:1301565/FULLTEXT01.pdf (accessed on 2 January 2024).
  27. Schneider, N.; Gerber, M. Rheological properties of digested pulp from agricultural biogas plants: An overview of measurement techniques and influencing factors. Renew Sustain. Energy. Rev. 2020, 121, 109709. [Google Scholar] [CrossRef]
  28. Pohn, S.; Kamarad, L.; Kirchmayr, R.; Harasek, M. Design, calibration and numerical investigation of a macro viscosimeter. In Proceedings of the 19th International Congress of Chemical and Process Engineering CHISA, Prague, Czech, 28 August–1 September 2010. [Google Scholar]
  29. Monch-Tegeder, M.; Lemmer, A.; Hinrichs, J.; Oechsner, H. Development of an in-line process viscometer for the full-scale biogas process. Bioresour. Technol. 2015, 178, 278–284. [Google Scholar] [CrossRef] [PubMed]
  30. Macosko, C.W. Rheology: Principles, Measurements, and Applications; Wiley-VCH: New York, NY, USA, 1994. [Google Scholar]
  31. Mezger, T.G. The Rheology Handbook: For Users of Rotational and Oscillatory Rheometers, 3rd Revised ed.; European Coatings Tech Files; Vincentz Network: Hanover, Germany, 2020. [Google Scholar]
  32. Ewoldt, R.H.; Johnston, M.T.; Caretta, L.M. Experimental challenges of shear rheology: How to avoid bad data. In Complex Fluids in Biological Systems; Spagnolie, S., Ed.; Springer: Berlin/Heidelberg, Germany, 2015. [Google Scholar] [CrossRef]
  33. Ismail, N.I.; Kuang, S.; Zheng, E.; Yu, A. Modeling and analysis of fluid rheology effect on sand screen performance. Powder Technol. 2022, 411, 117961. [Google Scholar] [CrossRef]
  34. Seyssiecq, I.; Karrabi, M.; Roche, N. In situ rheological characterisation of wastewater sludge: Comparison of stirred bioreactor and pipe flow configurations. Chem. Eng. J. 2015, 259, 205–212. [Google Scholar] [CrossRef]
  35. Gienau, T.; Kraume, M.; Rosenberger, S. Rheological characterization of anaerobic sludge from agricultural and bio-waste biogas plants. Chem. Ing. Tec. 2018, 90, 988–997. [Google Scholar] [CrossRef]
  36. Jobst, K.; Lincke, M. Modification of measuring systems for the application to flow behaviour determination of fibrous suspensions. In Collection of Methods for Biogas: Methods to Determine Parameters for Analysis Purposes and Parameters That Describe Processes in the Biogas Sector; Leipzig, J., Liebetrau, D., Pfeiffer, D.T., Eds.; DBFZ: Leipzig, Germany, 2016; pp. 114–124. [Google Scholar]
  37. Brehme, M.K. Measurement methods for the rheologic characterisation of fermentation substrates. In Collection of Methods for Biogas: Methods to Determine Parameters for Analysis Purposes and Parameters That Describe Processes in the Biogas Sector; Leipzig, J., Liebetrau, D., Pfeiffer, D.T., Eds.; DBFZ: Leipzig, Germany, 2016; pp. 105–124. [Google Scholar]
  38. Schatzmann, M.; Bezzola, G.R.; Minor, H.E.; Windhab, E.J.; Fischer, P. Rheometry for large-particulated fluids: Analysis of the ball measuring system and comparison to debris flow rheometry. Rheol Acta 2009, 48, 715–733. [Google Scholar] [CrossRef]
  39. Fakhari, A.; Galindo-Rosales, F.J. Numerical assessment of the penetroviscometer approach for large, rapid and transient shear deformations. arXiv 2020. [Google Scholar] [CrossRef]
  40. Cruz, N.; Forster, J.; Bobicki, E.R. Slurry rheology in mineral processing unit operations, A critical review. Can. J. Chem. Eng. 2019, 97, 2102–2120. [Google Scholar] [CrossRef]
  41. Lefebvre, L.P.; Whiting, J.; Nijikovsky, B.; Brika, S.E.; Fayazfar, H.; Lyckfeldt, O. Assessing the robustness of powder rheology and permeability measurements. Addit. Manuf. 2020, 35, 101203. [Google Scholar] [CrossRef]
  42. de Goede, T.C.; de Bruin, K.G.; Bonn, D. High-velocity impact of solid objects on Non-Newtonian Fluids. Sci. Rep. 2019, 9, 1250. [Google Scholar] [CrossRef]
  43. Wolski, P. Analysis of Rheological Models of Modified Sewage Sludge. Annu. Set Environ. Prot. 2017, 19, 230–239. Available online: https://yadda.icm.edu.pl/baztech/element/bwmeta1.element.baztech-18656c22-ab15-41d2-b74f-992b8a9f010f/c/13_wolski_analysis_ROS_2017.pdf (accessed on 2 January 2024).
  44. Beugre, E.Y.-M.; Gnagne, T. Vane geometry for measurement of influent rheological behavior in dry anaerobic digestion. Renew. Sust. Energ. Rev. 2022, 155, 111928. [Google Scholar] [CrossRef]
  45. Cao, X.; Jiang, Z.; Cui, W.; Wang, Y.; Yang, P. Rheological Properties of Municipal Sewage Sludge: Dependency on Solid Concentration and Temperature. Proc. Environ. Sci. 2016, 31, 113–121. [Google Scholar] [CrossRef]
  46. Sozański, M.; Kempa, E.; Grocholski, K.; Bień, J. The rheological experiment in sludge properties research. Water Sci. Technol. 1997, 36, 69–78. [Google Scholar] [CrossRef]
  47. Baroutian, S.; Eshtiaghi, N.; Gapes, D.J. Rheology of a primary and secondary sewage sludge mixture: Dependency on temperature and solid concentration. Bioresour. Technol. 2013, 140, 227–233. [Google Scholar] [CrossRef]
  48. Chmiel, H.; Takors, R.; Weuster-Botz, D. Bioprozesstechnik; Springer: Berlin/Heidelberg, Germany, 2018. [Google Scholar] [CrossRef]
  49. Redlinger-Pohn, J.D.; Jagiello, L.A.; Bauer, W.; Radl, S. Mechanistic understanding of size-based fiber separation in coiled tubes. Int. J. Multiph. Flow. 2016, 83, 239–253. [Google Scholar] [CrossRef]
  50. Schmid, C.F.; Switzer, L.H.; Klingenberg, D.J. Simulations of fiber flocculation: Effects of fiber properties and interfiber friction. J. Rheol. 2000, 44, 781–809. [Google Scholar] [CrossRef]
  51. VDI 4630; Fermentation of Organic Materials—Characterization of the Substrate, Sampling, Collection of Material Data, Fermentation Tests. Verlag des Vereins Deutscher Ingenieure: Düsseldorf, Germany, 2016. Available online: https://www.scirp.org/reference/referencespapers?referenceid=1932350 (accessed on 2 January 2024).
  52. Vasilyev, A.L.; Lavrenko, S.L.; Gruszczynski, M. Experimental studies of rheological properties of stowing pulps. J. Phys. Conf. Ser. 2018, 1118, 012045. [Google Scholar] [CrossRef]
  53. Dhodapkar, S.; Jacob, K.; Hu, S. Fluid-solid flow in duct. In Multiphase Flow Handbook; Crowe, C.T., Ed.; CRC Press Taylor & Francis Group: Abingdon, UK, 2006; Chapter 4. [Google Scholar]
  54. Mazur, R.; Kałuża, T.; Chmist, J.; Walczak, N.; Laks, I.; Strzeliński, P. Influence of deposition of fine plant debris in river floodplain shrubs on flood flow conditions—The Warta River case study. Phys. Chem. Earth 2016, 94, 106–113. [Google Scholar] [CrossRef]
  55. Jewell, R.J.; Fourie, A.B. Paste and Thickened Tailings: A Guide, 2nd ed.; Australian Centre for Geomechanics, The University of Western Australia: Nedlands, Australia, 2006. [Google Scholar]
  56. Wilson, K.C.; Addie, G.R.; Sellgren, A.; Clift, R. Slurry Transport Using Centrifugal Pumps; Springer: New York, NY, USA, 1997. [Google Scholar]
  57. Shook, C.A.; Roco, M.C. Slurry Flow: Principles and Practice; Butterworth–Heinemann, a division of Reed Publishing: Oxford, UK, 1991. [Google Scholar] [CrossRef]
  58. Dziubiński, M.; Kiljańsk, T.; Sęk, J. Theoretical Basis and Measurement Methods of Rheology; Lodz University of Technology Publishers: Łódź, Poland, 2014. (In Polish) [Google Scholar]
  59. May, C.J.; Henderson, K.O. Rheological Measurement Methods and Equipment. In Encyclopedia of Tribology; Wang, Q.J., Chung, Y.W., Eds.; Springer: Boston, MA, USA, 2013; pp. 2777–2787. [Google Scholar] [CrossRef]
  60. Schramm, G. A Practical Approach to Rheology and Rheometry, 2nd ed.; Thermo Electron (Karlsruhe) GmbH, Federal Republic of Germany: Karlsruhe, Germany, 2004; Available online: https://www.ifi.es/wp-content/uploads/2021/06/Rheology-Book.pdf (accessed on 6 July 2023).
  61. Barnes, H.A. Measuring the viscosity of large-particle (and flocculated) suspensions—A note on the necessary gap size of rotational viscometer. J. Non-Newton. Fluid Mech. 2020, 94, 213–217. [Google Scholar] [CrossRef]
  62. DIN 53019-1; Viscometry-Measurement of viscosities and flow curves by means of rotational viscometers-Part 1: Principles and geometry of measuring system. Deutsches Institut fur Normung E.V. (DIN): Berlin, Germany, 2008.
  63. Montgomery, L.F.R.; Schoepp, T.; Fuchs, W.; Bochmann, G. Design, Calibration and Validation of a Large Lab-Scale System for Measuring Viscosity in Fermenting Substrate from Agricultural Anaerobic Digesters. Biochem. Eng. J. 2016, 115, 72–79. [Google Scholar] [CrossRef]
  64. Koll, C. Aufnahme, Auswertung und Beurteilung rheologischer Parameter zur Auslegung und Simulation von Fördereinheiten sowie Rühraggregaten in Biogasanlagen. Master’s Thesis, Hochschule Hannover, Hannover, Germany, 2012. [Google Scholar] [CrossRef]
  65. Chen, X.; Shi, X.; Zhou, J.; Chen, Q.; Yang, C. Feasibility of Recycling Ultrafine Leaching Residue by Backfill: Experimental and CFD Approaches. Minerals 2017, 7, 54. [Google Scholar] [CrossRef]
  66. Bridge, J.S.; Bennett, S.J. A model for entrainment and transport of sediment grains of mixed sizes, shapes and densities. Water Resour. Res. 1992, 28, 337–363. [Google Scholar] [CrossRef]
  67. Książek, L.; Mitka, B.; Mrokowska, M.; Nones, M.; Phan, C.N.; Przyborowski, Ł.; Strużyński, A.; Wojak, S.; Wyrębek, M. Application of digital close-range photogrammetry to determine changes in gravel bed surface due to transient flow conditions. Publ. Inst. Geophys. Pol. Acad. Sci. 2021, 434, 95–96. [Google Scholar]
  68. Mumot, J.; Tymiński, T. Hydraulic research of sediment transport in the vertical slot fish passes. J. Ecol. Eng. 2016, 17, 143–148. [Google Scholar] [CrossRef]
  69. Szałkiewicz, E.; Dysarz, T.; Kałuża, T.; Malinger, A.; Radecki-Pawlik, A. Analysis of in-stream restoration structures impact on hydraulic condition and sedimentation in the Flinta River, Poland, Carpathian. J. Earth Environ. Sci. 2019, 14, 275–286. [Google Scholar] [CrossRef]
  70. Blott, S.J.; Pye, K. Particle shape: A review and new methods of characterization and classification. Sedimentology 2008, 55, 31–63. [Google Scholar] [CrossRef]
  71. Szabó, T.; Domokos, G. A new classification system for pebble and crystal shapes based on static equilibrium points. Cent. Eur. Geol. 2010, 53, 1–19. [Google Scholar] [CrossRef]
  72. Zingg, T. Beitrag zur Schotteranalyse.—Schweizeriscke Mineralogische und Petrologische Mitteilungen. Doctoral Thesis, ETH Zurich Research Collection, Zurich, Switzerland, 1935. [Google Scholar] [CrossRef]
  73. Sneed, E.; Folk, R.L. Pebbles in the lower Colorado River, Texas, a study in particle morphogenesis. J. Geol. 1958, 66, 114–150. Available online: https://www.journals.uchicago.edu/doi/abs/10.1086/626490 (accessed on 2 January 2024). [CrossRef]
  74. Javris, P.; Jefferson, B.; Parsons, S.A. Measuring floc structural characteristics. Rev. Environ. Sci. Bio/Technol. 2005, 4, 1–18. [Google Scholar] [CrossRef]
  75. Graham, D.J. TRI-PLOT. Ternary Diagram Plotting Software. 2000. Available online: https://triplot.software.informer.com/download/ (accessed on 2 January 2024).
  76. Graham, D.J.; Midgley, N.G. Graphical representation of particle shape using triangular diagrams: An excel spreadsheet method. Earth Surf. Process. Landf. 2000, 25, 1473–1477. [Google Scholar] [CrossRef]
  77. Fraunhofer IKTS/TU Berlin/KSB AG, Entwicklung eines Steuerungs- und Regelkonzeptes für Mischprozesse in Biogasfermentern auf der Basis zu validierender Prozessmodelle. Final Report, Dresden. 2017. Available online: https://www.fnr.de/index.php?id=11150&fkz=22023012 (accessed on 8 August 2023).
  78. Kamarád, L.; Pohn, S.; Bochmann, G.; Harasek, M. Determination of mixing quality in biogas plant digesters using tracer tests and computational fluid dynamics, Acta Universit. Agricult. Et Silvic. Mendel. Brun. 2013, 61, 1269–1278. [Google Scholar] [CrossRef]
  79. Kube, J.; Köhnlechner, M.; Thurner, F. Einfache Methode zur online-Bestimmung der Viskosität von Gärsubstraten in Biogasanlagen. 2011, pp. 83–91. Available online: https://serwiss.bib.hs-hannover.de/frontdoor/deliver/index/docId/386/file/MA-Koll-2012.pdf (accessed on 2 January 2024).
  80. Tian, L.; Shen, F.; Yuan, H.; Zou, D.; Liu, Y.; Zhu, B.; Li, X. Reducing Agitation Energy-Consumption by Improving Rheological Properties of Corn Stover Substrate in Anaerobic Digestion. Bioresour. Technol. 2014, 168, 86–91. [Google Scholar] [CrossRef]
  81. Basedau, D.; Lüdersen, U.; Glasmacher, B. Rheologische Charakterisierung von Fermentersuspensionen. Chemie Ingenieur Technik. 2015, 87, 543–548. [Google Scholar] [CrossRef]
  82. Hreiz, R.; Adouani, N.; Fünfschilling, D.; Marchal, P.; Pons, M.-N. Rheological Characterization of Raw and Anaerobically Digested Cow Slurry. Chem. Eng. Res. Design. 2017, 119, 47–57. [Google Scholar] [CrossRef]
  83. Pilarska, A.A.; Wolna-Maruwka, A.; Pilarski, K. Kraft lignin grafted with polyvinylpyrrolidone as a novel microbial carrier in biogas production. Energies 2018, 11, 3246. [Google Scholar] [CrossRef]
  84. Bansil, R.; Celli, J.P.; Hardcastle, J.M.; Turner, B.S. The influence of mucus microstructure and rheology in Helicobacter pylori infection. Front. Immunol. 2013, 4, 310. [Google Scholar] [CrossRef] [PubMed]
  85. Persat, A.; Nadell, C.D.; Kim, M.K.; Ingremeau, F.; Siryaporn, A.; Drescher, K.; Wingreen, N.S.; Bassler, B.L.; Gitai, Z.; Stone, H.A. The mechanical world of bacteria. Cell 2015, 161, 988–997. [Google Scholar] [CrossRef]
  86. Jankowska, H.; Dzido, A.; Krawczyk, P. Determination of Rheological Parameters of Non-Newtonian Fluids on an Example of Biogas Plant Substrates. Energies 2023, 16, 1128. [Google Scholar] [CrossRef]
  87. Smuts, E.M.; Deglon, D.A.; Meyer, C.J. A coupled CFD-DEM model for simulating the rheology of particulate suspensions. Prog. Comput. Fluid Dyn. 2017, 17, 290–301. [Google Scholar] [CrossRef]
  88. Li, X.; Zhao, J. Dam-Break of Mixtures Consisting of Non-Newtonian Liquids and Granular Particles. Powder Technol. 2018, 338, 493–505. [Google Scholar] [CrossRef]
  89. Zhong, W.; Yu, A.; Liu, X.; Tong, Z.; Zhang, H. DEM/CFD-DEM Modelling of Non-spherical Particulate Systems: Theoretical Developments and Applications. Powder Technol. 2016, 302, 108–152. [Google Scholar] [CrossRef]
  90. Li, J.-J.; Qiu, L.-C.; Tian, L.; Yang, Y.-S.; Han, Y. Modeling 3D non-Newtonian solid–liquid flows with a free-surface using DEM-MPS. Eng. Anal. Bound. Elem. 2019, 105, 70–77. [Google Scholar] [CrossRef]
Figure 1. Three-meter-thick scum in the fermenter (a) and 2.5 m-thick bottom sludge (b) in the fermenter of a typical agricultural biogas plant (after draining the liquid fraction of the digested pulp).
Energies 17 00965 g001
Figure 2. View of the biogas plant at the Agricultural and Orchard Experimental Farm in Przybroda (Jacek Dach).
Energies 17 00965 g002
Figure 3. Feed preparation (a,b); central stirrer in the digestion tank (c) (Jacek Dach).
Energies 17 00965 g003
Figure 4. Schematic drawing of the procedure for handling digested pulp for its characterization.
Energies 17 00965 g004
Figure 5. Scheme and dimensions of the MV-2 system (Manual HAAKE Viscotester, Thermo Fisher Scientific, Karlsruhe, Germany).
Energies 17 00965 g005
Figure 6. Scheme and dimensions of the MV-DIN system (Manual HAAKE Viscotester, Thermo Fisher Scientific, Karlsruhe, Germany).
Energies 17 00965 g006
Figure 7. Examples of flow curve shift in the position of the curve for samples collected on 12 June 2021 and 13 June 2021.
Energies 17 00965 g007
Figure 8. Size distribution of particles smaller than 0.5 mm.
Energies 17 00965 g008
Figure 9. Grain size distribution curves for particles with diameters greater than 0.5 mm for sample a (10 February 2023) and sample b (11 February 2023).
Energies 17 00965 g009
Figure 10. Particles retained at # 10 mm (a) and # 2 mm (b).
Energies 17 00965 g010
Figure 11. Classification of solid particle shapes: (a) Zingg diagram with 4 classes: Disc (I), Sphere (II), Blade (III), Rod (IV); (b) triangular diagram proposed by Sneed and Folk: Compact (C), Compact-platy (CP), Compact-bladed (CB), Compact-elongated (CE), Platy (P), Bladed (B), Elongated (E), Very platy (VP), Very bladed (VB), Very elongated (VE) [71].
Energies 17 00965 g011
Figure 12. Zingg diagrams for: (a) # 10 mm, (b) # 2 mm, where the red lines are the boundaries of the area classifying the shape, and × is the calculated parameter of a given particle.
Energies 17 00965 g012
Figure 13. Triangular diagrams for all analysed solid particles larger than 0.5 mm.
Energies 17 00965 g013
Figure 14. The Zingg diagram for all fractions of digested pulp particles of the Przybroda biogas plant, where the red lines are the boundaries of the area classifying the shape.
Energies 17 00965 g014
Figure 15. Selected characteristic shapes of digested pulp particles as recognized plant fragments: IV (Rode)—stems; III (Blade) and I (Disc)—leaf fragments; II (Sphere)—seeds, where the red lines are the boundaries of the area classifying the shape, and symbols + is the calculated parameter of a given particle.
Energies 17 00965 g015
Figure 16. Shapes of solid particles larger than 0.5 mm in digested pulp plotted on the triangular diagram.
Energies 17 00965 g016
Table 1. Rheological models used in the research.
Rheological ModelsOstwald–de Waele Relationship, ModelBingham ModelHerschel–Bulkley Model
formula τ = K O · γ n O τ = τ 0 + γ · η B τ = τ H + K H · γ n H
symbolsγ [1/s]: shear rate
τ [Pa]: shear stress
KO [Pa·sn]: flow consistency index
nO [-]: flow behaviour index
τo [Pa]: Bingham yield stress
ηB [kg/m·s]: Bingham viscosity
τH [Pa]: Herschel–Bulkley yield stress
KH [Pa·sn]: flow consistency index, flow coefficient
nH [-]: flow behaviour index, Herschel–Bulkley index
Table 2. Results of measurements of rheological parameters from two measurement campaigns of 12 June 2021 and 13 June 2021.
The Bingham ModelThe Ostwald–de Waele ModelThe Herschel–Bulkley Model
Fermenter No. 2ParametersFitParametersFitParametersFit
DateτoηBRMAEMAPEKOnORMAEMAPEτoKHnHRMAEMAPE
[-][Pa][Pa·s][-][Pa][%][N·s^(n/m2)][-][-][Pa][%][Pa][N·s^(n/m2)][-][-][Pa][%]
12 June 2021 2.9770.2430.9603.08414.40.3780.9280.9573.41416.78.4520.0181.4850.9662.87520.8
13 June 2021 8.4710.1510.9352.54613.01.9220.5560.9432.1998.82.1851.2710.6240.9432.1848.5
PE64.9%60.3% 80.3%66.8% 286.8%98.6%137.8%
The Bingham ModelThe Ostwald–de Waele modelThe Herschel–Bulkley model
LagoonParametersFitParametersFitParametersFit
DateτoηBRMAEMAPEKOnORMAEMAPEτoKHnHRMAEMAPE
[-][Pa][Pa·s][-][Pa][%][N·s^(n/m2)][-][-][Pa][%][Pa][N·s^(n/m2)][-][-][Pa][%]
12 June 2021 3.7110.0440.9680.5018.31.0680.4530.9880.2502.90.4590.8690.4850.9880.2432.7
13 June 2021 3.0350.0450.9820.3728.60.7670.5100.9980.1282.00.1830.6990.5250.9980.1231.9
PE22.3%3.0% 39.2%11.1% 151.3%24.4%7.5%
Table 3. Percentage of shapes in each fraction.
Class# 10 mm# 8 mm# 6 mm# 4 mm# 3.15 mm# 2 mmTotal
C10.000.001.191.053.1647.6212.07
CP0.000.000.000.000.000.000.00
CB0.000.000.001.500.000.950.41
CE2.500.000.007.371.054.762.86
P0.000.000.000.001.051.90.61
B0.000.000.000.002.110.000.41
E2.500.001.1911.585.263.814.50
VP0.000.000.001.050.000.950.40
VB0.002.863.577.377.376.675.32
VE85.0097.1494.0570.5380.0033.3473.42
(C), Compact-platy (CP), Compact-bladed (CB), Compact-elongated (CE), Platy (P), Bladed (B), Elongated (E), Very platy (VP), Very bladed (VB), Very elongated (VE).
Disclaimer/Publisher’s Note: The statements, opinions and data contained in all publications are solely those of the individual author(s) and contributor(s) and not of MDPI and/or the editor(s). MDPI and/or the editor(s) disclaim responsibility for any injury to people or property resulting from any ideas, methods, instructions or products referred to in the content.