Article

The Effectiveness of HEVs Phase-Out by 2035 in Favor of BEVs with Respect to the Production of CO2 Emissions: The Italian Case

by
Francesca Maria Grimaldi
* and
Pietro Capaldi
CNR-STEMS, Via G.Marconi, 4, 80125 Naples, Italy
*
Author to whom correspondence should be addressed.
Energies 2024, 17(4), 961; https://doi.org/10.3390/en17040961
Submission received: 12 December 2023 / Revised: 15 February 2024 / Accepted: 16 February 2024 / Published: 19 February 2024
(This article belongs to the Special Issue CO2 Emissions from Vehicles (Volume II))

Abstract

:
The EU has planned the phase-out of new vehicles based on internal combustion engines in favor of high-efficiency battery electric vehicles (BEV) by 2035 (Fit for 55 package). However, many doubts remain about the effectiveness of this choice for each country of the Union in terms of CO2 emissions reduction, as each State is characterized by a different carbon intensity related to the production of electricity needed to manufacture and recharge vehicles. This study seeks to explore the Italian case. To this aim, carbon intensities related to electricity production were calculated considering both the Italian electricity mix production in 2022 and those envisaged in 2035, considering two energy scenarios based on different introductions of renewable energy sources (RES). Afterward, the values obtained were adopted for determining the CO2 emissions related to the whole production process of battery systems in Italy (emissions from mining and refining, scrap materials, and final assembly included) by comparing some of the most up-to-date Life-Cycle Assessment (LCA) analyses related to the manufacturing cycle of the batteries. Finally, the results were adopted to calculate the starting carbon debit for A, B, C, and M car segments for Mild Hybrid, Full Hybrid, and Full Electric powertrains. At the same time, statistical road fuel/electricity consumption data were collected and overall CO2 emissions were calculated for the same vehicles adopting a dynamic approach and plotted for a defined distance, so as to determine break-even points with respect to the cumulative (i.e., from battery and road) carbon emissions. The results showed that advantages related to electric vehicles are significant only if a low carbon intensity related to electricity production is reached by means of a very high introduction of RES, thus keeping the door open for innovative hybrid powertrain technologies, if fed with low carbon fuels.

1. Introduction

In order to contain—or rather avoid—the imminent effects of climate change, rapid decarbonization of all economic sectors is required [1]. In particular, a fast decrease in emissions production within the vehicular transport sector is necessary, as it alone emits 23.2% [2] of total CO2 emissions (2022) and, in general, air pollution [3,4]. To this end, a wide variety of technologies and policies has been suggested and implemented in many countries so far, along with diversified ways to achieve the targets needed to meet mitigation in CO2 production [5]. Among these, electrification of transport is considered one of the most noticeable actions to be adopted, above all in Italy where the fleet is constituted by a large number (39.8 million) of quite old (12 years on average) and polluting units [6]. In fact, it is well known that Battery Electric Vehicles (BEVs) have significant advantages, as highlighted in various papers [7,8,9], such as no tail-pipe emissions and an overall greater efficiency than internal combustion engine (ICE)-based vehicles in terms of energy and emissions, even when electricity production is taken into account. However, BEVs cannot be considered as zero-emission vehicles, as they are characterized by significant values of cumulative CO2 emissions over their entire life cycle, especially when the Life Cycle Assessment (LCA) analysis methodology is applied [10,11]. The latter represents the most comprehensive approach to be adopted for evaluating the closest-to-reality CO2 emissions related to vehicles. However, it is not the only one that could be found in the literature. In fact, many papers, such as [12,13], applied instead a Well-to-Wheel (WTW) methodology, which is a simplified LCA and therefore provides a limited quantity of the effective emissions produced by vehicles. For example, it does not consider the hardware construction and decommissioning of vehicles, including materials cycles [12]. An even more misleading approach is the one adopted by the European Community (EC), which, implementing the Tank-to-Wheel (TTW) methodology [14], takes into account only the emissions produced during the road use-phase in order to determine the vehicle carbon footprint, thus considering BEVs as zero-emission vehicles [15]. Therefore, as the European Union has recently guided its member States to adopt a phase-out in the production of new conventional ICE vehicles and hybrid vehicles (HEV) by 2035 in favor of BEVs (Fit for 55 package) [16], mostly due to their reduced carbon footprint, this paper seeks to determine the real advantage of BEVs over Mild Hybrid (M-HEV) and Full Hybrid (F-HEV) cars in terms of CO2 emissions. In detail, the authors focused their analysis on the energy aspect of the problem, as they believe that the real advantage of adopting BEVs strictly depends on the future value of the carbon intensity of the electricity (c.i.e.) produced in the country where vehicles, and especially battery systems, have to be manufactured and, finally, used, along with the evolution of the c.i.e. value over time. This aspect has to be taken into major account if considering the Regulation (EU) 2023/1542 [17], which implicitly states that future batteries have to be produced in Europe in order to promote ethical and transparent sourcing/processing of raw materials, favor security of supply, and support the re-use, repurposing, and recycling of batteries. Since Italy has a long tradition as a carmaker, the analysis is focused on the comparison between BEVs and HEVs in the eventuality that these vehicles, and therefore batteries, are produced and adopted in the country.
To determine the potential advantage cited above, the cumulative CO2 emissions, related to some of the most popular and advanced BEVs, M-HEVs, and F-HEVs available on the market (Best in Class), were preliminary calculated adopting a dynamic approach, which foresees the evolution of the Italian grid mix composition over time (2022–2034) according to two energy scenarios toward the Fit for 55 objectives. Afterward, the cumulative CO2 emissions were plotted versus distance throughout the mean service life of the vehicle, and break-even points in terms of cumulative CO2 emissions were highlighted for all the vehicles along with percentage variations in carbon emissions between HEVs and BEVs. The same methodology was, then, employed in order to predict the cumulative CO2 emissions in 2035 and their evolution over time (2035–2047) according to the same energy scenarios but extended up to 2047 toward the decarbonization pledges. In this context, both technology development of the vehicles in terms of running efficiency and energy battery density were taken into account. Furthermore, even in this case, break-even points in terms of cumulative CO2 emissions were highlighted for all the vehicles, and percentage variations in carbon emissions between HEVs and BEVs were calculated.
The study presented shows that a significant advantage related to BEVs deployment in terms of CO2 reduction could be obtained only if a much lower c.i.e. than the one in 2022 is reached. In fact, if the introduction of newly installed RES capacity were at a standstill or proceeded at the same pace as the last past years (2016–2021), it could be reasonable to think about HEVs—in particular, new generation HEVs—as a valid alternative, especially if fed with low-carbon fuels (i.e., renewable fuels [18], advanced biofuels [19], e-fuels [20]), as foreseen by RED II [21] and RED III [22] for the future. Moreover, the study suggests that the advantage of BEV deployment in terms of CO2 emissions reduction differs significantly when it is compared to those found in other European countries characterized by a much lower c.i.e. than the Italian one.

2. Materials and Methods

In order to assess the advantage in phasing out the production of new HEV powertrains (Mild or Full) in 2035, 12 vehicles belonging to A, B, C, and M segments, which represent around 85% of the Italian fleet, were initially selected (Table 1). Each of them was characterized by one of the three recalled powertrains, was a model year 2022, and was identified by authors after a market inquiry as “Best in Class” models in terms of efficiency. They were currently manufactured by the following Brands: Suzuki, Mazda, Ford, Honda, Toyota, Hyundai, Volkswagen, Nissan, Tesla, and Opel.
Afterward, the values related to the cumulative CO2 emissions produced by the aforementioned vehicles were calculated by summing up the emissions coming from (a) the use-phase of the vehicle; (b) the vehicle production phase.

2.1. The Use-Phase Emissions of the Vehicle

The use-phase emissions can be obtained multiplying the specific use-phase emissions produced by the vehicles (Table 1) during their functioning on the road (expressed in terms of kgCO2/km) for the distance run by the vehicles throughout their mean service life. Moreover, these emissions depend on the energy/fuel consumption data, which, in this case, are not homologation data but real statistical mean records. In particular, in the case of BEVs, the CO2 emissions related to the use-phase depend on the c.i. of the electricity consumed to power vehicles, with the latter calculated by taking into account all the contributions related to the electricity production and transformation (from power plant to the battery). Along with this, they depend on the c.i.e evolution over time, the latter determined by means of a dynamic approach throughout the mean life service of the vehicle. The dynamic approach, described in detail elsewhere [11], foresees the evolution of the grid mix composition over time according to two energy scenarios: one conservative, i.e., Business-As-Usual (BAU), and one more aggressive, which takes into account a significant future increase in newly installed RES capacity.
In this work, the CO2 emissions related to the use-phase of BEVs were preliminary calculated in 2022 according to the 2022 c.i.e, calculated as mean value over the period 2016–2021, in order to obtain reference data. Afterward, their evolution over time (2022–2034) was dynamically determined according to two different energy scenarios, the BAU@2035 and the Fit for 55 (FF55) @2035, described as follows:
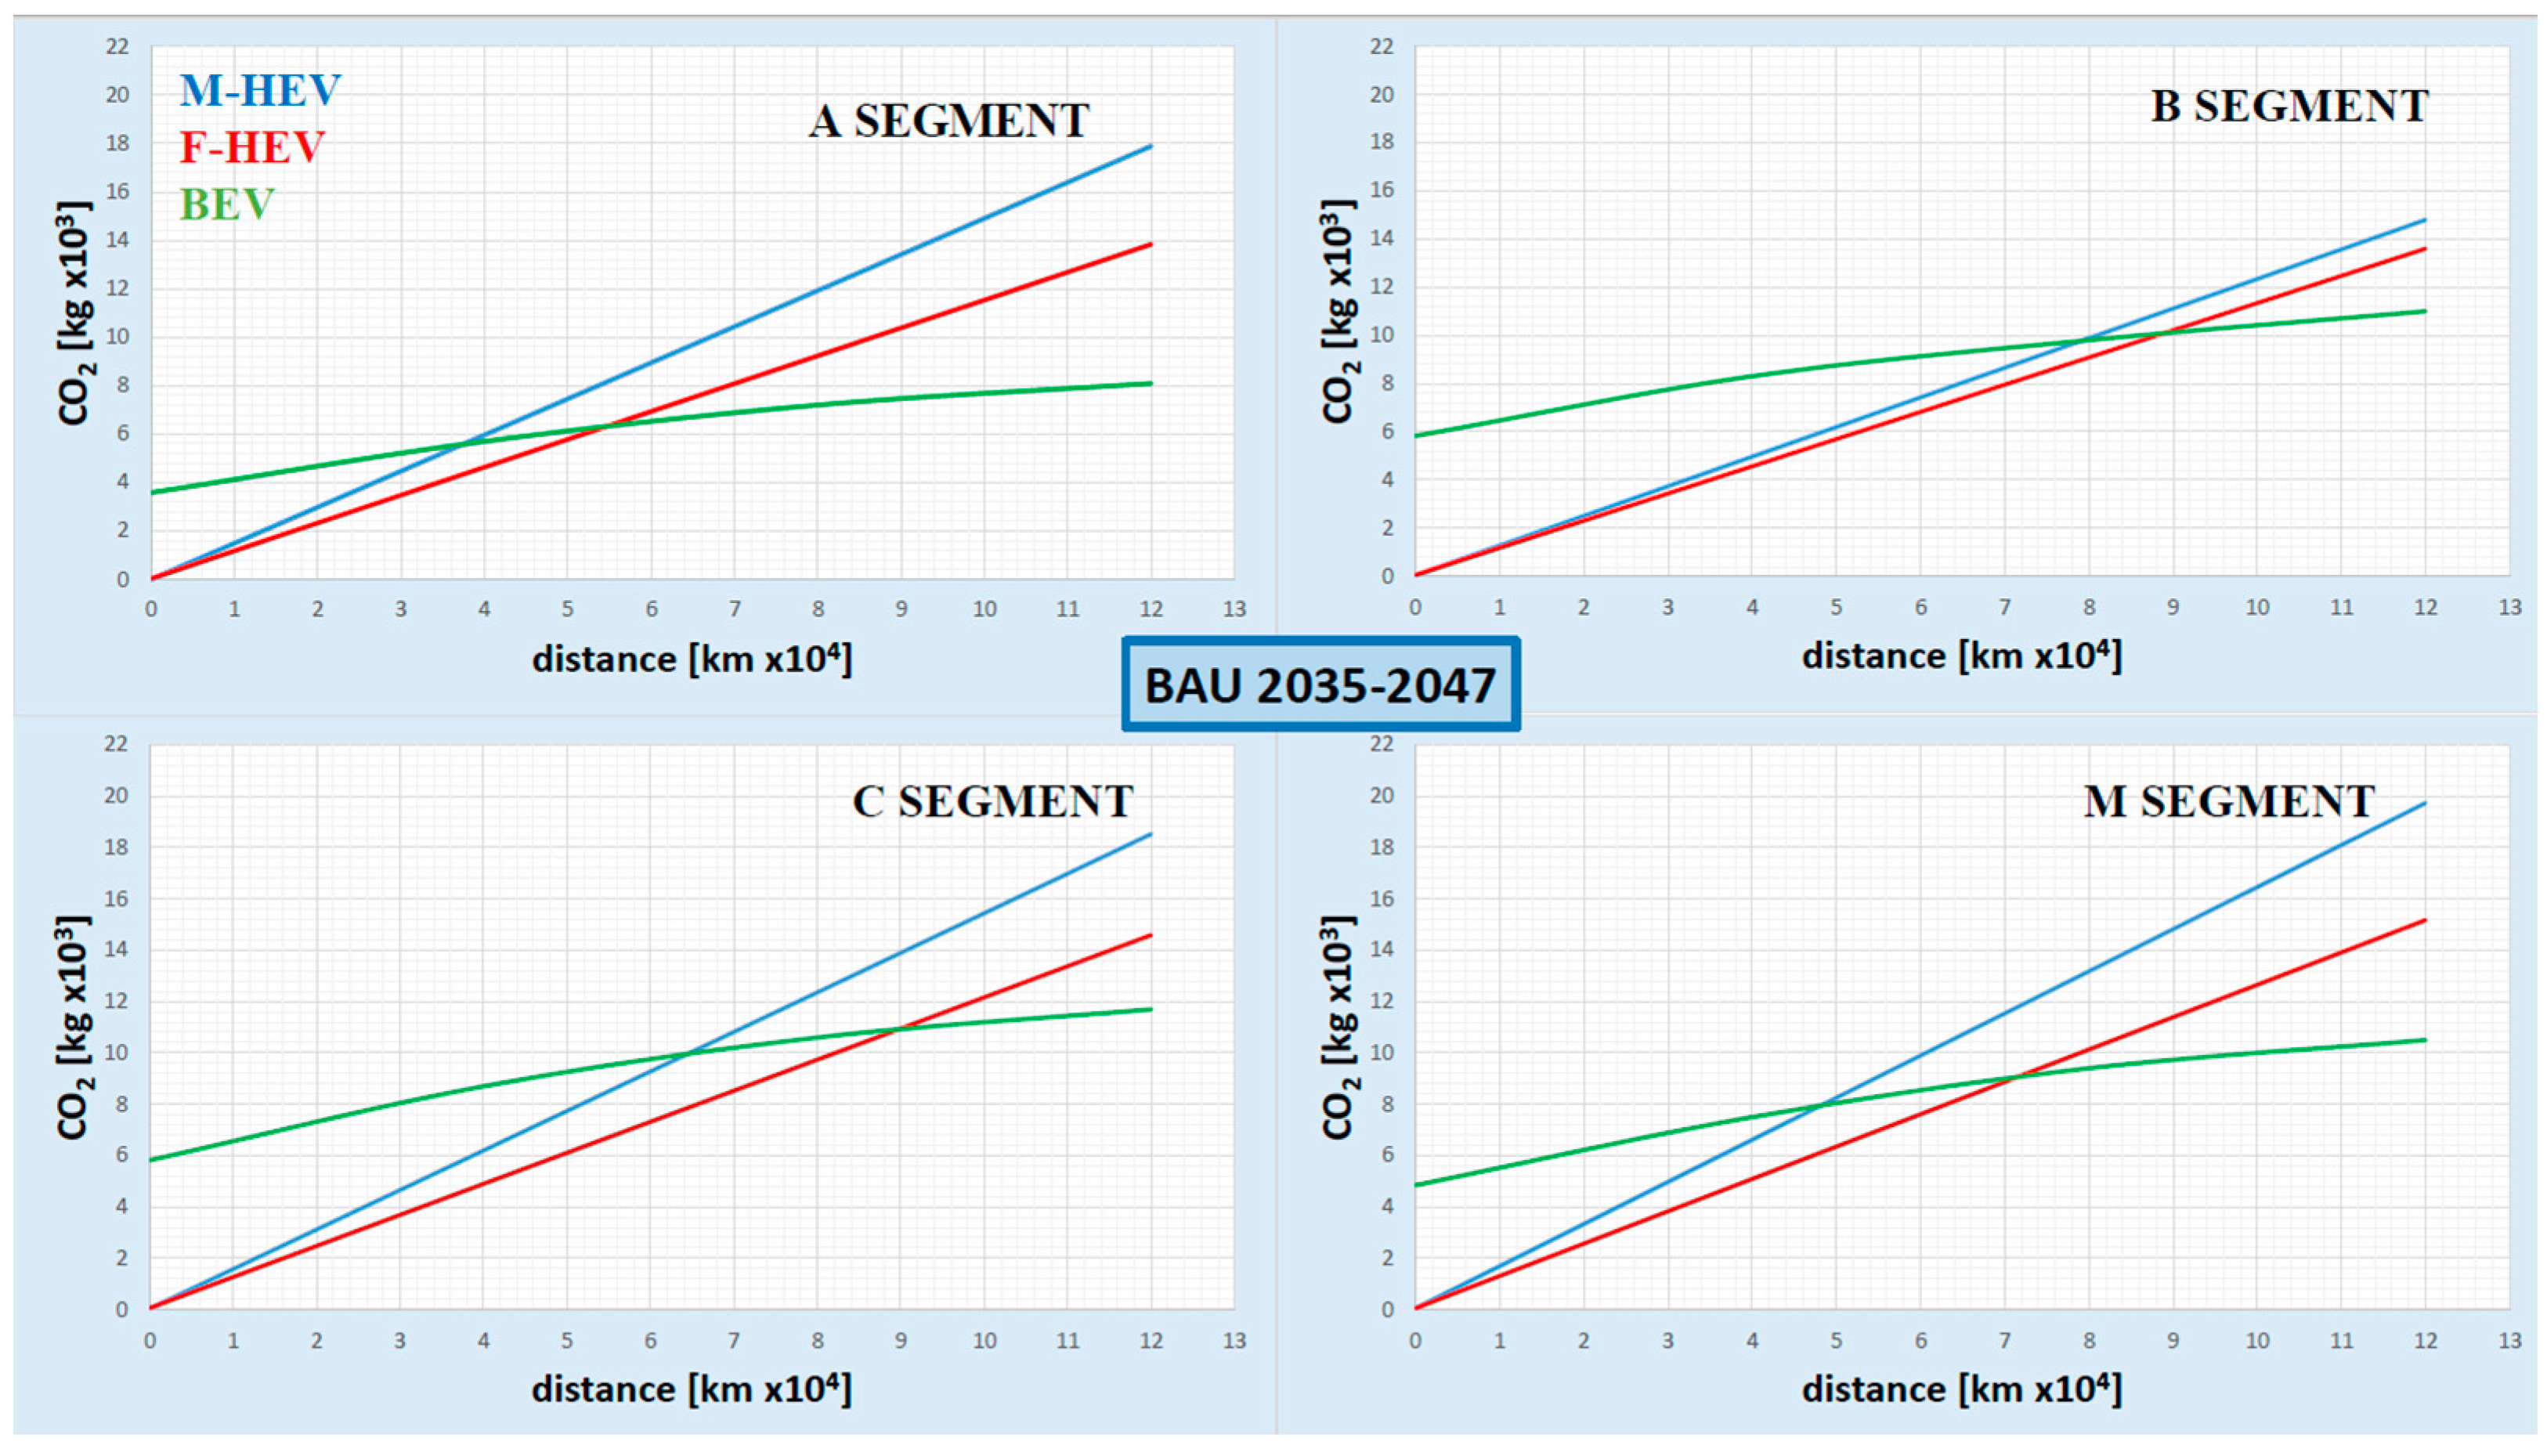
  • The BAU@2035: is a conservative scenario, i.e., Business-As-Usual. It was constructed considering a consolidated average growth rate (CAGR) of newly installed RES capacity over the period 2016–2021, which was afterward extended until obtaining a certain value of RES in 2035;
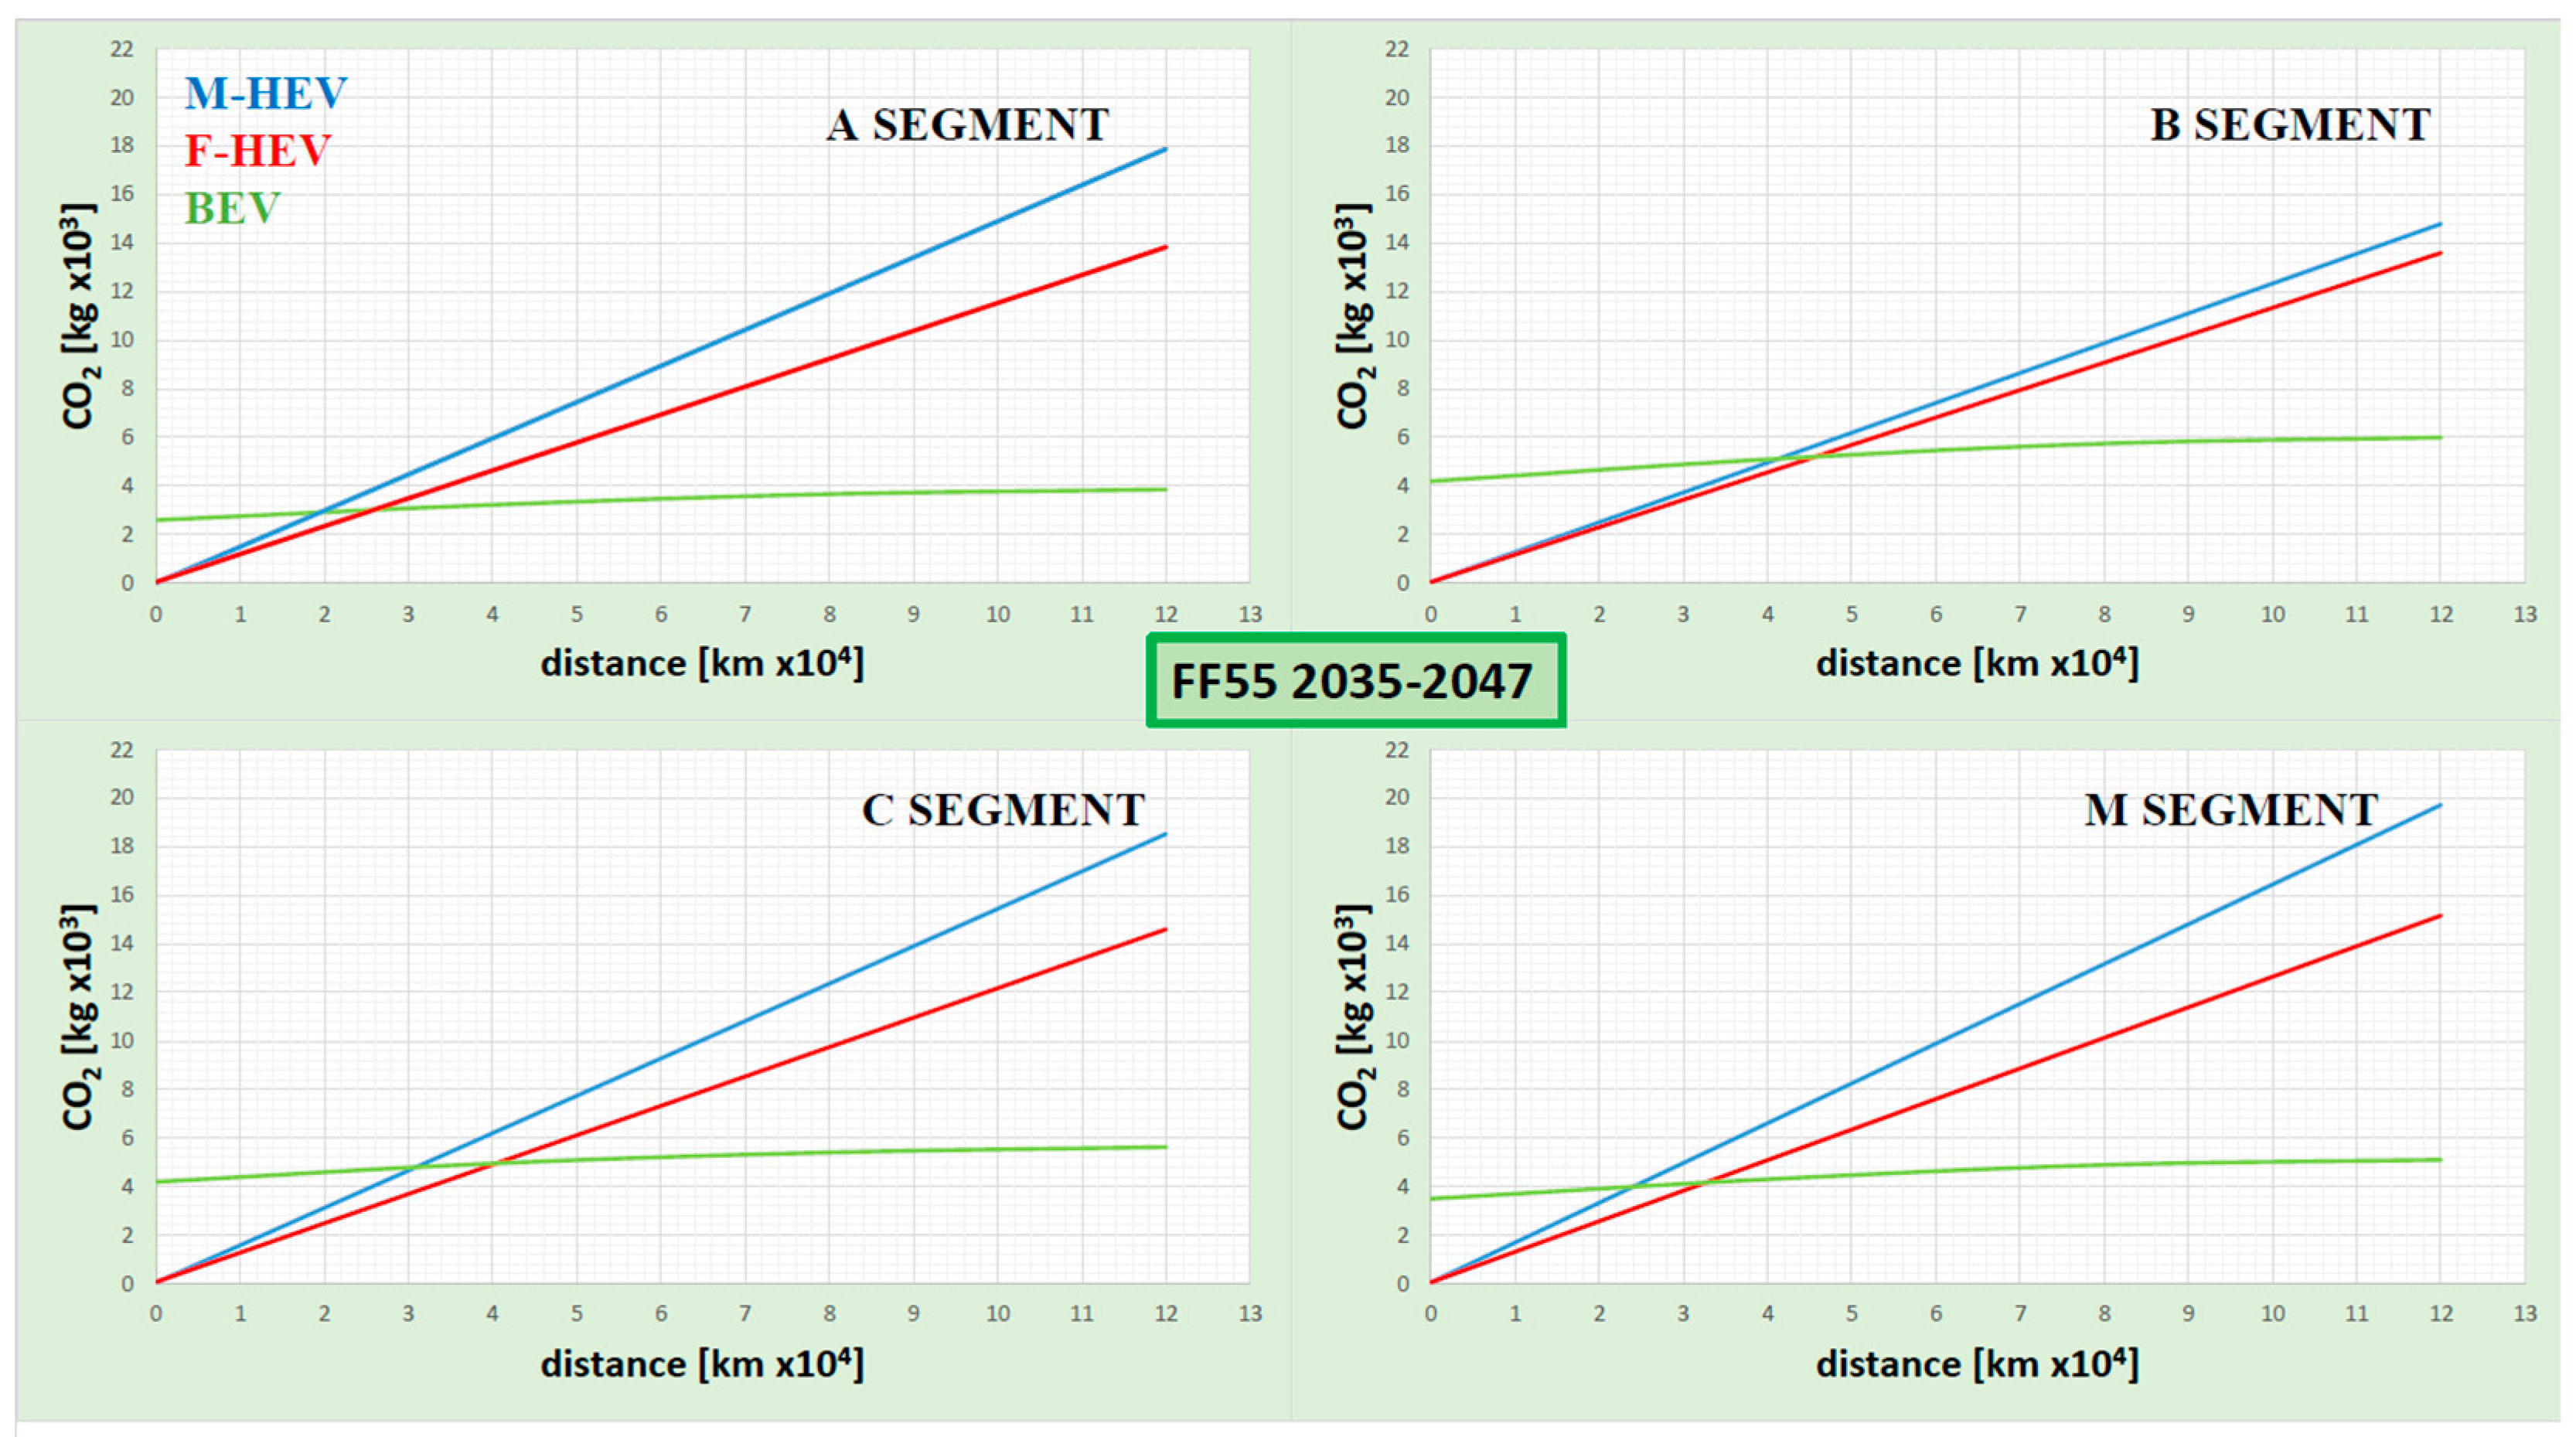
  • The FF55@2035: is a more aggressive and binding scenario. It was constructed by taking into account the same growth rate of newly installed RES capacity as stated to fulfill the Fit for 55 package objectives by 2030, but extended until obtaining a certain value of RES in 2035
The same methodology was, then, employed in order to predict the CO2 emissions related to the use-phase of BEVs at 2035 by means of the previously calculated c.i.e. for BAU@2035 and FF55@2035 scenarios at 2035. Furthermore, the evolution of the CO2 emissions related to the use-phase of BEV was dynamically determined in the timeframe 2035–2047 adopting the same energy scenarios and, therefore, the same CAGR, but extended up to 2047 toward the decarbonization pledges. In this context, both technology development of the vehicles in terms of running efficiency and energy battery density were taken into account. The obtained emissions for BEV, which are dependent on the c.i.e., can be defined as Power Plant-to-Wheel (PTW) emissions and can be considered equivalent to the Well-to-Wheel (WTW) emissions related to liquid fuels adopted for HEVs. Despite this, in this paper, we chose not to adopt a dynamic but rather a static approach for liquid fuels for HEVs, as the effective degree of reduction in carbon intensity due to the future introduction of low-carbon fuels (renewable fuels, advanced biofuels, and e-fuels), as stated by the RED II and RED III, is still uncertain.

2.2. The Vehicle Production Phase Emissions

As regards the CO2 emissions related to the vehicle production phase, it was assumed that battery production phase emissions were the only significant ones to be taken into account when comparing the selected vehicles (Table 1) and their relative powertrains. This approach derives from the analysis of some papers [9,11,23,24,25,26], in which the CO2 emissions produced during the material extraction and transformation processes (mining and refining), the vehicle production (manufacturing, battery production, etc.), and the final vehicle dismantlement (disposal phase) are reported. In fact, the aforementioned emissions, which depend on the carbon intensity of the manufacturing country at the time of construction and are therefore fixed, could be partly deconstructed into their own elements and later clustered again into the following three groups: (1) car glider group (body, suspensions, wheels, interiors), (2) powertrain system group (engines/motors, inverters and transmissions), (3) energy storage system group (power battery, tanks). As regards the first group, the CO2 emissions related to the construction of the whole vehicle body were found to be very similar for both HEVs and BEVs, when considering vehicles belonging to the same car segment, thus making the CO2 emissive differences quite negligible in the comparison between these two vehicle categories. As regards the CO2 emissions related to the construction of the two powertrains for HEVs and BEVs, it was considered that HEVs in general—and, in particular, M-HEVs—are characterized by an electric powertrain of quite limited power. In fact, HEV powertrain cannot even ensure a full electric running condition except for very short periods and at low speeds. This aspect limits the contribution of CO2 production by the electric elements (motor, inverters, and other auxiliary elements) to be added to the CO2 emissions related to the internal combustion engine. For this reason, the total CO2 emissions for HEVs powertrains are expected to be higher than those of a conventional ICEV powertrain, but slightly lower than those of a BEV powertrain [27], the latter being characterized by a significantly bigger electric motor and power control system, along with a high content of critical materials. This result is confirmed by ECF [28], which suggests that BEVs powertrains have higher emissions than HEVs when larger and more powerful vehicles are taken into account. On the contrary, other papers, such as [29], report that HEV small/medium car powertrains lead to slightly higher CO2 emissions, if compared to BEVs. As these differences are due to many aspects, which are specific for each powertrain characteristic and which cannot be extended to all vehicles, it was decided to consider as fully comparable the total CO2 emissions for HEV and BEV powertrains. It must be pointed out that this approach cannot be adopted in the case of PHEVs (plug-in hybrids) [10], where thermal and electric powertrains are both significant in terms of power and can perform independently. The above-seen considerations regarding the CO2 emissive content related to the car glider group and powertrain group enabled us to simplify the comparison between HEVs and BEVs, as they allowed us to assume the CO2 emissions generation related to these two groups as being fully comparable. For this reason, the car glider group and powertrain group emissive contributions will not be further considered in the comparison, allowing us to focus the analysis only on the emissions from energy storage systems, notably batteries, since fuel tank emissions for HEVs are not significant. In fact, batteries are considered the most significant and distinctive element to be measured in the comparison between HEVs and BEVs. In particular, in this work, we chose to focus the analysis on the battery production phase (mining and refining processes along with scrap materials production included) and on the determination of the consequent CO2 emissions when batteries are produced in Italy. To this aim, the CO2-specific emissions value, expressed in terms of kgCO2/kWh of battery capacity, was determined by performing a critical comparison between six of the most recent and relevant LCA analyses available in the literature [7,23,24,25,30,31], so to define a specific reference value of battery CO2 emissions when the Italian c.i.e. at the date of the vehicle construction (2022) is considered. The cross-comparison of these analyses was necessary as the LCA results reported in the literature, even if calculated by means of important and detailed databases, are commonly presented as local values of c.i.e., which could strongly differ from each other and from the Italian one. In fact, unlike the Italian case, they could depend on coal or nuclear energy for electricity production. Afterward, the specific CO2 emission value related to the battery production was multiplied for the battery capacity of each aforementioned vehicle and, then, summed to the relative total use-phase emissions, thus determining the final cumulative CO2 emissions value for each car over time. Lastly, the obtained cumulative CO2 emissions were plotted versus distance throughout the mean service life of the vehicle (120,000 km in 12 years [32]), and break-even points were highlighted for all the vehicles along with percentage variations in carbon emissions between HEVs and BEVs. The comparison was carried out for the three different powertrains and for each of the four vehicle segments taking into account the above-mentioned scenarios: 2022, BAU@2035, and FF55@2035. It has to be specified that while in the case of 2022 scenario, the c.i. that referred to battery production was determined by taking into account the c.i.e. in 2022, in the case of BAU@2035 and FF55@2035 scenarios, the c.i. for battery production was obtained considering the different c.i.e. in 2035 according to the above-mentioned scenarios. Moreover, it has to be pointed out that the analysis performed was based not only on the 2022 total consumption data, which considers the electrical and/or thermal powertrain efficiencies, battery energy capacity, etc., but also on their future development until 2035 in terms of technical evolution and enhanced performances of the recalled parameters [33]. For this reason, in 2035 energy scenarios, an increase in performance regarding battery capacity and better running efficiency were considered for BEVs. At the same time, a lower fuel consumption was considered for M-HEV and F-HEV, due to an enhanced matching between electric powertrain and ICE, which could reduce even more the low-efficiency part-load operation.

3. Results

In this Section, the value of the Italian c.i.e. in 2022 was first determined and reported (§3.1). Then, two different predictions of c.i.e. in 2035 were made by taking into account the evolution of the parameter over time (2022–2034) according to a conservative (BAU@2035) and a binding scenario (FF55@2035) (§3.2). These scenarios differ from each other above all for the different future electricity generation mix values and, in particular, for the different potential RES installed capacities. The obtained c.i.e. in 2022 and 2035 was newly determined, in comparison to a previous paper [34], by taking into account some updated values of the CO2-specific emissions, expressed in terms of gCO2/kWh, regarding renewables (e.g., new technologies for the production of photovoltaic panels, etc.) and fossil fuels (e.g., more efficient CCGT power plants), according to the American National Renewable Energy Laboratories (NREL) [35]. Furthermore, it was considered that the contribution coming from the CO2-specific emissions related to the imported electricity from other countries. In particular, the mean European c.i.e. value was taken into account according to the 2022 and future (2035) scenarios. Lastly, the CO2 emissions values relating both to the battery production (§3.3) and to the use-phase of the vehicle (§3.4) were calculated. The resulting data, which correspond to the cumulative value of CO2 emissions for each vehicle, were then dynamically plotted versus distance until the vehicle’s end of life (120,000 km in 12 years) according to the evolution of the 2022 scenario and to the four vehicle segments (respectively, A, B, C, and M). In particular, in all the four plots obtained, a comparison between the three different powertrains was made both highlighting the break-even points in terms of CO2 emissions and calculating the percentage variations in carbon emissions produced by HEVs, if compared to BEVs. Afterward, by taking into account the c.i.e. in 2035 for both the scenarios and the evolution of the vehicles in terms of running efficiency and energy battery density, a new set of data, corresponding to the future cumulative CO2 emissions value over time, was dynamically plotted according to the BAU@2035 and FF55@2035 scenarios (extended up to 2047) and to the four vehicle segments. In particular, in all the eight plots obtained, a comparison between the three different powertrains was made both highlighting the break-even points in terms of CO2 emissions and calculating the percentage variations in carbon emissions (expressed as percentages) produced by HEVs, if compared to BEVs.

3.1. The Italian c.i. at 2022

In general, the mean c.i. of the electricity produced in a country depends on the following features:
  • The primary fuel used and the thermodynamic cycle allowable by the fuel.
  • The contribution of RES, whose total incidence varies according to the season and to the different weather conditions.
  • The net energy flux imported and exported through the international exchange.
Regarding the Italian situation (updated to the end of 2021, as 2022 was considered statistically not significant because of the Russia–Ukraine conflict and the exceptional drought), the energy consumption was found to be around 320 TWh, with an electricity mix depending on the deployment of thermoelectric non-renewable plants based on natural gas (about 50% of the whole electricity production), oil (6.1%), and coal (6.9%), along with a significant percentage of RES (about 37%), mainly hydroelectric (15.7%), and photovoltaic and wind (16.1%) [36,37,38]. According to this energy panorama, the total electricity produced in the country was found to be 278 TWh, 116 TWh of which came from renewable sources and 162 TWh from fossil fuels (Table 2). Instead, the net electricity import was approximately 43 TWh [36] and the curtailment/storage losses accounted for about 1 TWh [39]. Therefore, based on the specific c.i. for each technology production as reported by NREL [35] and considering a mean European c.i.e. related to the net imported electricity (287 gCO2/kWh in 2022) [40], a quite accurate c.i.e. value of 293 gCO2/kWh was determined by means of the following equation:
C.I. E. (2022) = ∑gCO2/kWhres × (TWhres/TWhtot) + ∑gCO2/kWhfos × (TWhfos/TWhtot) + ∑gCO2/kWhI × (TWhI/TWhtot)

3.2. The Italian c.i. at 2035

In order to calculate the c.i.e. in 2035, two different scenarios were defined by the authors: the BAU@2035 and the FF55@2035. These were outlined by the comparison and merger of different scenarios defined in several analyses performed by Terna, Snam, and the Institute for Sustainable Future (ISF) for 2030 and 2040 [39,41,42]. The BAU@2035 is a conservative scenario that takes into account the evolution of the Italian installed RES capacity over the period 2022–2035. In particular, it considers the trend of newly installed RES capacity in the timeframe 2016–2021 extending up to 2035, along with a constant capacity of fossil-fuel-based power plants, if compared to 2022 values. The latter is constant as a whole, but foresees an increase in the deployment of natural gas and a decrease in other non-RES (mainly coal and oil); this is to accomplish the decarbonization pledges. In detail, the BAU@2035 scenario is characterized by a consolidated compound annual growth rate (CAGR) of newly installed RES equal to 1.0 GW/year (corresponding to an energy growth rate of about 1.35 TWh/year), a value which was calculated over the period 2016–2021 (2020 excluded because of COVID-19) and fully confirmed in the 2023 IEA report about Italy [37,38]. The trend depicted in the BAU@2035 scenario reflects the condition of the minimum introduction of RES, therefore representing the lowest trend of decarbonization. This situation reflects the limiting conditions that exist in the Italian panorama, such as cumbersome and time-consuming authorization processes for new power plants, inadequate grid characteristics [43], high costs of logistics, and critical procurement of base materials, which influence the success of the auctions. Last, but not least, the increasing opposition from local populations due to the NIMBY syndrome should be underlined. According to this scenario, the total electricity produced in the country in 2035 would be approximately 301 TWh, 139 TWh of which from renewable sources and 162 TWh from conventional power plants based on fossil fuels (Table 2). Furthermore, the total electricity consumption would be 350 TWh, and the annual electricity import from neighboring countries would increase to 53 TWh [36]. In this energy panorama, the curtailment/storage losses would be 4 TWh [id.]. If the above-seen Equation (1) is taken for granted, and if the specific c.i. for each energy source is considered, then the final c.i.e. value would almost be equal to 249 gCO2/kWh, when a mean European c.i.e. value reduced to 100 gCO2/kWh, due to increased decarbonization, is taken into account [40,41,44]. The FF55@2035, instead, is a binding scenario strongly based on RES, whose trend is outlined considering the same CAGR of newly installed RES planned in 2019 to achieve the Fit for 55 package pledges by 2030 (i.e., 7 GW/y), although extended up to 2035 through extrapolation. This scenario leads to an electricity generation of 413 TWh, with 300 TWh of RES, 60 TWh of fossil energy (mainly natural gas), and 53 TWh of imported energy. Because of the inconstancy of RES (mainly based on photovoltaic systems), which can cause great difficulty in following the real electric loads and can require large and expensive storage systems, significant energy curtailment and storage losses are expected (around 26 TWh), thus making the total national electric availability decrease to 387 TWh. The resulting trend depicted in this scenario reflects the condition of the maximum introduction of RES and therefore represents the highest trend of decarbonization. In this scenario, still considering equation (1) and a mean European c.i.e. of 100 gCO2/kWh [42,44], the c.i.e. would be almost equal to 110 gCO2/kWh. In the following Table 2, the 2022 and 2035 electricity mixes and c.i.e. are reported.
However, it has to be pointed out that the c.i.e. values reported in Table 2 have to be considered as gross values due to the fact that they are calculated at the power plants. Therefore, grid efficiency should also be taken into account in order to consider the real c.i.e. of the delivered energy. The latter may be generally available for production plants and industries (such as a battery production plant) at medium voltage (about 20 kV) with an average transmission efficiency of 95%. At the same time, electricity may be available at low voltage (380 V) for non-industrial uses (e.g., electric socket) after more transformation stages and consequent losses, with a final transmission efficiency of 92%. In the following Table 3, the resulting c.i.e. according to the different grid transmission efficiencies is provided with respect to scenarios and final applications.

3.3. The Carbon Footprint Related to the Battery Production (c.i.b)

In order to calculate the specific c.i. related to the production of the batteries (c.i.b) in Italy, six life cycle assessment analyses (LCAs) that referred to the production of BEVs or batteries (cells or packs) were considered (Table 4). The latter were chosen from the literature due to their relevance, their being up-to-date, and because they contained, implicitly or explicitly, values of c.i.b related to defined energy contexts (e.g., nuclear-based or coal-based ones). Each of the reported values related to the c.i.b was, then, singularly highlighted or extrapolated from each LCA (Table 4), although the energy contexts they were related to were quite different, when compared, to the 2022 Italian one (Table 2). Along with them, the CO2 emissions related both to the mining and refining processes (from brine or ore) and to scrap materials production in a battery factory, when available, were taken into account. As regards the latter, the authors decided to completely allocate them to the battery, following the methodology of the cut-off approach according to the Environmental Product Declaration (EPD) system [45]. For this reason, no system expansion was applied to this analysis, as no credits were recognized for material recycling and/or energy recovery from the same recycling.
Afterward, the aforementioned CO2 emissions values that related only to the production phase of the battery cells (all reports but Volvo, whose study referred to the whole battery pack) were compared in order to obtain a law of dependence of the specific CO2 emissions related to the production of the batteries with the electricity mix available at the production site, as indicated in Table 3. Once determined, the CO2 emissions values related to the production of the batteries were scaled based on the 2022 and future (2035) Italian c.i.e. (§ 3.1, 3.2), with the aim of obtaining a reliable mean specific CO2 emissions value that related to the production of the whole battery pack in Italy. Furthermore, for the BAU@2035 and FF55@2035 scenarios, an assumption was made regarding the evolution of the battery system in terms of energy density. In fact, by taking into account the energy increase in recent years, a 20% increase in battery capacity at constant weight was assumed [46]. Moreover, the authors did not consider solid-state cells, whose industrial applicability is not yet clearly defined. Therefore, 74 kgCO2/kWh was obtained as the CO2 emissions value for the production of the battery in Italy when considering the 2022 energy scenario, while 50 kgCO2/kWh and 23 kgCO2/kWh were determined in the case of the BAU@2035 and FF55@2035 scenarios, respectively (Table 5). Instead, the CO2 emissions related to the mining and refining processes resulted in 45 kgCO2/kWh in 2022 and 40 kgCO2/kWh in both the 2035 scenarios (Table 5). In fact, they were scaled only by 10%, as these processes are not always supported by publicly available data on energy consumption [47] and generally take place in non-EU countries where carbon-free electricity will not be widely accessible even in the near future. Instead, the contribution of scrap materials (in terms of CO2 emissions) during the production of batteries was calculated considering that it will follow the same c.i.e. reduction trends by 2035. In fact, after calculation, the related specific CO2 emissions resulted in 15 kgCO2/kWh in 2022, which are expected to become, respectively, 14 kgCO2/kWh and 10 kgCO2/kWh in the BAU@2035 and FF55@2035 scenarios (Table 5). Lastly, 20 kgCO2/kWh was added to the obtained c.i.b values in order to determine the CO2 content related to the construction of the whole battery pack, thus taking into account the significant contribution of the assembly process due to the presence of hundreds of welded connections, frame structures, containers, etc. [31]. As with the previous terms, the CO2 emissions related to the battery-pack assembly process were also calculated and were expected to decrease over time, from 20 to 18 or 14 kgCO2/kWh, according to the BAU@2035 scenario or FF55@2035 scenario, respectively (Table 5).

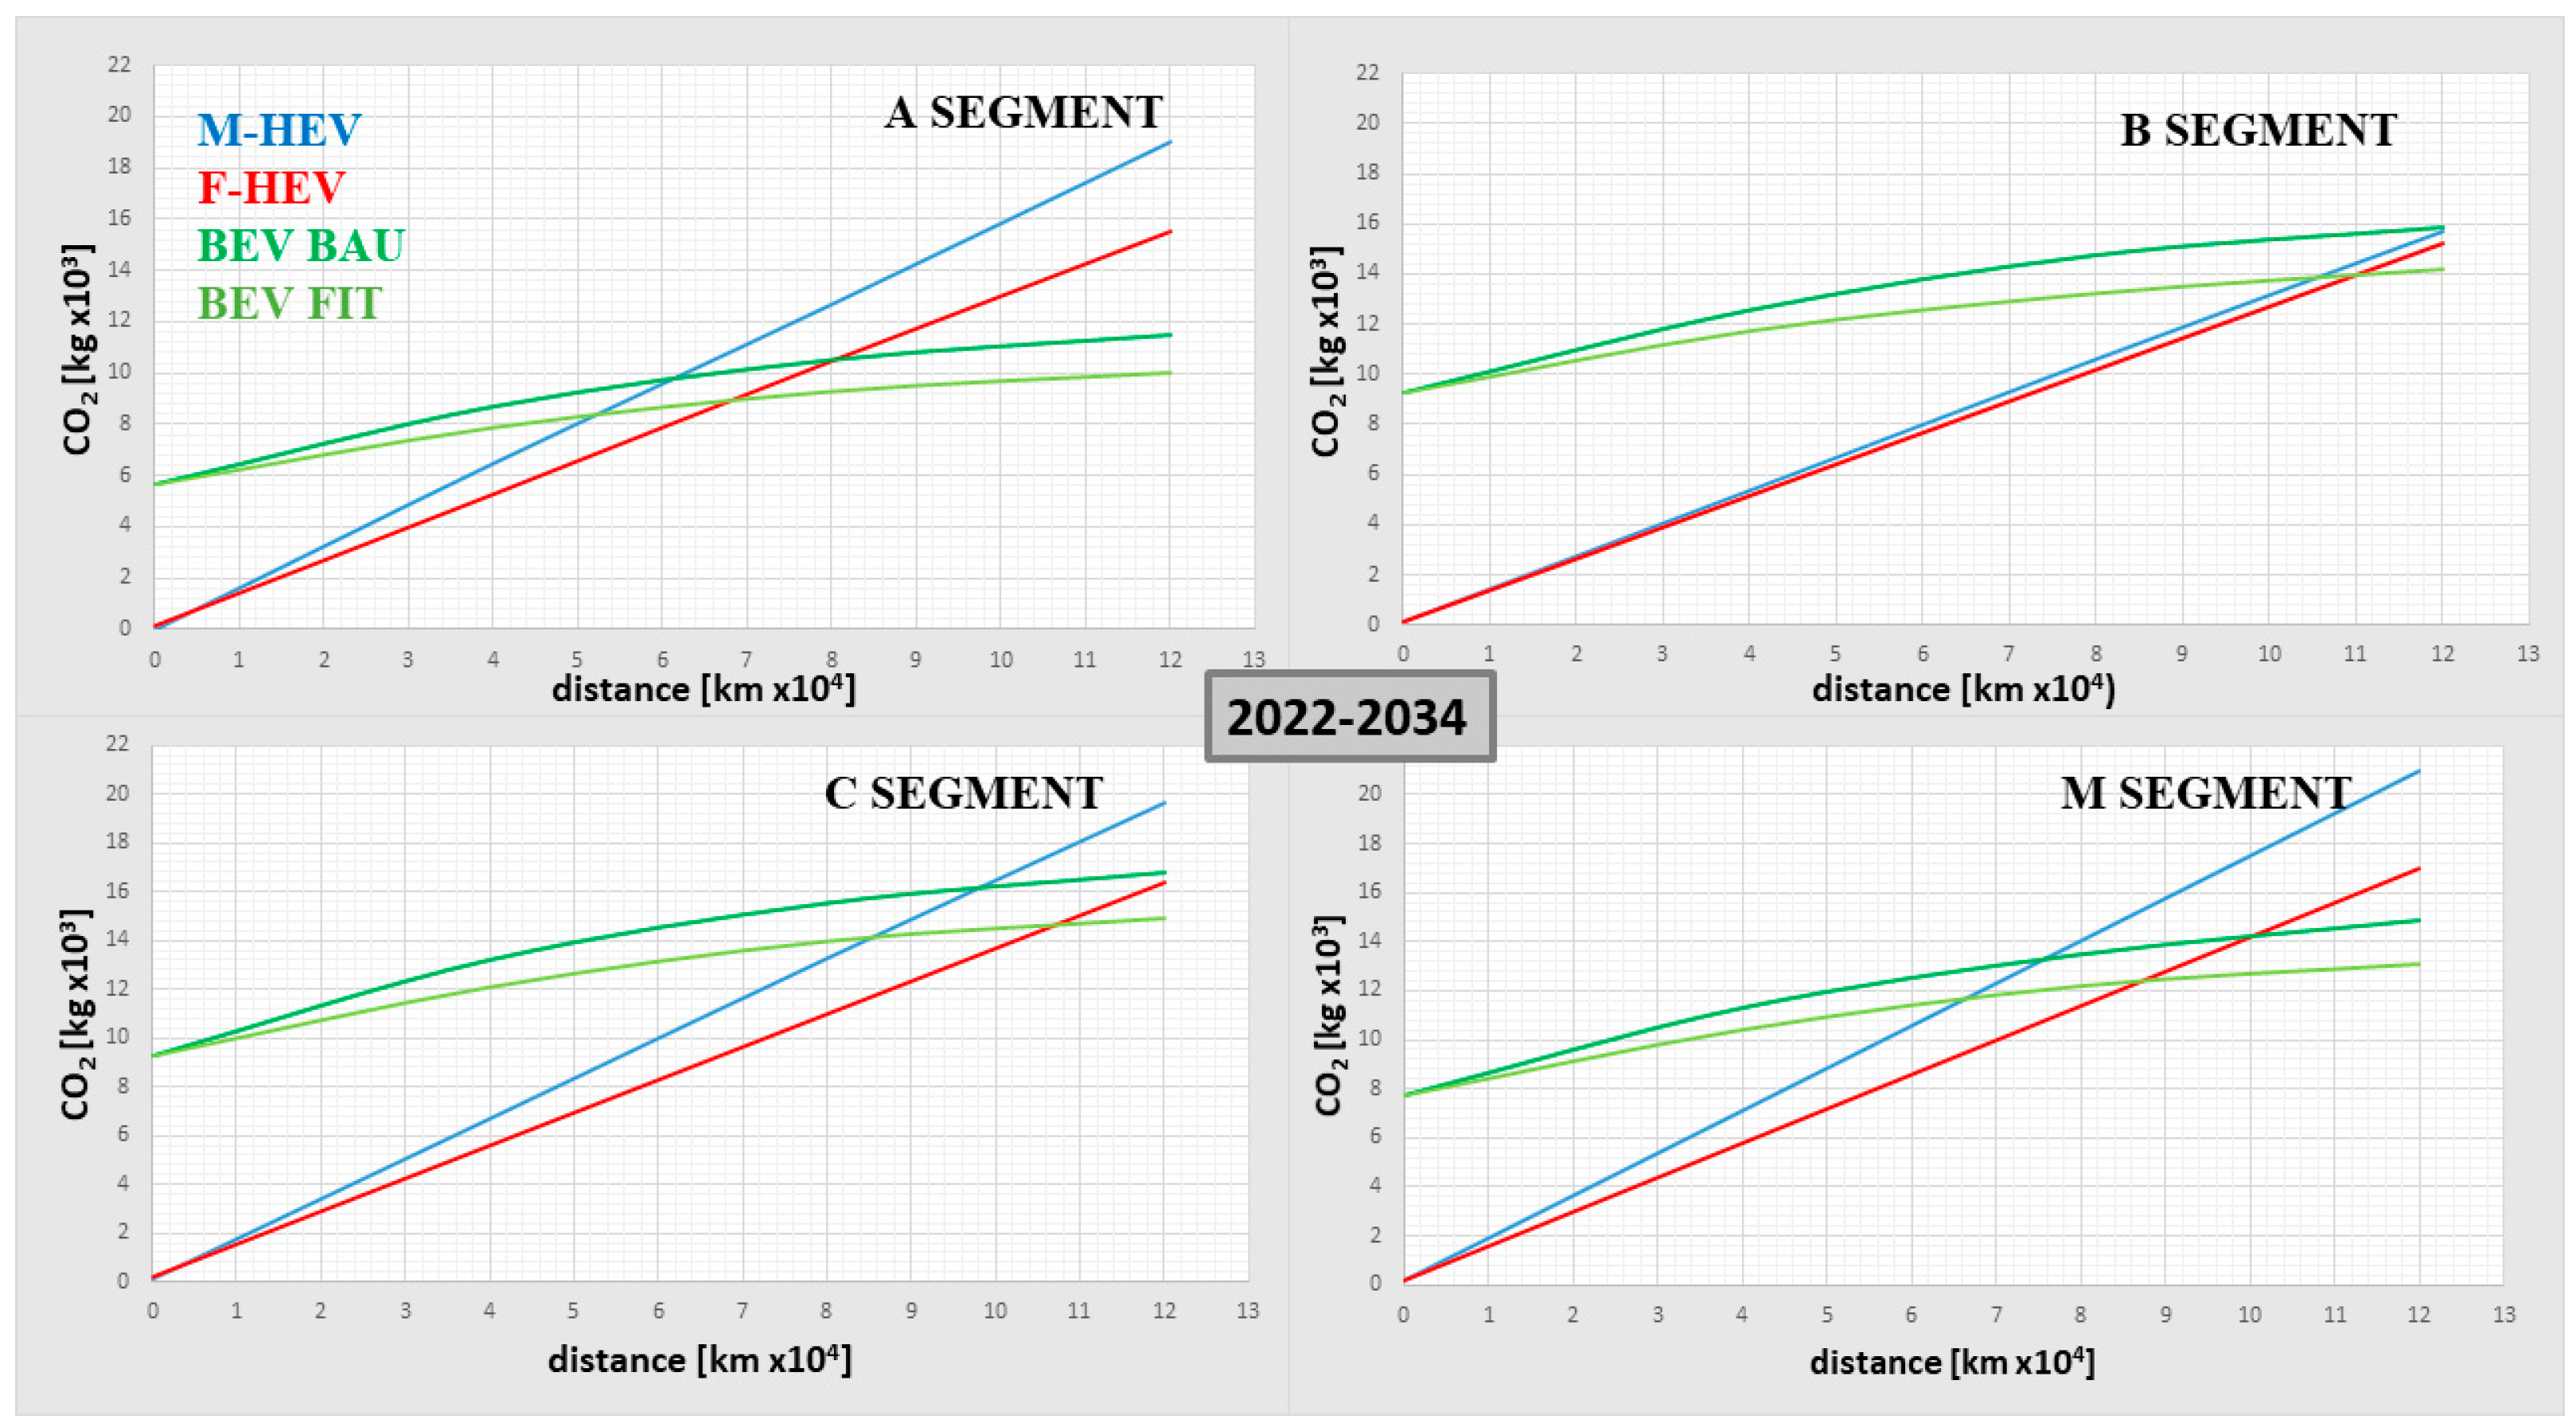
3.4. The c.i. of the Vehicles’ Use-Phase

As is well-known, the use-phase CO2 emissions of any vehicle are determined by two factors: (1) the fuel/electricity consumption of the vehicle, and (2) the c.i. of the fuel/electricity used to feed the vehicle. In order to determine the first one, the authors did not consider simulation models that calculate the vehicle fuel/electricity consumption according to different vehicle’s characteristics and operation points, nor WLTP homologation procedures, the implementation of which always provides values of the vehicle’s fuel requirement that are quite far from the real ones (−15% on average). Indeed, in order to determine the real fuel/electricity consumption of vehicles, in this paper, only significant statistical records relating to fuel needs were taken into account [48]; these were eventually compared with other consumption data delivered by independent institutions that had carried out road tests [49]. On the other hand, in order to determine the c.i. of the fuel/electricity used to feed the vehicle, a “Well-to-Wheel” (WTW) approach was adopted, both for HEVs and BEVs. Therefore, the CO2 emissions produced during both the “Well-to-Tank” (WTT) phase, which also includes the refinery and transportation contributions, and the “Tank-to-Wheel” (TTW) phase, also called the “Battery-to-Wheel” (BTW) phase for BEVs, were taken into account. In particular, for HEVs fed with gasoline, the values reported in the following two references were considered:
  • JEC Consortium (JRC, EUCAR, CONCAWE) [50];
  • ARGONNE Laboratories (adopting GREET-1 model) [51].
After having analyzed these data, a mean value of 470 gCO2/dm3 for the WTT phase was determined along with a mean value of 2330 gCO2/dm3 for the TTW phase. Therefore, a resulting total value of 2800 gCO2/dm3 for the WTW phase was obtained, which was later used in the computation of the real total CO2 emissions related to vehicle fuel consumption. It has to be pointed out that the obtained value was not supposed to change over time, as it is still uncertain which will be the effective future degree in carbon intensity reduction, and therefore in CO2 reduction, linked to the introduction of renewable fuels (renewable fuels, advanced biofuels, e-fuels) over time. Instead, as regards the determination of the c.i. of the electricity used to feed BEVs in the road use-phase, the values reported in Table 3 regarding the c.i.e. at low voltage (or socket c.i.) in the three scenarios were considered as references, to be afterward referred to as the efficiency of the whole charging phase. In fact, in order to determine the c.i. of the electricity used to feed BEVs as close to real conditions as possible, several losses should be considered, starting from the charging system, whose mean efficiency during charging can be sensibly lower than the nominal value, passing through cables and connections up to the battery itself. In particular, the global charging phase can be characterized by different efficiencies, ranging from 83%, in the case of an AC single-phase home apparatus, up to 87%, which is typical of an AC three-phase road charging tower (up to 22 kW of power) [49,52]. As regards DC systems, which can reach up to 300 kW of power and are normally adopted for fast charging on highways, they are characterized by a higher charging efficiency (around 91%) [53], when compared to AC systems. However, they were not considered in this analysis because of their much lower diffusion due to high costs. In conclusion, a mean efficiency value of about 85%, fully confirmed by [49], was chosen for the existing (2022) AC charging systems, while for the future (2035) ones, a significant improvement was considered by the authors, fixing the global mean charging efficiency at 88%. It must be underlined that the charging phase represents the most inefficient stage of the whole energy transmission process (from energy production sites up to car batteries) and, therefore, that the energy effectively stored in the battery can be significantly lower than the energy provided by the grid. For this reason, in order to determine the effective BEV efficiency in terms of CO2 emissions, the global mean AC charging efficiency value according to the different scenarios should be adopted. The latter values are reported in the following Table 6 along with the c.i.e. at low voltage and the resulting charging c.i. (c.i.c.) values for BEVs. It has to be pointed out that the c.i. of the electricity used to feed BEVs could be considered equivalent to the WTT c.i. previously reported for gasoline; alternatively, it could be called Plant-to-Battery efficiency (PTB). However, unlike the c.i. related to the fuel, which was considered to be constant over time throughout the mean life service of the vehicle, the c.i. of the electricity used to feed BEVs was assumed to dynamically change according to the scenarios previously described.
As stated before, the fuel/electricity consumptions of the vehicles taken into account in this investigation were gained from statistical records from customers, along with other real-world consumption tests performed by independent organizations [48,49]. Afterward, all the obtained data were compared, thus determining a mean fuel consumption expressed in terms of dm3/km for gasoline, in the case of M-HEVs and F-HEVs, or in terms of kWh/km for electricity, in the case of BEVs. Also, the battery capacity of each vehicle was considered and then multiplied for the total value of the battery-specific CO2 emissions in 2022 (i.e., date of vehicle construction reported in Table 5), thus determining the starting CO2 emissions for each model, to be summed up to the road use-phase emissions (Table 7).
Afterward, fuel and energy consumptions were multiplied respectively for the previously calculated fuel c.i. and the c.i.c., the latter dynamically updated to the period 2022–2034 by taking into account c.i.c. reduction according to BAU@2035 and FF55@2035, in order to determine the cumulative CO2 emissions for each vehicle. To this aim, a graphical comparison, in terms of CO2 emissions versus distance, was performed between the three powertrains when these were applied to the four vehicle segments according to the 2022 scenario in the timeframe 2022–2034 (Figure 1). In particular, two different curves were graphed for BEVs, which report their cumulative CO2 emission trends over distance when two different evolutions for c.i.c. are considered according to the BAU@2035 and FF55@20335 scenarios, respectively. The intersections between the green lines and blue line or red line, respectively, represent the break-even points of BEVs with respect to M-HEVs and F-HEVs according to the two scenarios.
By analyzing Figure 1, it can be seen that parity between BEVs and HEVs is obtained after significant distances in most of the cases, above all, when F-HEVs are considered, mainly due to their higher global efficiency. In fact, only in one case did a M-HEV (i.e., Mazda 2 provided with Skyactive-G engine family) show similar CO2 emissions with respect to a F-HEV, mostly because of the very high efficiency of its internal combustion engine even at partial loads [54]. Also, the significant role played by battery capacity is quite evident, as it increases considerably both the vehicle starting carbon debit and the energy consumption related to a greater moving mass (increasing the green line slope).
Lastly, in order to make predictions for 2035, the above-mentioned vehicles were again considered, although with upgraded performances in terms of global efficiency. In fact, a reduction in fuel consumption of about 5% and 10% for M-HEVs and F-HEVs, respectively, was considered, because of the higher potential expressed by the second ones in reducing inefficient partial load operations due to higher electric/thermal ratios. At the same time, a 5% improvement in efficiency was considered for BEVs, due to the already very high level achieved by each single component, which will be very difficult to improve further. Instead, as regards the battery, a 20% higher specific energy density was taken into account along with a lower specific c.i.b in the BAU@2035 and FF55@2035 scenarios, as reported in Table 5. In the following Figure 2 and Figure 3, graphical comparisons, in terms of CO2 emissions versus distance, of the three powertrains, when these are applied to the four vehicle segments according to the BAU@2035 and the FF55@2035 scenarios, are shown. Even in these cases, a dynamic scenario was adopted in order to take into account the decrease in c.i.e. occurring during the period 2035–2047. The intersections between lines represent the break-even points in terms of CO2 emissions between BEVs and HEVs.
By analyzing Figure 2 and Figure 3, it can be easily seen that the advantage of adopting BEVs is disruptive only in the case of the FF55@2035 scenario and when the whole life of the vehicle is considered. On the contrary, the break-even points are significantly higher for most of the vehicles in the BAU@2035 scenario, leading to a lower advantage for BEVs in terms of avoided CO2 emissions when HEVs are considered. In the following Table 8, the variations in CO2 emissions for M-HEVs and F-HEVs compared to BEVs are reported in terms of percentages for each of the four vehicle segments and for the scenarios considered. It has to be highlighted that the values reported are related to the mean statistical lifespan, which corresponds to the average running range for vehicles in Europe (120,000 km [32]).

4. Discussion

As can be easily seen from Figure 1, the 2022 Italian electricity mix is not able to bring a significant advantage to BEVs over HEVs in reducing cumulative CO2 emissions, if the 2022@BAU scenario is taken into account. In fact, the necessary distance for reaching the break-even point, therefore, the carbon emission parity, is significant, and the advantages in terms of avoided emissions over the mean statistical lifespan @120,000 km can be negative in some cases (Table 8). This issue is evident for most of the vehicle segments, especially when comparing BEVs to F-HEVs, the latter characterized by a higher efficiency powertrain in comparison to M-HEVs. On the contrary, a better result can be achieved for BEVs, if a significant introduction of RES takes place. Indeed, an increase in CO2 can be the result for M-HEVs (around +90%) in the case of city cars (Segment-A) when these are compared to the equivalent BEVs, the latter characterized by the presence of a small battery pack that determines a lower carbon debit and a better running efficiency due to the reduced mass. As regards the 2035 objectives imposed by the Fit for 55 package within the Green Deal, the advantage of phasing out new HEVs will depend on the future introduction of RES. In fact, in the case of the BAU@2035 scenario, HEVs would see a major increase in CO2 emissions in comparison to BEVs (up to +121%, in the case of Segment-A), whereas, in the case of the FF55@2035 scenario, BEVs would achieve an impressive advantage over HEVs (Table 8). However, the latter would be very difficult to reach in Italy because of the very low CAGR related to the newly installed RES capacity connected to the grid in 2022. Moreover, political uncertainty, e.g., linked to the Russia–Ukraine conflict, could play a troublesome action in future scenarios, as confirmed by the negative trends of c.i.e. reduction recorded during the last period in Italy [44,55] and in some parts of Europe [44,56].
The performed analysis has also underlined that it will be hard for Italy to give up using natural gas power plants because of its dependence on photovoltaic energy, which is characterized by a very strong seasonal fluctuation in power production. In fact, it will be hard for energy compensation to be resolved by means of storage systems based on hydrogen or battery systems, which would have enormous consequences, at least at the moment, in terms of capacity and high cost [36,57]. For these reasons, it is improbable that the Italian energy setup will soon reach a very low-carbon intensity value in electricity production like other countries can provide, for instance, with nuclear power plants and more stable RES, the latter based on wind turbines and hydroelectric power plants. For this reason, it is expected that a feasible c.i.e. value in 2035 would fall between the two values reported in the BAU@2035 and FF55@2035 scenarios, resulting in higher-than-expected specific CO2 emissions from cars and in limited global savings of total carbon emissions. Indeed, this perspective would represent quite a different situation from what the EU has planned in phasing out new ICE-based vehicles by 2035.
The research has also shown other issues that could reduce the advantages of BEVs over HEVs in terms of CO2 emissions, at least for the moment. the main issue still remains, namely, the high specific c.i. related to battery production, which was found to be quite higher than the ones assessed in other papers., To explain this underestimation, the authors have highlighted the following reasons: (1) mining and refining of base materials are often not taken into account; (2) CO2 emissions related to batteries refer to a single cell and not to the battery pack, thus excluding the emissive content related to the assembly phase; (3) emissions related to scrap materials are not allocated to the battery; and (4) the c.i.e. taken into account for the production of batteries is often theoretical. In fact, the latter could be referred to as the proper average value of a very large region and not the local one available at the production site or, in contrast, it could be distinctive of a specific country characterized by a very low c.i.e. On the contrary, if strictly applying recognized LCA guidelines and considering only the effective c.i.e. of the manufacturing country (Italy, in this case), higher specific carbon emissions than average could be obtained for the whole production process. Lastly, it must be underlined that the carbon footprint could be further reduced in the future through the adoption of electricity with a lower c.i. for cell manufacturing and assembly. However, the emissive content from mining and refining processes will not easily decrease, as these processes, often not supported by publicly available data on energy consumption [47], generally take place in non-EU countries where carbon-free electricity will not be widely accessible even in the near future. All these aspects together will keep the total carbon footprint value for battery production significant, above all in countries, like Italy, which will not easily reach very low c.i. values for electricity production.
Furthermore, other important issues regarding the effective advantages of BEVs over HEVs are set out below. The first one regards the effectiveness of the transmission of electricity from power plant to battery; in particular, the battery charging phase. In fact, the latter is usually found to be the most critical one, as it contributes to reducing BEVs’ global energy efficiency. Instead, the second issue regards the size of the battery pack and the consequences it could determine on-road efficiency and relative CO2 emissions. In fact, BEVs provided with larger battery packs lead to higher CO2 emissions during the battery production phase and to a lower global efficiency due to a higher vehicle mass. Instead, Segment-A (city cars) BEV vehicles show better performances in comparison to HEVs because of the smaller battery pack and the consequent lower mass, although this involves a shorter running range. It must be underlined that, even with cars provided with large battery systems, the current distance may be much shorter than the one achievable by HEVs. This aspect is still considered crucial by customers, making the trend toward bigger batteries quite unavoidable. On the other hand, the analysis has shown that 2022 HEVs, provided with high-efficiency right-sized combustion engines, could introduce a significant evolution in terms of fuel consumption and CO2 emissions production, as they were expressly designed to match with electric powertrains, thus achieving better global efficiency, when compared to past models. Moreover, HEVs could fully take advantage of the availability of low-carbon fuels (LCF), thus giving impressive attractiveness in the reduction in CO2 emissions. In fact, these fuels could even be produced in a sustainable and affordable way thanks to the availability of low-cost electricity instead of performing RES curtailment (quite probable in the case of the FF55@2035 scenario). This could lead to the availability of a low-c.i. energy source for the automotive sector, making HEVs again competitive with BEVs in many situations.
Lastly, the research has shown that the aforementioned issues along with the problems related to the industrial feasibility of BEVs (availability of critical materials in battery production, power control, motors/generators, etc.) could make the industrial transformation to electric vehicles very challenging for Italy. In fact, in these conditions, it could be quite impossible to create a production context capable of being competitive on the global market with other countries, characterized by lower c.i.e. and cost of energy (i.e., with a nuclear base production and wind/hydro renewables). Also, the resulting uncertainty could even have a negative impact on the country, reducing its potential and any related economic benefits. This panorama could make unworthy the huge economic efforts necessary to prepare adequate infrastructure for vehicle recharging without yielding substantial results in terms of CO2 emissions reduction.

5. Conclusions

The final aim of this paper was an evaluation of the effectiveness of phasing out hybrid vehicles (HEVs) in favor of battery electric vehicles (BEVs) by 2035 when considering the Italian energy scenario. To this aim, a preliminary analysis of the 2022 Italian electricity mix production was performed and a reliable value, comprehensive of the transformation losses, of the carbon intensity of the electricity (c.i.e) was obtained. The same methodology was adopted for predicting two different c.i.e. values in 2035 when taking into account, respectively, a conservative (BAU@2035) and a more aggressive (FF55@2035) scenario, characterized by a different CAGR in RES. Afterward, the obtained data were employed in order to evaluate the total carbon footprint of BEVs with respect to the HEVs’ (M-HEVs and F-HEVs) one, for all the selected vehicles and according to all the energy scenarios considered. In particular, the c.i.e was adopted for determining, at first, the emissions related to battery production (emissions from mining and refining, scrap materials, and final assembly included), then those related to the road use-phase over time adopting a dynamic approach. Afterward, both the CO2 emissive contributions, defined as “cumulative CO2 emissions”, were plotted over a defined distance throughout the mean service life of the vehicle (120,000 km in 12 years) in order to determine break-even points with respect to the cumulative carbon emissions. Furthermore, percentage variations in CO2 emissions for M-HEVs and F-HEVs with respect to BEVs were calculated for all the vehicles and energy scenarios. The obtained results show that, when the BAU@2035 scenario is considered over the timeframe 2022–2034, the Italian electricity mix does not manage to bring a significant advantage to BEVs over HEVs in reducing cumulative CO2 emissions. In fact, in most cases, break-even points are reached only after a significant distance, while percentage variations in CO2 emissions between HEVs over BEVs can be even negative when the B- and C-segments are taken into account. On the contrary, if, in the same timeframe, the FF55@2035 scenario is taken into account, break-even points are also reached after a not negligible distance, although percentage variations in CO2 emissions between HEVs over BEVs are found to be more accentuated, especially in case of A- segment M-HEV (+90%). As regards the 2035 objectives imposed by the Fit for 55 package, the advantages of phasing out new HEVs will depend on the future introduction of RES. In fact, when considering the BAU@2035 scenario in the timeframe 2035–2047, break-even points would be reached after a short distance (38,000 km) only when A-segment BEV is compared to A-segment M-HEV, while achieving minor advantages in the case of F-HEV and of the other segments, especially B- and C-segments F-HEV. Instead, in the case of the FF55@2035 scenario, BEVs would achieve an impressive advantage over HEVs (Table 8), both in terms of break-even points, which are found to be always < 50,000 km, and of percentage variations in CO2 emissions between HEVs and BEVs (from +126% to +364%). However, it would be very difficult to reach the latter condition in Italy because of the 2022 very low CAGR in newly installed RES capacity connected to the grid. For this reason, if the introduction of newly installed RES capacity was at a standstill or proceeded at the same pace as past years (2016–2021), it could be reasonable to think about HEVs—in particular, new generation HEVs—as a valid alternative, especially if fed with low-carbon fuels. Otherwise, an intermediate situation between those outlined in the timeframe 2035–2047 for the BAU@2035 and FF55@2035 scenarios would be expected, which will involve important but not disruptive results as those expected, as a starting point, by the EU for the phase-out of new HEVs by 2035 (Fit for 55 package). The same assumption could be made for all the other European countries whose c.i.e. value is similar to or exceeds the Italian one, while it could represent an absolute revolution in terms of efficiency and CO2 emissions reduction for countries already characterized by a very low c.i.e. value.
As this transformation could profoundly affect the Italian automotive industry, policymakers should be careful not to move too rapidly toward an electrification roadmap, which could definitively damage the significance of the car industry, which represents one of the most important Italian economic pillars. For all the above-mentioned reasons, the authors suggest that the phase-out of thermal engines has to be postponed until the achievement of a real reduction in CO2 electricity emissions, making battery production and end-use phase less critical for customers from both an economic and environmental point of view.
The latter concept finds confirmation in the small percentage of BEVs sold in Italy to mid-2023 (well below the European average), which, therefore, leads to a negligible percentage of BEVs in circulation and a small consequent impact on total CO2 emissions.

Author Contributions

Conceptualization, F.M.G. and P.C.; methodology, P.C.; investigation, F.M.G. and P.C.; resources, F.M.G. and P.C.; data curation, P.C.; writing—original draft preparation, F.M.G. and P.C.; writing—review and editing, F.M.G.; visualization, F.M.G. and P.C. All authors have read and agreed to the published version of the manuscript.

Funding

This research received no external funding.

Data Availability Statement

The original contributions presented in the study are included in the article, further inquiries can be directed to the corresponding author.

Acknowledgments

We warmly thank Antonio Di Meo for the precious help.

Conflicts of Interest

The authors declare no conflicts of interest.

References

  1. Abdul-Manan, A.F.N.; Zavaleta, V.G.; Agarwal, A.K.; Kalghatgi, G.; Amer, A.A. Electrifying passenger road transport in India requires near-term electricity grid decarbonisation. Nat. Commun. 2022, 13, 2095. [Google Scholar] [CrossRef]
  2. Eurostat. Shedding Light on Energy; 2023 ed.; Eurostat: Luxembourg, 2023; Available online: https://ec.europa.eu/eurostat/web/interactive-publications/energy-2023 (accessed on 27 October 2023).
  3. McBain, S.; Teter, J. Tracking Transport 2021; IEA: Paris, France, 2021; Available online: https://www.iea.org/reports/tracking-transport-2021 (accessed on 13 September 2023).
  4. International Energy Agency (IEA). Data Browser. Available online: https://www.iea.org/countries/italy (accessed on 15 November 2023).
  5. International Energy Agency (IEA). Clean Energy Innovation; IEA: Paris, France, 2020; Available online: https://www.iea.org/reports/clean-energy-innovation (accessed on 15 October 2023).
  6. The European Automobile Manufacturers’ Association (ACEA). Vehicles in Use, Europe; ACEA: Brussels, Belgium, 2023; Available online: https://www.acea.auto/publication/report-vehicles-in-use-europe-2023/ (accessed on 4 October 2023).
  7. Woody, M.; Vaishan, P.; Keoleian, G.A.; De Kleine, R.; Kim, H.C.; Anderson, J.E.; Wallington, T.J. The role of pickup truck electrification in the decarbonisation of light-duty vehicles. Environ. Res. Lett. 2022, 17, 034031. [Google Scholar] [CrossRef]
  8. The European Automobile Manufacturers’ Association (ACEA). Fuel Types of New Cars: Battery Electric, 9.1.%.; Hybrid, 1.9.6.%.; Petrol. 400% Market Share Full-Year 2021; ACEA: Brussels, Belgium, 2021; Available online: https://www.acea.auto/files/20220202_PRPC-fuel_Q4-2021_FINAL.pdf (accessed on 13 September 2023).
  9. Xia, X.; Li, P. A review of the Life-cycle Assessment of electric vehicles: Considering the influence of batteries. Sci. Total Environ. 2022, 814, 152870. [Google Scholar] [CrossRef] [PubMed]
  10. Zeng, D.; Dong, Y.; Cao, H.; Li, Y.; Wang, J.; Li, Z.; Hauschild, M.Z. Are the electric vehicles more sustainable than the conventional ones? Influences of the assumptions and modeling approaches in the case of typical cars in China. Resour. Conserv. Recycl. 2021, 167, 105210. Available online: https://www.sciencedirect.com/science/article/abs/pii/S0921344920305279 (accessed on 30 January 2024). [CrossRef]
  11. European Commission, Directorate-General for Climate Action; Hill, N.; Amaral, S.; Morgan-Price, S.; Nokes, T.; Bates, J.; Helms, H. Determining the Environmental Impacts of Conventional and Alternatively Fuelled Vehicles through LCA—Final Report, Publications Office of the European Union. 2020. Available online: https://data.europa.eu/doi/10.2834/91418 (accessed on 26 December 2023).
  12. Moro, A.; Lonza, L. Electricity carbon intensity in European Member States: Impacts on GHG emissions of electric vehicles. Transp. Res. Part D Transp. Environ. 2018, 64, 5–14. [Google Scholar] [CrossRef] [PubMed]
  13. Albatayneh, A.; Assaf, M.N.; Alterman, D.; Jaradat, M. Comparison of the overall energy efficiency for internal combustion engine vehicles and electric vehicles. Environ. Clim. Technol. 2020, 24, 669–680. Available online: https://sciendo.com/it/article/10.2478/rtuect-2020-0041 (accessed on 27 October 2023). [CrossRef]
  14. European Council. ‘Fit for 55′: Council Adopts Regulation on CO2 Emissions for New Cars and Vans. Available online: https://www.consilium.europa.eu/it/press/press-releases/2023/03/28/fit-for-55-council-adopts-regulation-on-co2emissions-for-new-cars-and-vans/ (accessed on 12 September 2023).
  15. European Commission. On the Path to a Climate-Neutral Europe by 2050. Available online: https://commission.europa.eu/strategy-and-policy/priorities-2019-2024/european-green-deal/delivering-european-green-deal_en (accessed on 12 September 2023).
  16. European Council. Fit for 55. Available online: https://www.consilium.europa.eu/en/policies/green-deal/fit-for-55-the-eu-plan-for-a-green-transition/ (accessed on 1 May 2023).
  17. European Parliament, Council of the European Union. REGULATION (EU) 2023/1542 of the European Parliament and of the Council of 12 July 2023 Concerning Batteries and Waste Batteries, Amending Directive 2008/98/EC and Regulation (EU) 2019/1020 and Repealing Directive 2006/66/EC. Off. J. Eur. Union 2023, 66. Available online: http://data.europa.eu/eli/reg/2023/1542/oj (accessed on 1 December 2023).
  18. European Commission. Biofuels. Available online: https://energy.ec.europa.eu/topics/renewable-energy/bioenergy/biofuels_en (accessed on 3 January 2024).
  19. Gustafsson, M.; Svensson, N.; Eklund, M.; Möller, B.F. Well-to-wheel climate performance of gas and electric vehicles in Europe. Transp. Res. Part D Transp. Environ. 2021, 97, 102911. [Google Scholar] [CrossRef]
  20. Efuel Alliance. What Are Efuels. Available online: https://www.efuel-alliance.eu/efuels/what-are-efuels (accessed on 15 September 2023).
  21. European Commission. Renewable Energy—Recast to 2030 (RED II). Available online: https://joint-research-centre.ec.europa.eu/welcome-jec-website/reference-regulatory-framework/renewable-energy-recast-2030-red-ii_en (accessed on 15 September 2023).
  22. European Parliament. Legislative Train Schedule. Revision of the Renewable Energy Directive. In “A European Green Deal”. Available online: https://www.europarl.europa.eu/legislative-train/package-fit-for-55/file-revision-of-the-renewable-energy-directive (accessed on 27 December 2023).
  23. Cox, B.; Bauer, C.; Beltran, A.M.; van Vuuren, D.P.; Mutel, C.L. Life cycle environmental and cost comparison of current and future passenger cars under different energy scenarios. Appl. Energy 2020, 269, 115021. [Google Scholar] [CrossRef]
  24. Helmers, E.; Johannes, D.; Weiss, M. Sensitivity Analysis in the Life-Cycle Assessment of Electric vs. Combustion Engine Cars under Approximate Real-World Conditions. Sustainability 2020, 12, 1241. [Google Scholar] [CrossRef]
  25. Evrard, E.; Davis, J.; Hagdahl, K.-H.; Palm, R.; Lindholm, J.; Dahllöf, L. Carbon Footprint Report—Volvo C40 Recharge; Volvo: Goteborg, Sweden, 2021; Available online: https://www.volvocars.com/us/news/sustainability/Wanted-clean-energy-for-full-climate-benefits/ (accessed on 15 August 2023).
  26. Petrauskienė, K.; Galinis, A.; Kliaugaitė, D.; Dvarionienė, J. Comparative environmental life cycle and cost assessment of electric, hybrid, and conventional vehicles in Lithuania. Sustainability 2021, 13, 957. [Google Scholar] [CrossRef]
  27. Onat, N.C.; Kucukvar, M.; Tatari, O. Conventional, hybrid, plug-in hybrid or electric vehicles? State-based comparative carbon and energy footprint analysis in the United States. Appl. Energy 2015, 150, 36–49. Available online: https://www.sciencedirect.com/science/article/abs/pii/S0306261915004407 (accessed on 15 December 2023). [CrossRef]
  28. Schuller, A.; Stuart, C. From Cradle to Grave: E-Mobility and the Energy Transition. From Cradle to Grave: E-Mobility and the Energy Transition. 2018. Available online: https://europeanclimate.org/wp-content/uploads/2018/09/From-cradle-to-grave-e-mobility-and-the-energy-transition_IT_SP_UK_EU.pdf (accessed on 31 December 2023).
  29. Pipitone, E.; Caltabellotta, S.; Occhipinti, L. A life cycle environmental impact comparison between traditional, hybrid, and electric vehicles in the European context. Sustainability 2021, 13, 10992. [Google Scholar] [CrossRef]
  30. Emilsson, E.; Dahllof, L. Lithium-Ion Vehicle Battery Production, Status 2019 on Energy Use, CO2 Emissions, Use of Metals, Products Environmental Footprint, and Recycling; IVL: Stockholm, Sweden, 2019; Available online: https://www.ivl.se/download/18.14d7b12e16e3c5c36271070/1574923989017/C444.pdf (accessed on 8 September 2023).
  31. Northvolt. Sustainability and Annual Report, 2022; Northvolt: Stockholm, Sweden, 2023; Available online: https://northvolt.com/environment/report2022/ (accessed on 1 November 2023).
  32. UNRAE. Per Quattroruote L’automobile: Italiani a Confronto; UNRAE: Roma, Italy, 2022; Available online: https://unrae.it/files/Studio%20UNRAE%20L_automobile%20Italiani%20a%20confronto_6336ab4170253.pdf (accessed on 15 October 2023).
  33. Islam, E.; Vijayagopal, R.; Moawad, A.; Kim, N.; Dupont, B.; Prada, D.N.; Rousseau, A. A Detailed Vehicle Modeling & Simulation Study Quantifying Energy Consumption and Cost Reduction of Advanced Vehicle Technology through 2050; Argonne National Lab (ANL): Argonne, IL, USA, 2021. [CrossRef]
  34. Capaldi, P.; Grimaldi, F.M. The effectiveness of ICEV phase-out at 2035 in terms of CO2 emission reduction in the Italian scenario. In Proceedings of the 6th International Conference on Energy Harvesting, Storage, and Transfer (EHST’22), Niagara Falls, ON, Canada, 8–10 June 2022; Available online: https://avestia.com/EHST2022_Proceedings/files/paper/EHST_146.pdf (accessed on 27 October 2023).
  35. Life Cycle Greenhouse Gas Emissions from Electricity Generation: Update. Available online: https://www.nrel.gov/docs/fy21osti/80580.pdf (accessed on 10 October 2023).
  36. Ministero della Transizione Ecologica—Dip.Energia—Direzione Generale Infrastrutture e Sicurezza. La Situazione Energetica Nazionale Nel 2021. Italy. Available online: https://dgsaie.mise.gov.it/pub/sen/relazioni/relazione_annuale_situazione_energya_nazionale_dati_2021.pdf (accessed on 27 September 2023).
  37. ANIE Federazione. Sala Stampa—Comunicati Stampa. Osservatorio FER. Available online: https://anie.it/sala-stampa/comunicati-stampa/ (accessed on 10 October 2023).
  38. International Energy Agency (IEA). Italy 2023—Energy Policy Review; IEA: Paris, France, 2023; Available online: https://www.iea.org/reports/italy-2023 (accessed on 27 October 2023).
  39. Terna—Snam. Documento di Descrizione Degli Scenari 2022; Terna/Snam: Roma, Italy, 2022; Available online: https://www.terna.it/it/sistema-elettrico/rete/piano-sviluppo-rete/scenari (accessed on 10 October 2023).
  40. EMBER European Union. The EU Accelerates Electricity Transition in the Wake of Crisis. Explore Open Data (Emissions Intensity). Available online: https://ember-climate.org/countries-and-regions/regions/european-union/ (accessed on 2 October 2023).
  41. Terna. Evoluzione Rinnovabile 2021; Terna: Roma, Italy, 2021; Available online: https://download.terna.it/terna/Evoluzione_Rinnovabile_8d940b10dc3be39.pdf (accessed on 27 October 2023).
  42. Teske, S.; Morris, T.; Nagrath, K. 100% Renewable Energy: An Energy [R] Evolution for ITALY. Report Prepared by ISF for Greenpeace Italy. 2020. Available online: https://www.uts.edu.au/sites/default/files/article/downloads/100-Percent-Renewable-Energy-Italy-report.pdf (accessed on 1 May 2023).
  43. International Energy Agency (IEA). Electricity Grids Secure Energy Transition; IEA: Paris, France, 2023; Available online: https://www.iea.org/reports/electricity-grids-and-secure-energy-transitions (accessed on 21 October 2023).
  44. International Energy Agency (IEA). Electricity 2024, Analysis and Forecast to 2026; IEA: Paris, France, 2024; Available online: https://www.iea.org/reports/electricity-2024 (accessed on 24 January 2024).
  45. The International EPD System Documentation Overview for, Environmental Product Declaration; PCR. Available online: https://environdec.com/resources/documentation#generalprogrammeinstructions (accessed on 1 November 2023).
  46. Link, S.; Neef, C.; Wicke, T. Trends in Automotive Battery Cell Design: A Statistical Analysis of Empirical Data. Batteries 2023, 9, 261. [Google Scholar] [CrossRef]
  47. Maus, V.; Werner, T.T. Impacts for half of the world’s mining areas are undocumented. Nature 2024, 625, 26–29. [Google Scholar] [CrossRef] [PubMed]
  48. Spritmonitor.de. MPG and Cost Calculator and Tracker. Available online: https://www.spritmonitor.de/en/ (accessed on 21 October 2023).
  49. ADAC. Elektroautos im Test: So Hoch ist die Reichweite Wirklich. Available online: https://www.adac.de/rund-ums-fahrzeug/elektromobilitaet/tests/stromverbrauch-elektroautos-adac-test/ (accessed on 10 October 2023).
  50. Edwards, R.; Larivé, J.-F.; Rickeard, D.; Weindorf, W. JEC, Well-to-Wheels Analysis, Well-to-Wheels Analysis of Future Automotive Fuels and Powertrains in the European Context”, Concawe-EUCAR-JRC; JRC: Bruxelles, Belgium, 2014; Available online: https://publications.jrc.ec.europa.eu/repository/bitstream/JRC85326/wtt_report_v4a_april2014_pubsy.pdf (accessed on 10 September 2023).
  51. Argonne National Laboratory. Energy Systems and Infrastructure Analysis, GREET Model—The Greenhouse Gases, Regulated Emissions, and Energy Use in Technologies Model. Available online: https://greet.es.anl.gov/ (accessed on 1 October 2023).
  52. Reick, B.; Konzept, A.; Kaufmann, A.; Stetter, R.; Engelmann, D. Influence of charging losses on energy consumption and CO2 emissions of battery-electric vehicles. Vehicles 2021, 3, 736–748. [Google Scholar] [CrossRef]
  53. Genovese, A.; Ortenzi, F.; Villante, C. On the energy efficiency of quick DC vehicle battery charging. World Electr. Veh. J. 2015, 7, 570–576. [Google Scholar] [CrossRef]
  54. Goto, T.; Isobe, R.; Yamakawa, M.; Nishida, M. The New Mazda Gasoline Engine Skyactiv-G. MTZ Worldw. eMag. 2011, 72, 40–47. [Google Scholar] [CrossRef]
  55. EMBER Italy. Fossil Gas still Dominates Italy’s Electricity but Renewable Power Targets Have Increased. Available online: https://ember-climate.org/countries-and-regions/countries/italy/ (accessed on 24 November 2023).
  56. EMBER Europe. Uneven Progress Towards Clean Electricity. Available online: https://ember-climate.org/countries-and-regions/regions/europe/ (accessed on 17 December 2023).
  57. SNAM; The European House-Ambrosetti. H2 Italy 2050. A National Hydrogen Value Chain for the Growth and Decarbonization of Italy; SNAM, The European House-Ambrosetti: Milano, Italy, 2020; Available online: https://www.ambrosetti.eu/en/community-innotech/hydrogen-community/ (accessed on 30 September 2023).
Figure 1. The comparison (in terms of CO2 emissions versus distance) between the three powertrains when applied to the four vehicle segments according to the 2022 scenario.
Energies 17 00961 g001
Figure 2. A comparison (in terms of CO2 emissions versus distance) between the three powertrains when applied to the four vehicle segments according to the BAU@2035 scenario.
Energies 17 00961 g002
Figure 3. A comparison (in terms of CO2 emissions versus distance) between the three powertrains when applied to the four vehicle segments according to the FF55@2035 scenario.
Energies 17 00961 g003
Table 1. The chosen vehicles according to the segment and powertrain.
Car SegmentPowertrain
M-HEVF-HEVBEV
A 1Suzuki IgnisHonda JazzVW UP
B 2Mazda 2Toyota YarisNissan Leaf
C 3Ford FocusHyundai IoniqTesla Mod.3
M 4Suzuki VitaraVW TiguanOpel Mokka
1 A = city cars with a full length up to 3.7 m; 2 B = small cars with a full length between 3.7 m and 4.2 m; 3 C = small family cars with a full length between 4.2 m and 4.6 m; 4 D = compact Multi-Purpose Vehicle with a full length up to 4.5 m.
Table 2. The Italian electricity mixes (TWh) and their relative c.i.e. (gCO2/kWh) according to current, BAU@2035, and FF55@2035 scenarios. The c.i.e. reported for 2022 and future (2035) scenarios have to be considered as gross values.
NG
(TWh)
OTHER NON-
RES
(TWh)
HYDRO
(TWh)
PV
(TWh)
WIND
(TWh)
OTHER RES
(TWh)
CURTAILMENT/
STORAGE LOSSES
(TWh)
Net I/E
(TWh)
c.i.e.
(gCO2/kWh)
20221402247252123−143293
2035 BAU155751353023−453249
2035 FF55573511369023−2653110
Table 3. Specific carbon intensities (c.i.e.) (kgCO2/kWh) related to the energy scenarios and delivery points.
Energy ScenarioElectric C.I.
(p.p.) 1
(kgCO2/kWh)
Electric C.I.
(m.v.) 2
(kgCO2/kWh)
Electric C.I.
(l.v.) 3
(Socket c.i.)
(kgCO2/kWh)
20220.2930.3080.318
2035 BAU0.2490.2620.270
2035 FF550.1100.1160.120
1 p.p. = electricity at power-plant; 2 m.v. = medium voltage; electricity for production plants and industries (battery production plants) at medium voltage (20 kV) with 95% grid transmission efficiency; 3 l.v. = low voltage; electricity for non-industrial uses (e.g., electric socket) at low voltage (380 V) with 92% grid transmission efficiency.
Table 4. CO2e emissions (kgCO2/kWh) related to (a) the battery cell production, (b) mining and refining processes, and (c) the scrap materials production found in the literature.
AuthorsCO2 Specific Emissions Related to the Battery Cell
(kgCO2/kWh)
CO2e Emissions
Related to Mining and Refining Processes
(kgCO2/kWh)
CO2e Emissions
from Scrap
Materials
(kgCO2/kWh)
Cox et al. (2017) [22]100N.C. 1N.C.
IVL (2019) [30]80N.C.N.C.
Helmers et al. (2020) [23]90N.C.N.C.
Woody et al. (2021) [7]90N.C.N.C.
Volvo 2 (2021) [24]905015
Northvolt (2022) [31]130 3////
1 N.C. = not considered; 2 Total emissions referred to the whole battery pack; 3 Global “State-of-the-Art” value also considering mining, refining, and emissions from un-recycled scrap materials.
Table 5. CO2 emissions (kgCO2/kWh) related to (a) mining and refining processes, (b) battery cell production, (c) scrap materials production, (d) battery pack assembly process, (e) total emissions related to battery pack production in the Italian case study, and (f) total emissions related to battery pack production in the Italian case study in case of enhanced battery efficiency. As b–f are dependent on the same c.i.e., the latter is reported for all the energy scenarios at the battery production plant.
Energy ScenarioElectric C.I.
(Battery Production Plant)
(kgCO2/kWh)
(a)
CO2
for
Mining and
Refining
(kgCO2/kWh)
(b)
CO2 for
Battery Cell Production
(kgCO2/kWh)
(c)
CO2 for Scrap
Materials
Production
(kgCO2/kWh)
(d)
CO2 for
Battery Pack
Assembly
(kgCO2/kWh)
(e)
Total CO2 for Battery Pack
Production
(kgCO2/kWh)
(f)
Total CO2 for
Enhanced
Battery
@2035
(+20% Energy)
(kgCO2/kWh)
20220.30845741520154//
2035 BAU0.2624050141812297
2035 FF550.116402310148770
Table 6. Socket carbon intensity (kgCO2/kWh), charging efficiency, and vehicle battery carbon intensity (kgCO2/kWh), for the 2022 scenario and 2035 scenarios.
Energy
Scenario
C.I.E.
@Socket
AC Charging
Phase
Efficiency
C.I.C.
@Vehicle
Battery
(PTB)
20220.3180.850.374
BAU@20350.2700.880.307
FF55@20350.1200.880.137
Table 7. Fuel/energy consumption, on-board battery capacity, and battery production CO2 emissions by the 12 vehicles taken into account.
Mild HEV
Car Segment
ModelFuel Consumption
(dm3/km)
Battery
Capacity
(kWh)
CO2 for Battery
Production
(kgCO2)
ASuzuki Ignis0.0540.1320
BMazda 20.0460.90138
CFord Focus0.0581.20185
MSuzuki Vitara0.0621.10169
Full HEV
Car Segment
ModelFuel Consumption
(dm3/km)
Battery
Capacity
(kWh)
CO2 for Battery
Production
(kgCO2)
AHonda Jazz0.0460.75115
BToyota Yaris0.0450.90138
CHyundai Ioniq0.0481.6200
MVW Tiguan0.0501.20185
BEV
Car Segment
ModelEnergy
Consumption
(kWh/km)
Battery
Capacity
(kWh)
Battery Carbon
Intensity
(kgCO2)
AVW UP0.141375700
BNissan Leaf0.162609240
CTesla Mod.30.184609240
MOpel Mokka0.177507700
Table 8. Variations in CO2 emissions for M-HEVs and F-HEVs compared to BEVs according to the energy scenarios considered.
SCENARIOCAR SEGMENTPOWERTRAIN
BEVFull
HEV
Mild
HEV
2022@ BAUARef.+35%+66%
B−4%−1%
C−2%+17%
M+14%+40%
2022@ FF55A+55%+90%
B+8%+11%
C+10%+32%
M+29%+60%
BAU@2035A+71%+121%
B+23%+34%
C+25%+58%
M+44%+88%
FF55@2035A+259%+364%
B+126%+147%
C+160%+229%
M+197%+286%
Disclaimer/Publisher’s Note: The statements, opinions and data contained in all publications are solely those of the individual author(s) and contributor(s) and not of MDPI and/or the editor(s). MDPI and/or the editor(s) disclaim responsibility for any injury to people or property resulting from any ideas, methods, instructions or products referred to in the content.

