Article

Shear Behavior of Two-Dimensional Propped Rough Fractures

Faculty of Engineering, China University of Geosciences, Wuhan 430074, China
*
Author to whom correspondence should be addressed.
Energies 2024, 17(4), 956; https://doi.org/10.3390/en17040956
Submission received: 11 January 2024 / Revised: 3 February 2024 / Accepted: 4 February 2024 / Published: 19 February 2024

Abstract

:
The deployment of proppant to fracture shear is a promising approach to stimulating hydraulic permeability in fractured reservoirs. However, the interactive effects of proppant and surface roughness have not been clearly revealed. To better understand this concern, direct shear tests (DSTs) are implemented on 2D rough fractures with a joint roughness coefficient (JRC) varying from 4 to 6 and 18 to 20 under propped conditions. The results show that peak shear strength is positively proportional to asperity amplitude. The highest peak shear strength is determined with a JRC of 14–16 due to it having the highest asperity of 6.34 mm. The peak shear load was decreased significantly by deploying the proppant. Shear damage only occurs in the localized zone where the upper–lower asperities contact. The shear dilatancy was attributed to both the “shear climbing” effects and the shear damage that caused the frictional slip. The proppants weaken the climbing effect but also prevent the shear damage that in turn promotes shear dilatancy.

1. Introduction

Shear stimulation, also known as hydro shearing or shear-dilation-based hydraulic stimulation, has proven to be an effective way to improve the hydraulic permeability of hot dry rock (HDR) reservoirs [1,2,3]. During shear stimulation of an HDR reservoir, fracturing fluid containing proppant is injected at a pressure lower than the surrounding rock’s minimal main stress [2,4]. Following injection, the effective normal stress on the fractures diminishes, resulting in shear slip of severely stressed fractures in the reservoir [3,5]. Previous research has shown that pre-existing fractures slide first, followed by the development of new fractures around the borehole, and shear stimulation increases permeability significantly [6,7,8].
During hydraulic fracturing, proppants, generally containing high-strength granular materials such as silica sand and ceramic, are frequently injected into the reservoir with fracturing fluids to preserve permeability [9,10]. Despite the fact that many theoretical studies have been conducted on the use of proppant in oil/gas reservoirs [11,12], experimental studies have rarely been conducted. Moreover, previous studies have mostly focused on the point of proppant embedment [13,14] and migration [15,16] in fractures. The presence of proppant introduces an unpredictable stress condition in fractured rock masses, which potentially influences the effective normal stress and the shear strength of the fault. The role of proppant in the shear progression of HDR fractures was still unclear.
The surface roughness of rock masses is one of the most critical factors that significantly affects the mechanical properties and shear behaviors of fractured rocks [17,18]. The quantification of the joint roughness coefficient (JRC) is crucial to the shear behavior of fractured rock masses. The JRC was first adopted by Barton [19], and ten standard profiles of joint surfaces with JRC values ranging from 0 to 20 were formulated from practices in 1976 [20]. Despite the obvious advantages of the 3D roughness parameters, 2D roughness parameters are preferred in practice due to their simplicity. Among the 2D criteria, the Barton model is probably the most popular one for determining the shear strength of discontinuities [21,22].
The rough fracture surface is composed of many asperities with different shapes and amplitudes. The degradation of these asperities constitutes the macroscopic shear failure characteristics of joint surfaces [23]. Previous studies have shown that surface roughness influences proppant embedment during rock fracture shearing, affecting the shear behavior of fractured rocks [24]. Liu et al. [25] reported that the asperity amplitude significantly affected the roughness. On the other hand, the asperity degradation features of rock fracture during shearing have also been widely studied through experiments [17,26].
However, the shear behavior of rough fractures is extremely complicated and cannot be clearly revealed by three-dimensional (3D) rough fractures. Thus, clarifying the critical coupling effects of proppant and surface roughness on shearing two-dimensional (2D) fractures becomes an important alternative. To clarify these interactive effects, this paper aims to investigate the mechanical behavior and shear dilatant characteristics of propped rough fractures by direct shear tests (DSTs). The fractured specimens with various 2D roughness and propped conditions are tested by deploying a constant vertical load and a lateral shear load. The progressive shear dilatant displacement is monitored to elucidate the progressive fracture aperture and interactions of proppant and roughness. The role of proppant and surface asperities in the shear of propped fractures is discussed.

2. Materials and Methods

2.1. Specimen Preparation

On a laboratory scale, the roughness was conventionally investigated by direct shear tests with artificial rock joints [27,28]. For practical engineering, this simplification can conveniently characterize the natural roughness of joints [29]. In this study, the natural rough fractures were simulated by pre-fracturing the specimens, which were made of rock-like materials. The composition of the specimens was made by mixing cement, fine sand, water, and coarse aggregates in a mass ratio of 1:2:0.25:3 to simulate the mineral composition of granite. The specimens with four roughnesses were made by the following steps: (1) The concrete was precisely cut into specimens with dimensions of 50 × 50 × 25 mm. (2) Rhinoceros (7.4) and Geomagic Studio (2013) software were used to expand the Barton standard roughness profiles laterally into a 3D model. (3) The 3D model was entered into the CNC engraving machine, and the specimens were engraved. Then the rock-like specimens were completed, and the upper and lower fracture surfaces were completely fitted, as shown in Figure 1. There are four different levels of roughness in terms of JRC: 4–6, 10–12, 14–16, and 18–20.

2.2. Direct Shear Test (DST)

To understand the evolution of shear dilation during the shear process under varied propped conditions, direct shear tests (DSTs) combined with a camera device were performed using the RMT150C testing apparatus (Figure 2), which has servo-controlled normal and shear loads. Two normal load conditions of 40 kN and 80 kN (equivalent to 5 MPa and 9 MPa normal stress) were held constant during the shear process, and four proppant sizes were applied: none, 0.1 mm, 0.5 mm, and 1.0 mm. Controlled by the aforementioned conditions (Table 1), direct shear tests were conducted. The direct shear test was performed at a constant shear rate of 0.01 mm/s and a maximum shear displacement of 15 mm. The gouge material on the tested sample surface, including proppant and damaged surface materials, was carefully collected for further examination.

2.3. Analysis of Surface Damage

Fractured surfaces were scanned before and after direct shear tests using an OKIO-5M 3D scanner (Shenzhen Mubibai Technology Co., Ltd., Shenzhen, China), generating point cloud data containing the three-dimensional (3D) topological information of the fracture surface. The data were then pre-processed using the following steps: (1) Matching the 3D coordinates for the same surface before and after the shear test so that the surface scan data have the same origin and orientation. (2) Removing the data points within 5 mm from the edges of the sample surface, which excludes the abnormal damage due to stress concentration at the edges from further analysis. (3) Rotating the points so that the best-fitted plane of the points is horizontal, which eliminates the global inclination of the point cloud. (4) Interpolating the point coordinates onto a 600 × 600 grid. After pre-processing, the deviation of shear surface elevation (z) for each surface before and after the shear test was determined. These deviations indicate surface damage.

2.4. Dilatant Behavior Monitoring

Based on the direct shear tests on rock fractures, a strong correlation between roughness and proppants and the fracture shear behavior was found in rock fractures [29,30]. In order to elucidate the relation between asperity amplitude and shear behavior of fractures, we counted the asperity amplitudes of four Barton standard JRC profiles, as shown in Figure 3. It can be seen that the maximum asperity amplitude of 6.34 mm is measured at the fracture with JRC = 14–16. The present study focuses on the peak dilation angle (dp) and the maximum dilation angle (di), which are defined in Figure 3 [20]. The maximum dilation angle on the four Barton standard JRC profiles was identified by image recognition technology in MATLAB (version R2020a). The processing steps are as follows: (1) The Canny operator is first used to detect the edges of the profiles and extract the positional information to obtain a binarized image. (2) Obtain the pixel index of the non-edge region and split it into x and y vectors. (3) Calculate the slope and find the index of the point with the largest slope. (4) Output the coordinates of the point with the maximum slope and its corresponding slope value.
Previous research has employed the normal displacement curve monitored by DST equipment to characterize fracture dilatant behavior, as shown in Figure 3a. However, this can only explain the overall displacement trend of the fracture and cannot characterize the rough fracture’s local displacement field. Area information was recorded with a high-speed camera and smartphone, as shown in Figure 2. The local displacement of fractures can be obtained. In the process of testing, images of the fracture were captured with a high-speed camera and remote-control software (O-KAM 2.2.09).

3. Results

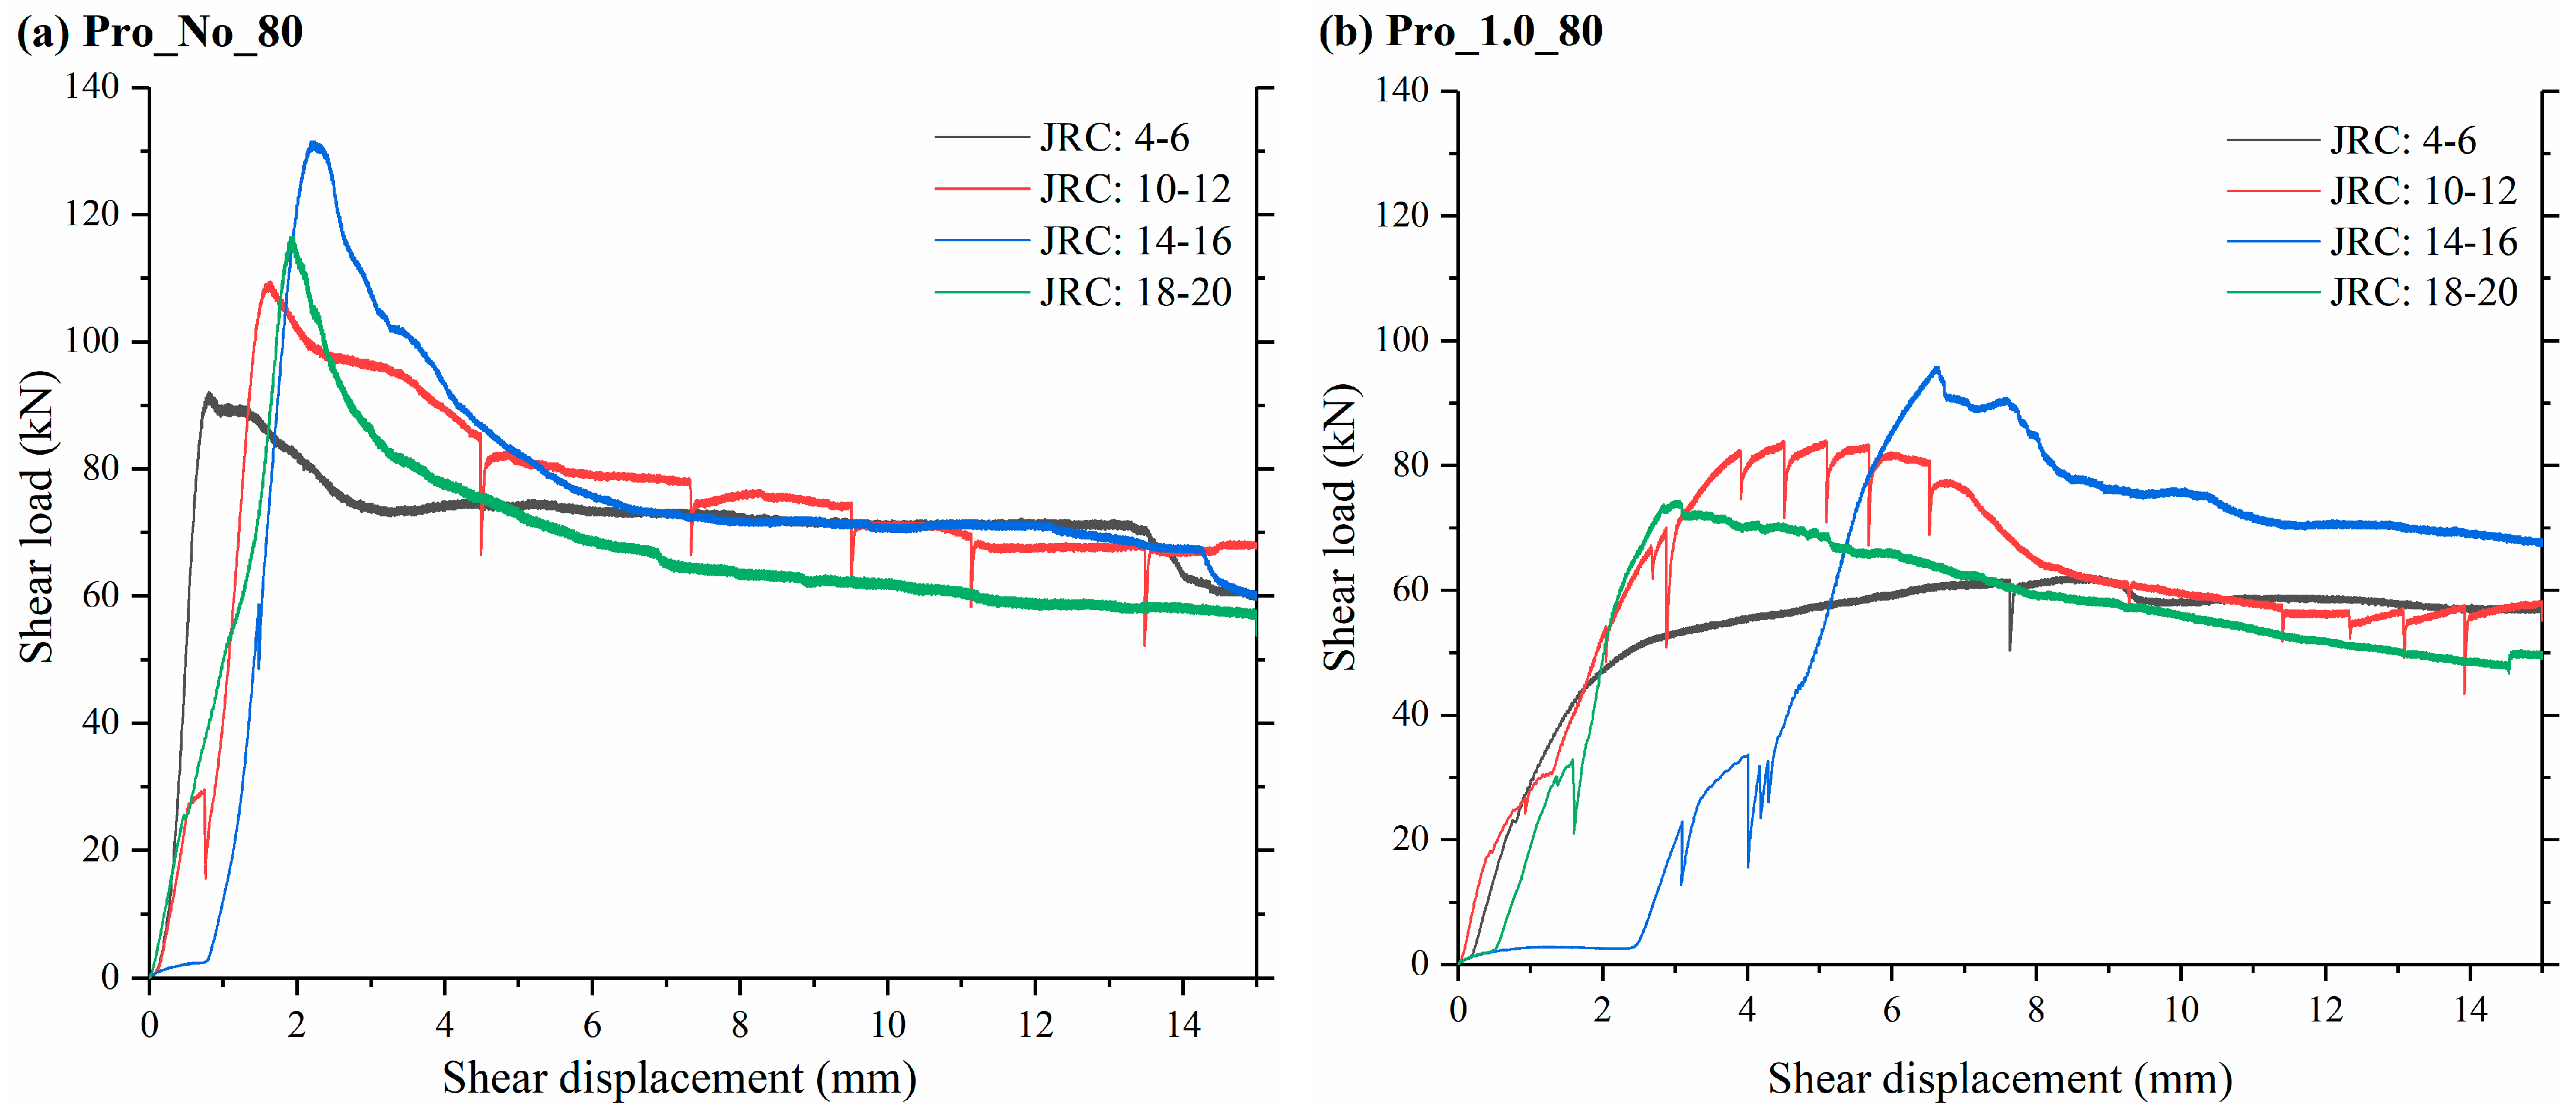
3.1. Load–Displacement Characteristics
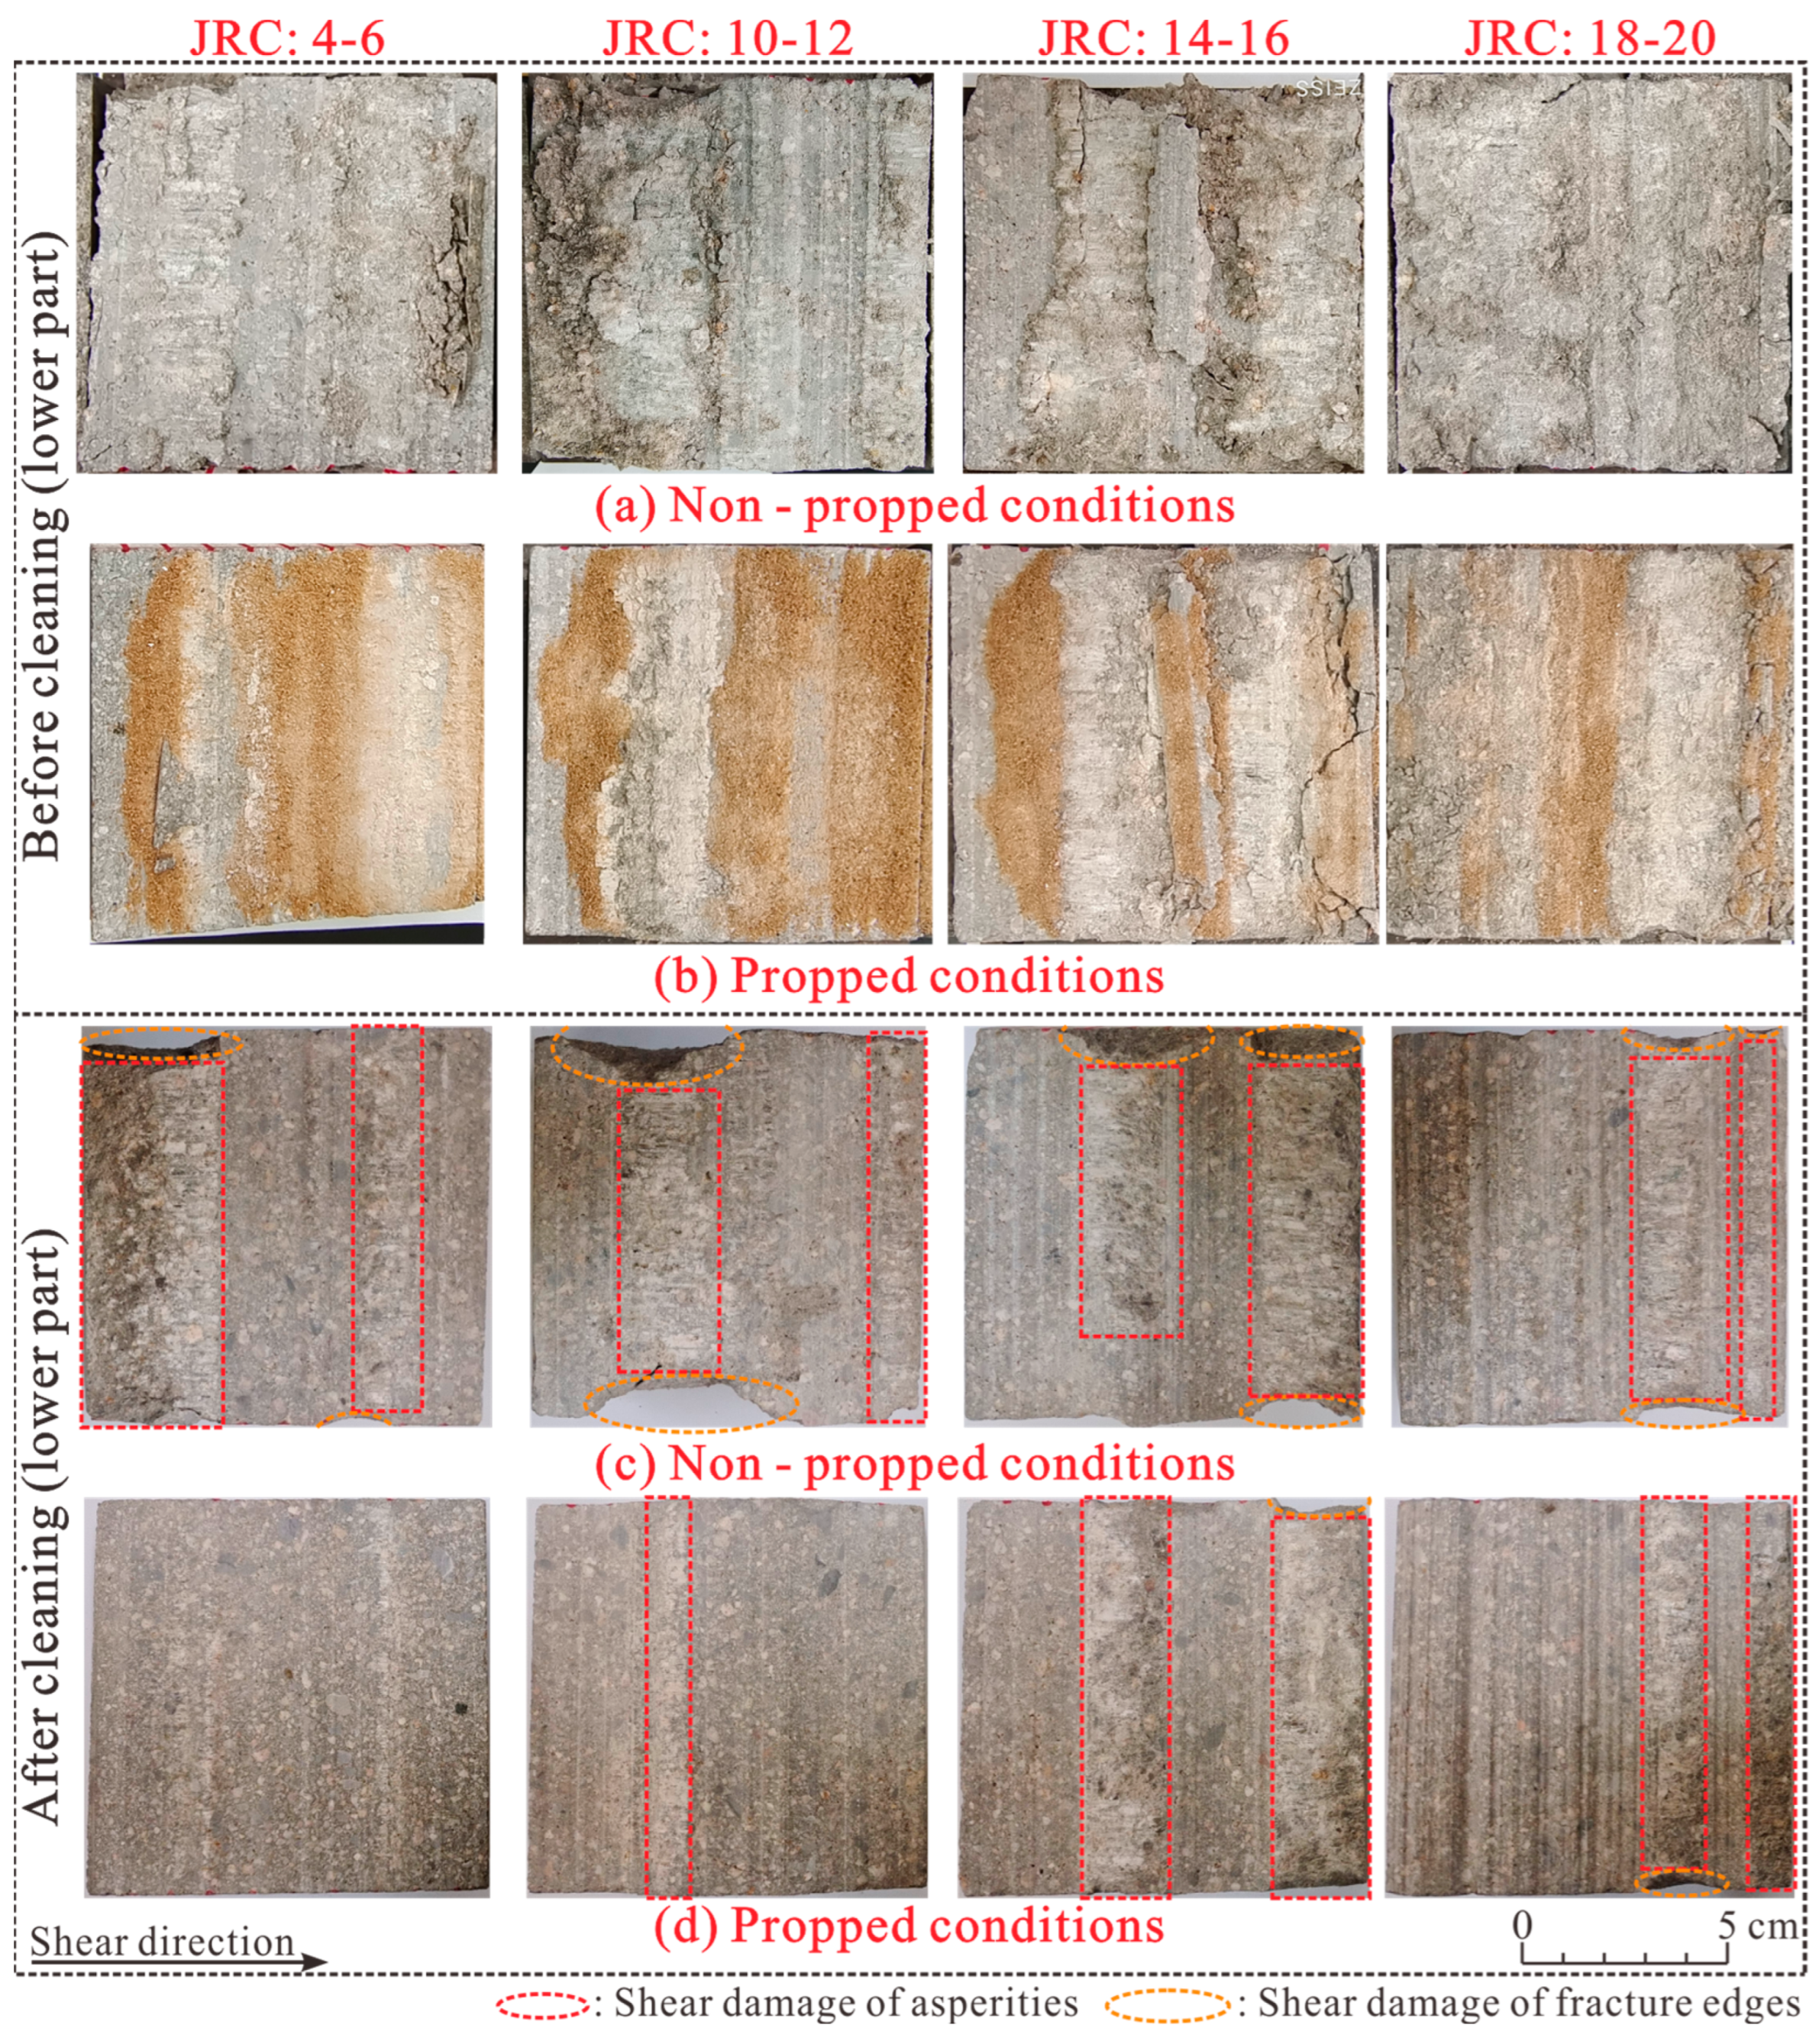
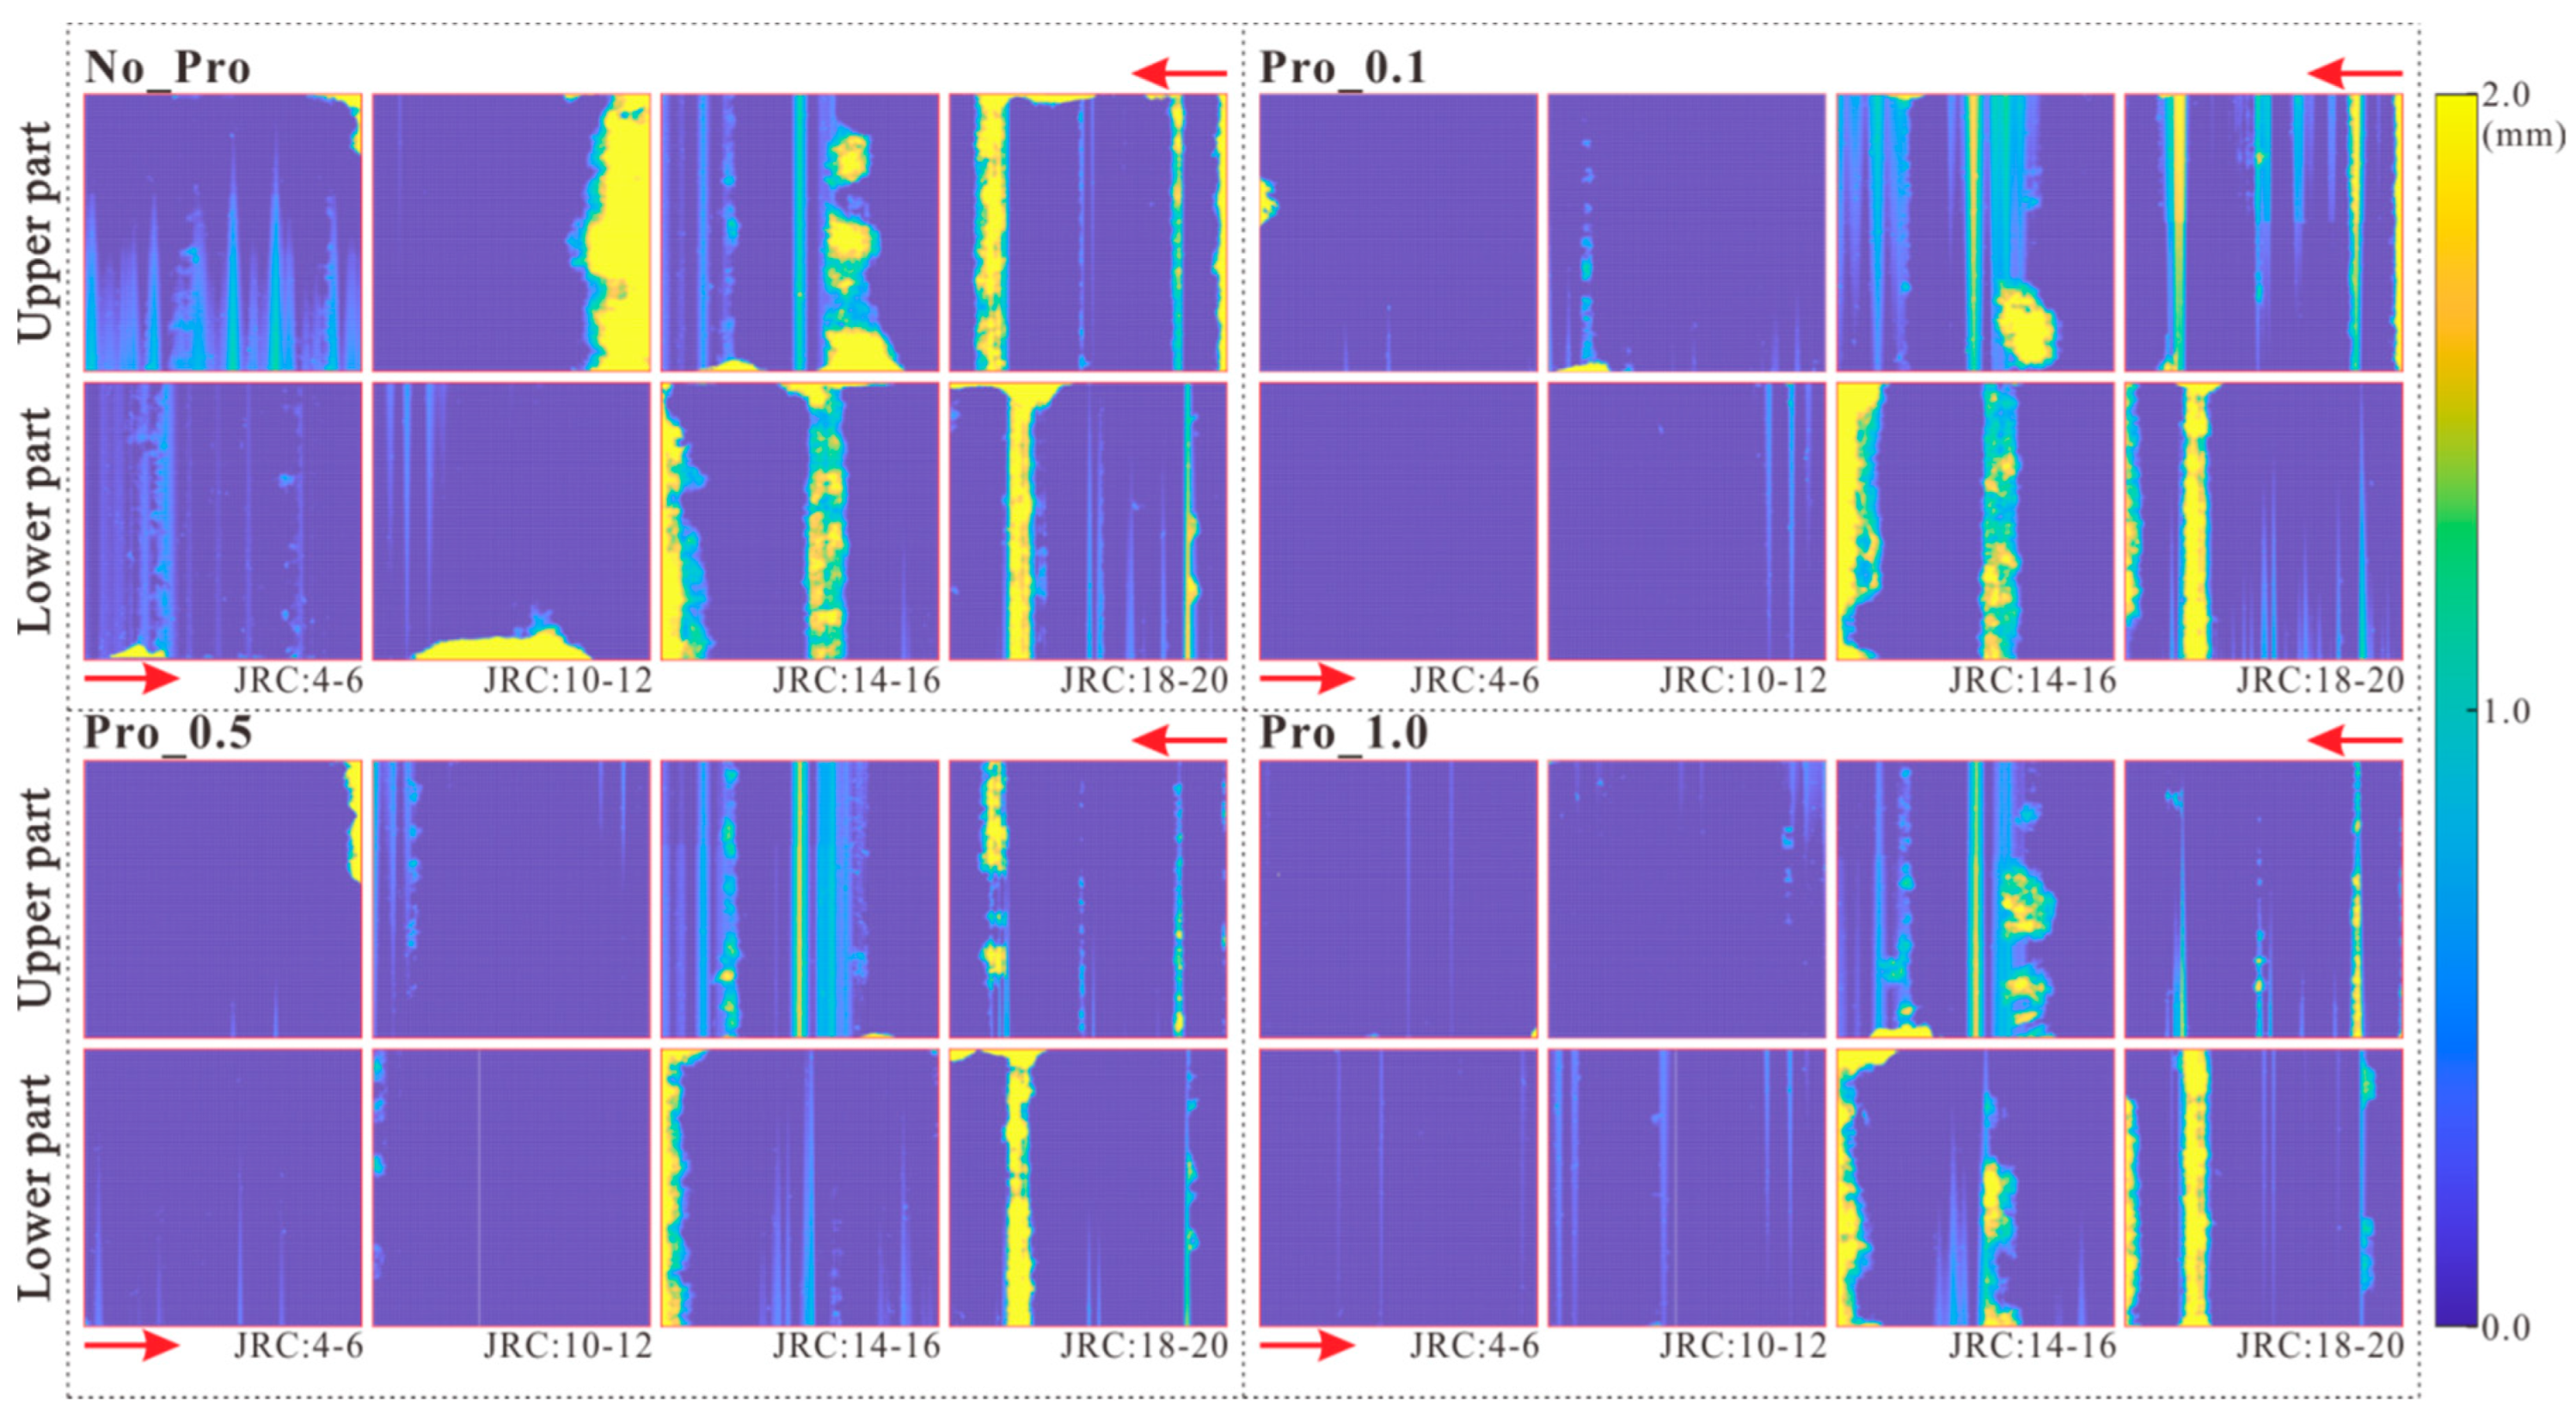
Sixteen tests were performed under a 40 kN normal load under four roughness conditions and four different propped conditions (Figure 4). Among the four propped conditions, the largest peak shear stresses were observed when JRC = 14–16 and the lowest when JRC = 4–6, with the smoothest load curves. The shear load rose with shear displacement to a peak value in the non-propped sample (Pro_No-40), followed by a sudden reduction. After that, the shear load gradually decreased to a residual value. The propped fractures showed lower peak shear stress at larger shear displacements, and the peak region of the load–displacement curve became less pronounced as the proppants were deployed. The delay of the peak occurrence increased with increasing proppant grain size. Moreover, with the deployment of the proppant, the shear load curves under roughness of JRC = 10–12 show an abrupt stress drop, with the frequency of the stress drop increasing as the grain size of the proppant rises.
The shear behaviors of propped fractures at normal loads of 80 kN are depicted in Figure 5. Compared with the vertical load of 40 kN, the peak and residual shear loads increased, which is commonly seen in direct shear tests. Similar to the phenomenon observed above, stick-slip is also observed only in the tests under roughness of JRC = 10–12, where sharp stress drops occurred caused by the slip of the fracture surface or shear damaging by asperities, proppant, or debris. Under roughness of JRC = 14–16, the peak shear load appears the latest compared to the other roughness. The creep stage can be observed before the shear load rises, and the deployment of proppant prolongs the duration of the creep stage. In the stress climbing stage, the stick-slip is also found under propped conditions.

3.2. Surface Damage

The ultimate shear failure modes of fracture surfaces at the end of the shear tests are shown in Figure 6. The deviation of surface elevation was used to identify the damaged areas (Figure 7). The initial roughness of the fractures was controlled and thus showed significant regularity among samples. The results show that the shear failure is only concentrated in the local contact area and verges during the shearing process. The normal stress of asperities is relatively concentrated, and damage behavior then occurs after the material reaches the yield strength. Previous studies have shown that the asperities on fracture surfaces provide a “real” contact area, resulting in contact stresses that are significantly larger than the area partly stripped owing to shear dilatancy [31].
Furthermore, the damage area is larger and more concentrated in the fractures with JRC = 10–12 and JRC = 14–16 than that with JRC = 4–6 and JRC = 18–20. This is due to the fact that asperities with high roughness on the fracture surface are dominated by fine size and are more evenly distributed, with significantly lower yield strength than asperities with coarse size. It explains why the peak shear loads are larger for these two conditions (JRC = 10–12, JRC = 14–16). It is further demonstrated that asperities of smaller size are more susceptible to shear damage during the shearing process.
The shear damage is considerably alleviated when proppants are deployed, and there are essentially no major areas of concentrated damage events on the fracture surfaces, as seen in Figure 6. Because of shear dilatancy, a considerable fraction of proppants is entirely unstressed and exists in the locally opened fracture aperture. To investigate the crushing ratio of proppant further, the unbroken proppant grains were collected by sieving the gouge material according to the initial proppant grain sizes and manually removing the fresh rock fragments chipped off from the surface. The weight of the unbroken proppant was determined, and the ratio of unbroken to fractured proppant was calculated. The weight proportion of crushed proppant during shear testing indicates that roughness is closely connected to proppant crushing. Under four roughness conditions, the weight ratio of proppant crushing is 26.45%, 31.64%, 61.32%, and 78.26%. The crushing ratio of proppant rises as roughness increases. It signifies that the fracture surface has more homogeneous compression conditions, which might crush the proppant. Since the proppants are deposited in the gully of the fracture surface, it lowers the actual contact area of the asperity and thus alleviates shear damage during the shear process.
The damage distribution of fracture surfaces was shown to be strongly related to the initial roughness and propped conditions. The banded damage zone on the fracture surface means that the local contact of asperity dominates the damage behavior of the fracture surface during the shear process. As illustrated in Figure 7, the area of damage bands decreases dramatically as the grain size of the proppant increases. This is due to the low fluctual amplitude of asperity on the JRC = 4–6 fracture surfaces, where the rough surface grooves are completely covered by proppants, acting as a protective effect. Nevertheless, on the fracture surfaces of JRC = 10–12, there is a single asperity with coarse size and a higher shear damage stress limit. Due to the proppants acting as lubricants, the fracture is prone to shear dilatation. Under the high roughness, the proppants cannot adequately cover the fracture surface because of the multi-level gully on the fracture surface.

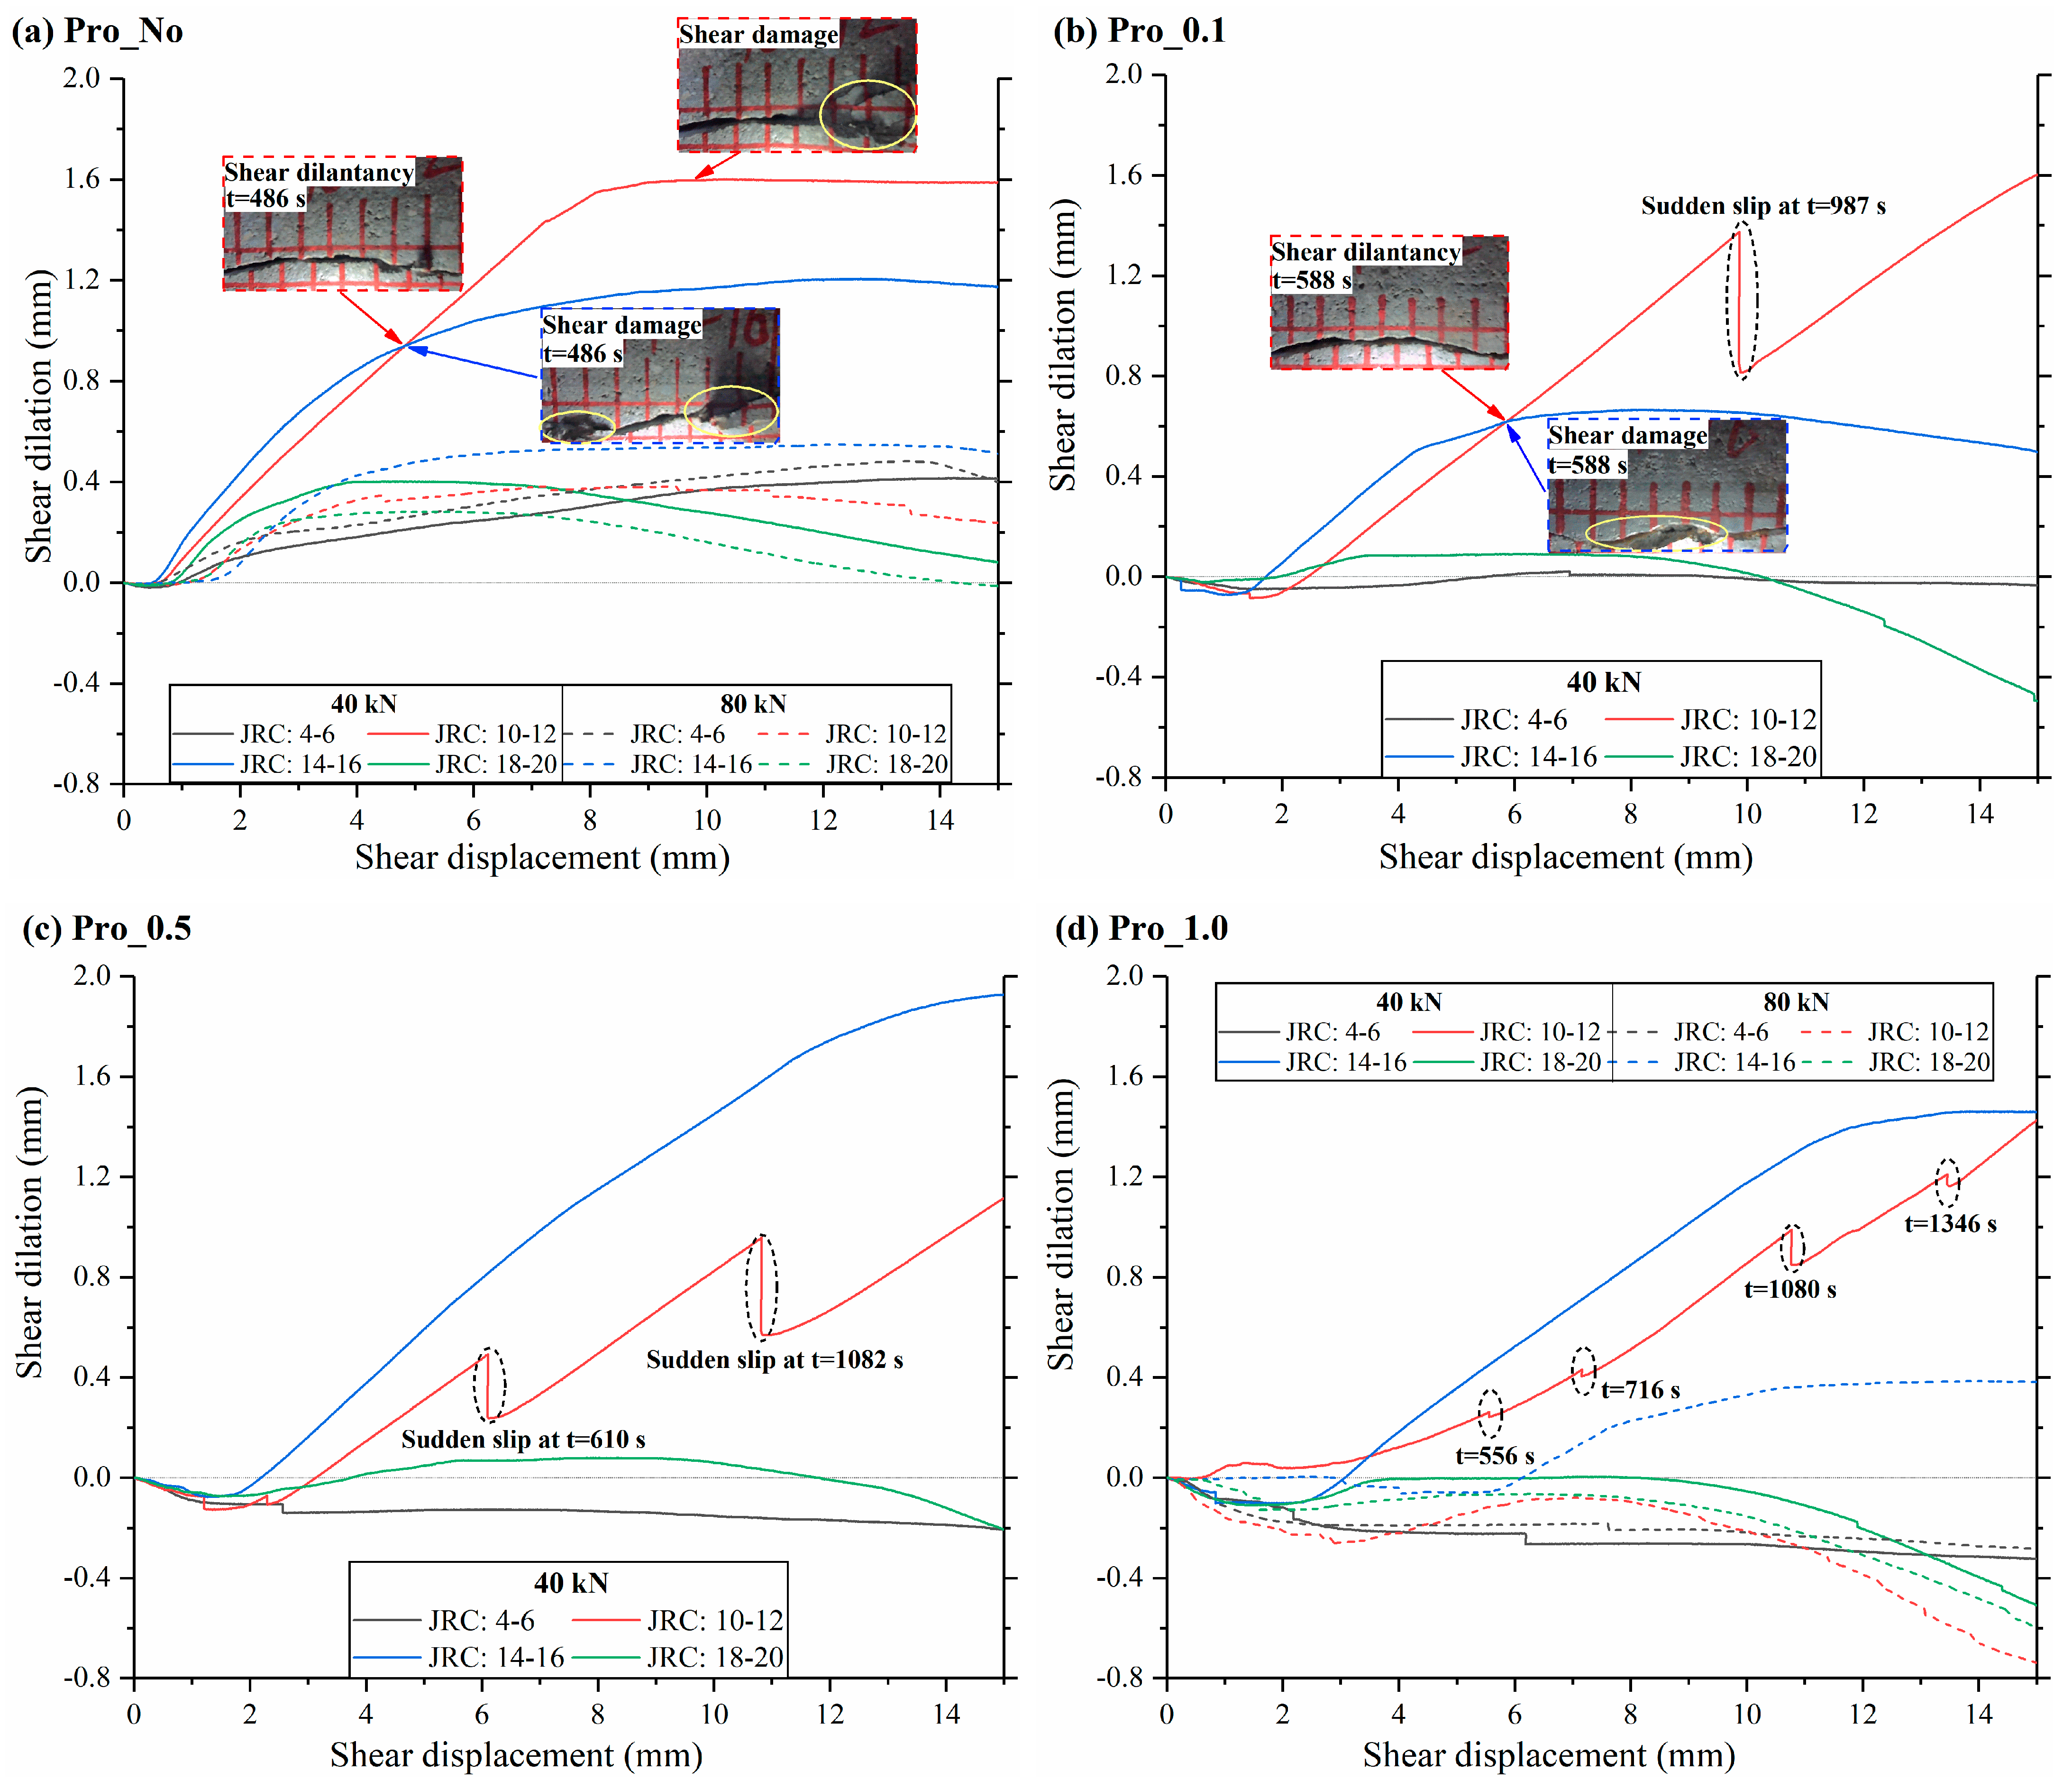
3.3. Shear Dilation Behavior

The dilatancy–shear displacement curves monitored by the displacement sensors associated with the loading indenter are shown in Figure 8. In a typical direct shear test, the vertical displacement usually experiences a transition from compaction to dilation with increased shear displacement, as shown in Figure 8a under non-propped conditions. The dilatant curve progressively increases to a stable value after the valley value of the shear contraction stage, which corresponds to the shear residual stage. The dilatant curve declines again in the residual stage when JRC = 18–20, which can be attributed to shear damage by asperities. Except for JRC = 4–6, where concentrated damage rarely occurs, increasing the normal load diminishes the shear dilatant effect.
Under the propped conditions, the dilatant effect is remarkable under two roughnesses of JRC = 10–12 and JRC = 14–16, as shown in Figure 8b–d. Under the roughness of 18–20, the dilatant effect is essentially non-existent, and the final dilatancy is negative at the end of the tests, which can be attributed to the compaction and crushing of the proppants and debris. According to the previous study, the variation in dilatant behavior is caused by asperities on the joint surface, and the slope-climbing effect is more pronounced for rougher joint specimens [23]. However, in our study, the discrepancy is discovered under the roughness of JRC = 18–20, ultimately with a negative dilatancy value.
According to the recorded observation of the shear process, the shear dilatant displacement rises continuously before shear damage occurs due to the shear climbing effects. When the curve rises slowly or falls, shear damage phenomena occur, corresponding to the asperity exceeding the yield strength, as shown in Figure 8a,b. It can also be observed that the asperity suffers shear damage later when JRC = 10–12 than when JRC = 14–16 under the propped conditions of Pro_No and Pro_0.1. This is attributed to the fact that the size of the asperity on the fracture surface with the JRC of 14–16 is smaller than that with the JRC of 10–12. Asperity with a smaller size is more preferentially damaged. In the early stage of a test, the movement of the fracture surface with a JRC of 10–12 is dominated by the shear climbing effect. As the grain size of proppant increases, the protective effect of proppant on asperity is enhanced. The asperity contact is delayed, and damage is weakened in terms of shear distance. As a result, the magnitude of shear dilatancy for the fracture with JRC of 14–16 exceeds that of the fracture with JRC of 10–12.
In addition, under the roughness of JRC = 10–12 (red lines), many abrupt dips in shear dilatancy were detected, which match the previously reported stress drop. This can be attributed to the shear climbing effect. After the peak of asperity has come into contact, the upper part of the fracture tends to drop towards the rift gully, resulting in a sudden drop in normal stress and dilatant displacement.

4. Discussion

4.1. Mechanical Behavior

The correlation of peak shear strength and JRC with asperity amplitudes under propped conditions is shown in Figure 9. The fractures with a JRC of 14–16 have the highest peak shear strength due to the highest asperity amplitude of 6.34 mm. There is a strong correlation between the peak shear strength and the asperity amplitude of the fracture surfaces. It suggests that the asperity with the highest amplitude determines the shear mechanical behavior of fractures, and it is here that contact is usually made first and shear damage occurs during shear. This is also supported by the damage distribution on the fracture surface (Figure 7).
Moreover, the peak shear strength of the non-propped fracture was remarkably higher than that of the propped fracture. The peak shear load is usually caused by the shear damage of the strong asperities at the fracture surface, while the proppants shield small-scale asperities on the surface, preventing them from interlocking. A similar shear mechanical behavior was also observed in Ref. [29]. In the propped tests, the fracture surfaces are heterogeneously covered by proppants. It is only when the shear displacement is sufficiently large that the asperities with high amplitude begin to contact, and then damage occurs. At this point, compared to the interlocked state of asperity in the non-propped test, the damage volume of the asperity became smaller, and the peak shear strength was also lower.
According to the damage identification (Figure 7), a generalized damage model of fracture surfaces with different roughnesses is proposed, as shown in Figure 10. In the state of complete interlocking of the upper and lower fracture surfaces, the overall damage degree of the fracture surface directly depends on the asperity amplitude. The asperity with the highest amplitude tends to contact foremost and have the largest volume of damage. Furthermore, not all asperities will undergo shear damage during the shear process. This is due to the shear dilatancy opening up the fracture aperture, detaching the asperity contact, and weakening the shear damage.

4.2. Shear Dilatant Behavior

The shear dilatant behavior significantly affects the hydro-mechanical behavior of fractured rock masses [32]. It has been proven in previous studies that shear dilatancy is one of the most sensitive factors for fracture apertures [27,33]. The effects of fracture roughness and asperity amplitude on the shear dilatant behavior of a series of 2D rough fractures are investigated in this study.
In the base of Barton’s standard roughness profiles, the theoretical maximum shear expansion angle (dm) is positively proportional to the roughness of the fracture surface [22]. Yet, according to the experimental observation of the shear dilatant displacement, the shear dilation angle increases to a peak value when the roughness increases to JRC = 14–16 and then decreases, as shown in Figure 11a. This is because the high-rough fractures of JRC= 18–20 have a smaller contact asperity than that of JRC = 14–16 and are thus more susceptible to being damaged in shear, resulting in frictional slip and weakening the shear climbing effect. In addition, the shear dilation angle is positively proportional to asperity amplitude, as shown in Figure 11b. Grasselli [34] found that only the parts of the joint surface that face the shear direction and are steeper than a threshold inclination provide shear resistance. It implies that the asperity amplitude of the actual contact determines the degree of shear dilatancy.
Under propped conditions, the shear dilation angle is much smaller than under non-propped conditions. This is because the shear behaviors under the two conditions are completely different. Under non-propped conditions, the fracture roughness initially induces a climbing effect along the asperity’s rising direction and continuously increases the dilatancy amplitude with the shear process. The shear damage occurs when the stress strength of the contact asperity is reached, and the shear climbing stage gradually transitions to the shear slip stage, which corresponds to the residual shear stage, as shown in Figure 12a.
Under the propped conditions, the proppants fill in the gullies, reducing the amplitude of the contact asperities, as shown in Figure 12b. In the pre-peak stage, the compaction and rearranging of proppants cause the shear contraction effect and reduce the shear climbing. Following that, asperities come into contact and are damaged. As a result, the area of contacted asperities is smaller than in the non-propped condition, resulting in a decrease in peak shear strength.
The deformation of the fracture is recorded during the whole shear process, as shown in Figure 13. It can be found that proppants can reduce the damage degree of the fracture surface and promote the occurrence of the shear dilatancy process, which is beneficial to opening up the fracture aperture. This is particularly meaningful for the enhancement of the permeability of fractured reservoirs, such as HDR reservoirs, shale gas reservoirs, or oil reservoirs [2]. Furthermore, in the non-propped conditions, the damage on the fracture surfaces with the JRC of 10–12 and 14–16 is more severe than in the other two roughness conditions due to the higher asperity amplitude, as highlighted with yellow circles in Figure 13b,c.

5. Conclusions

This paper investigates the mechanical behavior and shear dilatancy of propped 2D rough fractures. The fractured specimens are tested by DST. The progressive fracture roughness and proppant–asperity interaction are elucidated. The following conclusions can be drawn from this study:
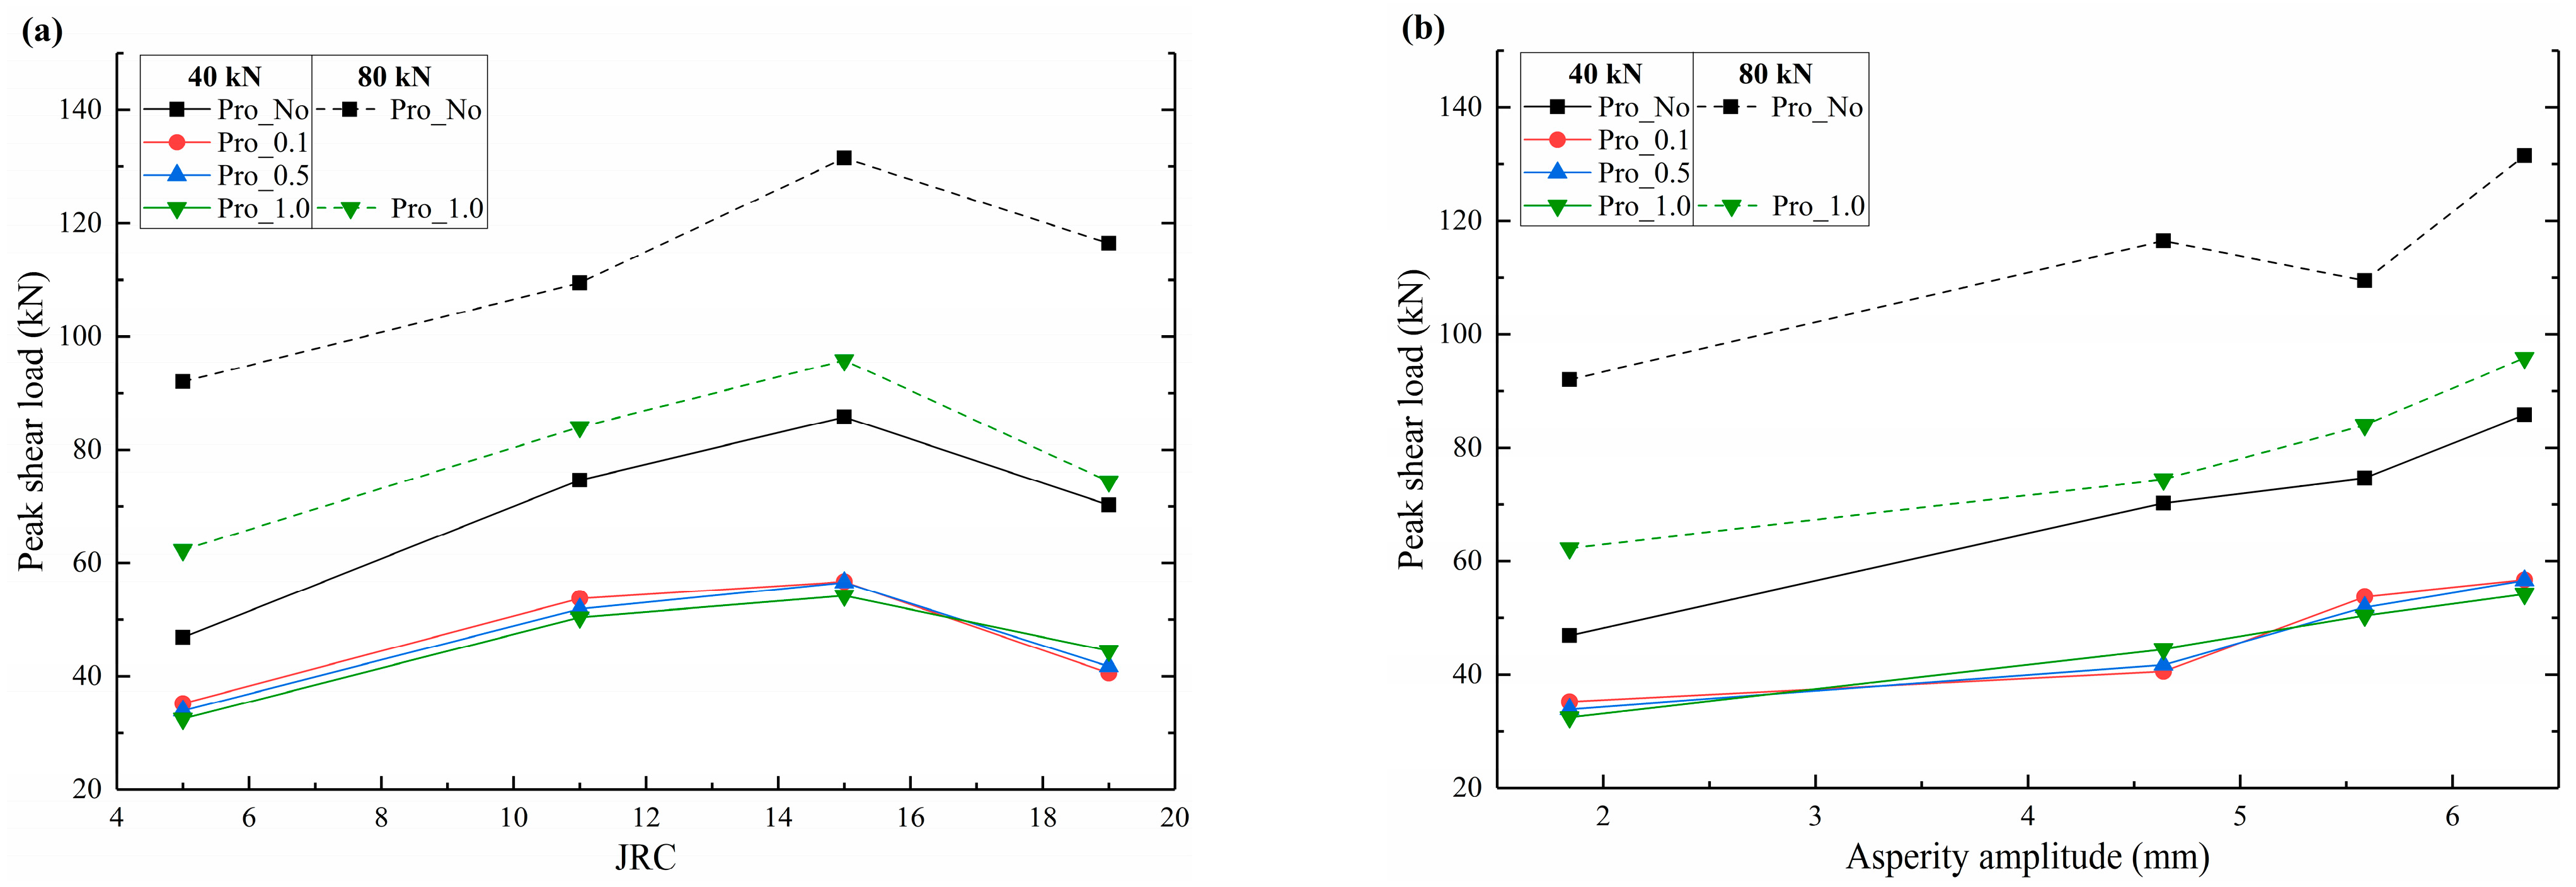
  • The asperity amplitude plays a decisive role in the shear strength, and the peak shear strength is positively proportional to the asperity amplitude under the same propped conditions. The fracture with a JRC of 14–16 has the highest peak shear strength due to the highest asperity amplitude of 6.34 mm among all the specimens. The peak shear strength was reduced significantly by the deployment of proppants.
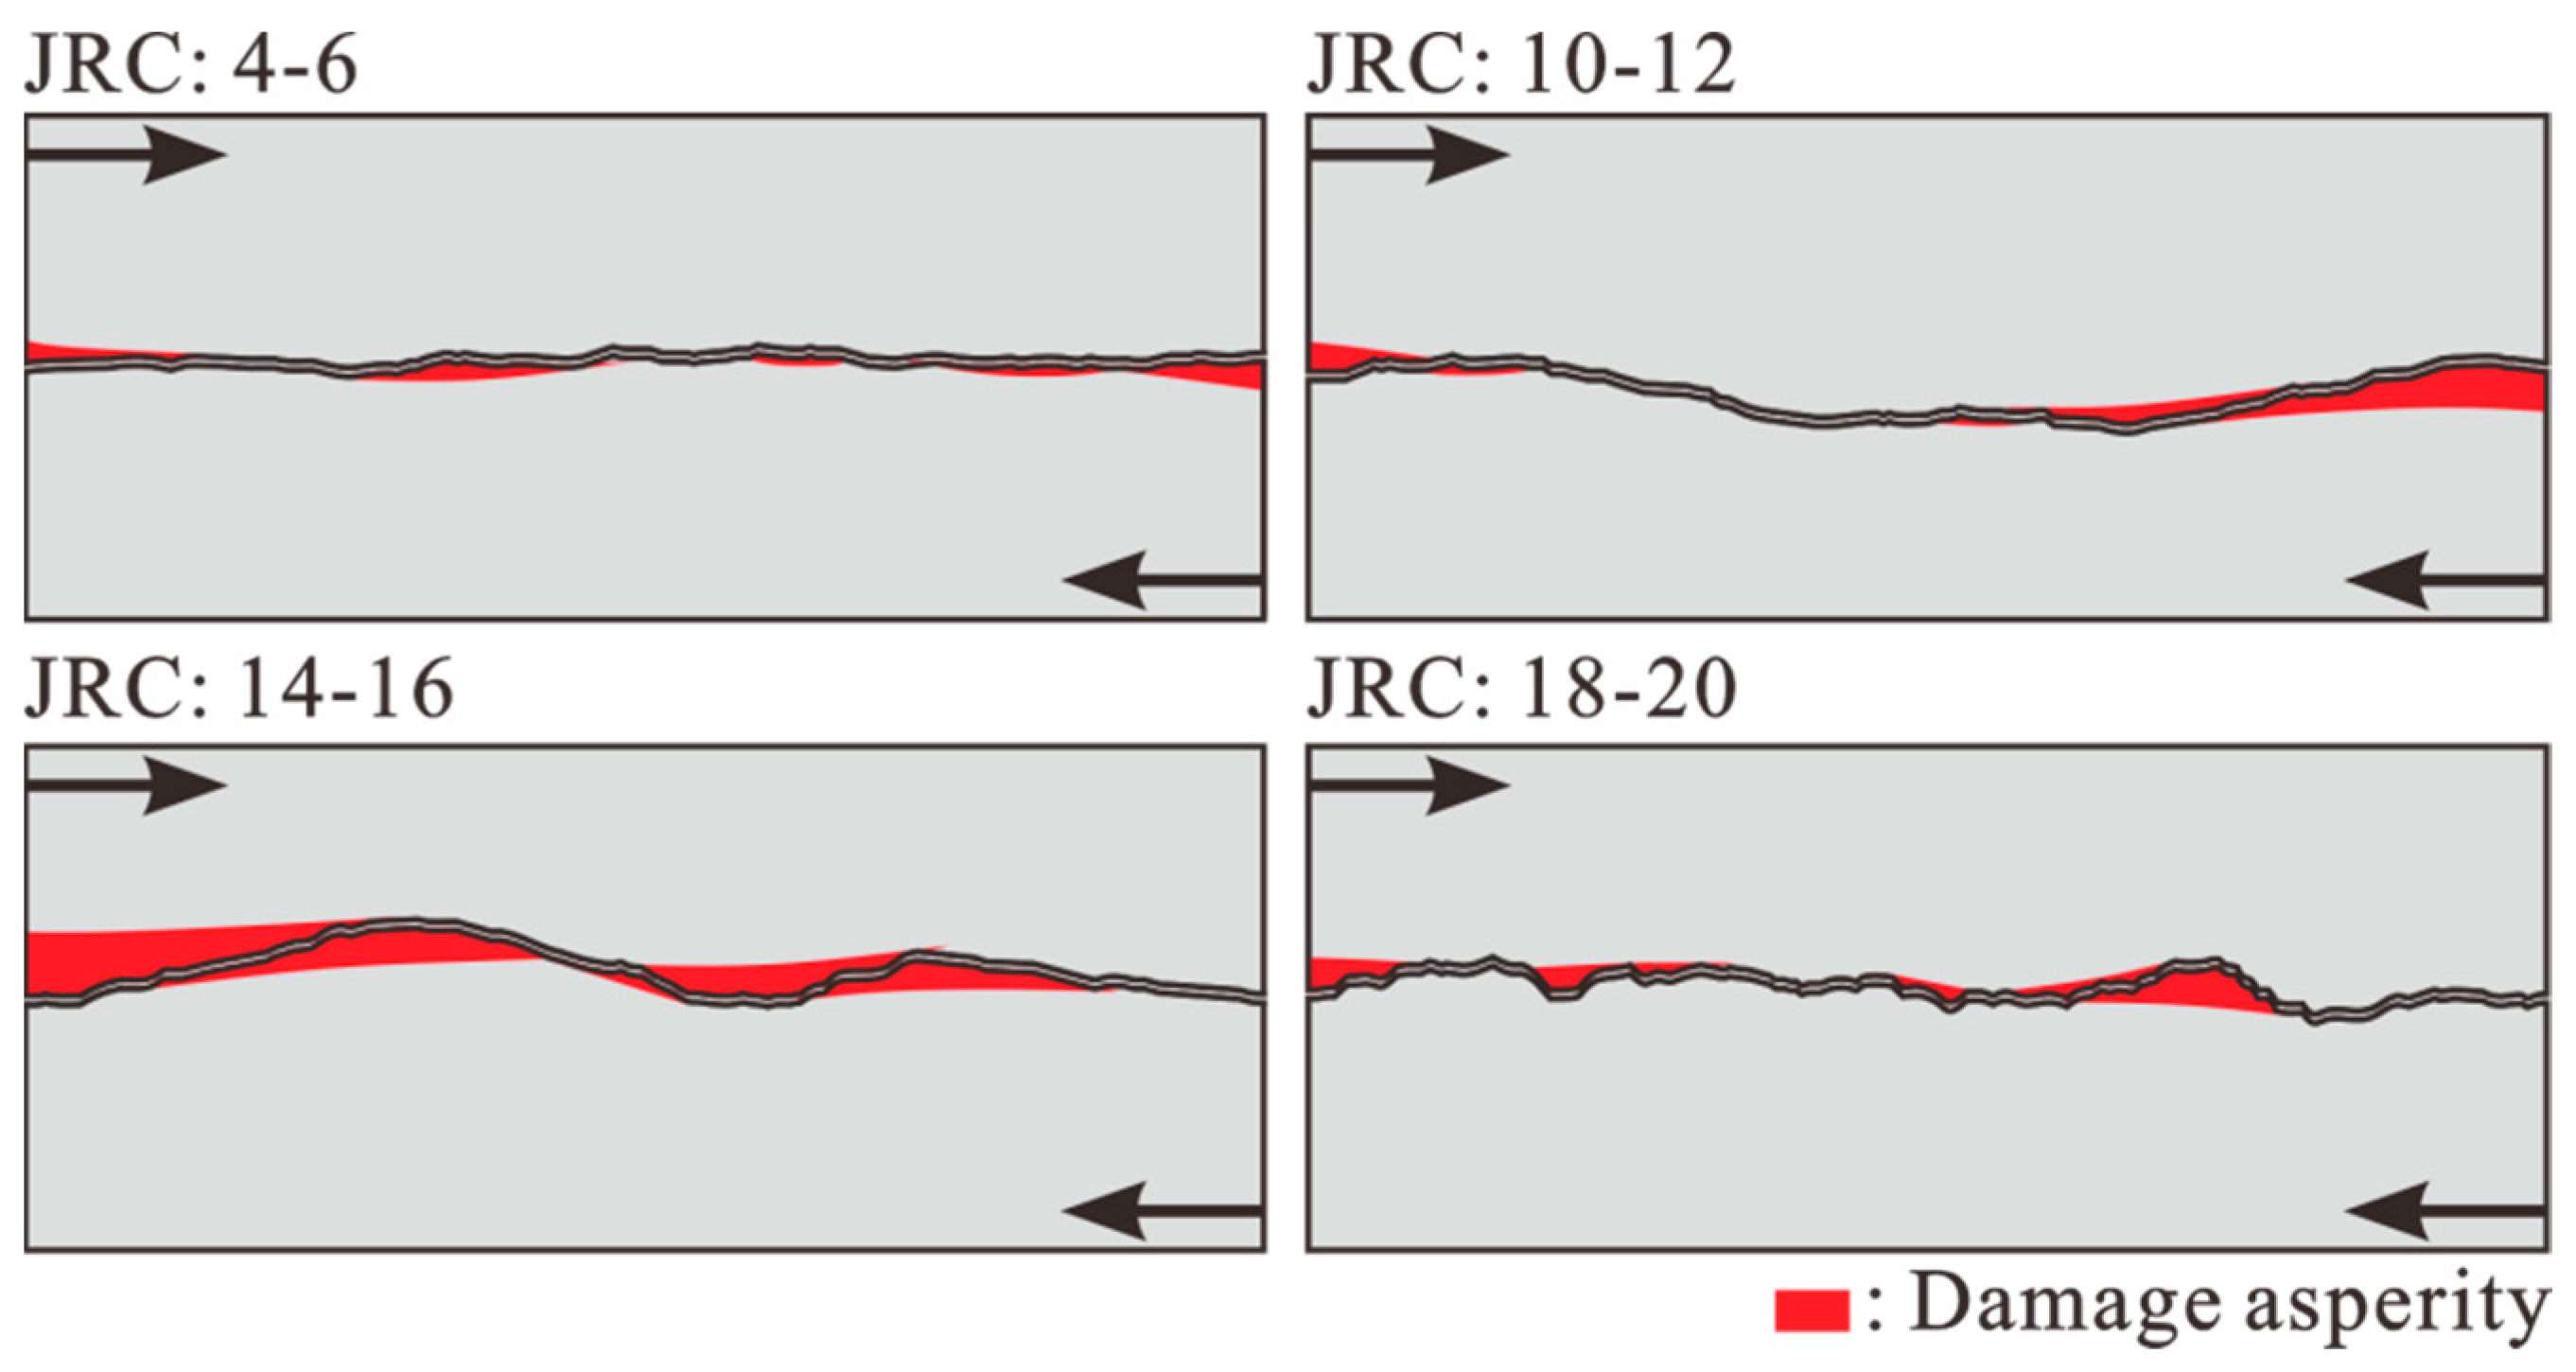
  • Shear damage occurs in localized zones where the upper–lower surface asperity contacts. The damage zone was band-shaped, which became smaller when proppants were deployed. This is due to the proppants being concentrated at the gully of fracture, flattening the surface roughness and detaching the upper–lower asperity contact, which in turn reduces the asperity damage and decreases the peak shear strength.
  • The highest shear dilatancy is determined at the fracture, with a roughness of JRC = 10–12 and JRC= 14–16. The shear dilatancy of a rough fracture was mainly attributed to the asperity amplitude due to the shear climbing effects. On the other hand, the shear damage of asperity induces frictional slip, which reduces the shear dialatancy. Moreover, the deployment of proppant weakens the shear dilatancy by flattening the fracture roughness, but it promotes the shear dilatancy by alleviating the shear damage. Thus, the proppant deployment has both negative and positive effects on stimulating the fracture shear dialatancy.

Author Contributions

Conceptualization, Q.Z. and J.L.; Methodology, Q.Z. and S.W.; Software, Q.Z.; Validation, J.L.; Investigation, S.W. and J.Z.; Data curation, S.W. and J.Z.; Writing—original draft, Q.Z.; Writing—review & editing, J.L. and D.C.; Project administration, Q.Z.; Funding acquisition, J.L. and D.C. All authors have read and agreed to the published version of the manuscript.

Funding

This work is supported by an innovation and development project that was co-funded by China Three Gorges Corporation and the Department of Science and Technology of Hubei province, P.R. China (No. 2023AFD197).

Data Availability Statement

The dataset is available on request from the authors.

Conflicts of Interest

The authors declare no conflict of interest.

References

  1. Ghassemi, A. A review of some rock mechanics issues in geothermal reservoir development. Geotech. Geol. Eng. 2012, 30, 647–664. [Google Scholar] [CrossRef]
  2. Ye, Z.; Ghassemi, A. Injection-induced shear slip and permeability enhancement in granite fractures. J. Geophys. Res. Solid Earth 2018, 123, 9009–9032. [Google Scholar] [CrossRef]
  3. Bijay, K.C.; Ghazanfari, E. Geothermal reservoir stimulation through hydro-shearing: An experimental study under conditions close to enhanced geothermal systems. Geothermics 2021, 96, 102200. [Google Scholar]
  4. Li, J.; Yuan, W.; Li, H.; Zou, C. Study on dynamic shear deformation behaviors and test methodology of sawtooth-shaped rock joints under impact load. Int. J. Rock Mech. Min. Sci. 2022, 158, 105210. [Google Scholar] [CrossRef]
  5. Ye, Z.; Ghassemi, A. Heterogeneous fracture slip and aseismic-seismic transition in a triaxial injection test. Geophys. Res. Lett. 2020, 47, e2020GL087739. [Google Scholar] [CrossRef]
  6. Vogler, D.; Amann, F.; Bayer, P.; Elsworth, D. Permeability evolution in natural fractures subject to cyclic loading and gouge formation. Rock Mech. Rock Eng. 2016, 49, 3463–3479. [Google Scholar] [CrossRef]
  7. Frash, L.P.; Carey, J.W.; Welch, N.J. EGS collab experiment 1 geomechanical and hydrological properties by triaxial direct shear. In Proceedings of the 44th Workshop on Geothermal Reservoir Engineering, Stanford, CA, USA, 11–13 February 2019. [Google Scholar]
  8. Nadimi, S.; Forbes, B.; Moore, J.; Ye, Z.; Ghassemi, A.; McLennan, J.D. Experimental evaluation of effect of hydro-shearing on fracture conductivity at the Utah FORGE site. In Proceedings of the 44th Workshop on Geothermal Reservoir Engineering, Stanford, CA, USA, 11–13 February 2019; pp. 11–13. [Google Scholar]
  9. Gong, Y.; Mehana, M.; El-Monier, I.; Viswanathan, H. Proppant placement in complex fracture geometries: A computational fluid dynamics study. J. Nat. Gas Sci. Eng. 2020, 79, 103295. [Google Scholar] [CrossRef]
  10. Aslannezhad, M.; Kalantariasl, A.; You, Z.; Iglauer, S.; Keshavarz, A. Micro-proppant placement in hydraulic and natural fracture stimulation in unconventional reservoirs: A review. Energy Rep. 2021, 7, 8997–9022. [Google Scholar] [CrossRef]
  11. Chen, T.; Fu, Y.; Feng, X.T.; Tan, Y.; Cui, G.; Elsworth, D.; Pan, Z. Gas permeability and fracture compressibility for proppant-supported shale fractures under high stress. J. Nat. Gas Sci. Eng. 2021, 95, 104157. [Google Scholar] [CrossRef]
  12. Tan, Y.; Pan, Z.; Liu, J.; Feng, X.T.; Connell, L.D. Laboratory study of proppant on shale fracture permeability and compressibility. Fuel 2018, 222, 83–97. [Google Scholar] [CrossRef]
  13. Wang, J.; Huang, Y.; Zhou, F.; Liang, X. The influence of proppant breakage, embedding, and particle migration on fracture conductivity. J. Pet. Sci. Eng. 2020, 193, 107385. [Google Scholar] [CrossRef]
  14. Zhong, Y.; Kuru, E.; Zhang, H.; Kuang, J.; She, J. Effect of fracturing fluid/shale rock interaction on the rock physical and mechanical properties, the proppant embedment depth and the fracture conductivity. Rock Mech. Rock Eng. 2019, 52, 1011–1022. [Google Scholar] [CrossRef]
  15. Isah, A.; Hiba, M.; Al-Azani, K.; Aljawad, M.S.; Mahmoud, M. A comprehensive review of proppant transport in fractured reservoirs: Experimental, numerical, and field aspects. J. Nat. Gas Sci. Eng. 2021, 88, 103832. [Google Scholar] [CrossRef]
  16. Barboza, B.R.; Chen, B.; Li, C. A review on proppant transport modelling. J. Pet. Sci. Eng. 2021, 204, 108753. [Google Scholar] [CrossRef]
  17. Kou, M.; Liu, X.; Tang, S.; Wang, Y. Experimental study of the prepeak cyclic shear mechanical behaviors of artificial rock joints with multiscale asperities. Soil Dyn. Earthq. Eng. 2019, 120, 58–74. [Google Scholar] [CrossRef]
  18. Han, G.; Zhou, Y.; Liu, R.; Tang, Q.; Wang, X.; Song, L. Influence of surface roughness on shear behaviors of rock joints under constant normal load and stiffness boundary conditions. Nat. Hazards 2022, 112, 367–385. [Google Scholar] [CrossRef]
  19. Barton, N. Review of a new shear-strength criterion for rock joints. Eng. Geol. 1973, 7, 287–332. [Google Scholar] [CrossRef]
  20. Barton, N.; Choubey, V. The shear strength of rock joints in theory and practice. Rock Mech. 1977, 10, 1–54. [Google Scholar] [CrossRef]
  21. Pakdaman, A.M.; Moosavi, M. Surface Roughness Assessment of Natural Rock Joints Based on an Unsupervised Pattern Recognition Technique Using 2D Profiles. Rud.-Geološko-Naft. Zb. 2023, 38, 185–198. [Google Scholar] [CrossRef]
  22. Barton, N.; Wang, C.; Yong, R. Advances in joint roughness coefficient (JRC) and its engineering applications. J. Rock Mech. Geotech. Eng. 2023, 15, 3352–3379. [Google Scholar] [CrossRef]
  23. Zhang, S.; Wang, G.; Jiang, Y.; Wang, C.; Xu, F. Shear behaviours and roughness degeneration based on a quantified rock joint surface description. Int. J. Min. Sci. Technol. 2023, 33, 1301–1316. [Google Scholar] [CrossRef]
  24. Tang, Y.; Ranjith, P.G. An experimental and analytical study of the effects of shear displacement, fluid type, joint roughness, shear strength, friction angle and dilation angle on proppant embedment development in tight gas sandstone reservoirs. Int. J. Rock Mech. Min. Sci. 2018, 107, 94–109. [Google Scholar] [CrossRef]
  25. Liu, Q.; Tian, Y.; Liu, D.; Jiang, Y. Updates to JRC-JCS model for estimating the peak shear strength of rock joints based on quantified surface description. Eng. Geol. 2017, 228, 282–300. [Google Scholar] [CrossRef]
  26. Shen, H.; Liu, Y.; Li, H.; Wu, D.; Xia, X.; Liu, B.; Yu, C. Rate-Dependent Characteristics of Damage and Roughness Degradation of Three-Dimensional Artificial Joint Surfaces. Rock Mech. Rock Eng. 2022, 55, 2221–2237. [Google Scholar] [CrossRef]
  27. Barton, N.; Bandis, S.; Bakhtar, K. Strength, deformation and conductivity coupling of rock joints. Int. J. Rock Mech. Min. Sci. Geomech. Abstr. 1985, 22, 121–140. [Google Scholar] [CrossRef]
  28. Hou, J.; Zhao, H.; Peng, W.; Zhao, M. A limit solution for predicting side resistance on rock-socketed piles. J. Eng. Mech. 2022, 148, 04021131. [Google Scholar] [CrossRef]
  29. Luo, J.; Zhang, Q.; Elsworth, D.; Zhao, Q. Competing Effects of Proppant and Surface Roughness on the Frictional Stability of Propped Fractures. Rock Mech. Rock Eng. 2023, 56, 2923–2934. [Google Scholar] [CrossRef]
  30. Yang, K.; Hu, Q.; Zhao, H.; Zhao, M.; Zhou, S. Numerical study on the shear behavior of concrete-rock joints with similar triangular asperities. Comput. Geotech. 2023, 159, 105468. [Google Scholar] [CrossRef]
  31. Ban, L.; Qi, C.; Chen, H.; Yan, F.; Ji, C. A new criterion for peak shear strength of rock joints with a 3D roughness parameter. Rock Mech. Rock Eng. 2020, 53, 1755–1775. [Google Scholar] [CrossRef]
  32. Zhu, X.; Gao, M.; Si, G.; Zhang, C.; Moon, J.S.; Oh, J. An Improved Model for Evaluating the Hydraulic Behaviour of a Single Rock Joint Considering Contact Area Evolution During Shearing. Rock Mech. Rock Eng. 2023, 56, 8723–8743. [Google Scholar] [CrossRef]
  33. Olsson, R.; Barton, N. An improved model for hydromechanical coupling during shearing of rock joints. Int. J. Rock Mech. Min. Sci. 2001, 38, 317–329. [Google Scholar] [CrossRef]
  34. Grasselli, G. Manuel Rocha medal recipient shear strength of rock joints based on quantified surface description. Rock Mech. Rock Eng. 2006, 39, 295–314. [Google Scholar] [CrossRef]
Figure 1. The preparation of the fractured specimens with 2D roughness: (a) the selected four Barton standard roughness profiles for DST [20]; (b) the fresh rough fractures with matching surfaces; (c) the 3D model created by Rhinoceros and Geomagic Studio software; (d) numerical control caving.
Energies 17 00956 g001
Figure 2. (a) A snapshot of the experimental set-up; (b) monitoring of the fracture deformation by fisheye video.
Energies 17 00956 g002
Figure 3. The definition of dilation angle and asperity amplitude (a,b) and the maximum dilation angle (c) of rough fractures with 4 standard JRC profiles (modified from [22]).
Energies 17 00956 g003
Figure 4. Shear load during the shearing process under different roughnesses and a vertical load of 40 kN: (a) Pro_No_40; (b) Pro_0.1_40; (c) Pro_0.5_40; (d) Pro_1.0_40.
Energies 17 00956 g004
Figure 5. The development of shear load during the shearing process under different surface roughnesses under a vertical load of 80 kN: (a) Pro_No_80; (b) Pro_1.0_80.
Energies 17 00956 g005
Figure 6. The fracture surfaces after shearing under different roughnesses. The localized contact asperities with higher amplitude and slope are more likely to be damaged, and the proppant mitigates the damage degree of the asperity.
Energies 17 00956 g006
Figure 7. Damage distribution on the fracture surface with different surface roughness and proppant grain sizes. The amplitude shown by the color bar indicates a reduction in surface elevation. The red arrows represent the shearing direction.
Energies 17 00956 g007
Figure 8. Shear dilation during the shearing process under different roughnesses: (a) Pro_No; (b) Pro_0.1; (c) Pro_0.5; (d) Pro_1.0.
Energies 17 00956 g008
Figure 9. Summary of peak shear load under different roughness and propped conditions: (a) peak shear load versus JRC; (b) peak shear load versus asperity amplitude.
Energies 17 00956 g009
Figure 10. The schematic diagram describes the damaged asperities of fractures under different roughnesses, according to Figure 7. The larger the area of damaged asperity, the higher the shear stress. The black arrow represents the shearing direction, and the black line represents the profiles of rough fractures.
Energies 17 00956 g010
Figure 11. Shear dilatant behavior for different roughness and propped conditions: (a) dilation angle versus JRC; (b) dilation angle versus asperity amplitude. The dashed line is the reference line representing the 0 scale.
Energies 17 00956 g011
Figure 12. A schematic of mechanisms describing the shear behavior and dilatant characteristics controlled by asperity amplitude and propped conditions (a) non-propped condition; (b) propped condition. (Not to scale.).
Energies 17 00956 g012
Figure 13. The monitored fracture apertures with different roughness under non-propped conditions and propped conditions extracted from the high-speed camera. A constant speed of 0.01 mm/s was applied in the lateral shear. (a) JRC = 4–6; (b) JRC = 10–12; (c) JRC = 14–16; (d) JRC = 18–20.
Energies 17 00956 g013
Table 1. The scheme of the direct shear tests for the prepared artificially made 2D fractures.
ProppantPro_NoPro_0.1Pro_0.5Pro_1.0
Vertical Load40 kN80 kN40 kN40 kN40 kN80 kN
JRC: 4–6No.1No.17No.5No.9No.13No.21
JRC: 10–12No.2No.18No.6No.10No.14No.22
JRC: 14–16No.3No.19No.7No.11No.15No.23
JRC: 18–20No.4No.20No.8No.12No.16No.24
Disclaimer/Publisher’s Note: The statements, opinions and data contained in all publications are solely those of the individual author(s) and contributor(s) and not of MDPI and/or the editor(s). MDPI and/or the editor(s) disclaim responsibility for any injury to people or property resulting from any ideas, methods, instructions or products referred to in the content.

