1. Introduction
The pro-environmental challenges faced by today’s society have led to increased investments in renewable energy sources. The best example of this is the constantly growing number of household photovoltaic installations. Their intensive development, especially in Central and Eastern European countries, is dictated by both pro-ecological considerations and many subsidies from government institutions and the European Union budget. Such installations (with a capacity of several kWp) are created in a highly chaotic manner—their construction is not preceded by any development plans (unlike commercial PV farms [
1]) or a specific demand for electricity in individual regions but relates to the wealth of residents and the availability of land or roof space for such installations. An additional factor that should be accounted for is the fact that such installations are often built in rural, low-urbanized areas where the existing infrastructure—created decades ago—was not designed in the context of the two-way transmission of electricity or its storage [
2]. The unfortunate consequence of the confluence of all these factors is a network voltage increase. On the other hand, apart from the apparent threats to devices that operate for a long time in non-optimal power conditions, this leads to legally sanctioned PV downtime periods. As a result, individual investors who have often decided to sacrifice significant savings or even take out loans to purchase and install a home photovoltaic installation must face its continuous shutdowns, which leads to a decrease in the profitability of the investment.
1.1. Solutions Proposed in the Literature
The solution to this problem, as proposed in the literature, for small prosumers and end users is energy storage and self-consumption [
3,
4]. Even in the case of large photovoltaic farms connected by data buses, it can partially turn them off (using the APC—active power curtailment) [
5,
6] or focus on a more effective production of reactive power [
7,
8]. Still, this is not possible in the case of small prosumers not connected by data buses [
9] and who are often living in large areas. For them, often the only protection against high voltage in the network is the operation of the inverter, which reduces the voltage by stopping production. Intermediate solutions such as the low voltage regulator [
9] or active distribution grids [
10] appear on the market, but the level of their implementation by energy operators is unnoticeable. It should also be mentioned that in some countries or regions, overproduction results in network outages, which is also reflected in the literature [
11]. A negative consequence of dealing with this problem is the increasingly frequent cases of unlawful interference with the voltage in the network, consisting of increasing the voltage on the side of the energy supplier and maintaining a safe voltage in neighborhood houses connected to the network. Unfortunately, in addition to the already mentioned legal restrictions that prohibit such practices, there is also a risk of damaging the equipment and even causing fires that are dangerous to property, health, and life that follow uncontrolled voltage increases in the network above the prevailing standards.
In the context of law, therefore, the two solutions mentioned above remain. The case of energy storage should be considered with particular emphasis on two aspects—the cost effectiveness and efficiency of this solution [
12,
13]. In the case of installations carried out by home users, storage can be performed with dedicated batteries and the electricity network. It is also possible to convert this energy directly into thermal energy [
14,
15], kinetic energy, etc. However, because the effective recovery of such converted energy at home conditions is sporadic and is not currently implemented on such a small scale commercially, these methods are not considered in this work as a form of electricity storage (although they may be a form of self-consumption discussed later). It is worth noting that increasing PV self-consumption using an electric water heater is a topic discussed in recent scientific publications [
16], but the approach refers to the daily approach of energy used in known hourly slots and not in the context of turning consumption on and off, on demand, in high voltage conditions in the network. Energy storage in batteries relates to their efficiency. In laboratory conditions, it is becoming higher, and, in the literature, cells with more than 95% efficiency can already be found [
17,
18,
19]. On the other hand, in the case of commercially available solutions that are affordable, efficiency levels are increasing more slowly and currently (for the entire system, i.e., inverter and battery) oscillates around the 80–90% range (depending on the different System Performance Index measurements) [
20,
21,
22]. An important aspect is also the price and effectiveness of such a solution. The initial cost often corresponds to the cost of building a whole home PV installation, which is already a considerable expense for most investors. Solutions that also use electric cars as one of the system components replacing or cooperating with batteries can be found [
23], but the number of compatible vehicles on the market is still small, and battery life also remains under discussion. Therefore, this solution should be treated rather as a side effect in the context of lowering the voltage in the network (which leads to a reduction in the number of outages), and its main task is to store energy.
1.2. Energy Accumulation in the Network
In opposition to energy storage in batteries, it is possible to store energy as part of the solutions provided by electricity suppliers. In the case of the legal situation in Poland, which is analyzed in this paper, there are currently two models: net metering and net billing. The first enables the transmission of energy to the grid that is not subject to self-consumption. Then, it is consumption (reduced by 20 or 30%, depending on the installed PV installation size) when the household’s demand for electricity is greater. The second solution (operating after legal changes from 1 April 2022) abolishes the cost-free energy exchange. It replaces it with sale (in case of overproduction) and purchase (when demand grows) at market prices. In both cases, the costs associated with energy transmission from and to the grid should also be considered. In the first case, it can be assumed that a standard household with an installation of up to 10 kWp could use energy storage with an 80% free-of-charge efficiency. After the legal changes, although it is subject to constant changes that are conditioned by the market situation, this value is now even more favorable for prosumers (the price of electricity in December–February, i.e., those in which energy consumption is the highest, was about 80% of the energy price in June–August, i.e., those with the highest production). For the purposes of this work, however, it is assumed that due to the number of home installations established before the legal changes (up until the end of March, it was 966,350), this case would be assumed as the leading one. Thus, from the consumer’s point of view, it is possible to choose battery storage, the initial cost of which corresponds to the cost of the installation that has already incurred.
Moreover, it is associated with a specific lifetime of the implemented solution, which has a finite capacity and maximum power. On the other hand, there is a cost-free solution from the point of view of the initial contribution that does not require further installation work, has unlimited (from the consumer’s point of view) capacity and power offered, does not require service work, and offers an efficiency only slightly lower than the first solution. Unfortunately, this solution is burdened with the risk of shutdowns of the photovoltaic installation, which is unfortunately unpredictable in the long run—even if the analysis of the voltage in the network at the time of installation does not indicate the occurrence of this problem, operation in subsequent years and changes in the network may lead to changes (e.g., changes in transformer settings, neighboring installations, etc.) which will result in an increase in voltage. Despite this, the vast majority of consumers decide to choose the second solution. This, in turn, only deepens the problem of voltage increases in the grid, which are challenging to avoid and lead to installation shutdowns and a loss of expected income.
1.3. Smart Grid and Self-Consumption
The second proposed solution is the Smart Grid (SG) idea and the related increase in self-consumption [
2]. The general assumption of this solution is the possibility of activating equipment and devices with the highest demand for electricity at times when it is the cheapest, while limiting its consumption when its price is the highest. Unfortunately, the current legal regulations for end users in Poland do not allow for dynamic changes in electricity prices but can only change daily (cheaper and more expensive hours) or weekly (lower rates on holidays). Moreover, sometimes, it is proposed to disconnect from the grid and switch to purely renewable energy [
24], which is, among other things, to relieve the network. However, in a net metering situation, this only means losses in the absence of energy storage for consumers. Thus, using a standardized SG is practically impossible, and the end user is responsible for such energy management (e.g., programming the start of devices) that will enable the highest possible consumption during high energy production periods.
Unfortunately, this approach is not a solution that automatically enables energy consumption during periods of intensive production, and it is the user’s responsibility to constantly monitor production and adjust the consumption generated by home appliances. Thus, on consumer’s off-work days, it would be theoretically possible. However, for most of the day, when the production of energy from the photovoltaic installation is the highest, a significant proportion of people will be at work—hence, they cannot constantly monitor the dynamically changing situation. Moreover, this solution is ineffective even if this is not an obstacle. It forces the typically non-technical user to track the many parameters of the installation’s operation (e.g., current production, house consumption, and network voltage) and requires constant attention—in a word, it is difficult to implement and impractical. In addition, there is also a very narrow range of devices that allow an immediate turn-on load and then stop. Most often, such devices are the simplest resistance heaters with a predetermined power, switched on and off (and, thus, consume energy and temporarily reduce the voltage in the electrical system) immediately after the power supply is applied. Depending on the form of implementation, they are used for the additional heating of domestic hot water (DHW) [
16] and, for example, swimming pools in the summer.
In the context of these conditions, the proposal described in this publication is positioned, operating at the intersection of smart solutions (monitoring the voltage and production of a photovoltaic installation) and grid (energy storage in the cheapest possible way, in the network), allowing for the optimization of both the number of shutdowns and reducing the costs of such a solution.
To achieve it, the author conducted a series of experiments to answer the question of the legitimacy of using low-cost methods (an order of magnitude lower than in the case of batteries used in the same way [
25]) to increase the self-consumption of electricity in a household. The proposed solution is not a complete home energy-management system [
26], although it may become its foundation due to the components used. This analysis was undertaken for over a year; its results are discussed in the paper. This paper is organized as follows: chapter 2 presents legal conditions, scenarios, and technical and programming aspects of the proposed solution. Chapter 3 explains how the shutdowns were calculated and the energy losses the shutdown caused. Chapter 4 discusses the total number of shutdowns and shows their financial dimension. Finally, Chapter 5 provides a summary and conclusions for further research.
2. Legal Conditions, Scenarios, Materials and Methods
Current legal standards in Poland regulate the requirement for a generator from the European Commission Regulation (EU) 2016/631-NC by the standard EN 50549-1:2019 (and its PL variant PN-EN 50549-1:2019). There are two cases in which a photovoltaic installation must be turned off (stop increasing the voltage to send it to the grid) that are the most important from the point of view of the documents:
When the voltage in the installation is 264 V: there must be an immediate cessation of the production and transmission of electricity to the grid.
When the voltage in the installation reaches at least 253 V: the inverter monitors the average voltage in the 10 min time slot. If this increased voltage condition persists for 10 min, production must be stopped immediately, and electricity must not be sent to the grid.
In both cases, the switch off lasts at least 2 min (or even longer until the voltage drops) for installations controlled by a Fronius inverter. The time to full efficiency of work is even longer; however, it depends on the current environmental conditions (after restarting production, the amount of energy fed into the grid does not increase dramatically but increases slowly). To analyze the effectiveness of the optimization methods based on the controlled switching of ON/OFF energy consumption, a proposed model that requires an external controller was implemented. To be able to turn the energy receiver on and off at will, it was decided to use remotely controlled sockets.
Many types and models of smart sockets are available on the market today and are becoming increasingly popular. They allow for remote management, turning devices on and off, and sometimes measuring the consumed electricity. Devices of this type—often working under the control of ESP8266 microprocessors—may be subjected to software modifications (such as Tasmota, ESPHome, or Supla) that enable the construction of simple scripts that turn the device on and off depending on the supply voltage in the network or even enable communication with a self-management server. Depending on the complexity of this procedure, it also depends on how long the given device will be switched on and the operational sensitivity of the given device to the supply voltage in the network.
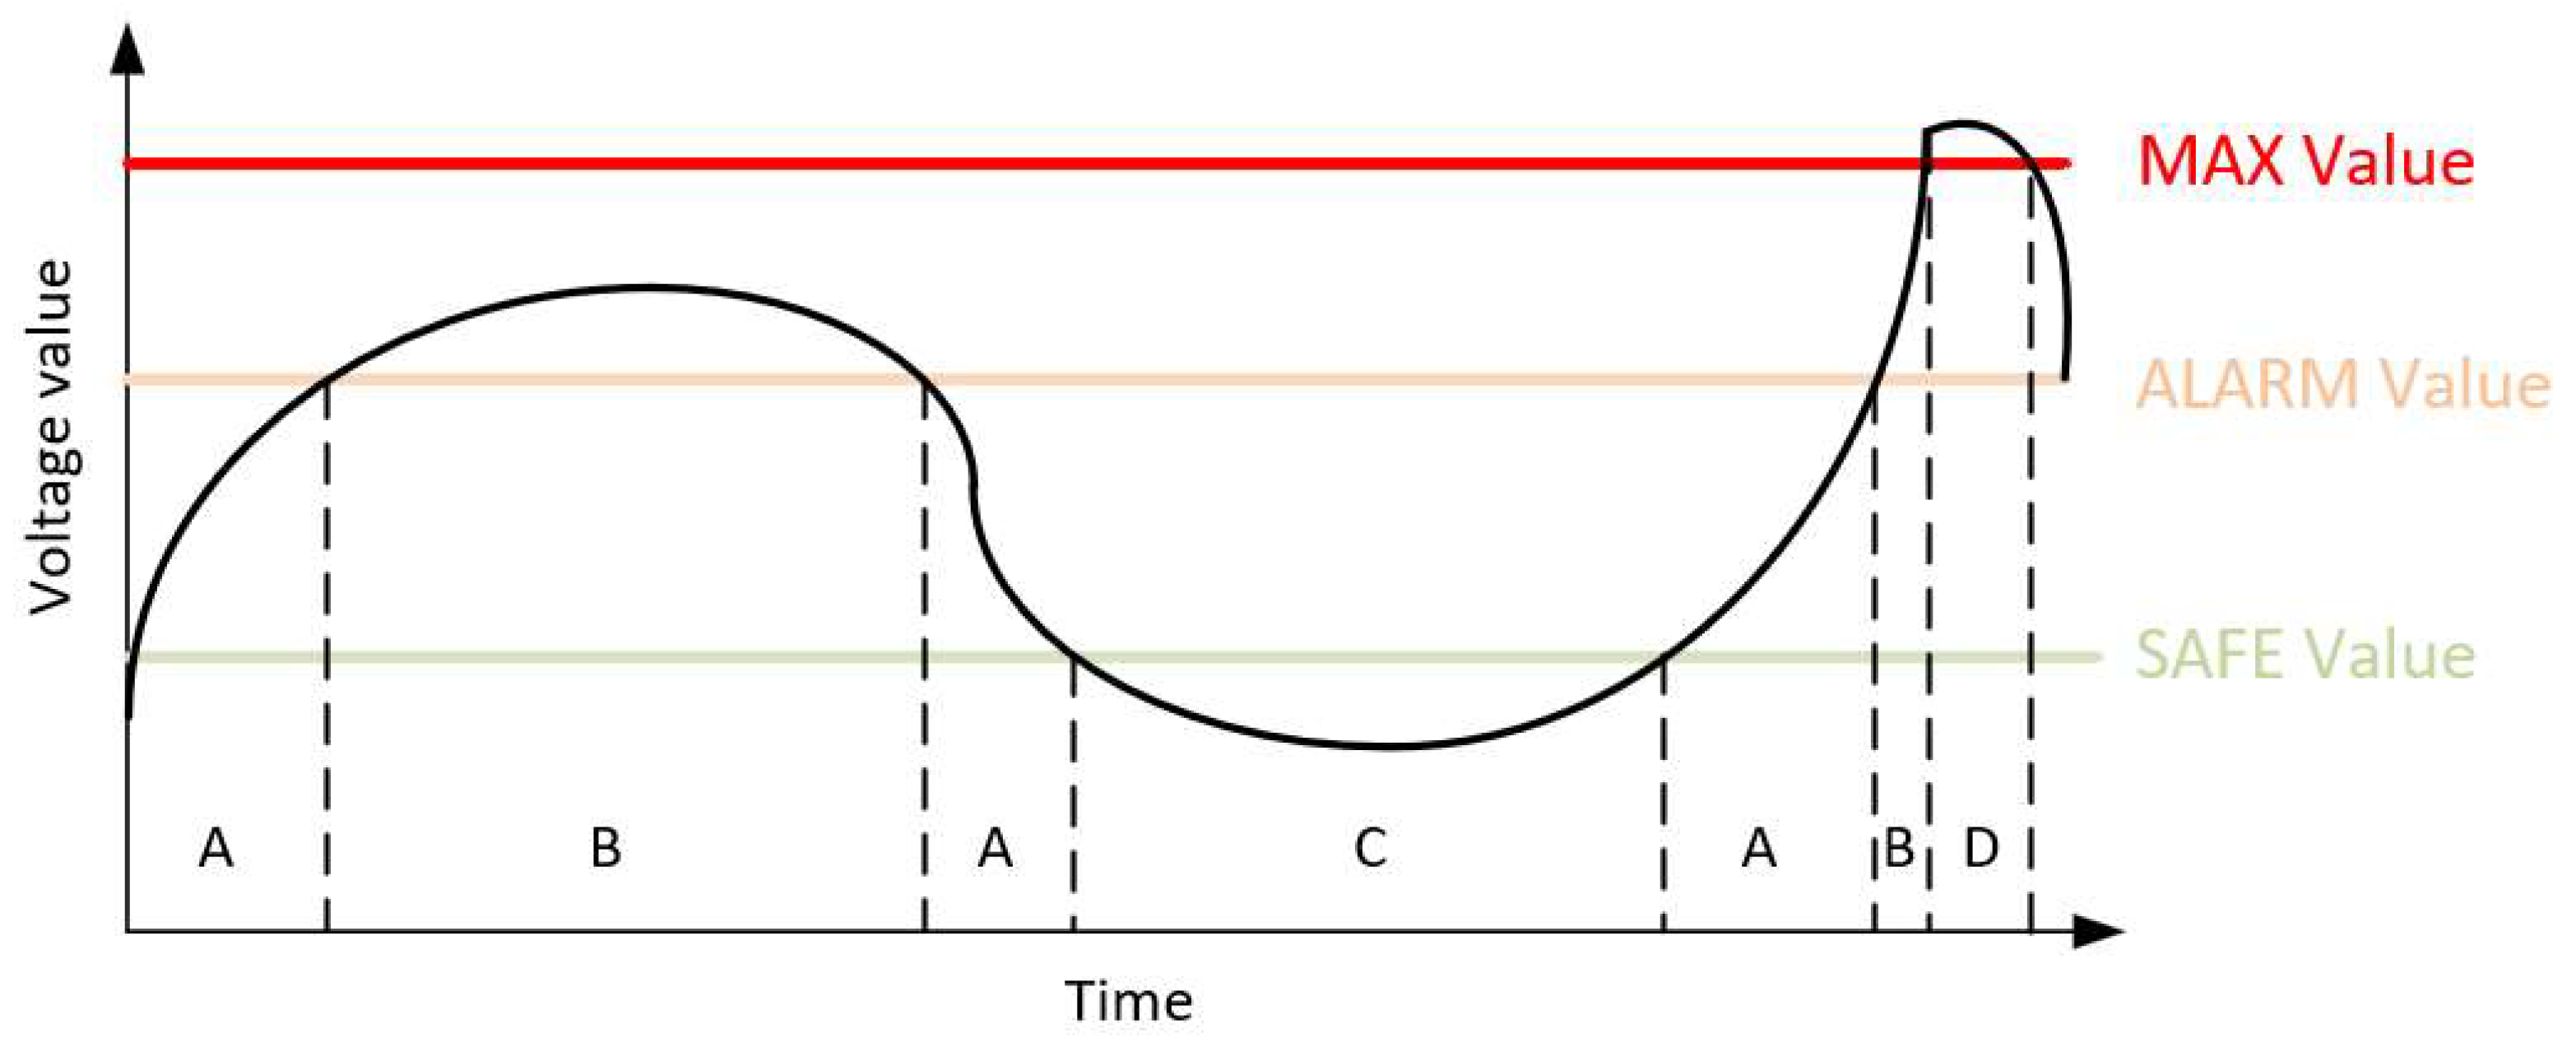
In the proposed solution each socket will be connected to an external current receiver of 500 W power in each of the three phases. The operation of the system can be presented graphically in the form of a chart (
Figure 1). Moreover, the proposed test variant is presented in
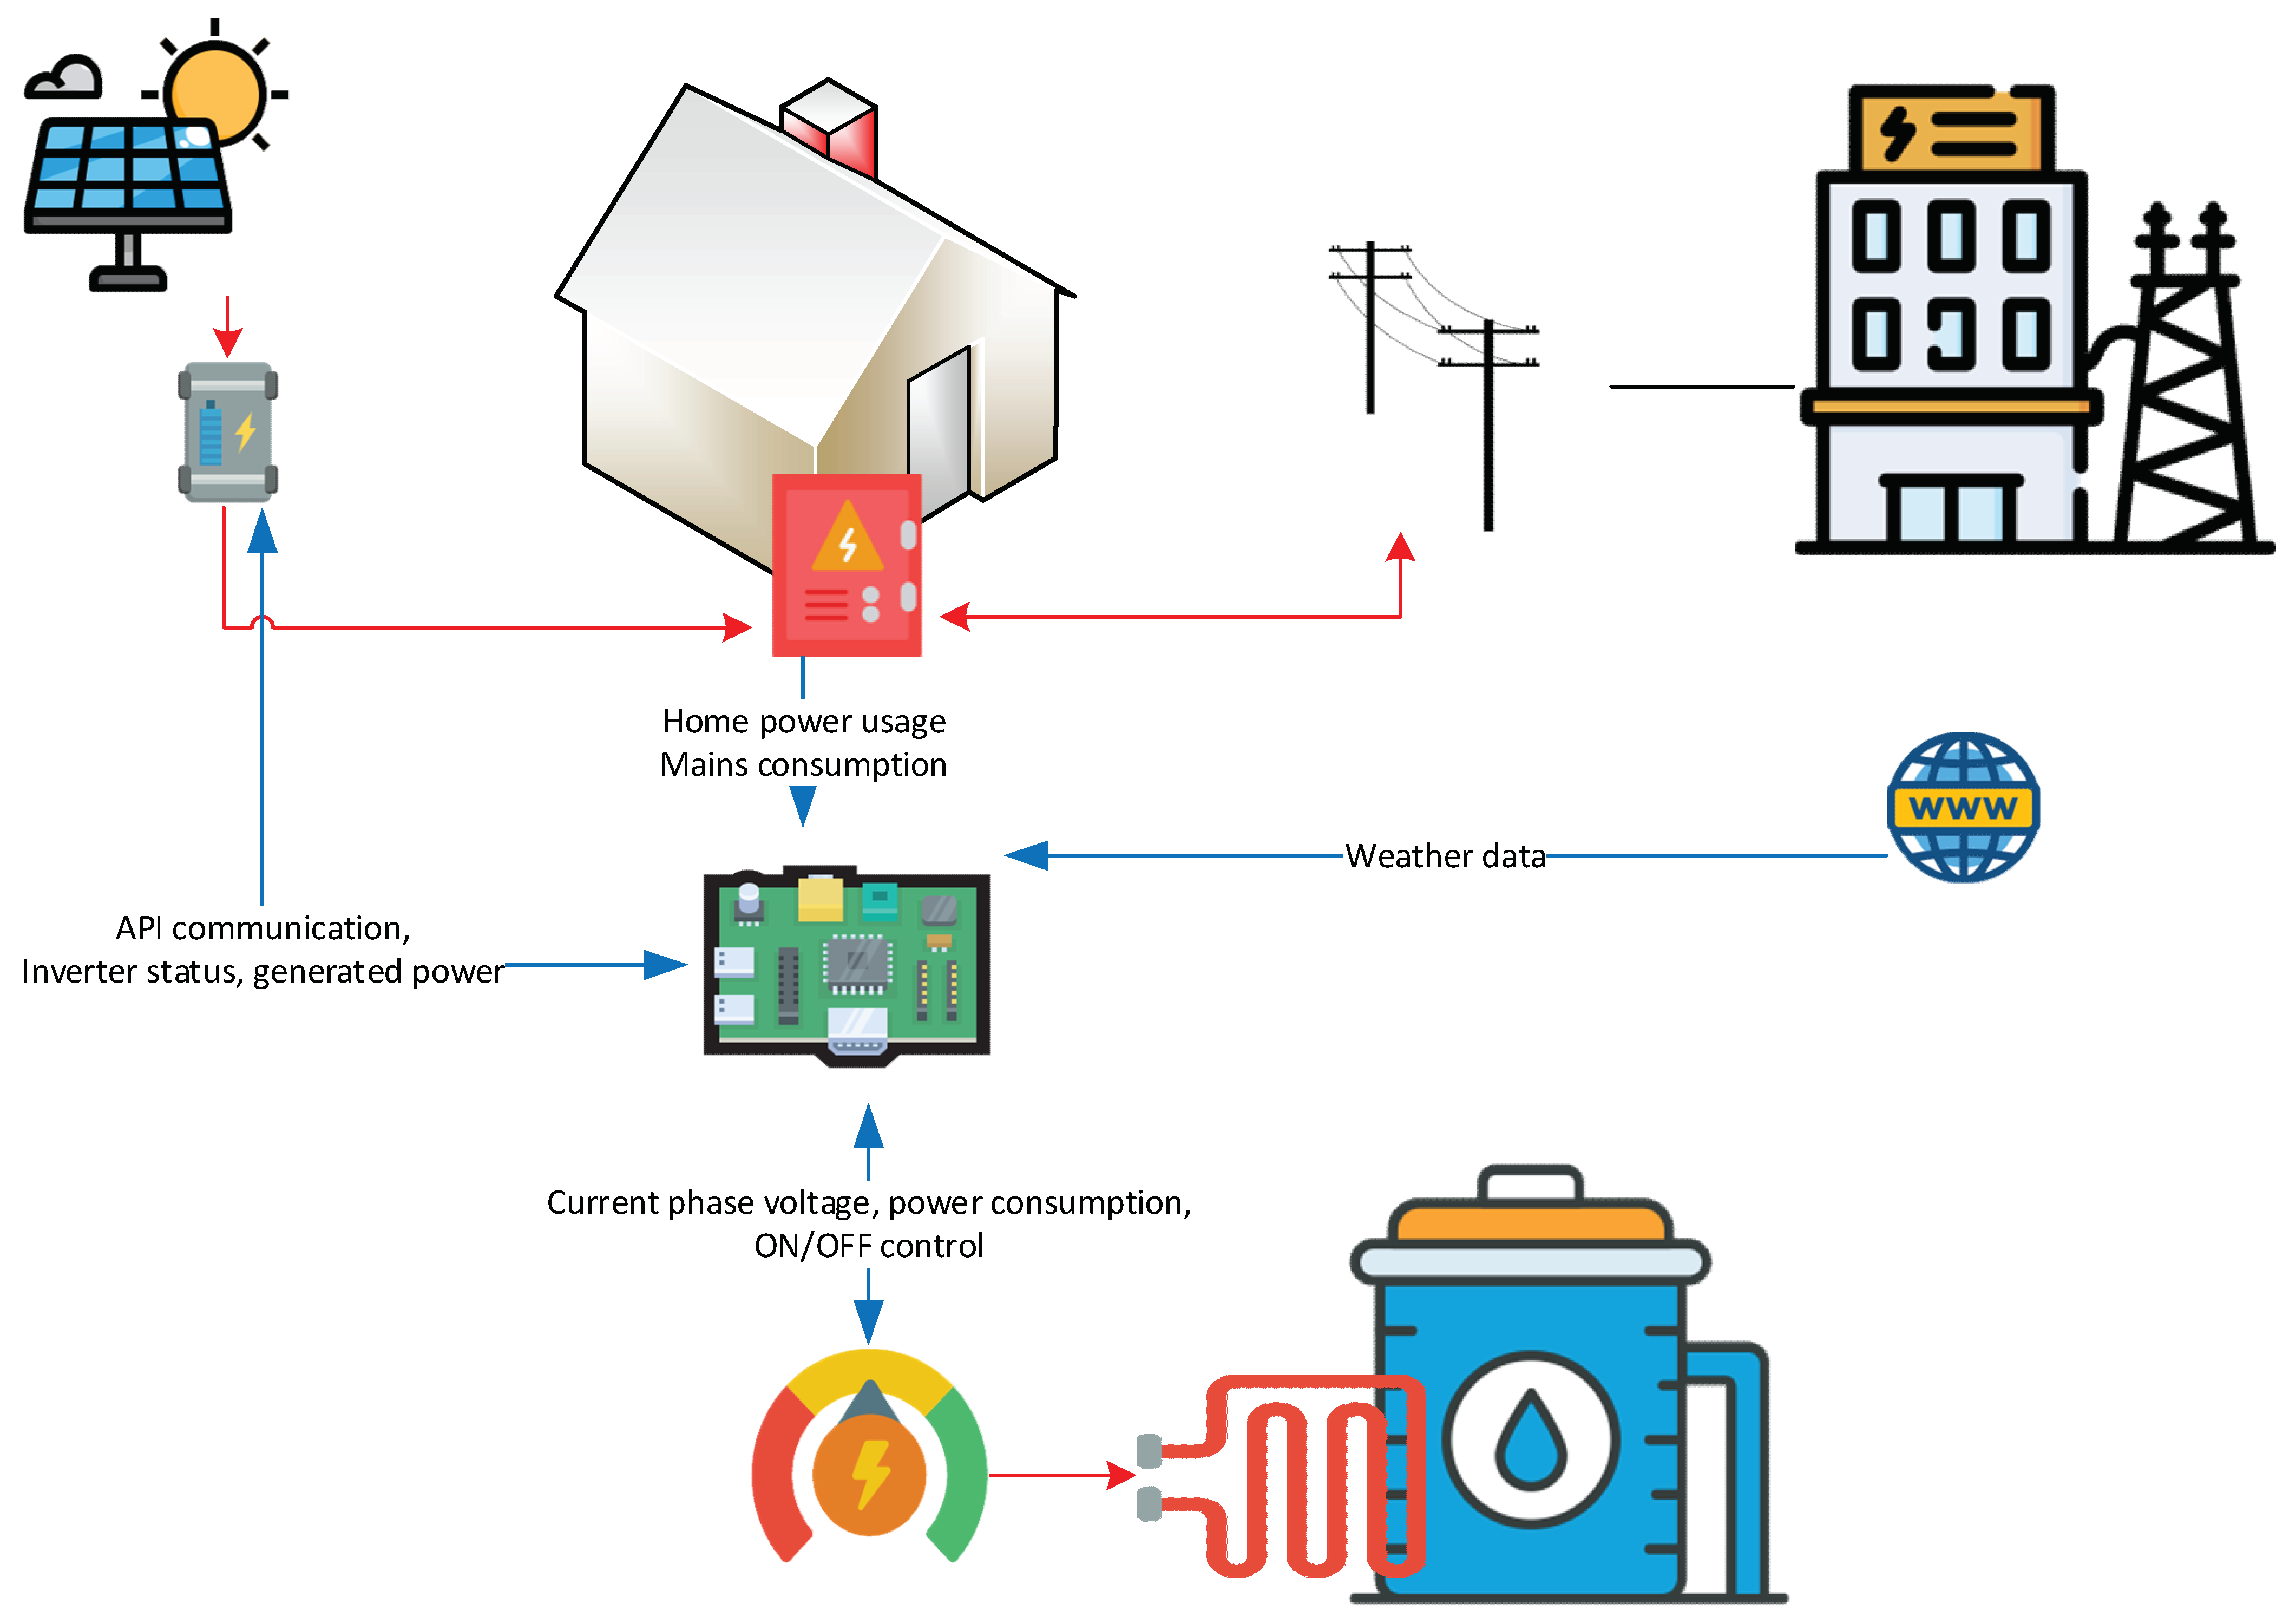
Figure 2, and on/off conditions are given in
Table 1.
The behaviors of the system in the states shown in the diagram (A–D) are:
The system operates in a transient state. If the relay is on, it will remain on. The counter value is neither incremented nor decremented;
The system operates in an incrementing state until the relay is turned on. If the counter value reaches the set number, the relay will turn on, and the counter value will be set to 0;
The system operates in a voltage monitoring state. If the counter has a positive non-zero value, subsequent measurements decrease this value to zero. If the switch is on, the counter starts decrementing to the given negative value. If it reaches it, the switch will be turned off, and the counter is set to 0;
The system has detected a critical voltage value. The relay is switched on immediately, and the counter is set to 0.
The measurement environment is organized as shown in
Figure 2, with a list of items listed below.
Fronius Symo 10.0-3-M inverter,
two strings of photovoltaic panels with a total power of 9470 Wp,
3-phase ORNO electricity meter on the building side,
grid connection supplied by Tauron Polska infrastructure,
Raspberry Pi microcontroller running the Linux/Domoticz system,
a socket equipped with an ESP8266 microprocessor and a BL0937 chip (in the case of this study, Gosund SP111 was used with Tasmota 12.1.1 software after full calibration),
three-phase heater with a nominal power of 500 W per phase (total 1500 W).
The server implemented is the open-source Domoticz (build 14905) software, operating under the control of a Linux operating system on the Raspberry Pi microcontroller. The measuring device measures every 1 s, while the value is sent to the server every 10th value (however, its acquisition times due to the communication process can be 10 ± 1 s). The system also performed an independent data acquisition through a dedicated script for the Domoticz environment and, in addition, through a script directly querying the Fronius inverter via the available API.
To conduct a detailed analysis and enable further comparative analysis, it was decided to acquire the following data:
The voltage on each of the three phases;
Power produced by the photovoltaic installation;
Household electricity consumption;
Weather conditions.
Due to the power consumption, which depends on the current voltage in the network, it was also decided to collect data on the current power consumed by each receiver (regardless of the declared nominal power). The occurrence of events such as, for example, the loss of electricity production by a photovoltaic installation or current insolation were also independently collected directly from the Fronius API to correlate them with the voltage in the network. To simplify this mechanism as much as possible, the voltage reduction results directly from Ohm’s law (1) when we increase the resistance of the circuit,
(e.g., we turn on a receiver that consumes a lot of energy) while maintaining a constant current supply
will lead to a voltage
drop, i.e.,:
Based on the collected data, information can be calculated such as (amongst others):
Predicted lost energy—the amount of energy that would have been produced when the PV was off;
Amount of energy consumed—the actual value of energy consumed during the heater operation;
The actual amount of energy obtained—the amount of energy produced, reduced by the amount of energy consumed by the heater;
The total amount of extra generated energy—the amount of energy produced while the heater is operating, assuming that the installation was not turned off during that time.
An undoubted gain is also an increase in the temperature of the DHW, but this factor is not directly considered in the analysis of the effectiveness of the optimization algorithm (the controller used the information to prevent possible overheating of the water in the tank). Data were collected in this way for less than one year (preceding the period of actual research) and during this time the system was calibrated and adjusted, among other updates. The “alarming” and “safe” voltage values were assumed. The final adopted parameters were presented in
Table 2. and each activity was preceded by an analysis of weather conditions and a period of at least two weeks of observing the installation without the shutdown pre-vention system activated. The result of these activities was the development of the system in its current form, which was then decided to be subjected to an annual comparative test. First, it was used to answer the question of the actual losses generated by switching on the installation, which is presented in the next section and in
Table 2.
The selection of values was carried out experimentally, based on the following algorithm:
For the maximum value, it was assumed that if the shutdown occurs at 264 V, a buffer should be created to filter out very rare situations in which the voltage in the network increases rapidly. Two such cases are specified for their sudden, intense changes in light intensity or changes resulting from energy prices in the daily cycle. The first of these cases occurred irregularly and was very rare and difficult to analyze. The second one caused a sudden increase in value. Based on the analysis of the average value of 10 maximum values of the temporary jump in June 2022, it was determined to be an average value of 2.9 V. Based on this observation, it was arbitrarily assumed that the maximum value would be 260 V to compensate for such spikes in the event that the voltage value led to a necessary shutdown (the further effectiveness of this mechanism was not individually analyzed, due to the implementation of all of them together).
For the second level (alarm), the original value was assumed to be 255 V. However, it was observed that this value was too low for trips resulting from the average voltage value (253 V for over 10 min) because the voltage values often oscillated around the limit value. Therefore, this value was successively lowered. Values significantly below 253 V led to more frequent, economically unjustified switching on of the heater; therefore, the target value was set to 253 V which allowed for the detection of the increasing tendency for the average quickly (and immediately reduce it in the case of a slow increase in the voltage value) and did not lead to continuous operation of heaters during electricity production.
In the case of the “safe” value, an important observation was that turning on the heaters allowed for a voltage reduction of about 4 V. Therefore, it was decided that this value should be 4 V lower than the alarm value.
Each of such activities was preceded by an analysis of weather conditions and a period of at least two weeks of observing the installation without the shutdown prevention system activated. The result of these activities was the development of the system in its current form, which was decided to be subjected to an annual comparative test. First, it was used to answer the question of the actual losses generated by switching on the installation, which is presented in the next section.
3. Energy Loss and Methodology for Its Determination
To calculate the losses generated by turning off the PV installation, it is necessary to conduct a production analysis. This is a complex task because the shutdown process consists of two phases: the actual shutdown of the inverter and its restart, in which the installation does not operate with its appropriate parameters. Moreover, just as determining the actual loss in the case of the first phase (complete shutdown) can be estimated relatively easily (assuming that the installation should produce a certain amount of kWh corresponding to the previous period when it was turned off), determining the loss resulting from startup is not always obvious. It begins production and gradually increases the energy supply to the grid; therefore, it cannot be assumed that production is zero-synchronous throughout the startup period. Hence, for the purposes of this analysis, it is assumed that the first phase (shutdown phase) would be treated as a total loss. Its value will be estimated based on the average of the last recorded value and the first value after the full restoration of production, while the moment of the full restoration of production will be determined as described by the following conditions (2):
where
P is the value of the power produced by the installation,
i is the iterator of the following reading, and
Precov is the average value between subsequent readings. In the case of the second phase, it is assumed that the value of the loss would be determined based on the non-negative difference between the average determined as described above and the current production value. For example,
Table 3 shows how to analyze one exclusion shows how to analyze one exclusion.
In
Table 3, in line 7, there is a sudden collapse in production values. After correlating this data with the readings from the inverter (i.e., code informing about the shutdown due to network parameters inconsistent with the standard), a calculation is performed. Thus, from the next line, the
Precov value is determined. In lines 8–17, it can be observed that the production value remains zero—this is the time during which the inverter waits for the voltage parameters in the network to stabilize. This time depends on the current voltage value in the network and may vary between subsequent shutdowns, but the minimum during the tests was 100–120 s. Then, lines 18–57 show the loss in increasing production. Line 58 is an exception in which the current value of production is greater than the average value; therefore, it is not considered. In line 59, the
Precov value meets the described condition defining the end of the shutdown recovery process. Thus, the average values of rows 7 and 59 of the P [Wh] column are the starting points for calculating the loss in the
Ploos and
Wloos columns. Hence, this value for the first phase (without production) is 6379 Wh, which is then determined for individual moments of the startup phase. Therefore, in the case of this shutdown, it was calculated that 527 W was lost.
It should be noted that the rule mentioned above made an exception when the difference in the production increase was less than 50 Wh. Still, the further course of the data indicated a single reading disturbing the statistics, e.g., for subsequent readings in the set {0, 0, 0, 169, 301, 467, 636, 771, 771, 1136, 1233, 1433, 1567, 1767, 1933} it can be observed that the value 771 appears twice in the sequence that, if the method were strictly applied, would suggest that the inverter finished the startup process at this value, which is untrue because the values continue to increase (up to over 7000 Wh) and required capture and manual correction. It is noteworthy, however, that this is an infrequent case in the context of the data acquisition period.
For the algorithm prepared in this way,
Table 4 shows an example of a 15-day schedule, which was analyzed in terms of energy losses and the number of shutdowns in relation to each other.
Table 4 presents data relating to the analysis of energy production and the number of shutdowns in the period 4 August–18 August (15 days). During this period, four days with rain (precipitation above 4 mm) and two days with limited visibility (due to visibility below 5 km) were recorded. The UV index dropped below the value of 4 UVI five times. The number of installation shutdowns in this period amounted to 49, which gives an average of 3.3 shutdowns per day. A total of 551.59 kWh was produced, and the loss resulting from the installation shutdown periods amounted to 31.97 kWh, or 5.8% of the total production. The turnoff ratio (TR) parameter described by the Formula (3) was adopted to relate different periods to each other. The lower the value of this parameter for similar weather periods, the lower the impact of inverter shutdowns.
In the discussed case, this parameter was set at 0.0580.
The second period was collected immediately after the first one, from 19 August to 2 September. The results are presented in
Table 5.
During the data acquisition period, the system that reduces the number of shutdowns was turned on. Weather conditions during this period were comparable, which resulted in three days with precipitation above 4 mm, three days with limited visibility (below 5 km), and the UVI index dropped four times below the value of 4 UVI. The result was 15 installation shutdowns (down from 49), which is one shutdown per day (compared to 3.3). Total production in this period amounted to 483.65 kWh, while the loss relating to shutdowns was 10.24 kWh, which gives 2.12% of total production. Compared to the previous period, it is 3.68% less. The index mentioned above was 0.0212.
All corresponding periods during the year were subjected to a similar analysis. The result was the determination of the overall value of the TR parameter at the level of 0.0540 for the system switched off and 0.0306 during the periods when the system was on. The difference in this parameter was 0.0234.
4. Analysis of Losses Incurred in Energy Production
To analyze the validity of using the discussed solution, it was decided to test the system for several months in symmetrical cycles (at least two weeks) to determine the number of shutdowns and the economic viability of the solution. One of the monitored periods (i.e., 25 June–24 July) was selected as an example to discuss in the context of presenting the number of shutdowns when the system is on and off in the context of weather.
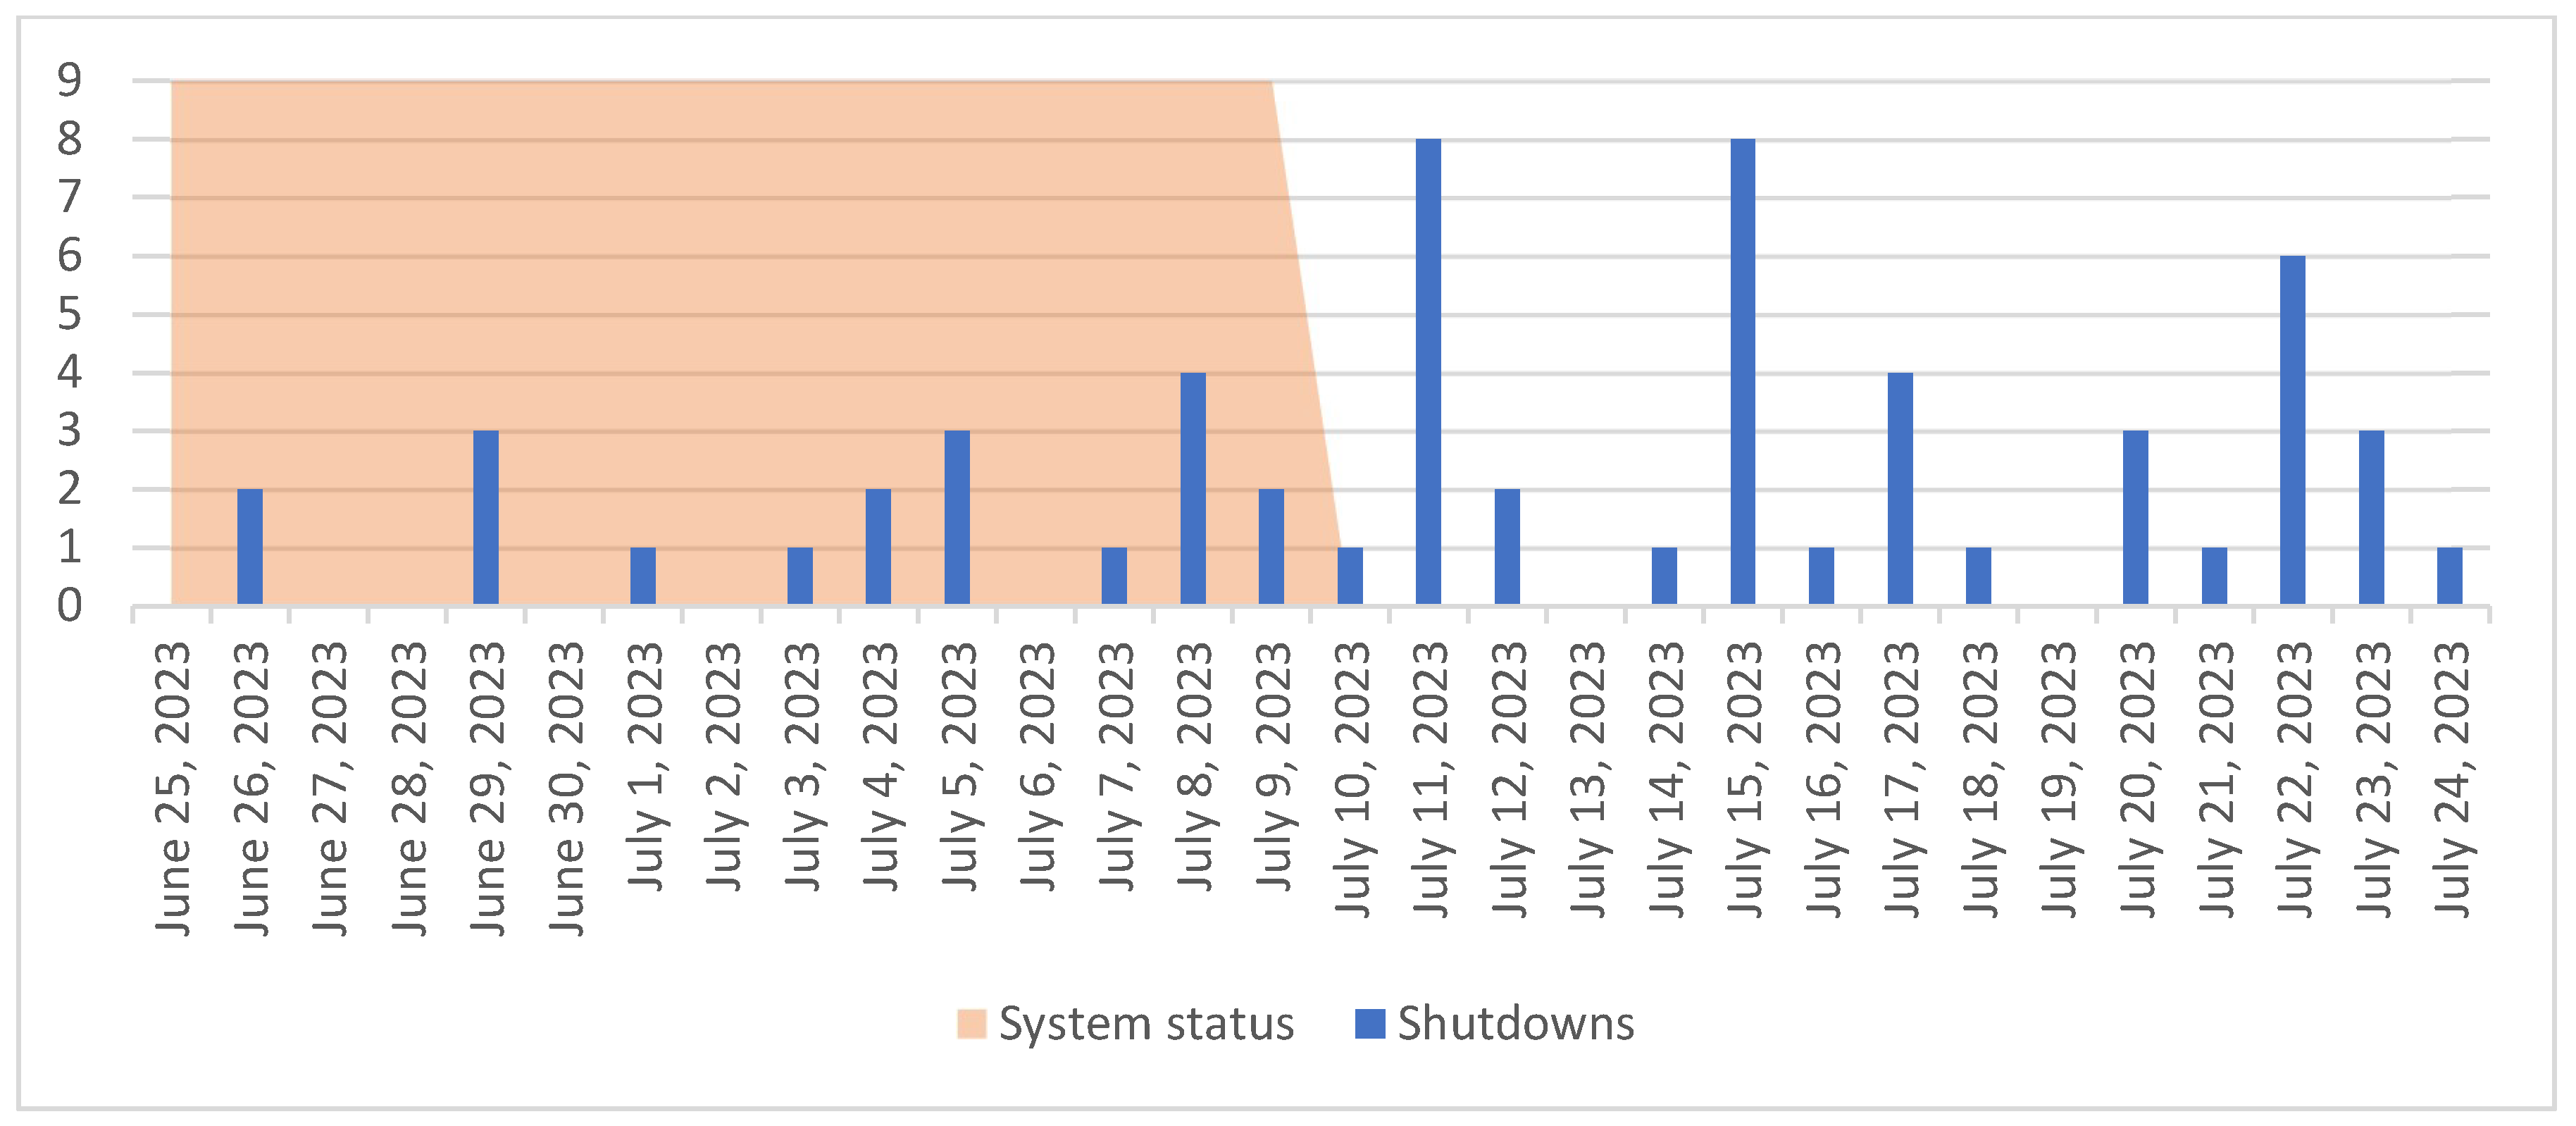
In the first 15 days, the system worked with the heaters turned off, while for the next 15 days, the heating module was turned on. The chart (
Figure 3) shows the number of shutdowns in the monitored period.
In
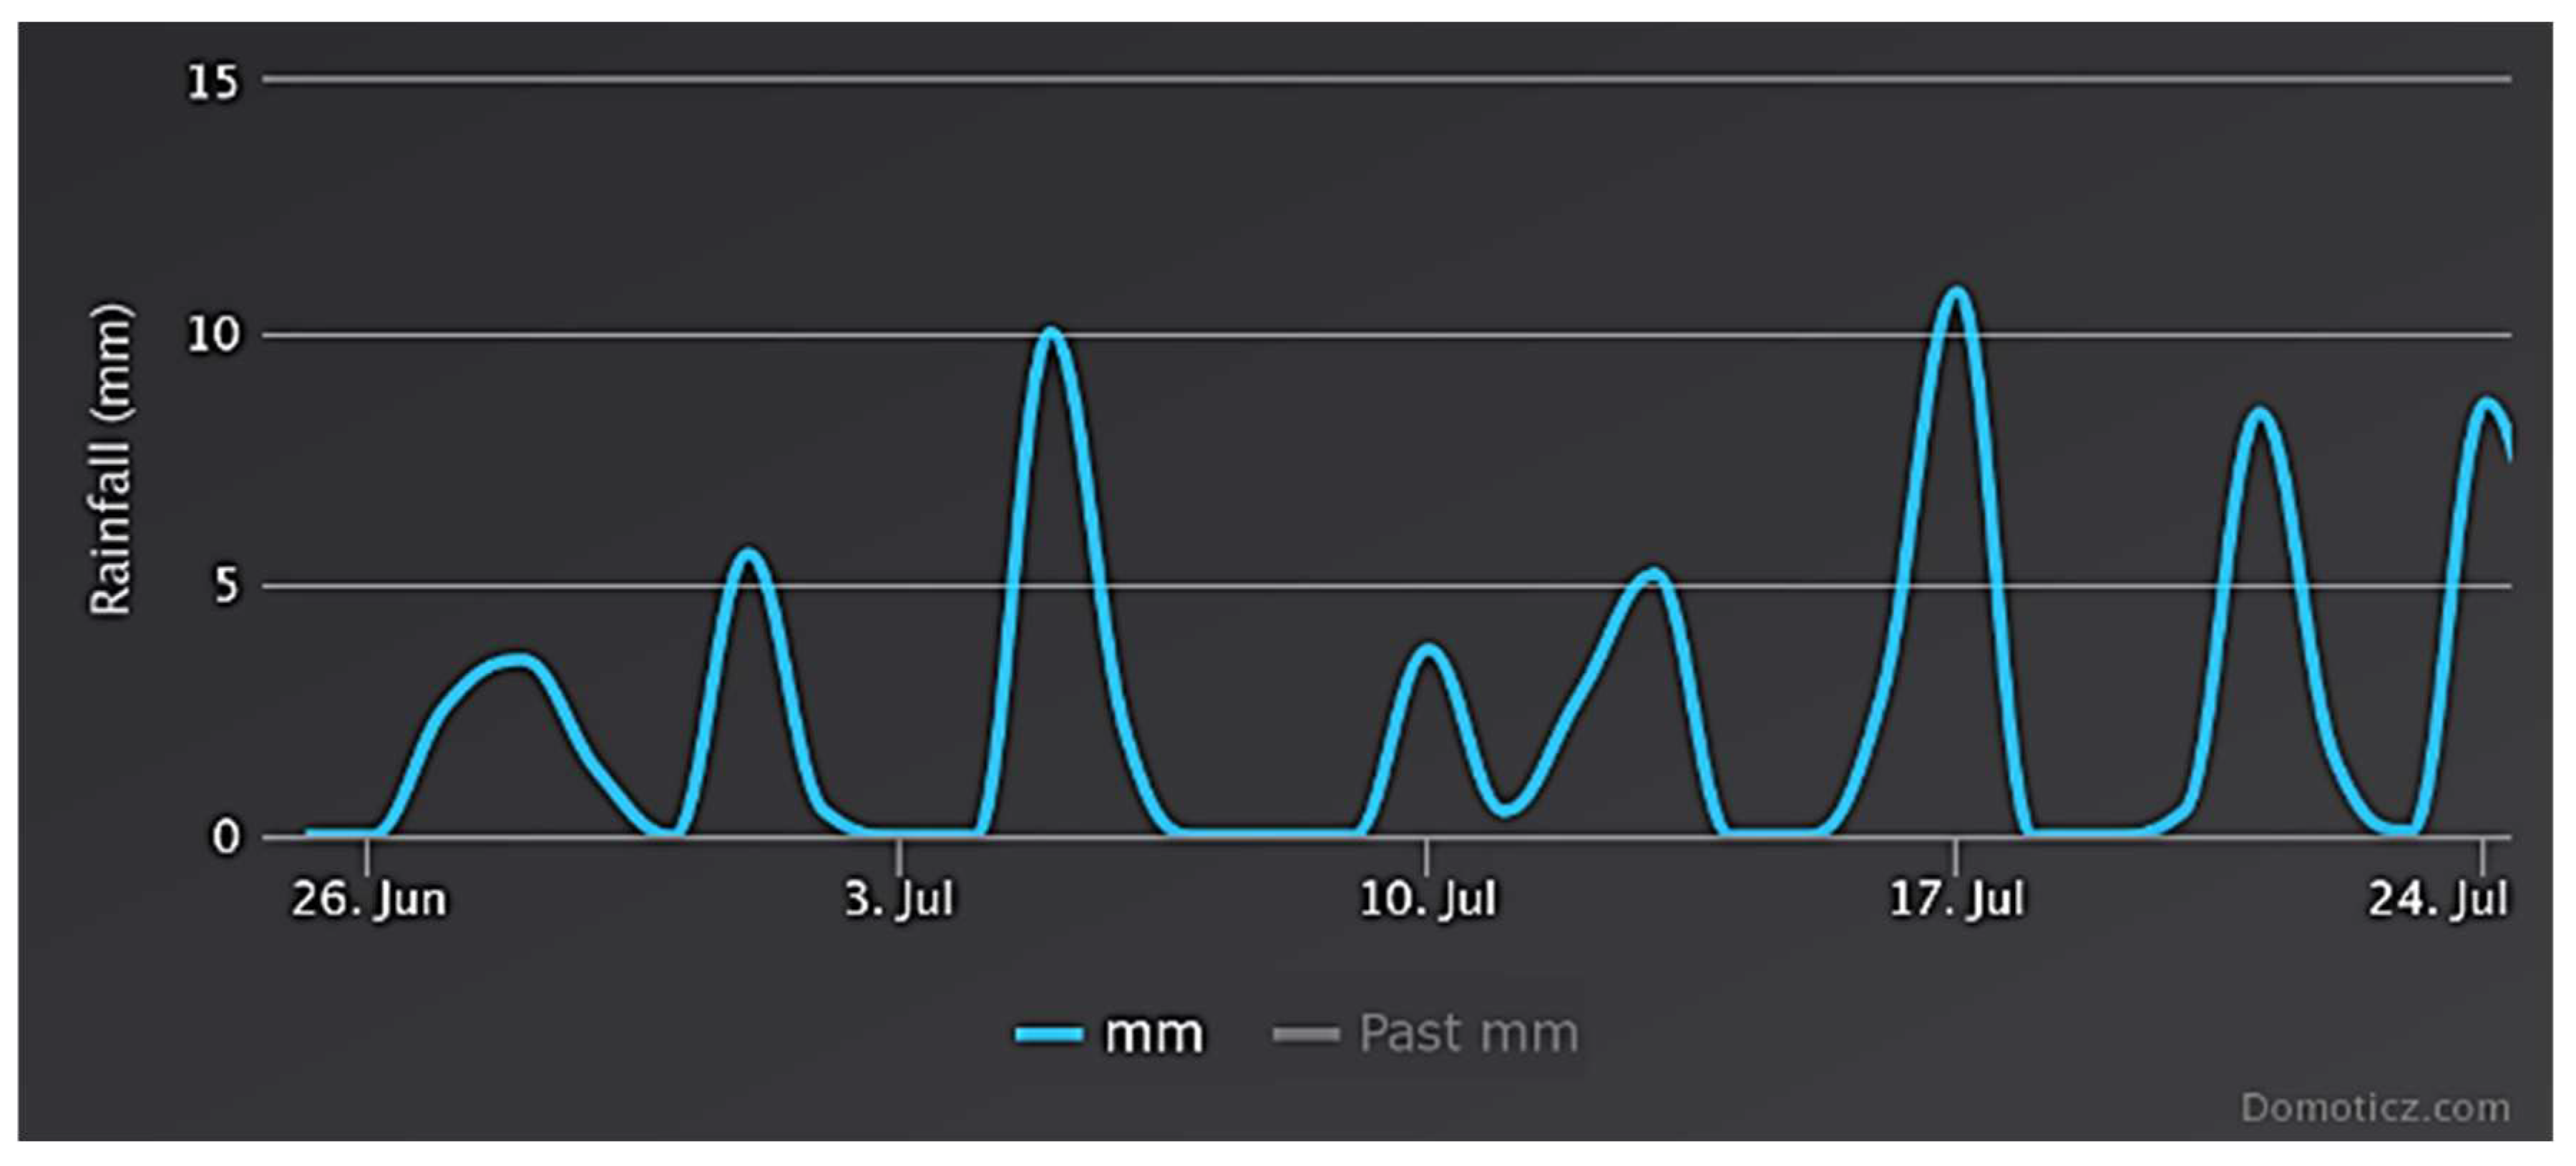
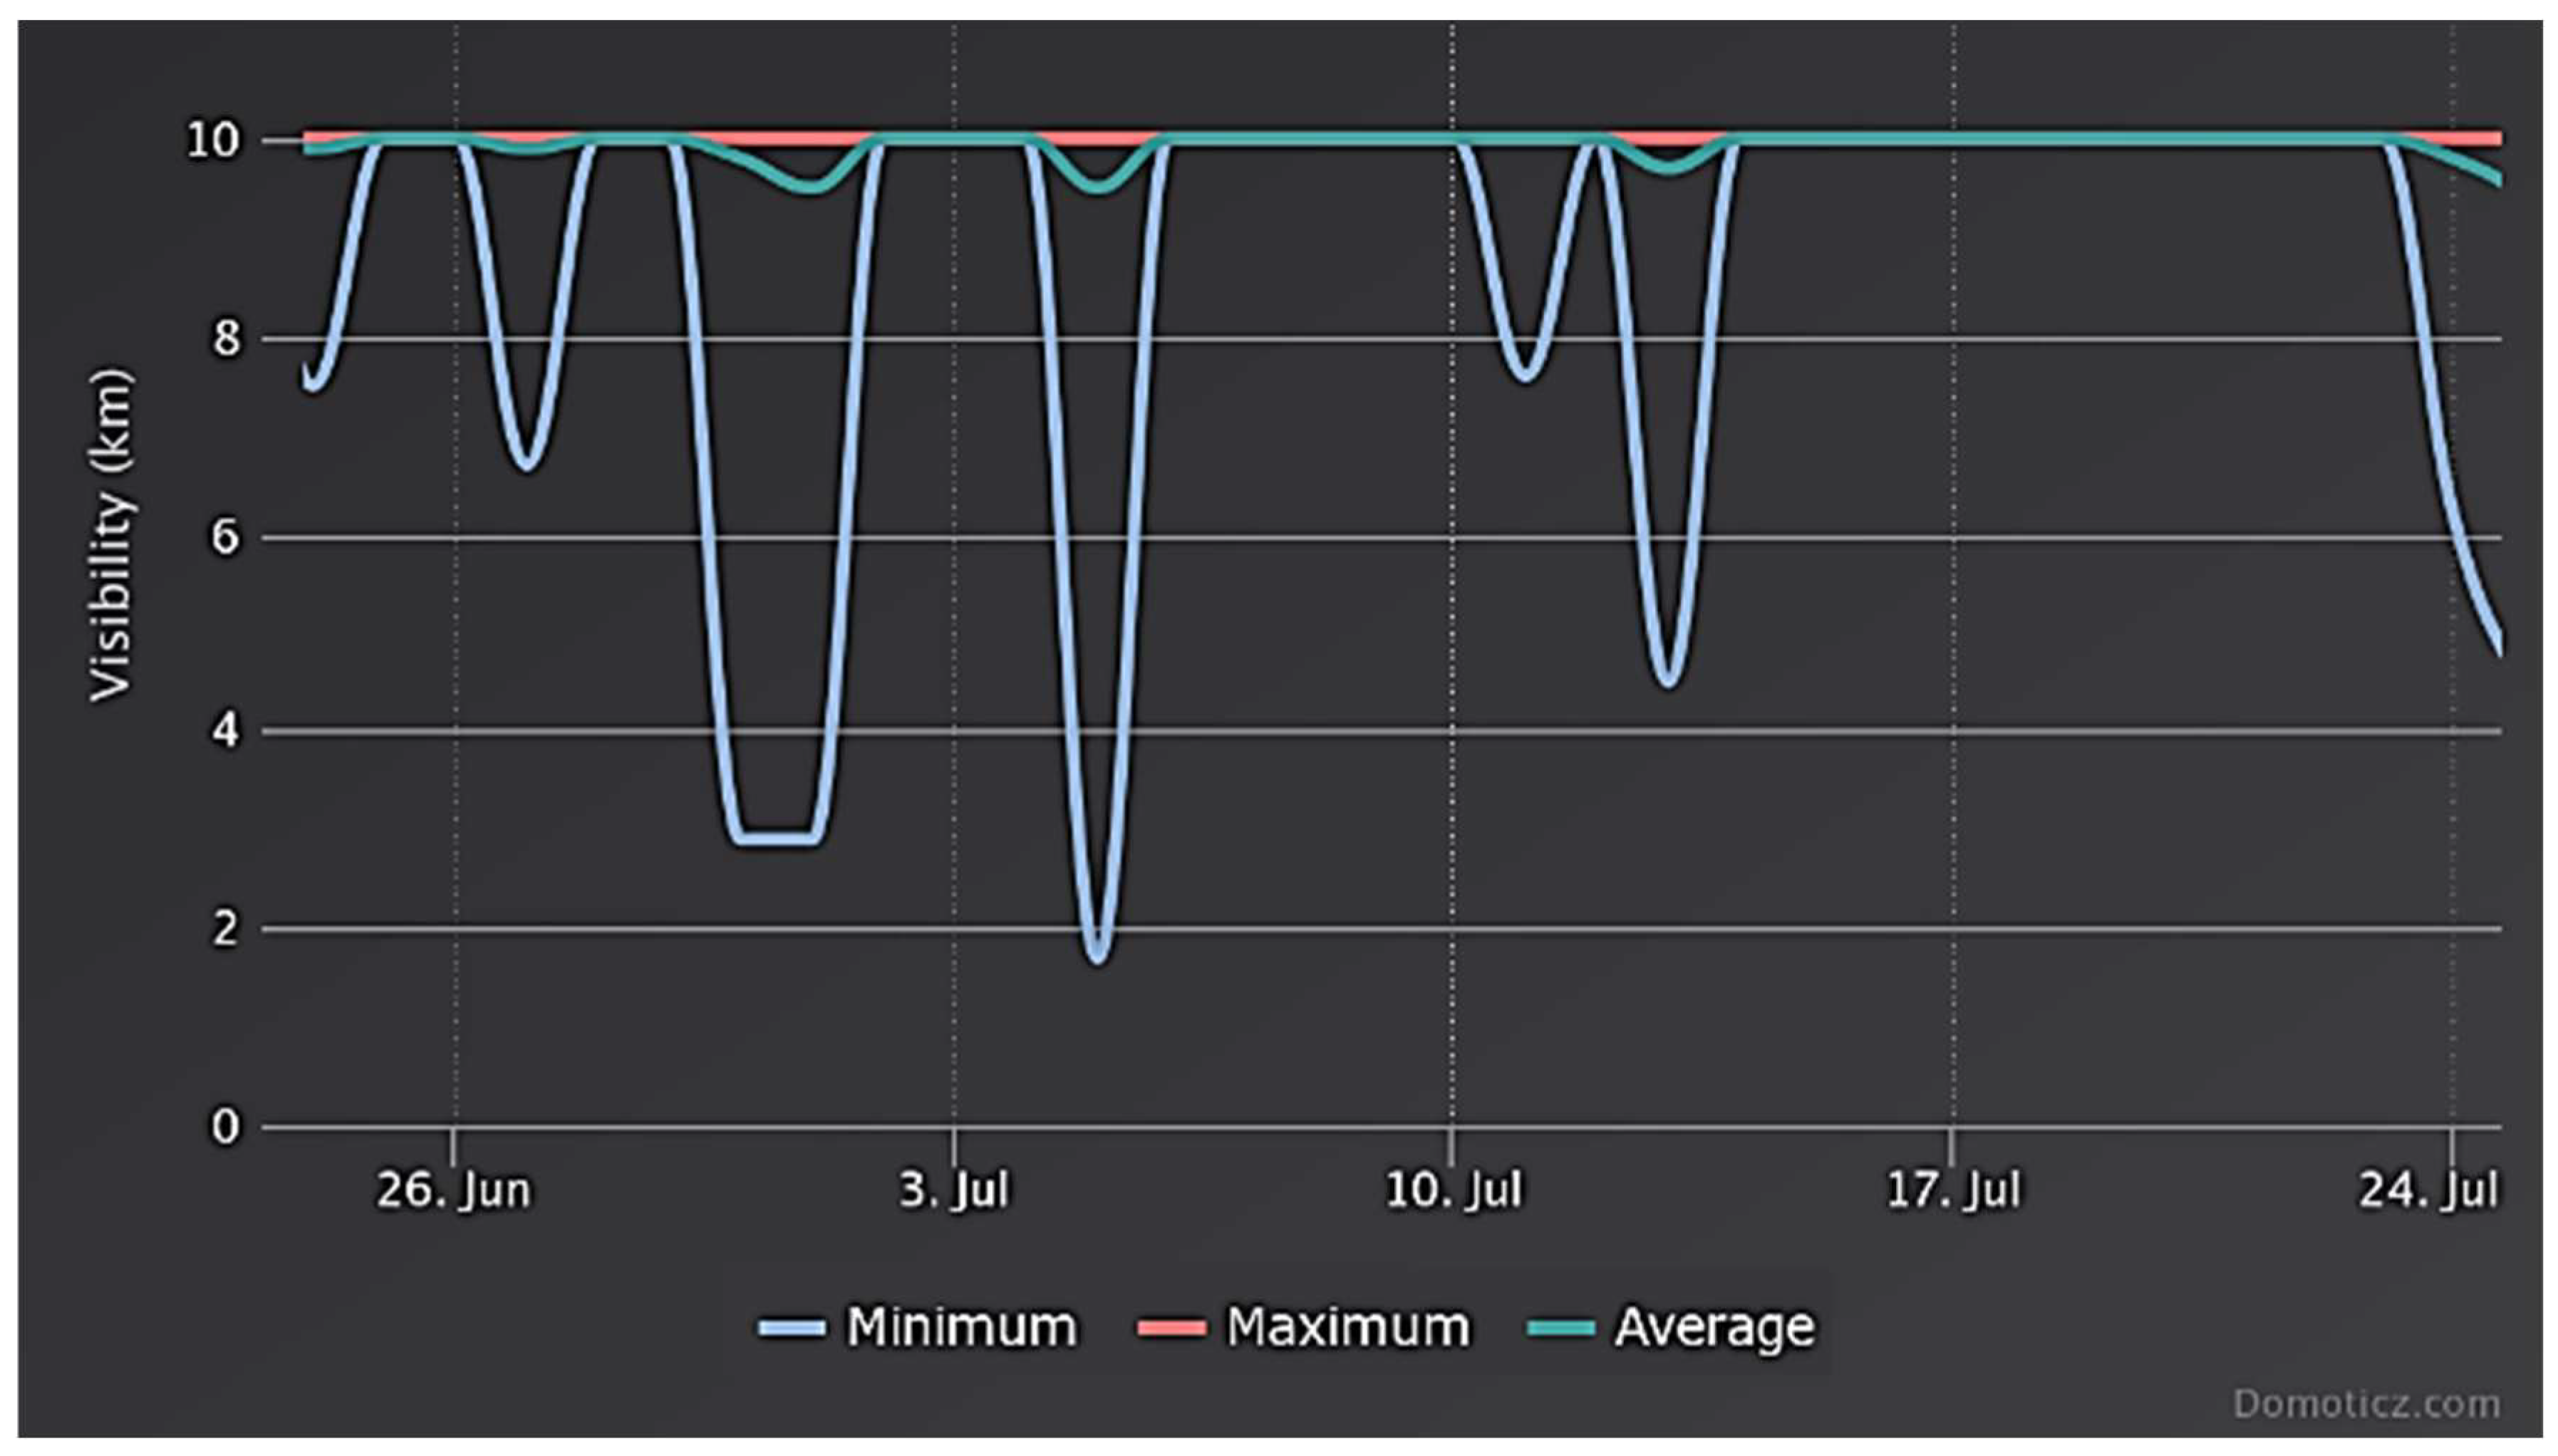
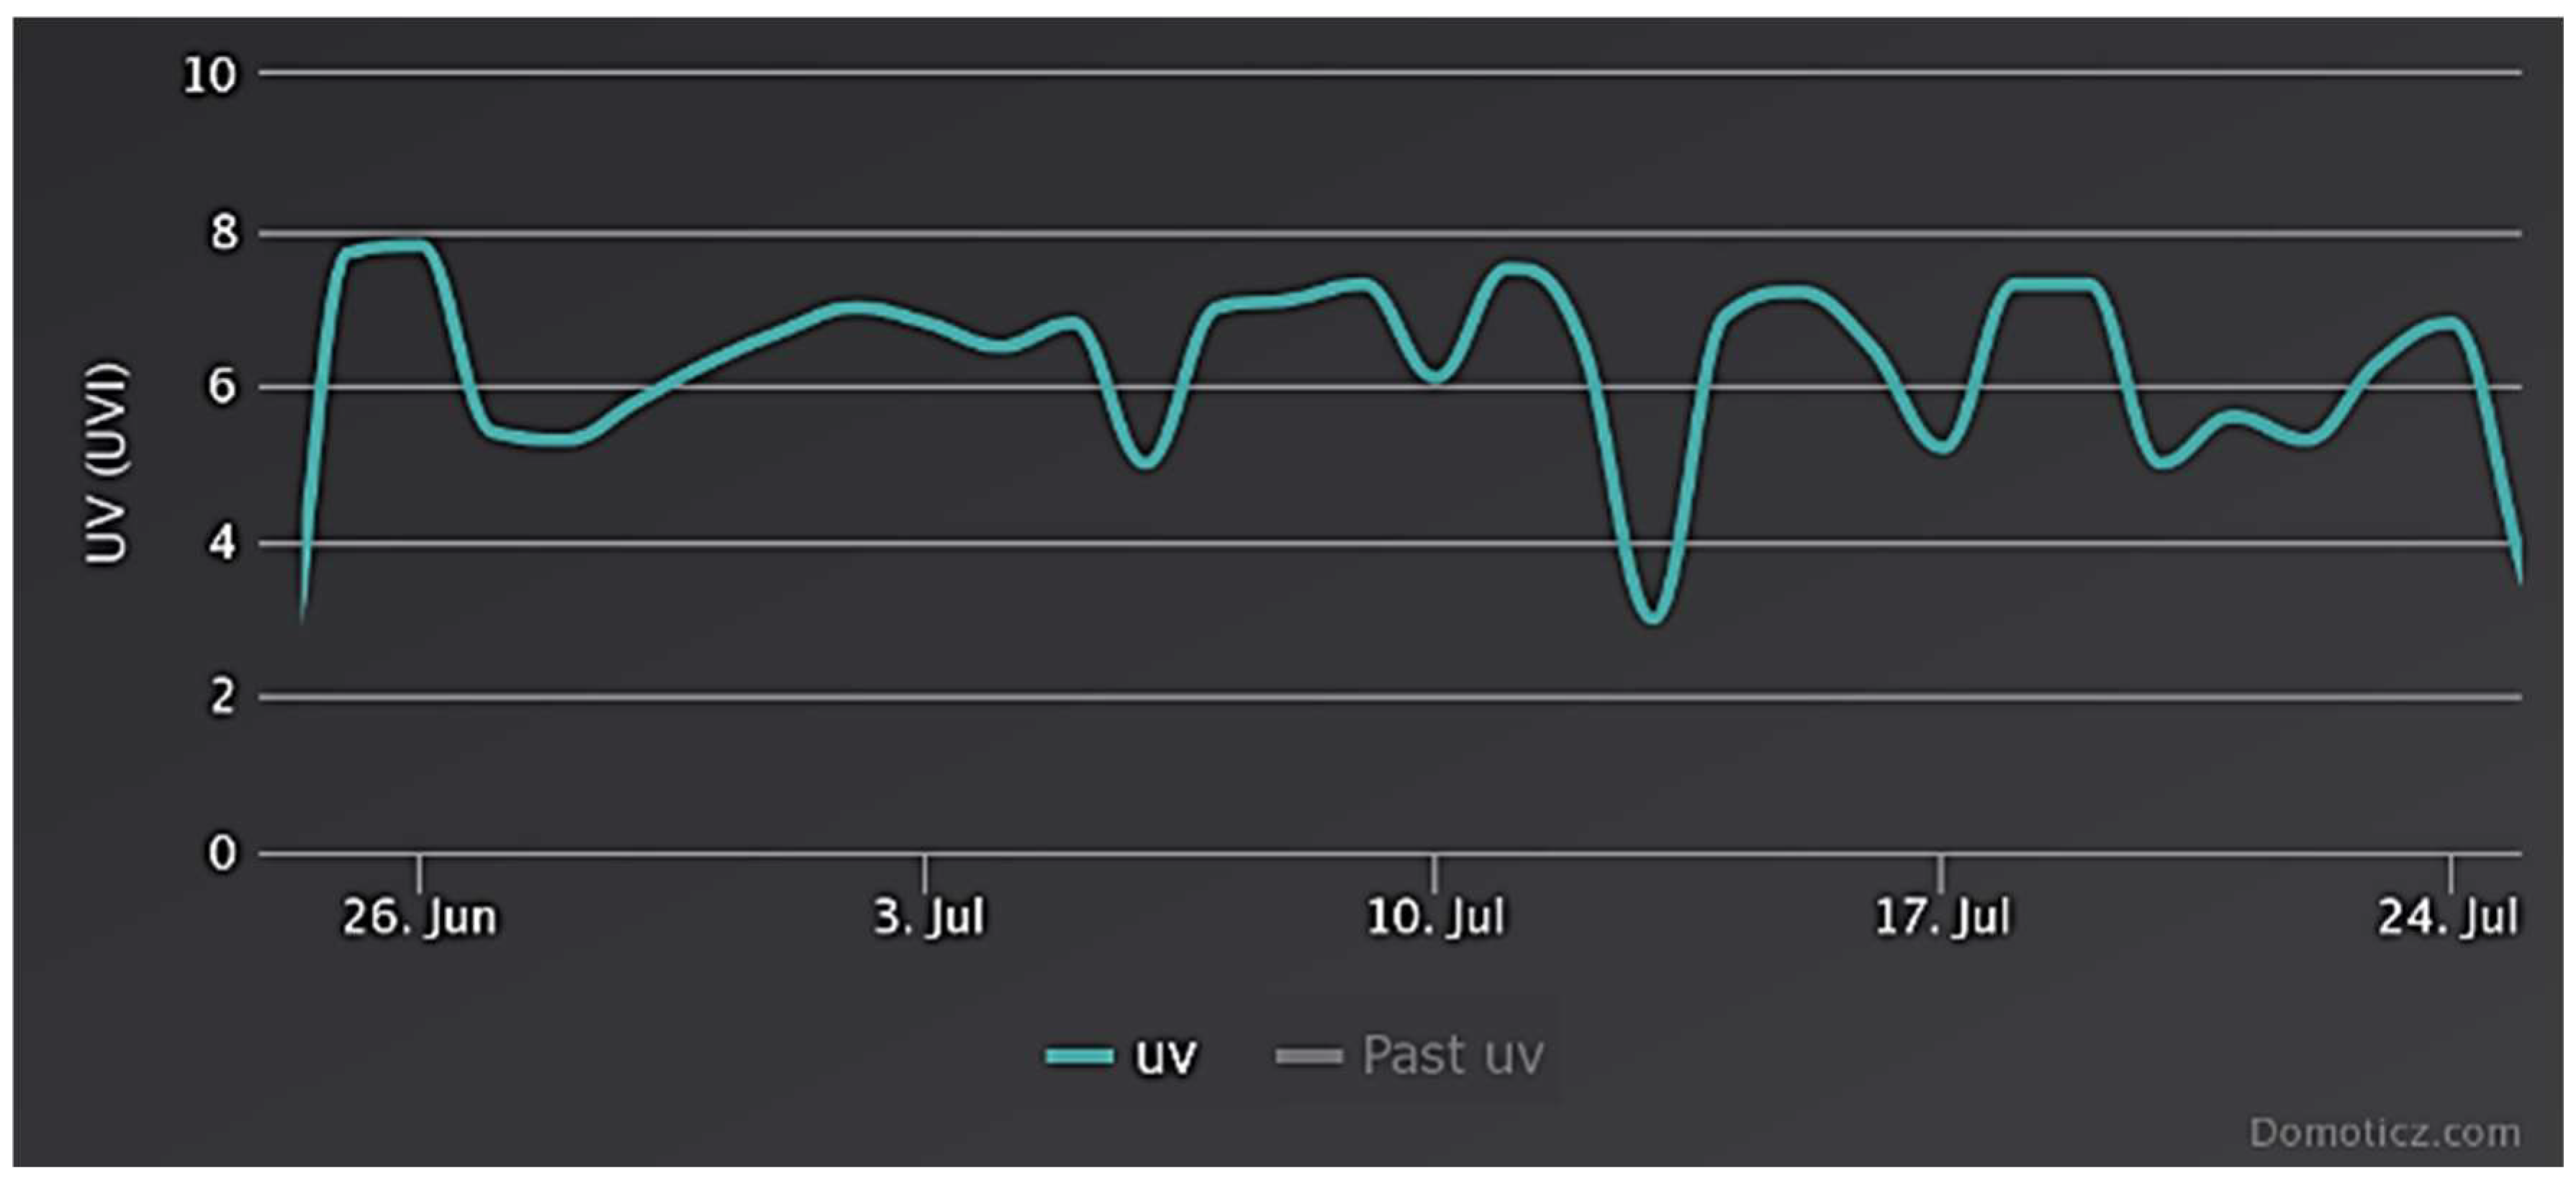
Figure 3, there were 19 PV shutdowns in the first period, while in the next period, after the system was turned off, there were 40 shutdowns. This tendency (around 40–50%) is noticeable in all observed periods. As mentioned, test periods were also analyzed to select the periods with similar weather conditions. For example, in the period mentioned above, the following was analyzed: rainfall (in mm, which is equivalent to one liter of water per square meter) (
Figure 4), visibility (in km, what is the distance a large dark object can just be seen against the horizon sky in daylight) (
Figure 5), and UV (in UVI, a measure of the level of UV radiation) (
Figure 6).
Figure 4 shows rainfall. In both periods, it can be seen that there are days with little precipitation (less than 5 mm) and days with more rain (10 mm). However, the number of rainless days (less than 1 mm) is similar for both periods.
Figure 5 shows visibility. The first period is characterized by temporary visibility restrictions much more often than in the second period. It should be noted, however, that the average value deviates only slightly from complete visibility, which indicates no real impact on the day-long operation of the installation.
Figure 6 presents the UV index. Based on the observations, this parameter has the most visible impact on the amount of energy produced and, consequently, on the number of shutdowns of the PV installation. In the presented graph, the value oscillates around 6 UVI and, apart from the first, last, and one day in the second period, it does not fall below 4 UVI.
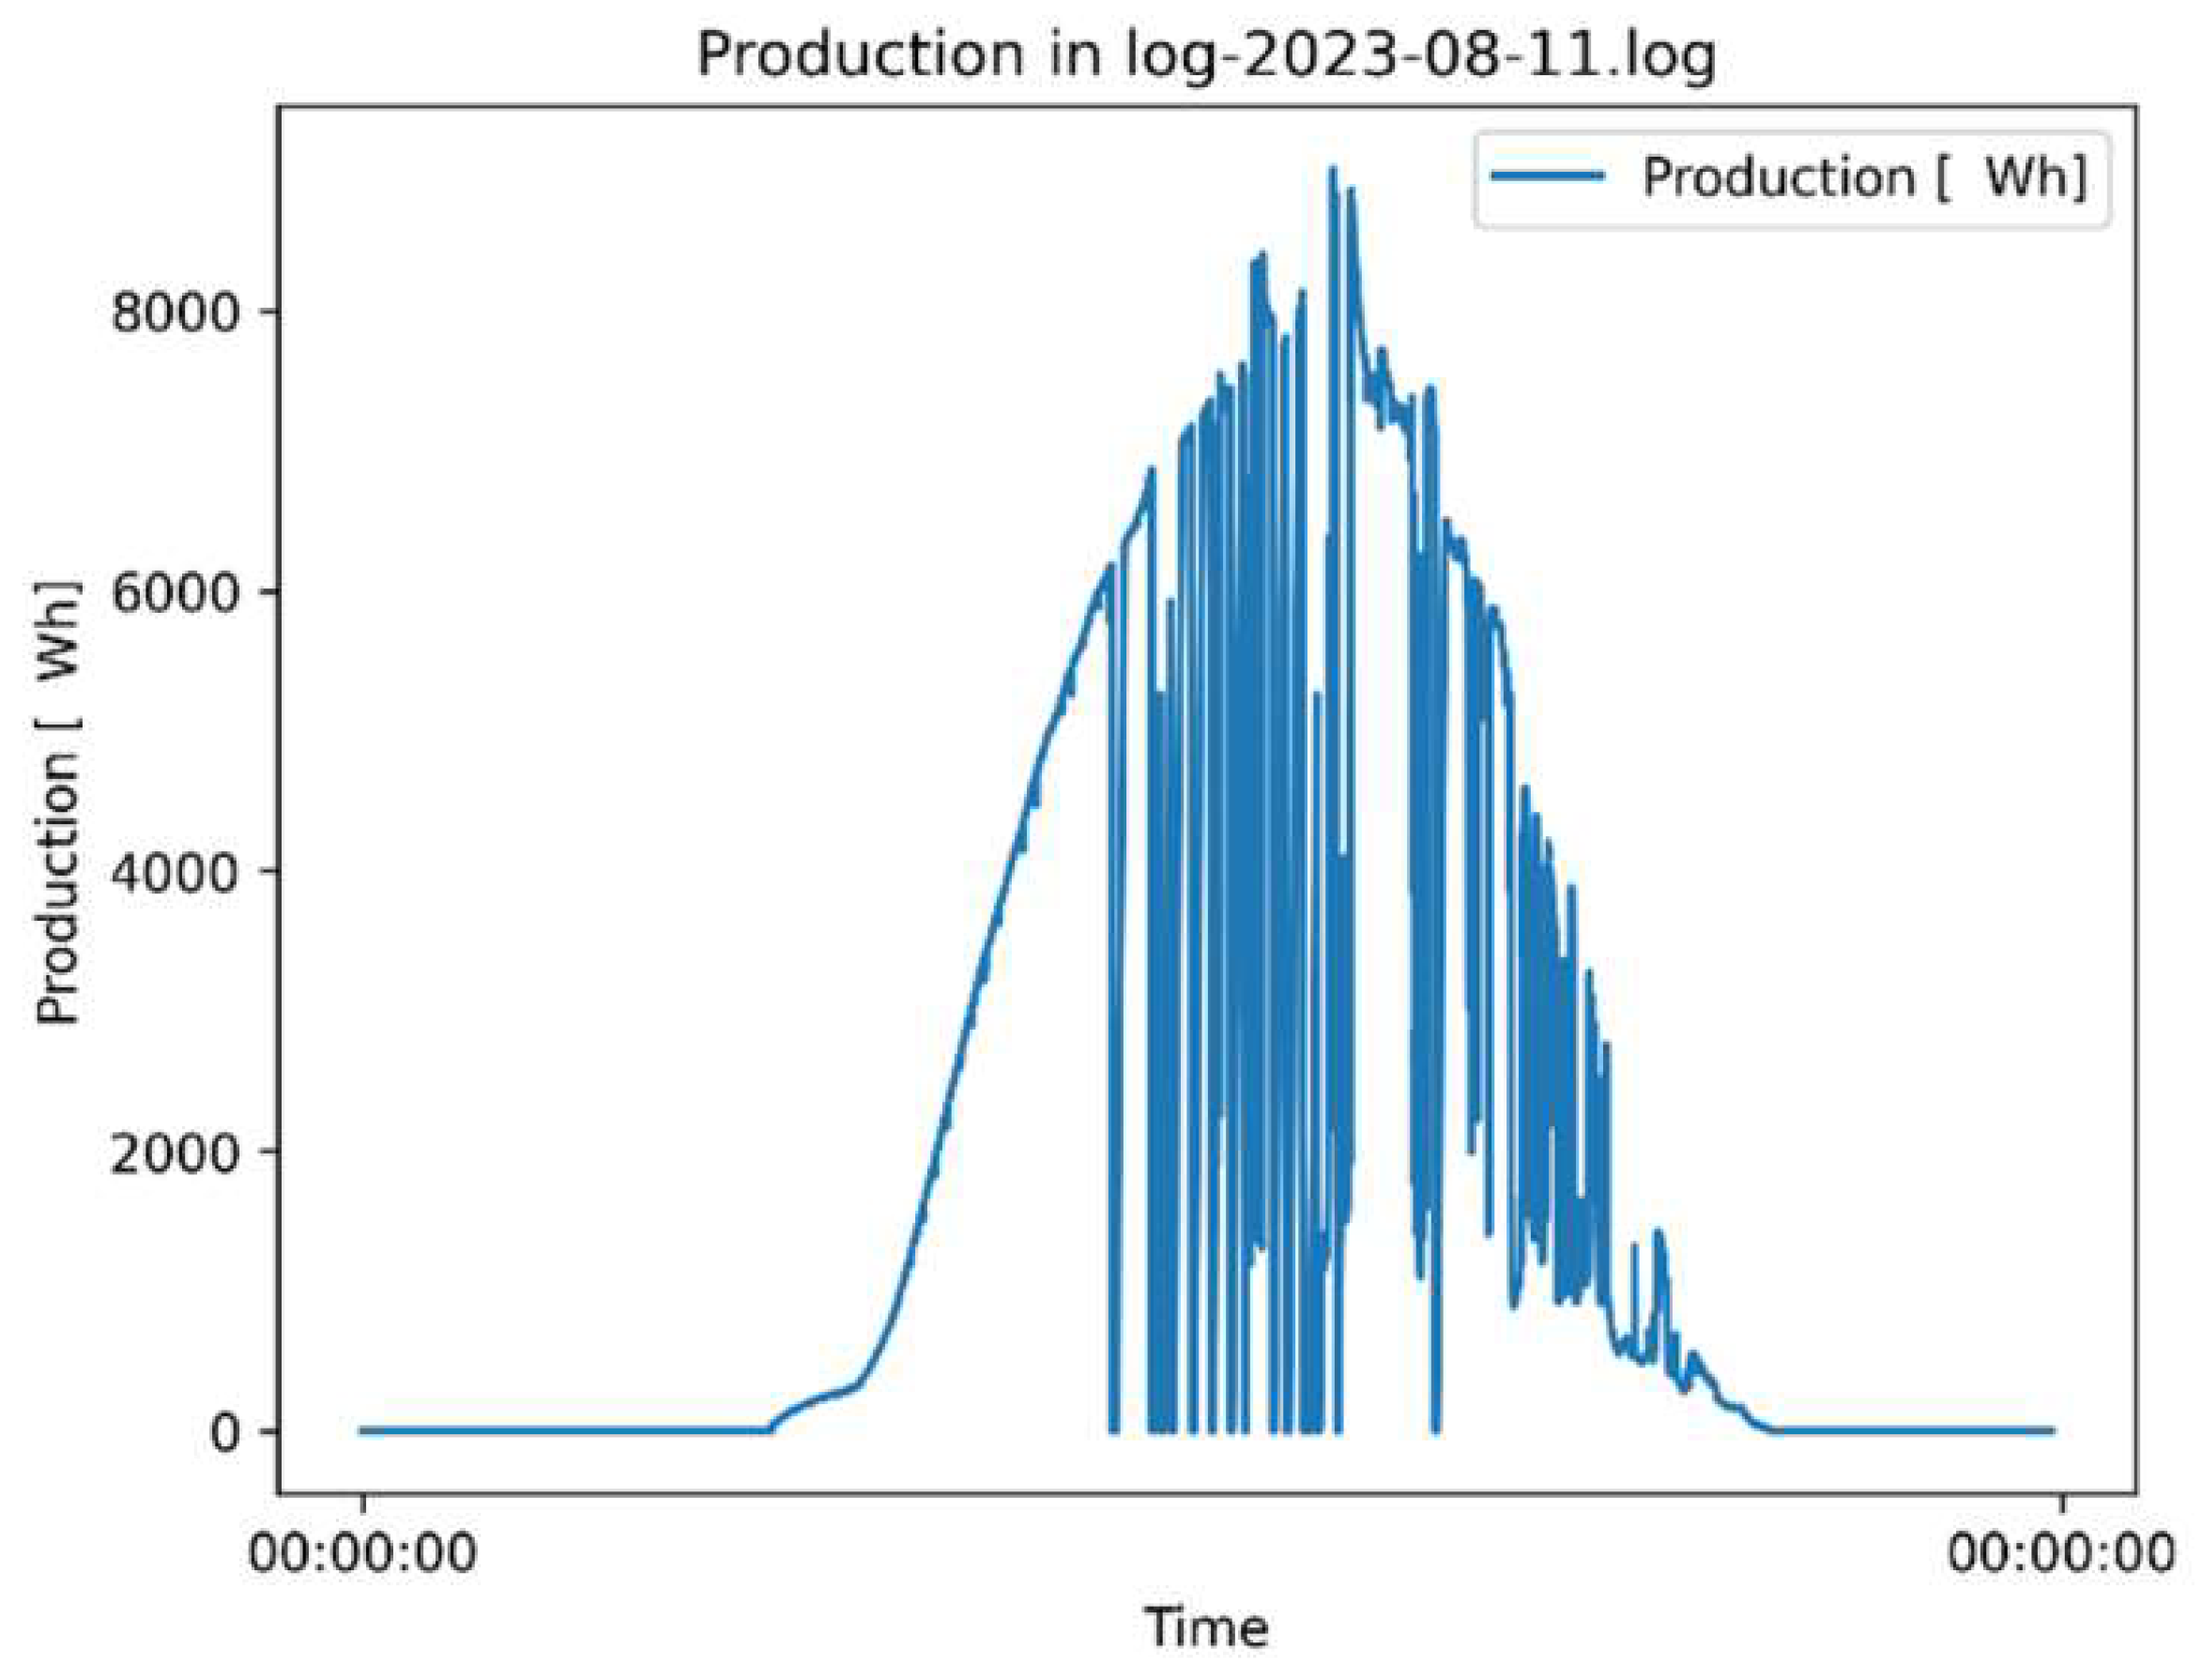
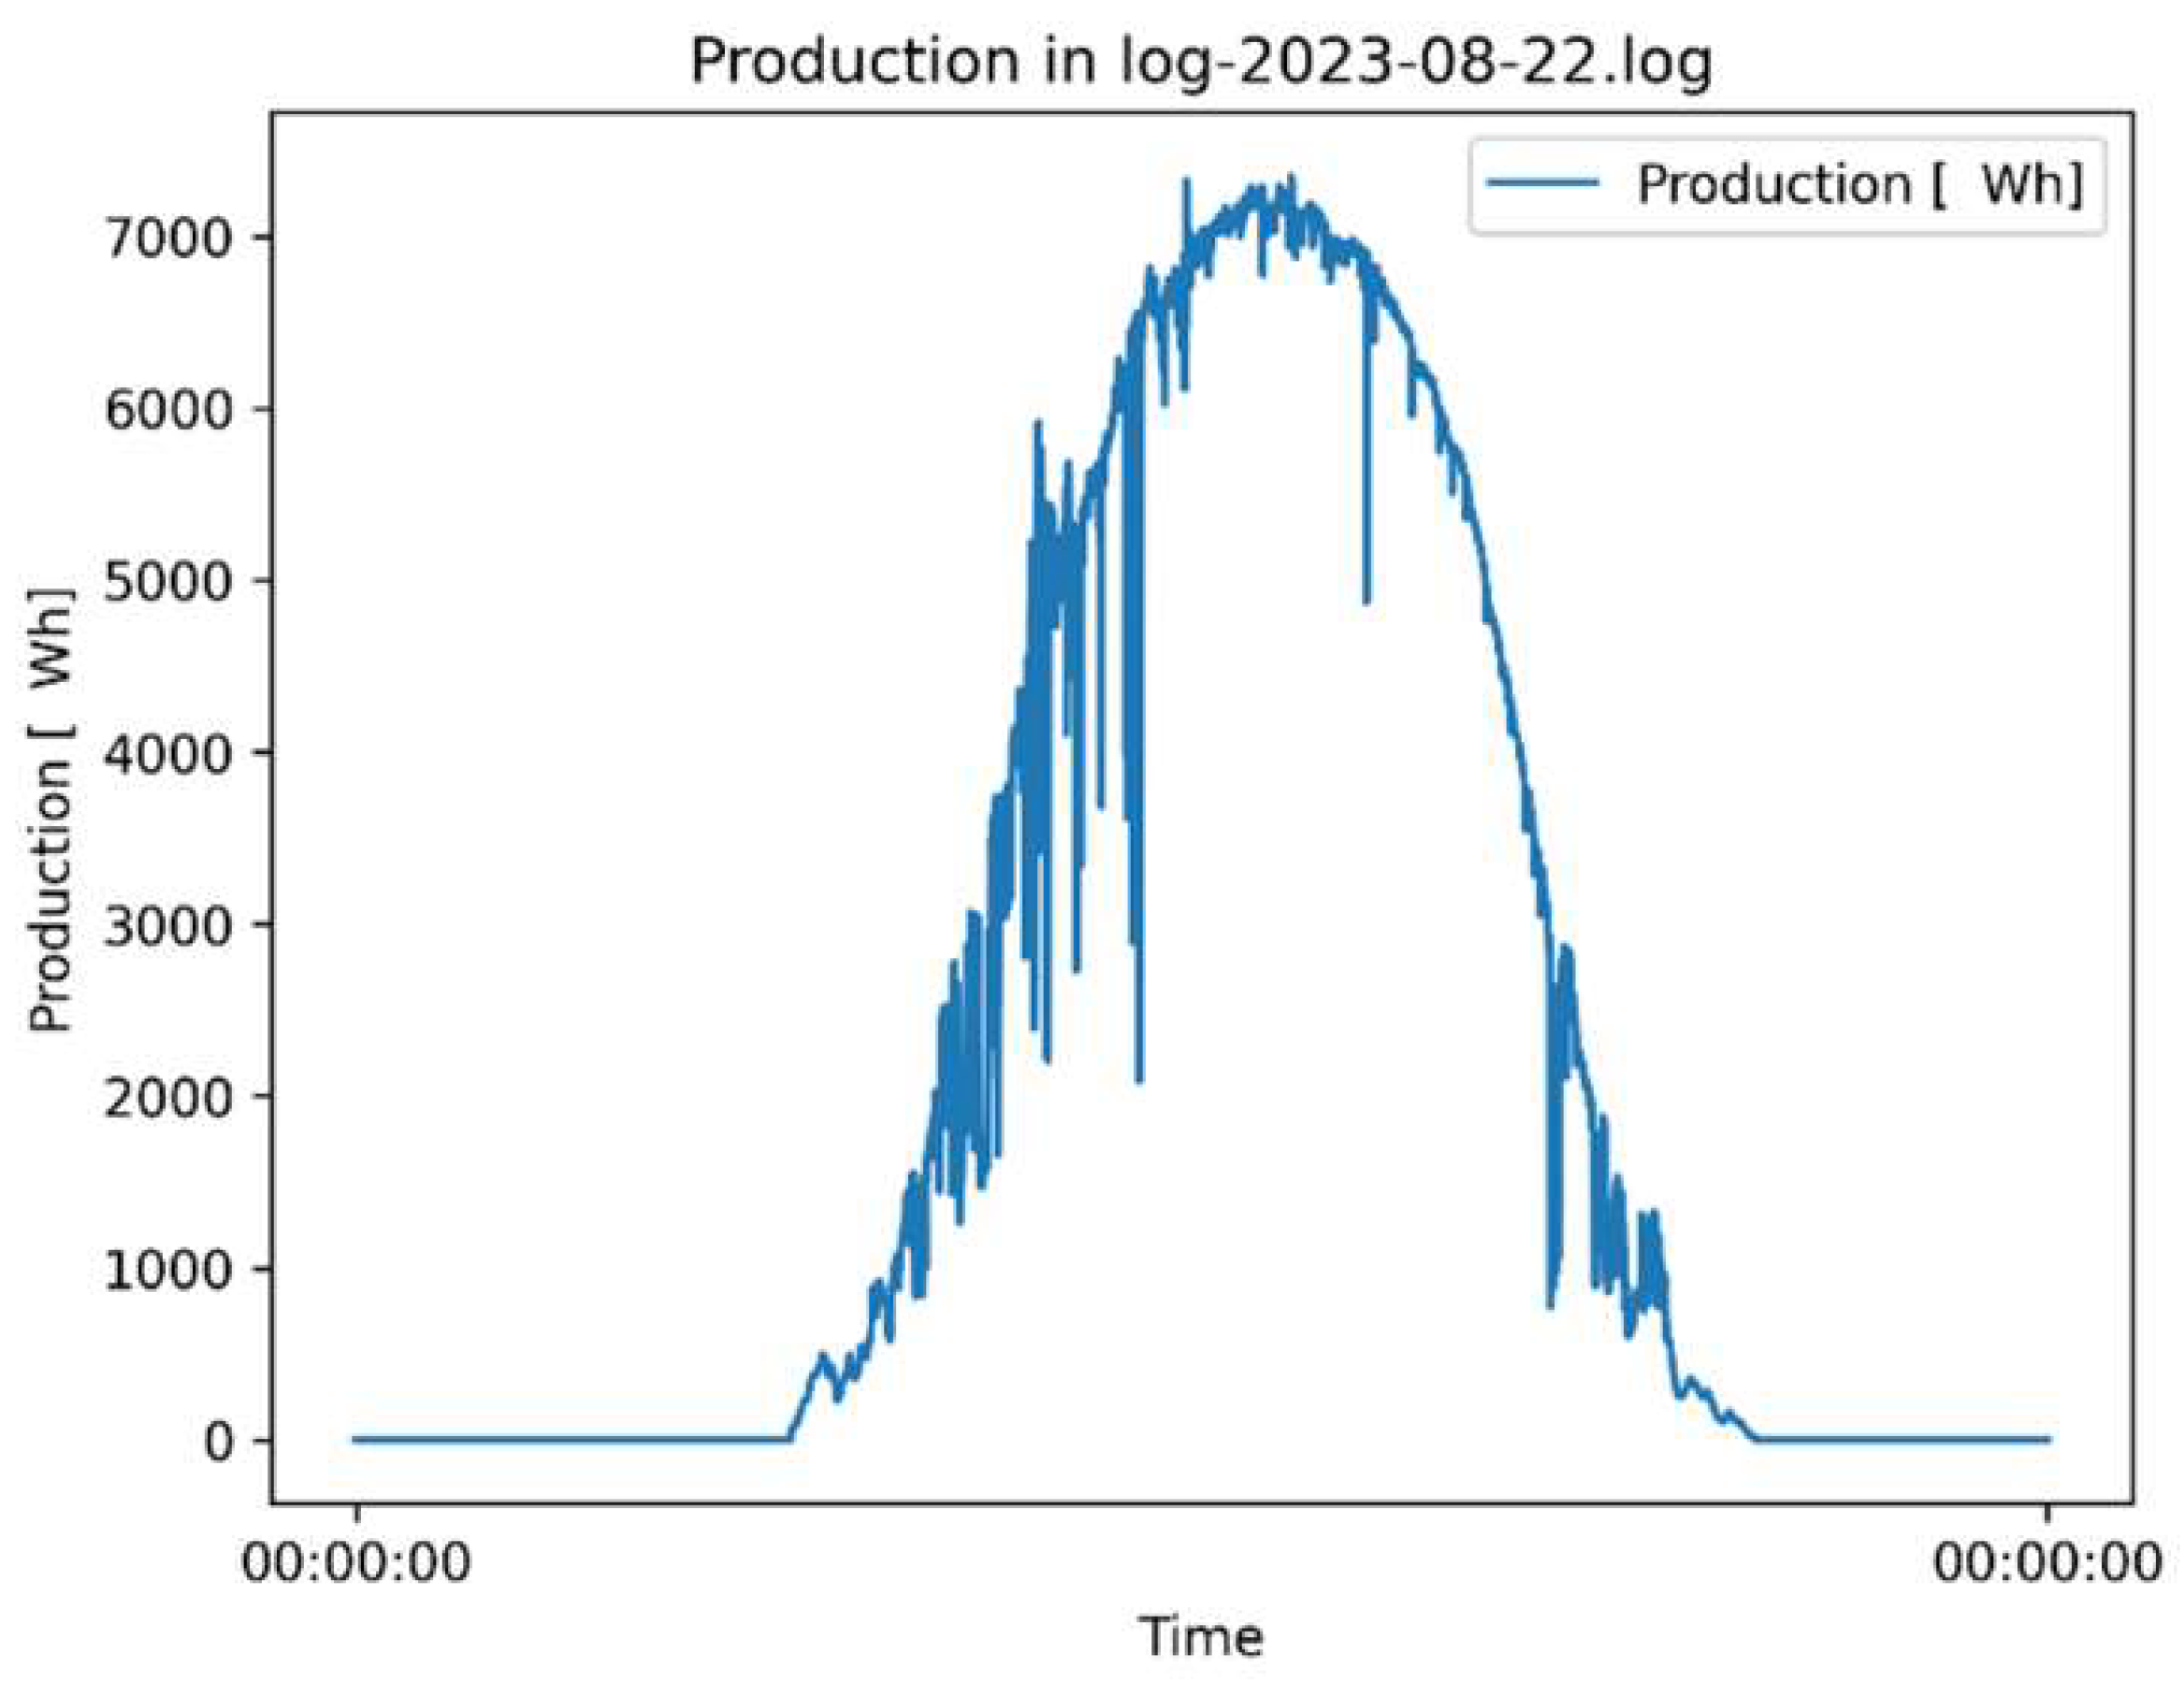
An example of a detailed analysis of production charts from two atmospherically comparable days, is a study for a disabled system on 11 August 2023. The system recorded as many as 16 shutdowns (this is the highest result in terms of the number of shutdowns), which translated into a loss of almost 9 kWh that, in the case of a hot and sunny day, amounted to 20.2% of the total production on that day (42.72 kWh). It is worth comparing this day to a similar one regarding atmospheric conditions and weather (i.e., 22 August 2023, where the production amounted to 52.36 kWh). On this day, thanks to the system’s operation, it was possible to avoid shutdowns of the photovoltaic installation. A comparison of both days in terms of weather is as follows (i.e., for 11/08 versus 22/08): UV index: 6.5/6.4; wind: 2.8/2.1; visibility: 10 km/10 km; cloud cover: clear sky/clear sky; precipitation: 0 mm/0 mm. The production chart for the first mentioned days is depicted in
Figure 7.
In the case of the second analyzed day (22/08), when the system preventing shutdowns of the installation was turned on, the production chart is shown in
Figure 8.
Figure 8 shows that the photovoltaic installation, despite very high production, has not been shut down. The graph also shows the impact of the system’s operation on voltage reduction, which directly affects the decrease in the nominal value of energy production. However, it must be admitted that it was an exceptionally favorable day for the system, considering the situation in the power grid—the average voltage repeatedly approached 253 V but was never reached.
Number of Shutdowns Summary
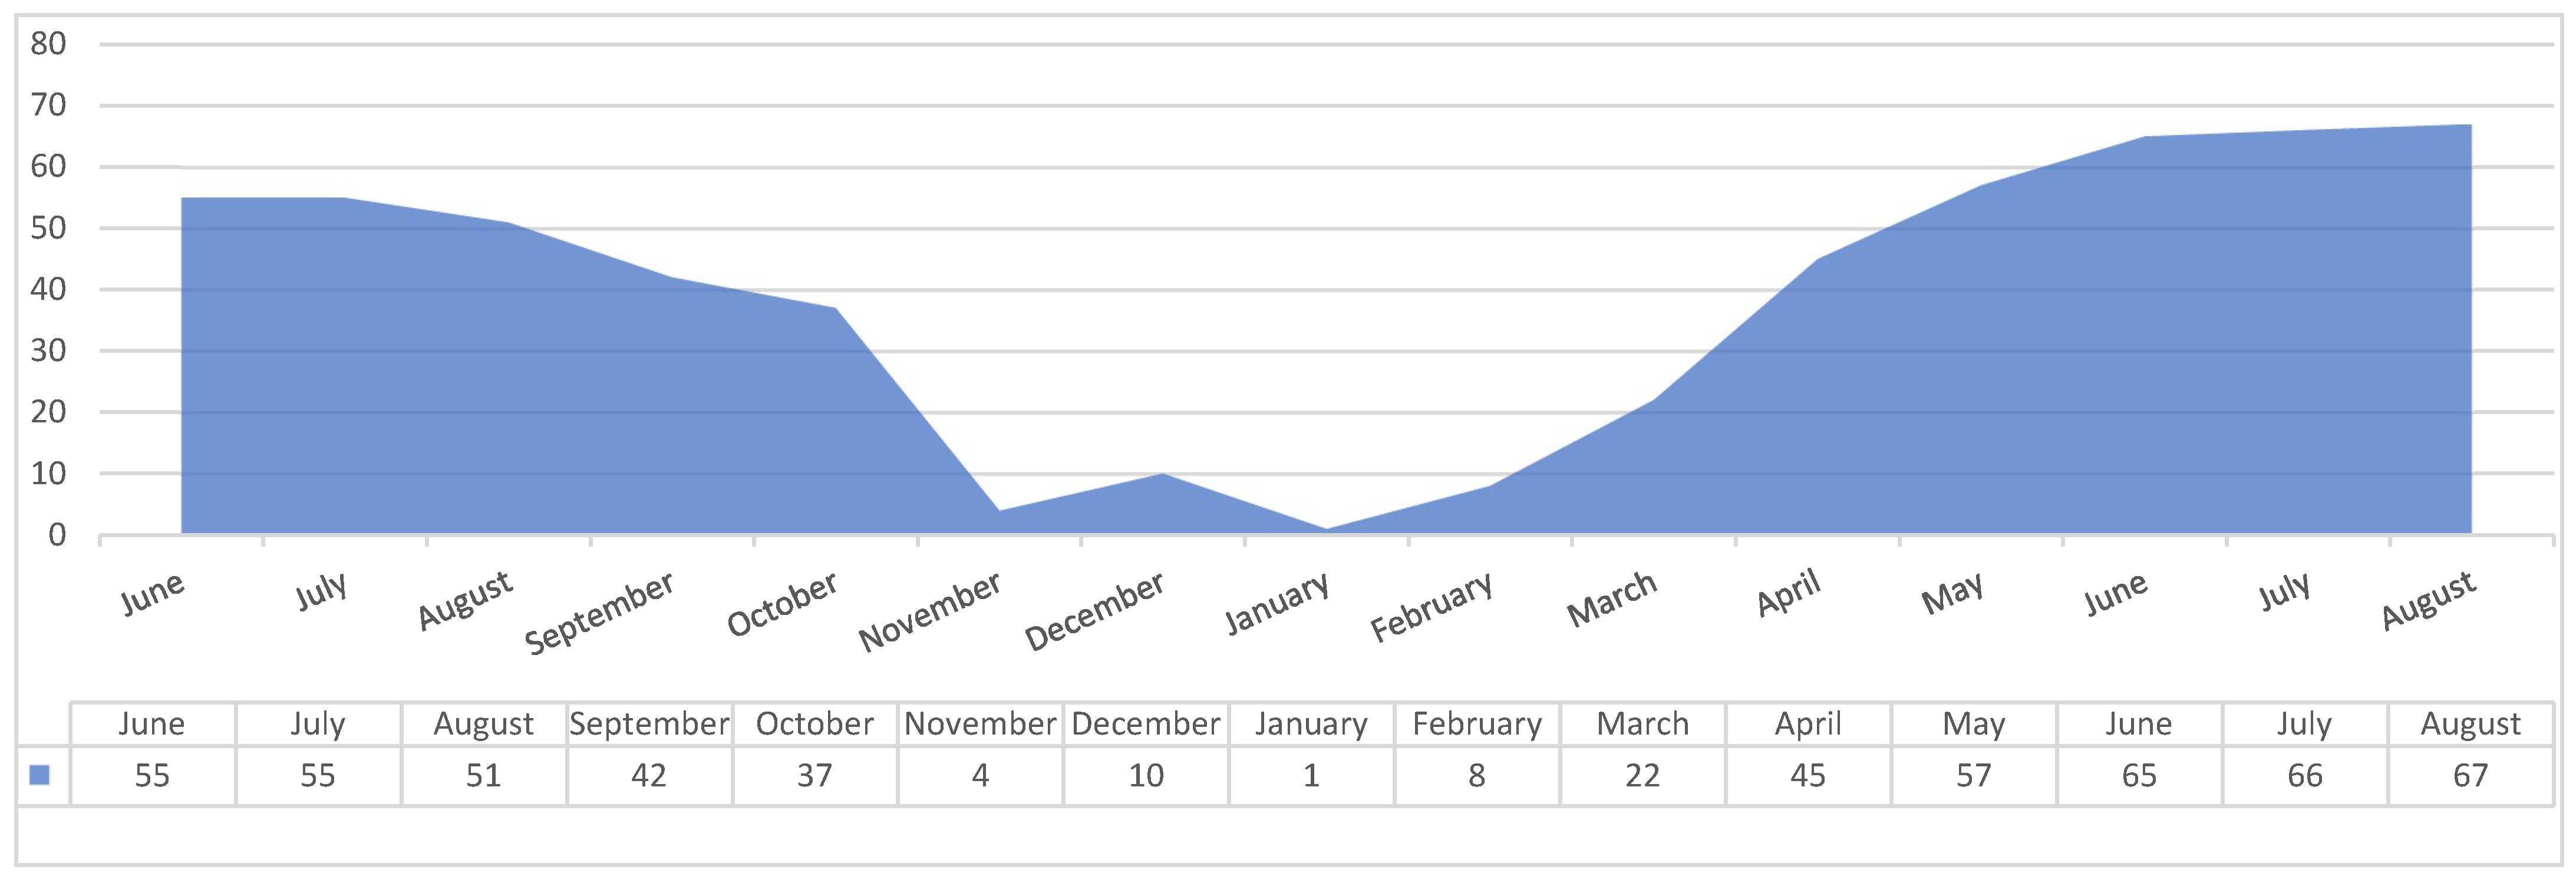
Because the system was temporarily turned on and off during the acquisition, it was possible to prepare a percentage determination of the number of shutdowns observed in relation to all shutdowns. This base value was used as a reference value, i.e., 100%. It is noteworthy that, in different months of the year, the production from the photovoltaic installation is different, which makes it impossible to compare the operation of the system, e.g., in January or February, when there are several shutdowns per month, e.g., for August, when the number of shutdowns is the largest and reaches up to a dozen a day. The number of shutdowns was counted based on all of the data, and a summary was prepared, represented by
Figure 9.
Figure 9 shows several trends that affect the operation of the entire photovoltaic installation. The first is the noticeable seasonality of the problem—i.e., the shutdowns, especially in the winter—when they almost do not occur (there are no shutdowns for four months a year, or there are fewer than 10 of them). The second important piece of information that can be seen in this chart, which is covered by many industry media, is the constantly growing problem of shutdowns i.e., a year-on-year increase of about ten shutdowns per month. This is due to the constantly growing number of home photovoltaic installations, which do not go hand-in-hand with the modernization of the network. It is also noteworthy that additional shutdowns in the winter season appeared during the Christmas period, most likely due to low power consumption by companies, which increased network voltage and, in sunny and frosty weather, led to quick but short-lived increases in network voltage.
5. Analysis of Consumed Electricity
An essential aspect of the conducted research was the acquisition of electricity consumed on an ongoing basis by the DHW heaters for each connected power phase. Thus, during the 15 days in question, the system contributed to the consumption of an additional 3.38 kWh of electricity. It should be noted, however, that even considering the sum of energy lost due to the shutdowns that occurred (i.e., 10.24 kWh) and the energy consumed by the heaters, the total loss is 13.62 kWh, compared to over 30 kWh that was lost without the system operating. It should also be noted that this energy, although consumed in the case of the installation in question, would still be used for the same purpose (i.e., the DHW).
An analysis, such as the one above, was performed for all related periods during the research year. The result is a summary in which the obtained outcomes are averaged and presented annually (considering energy production and the number of shutdowns in one calendar year), allowing for a determination of the effectiveness of the proposed solution and providing conclusions for further research (providing conclusions for further research (
Table 6)).
Based on the statistics, it can be determined that (in the assumed monitored period of 1 year) the system’s operation allowed for a reduction in the number of shutdowns by 2/5. Considering the operation of the heaters, i.e., the total energy balance (assuming that the operation of the heaters is considered a loss), the difference in energy losses was approximately 1/4 in favor of the operation of the system. For the discussed installation, in the context of year-round production (at the level of less than 10,000 kWh), the annual loss caused by shutdowns constitutes over 5% of this value.
The last stage of the analysis was to translate the received data into a payback period of the investment. For this purpose, assumptions were made that coincide with the current market purchase prices of the devices used (i.e., RPi, heaters, and smart plugs), which is around USD 185, and the current price of electrical energy, rounded to PLN 1/kWh (USD 0.23) (the current price of the energy itself is lower and amounts to approximately PLN 0.85, but the construction of the tariffs require the addition of other components, maintenance fees, energy transfer, etc.; therefore, its precise determination without further assumptions is impossible). Thus, it was determined that if the system were used without considering the electricity costs (i.e., energy consumed by heaters to heat DHW), this period would be 3.63 years. If the consumed electricity is also considered in the calculations, this period will be extended to approximately seven years. Accounting for the payback time of the photovoltaic installation, estimated at 10–15 years, it can be concluded that, in both cases, such a solution will have a positive impact on profitability by shortening the payback period of the investment in the photovoltaic installation in a preferred variant by almost 100 days; in addition, not using any system extends the payback period by nearly 300 days. The total energy loss assuming a 15-year investment period will be—without using the system—7725 kWh, which is less than a year of operation of such an installation. Taking into account the current electricity costs (forecasts of which are constantly rising) this works out to USD 1777.
6. Summary and Conclusions
In the conducted research, the low quality of low-voltage infrastructure is shown to be a significant problem alongside a lack of appropriate mechanisms that ensure the regulation of the operation of photovoltaic installations. It has been demonstrated that investors suffer measurable losses caused by shutdowns of the photovoltaic installations. As part of the research, it was also possible to propose and verify the effectiveness of a low-cost method that reduces the number of shutdowns of photovoltaic installations for home users. However, it should be remembered that the solution in question was tailored to a specific installation. Although the conclusions from the research are clear (indicating a reduction in shutdowns by over 40%), when implemented elsewhere, the final results may differ since they are determined by factors such as the size of the installation, the heating devices used, or the quality of the low-voltage lines.
What is important from the point of view of the research conducted is the observation that the outages did not occur only on days with increased energy production (long sunny days with a high solar radiation index and average atmospheric temperature). The problem identified by the system are sudden changes, the compensation of which is extremely difficult because the voltage builds up in a small timeframe. Switching on the load too early leads to unjustified energy consumption (although it protects against an increase in the average voltage value and, consequently, switching off). Switching on too late causes the average to increase beyond the permissible limits and the installation to be shut down. An important research aspect in the case of the discussed solution will be the use of higher-power loads, which may directly contribute to an even more significant reduction in the number of shutdowns of the photovoltaic installation by more effectively reducing the voltage while reducing the number of “false positive” signals that result in the heaters being turned on at a lower voltage to flatten the voltage curve.
The proposed solution also provides additional benefits that clearly result from the solution used but have not been included in the overall work picture. First of all, it should be noted that the user of such a design system has the ability to monitor the voltage in the network on individual phases. This makes it possible not only to observe where the problem is concentrated, but also to more effectively distribute devices with a greater demand for electricity (such as induction furnaces, heating, air conditioning, electric car chargers, etc.). The second aspect is also the observation that 110 kWh of energy has been converted, i.e., it does not directly constitute a loss, because otherwise domestic hot water would have to be produced in perhaps a more energy efficient but different way.
To summarize, solutions relating to increasing auto-consumption, especially in periods of high energy production, will play a very important role not only in the context of increasing the profitability of the photovoltaic installations but also in the long term use of similar solutions in “smart grid” networks defining, for example, the current quota rates for electricity consumption, which may result in lower bills by limiting the energy supply at unfavorable (low or negative) rates. It should also be remembered that although the proposed solution noticeably eliminates the problem, it does not reach its origins, which unfortunately lie with the electricity network operators.
