Article

Study on the Thermal Field of a Hydro-Generator under the Effect of a Plateau Climate

1
Faculty of Metallurgical and Energy Engineering, Kunming University of Science and Technology, Kunming 650093, China
2
Kunming Electric Machinery Factory Limited Liability Company, Kunming 650100, China
*
Authors to whom correspondence should be addressed.
Energies 2024, 17(4), 932; https://doi.org/10.3390/en17040932
Submission received: 16 January 2024 / Revised: 12 February 2024 / Accepted: 15 February 2024 / Published: 17 February 2024
(This article belongs to the Section J: Thermal Management)

Abstract

:
With the advancement in the developmental project on the lower reaches of the Yarlung Tsangpo River, the influence of the plateau climate environment on the performance of a hydro-generator has received more and more attention from researchers. This study numerically simulated the thermal field of a hydro-generator with a 20 MW capacity under the effect of a plateau climate. Ambient pressure and temperature are two main factors that affect the temperature distribution of the generator. In addition, temperature distributions with different speeds are also studied under a plateau climate. The results show that the generator temperature decreases with increasing air pressure and speed. The generator temperature increases linearly with increasing ambient temperature. Among them, when the pressure lies in the range of 25–85 kPa, the temperature change gradient of the stator structure is very large. The temperature difference gradually decreases with the increase in air pressure. The temperature gradient gradually slows down when the air pressure is above 85 kPa. When the pressure is located at 55–85 kPa, the average temperature difference of the stator windings is 6.325 °C, and the average temperature difference of the stator core is 3.815 °C. Finally, the temperature distribution pattern can provide a basis for staff in different barometric pressure regions. It can also improve the safety and reliability of the hydro-generator under the effect of a plateau climate, which is important for improving its integrated hydraulic performance.

1. Introduction

With the continuous growth in global energy demand, hydropower has played an increasingly important position as a clean and renewable energy source. The hydro-generator, which is driven by water turbines, is an essential piece of power generation equipment in the hydropower industry. In addition to providing reliable electricity to the power grid, the hydro-generator also plays a crucial role in peak load regulation. It contributes to frequency control and serves as backup power during emergencies. Hydro-generators are widely used in remote areas for energy supply, renewable energy utilisation, eco-tourism, and environmental projects. They also play a role in educational and research activities at schools [1]. They have played a crucial role in promoting the popularisation and dissemination of clean energy, meeting energy demands, and facilitating sustainable development [2]. The characteristics of the generator temperature with the variation of parameters such as ambient pressure or temperature have been focused on by only a few researchers [3]. When the generator is in an environment that dissipates heat well, it can reach high levels of power. However, if the generator temperature remains above the operating temperature for an extended period, this can lead to undesirable effects. These effects include aging, demagnetisation, and geometric deformation of generator materials. Ultimately, these issues can greatly diminish the generator’s reliability, service life, and efficiency [4]. Therefore, studying generator temperature distribution is necessary for designing or improving efficiency.
Recently, the heat dissipation of generators has drawn the attention of more and more researchers, which could improve the efficiency during the generator’s work. The heat dissipation of the generator directly affects the formation and distribution of the temperature field. The efficient heat dissipation system is capable of timely discharging heat, maintaining a reasonable temperature range, and guaranteeing the safe operation of the generator [5]. By analysing the temperature field, the thermal design can be targeted to improve cooling efficiency, leading to better temperature control. Therefore, the relationship between the heat dissipation and the temperature field of the generator is one of mutual influence and constraint [6]. By optimising the design of the cooling system and monitoring temperature variations, the safe and efficient operation of the generator can be achieved, extending the life of the equipment. Hence, the importance of studying the temperature distribution of the generator is presented again. Regarding the improvement of heat dissipation in motors, scholars [7] have proposed such an optimisation: changing the geometrical parameters of the flow path. This optimised design configuration results in an overall improvement in heat dissipation. To further predict the temperature distribution, a new scaled model [8] of the generator is proposed that is able to predict the overheating point. In terms of the theoretical basis of the generator temperature field, scholars [9] studied the temperature field of the rotor under different incidence angles. They compared the calculated results with the experimental findings, providing valuable reference implications for future theoretical learning. In terms of research methodology, both Zhen Zhao et al. [10] and Yifei Zhou [11] used the coupling method for research and analysis. The former analysed the temperature field distribution inside the motor in the ventilation duct. The latter analysed the bearings, ventilation system, and runners of a high-speed, high-capacity horizontal hydro-generator set. The results of both studies provide a basis for the development of related hydroelectric generators. With a deeper study of these findings, two different turbulence models were comparatively analysed by DANG D-D et al. [12]. They found that the position of the rotor–stator interface significantly affects the predicted thermal performance within the air gap.
The study of the temperature field plays a key role in improving the performance of the generator. If an accurate temperature distribution is obtained, it is possible to predict the degree of use of the internal components of the generator [13], which facilitates the repair or replacement of the generator in advance. This could lead to reduced economic losses, significantly improved efficiency, and increased convenience for staff. Additionally, it contributes to enhancing generator efficiency and lowering temperature rise. The study of the hydro-generator temperature field is necessary for several reasons. It helps improve efficiency, ensures safety, optimises design and maintenance, adapts to high-altitude environments, and promotes technological innovations like thermal management [14,15]. The study of the temperature field will have a profound impact on the performance and reliability of hydro-generators.
In China, the hydropower industry accounts for over 50% of the energy production in the southwestern region. The southwestern region is mostly characterised by high plateaus and mountains. Additionally, with the ongoing development of hydropower projects downstream of the Yarlung Zangbo River in the high-altitude plateau region of Tibet, the impact of the high-altitude climate environment on the performance of generators has gradually drawn attention from various researchers. In high-altitude regions, the altitude is relatively high, and the air is thin with a lower density and lower air pressure. There are significant temperature differences between day and night. The atmospheric pressure decreases with the increase in altitude [16]. A low air pressure leads to a decrease in the density and thermal conductivity, which contributes to a low heat transfer efficiency. Hence, losses of the generator increase, which might lead to temperature fluctuations. Temperature fluctuations could influence the efficiency and service life of the hydro-generator. Hence, studying the impact of the plateau environment on the performance of the hydro-generator is important and meaningful. Generator performance faces greater challenges at high altitudes due to lower air pressure and harsh ambient temperatures. However, few researchers have paid attention to the effects of high-altitude climate environments on hydro-generators. This paper will focus on considering the effect of the plateau environment on the generator temperature field.
In summary, the rotor region of large generators is currently the focus of generator temperature field studies. However, the analysis of the overall temperature field in hydro-generators is limited, especially in high-altitude regions where research on generator temperature fields is scarce. This paper aims to investigate the temperature distribution of hydro-generators in high-altitude regions. It takes into account factors like air pressure, ambient temperature, and wind speed. The overall temperature distribution characteristics of a small generator in a plateau environment are analysed using numerical simulation and experimental study. The trend of the stator temperature field was evaluated to provide a reference basis for the efficient, safe, and stable operation of hydro-generators in the plateau region. Meanwhile, the research results offer practical guidance and suggestions for the design, installation, and similar studies of hydro-generators in high-altitude areas. Furthermore, it contributes to the sustainable development of hydropower in high-altitude regions, promoting the application and popularisation of clean energy worldwide.

2. Mathematical Model

2.1. Problem Statement

This paper numerically studies the temperature distribution of a hydro-generator with a capacity of 20 MW. The hydro-generator model used in this study was obtained from a secondary hydropower plant situated on a river in Yunnan province, China. The cooling mode of this generator is forced air cooling, the main structural parameters are shown in Table 1. The local elevation difference is 4042 m, with an average elevation of 3459 m. The hydropower station studied in this paper is located on a river in the Yunnan Plateau region of China, at an altitude of 3135 m. The geographical location of the study site is depicted in Figure 1. By converting the altitude, the local air pressure is determined to be 70 kPa.
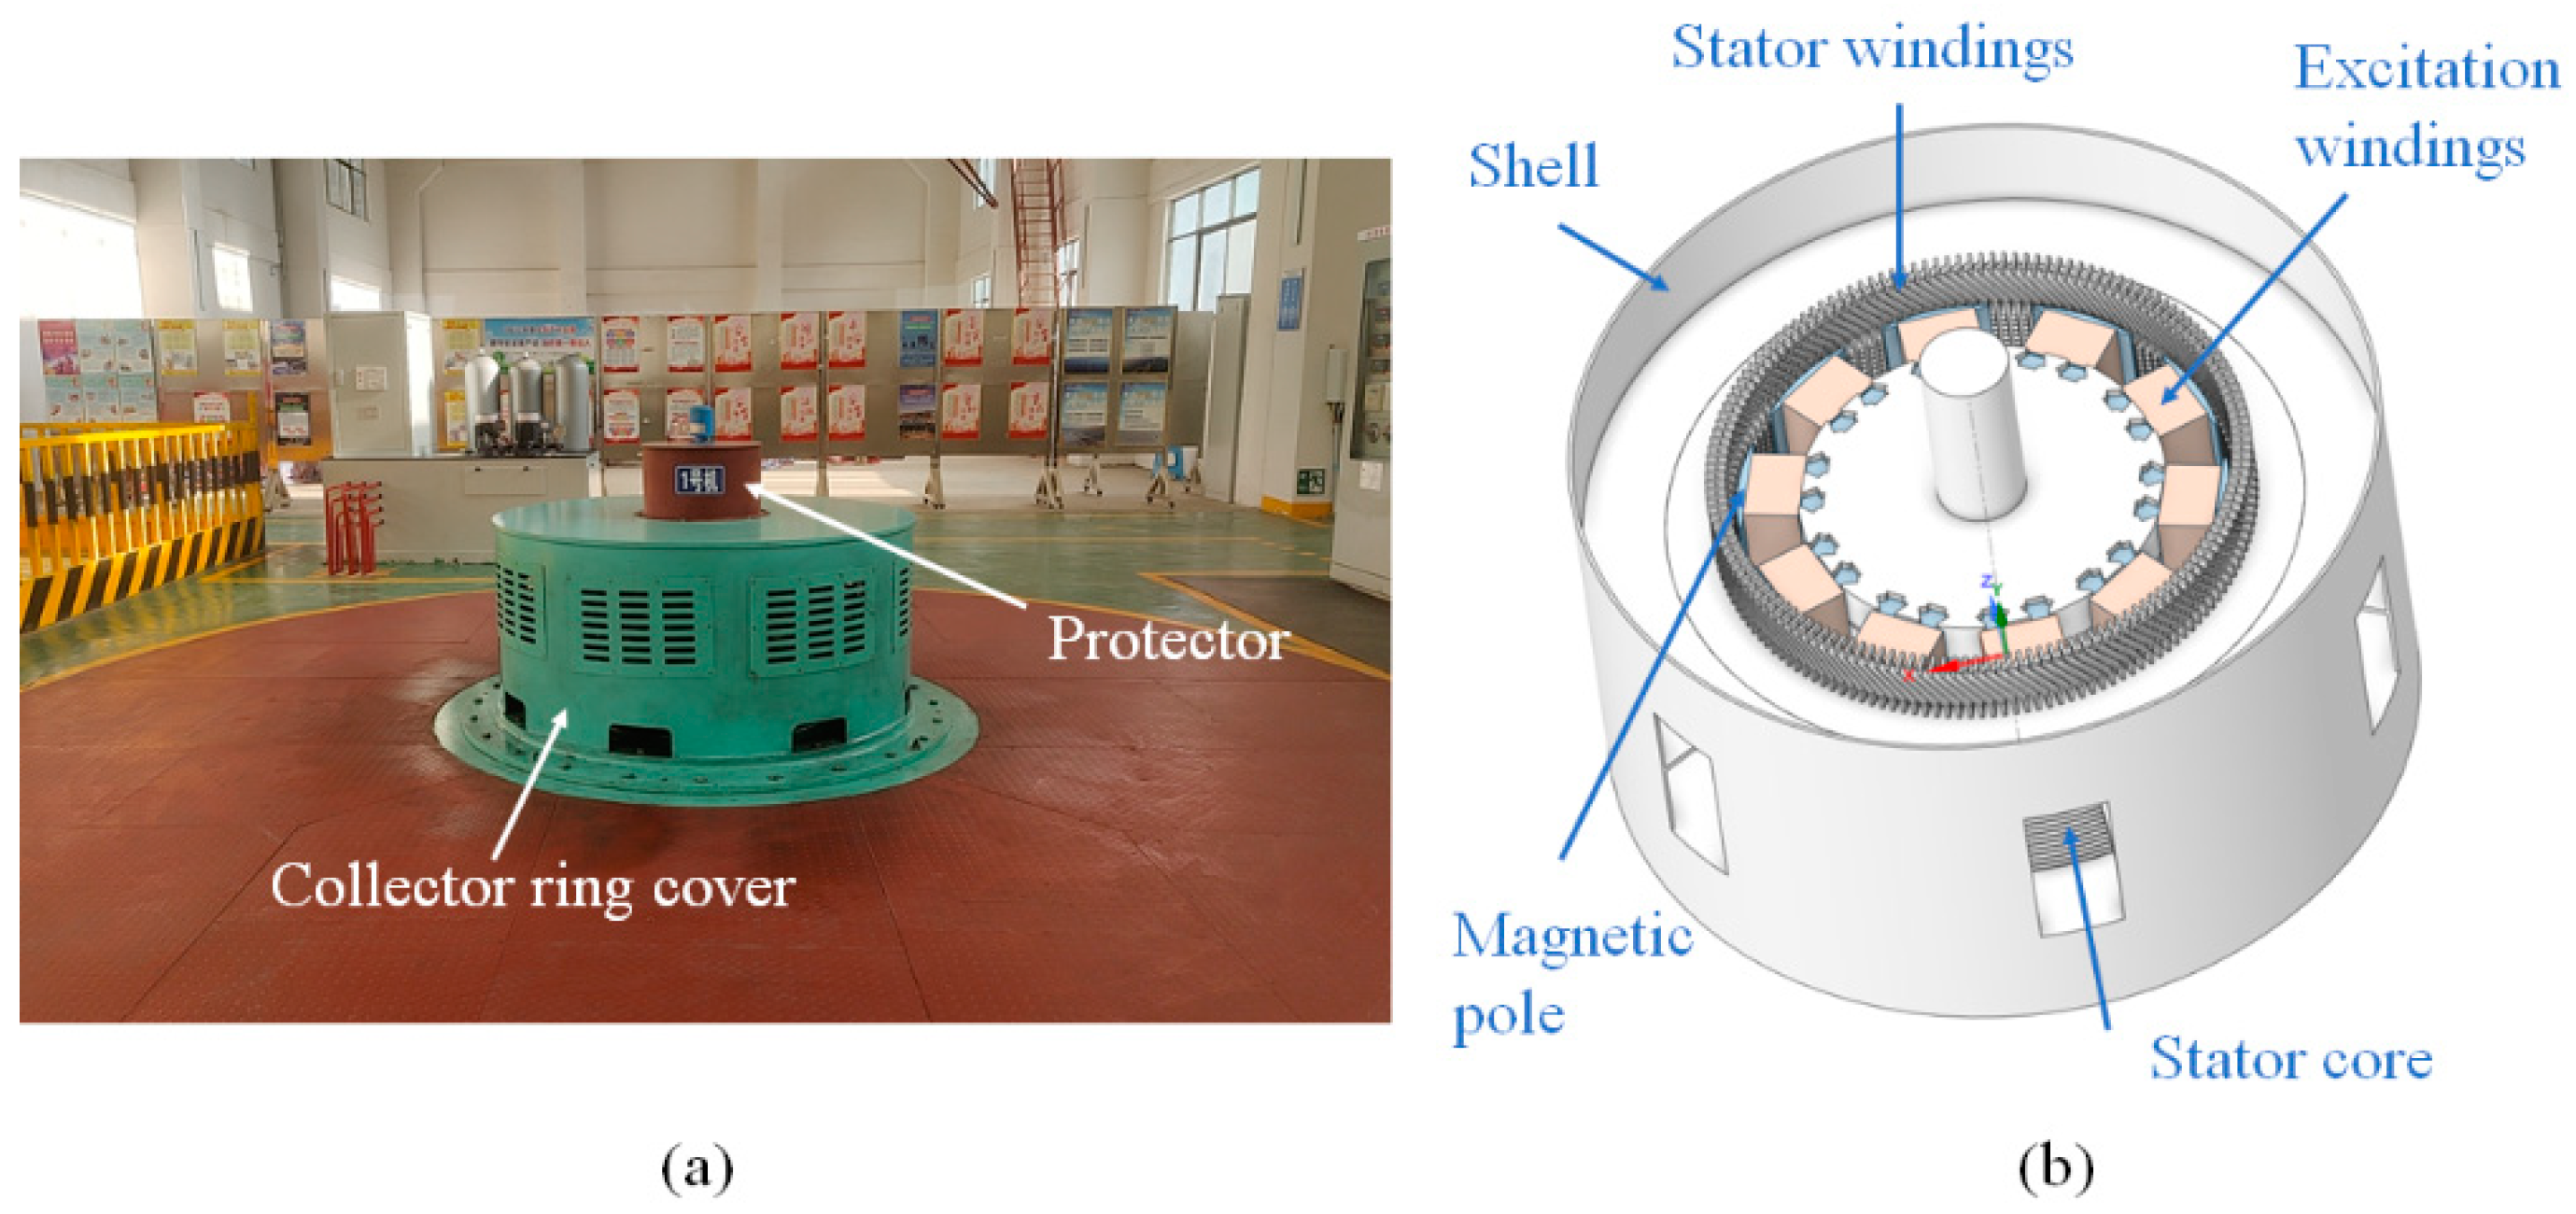
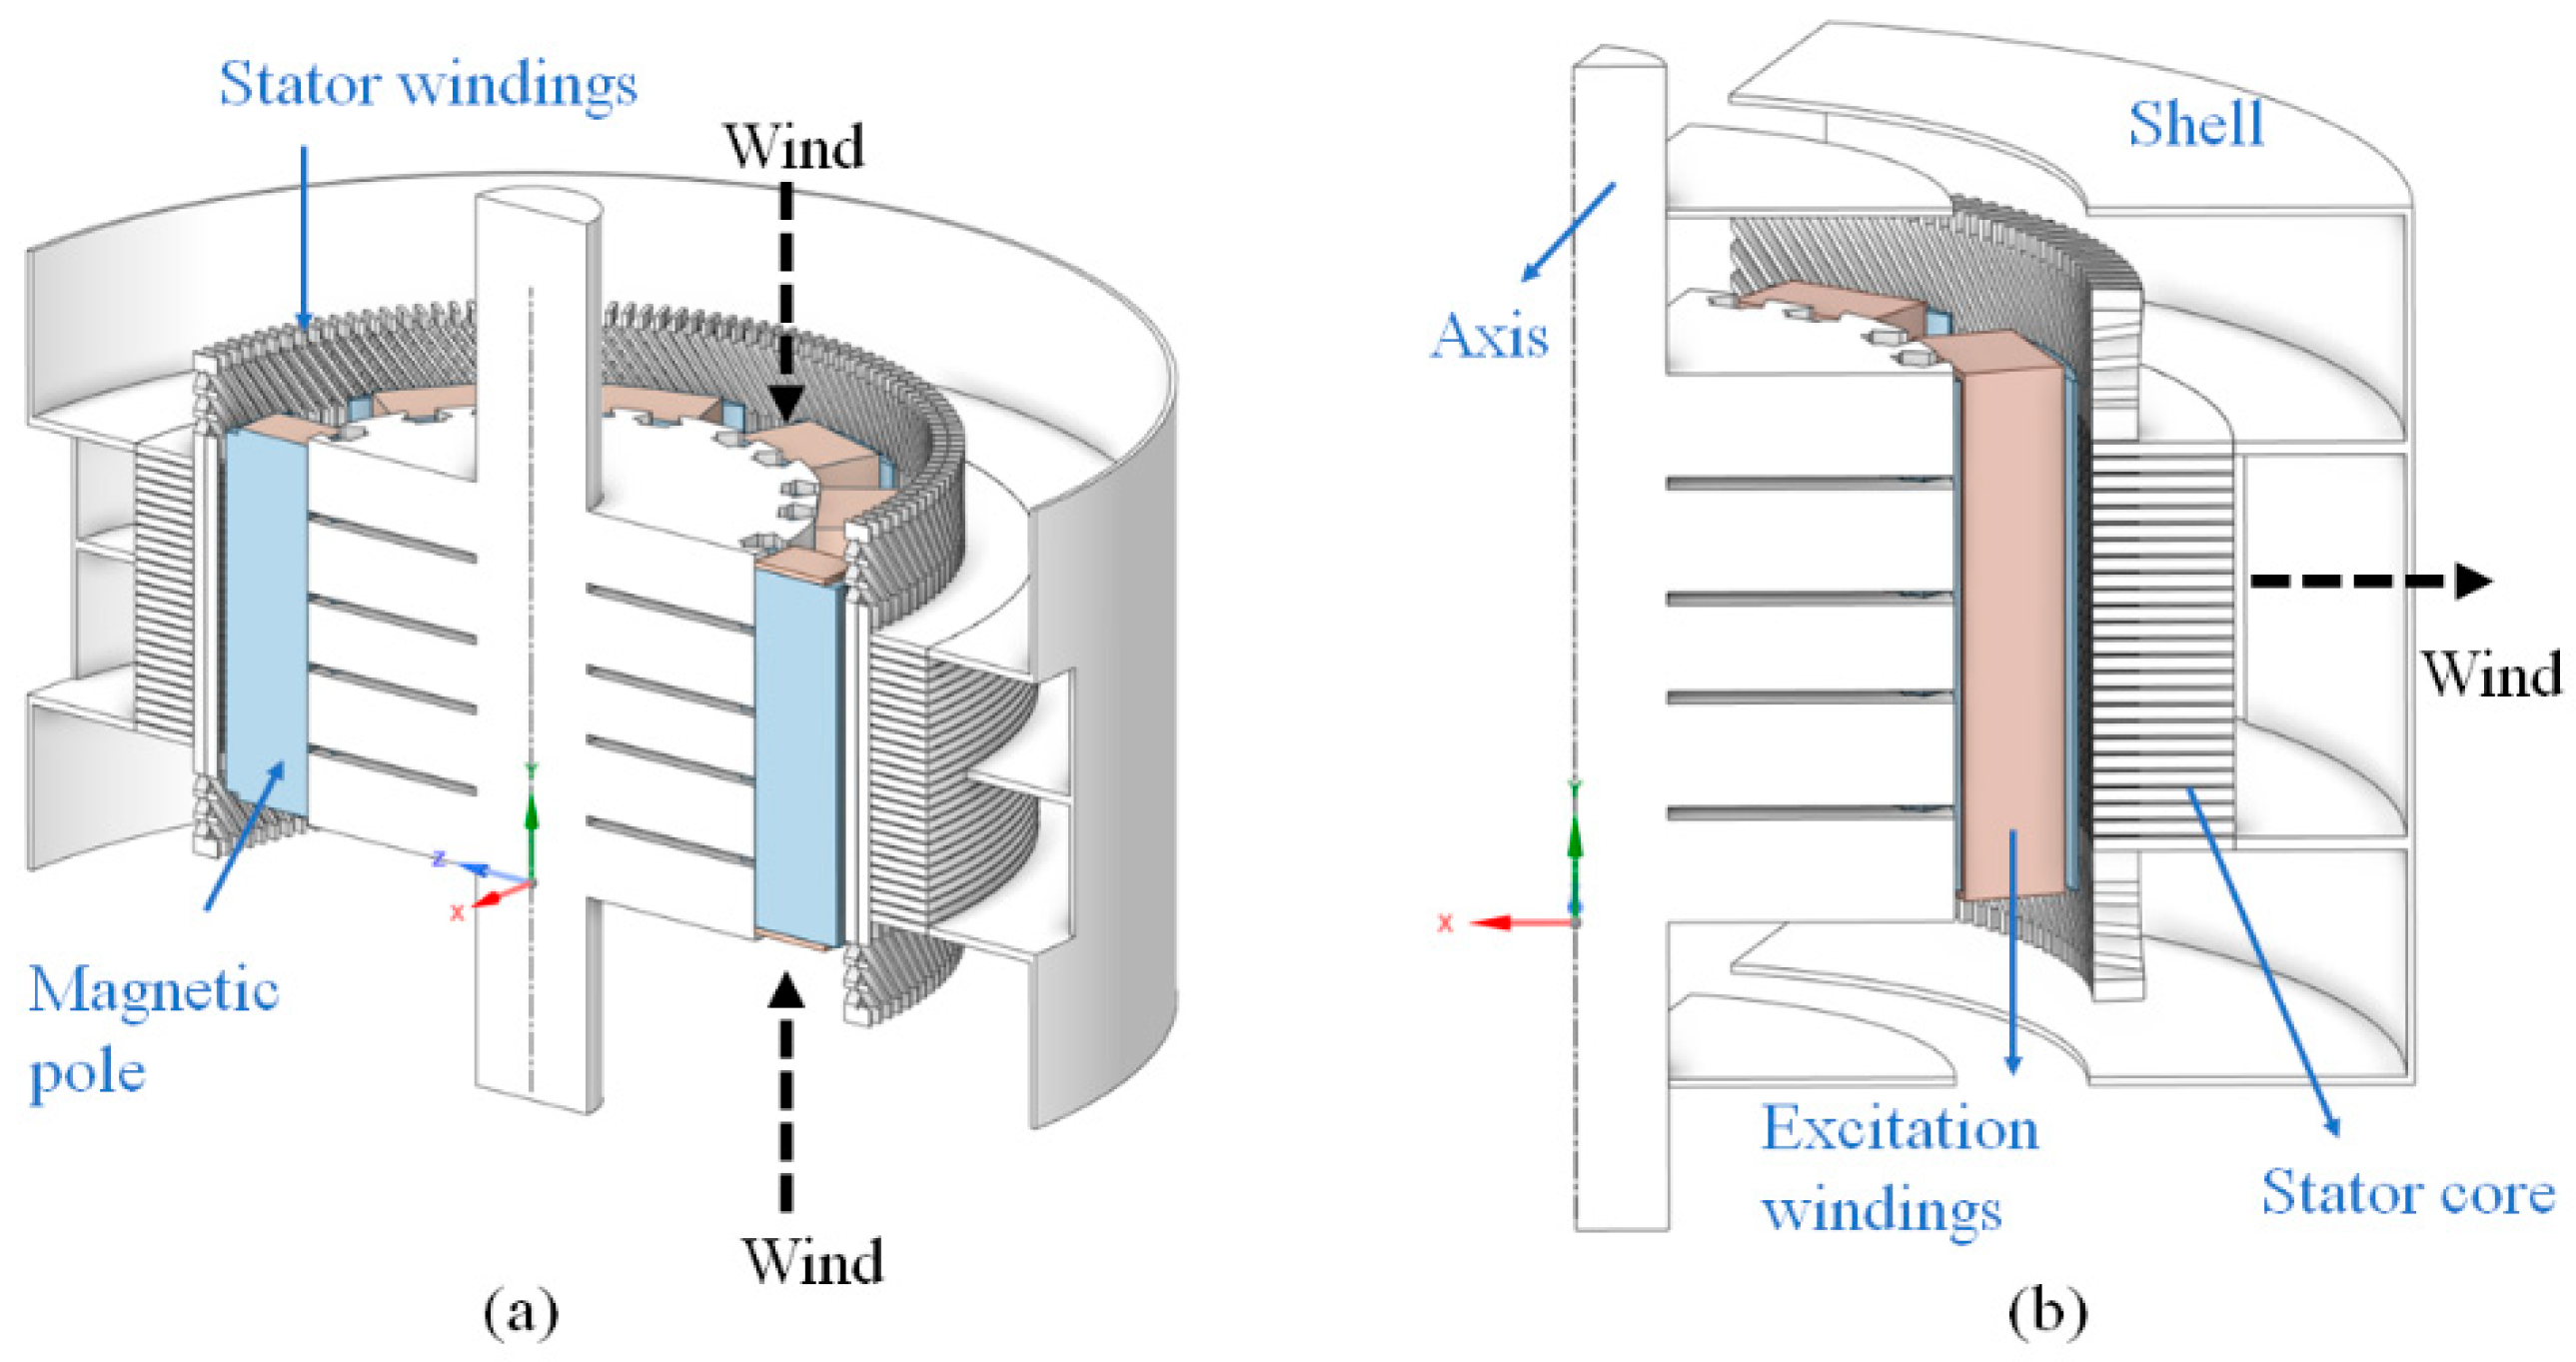
A three-dimensional model is created based on the hydro-generator field structure and drawing dimensions, as shown in Figure 2. The hydro-generator ventilation scheme studied involves the use of an air cooler for heat exchange and cold air stabilisation. This system utilises a closed dual pathway radial direction ventilation system. Cold air from the air cooler enters the rotor through the air gap and air ducts, with a small portion flowing through the stator winding ends. The majority of the air passes through the rotor yoke wind gutter, the pole-to-pole gap, and the air gap. It then flows through the stator air groove and the tooth pressure plate gap before being collected at the casing window and discharged.
Based on the principle of generator period symmetry and limited computational resources, this paper proposes the use of the one-fifth model as the solution domain. In this model, the generator casing and stator windings are appropriately simplified for ease of analysis [17]. The number of ventilation windows in the casing is simplified to five, and the stator windings are simplified to a single layer, as shown in Figure 3.
As the capacity of single-machine and economic and technical indicators continues to increase, it poses a great challenge to the load-bearing capacity of hydro-generator units. The operation of this generator involves the generation of temperature, speed, pressure, and other parameters. These parameters play a crucial role in influencing the operation of the hydro-generator. In this paper, the pressure and temperature of the environment on the plateau are the two main factors that affect the thermal field of the hydro-generator.
To facilitate a more distinct comparative analysis of the influence of various factors on the temperature distribution of generators, this study investigates 19 specific cases. The specific conditions for these cases are presented in Table 2.

2.2. Mathematical Formulas

When the hydro-generator is in operation, the rotor rotates at a high speed in relation to the stator, which is responsible for generating torque. In order to calculate the three-dimensional heat-flow coupling field of the hydro-generator, the principles of fluid mechanics, heat transfer, conservation of energy, conservation of mass, and conservation of momentum need to be taken into account. The mathematical equations of the coupling field can be expressed as shown below [18].
The energy equation is as follows:
t ( ρ E ) + ( v ( ρ E + p ) ) = k e f f T j h j J j + τ ¯ ¯ e f f v + S h
where ρ is the fluid density; E is the total energy per unit mass, including internal, kinetic, and potential energy; is the gradient operator (math.); v is the velocity vector of the fluid; p is the pressure; and T is the temperature. The sensible heat of species h j is the part of enthalpy that includes only changes in the enthalpy due to specific heat. τ ¯ ¯ e f f is effective viscous shear stress. k e f f is the effective conductivity and J j is the diffusion flux of species j . The first three terms on the right side of Equation (1) represent energy transfer due to conduction, species diffusion, and viscous dissipation, respectively. S h is a volumetric heat source and includes volumetric heat sources have been defined and the heat generation rate from chemical reactions.
The mass conservation is expressed as follows:
ρ t + ( ρ v ) = 0
where ρ is the fluid density, t is time, and v is the velocity vector.
Conservation of momentum is described by Equation (3).
t ( ρ v ) + ( ρ v v ) = p + ( τ ¯ ¯ ) + ρ g + F
where p is the static pressure, τ ¯ ¯ is the stress tensor (described below), and ρ g and F are the gravitational body force and external body forces (for example, that arise from interaction with the dispersed phase), respectively. This equation describes the conservation of momentum in a fluid. The first term on the left side represents the rate of change of momentum and the second term on the left side represents the rate of momentum transport. The first term on the right side represents the effect of pressure gradient forces, the second term represents the effect of viscous stresses, and the third term represents the effect of gravity.
The stress tensor is given by Equation (4).
τ ¯ ¯ = μ v + v T 2 3 v I
where μ is the molecular viscosity, I is the unit tensor, and the second term on the right side is the effect of volume dilation.
The generator operates for a long period, which unavoidably results in losses during operation. Losses are the primary factor that affect the temperature rise of the generator. Accurately understanding the losses in various components of the generator is fundamental to calculating the temperature field. The vast majority of losses are converted into heat, which is exchanged with the surrounding environment through various structures, eventually reaching a steady-state equilibrium [19]. According to the technical documents guiding the electrical engineering profession, generators have various categorised losses, including no-load losses, short-circuit losses, excitation losses, and mechanical losses. These categories are further broken down into losses specific to individual components. The total loss P of the generator is calculated by the following formula:
P = P c u + P c u f + P F e + P Δ + P Ω
where P c u is stator winding copper loss, P c u = 3 I 2 R . I is the current RMS value, R is the resistance value of the winding per phase, and P c u f is the rotor excitation loss, P c u f = ( I fN 2 R 2 I fN ) 10 3 . I fN is the rated current. P f e is the iron loss of the stator structure, P f e = ( K 1 G 1 B 1 P 1 + K 2 G 2 B 2 P 2 ) ( f N / 50 ) 1.3 10 3 . K 1 , K 2 are the loss increase coefficients of the stator yoke and tooth, respectively, at no-load iron loss. G 1 , G 2 are the masses of the stator yoke and tooth, respectively. P 1 , P 2 are the unit losses of the stator yoke and tooth, respectively. B 1 , B 2 are the magnetic flux densities of the stator yoke and tooth, respectively. f N is rated frequency. P Δ is any stray losses, mainly concentrated on the surface of the rotor or pole, divided into additional iron losses and additional copper losses. P Ω is mechanical loss, which is divided into ventilation losses, wind friction losses, slip ring friction losses, and bearing friction losses.
Stray losses and mechanical losses are relatively small compared to copper losses and iron losses, which are not the focus of this study. Additional iron losses such as the extra losses in the rotor damping windings and the extra losses on the rotor pole shoe surface are converted to stator core losses accordingly. Therefore, in the subsequent simulations, only the basic losses, which refer to the first three mentioned losses, are considered.
Heat can be transferred through three different methods: heat conduction, heat convection, and heat radiation. Typically, all three modes of heat transfer occur simultaneously but in many complex scenarios, thermal convection plays a major role. In this study, heat radiation is disregarded, and only heat conduction and heat convection are considered [20].
The three-dimensional steady-state heat conduction equation is expressed as follows:
q v = x λ x t x + y λ y t y + z λ z t z
where q v is the heat generation rate per unit volume, and λ x , λ y , λ z are the thermal coefficient conductivities in the direction of x , y , z , respectively.
The RNG k - ε model is adopted to simulate the turbulence in the model. The RNG k - ε model is a turbulence model widely used in computational fluid dynamics with the following specific equation expressions:
a. k equation.
( ρ k ) t + ρ k u i x i = x j α k μ e f f k x j + G k + G b ρ ε Y M + S k
b. ε equation.
( ρ k ) t + ρ k u i x i = x j α ε μ e f f k x j + G 1 ε ε k G k + C 3 ε G b C 2 ε ρ ε 2 k R ε + S ε
where G k is the turbulent energy production term due to the mean velocity gradient. G b is the turbulent energy k production term due to buoyancy. Y M represents the contribution of pulsation expansion in compressible turbulence. G 1 ε , C 2 ε , C 3 ε are empirical constants. α k and α ε are the Prandtl numbers corresponding to the turbulent energy k and the e dissipation rate, respectively. S k and S ε are user-defined source terms. Other correction parameters such as μ e f f and R ε enable the RNG k-ε model to give a better response.

2.3. Boundary Conditions

To solve the mathematical model of the hydro-generator, it is necessary to provide boundary conditions for determining the flow–solid coupling field of the hydro-generator. Through the structural model shown above, it can be seen that the top and bottom ends of the generator serve as the inlets and the circumferential direction is the outlet. The inlet of the computational model is set as the velocity inlet, and the cooling air flows uniformly and axially into the generator. The inlet velocity values are calculated based on the wind resistance characteristics and vary for different pressures. The outlet of the computational model is set as the pressure outlet, which is a standard atmospheric pressure. The solid–solid contact surface and the solid–fluid contact surface belong to the coupled wall boundary [21]. According to the generator structure and rotational properties, the two tangent surfaces symmetrical to the axial left and right centers are designated as the associated periodic boundaries [21]. Apart from the entrance, exit, and periodicity, all other contact surfaces of the computational model are considered to have a no-slip boundary.

2.4. Basic Assumptions

This paper adopts the finite volume method to conduct a thermal flow coupling study. The temperature and flow fields of a three-dimensional model of a hydro-generator are simulated. The solution utilises a segregated implicit solver based on pressure [22] and employs the RNG k - ε turbulence model. The separated implicit iteration method and coupled calculation method are chosen. In spatial discretisation, except for momentum, which is computed using the first-order upwind scheme, all other variables are computed using the second-order upwind scheme. To ensure computational accuracy, the convergence criterion for monitoring the periodicity of flow field physical quantities and equation residuals is set to be less than 10−5. However, for the energy equation, a stricter standard of 10−6 is applied. To minimise computational time as much as possible [23], a mixed initialisation is applied to the initial boundary conditions, and a reasonable number of iterative calculations is set. The temperature field is solved by the fluid heat transfer theory, which provides that the heat source, the thermal conductivity of the solid, the boundary conditions, and the fluid state are known [24].
The hydro-generator is a nonlinear device with complex structures and diverse materials. According to the principle of generator cycle symmetry [25] and the limited computational resources, reasonable simplifications and assumptions will be made for the computational area and solution process. Also, the computational accuracy of the model will be considered and the basic assumptions are as follows:
(1)
The fluid inside the hydro-generator has a large Reynolds number (Re > 2300) and its flow field is solved using a turbulent flow model [26];
(2)
Since the fluid flow velocity inside the turbine is much smaller than the speed of sound, the Mach number (Ma) is very small, Ma < 0.3, and the fluid is treated as an incompressible fluid [27];
(3)
The effects of air buoyancy and gravity in the turbine generator are ignored [28,29];
(4)
The thermal conductivity equation does not include a time term as only the steady-state of the fluid flow in the generator is studied, i.e., constant flow [26];
(5)
The losses in the tooth and yoke of the stator core are evenly distributed [29];
(6)
The air in the air gap is equated to a medium with only thermal conductivity efficacy, and the thermal conductivity is determined according to the results of the study by DANG D-D et al. [21].

2.5. Numerical Validation

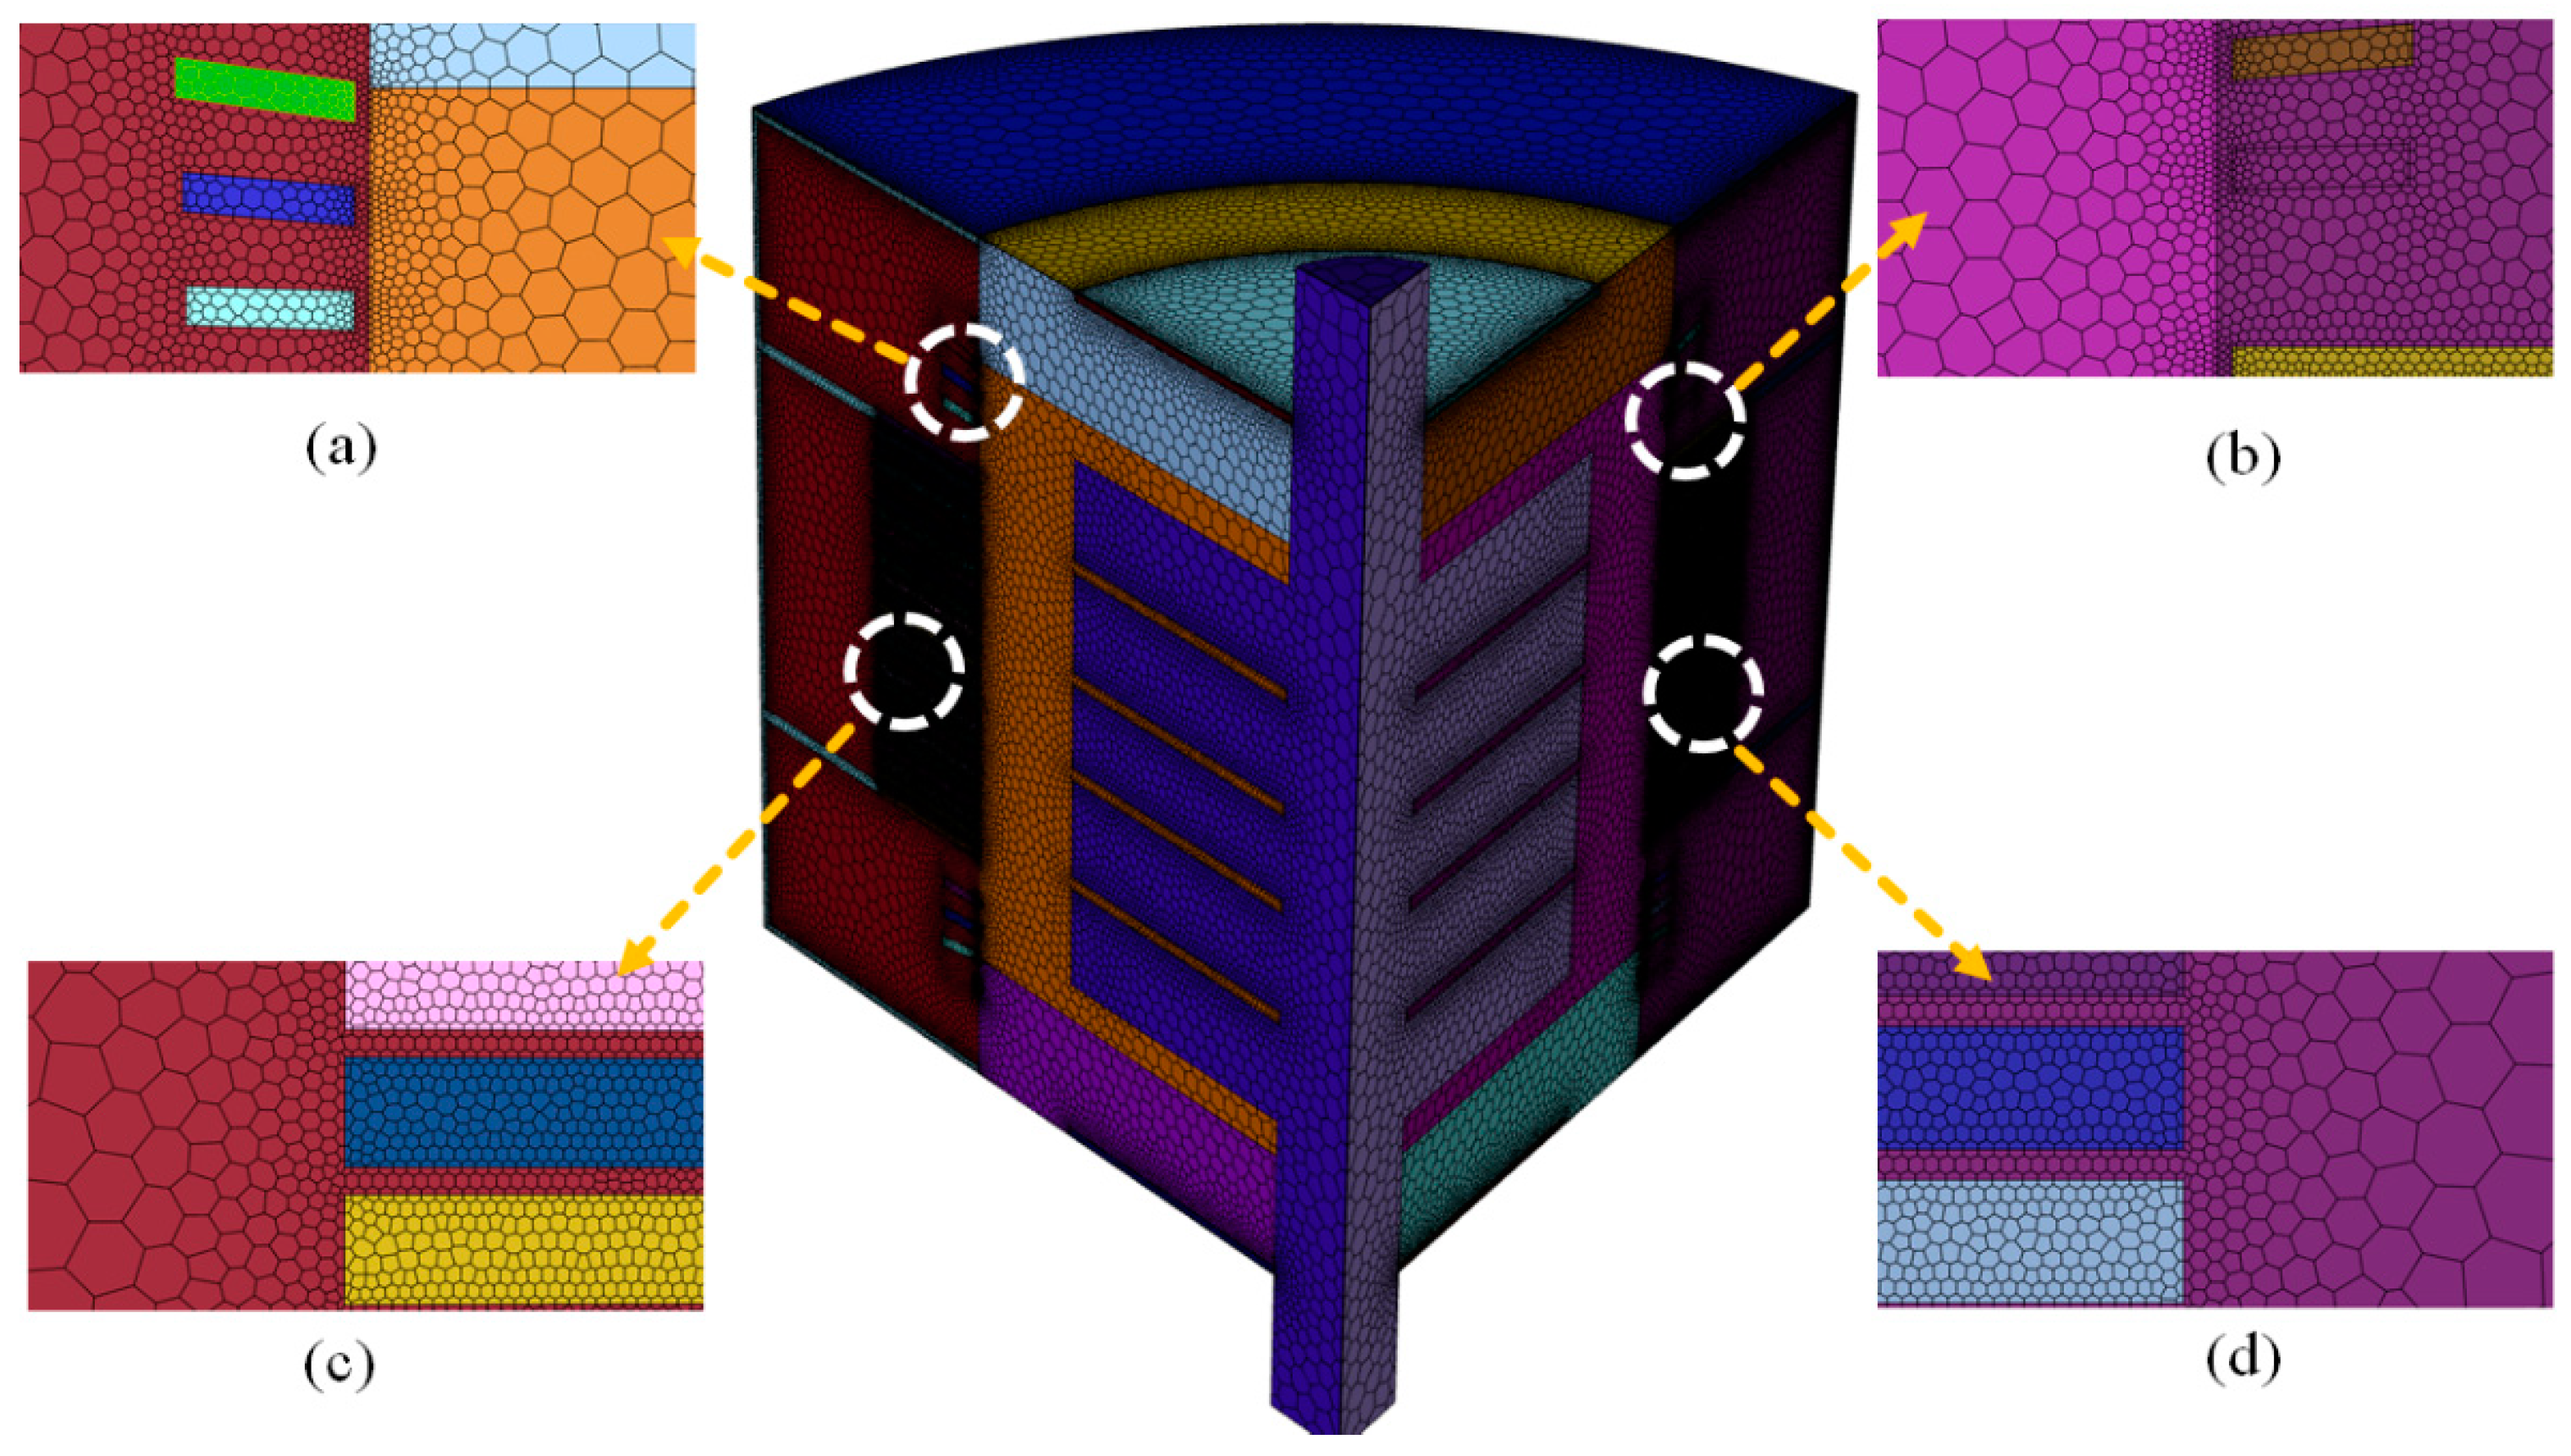
In this study, a fluid pre-processing tool was used to automatically partition the model into grids, with a maximum size of 60 mm and a minimum size of 2 mm. The generated unstructured grids have good adaptability and connectivity. For example, the ability to select the common node grids at the rotor–stator interface and the fluid–solid interface, as shown in Figure 4a,b. To reduce truncation errors and achieve better convergence, a polyhedral form was adopted during grid generation. Local refinement was also applied to complex structures, as shown in Figure 4c,d, for improved convergence. After mesh encryption, the average value of y+ on the stator structure and the surface of rotor poles is greater than 15, which satisfies the computational requirements. The standards for evaluating grid quality include minimum orthogonal quality, aspect ratio, and skewness, with values of 0.16, 75.78, and 0.6, respectively, meeting the calculation accuracy. Based on grid independence analysis, the optimal grid solution consists of 6,424,039 elements.
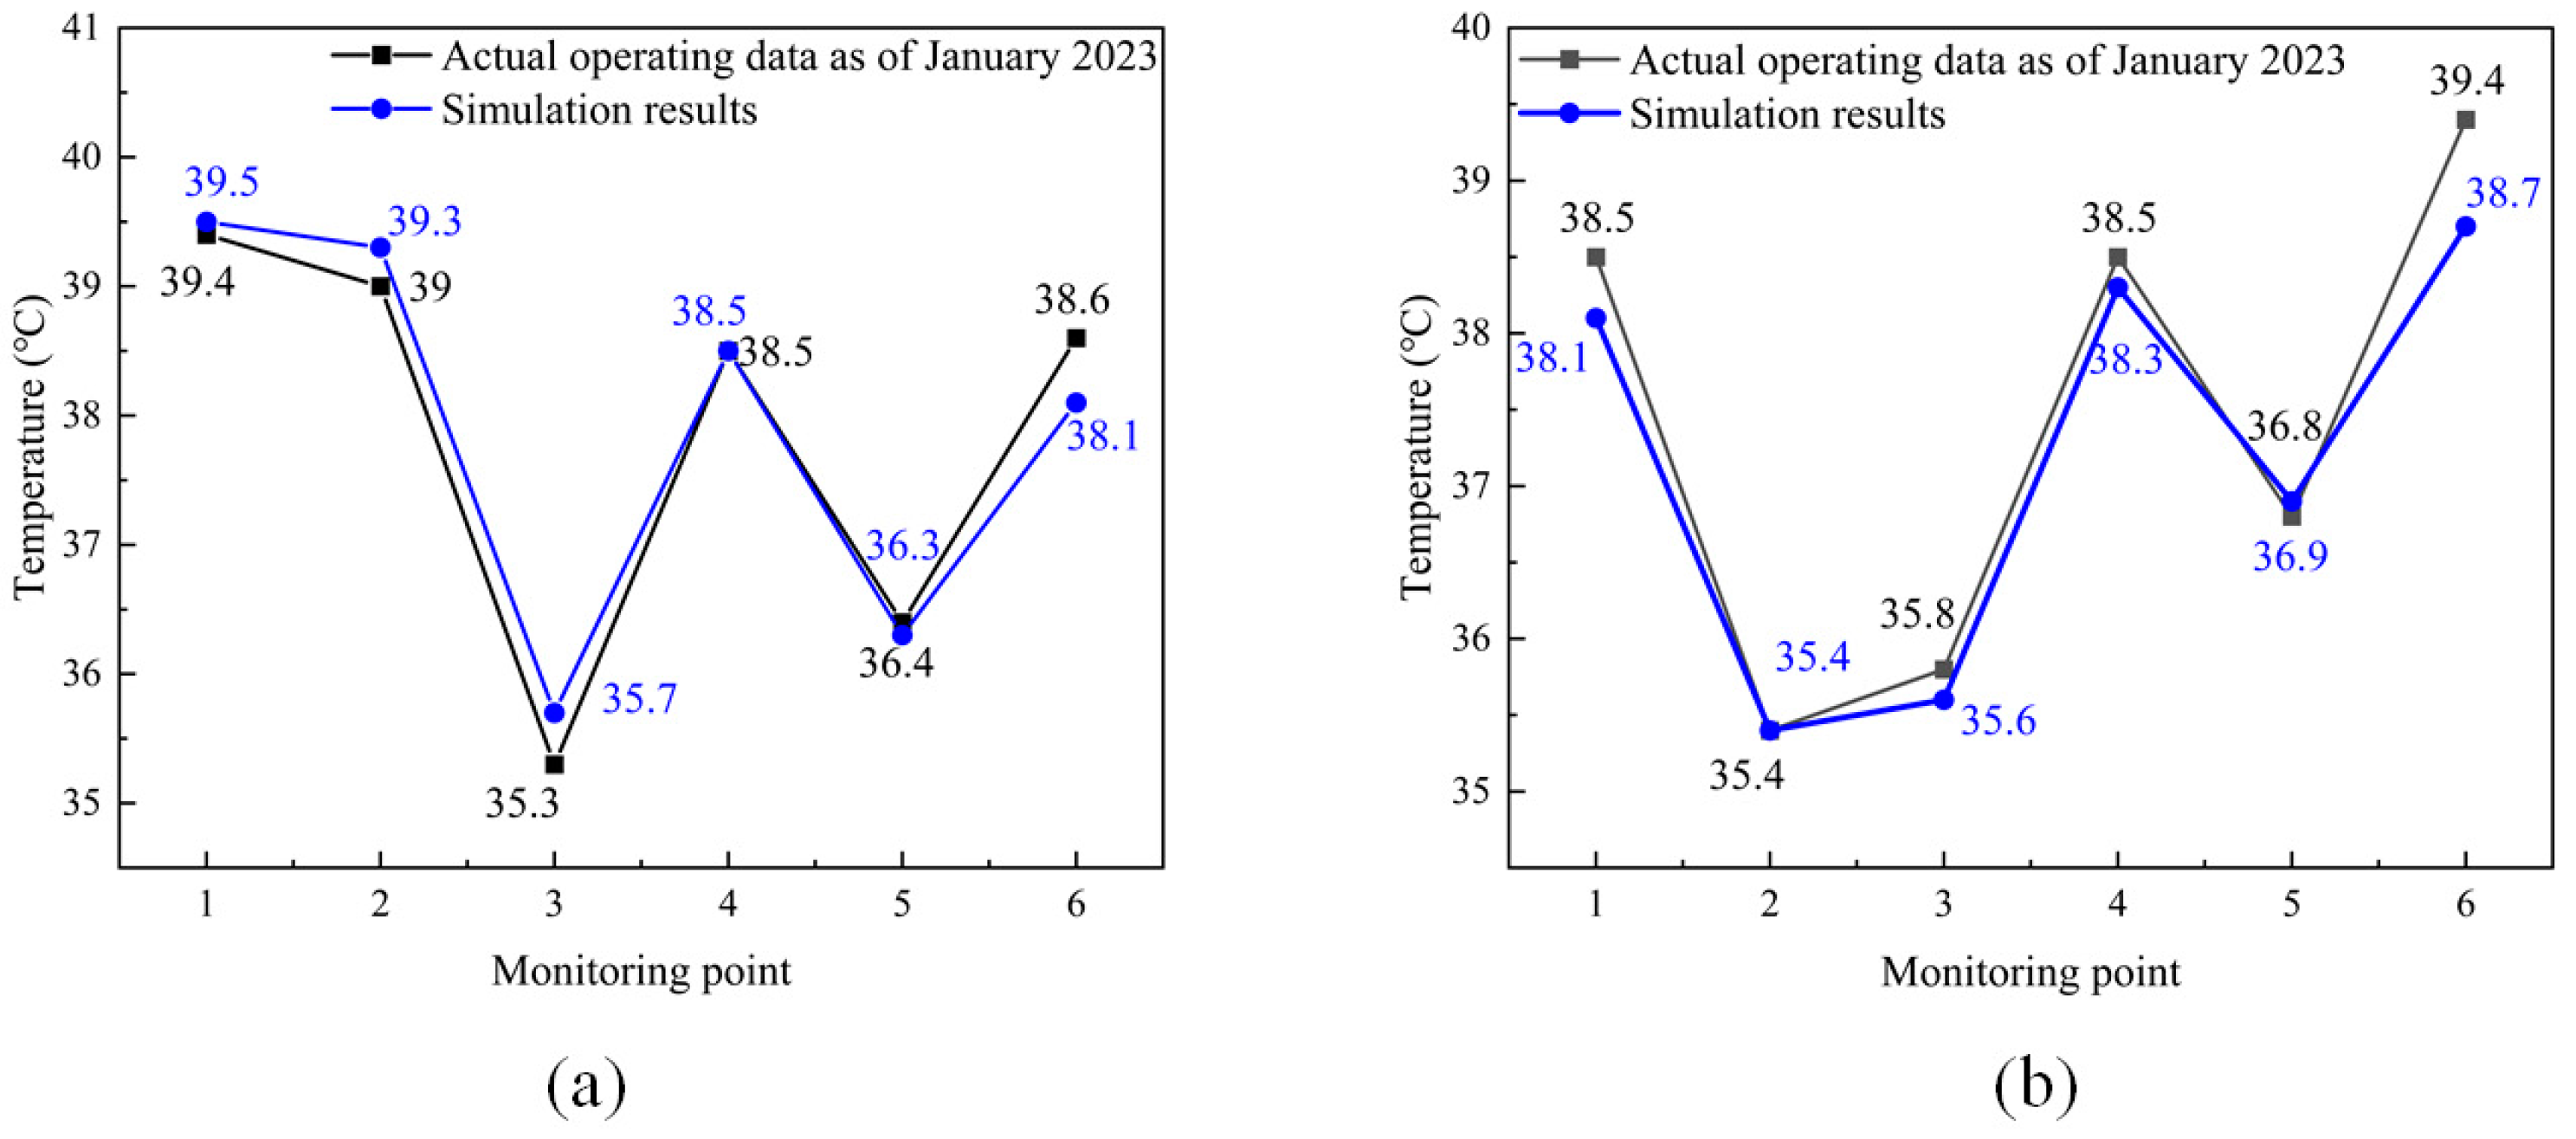
After the pre-processing is completed, the simulation is carried out. The actual temperature variations of the stator windings and stator core can be seen from the operating log of the plant, as shown in Table 3 and Table 4. The hydroelectric power plant under study is not disclosed for confidentiality and security. It is not possible to provide information on the exact location of the different points on the hydro-generator in Table 3 and Table 4. Two months of actual data provided by the power station were compared and numerically verified with the simulation data, see Figure 5 and Figure 6. From these figures, it can be seen that the relative error between the measured and the simulated values of stator windings and cores is less than 5%. The experimental data are only used for numerical validation. A deviation of less than 5% means compliance with the engineering requirements and proves that the research method is reasonable and correct.

3. Discussion and Results

3.1. Temperature Distribution of Generators at Different Air Pressures

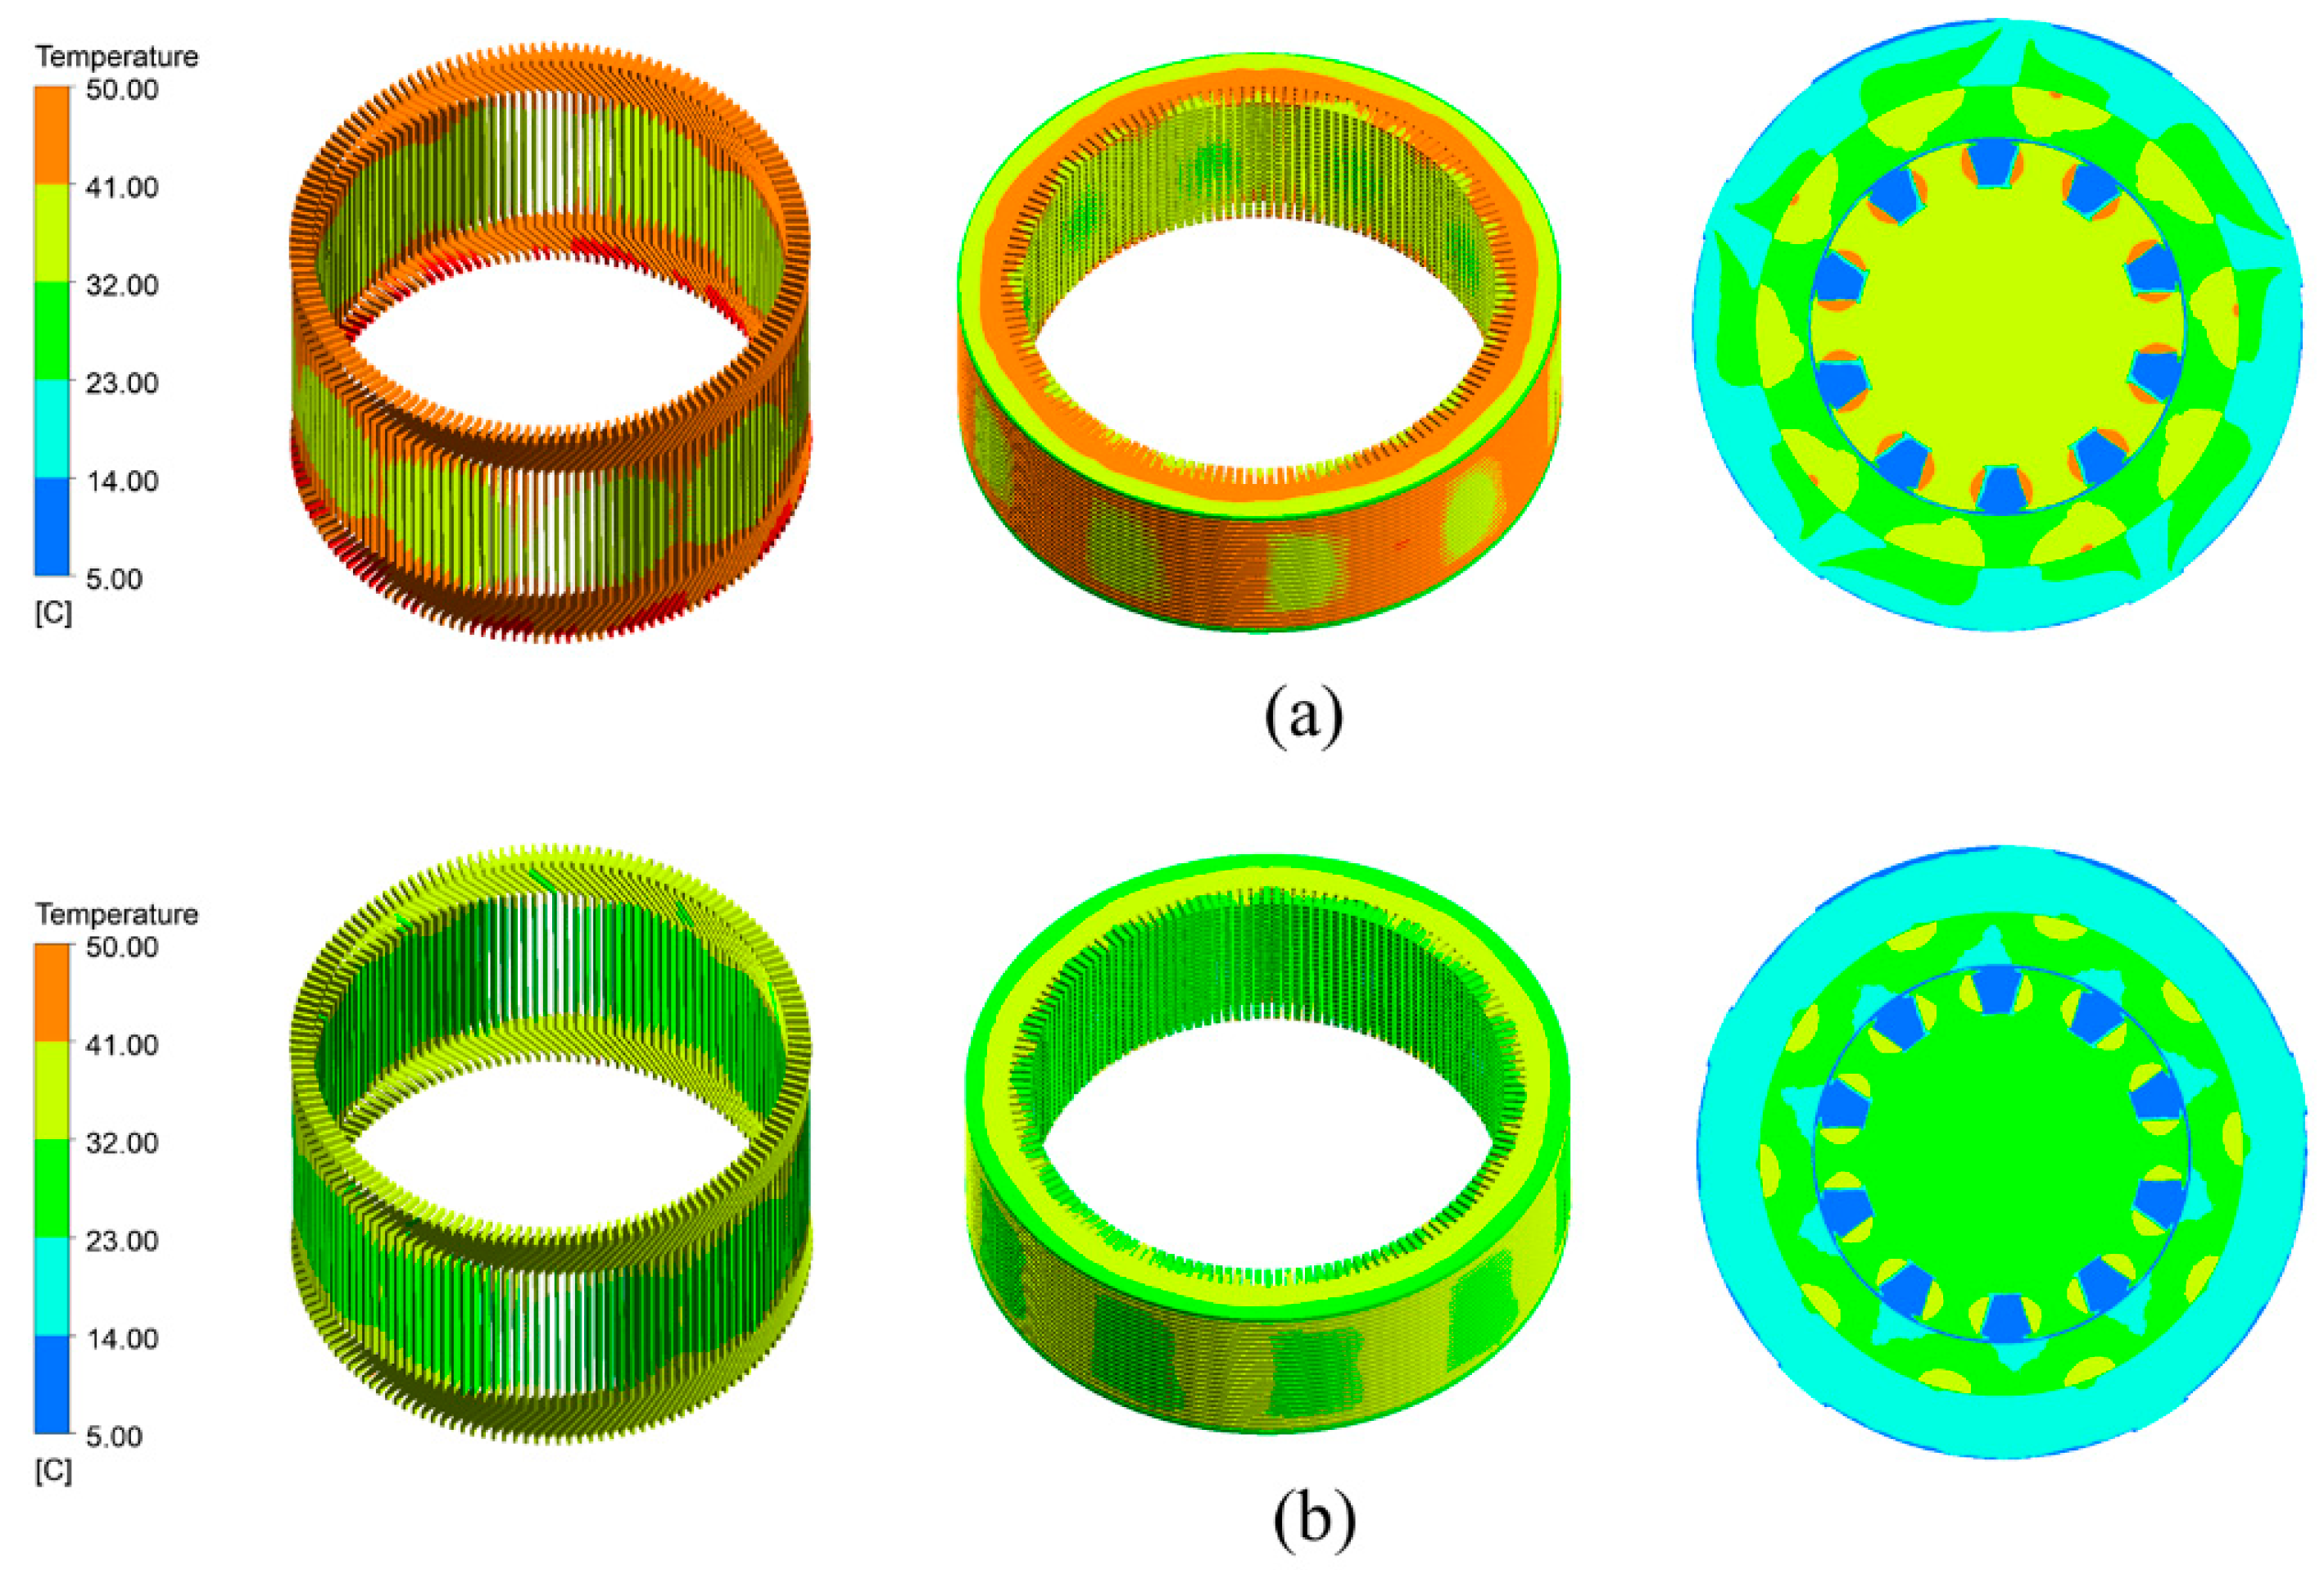
There is a significant difference in elevation between the plateau and plain terrains. Plains are lower and generally defined as areas of up to 200 m above sea level, while vast areas above 500 m with relatively flat terrain are generally referred to as plateaus. In high-altitude areas with unique climatic conditions, the characteristics primarily include low atmospheric pressure, low air density, low oxygen content, low air humidity, large temperature differences, high ultraviolet intensity, and low precipitation. To ensure the safe and reliable operation of generators, pumps, and motors in such conditions, parameters need to be appropriately corrected. The atmospheric pressure decreases with the increase in altitude. In this study, the pressure of this hydropower station is 70 kPa. As shown in Figure 7, the temperature of the generator decreases with the increase in air pressure, and they are negatively correlated. Due to the increase in atmospheric pressure, the gas density rises, consequently enhancing the airflow in the cooling duct or radiator. This leads to improved cooling efficiency and a subsequent decrease in the temperature of the generator.
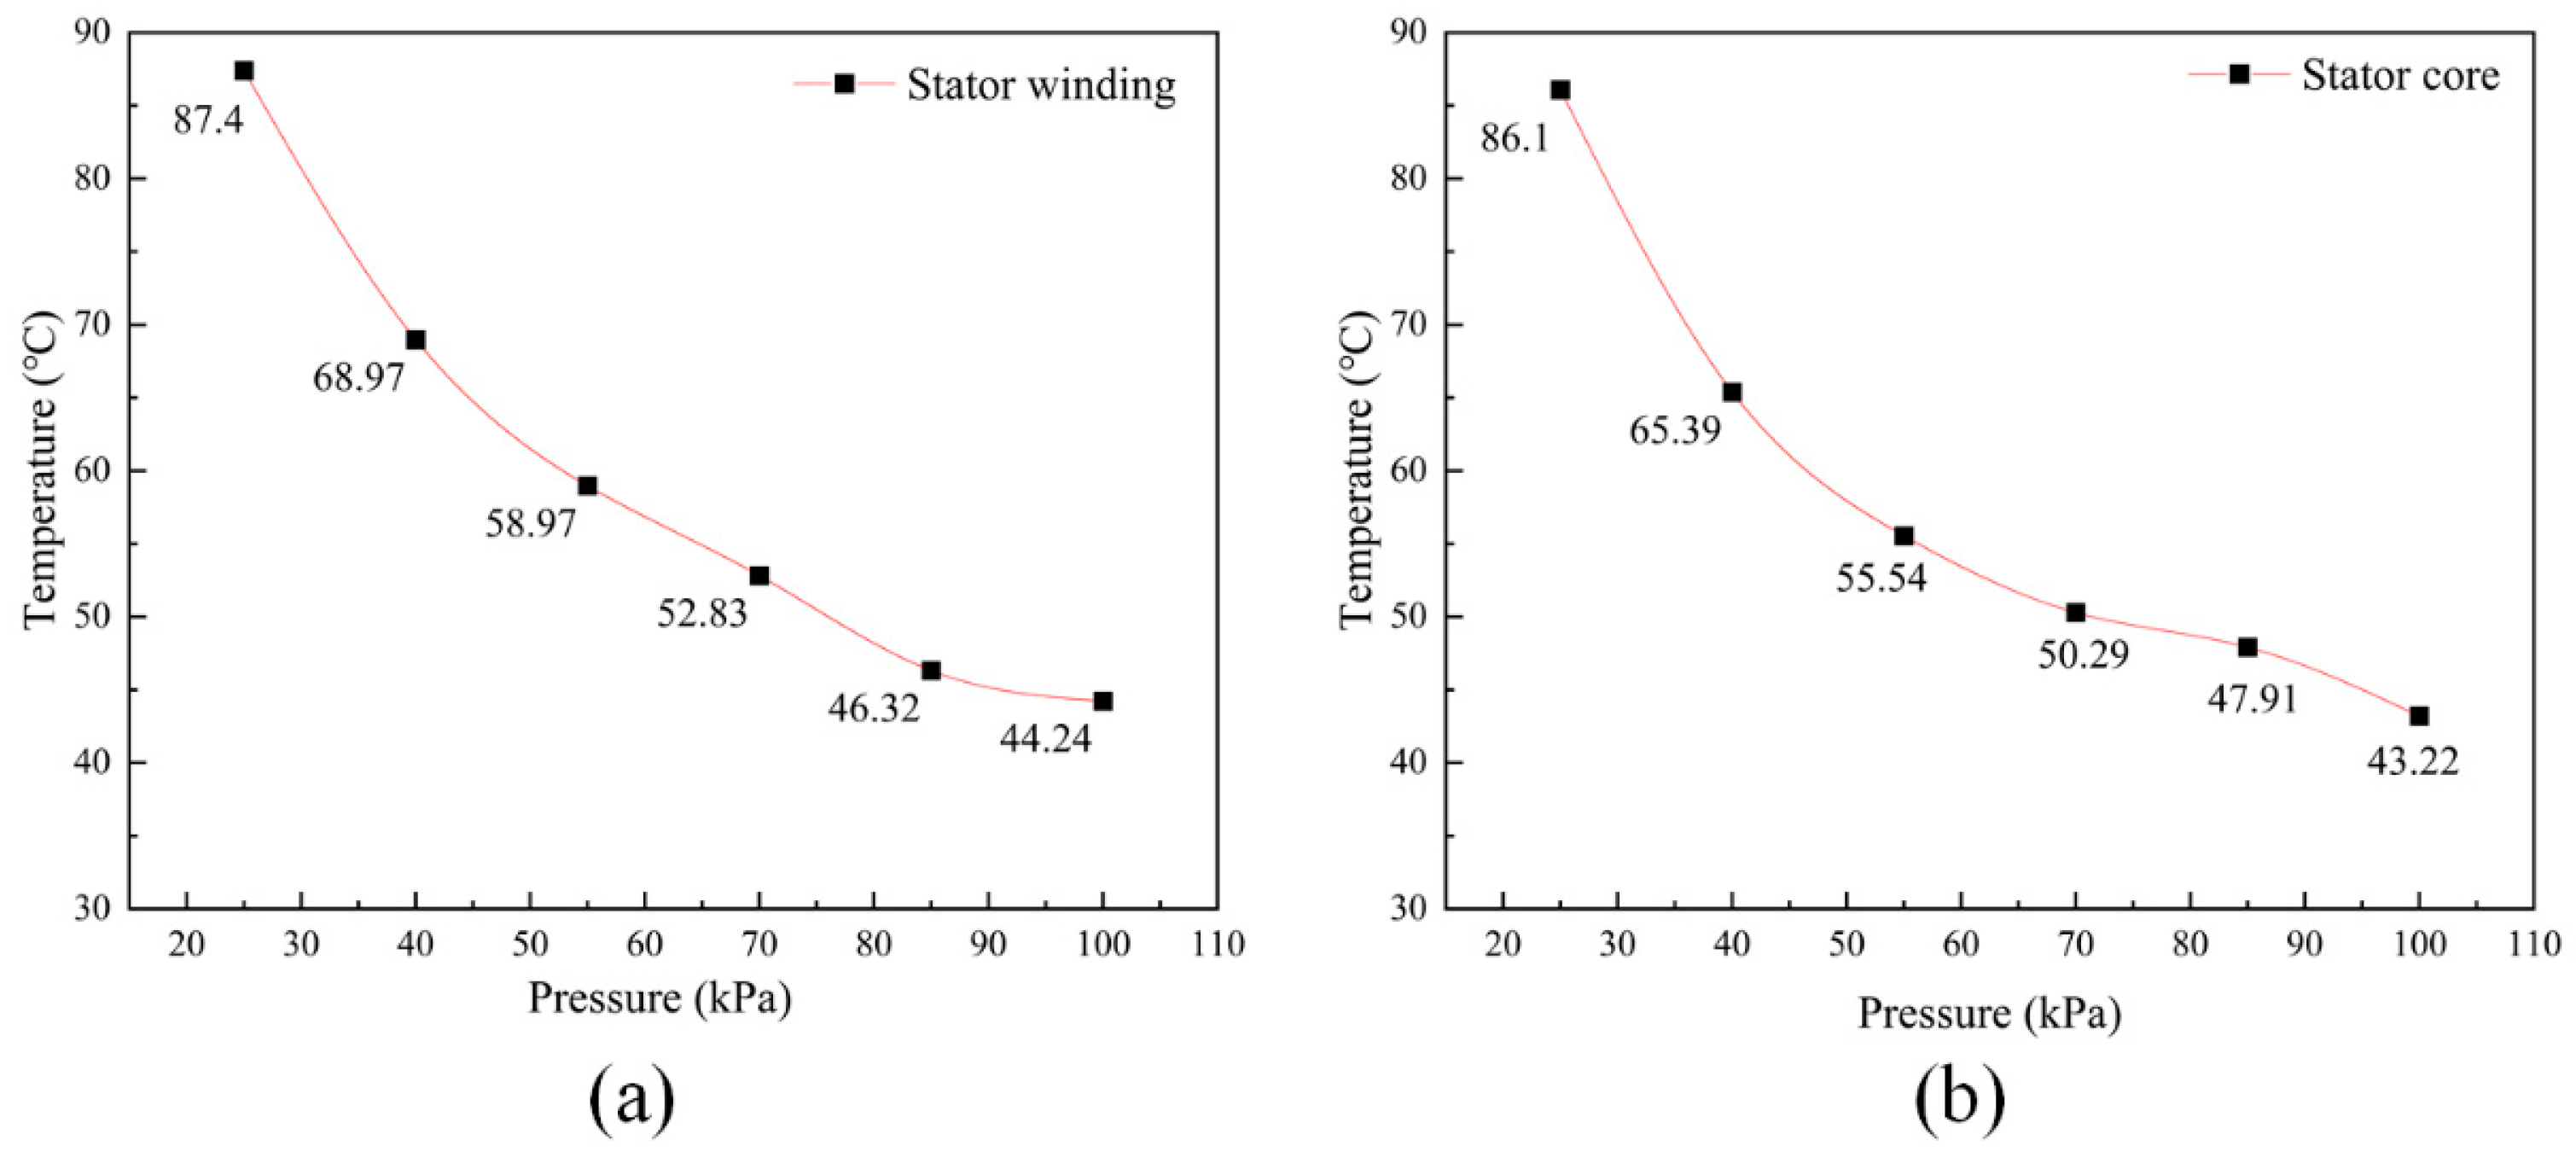
In order to further investigate the effect of pressure on the temperature of the stator, the temperature profiles of the stator under various air pressures are shown in Figure 8. From Figure 8, it can be observed that the temperature of the stator decreases nonlinearly with the increase in air pressure. From Figure 8, it can be seen that the temperature change gradient of the stator structure is large when the pressure is located in the range of 25 kPa-85 kPa. In particular, when the air pressure increases from 25 kPa to 40 kPa, the stator winding temperature difference reaches 18.43 °C and the stator core temperature reaches 20.71 °C. When the air pressure is above 85 kPa, the temperature gradient decreases and levels off. Within an air pressure range of 85 kPa to 100 kPa, the stator winding temperature difference is only 2.08 °C, and the stator core temperature difference is only 4.69 °C.
This is because the increase in air pressure leads to an increase in air density, which in turn reduces hysteresis losses. Hysteresis loss refers to the energy loss that occurs during the magnetisation and demagnetisation of the core material. By reducing hysteresis loss, the heating of the stator structure can be mitigated. When the air pressure increases, more cooling medium flows in the generator, which can effectively take away the heat generated by the generator and thus reduce the temperature of the stator structure.
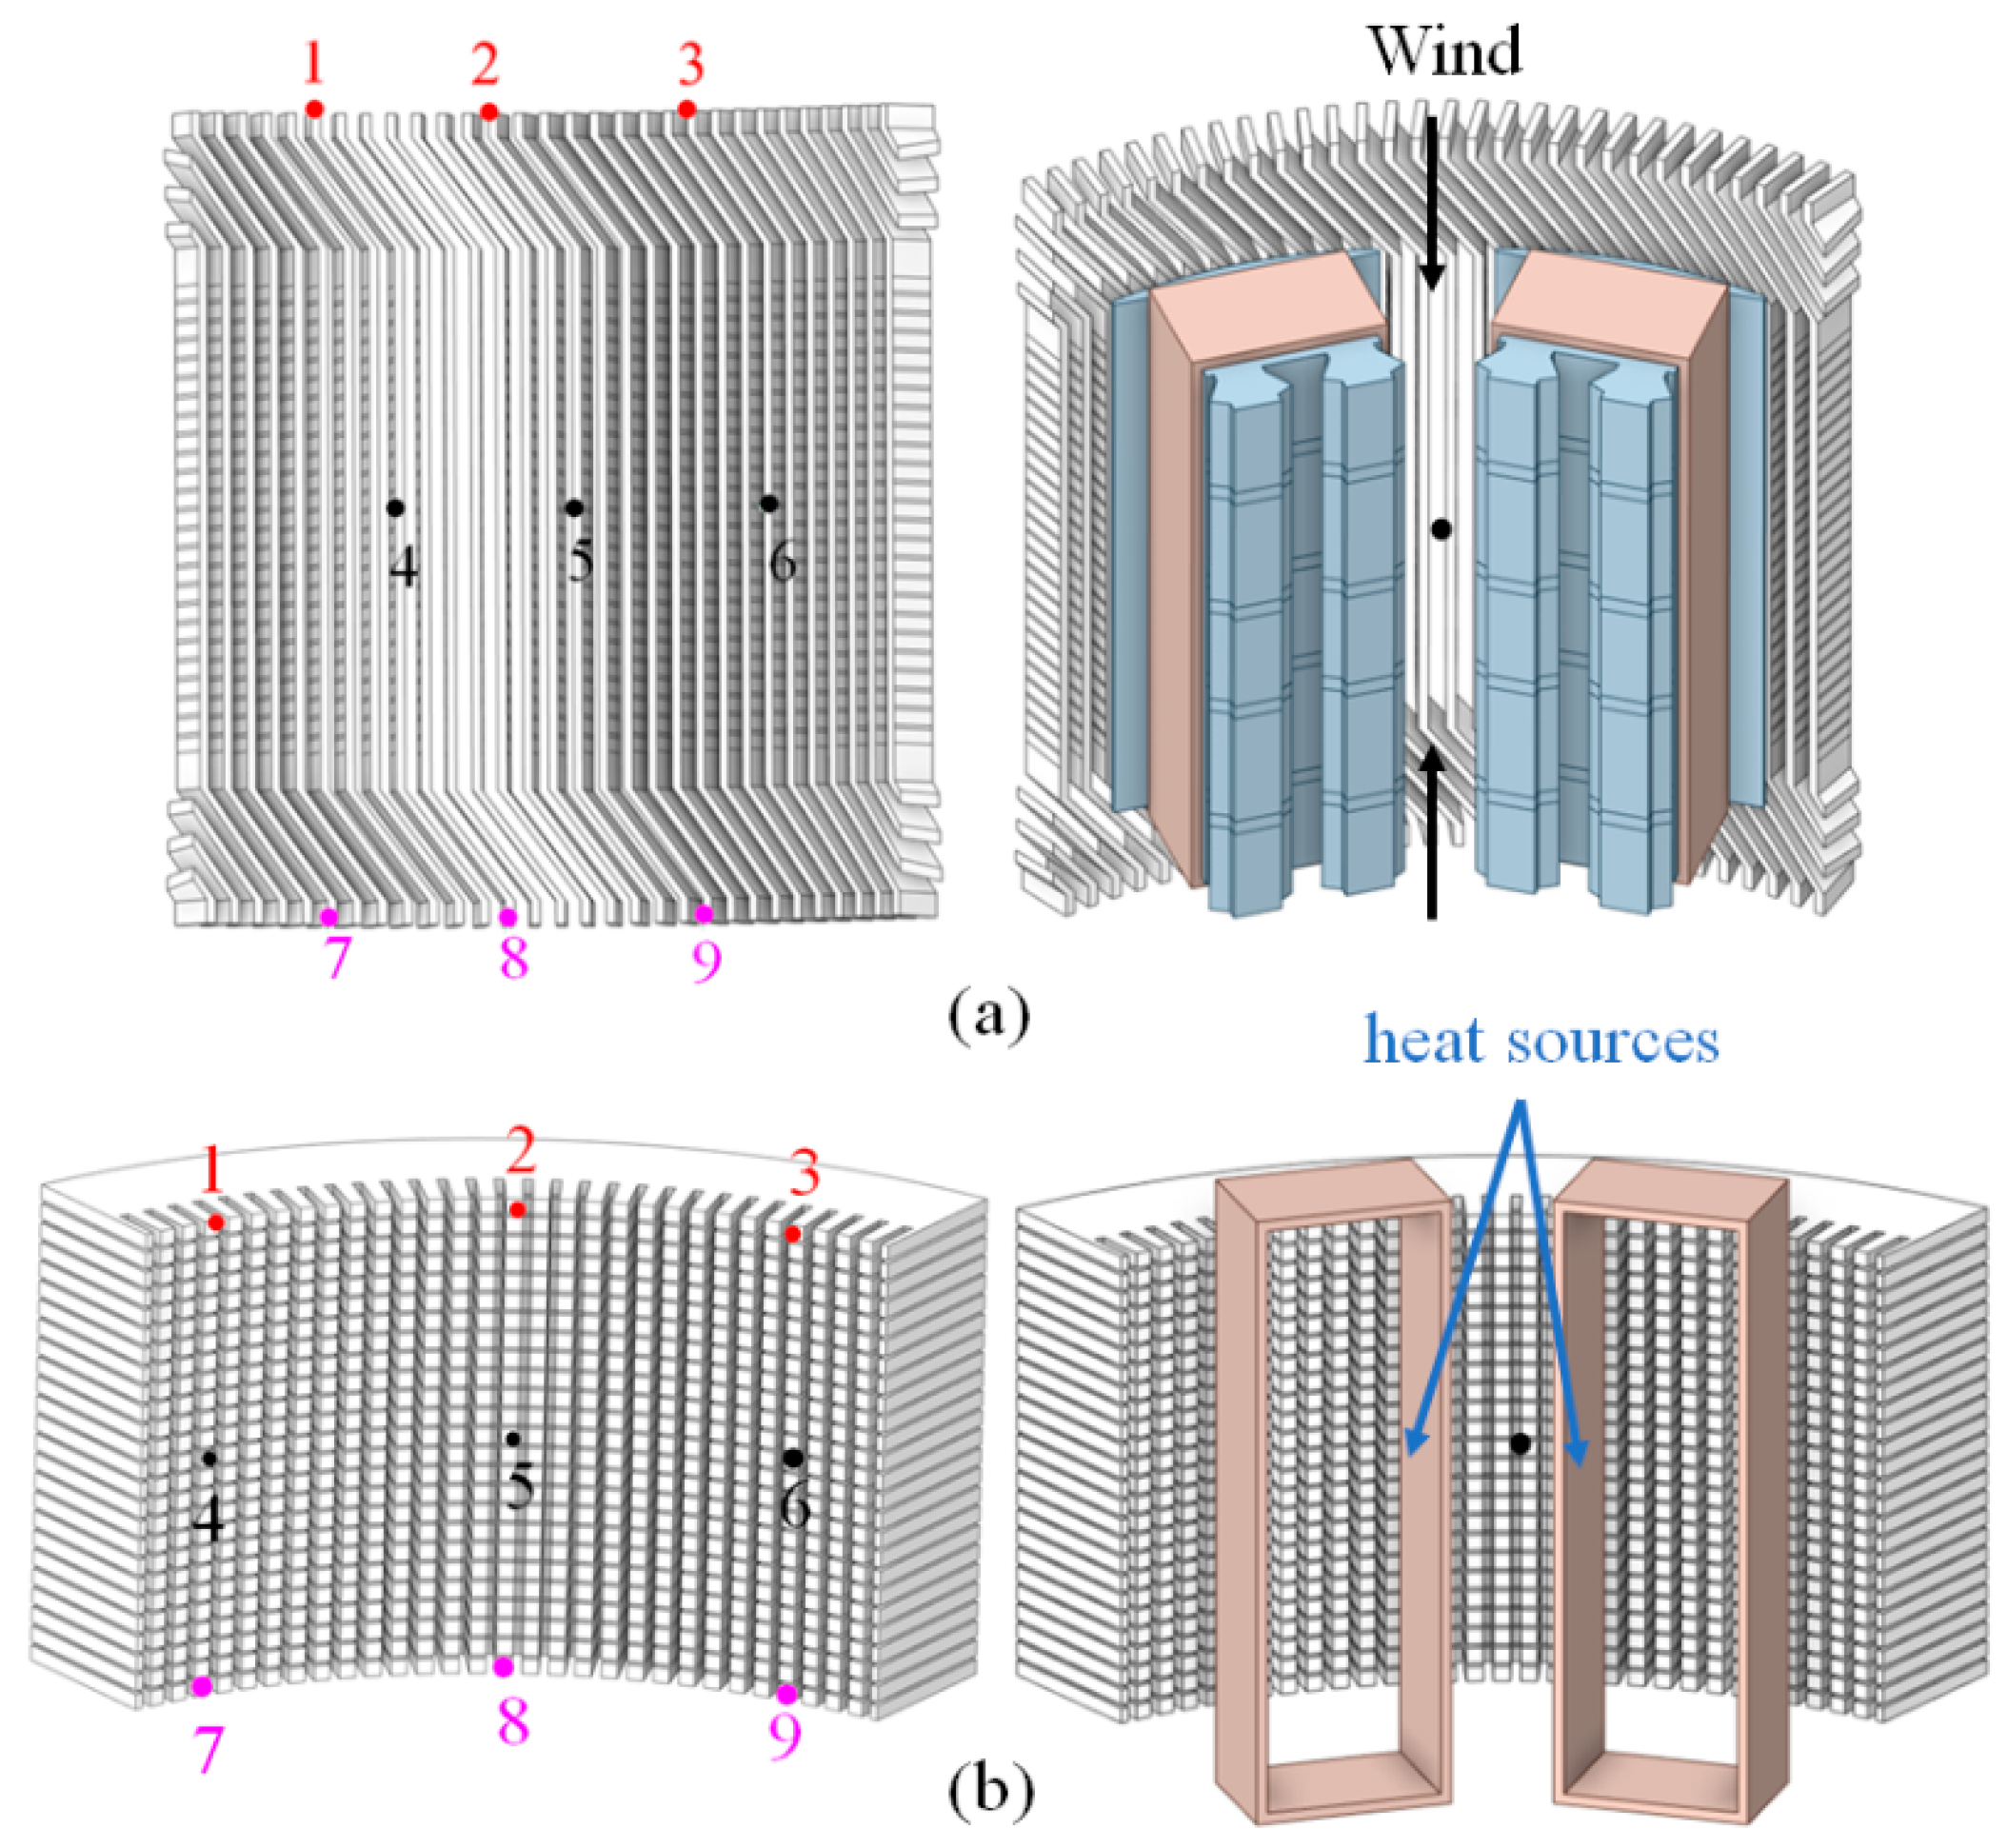
To analyse the correlation between the pressure and temperature of the generator, some monitoring points were set up on the stator components. The monitoring points are shown in Figure 9.
The temperature of different monitoring points decreases with an increase in the pressure (as seen in Figure 10), which is also similar to Figure 8. In Figure 10, the temperature values at stator winding monitoring point five are lower than at monitoring points four and six. The temperature distribution within the stator winding is observed to be lower in the middle and higher section at both ends, as the cooling air primarily contacts this area. Conversely, in the stator core, the temperature at monitoring point five surpasses that at monitoring points four and six. This discrepancy can be attributed to the presence of numerous heat sources at monitoring point five, resulting in elevated temperatures. Notably, the temperature difference between the upper and lower ends of the stator structure is relatively small.
Based on the observed temperature pattern, it may be beneficial to consider a moderate reduction in the number of temperature sensors at the upper and lower ends. This adjustment would help save on both installation time and economic costs. Since the middle part of the stator structure is in the complex internal space, it is difficult to make a comprehensive analysis with only three monitoring points. Moreover, there is still a lot of room to explore the temperature variation in the middle part of the structure, and this part will be studied and analysed in depth in the future.
In addition, due to the rotation of the rotor, the cooling air in the hydro-generator presents a very complex distribution. The flow condition of the cooling air will also directly affect the temperature rise of the components of the hydro-generator [30]. Therefore, it is necessary to analyse the variation of the temperature field from the point of view of the flow field. From Figure 11, it can be inferred that in high-altitude regions, the air is thin, resulting in a lower working pressure, which in turn leads to a relatively sparse distribution of streamlines. The streamlined distribution on the windward side is uneven, forming distinct vortex-like streamlines on the leeward side. In the operating environment of 100 kPa, the streamlined distribution is more uniform. More heat is carried away at 100 kPa operation than at 70 kPa in a plateau environment, which is in line with the law of higher air pressure and lower temperature. By analysing and studying the flow velocity distribution, increasing the air intake volume when the plateau generator is running could be considered in the future. This adjustment aims to compensate for the limitations resulting from thin air and inadequate flow velocity distribution at high altitudes and low air pressures.

3.2. Temperature Distribution of Generators in Different Ambient Temperatures

After reviewing the weather history data, it was found that the local temperature ranges from −10 °C to 7 °C in January and from 0 °C to 12 °C in April. The temperature distribution of the generator will be different in different climates in the plateau region. When the ambient temperature is lower, the water temperature entering the generator’s air cooler decreases, resulting in a greater amount of heat being carried away. The temperature of the stator was significantly higher in April than in January, as shown in Figure 12, with an average of about 10 °C higher. The maximum temperatures of the stator winding and stator core in April are 51.3 °C and 50.5 °C, and the average temperatures are 48.5 °C and 47.4 °C, respectively. The maximum temperatures of the stator winding and stator core in January were 39.7 °C and 39.6 °C, and the average temperatures were 38.05 °C and 37.5 °C, respectively.
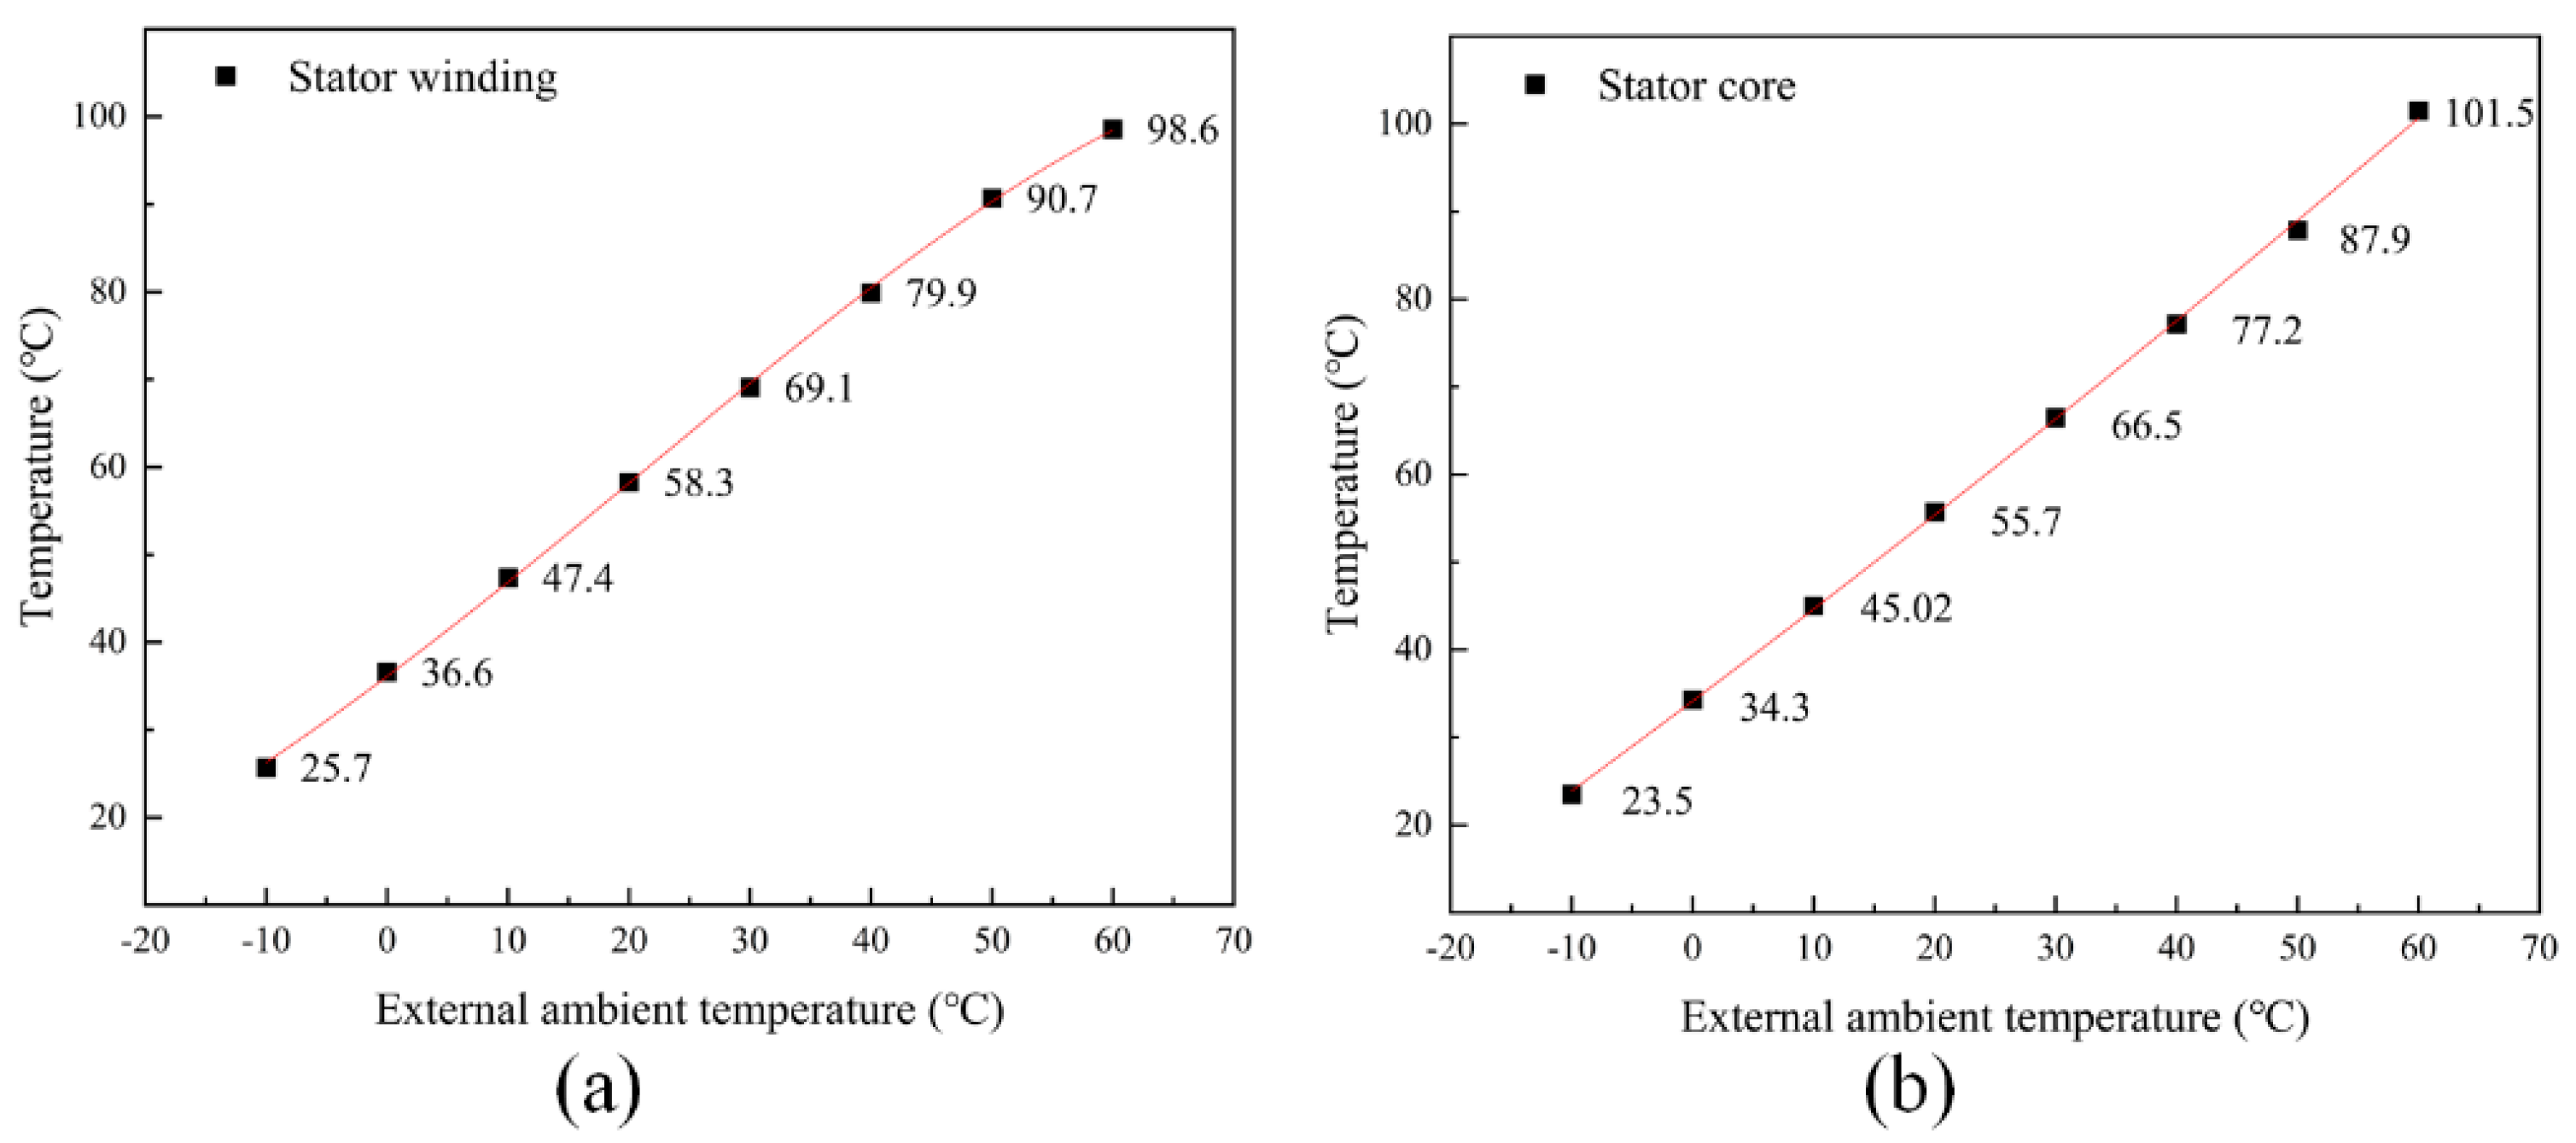
Similarly, the temperature variations of the stator at various external ambient temperatures were computationally simulated. As shown in Figure 13, the generator temperature increases linearly with increasing ambient temperature. The temperature of the stator is positively correlated with the ambient temperature. An increase in ambient temperature can cause the generator itself to also increase in temperature. This rise in temperature may result in the generator producing more losses. This ultimately leads to an increase in the temperature of the stator structure. An increase in the temperature of the external environment may lead to an increase in the ambient temperature of the generator as well. During the heat transfer process, the temperature difference between the cooling medium (e.g., water or air) and the external environment decreases. The cooling medium is less effective at carrying away heat, leading to an increase in the temperature of the generator.
Based on the results of the data comparative analysis, as shown in Figure 14, it can be observed that the temperature variation trends of the monitoring points on the generator are generally similar under different external ambient temperature conditions and different pressure conditions. Therefore, there is no need for further detailed descriptions.

3.3. Temperature Distribution of the Generator at Different Speeds

Since the object of study is a synchronous generator, its rotational speed varies unless it is out of step with the grid. The speed of the synchronous generator is constant for the rest of the cases (with small variations of ±2%). Any substantial change in speed may cause the generator to lose synchronisation with the grid, triggering power system instability or even blackout faults. Temperature is used as one of the indicators to predict generator failure. Studying the relationship between rotational speed and temperature may help identify abnormal or faulty conditions for early warning and diagnosis.
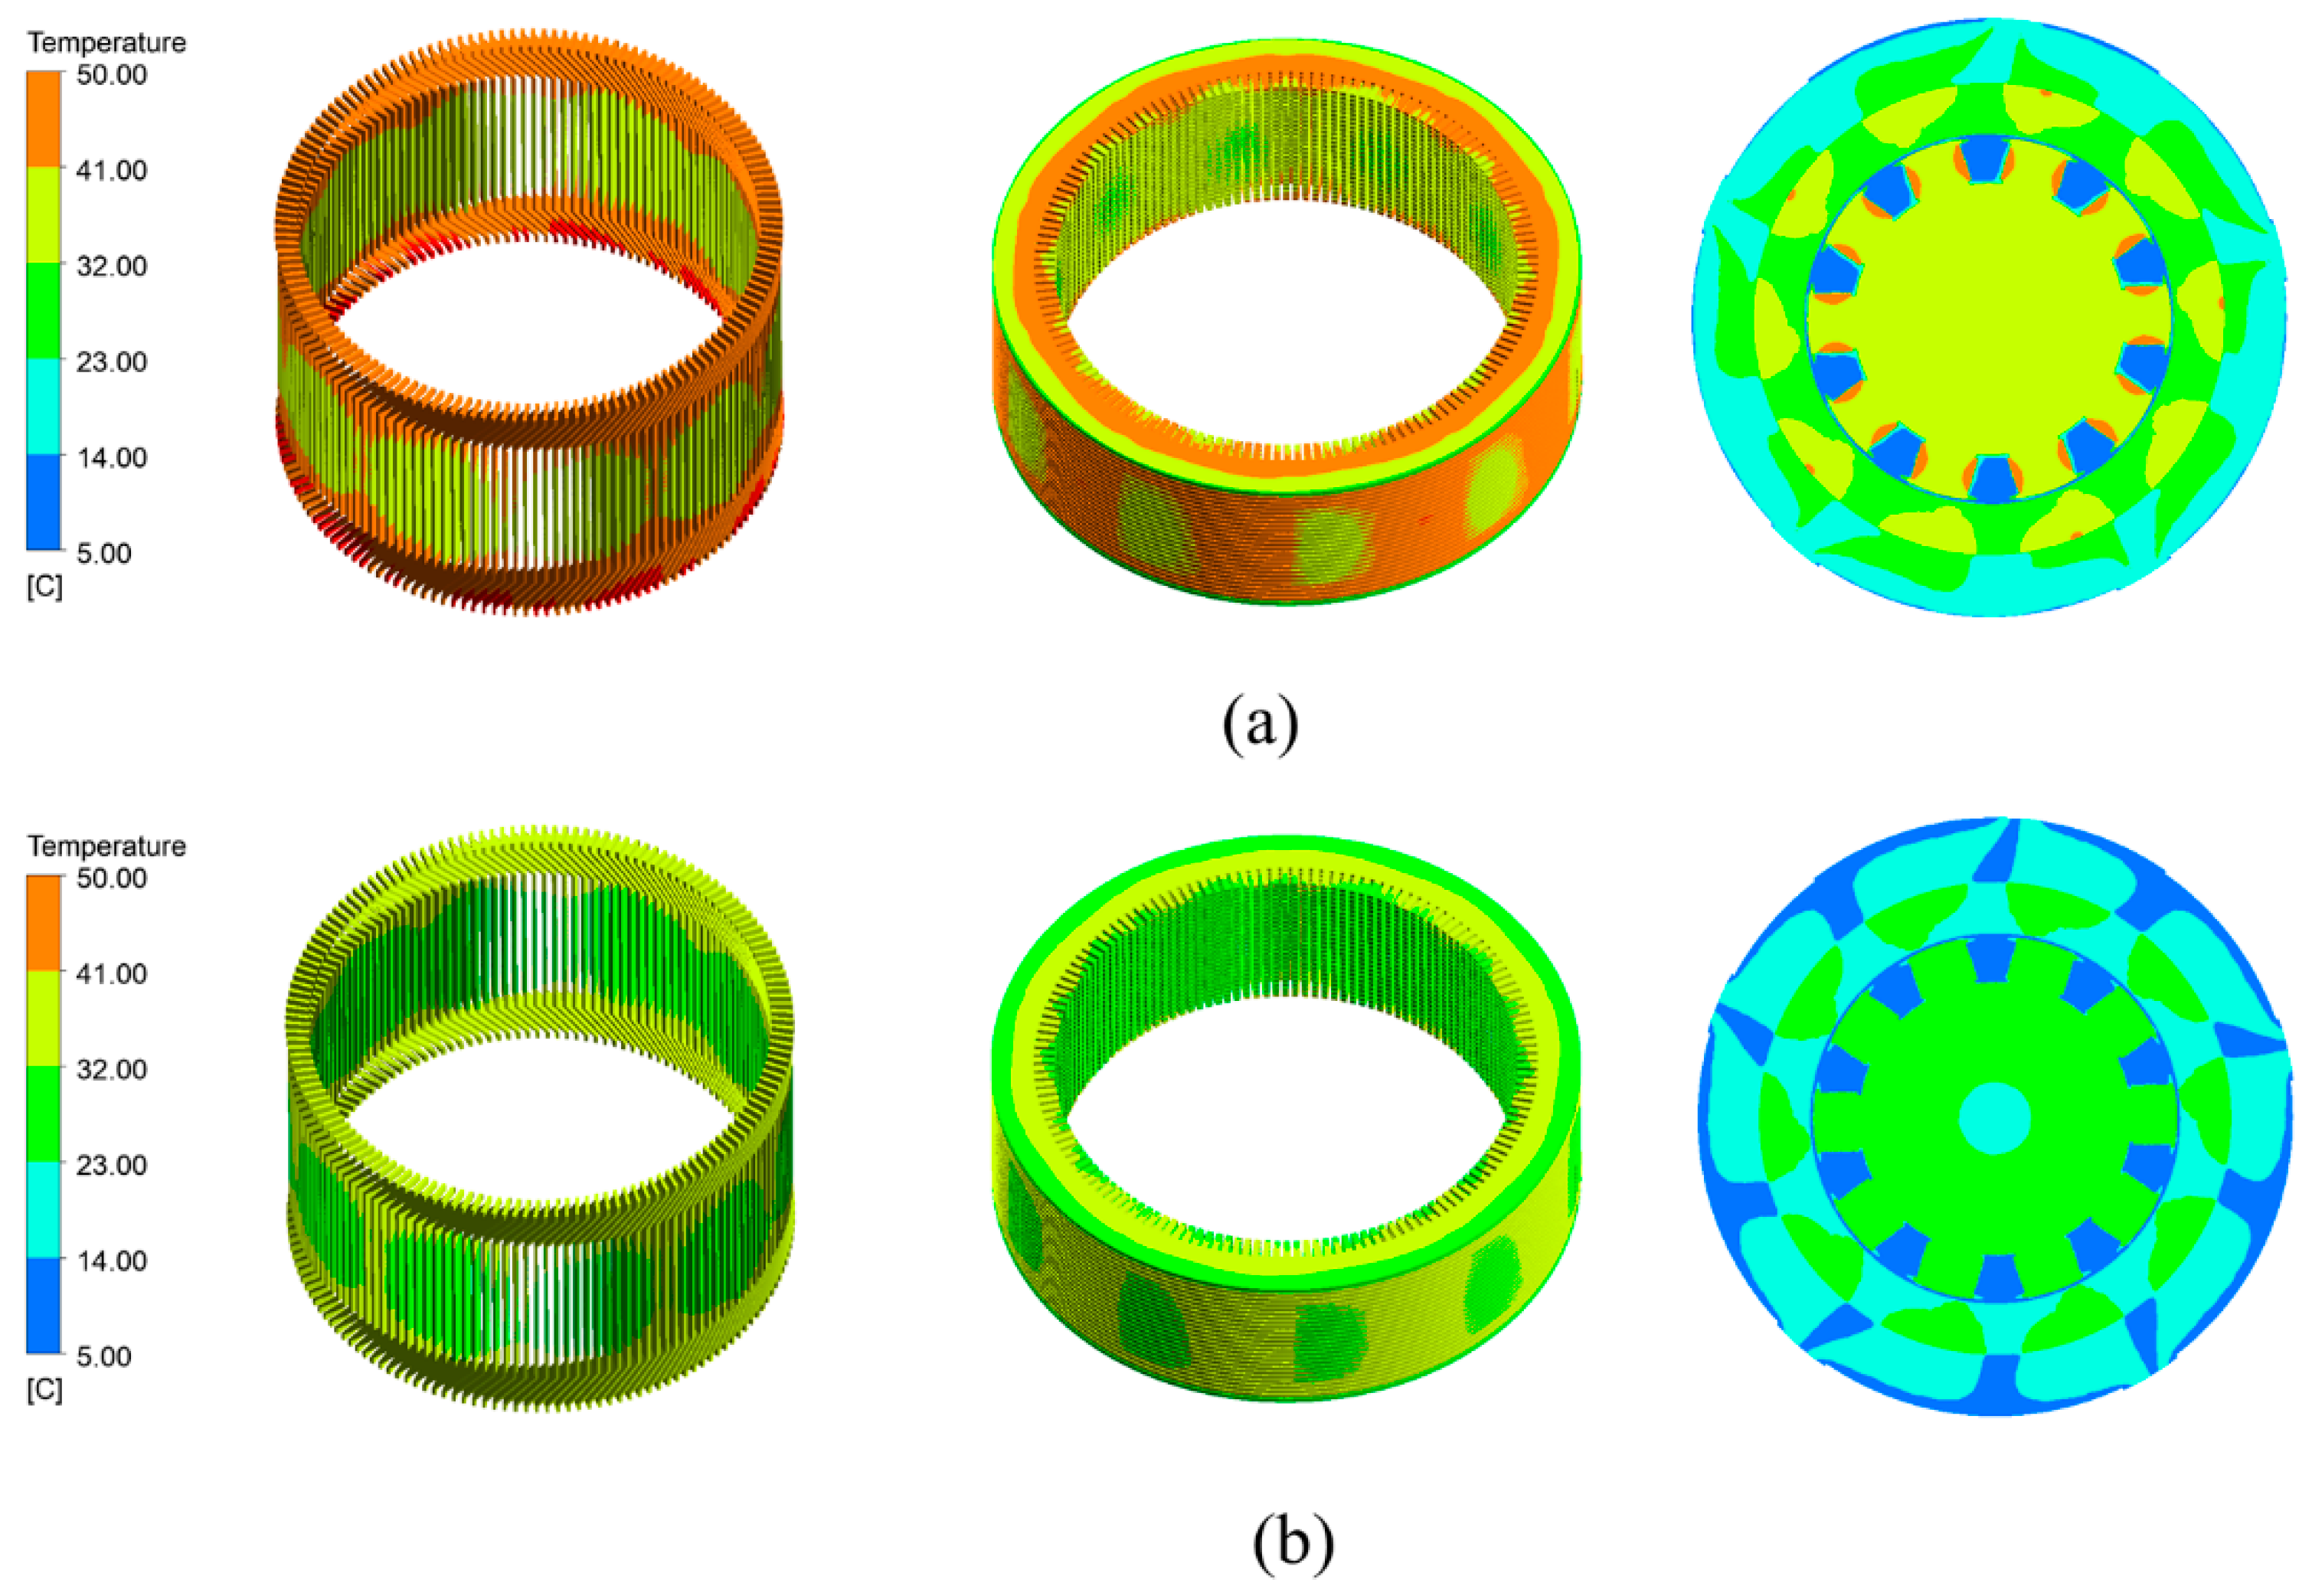
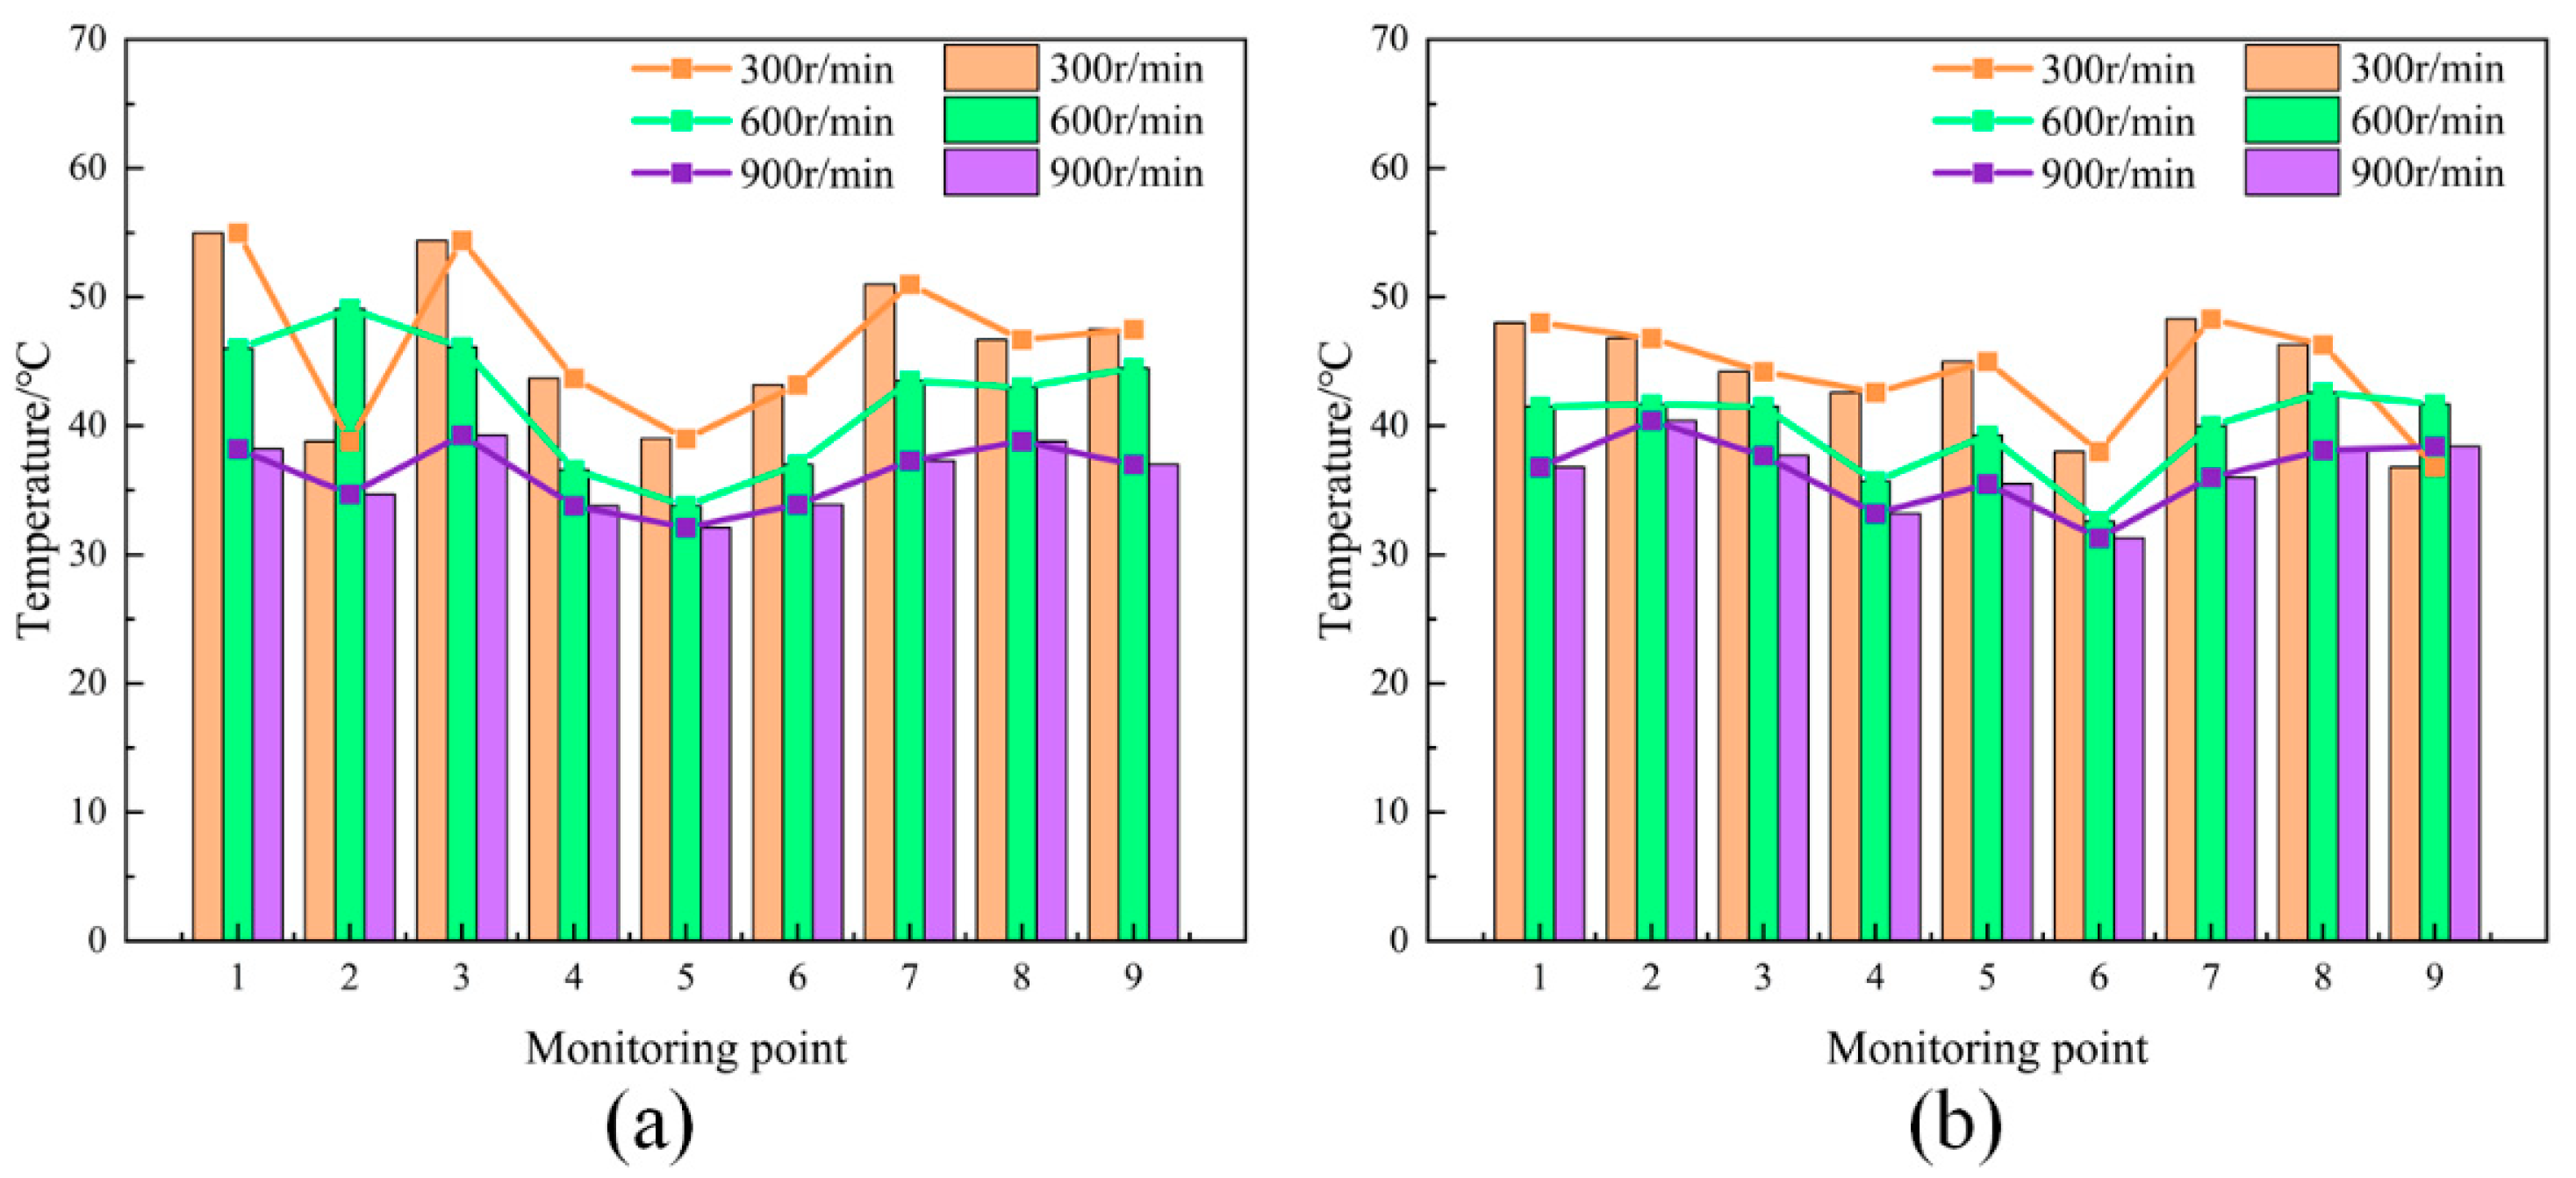
The generator under study is rated at 600 r/min under normal operation. As a result, the temperature field distribution in the plateau environment was simulated for three different rotational speeds, namely 300 r/min, 600 r/min, and 900 r/min, as shown in Figure 15. From the figure, it can be seen that the temperature decreases when the rotational speed increases when the generator is operated in a plateau environment. The generator temperature decreases non-linearly with increasing speed. The higher temperatures in the figure are due to heat generation caused by energy loss in the rotor coil, and the lower temperatures are due to convective heat transfer between the rotor poles.
As can be seen from Figure 16, the temperature of the stator structure is lower at 900r/min. This is due to the increase in speed, which leads to an increase in the fan speed and airflow of the cooling system. This enhances the capability of dissipating the heat generated by the stator structure. The cooling of the stator’s surface becomes more comprehensive, leading to a reduction in temperature. However, it is not advisable to leave the generator in high-speed operation for a long time. This will cause the various structures of the generator to be subjected to forces over their rated condition, thereby increasing the friction between the various components and affecting the performance of the generator. In addition, there is also the problem that the flyaway speed may be reached. The problem could lead to load shedding in the unit and trigger power system failures, posing a serious hazard to people’s property and safety. Therefore, the generator needs to be operated carefully to ensure that it operates within the appropriate speed range.
As can be seen from Figure 16, the stator winding temperature shows large fluctuations when the generator is operated at 300 r/min operating conditions. The lowest temperature is about 39 °C, and the highest temperature reaches about 55 °C. The low-speed operation can induce load changes in the generator. These changes lead to extra losses and heat generation. Consequently, fluctuations in the stator structure temperature occur. At low speeds, the flux distribution of the generator may be different from that at the rated speed, resulting in hot spots in localised areas of the stator structure, which can cause temperature fluctuations. The low-speed operation may also disrupt the equilibrium of the generator’s operation. This leads to an imbalance in the overall thermal balance, which can cause damage or even lead to serious safety accidents such as generator burnout. Therefore, during the operation of the generator, operation at speeds below the rated speed should be avoided.
In conclusion, studying the distribution of the generator temperature at different rotational speeds is valuable for optimising generator operation and maintenance strategies, improving equipment performance, reducing the risk of failure, and ensuring the stable and reliable operation of the power system. Analysing the temperature distribution under various rotational speeds offers insights for guiding future generator ventilation designs in plateau regions. Moreover, this analysis helps to select the right speed for similarly structured generators.
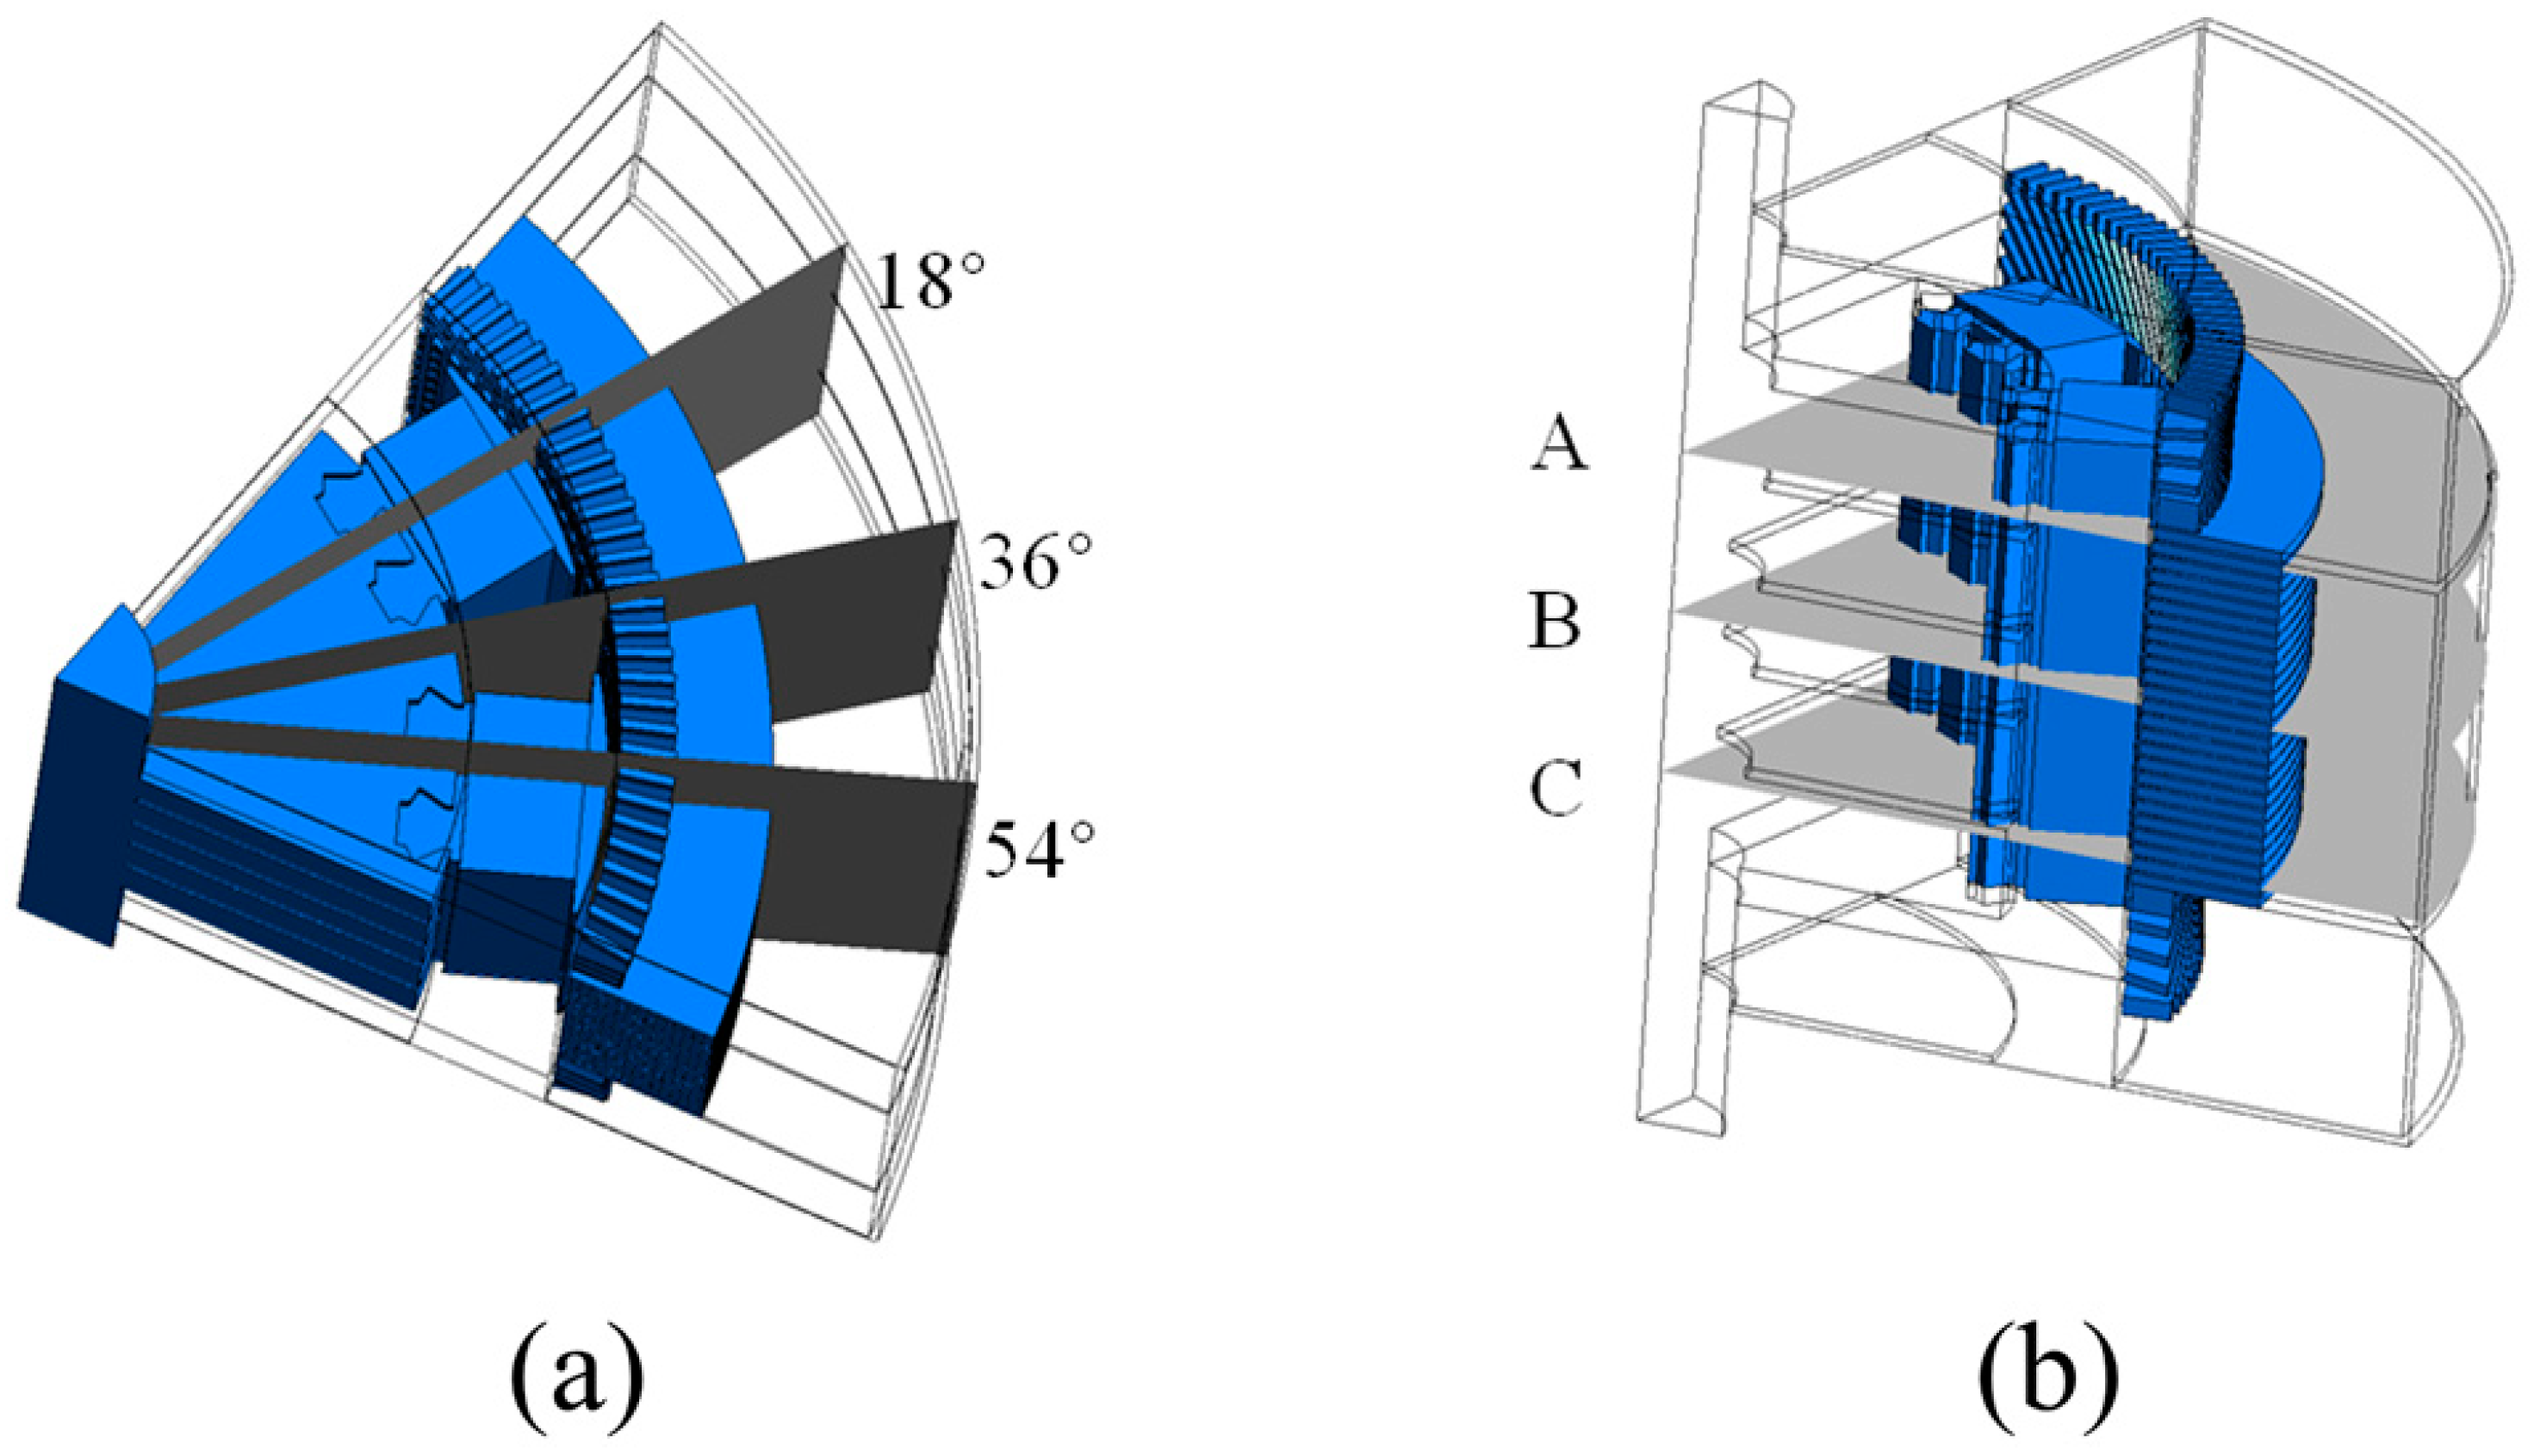
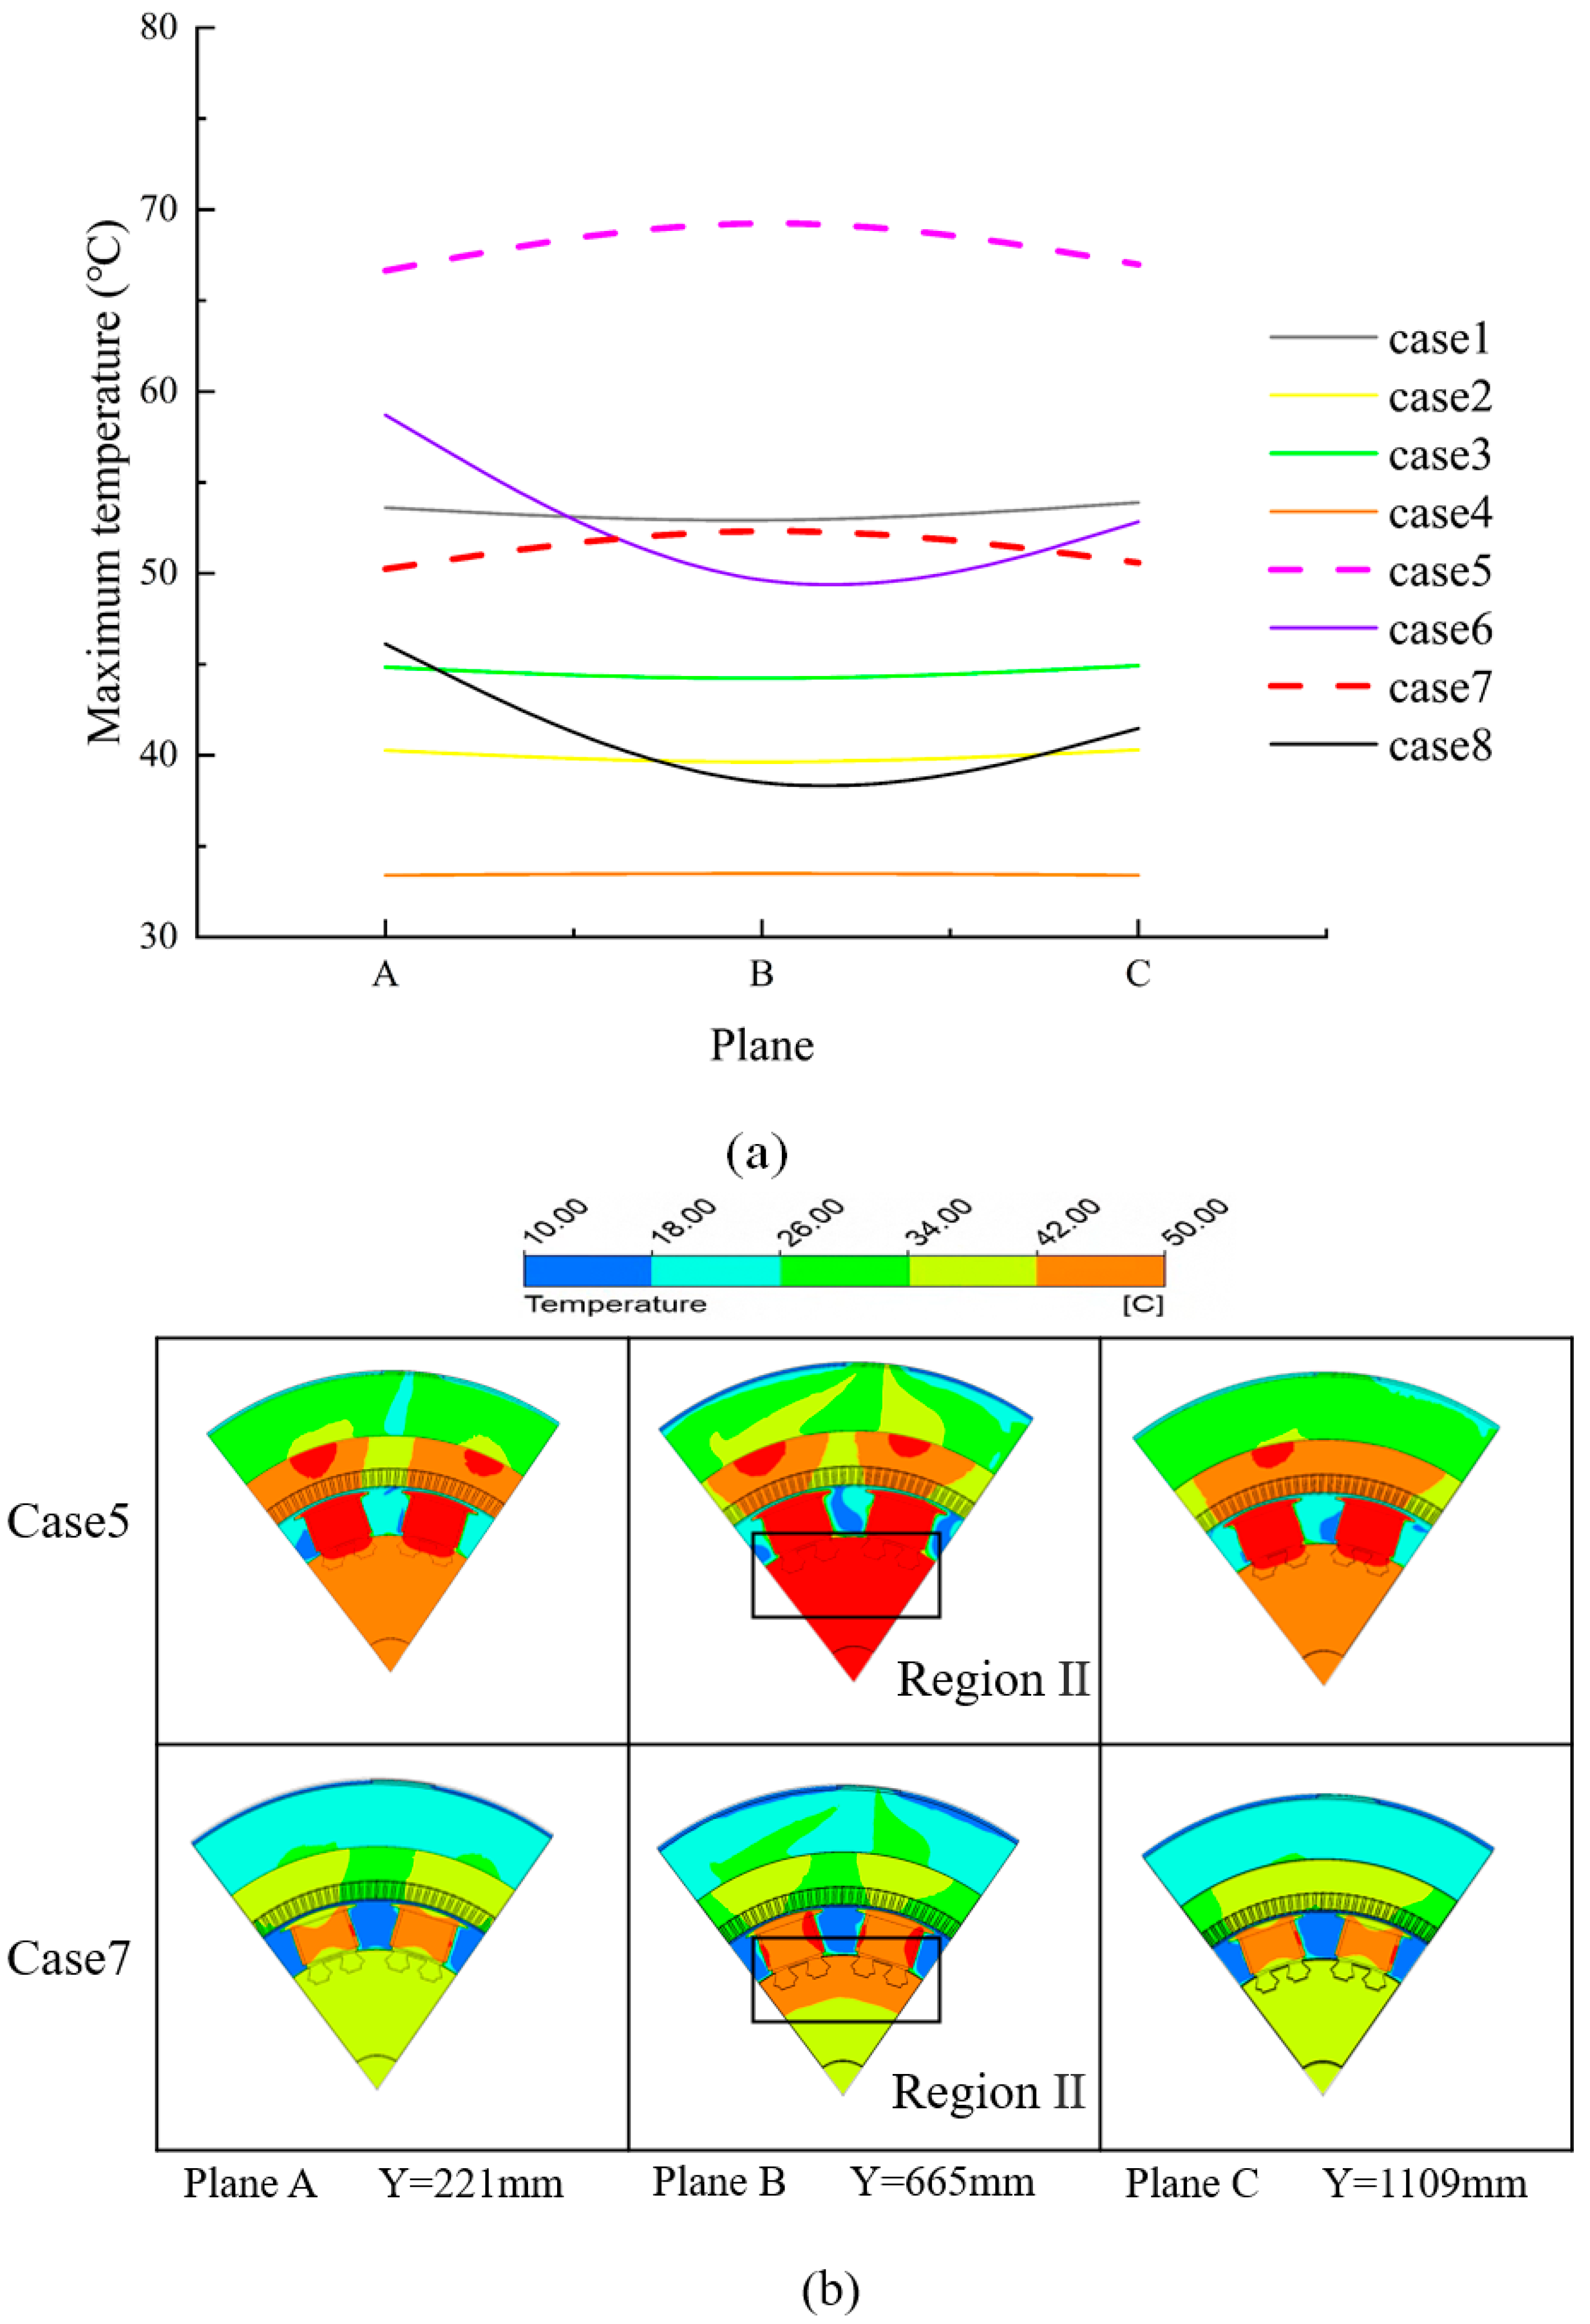
To understand the rule of changing temperature more intuitively under generator operating conditions, it is necessary to study not only the external three-dimensional structure but also the internal two-dimensional planes that are not easy to see. In this subsection, the temperature distribution of the individual generator structures is analysed by starting from multiple perspectives and planes. The planes selected are shown in Figure 17, which are three vertical and horizontal planes uniformly selected on the computational model. Based on the simulation results of eight cases, the temperature trends of each cross-section are statistically summarised.

3.3.1. Vertical Section—High Speed

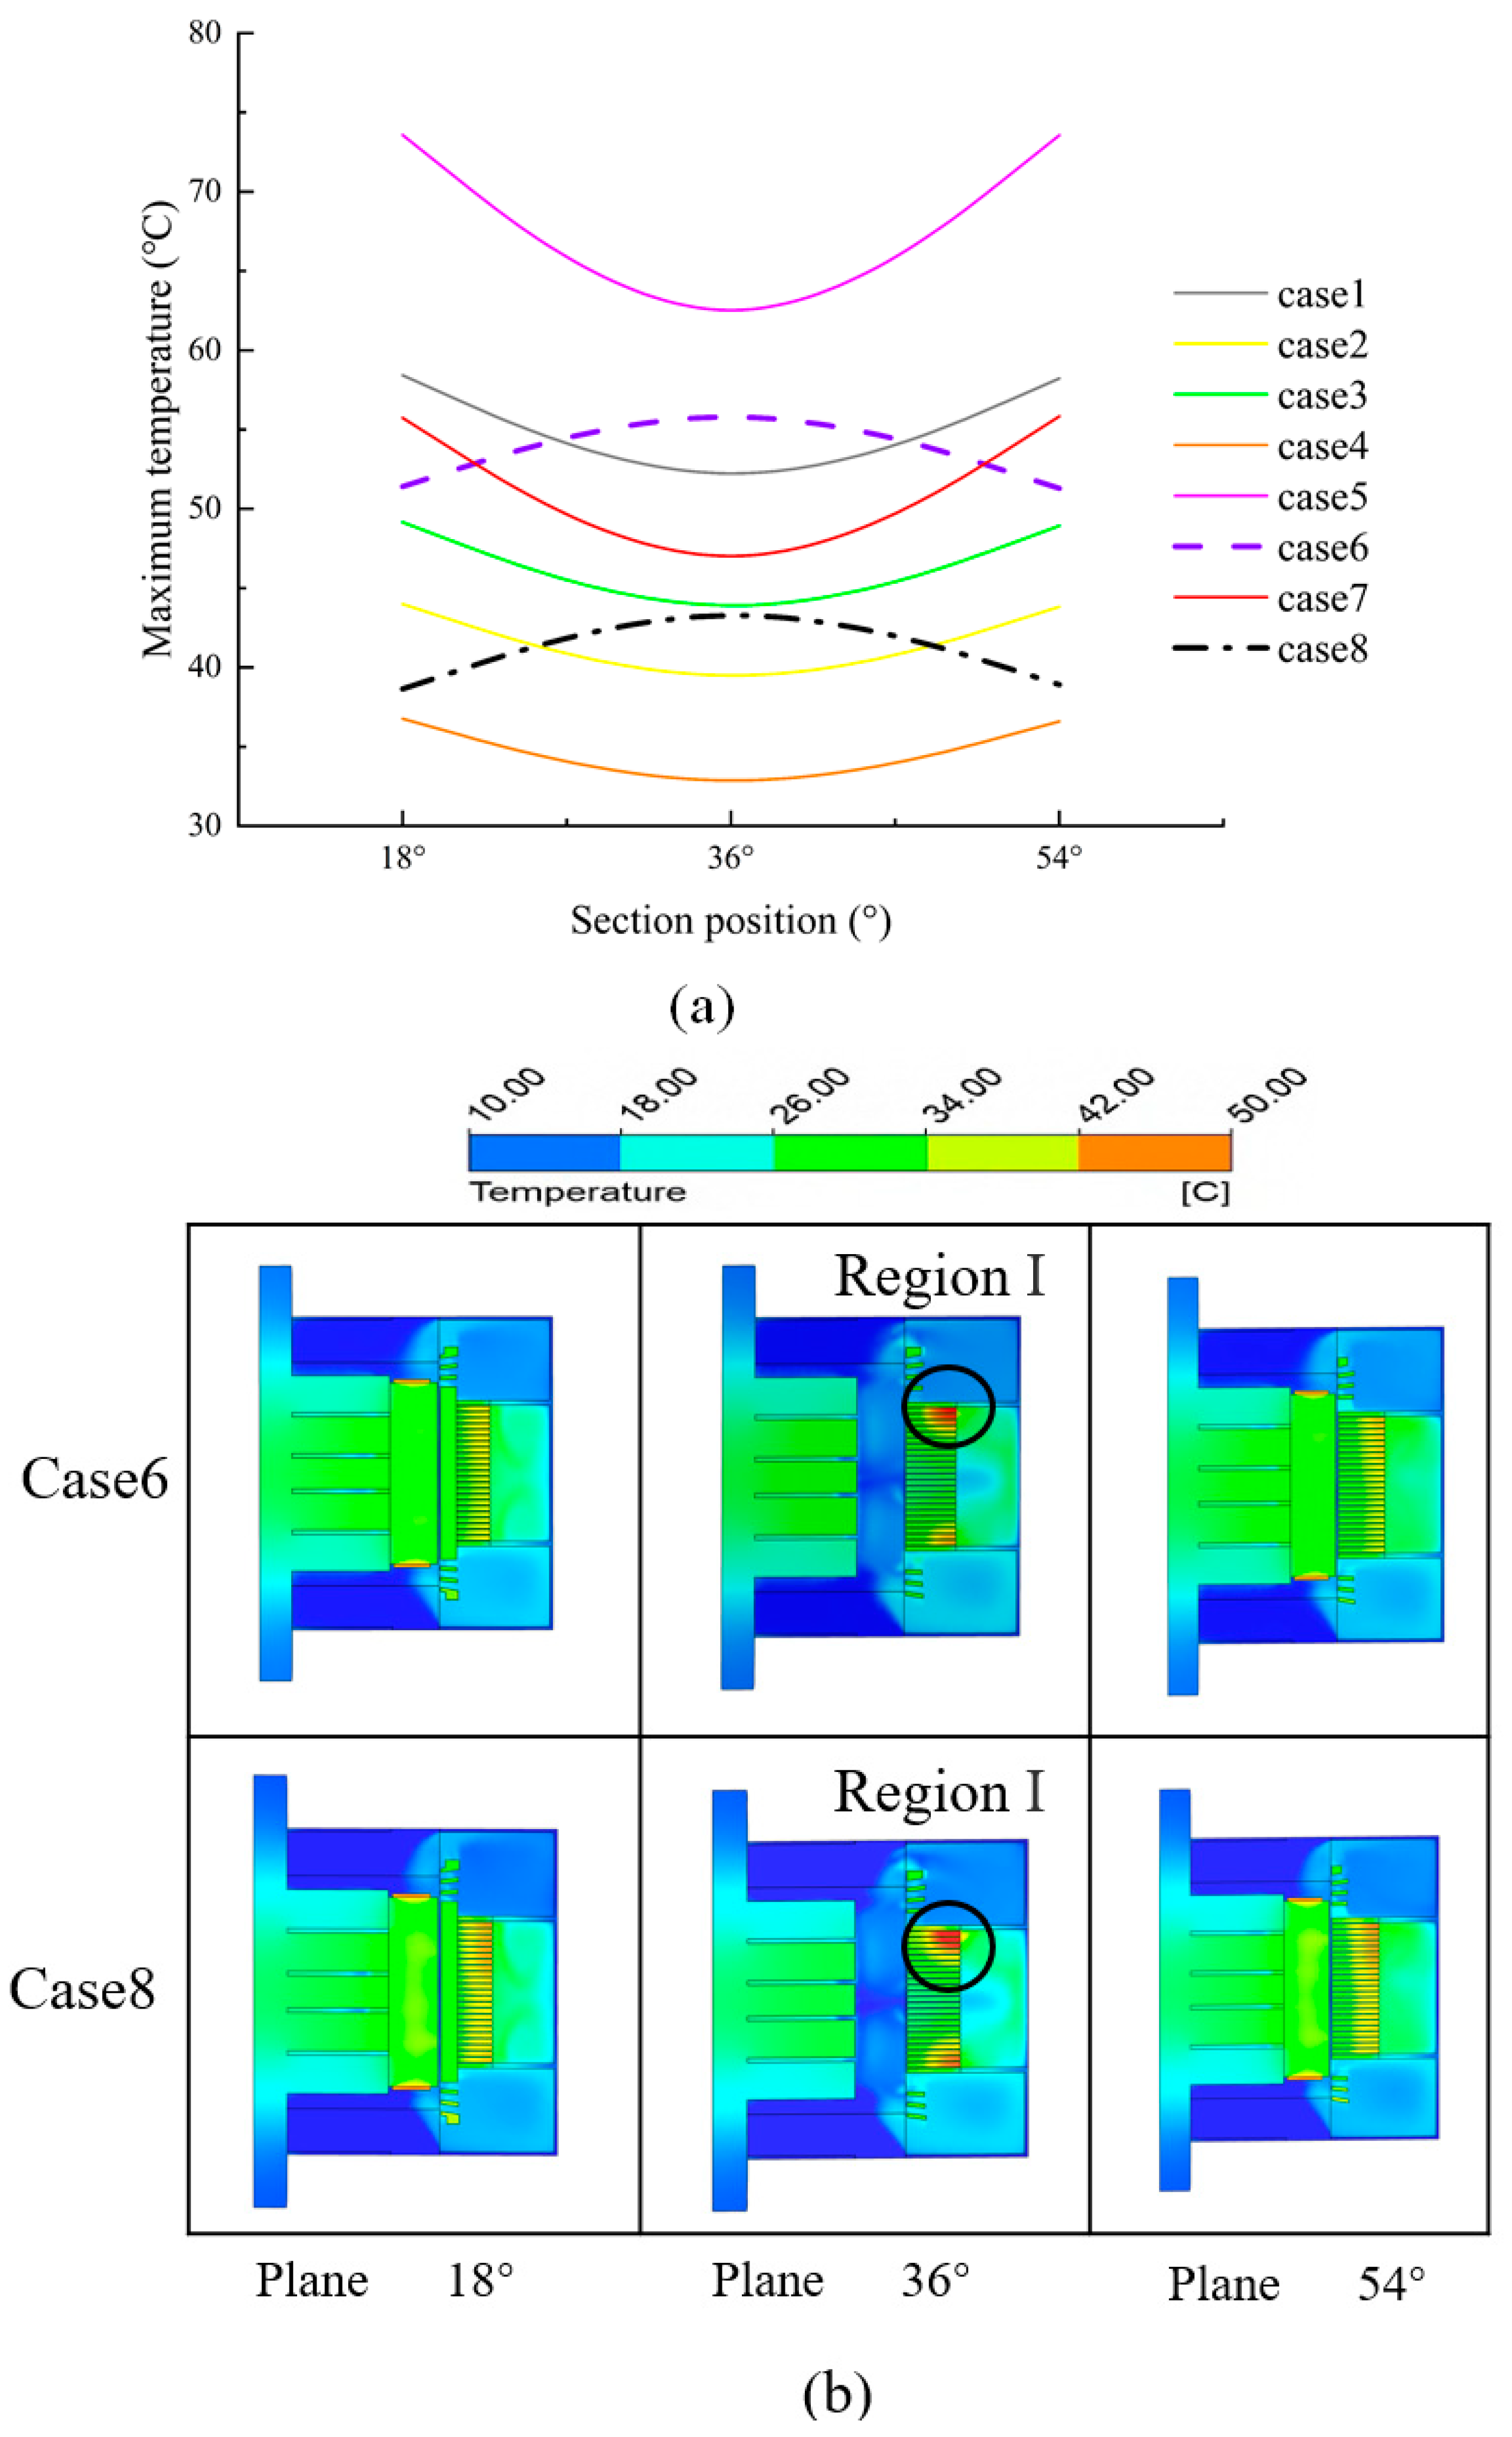
Figure 18a shows that all cases have a concave trend except Case 6 and Case 8, which have an upward convex trend. In the simulation case, both Case 6 and Case 8 are operating at high speed (900 r/min). The generators in this state are all running at high speeds, and there is a certain amount of wind friction loss between the components, leading to an increase in temperature. The 36° plane is in the position of the gap between the two magnetic poles. The wind friction loss is higher than the other two planes, so the temperature change under the high-speed case shows an upward convex trend. As can be seen in Figure 18b, the temperature of Region I in the 36° plane is higher than the other two planes. At high rotational speeds, the temperature variations in the vertical cross-section form an upward convex trend with a high middle and two low ends. The temperature distributions in the 18° plane and the 54° plane are approximately the same, satisfying the assumed period setting.

3.3.2. Horizontal Section—Low Speed

As shown in Figure 19a, it can be seen that most cases have a downward concave planar temperature change. However, there are still two cases in which the trend is different from the others. Case 5 and Case 7 show an upward convex trend in temperature change, which is opposite to the trend of the other cases. Case 5 and Case 7 are the operating conditions at low speed (300 r/min). In these cases, the generator operates at a reduced speed and the air velocity is decreased, leading to inadequate air circulation. Resulting in insufficient air flow, difficulty in dissipating heat, and heat build-up. Because the upper and lower planes of Plane A and Plane C (see Figure 17b) are close to the inlet position, the temperature in the middle of Plane B is higher than that of the upper and lower planes. From what can be seen in Figure 19b, the Region II temperature in the middle of Plane B is higher than the other two planes. The temperature variation in the horizontal cross-section corresponds to Figure 19a, forming an upward convex trend with a low top and bottom and a high center.
The distribution law of generator temperature can be derived from the discussion and results, which is of significant reference value for future research on plateau generators. By understanding the temperature distribution across the generator and its different sections, it becomes feasible to strategically position temperature sensors. These sensors enable the effective monitoring of the generator’s operational status and various components. This not only provides convenience to operators and designers but also reduces manufacturing costs and advances the maintenance and protection of the generator.

4. Conclusions

This paper numerically studied the temperature field of a three-dimensional hydro-generator, which specifically focuses on a hydro-generator operating in a plateau environment. It aims to investigate and analyse the effects of varying atmospheric pressures, ambient temperatures, and rotational speeds on the temperature of the generator. Through the numerical results, a reasonable judgement can be made and can provide certain references for the threshold range of a plateau generator’s structural materials. This study provides a certain reference basis for choosing or producing a hydro-generator in a plateau climate, which is important for improving integrated hydraulic performance. From the discussion and results, the following especial conclusions can be drawn:
  • The generator temperature decreases with increasing air pressure, and there is a negative correlation between the two. When the air pressure lies in the range of 25 kPa–85 kPa, the temperature change gradient of the stator structure is very large. The temperature difference gradually decreases with the increase in air pressure. In particular, when the air pressure is located at 55–85 kPa, the average temperature difference of the stator windings is 6.325 °C, and the average temperature difference of the stator core is 3.815 °C. The temperature gradient gradually slows down when the air pressure is above 85 kPa;
  • The generator temperature increases linearly with increasing ambient temperature. An increase in external ambient temperature may be accompanied by an increase in load, resulting in more losses and heat generated by the generator. When the ambient temperature gradually increases from −10 °C to 60 °C, the temperature of the stator windings and stator core also gradually increases. Specifically, when the external ambient temperature increases by 10 °C, the generator temperature increases by 10 °C.
  • The generator temperature decreases with increasing speed and the two are positively correlated. The temperature of the generator stator winding fluctuates greatly during below-the-rated-speed operation, with a difference of about 15 °C between the maximum and minimum temperatures. The temperature variations in both the vertical and the horizontal sections show an upward convex trend.
The study has collected temperature distribution data under various air pressures, ambient temperatures, and rotational speeds. Based on the temperature distribution data, this study establishes a robust foundation and framework for future research in related domains. However, the next step involves exploring the temperature variation mechanism at the monitoring points in depth. This exploration is expected to offer a more comprehensive understanding of the dynamic characteristics of the temperature field. Going forward, this research will have an impact on the field of power engineering in plateau environments.

Author Contributions

Conceptualisation and methodology, R.S. and J.D.; software, R.S., G.D., and M.Z.; validation, R.S., J.D., and Y.Z.; formal analysis, J.D. and Y.Z.; writing—original draft preparation, R.S.; writing—review and editing, R.S., J.D., and Y.Z.; supervision, J.Z.; funding acquisition, J.D., Y.Z., and J.Q. All authors have read and agreed to the published version of the manuscript.

Funding

This research was funded by the ranking at the top of the list for science and technology projects of Yunnan Province, grant number 202204BW050001. This research was funded by Yunnan Fundamental Research Projects, grant number 202201AU070114. This research was funded by the National Natural Science Foundation of China (NSFC) Project, grant number 52079059. This research was funded by the National Natural Science Foundation of China (NSFC) Project, grant number 52269020.

Data Availability Statement

Some or all data, models, or codes that support the findings of this study are available from the corresponding author upon reasonable request.

Acknowledgments

Thanks to Hefei’s advanced computing center. These numerical computations were performed at Hefei’s advanced computing center.

Conflicts of Interest

The authors declared that they have no conflicts of interest in this work.

References

  1. Torriano, F.; Lancial, N.; Lévesque, M.; Rolland, G.; Hudon, C.; Beaubert, F.; Morissette, J.-F.; Harmand, S. Heat transfer coefficient distribution on the pole face of a hydrogenerator scale model. Appl. Therm. Eng. 2014, 70, 153–162. [Google Scholar] [CrossRef]
  2. Wang, X.; Li, B.; Gerada, D.; Huang, K.; Stone, I.; Worrall, S.; Yan, Y. A critical review on thermal management technologies for motors in electric cars. Appl. Therm. Eng. 2022, 201, 117758. [Google Scholar] [CrossRef]
  3. Nogal, Ł.; Magdziarz, A.; Rasolomampionona, D.D.; Łukaszewski, P.; Sapuła, Ł.; Szreder, R. The laboratory Analysis of the thermal processes occurring in low-voltage asynchronous electric motors. Energies 2021, 14, 2056. [Google Scholar] [CrossRef]
  4. Chang, M.; Lai, B.; Wang, H.; Bai, J.; Mao, Z. Comprehensive efficiency analysis of air-cooled vs water-cooled electric motor for unmanned aerial vehicle. Appl. Therm. Eng. 2023, 225, 120226. [Google Scholar] [CrossRef]
  5. Ma, P.; Wang, G.; Duan, H.; Jiang, T.; Luo, Y. Investigation and application of thermal design of large-scale wind turbines based on CFD numerical simulation. J. Chin. Soc. Power Eng. 2023, 43, 568–574. [Google Scholar] [CrossRef]
  6. Wu, S.; Li, W.; An, Z.; Yu, S. Thermal analysis of variable-speed constant-voltage hybrid excited wind generators. Trans. China Electrotech. Soc. 2019, 34, 1857–1864. [Google Scholar] [CrossRef]
  7. Saleem, A.; Hyeon Park, M.; Ambreen, T.; Kim, S.C. Optimization of oil flow distribution inside the in-wheel motor assembly of electric vehicles for improved thermal performance. Appl. Therm. Eng. 2022, 201, 117753. [Google Scholar] [CrossRef]
  8. Venne, K.; Torriano, F.; Mydlarski, L.; Baliga, B. Validation of a numerical model for hot-spot detection on the surface of a rotor pole using a scale model of a hydroelectric generator. Appl. Therm. Eng. 2022, 215, 118967. [Google Scholar] [CrossRef]
  9. Su, Y.; Li, W.; Li, D.; Li, D.; Li, Y.; Liu, W. Influence of incident angle of hydrogen in the ventilation ducts on multi-physical fields of 1100 MW turbine-generator rotor. Int. J. Heat Mass Transf. 2019, 140, 852–861. [Google Scholar] [CrossRef]
  10. Zhao, Z.; Mei, T.; Li, J.; Liu, G. Ventilation structure design and heat transfer analysis of 3.3MW permanent magnet direct drive wind generators. Energy Rep. 2022, 8, 1280–1286. [Google Scholar] [CrossRef]
  11. Zhou, Y. Analysis and research on key technologies of high speed and large capacity horizontal hydro-generator. Manuf. Autom. 2022, 44, 137–141. [Google Scholar]
  12. Dang, D.-D.; Pham, X.-T.; Nguyen, C.-C. Thermal performance prediction in the air gap of a rotor-stator configuration: Effects of numerical models. J. Therm. Sci. 2020, 29, 206–218. [Google Scholar] [CrossRef]
  13. Yang, Y.; Xiao, Y.; Du, Z.; Feng, X. Data-driven varying state-space model based on thermal network for transient temperature field prediction of motorized spindles. Appl. Therm. Eng. 2023, 219, 119456. [Google Scholar] [CrossRef]
  14. Han, N.G.; Lee, H.L.; Kim, R.H.; Beom, T.Y.; Kim, Y.K.; Ha, T.W.; Lee, S.W.; Kim, D.K. Thermal analysis of the oil cooling motor according to the churning phenomenon. Appl. Therm. Eng. 2023, 220, 119791. [Google Scholar] [CrossRef]
  15. Liu, X.; Yu, H.; Shi, Z.; Xia, T.; Hu, M. Electromagnetic-fluid-thermal field calculation and analysis of a permanent magnet linear motor. Appl. Therm. Eng. 2018, 129, 802–811. [Google Scholar] [CrossRef]
  16. He, L.; Chen, H.; Wu, H.; Ge, S.; Shi, W.; Yan, X. Study on temperature rise characteristics of vehicle permanent magnet synchronous motors under peak working conditions considering boiling heat transfer. J. Xi’an Jiaotong Univ. 2022, 56, 138–146. [Google Scholar] [CrossRef]
  17. Li, W.; Li, D.; Li, J.; Zhang, X. Influence of rotor radial ventilation ducts number on temperature distribution of rotor excitation winding and fluid flow state between two poles of a fully air-cooled hydro-generator. IEEE Trans. Ind. Electron. 2017, 64, 3767–3775. [Google Scholar] [CrossRef]
  18. Han, J.; Ge, B.; Tao, D.; Zhao, H.; Xiao, F.; Li, W. Calculation and analysis of complex fluid flow and thermal fields in a fully air-cooled hydrogenerator. Int. J. Therm. Sci. 2017, 116, 278–286. [Google Scholar] [CrossRef]
  19. Tai, Y.; Liu, Z. Analysis on three-dimensional transient temperature field of induction motor. Proc. Chin. Soc. Electr. Eng. 2010, 30, 114–120. [Google Scholar] [CrossRef]
  20. He, J.; Bian, X.; Liang, Y. Design and Analysis for Stator Cooling Structure of Air Cooled Hydrogenerator. J. Xi’an Jiaotong Univ. 2019, 53, 111–119. [Google Scholar] [CrossRef]
  21. Dang, D.-D.; Pham, X.-T.; Labbe, P.; Torriano, F.; Morissette, J.-F.; Hudon, C. CFD analysis of turbulent convective heat transfer in a hydro-generator rotor-stator system. Appl. Therm. Eng. 2018, 130, 17–28. [Google Scholar] [CrossRef]
  22. Fang, X.; Wu, Y.; Wu, H. Calculation of Motor Temperature Field Based on Fluent. Electron. Sci. Technol. 2021, 34, 30–35. [Google Scholar] [CrossRef]
  23. Li, W.; Song, H.; Yang, F. Numerical of the tubular turbine hydroelectric generator ventilation system multi-field coupling. Electr. Mach. Control 2013, 17, 85–90. [Google Scholar] [CrossRef]
  24. Li, W.; Yuan, S.; Huo, F.; Zhang, Y. Calculation of temperature field of PM generator for wind turbine based on theory of fluid heat transfer. Electr. Mach. Control 2011, 15, 56–62. [Google Scholar] [CrossRef]
  25. Zhou, F.; Xiong, B.; Li, W.; Cheng, S.K. Numerical calculation of 3D stator fluid field for large electrical machine as well as influences on thermal field distribution. Proc. Chin. Soc. Electr. Eng. 2005, 25, 128–132. [Google Scholar] [CrossRef]
  26. Ding, S.; Sun, Z.; Jiang, N.; Deng, L.; Xie, Y. Numerical simulation of rheological properties inside large doubly-fed wind generator. Electr. Mach. Control 2011, 15, 28–34. [Google Scholar] [CrossRef]
  27. Gong, H.; Ge, B.; Tao, D.; Wang, L.; Li, Y. Research on coupling heat transfer of fluid and solid under rotating state of water-cooled permanent magnet synchronous motor for compressor. Proc. CSEE 2021, 41, 7830–7841. [Google Scholar] [CrossRef]
  28. Li, W.; Li, J.; Li, D. Influence of variable section Rotor ventilation ducts on temperature and fluid fields of a full air-cooled large hydro-generator rotor. Trans. China Electrotech. Soc. 2017, 32, 42–49. [Google Scholar] [CrossRef]
  29. He, J. Research on Modeling Method of Stator Fluid and Temperature Field and Cooling Structure of Hydro-Generator. Master’s Thesis, Harbin University of Science and Technology, Harbin, China, 2019. [Google Scholar]
  30. Zhang, S.; Li, W.; Li, J.; Wang, L.; Zhang, X. Research on flow rule and thermal dissipation between the rotor poles of a fully air-cooled hydrogenerator. IEEE Trans. Ind. Electron. 2015, 62, 3430–3437. [Google Scholar] [CrossRef]
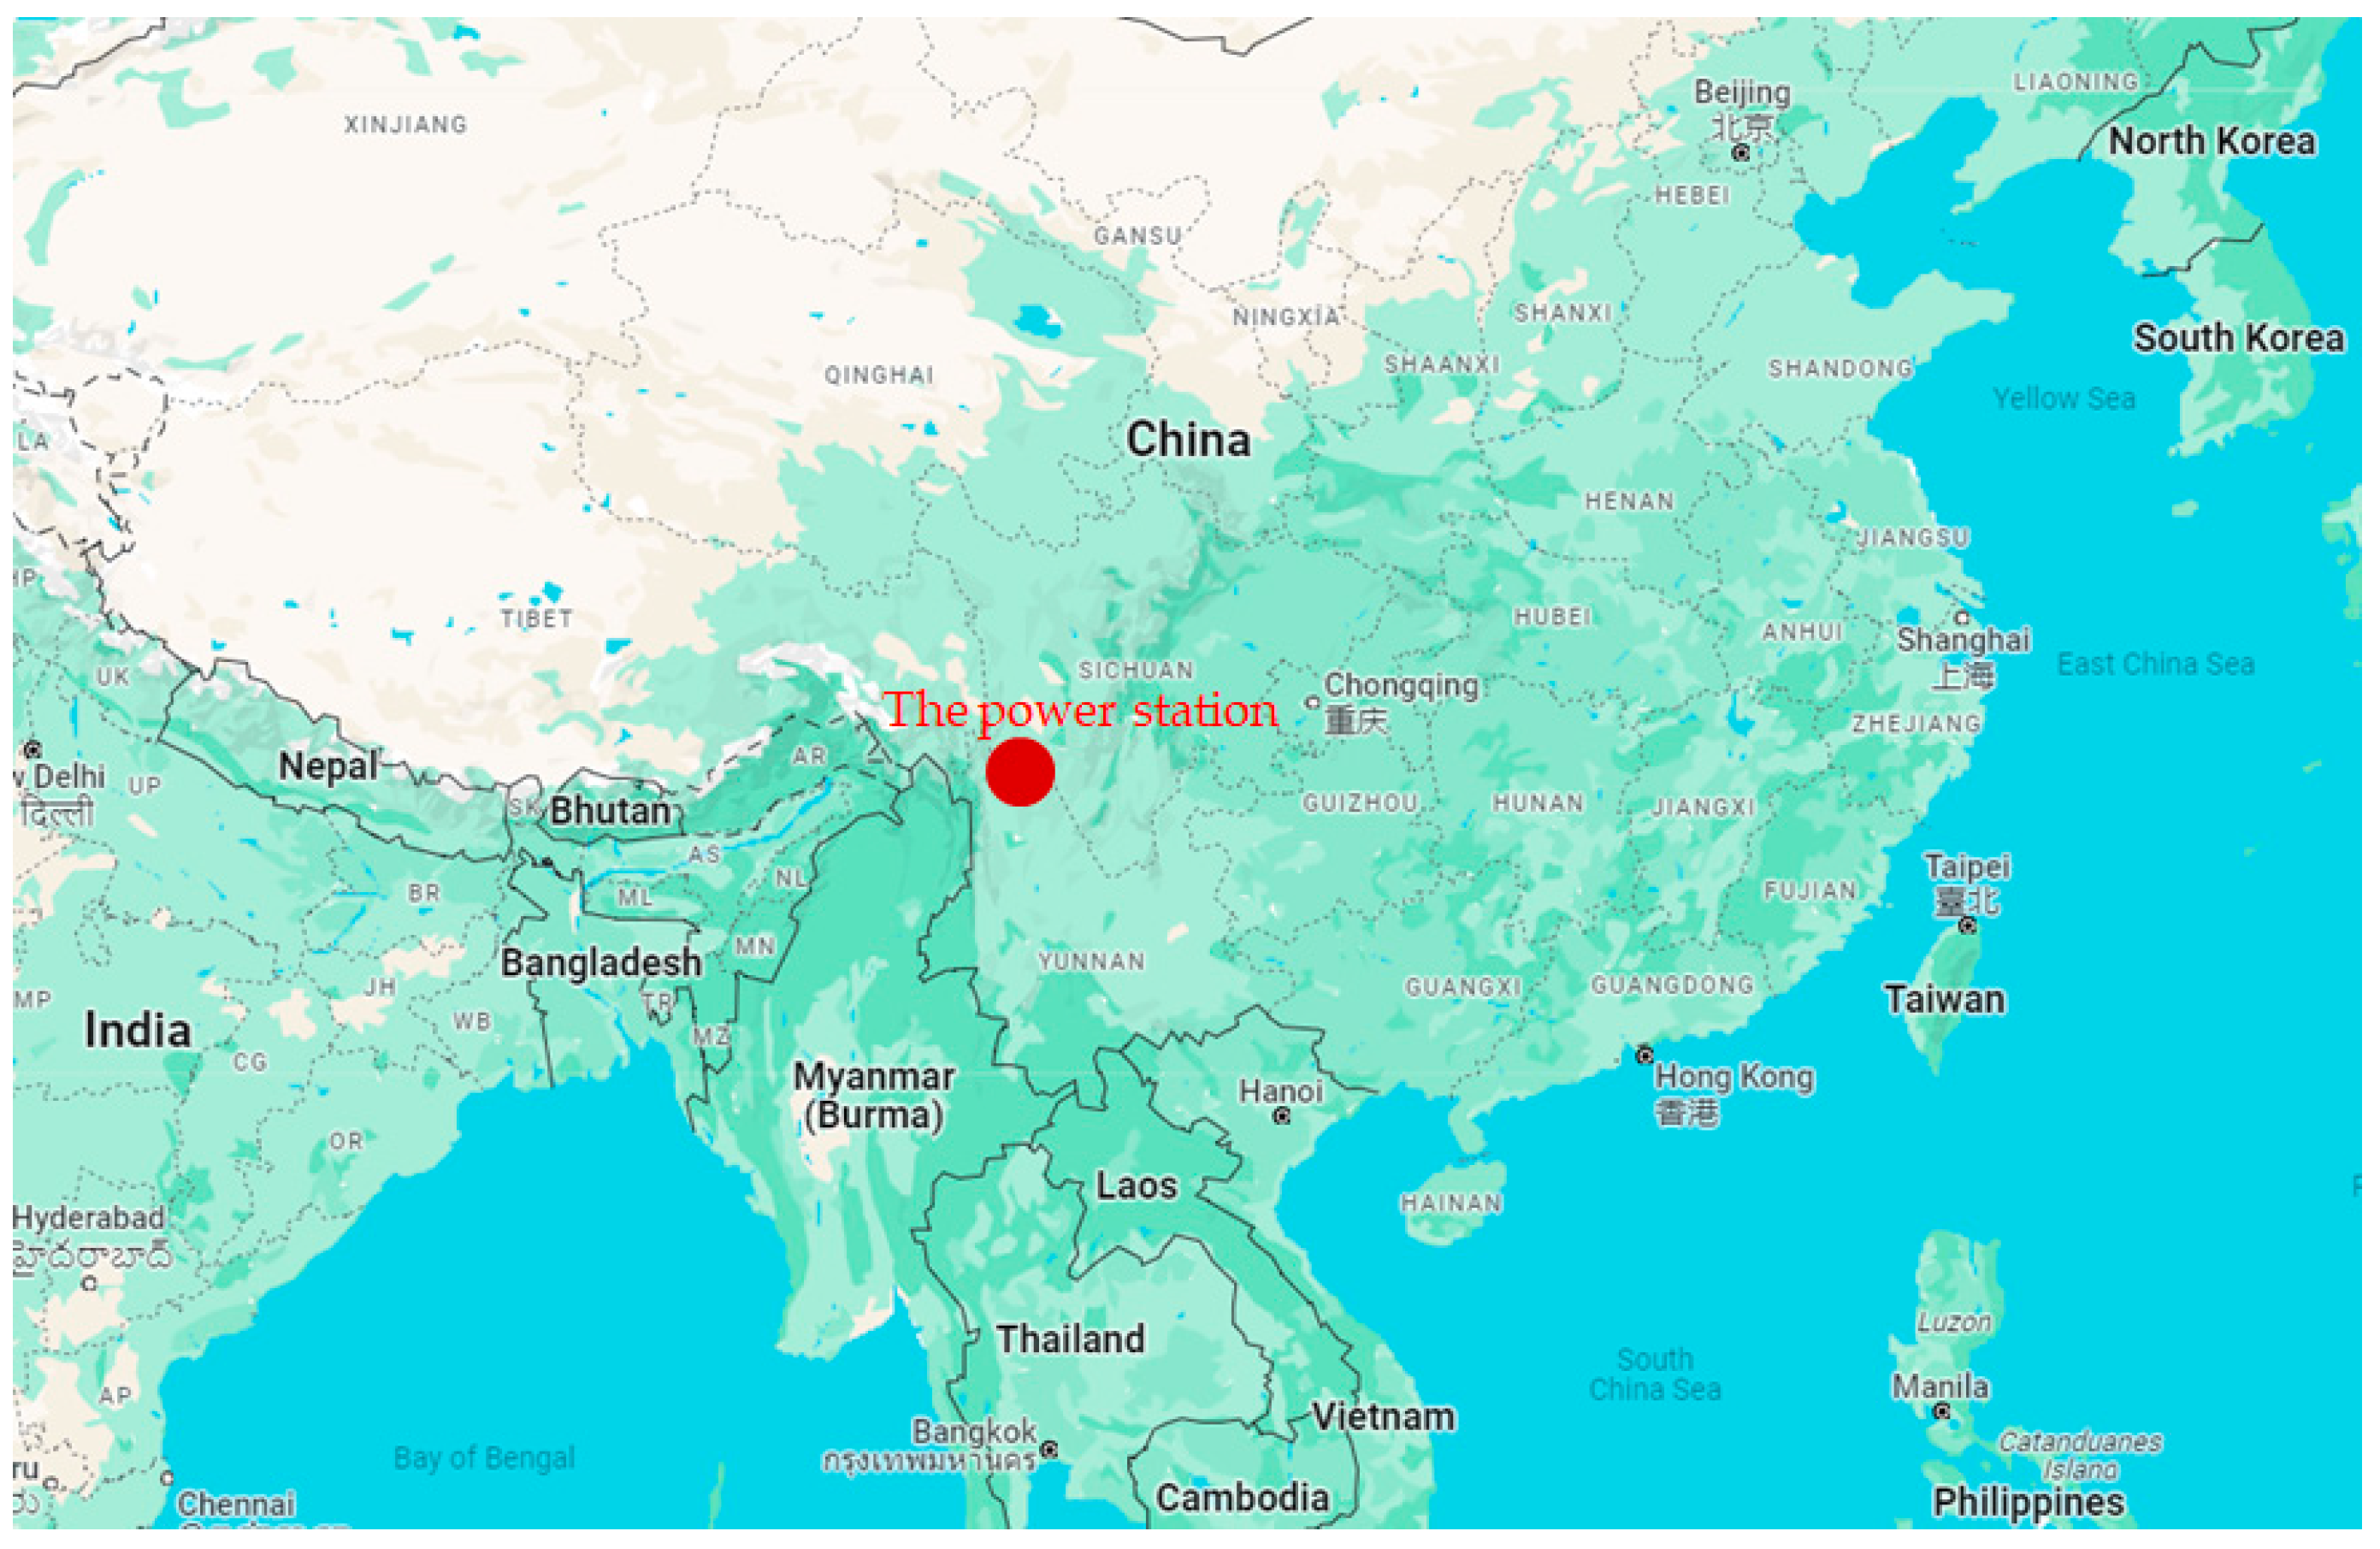
Figure 1. The map with the location of the examined object.
Energies 17 00932 g001
Figure 2. Three-dimensional model of a hydro-generator: (a) actual site structure diagram of the generator; (b) 3D model of the generator.
Energies 17 00932 g002
Figure 3. A model used to simulate calculations: (a) overall profile view of the generator; (b) one-fifth model of the generator.
Energies 17 00932 g003
Figure 4. The meshing of the solved region of the 3D hydro-generator model: (a,b) are co-nodal meshes; (c,d) are local encryption.
Energies 17 00932 g004
Figure 5. Temperature verification comparison of stator structures in January: (a) comparative verification of stator windings; (b) comparative verification of stator cores.
Energies 17 00932 g005
Figure 6. Temperature verification comparison of stator structures in April: (a) comparative verification of stator windings; (b) comparative verification of stator cores.
Energies 17 00932 g006
Figure 7. Temperature distribution clouds of the stator structure at different pressures: (a) 70 kPa; (b) 100 kPa.
Energies 17 00932 g007
Figure 8. The profiles of the maximum temperature of the stator structure at 25 kPa, 40 kPa, 55 kPa, 70 kPa, 85 kPa, and 100 kPa: (a) stator winding; (b) stator core.
Energies 17 00932 g008
Figure 9. Schematic diagram of the distribution of monitoring points on the stator structure: (a) monitoring points for stator windings; (b) monitoring points of the stator core.
Energies 17 00932 g009
Figure 10. Temperature values for each monitoring point in the stator structure at different pressures: (a) stator winding; (b) stator core.
Energies 17 00932 g010
Figure 11. Flow velocity distribution inside the generator at different pressures: (a) 70 kPa; (b) corresponding rotor schematic; (c) 100 kPa.
Energies 17 00932 g011
Figure 12. Temperature distribution clouds of the stator structure at different ambient temperatures: (a) 15 °C; (b) 10 °C.
Energies 17 00932 g012
Figure 13. Maximum temperature trend of stator structure at −10 °C, 0 °C, 10 °C, 20 °C, 30 °C, 40 °C, 50 °C, and 60 °C: (a) stator winding; (b) stator core.
Energies 17 00932 g013
Figure 14. Temperature values of the monitoring points in the stator structure at different external ambient temperatures: (a) stator winding; (b) stator core.
Energies 17 00932 g014
Figure 15. Temperature distribution clouds of the stator structure at different rotational speeds: (a) 300 r/min; (b) 600 r/min; (c) 900 r/min.
Energies 17 00932 g015
Figure 16. Temperature values for each monitoring point in the stator structure at different speeds: (a) stator winding; (b) stator core.
Energies 17 00932 g016
Figure 17. Schematic diagram of the location of the plane: (a) vertical section; (b) horizontal section.
Energies 17 00932 g017
Figure 18. Temperature changes in the vertical direction: (a) temperature trends in vertical sections of 8 cases; (b) temperature distribution cloud for Case 6 and Case 8 vertical sections.
Energies 17 00932 g018
Figure 19. Temperature changes in the horizontal direction: (a) temperature trends in horizontal sections of 8 cases; (b) temperature cloud for Case 5 and Case 7 horizontal cross-sections.
Energies 17 00932 g019
Table 1. Main parameters of the generator.
ParametersValuesParametersValues
Rated power/kW20,000Rated speed/rpm600
Rated voltage/kV10.5Rated current/A1293.8
Stator outer diameter/mm3300Stator bore/mm2590
Rotor outer diameter/mm2548Rotor inner diameter/mm1816
Core length/mm990Number of generator poles10
Table 2. Specific conditions for simulation modeling cases.
CasePressureAmbient TemperatureRotational SpeedCasePressureAmbient TemperatureRotational Speed
170 kPa15 °C600 r/min1155 kPa15 °C600 r/min
270 kPa10 °C600 r/min1285 kPa15 °C600 r/min
3100 kPa15 °C600 r/min1370 kPa−10 °C600 r/min
4100 kPa10 °C600 r/min1470 kPa0 °C600 r/min
570 kPa15 °C300 r/min1570 kPa20 °C600 r/min
670 kPa15 °C900 r/min1670 kPa30 °C600 r/min
770 kPa10 °C300 r/min1770 kPa40 °C600 r/min
870 kPa10 °C900 r/min1870 kPa50 °C600 r/min
925 kPa15 °C600 r/min1970 kPa60 °C600 r/min
1040 kPa15 °C600 r/min
Table 3. Actual power plant operating data for April.
Operational Log of Temperature Values for Unit 1 of the Secondary Power Plant
TimeH1/mT1/°CT2/°CT3/°CT4/°CT5/°CT6/°Ct1/°Ct2/°Ct3/°Ct4/°Ct5/°Ct6/°CTm/°CP/MPa
0:00258250.650.543.748.245.348.748.243.344.249.145.749.835.45.88
1:00258250.550.443.648.245.448.848.243.244.149.145.649.835.65.89
2:00258250.550.443.548.145.348.748.143.244.149.145.649.8356.1
3:00258250.550.443.548.145.248.748.143.24449.145.649.7355.96
4:00258250.550.443.54845.248.648.143.1444945.549.734.85.83
5:00258250.450.343.64845.248.74843.1444945.649.735.26.06
6:00258250.450.343.54845.148.74843.143.948.945.549.635.25.94
7:00258250.450.243.44845.148.64843.143.848.945.549.635.65.83
8:00258250.450.343.54845.248.748.143.143.848.945.549.635.86.05
9:00258250.650.443.548.145.248.748.143.143.949.145.649.636.65.91
10:00258250.550.343.54845.248.648.143.143.84945.549.636.46.1
11:00258250.550.443.54845.248.748.143.143.94945.549.636.45.91
12:00258250.550.443.548.145.348.748.143.143.94945.649.635.36.17
13:00258250.550.343.548.145.248.748.143.243.94945.649.635.35.97
14:00258250.650.443.548.245.348.848.243.24449.145.649.735.55.82
15:00258250.750.543.648.345.448.848.243.34449.245.749.734.96.08
16:00258250.750.643.748.345.448.948.343.244.149.345.749.834.35.96
17:00258250.750.643.648.345.548.848.443.344.149.245.749.833.65.83
18:00258250.850.543.748.345.448.948.343.344.149.245.749.834.66.02
19:00258250.650.543.748.345.548.848.343.344.149.245.749.833.85.84
20:00258250.750.543.748.245.548.948.343.344.149.245.749.833.86.08
21:00258250.650.543.748.345.448.848.343.344.149.145.749.834.25.93
22:00258250.650.543.748.245.448.948.343.244.149.245.749.934.66.15
23:00258250.650.443.748.145.348.748.143.24449.145.649.834.45.98
max values258250.850.643.748.345.548.948.443.344.249.345.749.936.66.2
AnnotationH1: pre-dam elevation T1–T6: the temperature of stator winding t1–t6: the temperature of stator core
Tm: the temperature of main transformer No. 1 P: governor oil pressure
Table 4. Actual power plant operating data for January.
Operational Log of Temperature Values for Unit 1 of the Secondary Power Plant
TimeH1/mT1/°CT2/°CT3/°CT4/°CT5/°CT6/°Ct1/°Ct2/°Ct3/°Ct4/°Ct5/°Ct6/°CTm/°CP/MPa
0:002581.338.538.134.737.835.837.837.834.935.437.636.238.652.25.95
1:002581.337.737.434.337.235.337.237.234.534.93735.838.152.45.95
2:002581.337.637.334.137.135.23737.134.434.836.935.637.952.25.81
3:002581.437.537.234.13735.136.93734.334.736.835.537.851.25.94
4:002581.437.537.234.13735.136.93734.334.736.835.537.850.66.01
5:002581.537.537.13436.93536.936.934.234.636.735.537.749.85.83
6:002581.537.437.13436.93536.936.934.234.636.735.537.850.05.94
7:002581.637.4373436.93536.836.934.234.636.735.437.748.16.03
8:002581.637.43733.936.93536.836.834.134.536.635.437.650.15.84
9:002581.637.43733.936.93536.836.834.134.536.735.337.648.65.9
10:002581.737.336.933.836.734.936.636.73434.436.635.337.550.56
11:002581.737.236.833.736.734.836.636.733.934.336.535.237.449.96.13
12:002581.836.836.533.536.434.536.236.333.734.136.134.937.151.95.94
13:002581.838.538.134.537.635.737.737.634.535.137.63638.553.25.82
14:002581.839.238.835.138.336.238.438.335.235.638.236.539.255.96.05
15:002581.739.43935.338.536.438.638.535.435.838.536.839.450.95.82
16:002581.738.438.134.837.735.837.737.83535.437.636.338.642.95.89
17:002581.737.937.634.437.335.537.237.334.6353735.938.144.95.86
18:002581.837.637.334.237.135.23737.134.434.836.935.637.850.86.06
19:002581.937.537.234.13735.236.93734.334.736.835.637.852.76.1
20:002581.937.4373436.93536.736.934.234.636.735.437.652.26.01
21:002581.938.43834.537.635.737.637.734.735.237.536.138.550.55.81
22:002581.938.838.434.83835.9383834.935.437.936.338.849.25.98
23:002581.838.33834.437.535.637.637.634.635.137.43638.449.85.99
max values2581.939.43935.338.536.438.638.535.435.838.536.839.455.96.1
AnnotationH1: pre-dam elevation T1–T6: the temperature of stator winding t1–t6: the temperature of stator core
Tm: the temperature of main transformer No. 1 P: governor oil pressure
Disclaimer/Publisher’s Note: The statements, opinions and data contained in all publications are solely those of the individual author(s) and contributor(s) and not of MDPI and/or the editor(s). MDPI and/or the editor(s) disclaim responsibility for any injury to people or property resulting from any ideas, methods, instructions or products referred to in the content.