1. Introduction
Wind energy is gaining significant attention with increasing demand for renewable energy as well as global policies for reducing carbon emissions [
1,
2]. Based on long-term progress, accumulated proven data, and advanced technologies, wind energy has become a reliable renewable energy resource. Because the construction of large offshore wind farms has been planned based on economics, abundant wind resources, and fewer objections from residents, large wind turbines with a capacity of more than 10 MW and blades more than 100 m long have become popular today [
3,
4,
5].
However, operation and maintenance tasks are becoming more important and difficult because offshore wind turbines are located far from shore. This significantly hinders the accessibility and labor tasks compared to those for the onshore wind turbines [
6,
7]. Therefore, reducing the failure risk of components through good monitoring at the manufacturing and testing stages and the early detection of component issues before failure occurs are highly important.
The wind blade is one of the most important and critical components of a wind turbine. They are exposed to harsh environmental conditions such as rain, moisture, ultraviolet (UV) radiation, extreme winds such as typhoons, and temperature variations. During the past decade, the blade has grown to more than 100 m in length and has become slender to make efficient use of strong and stable wind resources on the ocean. Moreover, the structural behavior has become complex compared to that of a traditional blade, and is often difficult to detect using conventional testing and measurement approaches. Therefore, the demand for more advanced testing that reflects real conditions and improved measurement techniques has increased [
8,
9,
10].
Traditionally, contact measurement methods using traditional transducers, such as strain gauges, string extensometers, and accelerometers, have been used to detect the strain or displacement response of device under testing (DUT)-like specimens and full-scale blades [
11,
12,
13,
14,
15]. Although these sensing devices have been widely used for a long time, such conventional methods provide information only at designated discrete points; thus, the complicated and complex structural behavior cannot be easily and quickly measured using a limited set of contact-sensing devices. In addition, installing the devices on a large wind blade is labor-intensive and normally takes several weeks to set up; this also requires many signal cables, which can cause signal noise and additional weight, and impact the blade frequency measurement owing to expensive and lengthy wiring.
Recently, optical measurement methods such as DIC, which provide displacement fields and/or strain fields, have been actively researched and implemented in industry [
16]. Some of these methods can only measure in-plane displacements/strains on planar specimens, whereas others can provide both in-plane and out-of-plane displacement/strain fields on any type of specimen (planar or not). Thus, when used with a single camera (Classical DIC or two-dimensional (2D) DIC), the 2D DIC method can only measure the in-plane displacement/strain fields on planar objects. Using two cameras (stereo vision), the displacement field and surface strain field of any three-dimensional (3D) object can be measured. The DIC method has been used not only for the determination of material properties, such as static properties, the elastic modulus, Poisson’s ratio, and ultimate strength, but also for the determination of the coefficient of thermal expansion (CTE) under thermal loading in a heating chamber. This shows that 3D DIC is a practical and effective tool for full-field thermal deformation and CTE measurements of soft materials such as thin-film structures or elastomers [
17,
18].
During the past decade, some studies have been conducted on the application of DIC in wind-blade structure testing. Poozesh et al. utilized the 3D DIC method to determine the surface geometry, deformation, and strain displacement over a large area on a 50 m utility-scale wind blade subjected to quasi-static and cyclic loadings [
19]. However, this was restricted to measuring only a portion of the full-scale blade. LeBlanc et al. used a portable stereo DIC setup system to measure the strain and displacement over the entire surface of a 9 m TPI composite CX-100 blade with and without an applied load [
20]. In their study, the entire blade was divided into 16 fields of view (FOVs), and each FOV was captured using a single stereo DIC system. Ozbek et al. used four CCD cameras to monitor the vibration characteristics of a 2.5 MW wind turbine blade during operation [
21].
Winstroth et al. measured 3D movement and obtained the deflection of 3.2 MW wind turbine blades using DIC and showed that 3D DIC could be a potential method for monitoring the condition of wind turbine blades [
22]. Zhao et al. measured the full-field displacement of the blades of a 1.5 MW wind turbine using a system of three stereo cameras [
23]. Carr et al. performed dynamic tests on wind turbine blades and obtained the corresponding full-field strain measurements using DIC [
24].
The international standards document IEC 61400-23 and IEC 61400-5 specify material properties and frequency testing [
25,
26]. The current study could be part of future research to replace traditional contact measurement technology (using strain gauges and accelerometers) with a noncontact measurement approach using 3D DIC technology.
In this study, the possibility of applying 3D DIC technology to the blade certification process was studied using material and frequency testing. The present research aims to apply a 3D DIC technique to the measurement of material properties at the coupon size level, and to measure the structural dynamic behavior of a small-sized wind blade. In the current study, a stereovision technique using two cameras to measure 3D displacement/strain fields on any 3D object was used to measure the full-field strain and displacement of the DUTs. First, the material properties of the GRFP specimen were measured by specifying the wind-blade structure. To validate the 3D DIC application, conventional contact measurement instruments, such as strain gauges, were installed on the specimens in parallel. Second, the 3D DIC method was applied to measure the first flapwise frequency of a small blade (3.76 m in length) and was verified with modal test results using an impact hammer and accelerometers. Based on validation with the conventional contact measurement approach, it is expected that the 3D DIC method could be an alternative technique for wind blade property measurement upon more validation tests.
2. Sensing Techniques for the Property Measurement of Material and Blade
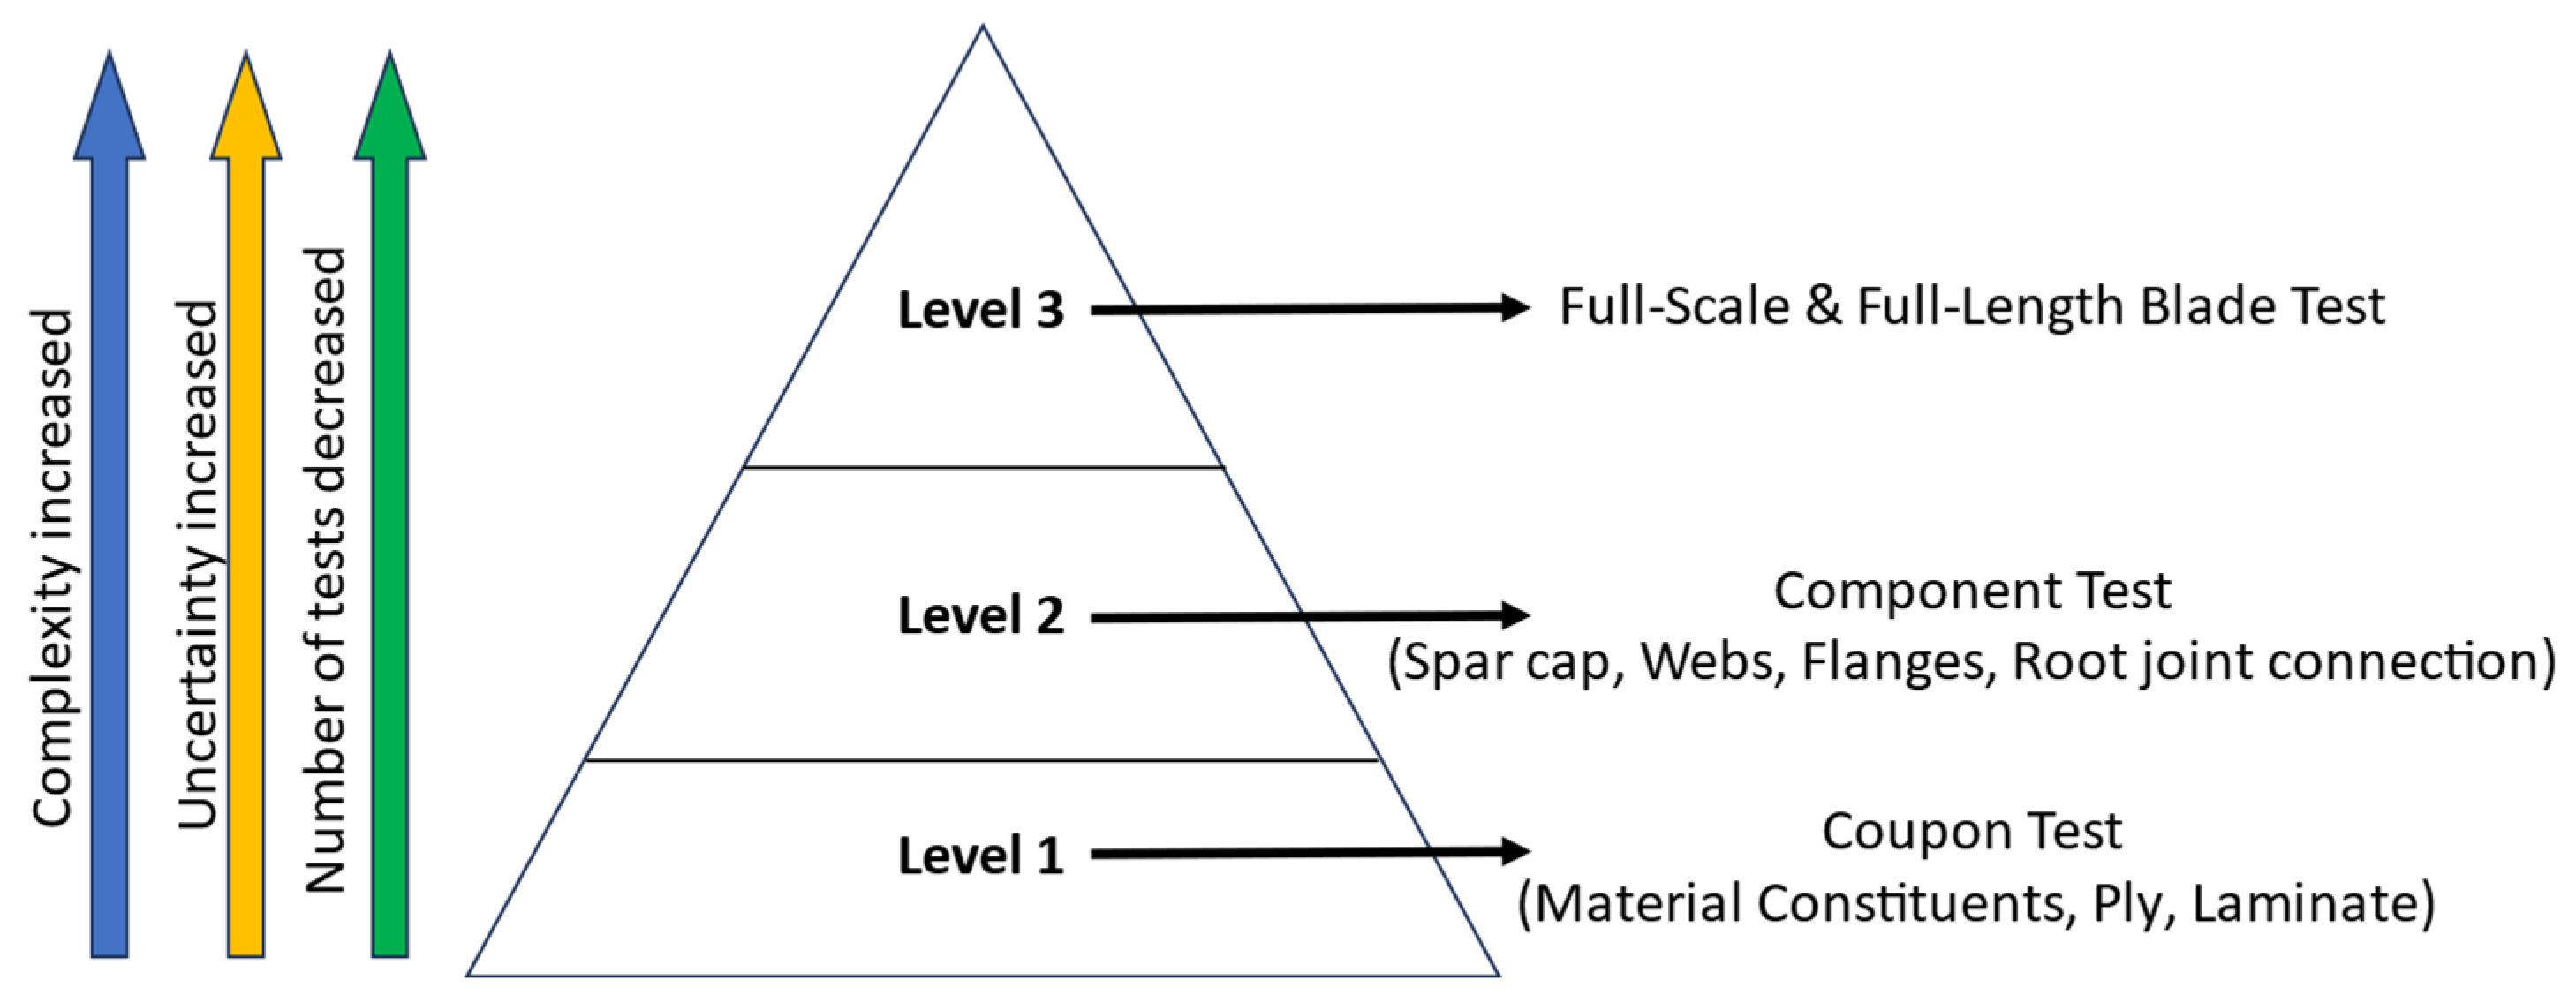
To verify a wind blade through the validation and verification process of the blade design model, an assessment based on the test pyramid shown in
Figure 1 is typically performed. Among these tests, coupon tests for material properties and full-scale tests for blade properties and structural integrity are necessary, whereas subcomponent tests for beams, flanges, and web connections are optional.
The characteristics of the materials used for blade manufacturing were used for blade design and design model verification with manufactured blades based on IEC 61400-5, which should be experimentally obtained or provided by OEM suppliers. Full-scale blade testing is also required according to IEC 61400-23, which states that the following tests should be performed:
- -
Blade weight, center of gravity, first natural frequencies in the flap, and edge directions.
- -
Pre-static testing.
- -
Fatigue testing.
- -
Post-fatigue static testing.
To perform each of the aforementioned tests, contact transducers are typically used to measure the blade properties.
2.1. Contact Measurement
Traditionally, contact or direct measurement techniques are used, including transducers such as strain gauges and accelerometers placed at specified discrete points on DUTs. During deformation, electrical signals are transferred from the sensing device to the data acquisition (DAQ) system, and finally converted to meaningful engineering information such as the modulus and strength. This method is highly effective for quantifying the deformation at discrete points of an object with high precision.
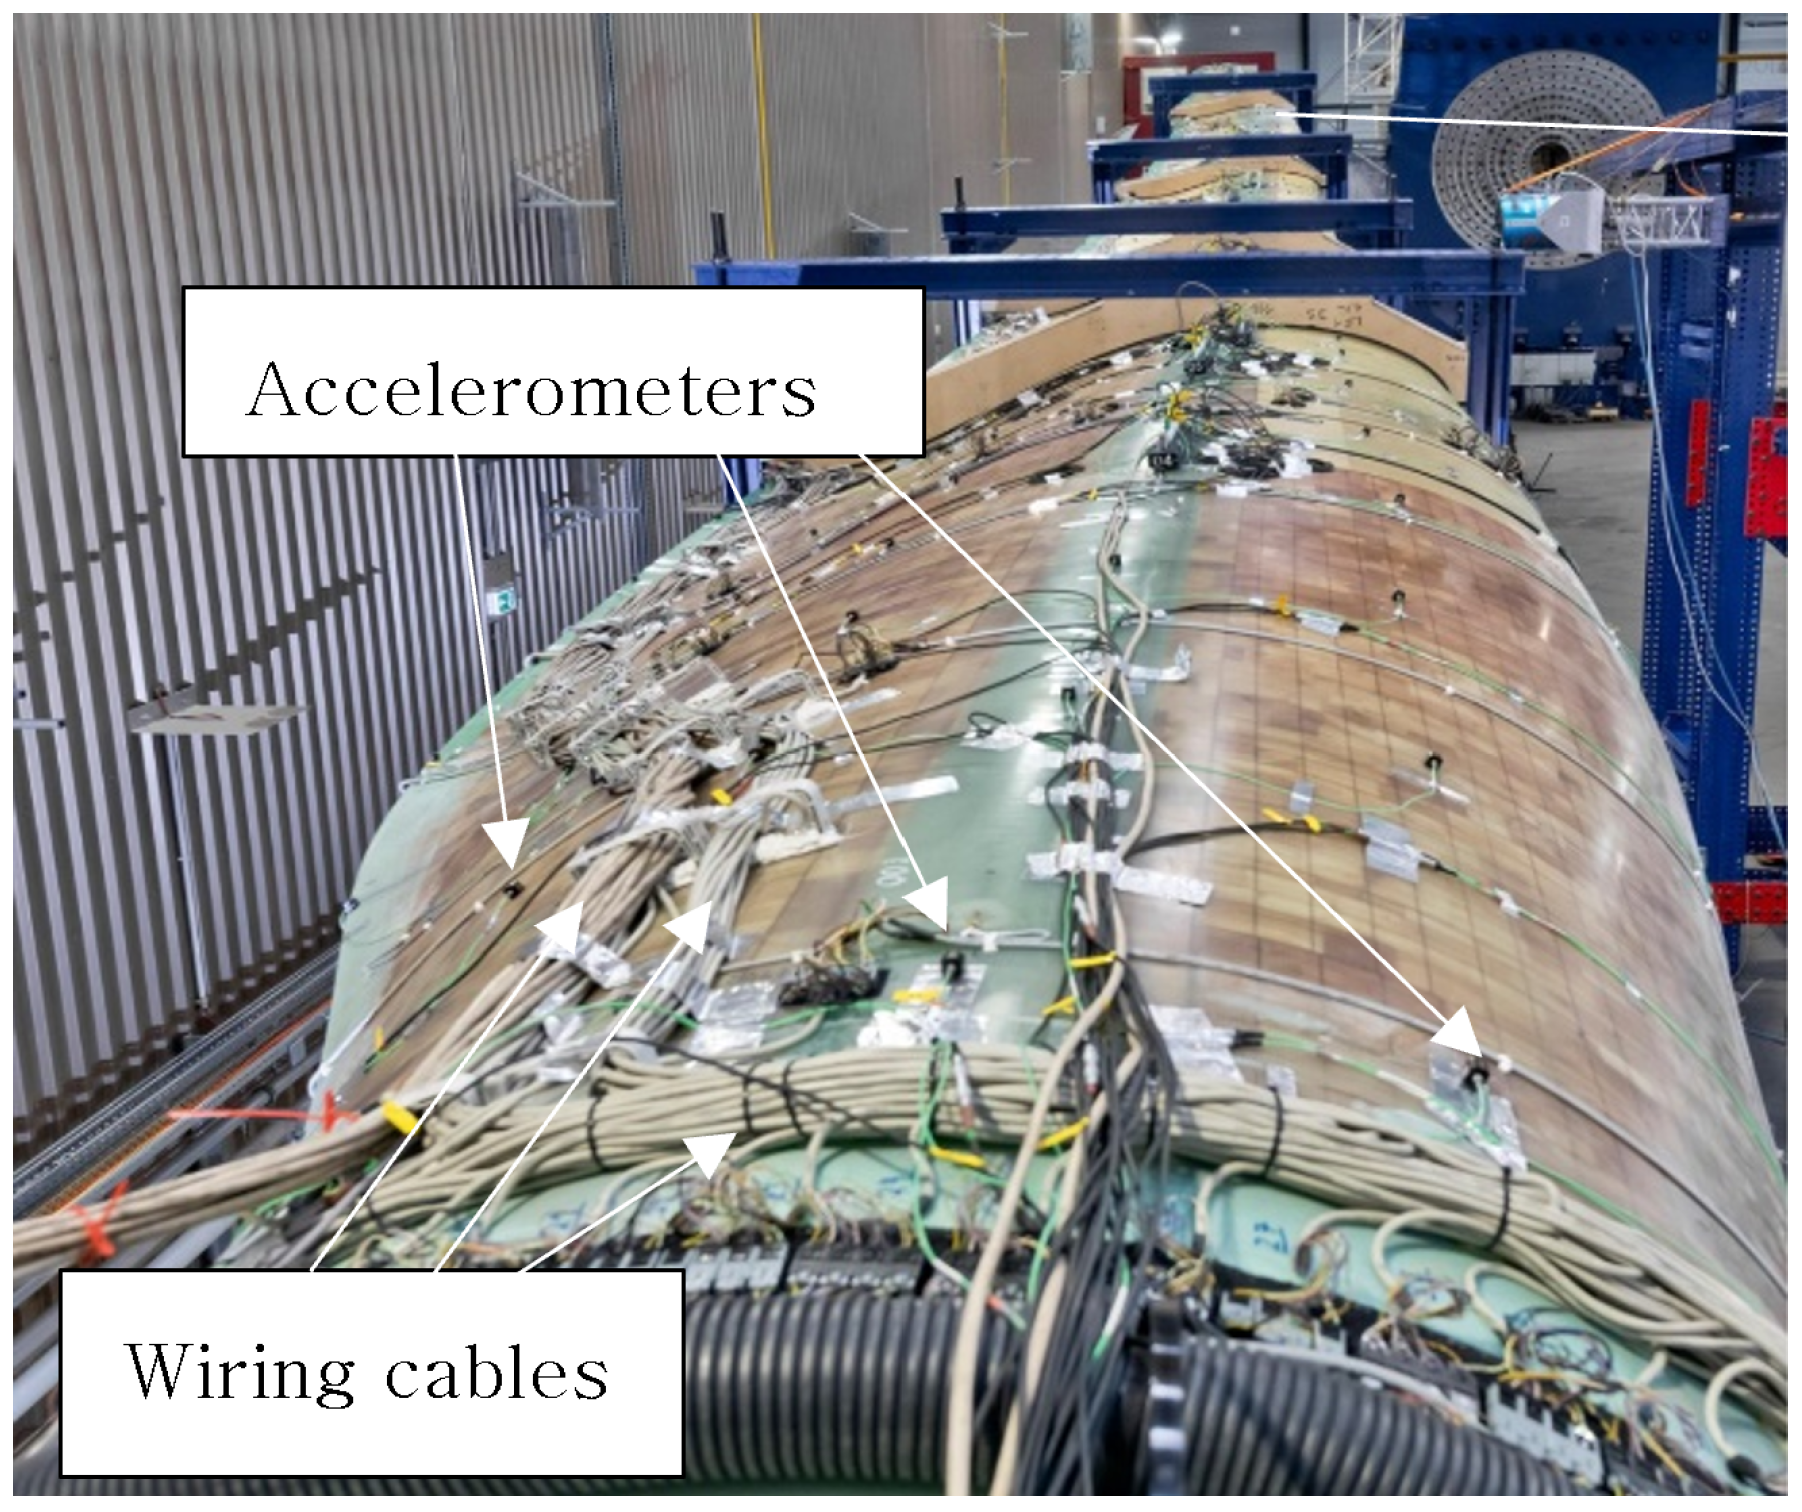
Figure 2 shows a typical contact measurement using sensors, such as accelerometers, on a wind blade.
However, the range of measurement for most contact-based approaches is restricted, and the arrangement of the measurement system is complex, limited, or both. In addition, installing contact-based sensors might introduce structural defects in the blades or deviation in blade characteristics, such as eigenfrequencies, weight, and center of gravity, as shown in
Figure 2. This situation has prompted many studies of noncontact or nondestructive measurement methods.
2.2. Noncontact Measurement
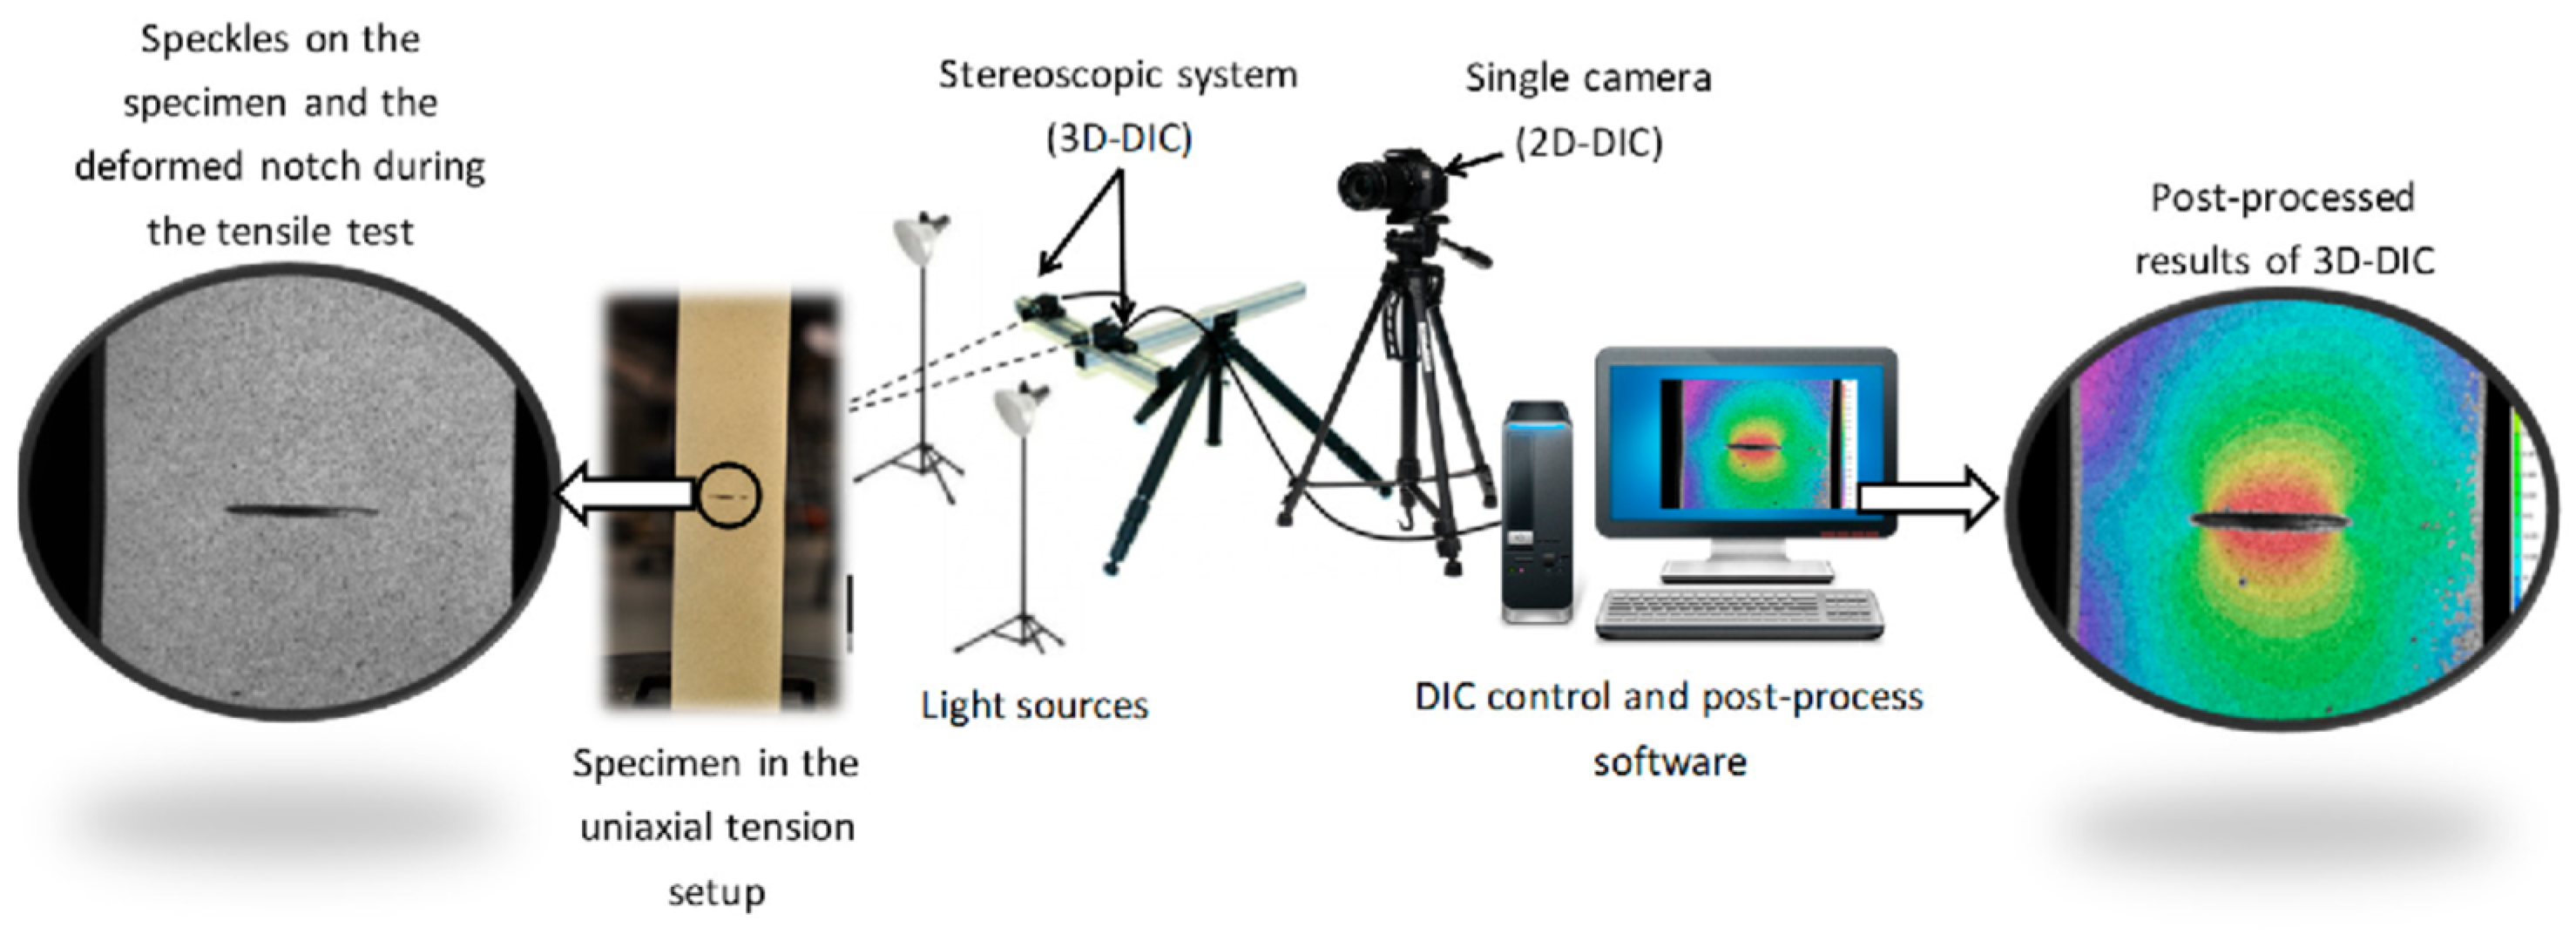
Various noncontact measurement methods have been widely studied, including DIC, thermography, and ultrasonic and nondestructive tests. As a noncontact optical measurement technique, DIC combines digital cameras with recording systems and proven image measurement techniques and can accurately compute the displacements and strains for any given test part. The simplest noncontact method is one-dimensional and can measure the distance between two points on the sample being tested. A single camera with DIC software (Instra4D 4.6) was used to measure the point-to-point tension/compression strain and crack-opening displacement. To measure full-strain or 3D strain values, a stereoscopic imaging capability with at least two cameras pointing to the same object from a fixed distance apart is required; this is known as the 3D DIC method [
28].
Figure 3 shows a schematic of the 2D DIC using a single camera and the 3D DIC technique using two cameras.
Because this method is a noncontact measurement approach, the test data are not affected by the weight of the measuring instruments, the signal noise from lengthy cables, or the sharp edge of the contact device, such as an extensometer attached to the test article. In addition to 3D full-strain and displacement measurements, the 3D DIC method can clearly identify the failure locations of samples, and the recorded test data can be post-processed to validate and even improve the existing finite element model (FEM). DIC has been gaining attention in the areas of material and component testing of wind-blade structures owing to its noncontact principle and ability to measure displacements and derive strains, velocities, and accelerations through post-processing. This interest is because specimen and measurement preparation is easy, especially for large wind-blade structures. The DIC technique could replace traditional measuring devices, such as linear variable differential transformers, strain gauges, and accelerometers currently used for wind blades.
In the next section, 3D DIC utilizing two cameras and image processing software is applied to determine the material characteristics of the glass-fiber-reinforced plastics (GFRPs) typically used for wind-blade structures and validated with simultaneously obtained data from strain gauges. In addition, the 3D DIC technique was applied to measure the first frequency of a small wind blade and was validated with modal test results using accelerometers and numerical data obtained from the FEM analysis.
3. Experimental Verification of DIC Application to Material Tests and Blade Tests
First, the material properties specifying the wind-blade structure were experimentally measured using DIC and verified in parallel with conventional contact measurement instruments such as strain gauges. Second, the DIC method was applied to measure the first flapwise frequency of a small blade (3.76 m in length) and verified with a modal test using an impact hammer and accelerometers. In addition, a frequency analysis of the 3D FE model was executed to verify the application of DIC to wind blade property measurement.
3.1. Measurement of Material Properties
3.1.1. Coupon Preparation
Coupons made of 5-ply GFRP mats infused with vinyl were manufactured according to ASTM D638, as shown in
Figure 4. Their geometric dimensions are listed in
Table 1 [
29].
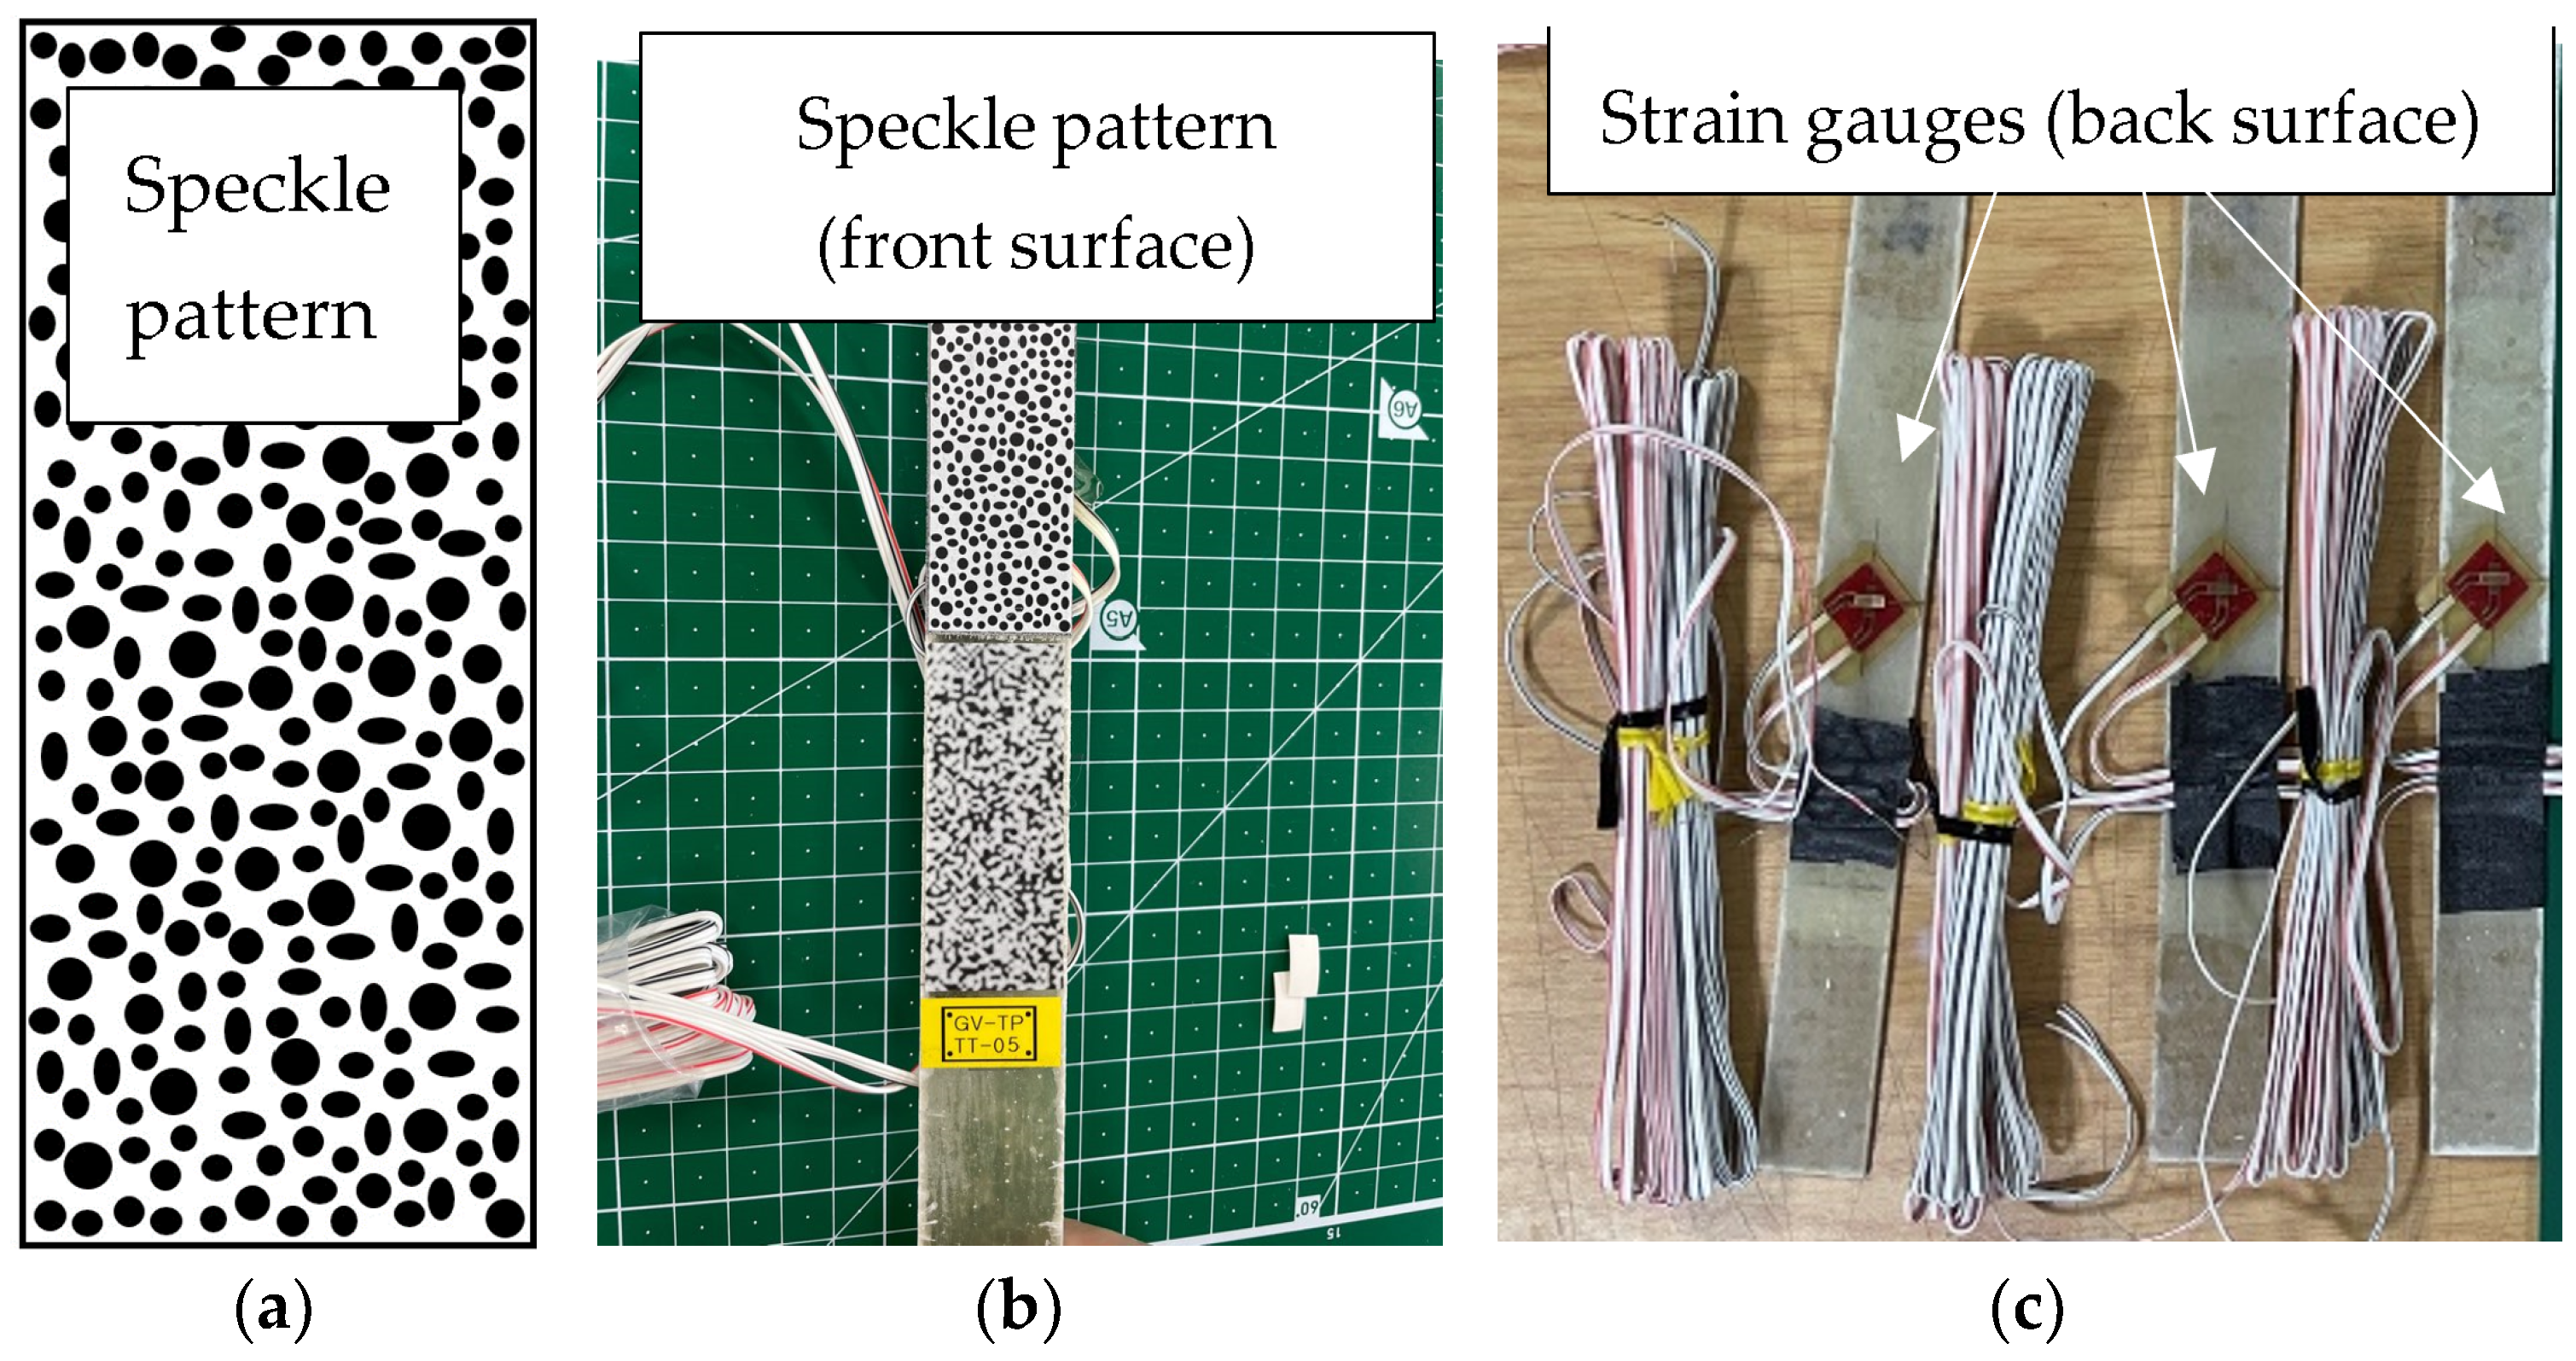
For the DIC methods, urethane papers printed with speckles were made and bonded to the front surface of the coupons, as shown in
Figure 5a,b. Urethane paper is a waterslide paper made of urethane material; it is not normal paper, but highly elastic, handy, and easily bonded paper. The bonding process was simple. After placing the waterslide paper in water for a few seconds or spraying it with water, it was ready to bond to the surface. Once wet, it was slid directly off the backing paper onto the dry prepped nail, and pressed firmly onto the blade surface. After drying for a minimum of an hour, 3D DIC measurement activity began. It is easy to apply onsite without the surface preparation, cables, or chemical bonding necessary for strain gauges, and it is highly elastic because it is made of urethane (which is more elastic than the blade surface material). The elastic paper is sensitive to blade deformation, which is advantageous for 3D DIC utilization. It can also be easily removed for other testing activities and does not leave any trace on the blade surface. Strain gauges bonded with cables are difficult to remove without scarring or surface wear. In this work, for the DIC verification results, strain gauges were also installed on the back surface of the same coupons, as shown in
Figure 5c.
3.1.2. Test Configuration
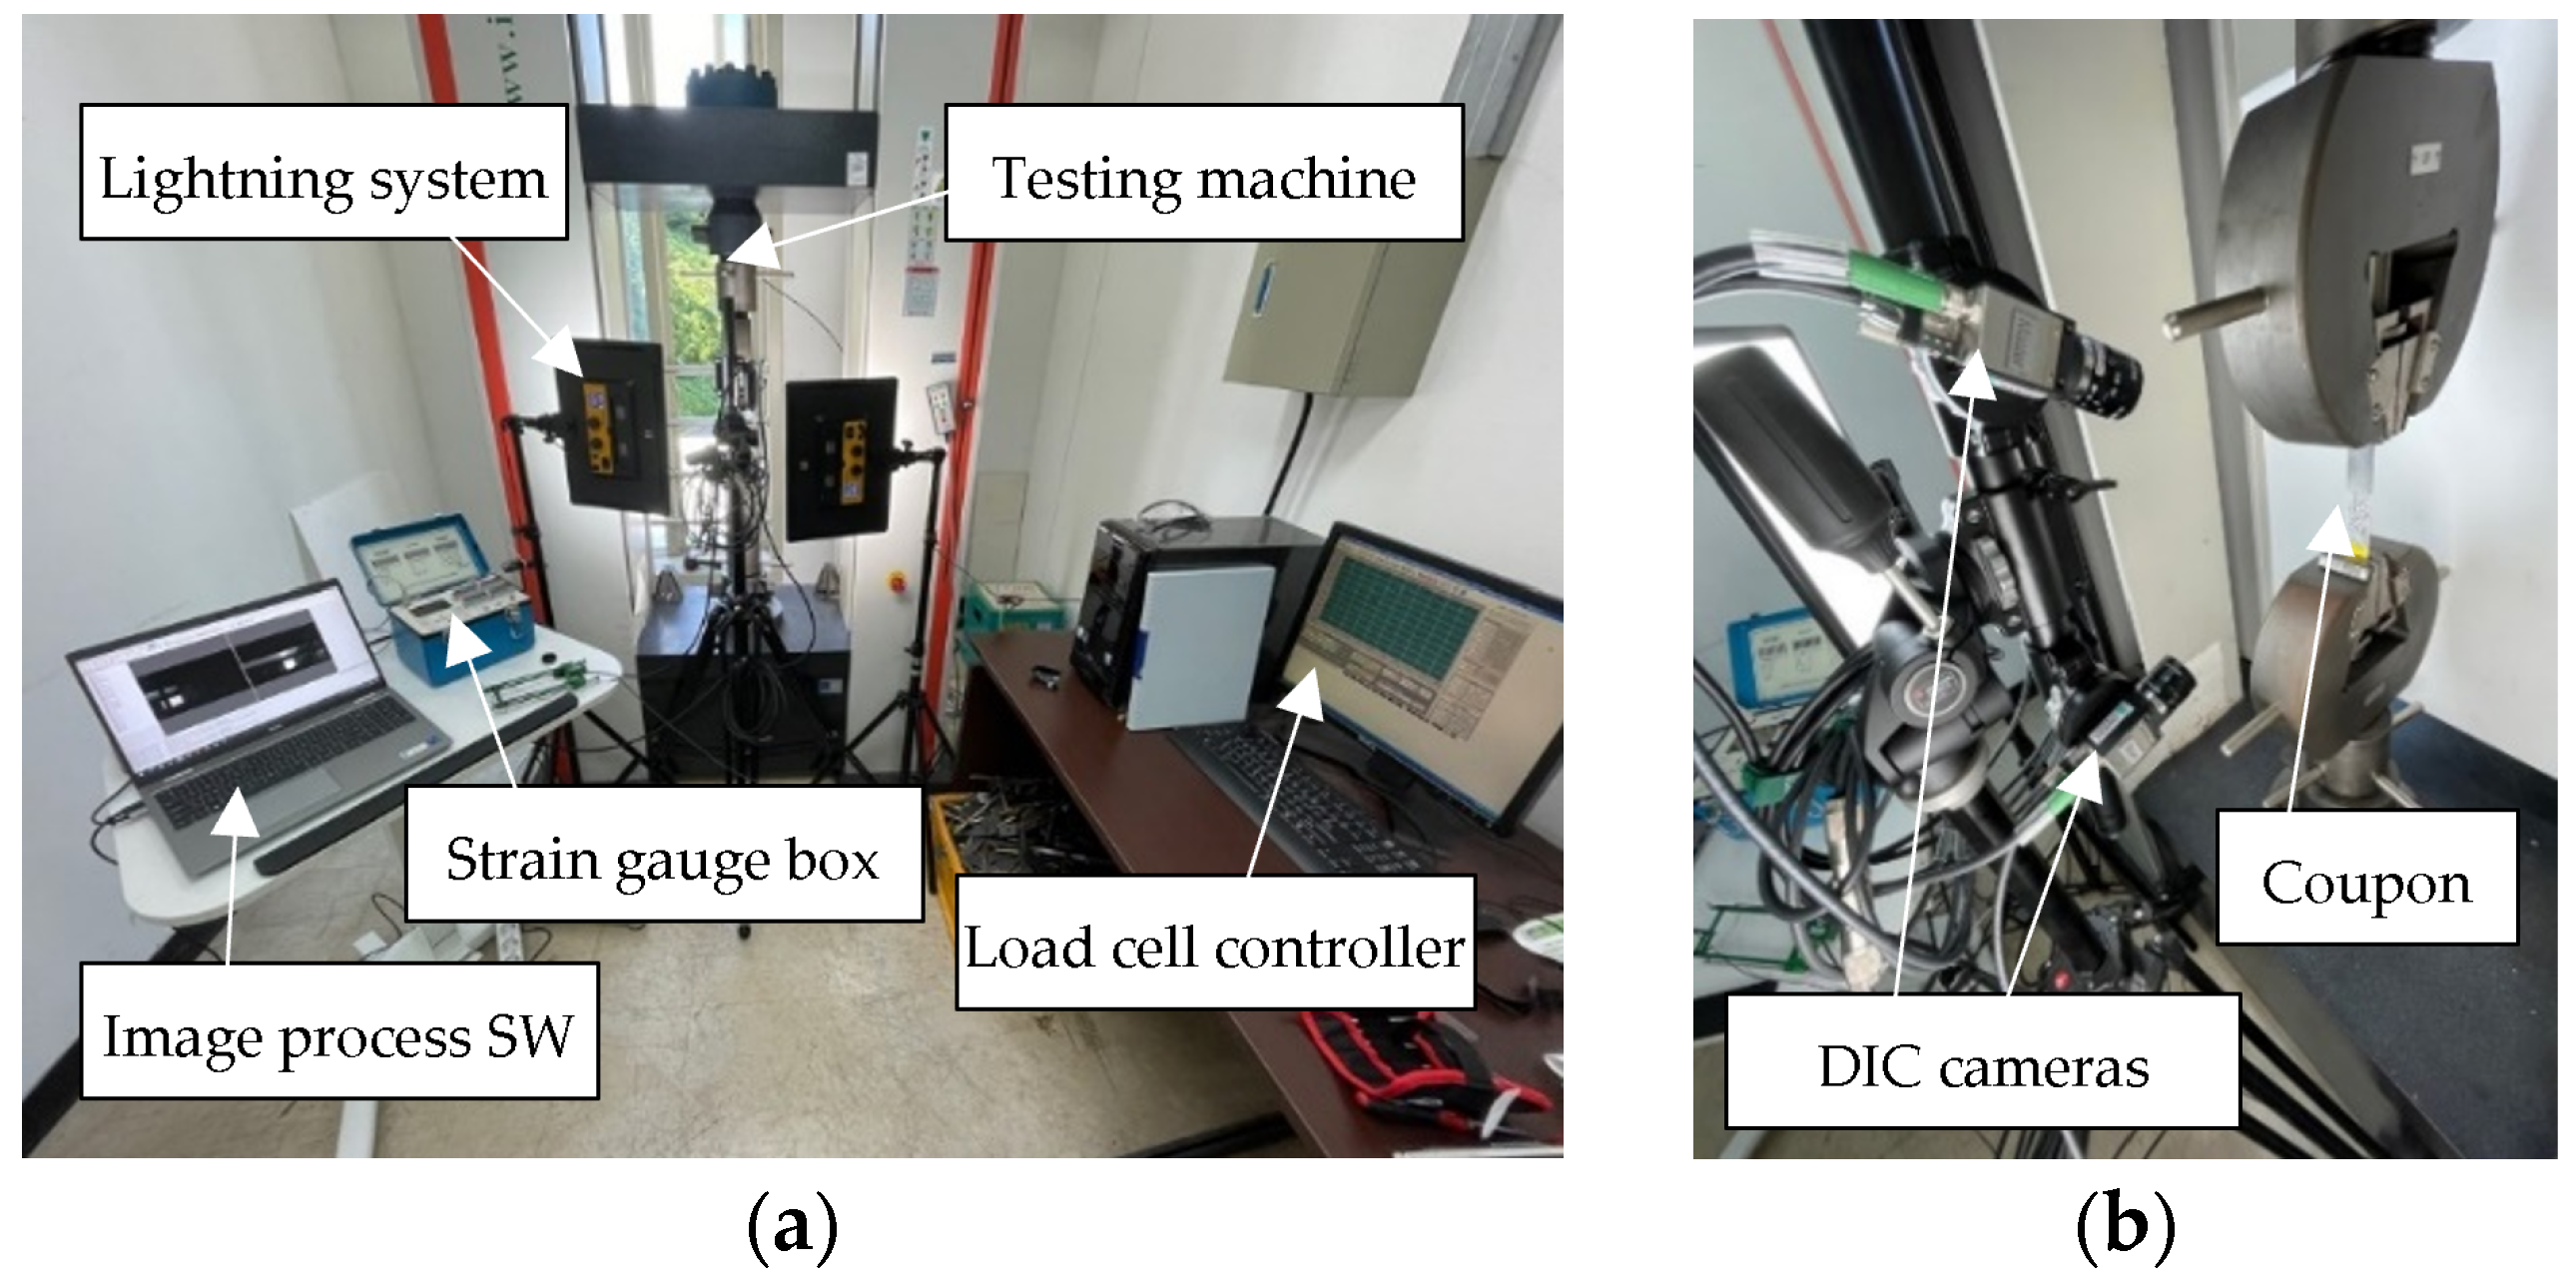
For material testing, the test configuration was set up as shown in
Figure 6. The setup was as follows:
- -
3D DIC system with two cameras and a notebook computer with image processing software.
- -
Two-light system to acquire better images.
- -
Test machine with maximum-300-kN-capacity load cell.
- -
Strain gauge conditioning box.
Figure 6.
Tensile test configuration: (a) overall setup and (b) DIC camera location.
Figure 6.
Tensile test configuration: (a) overall setup and (b) DIC camera location.
Table 2 lists the specifications of the systems used for the test setup for material and frequency testing.
3.1.3. Experimental Results
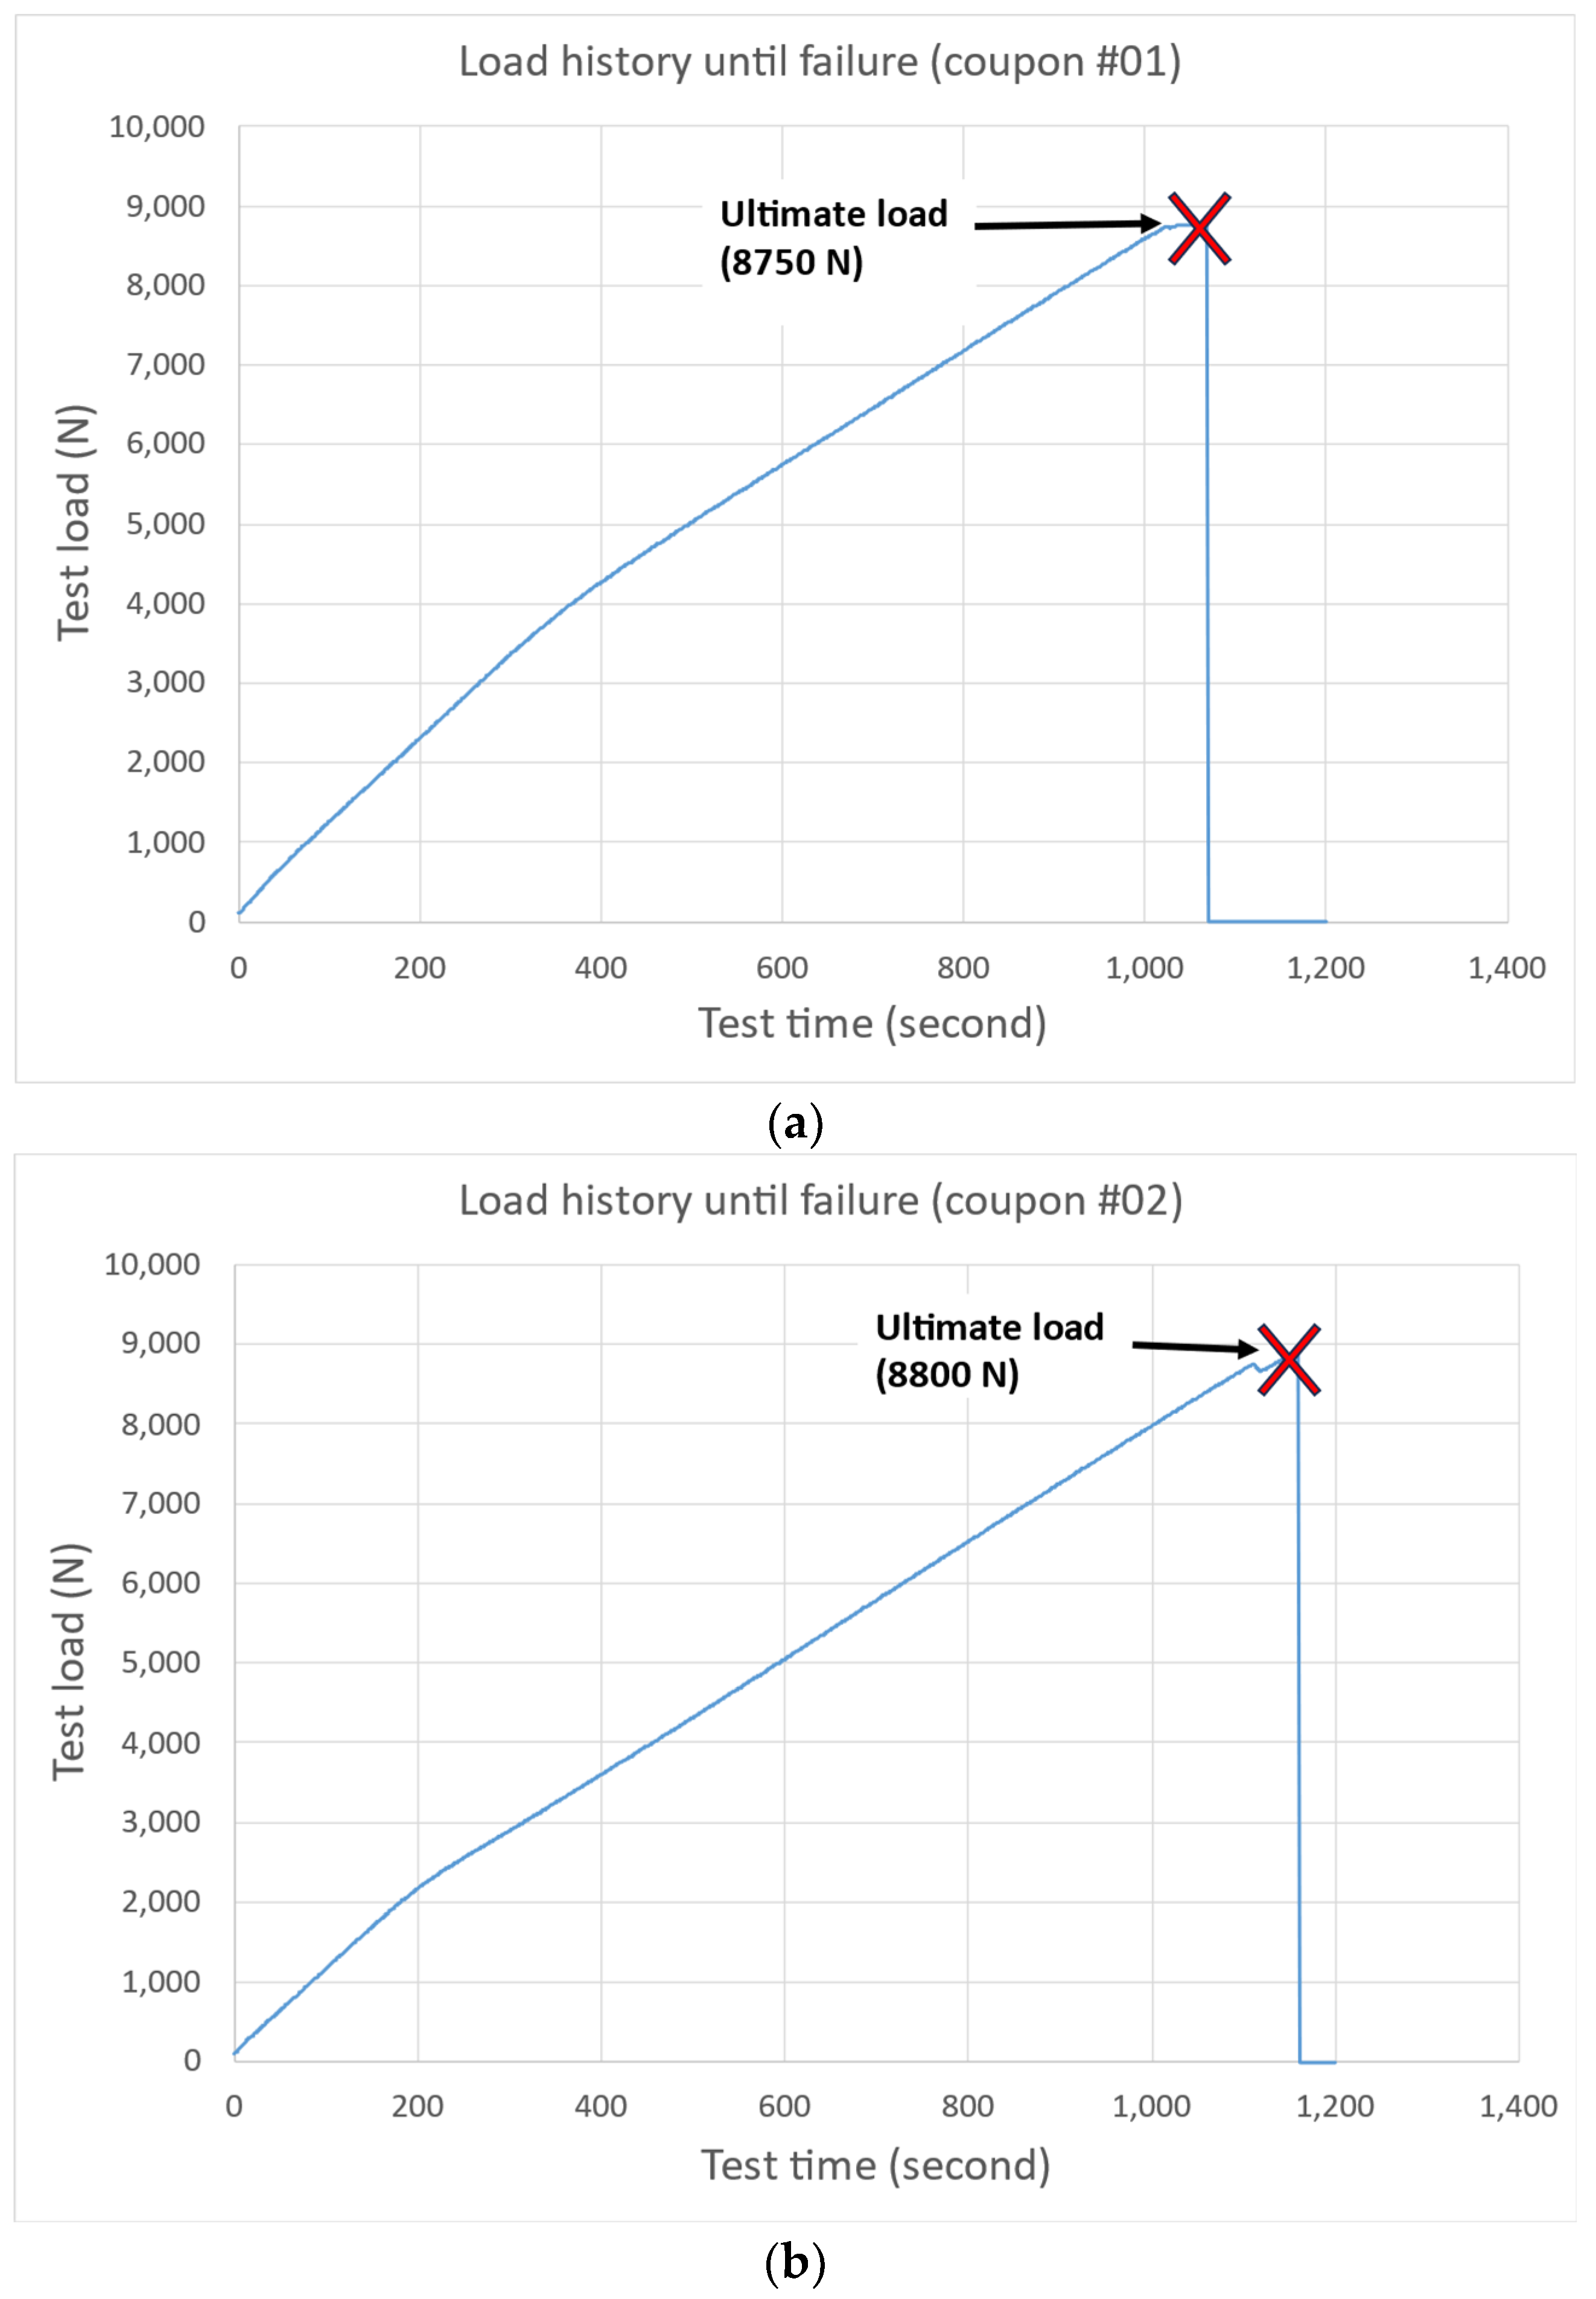
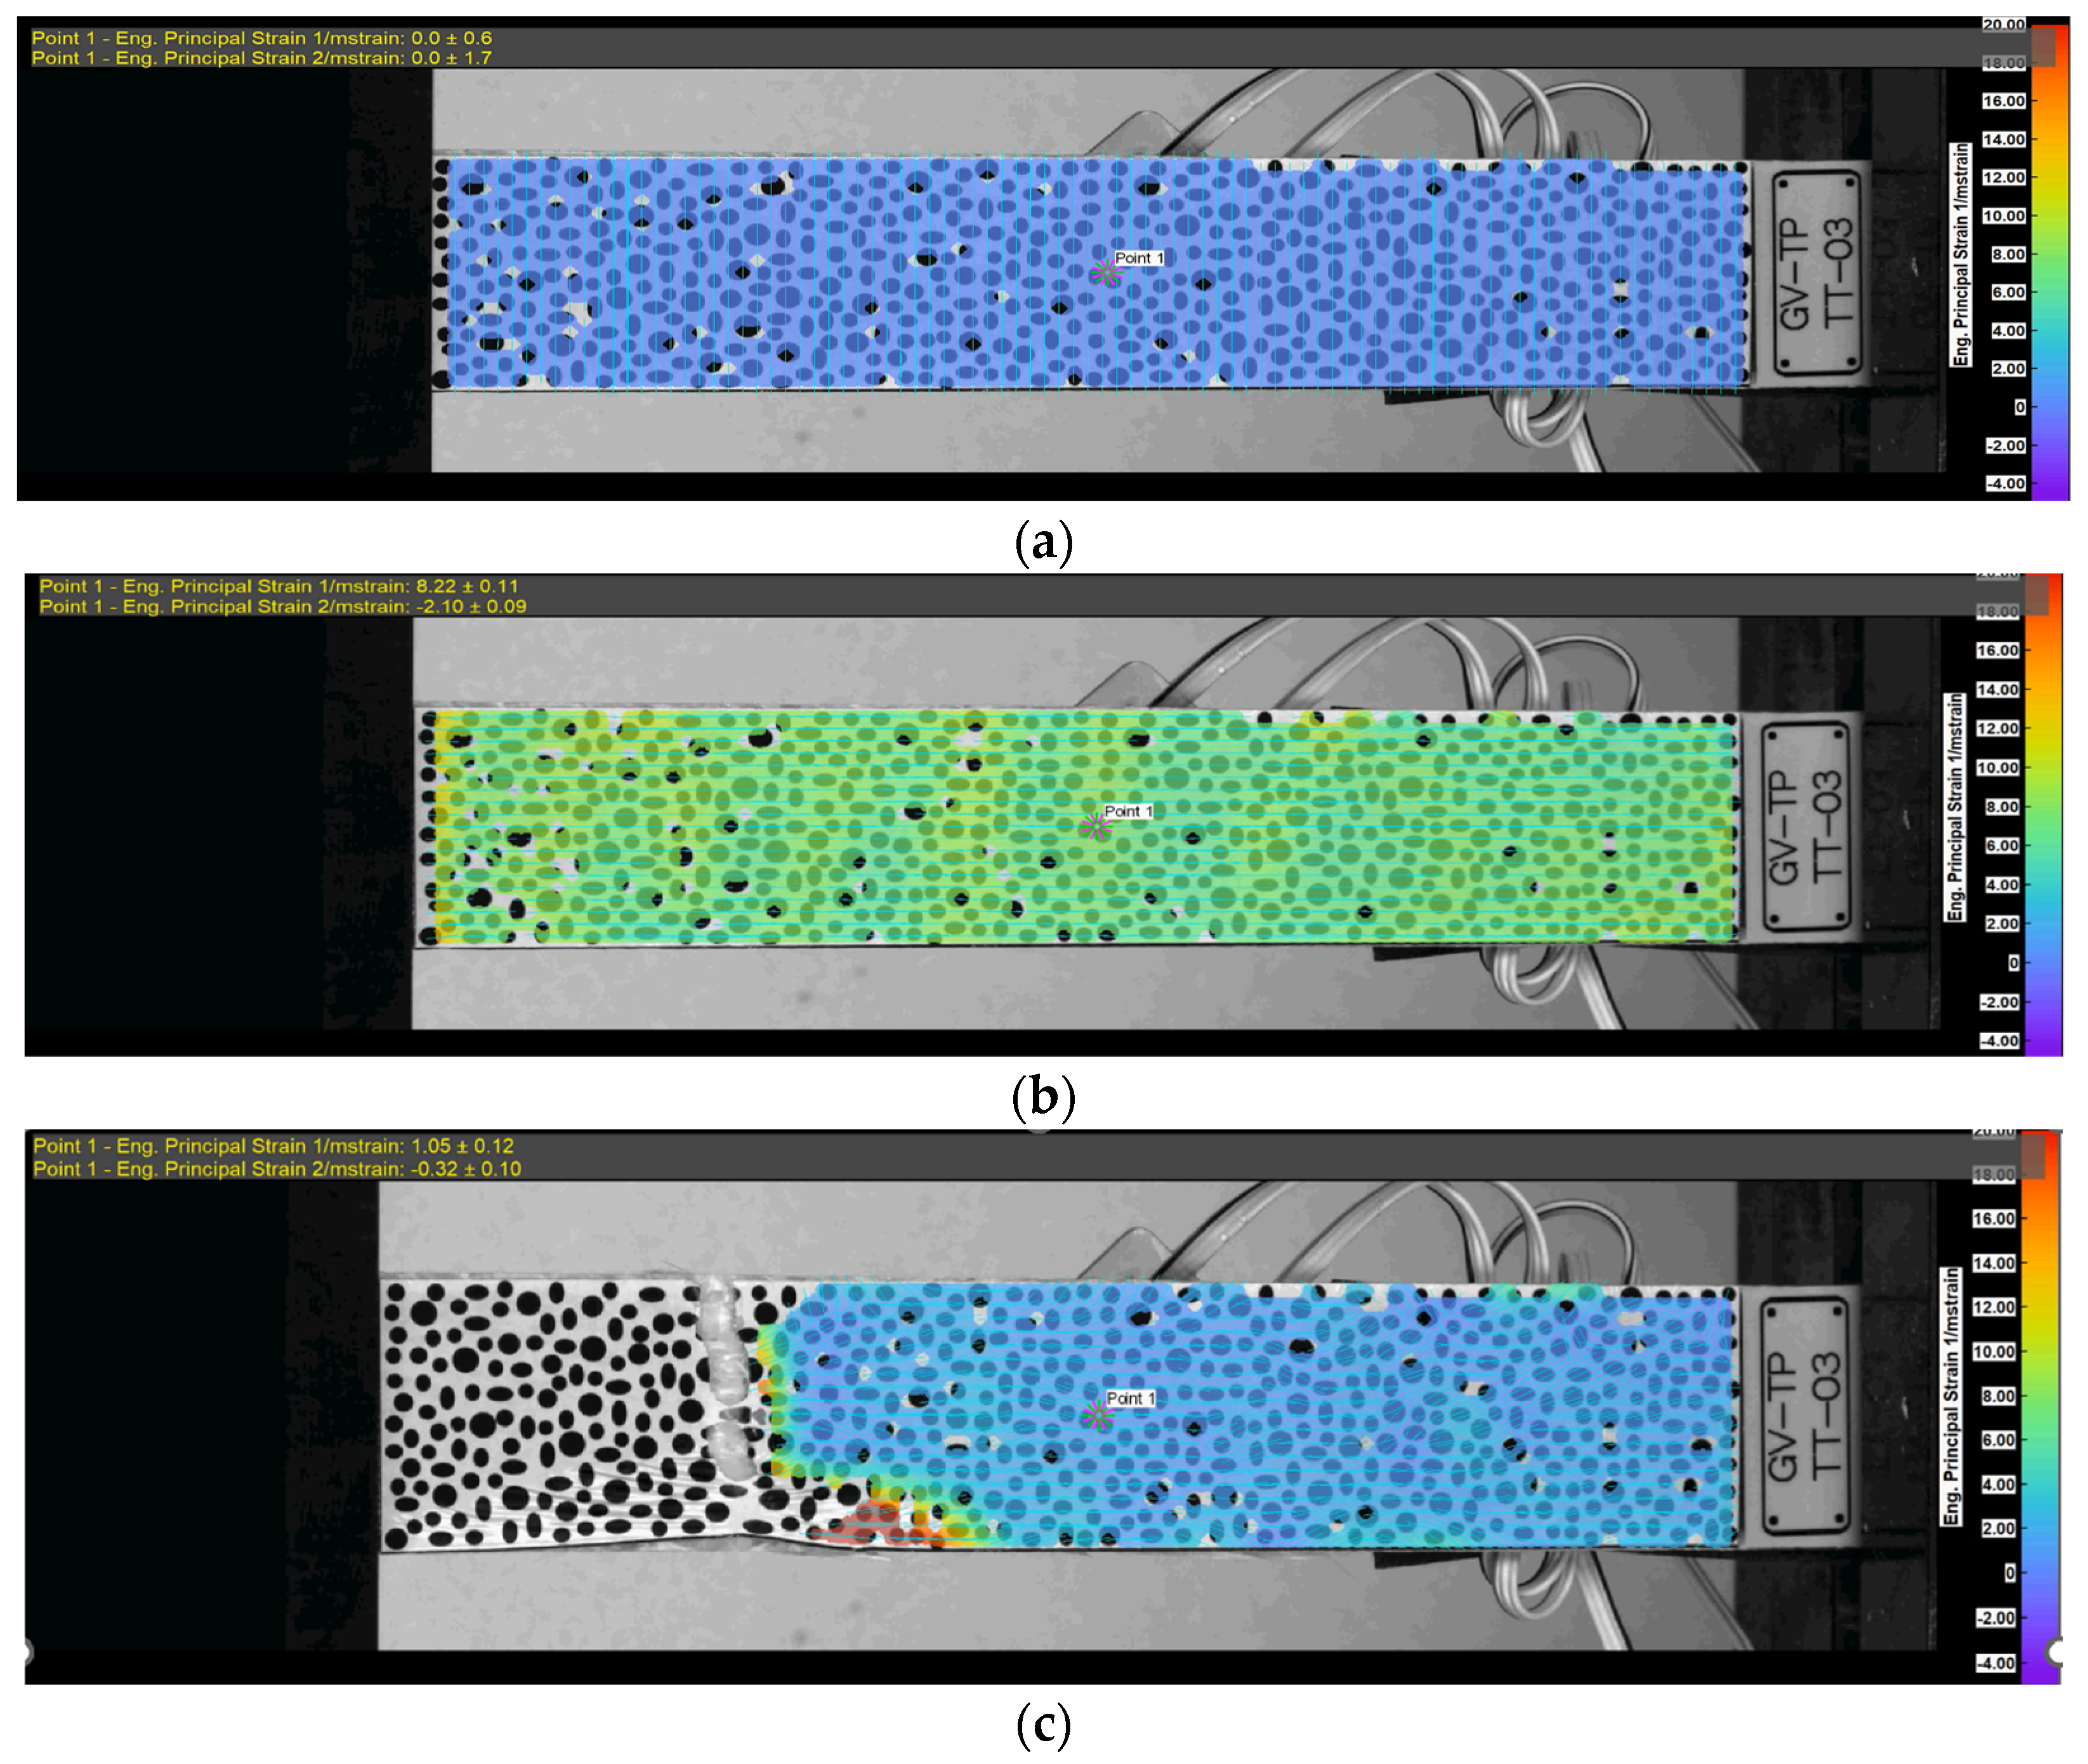
To observe the elastic deformation at the yield limit and the plastic deformation behavior up to failure, if failure occurred, displacement control at a speed of 3 mm/min was applied until the specimen failed, as shown in
Figure 7. As expected, unlike metallic materials, the specimen exhibited a linear response until failure without a clear indication of the plastic region. Owing to grip slippage, only two specimens were used to verify the ultimate load history.
The test data were recorded using speckles on the front surface of the specimens for the 3D DIC system and strain gauge transducers on the back surface of the specimens. The progress of specimen deformation under a tensile load is shown in
Figure 8.
As shown in
Figure 8, the 3D DIC method can detect full strains and displacements of all continuous points covered with speckles, whereas the contact measurement method using strain gauges can detect in-plane deformation only at discrete points. In this case, a single point is installed with strain gauge sensors.
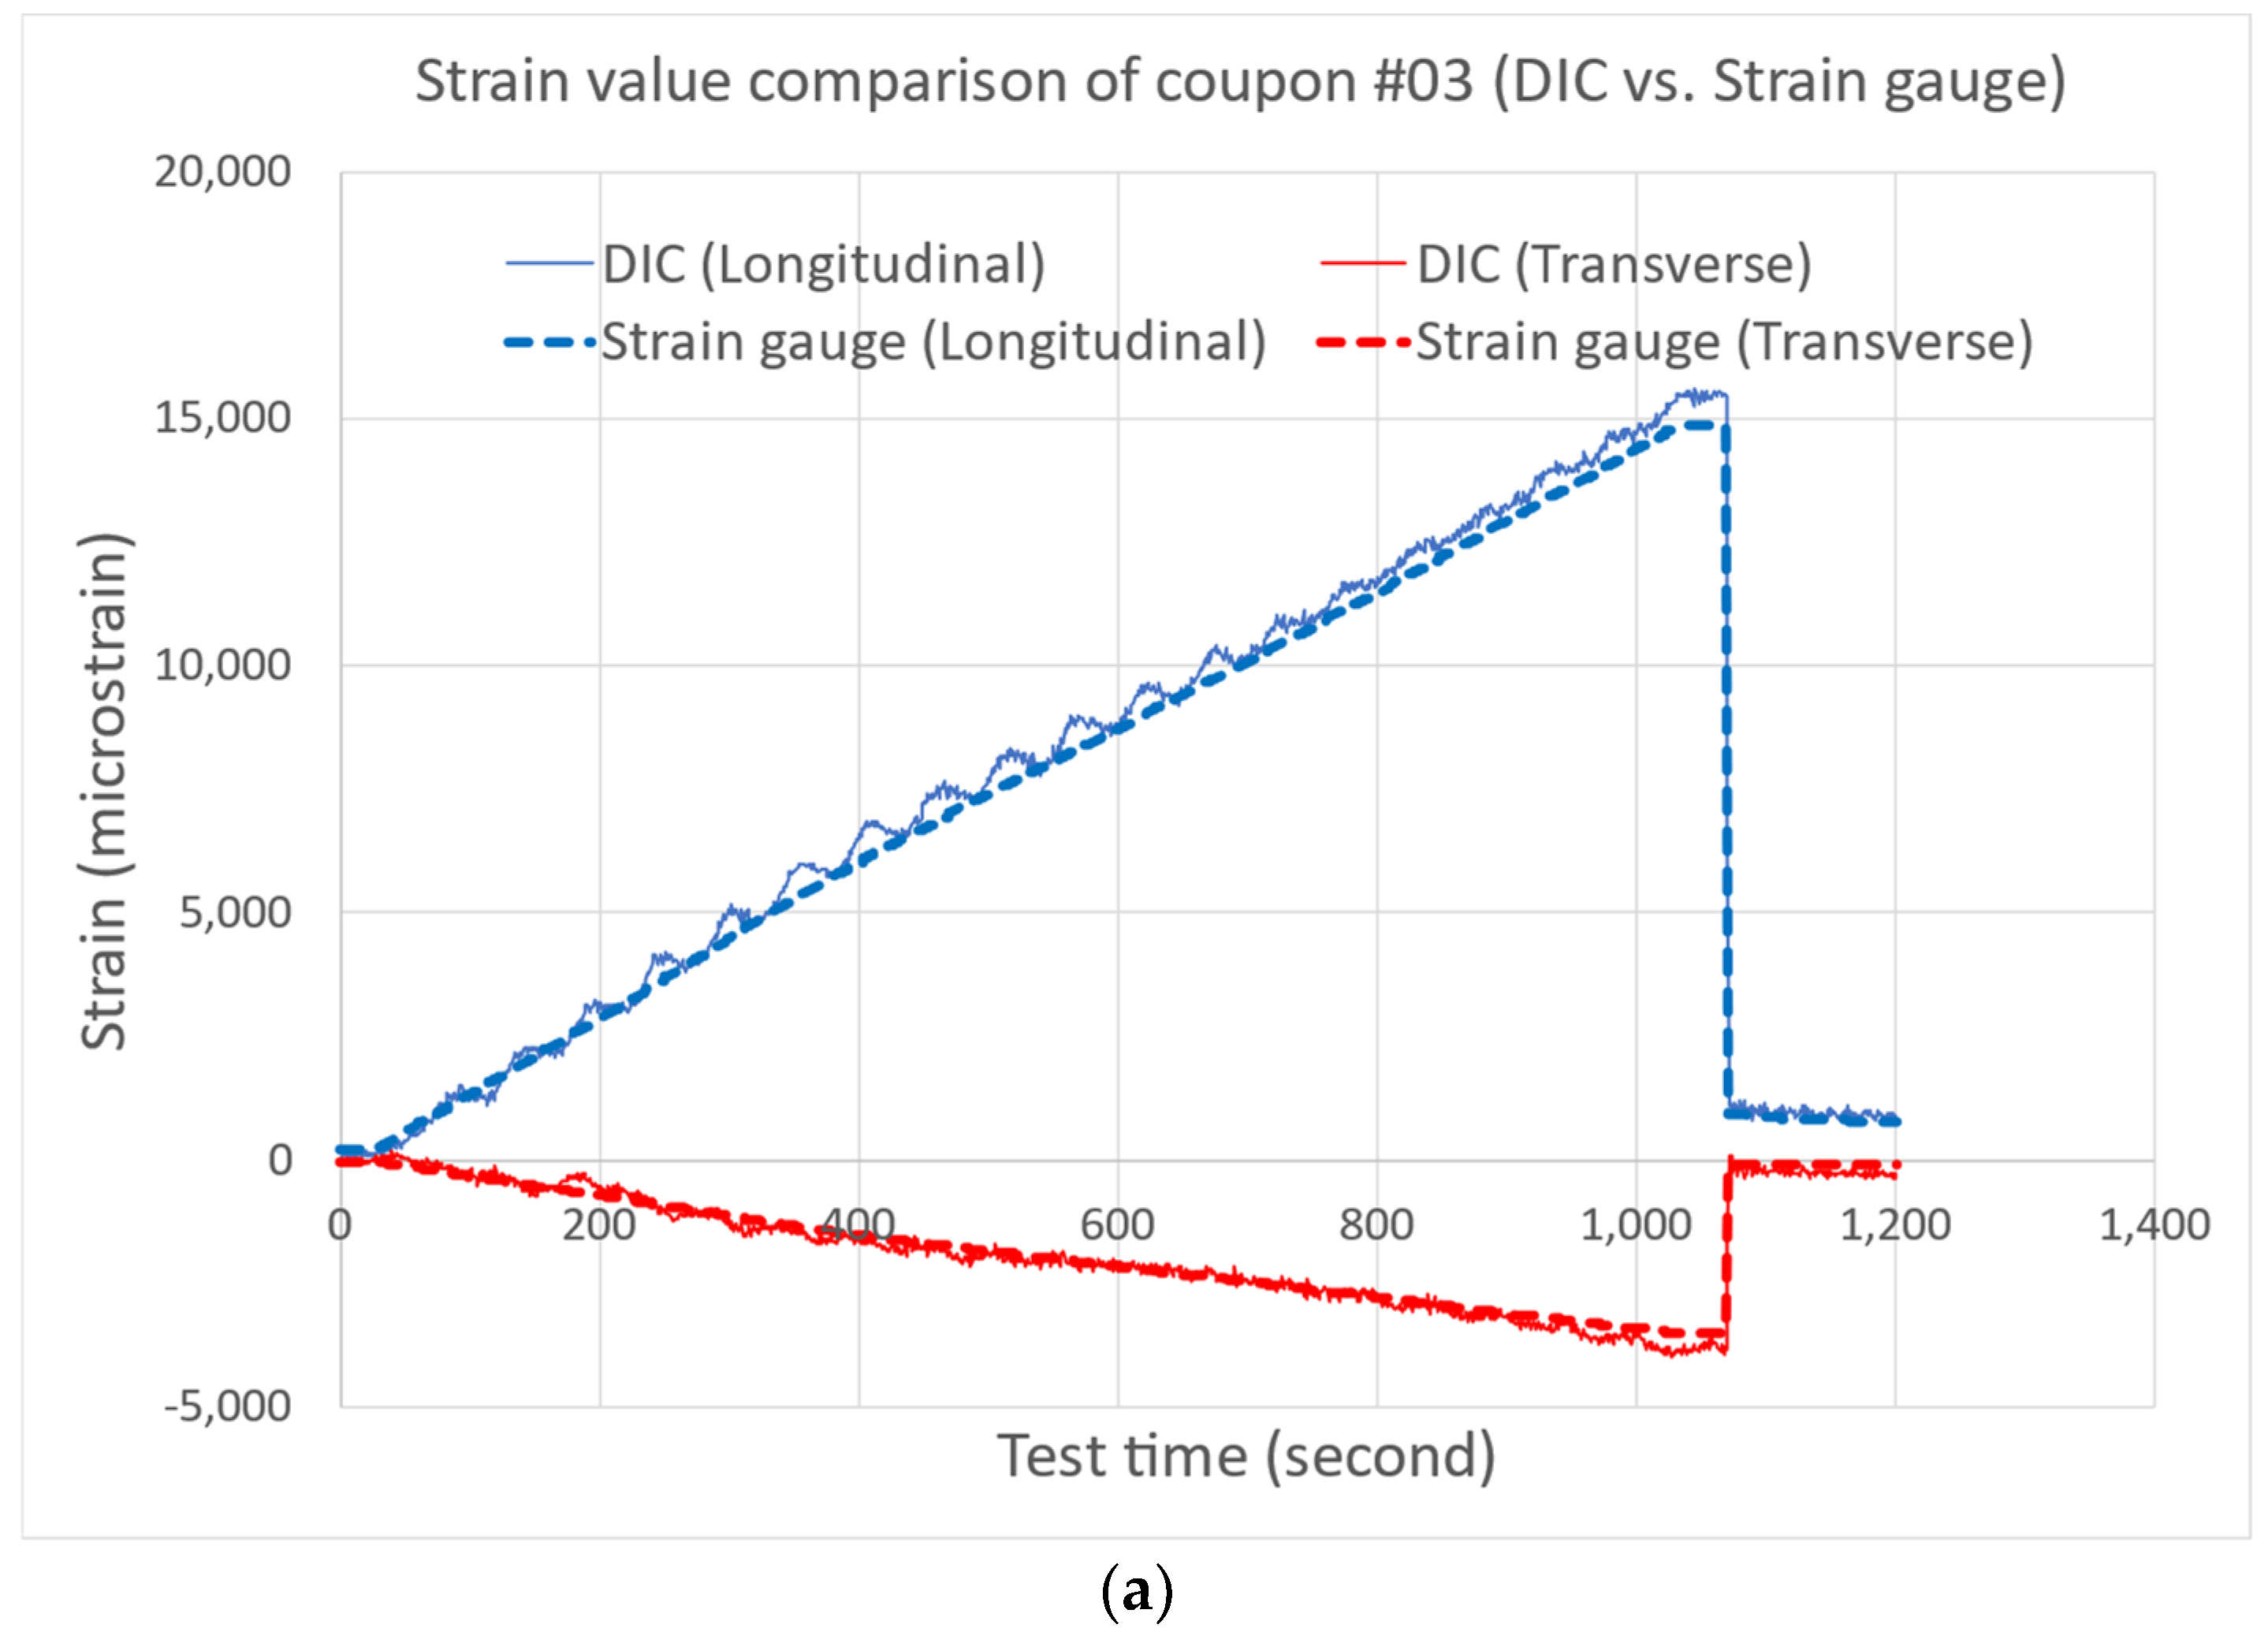
For a direct comparison with the results recorded from the strain gauges located at the center of the back surface of the specimen, the opposite point on the front surface with the DIC speckle was selected.
Figure 9 shows the longitudinal and transverse strains from both 3D DIC and the strain gauges and very good correlation.
3.2. Measurement of Blade Property (First Frequency in the Flapwise Direction)
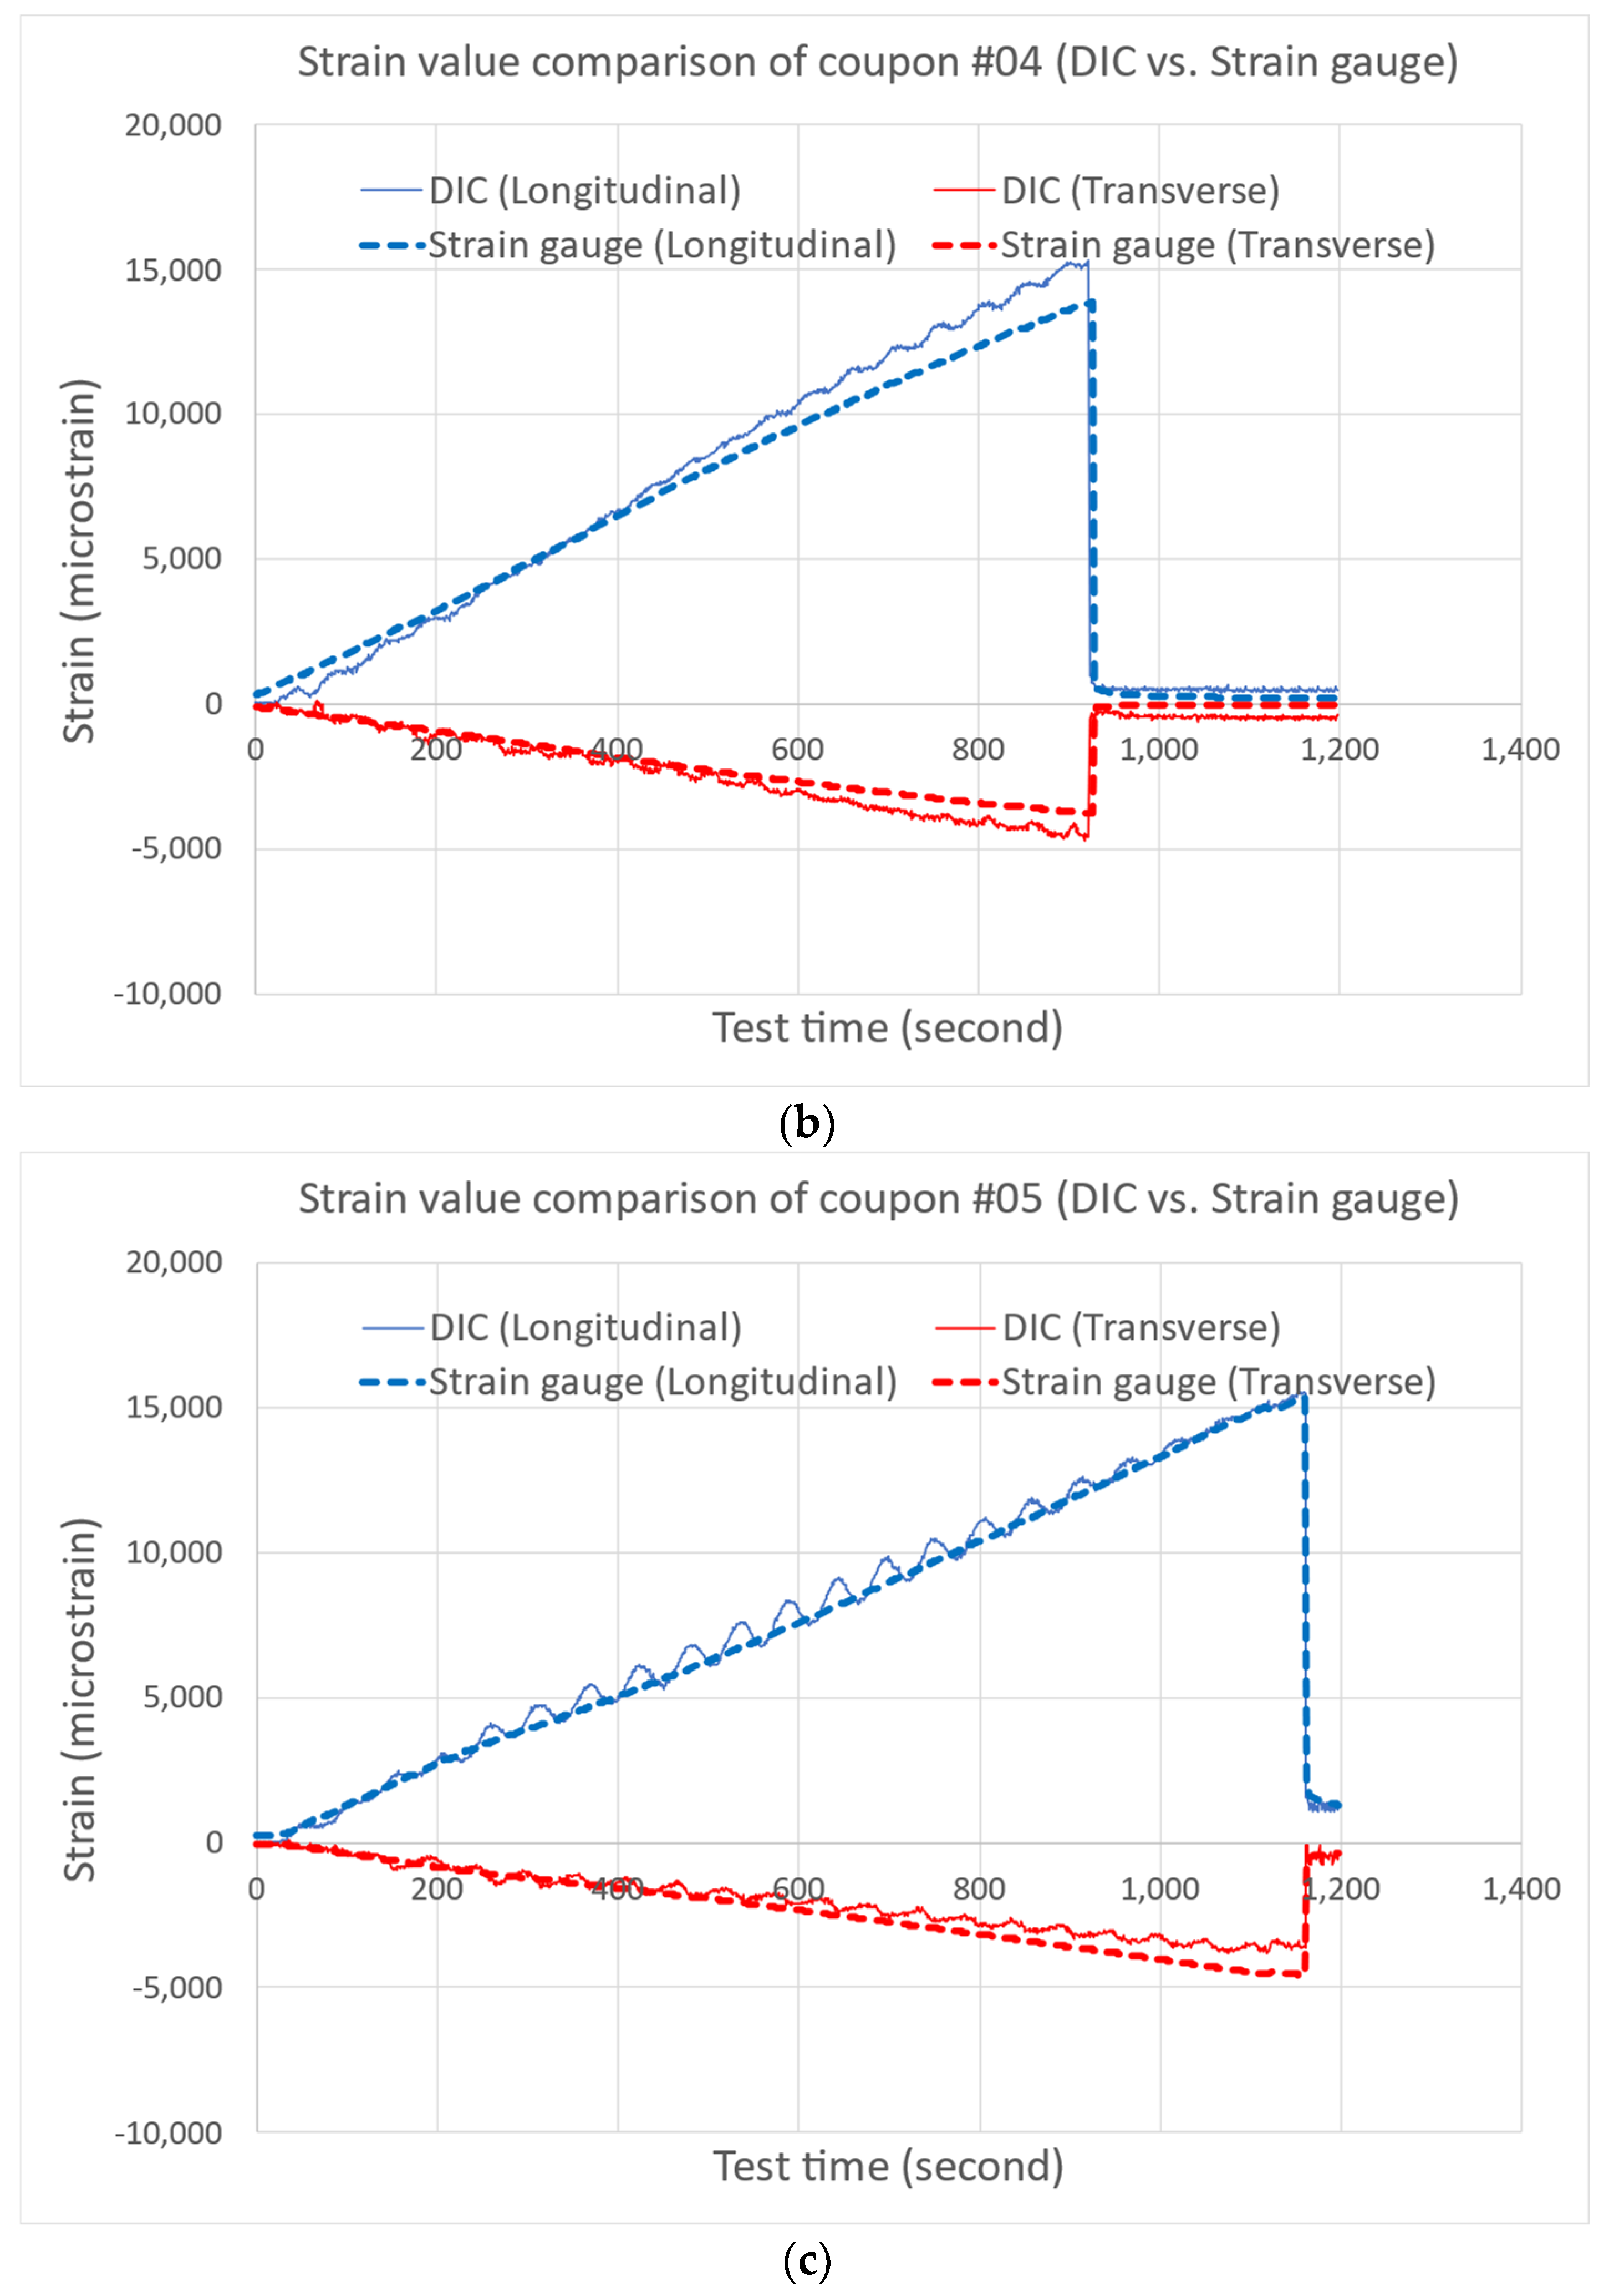
3.2.1. Blade Preparation
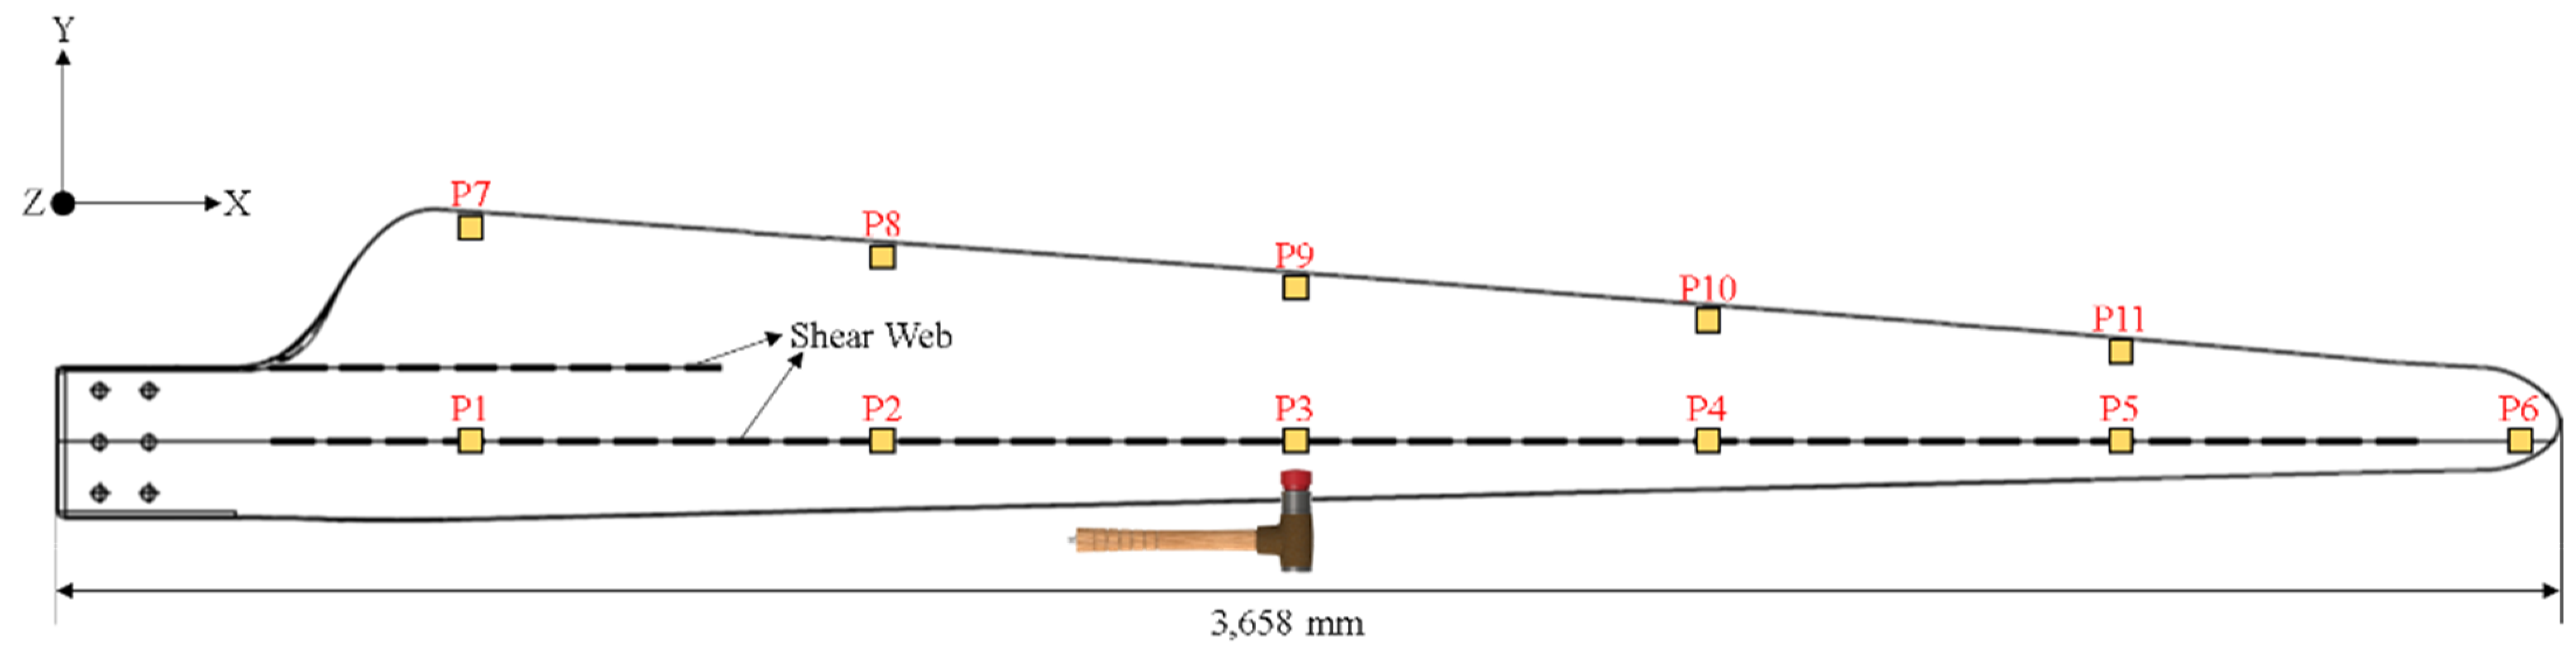
A small blade provided by Geum Poong Energy Inc. was used, which was 3.65 m in length, weighed 19.6 kg, and was completely fixed at the root with a test stand through a bolted connection, as shown in
Figure 10.
3.2.2. Test Configuration
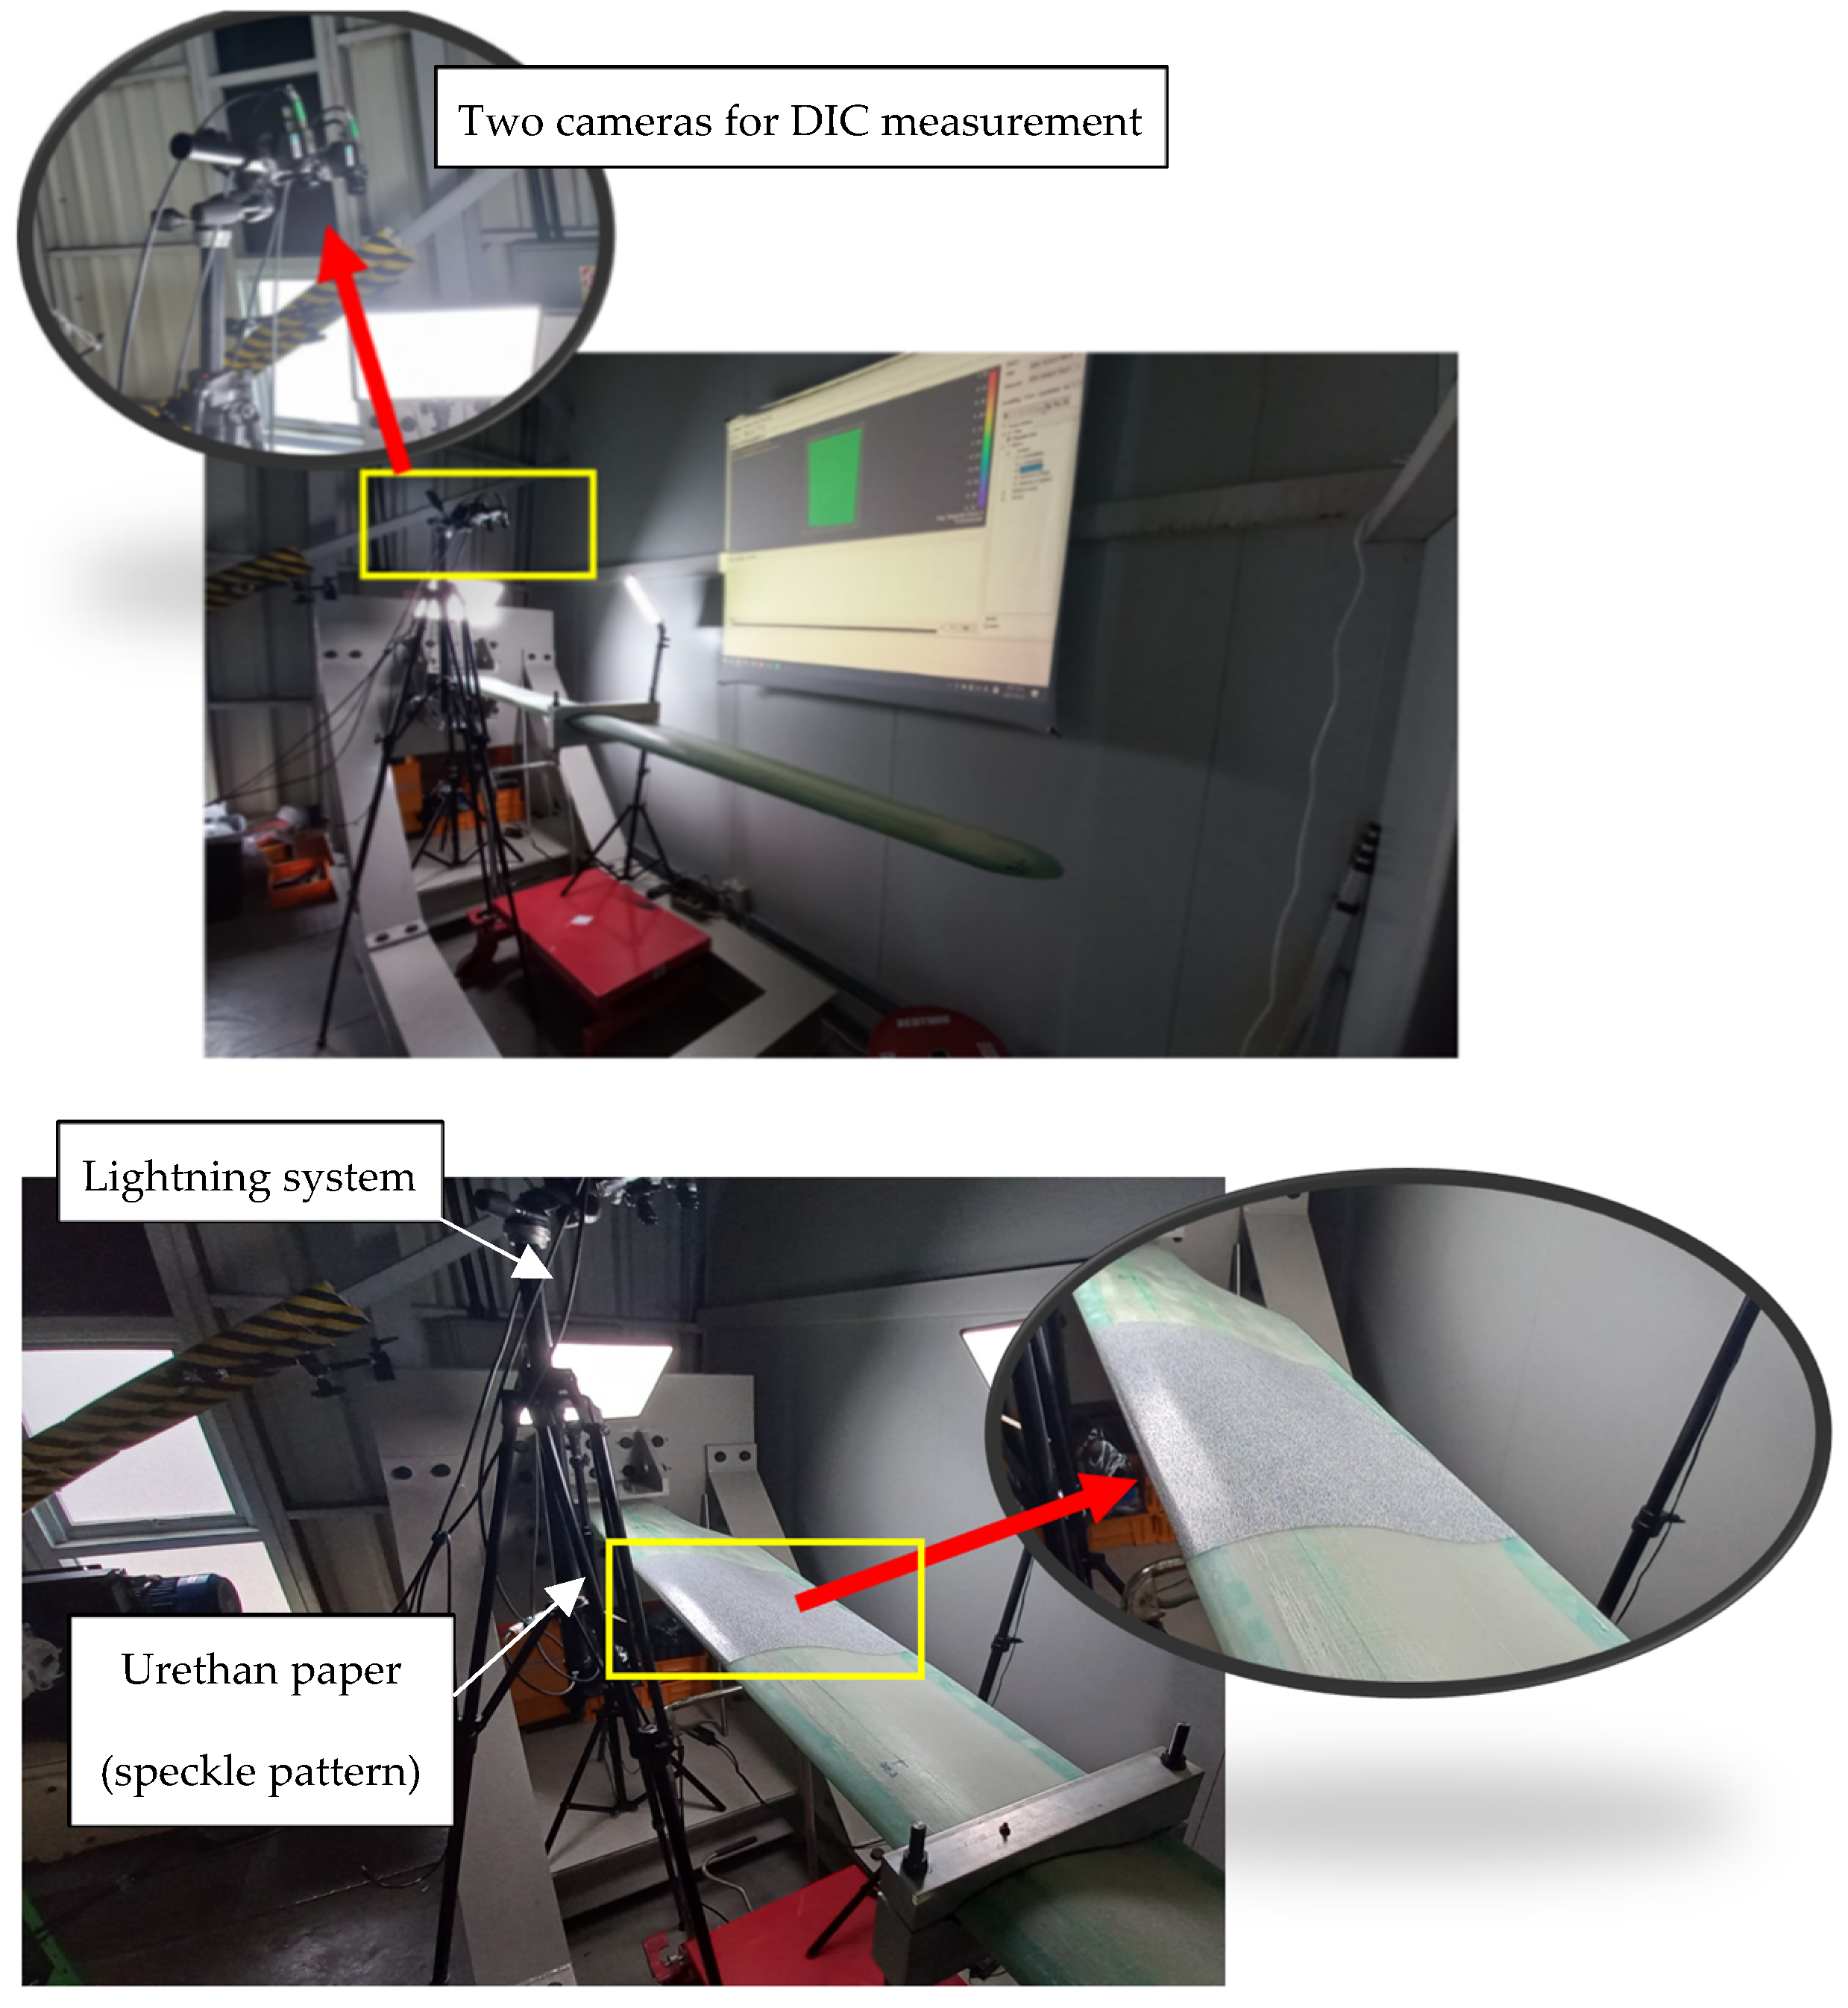
Figure 11 shows the test configuration for the 3D DIC measurement of blade behavior, which includes two cameras, speckle patterns, and two lighting systems containing light-emitting diodes. For the 3D DIC measurement of the blade behavior, urethane paper with a speckle pattern, measuring 1.2 ± 0.15 m, was bonded to each side of the blade.
3.2.3. Experimental Results
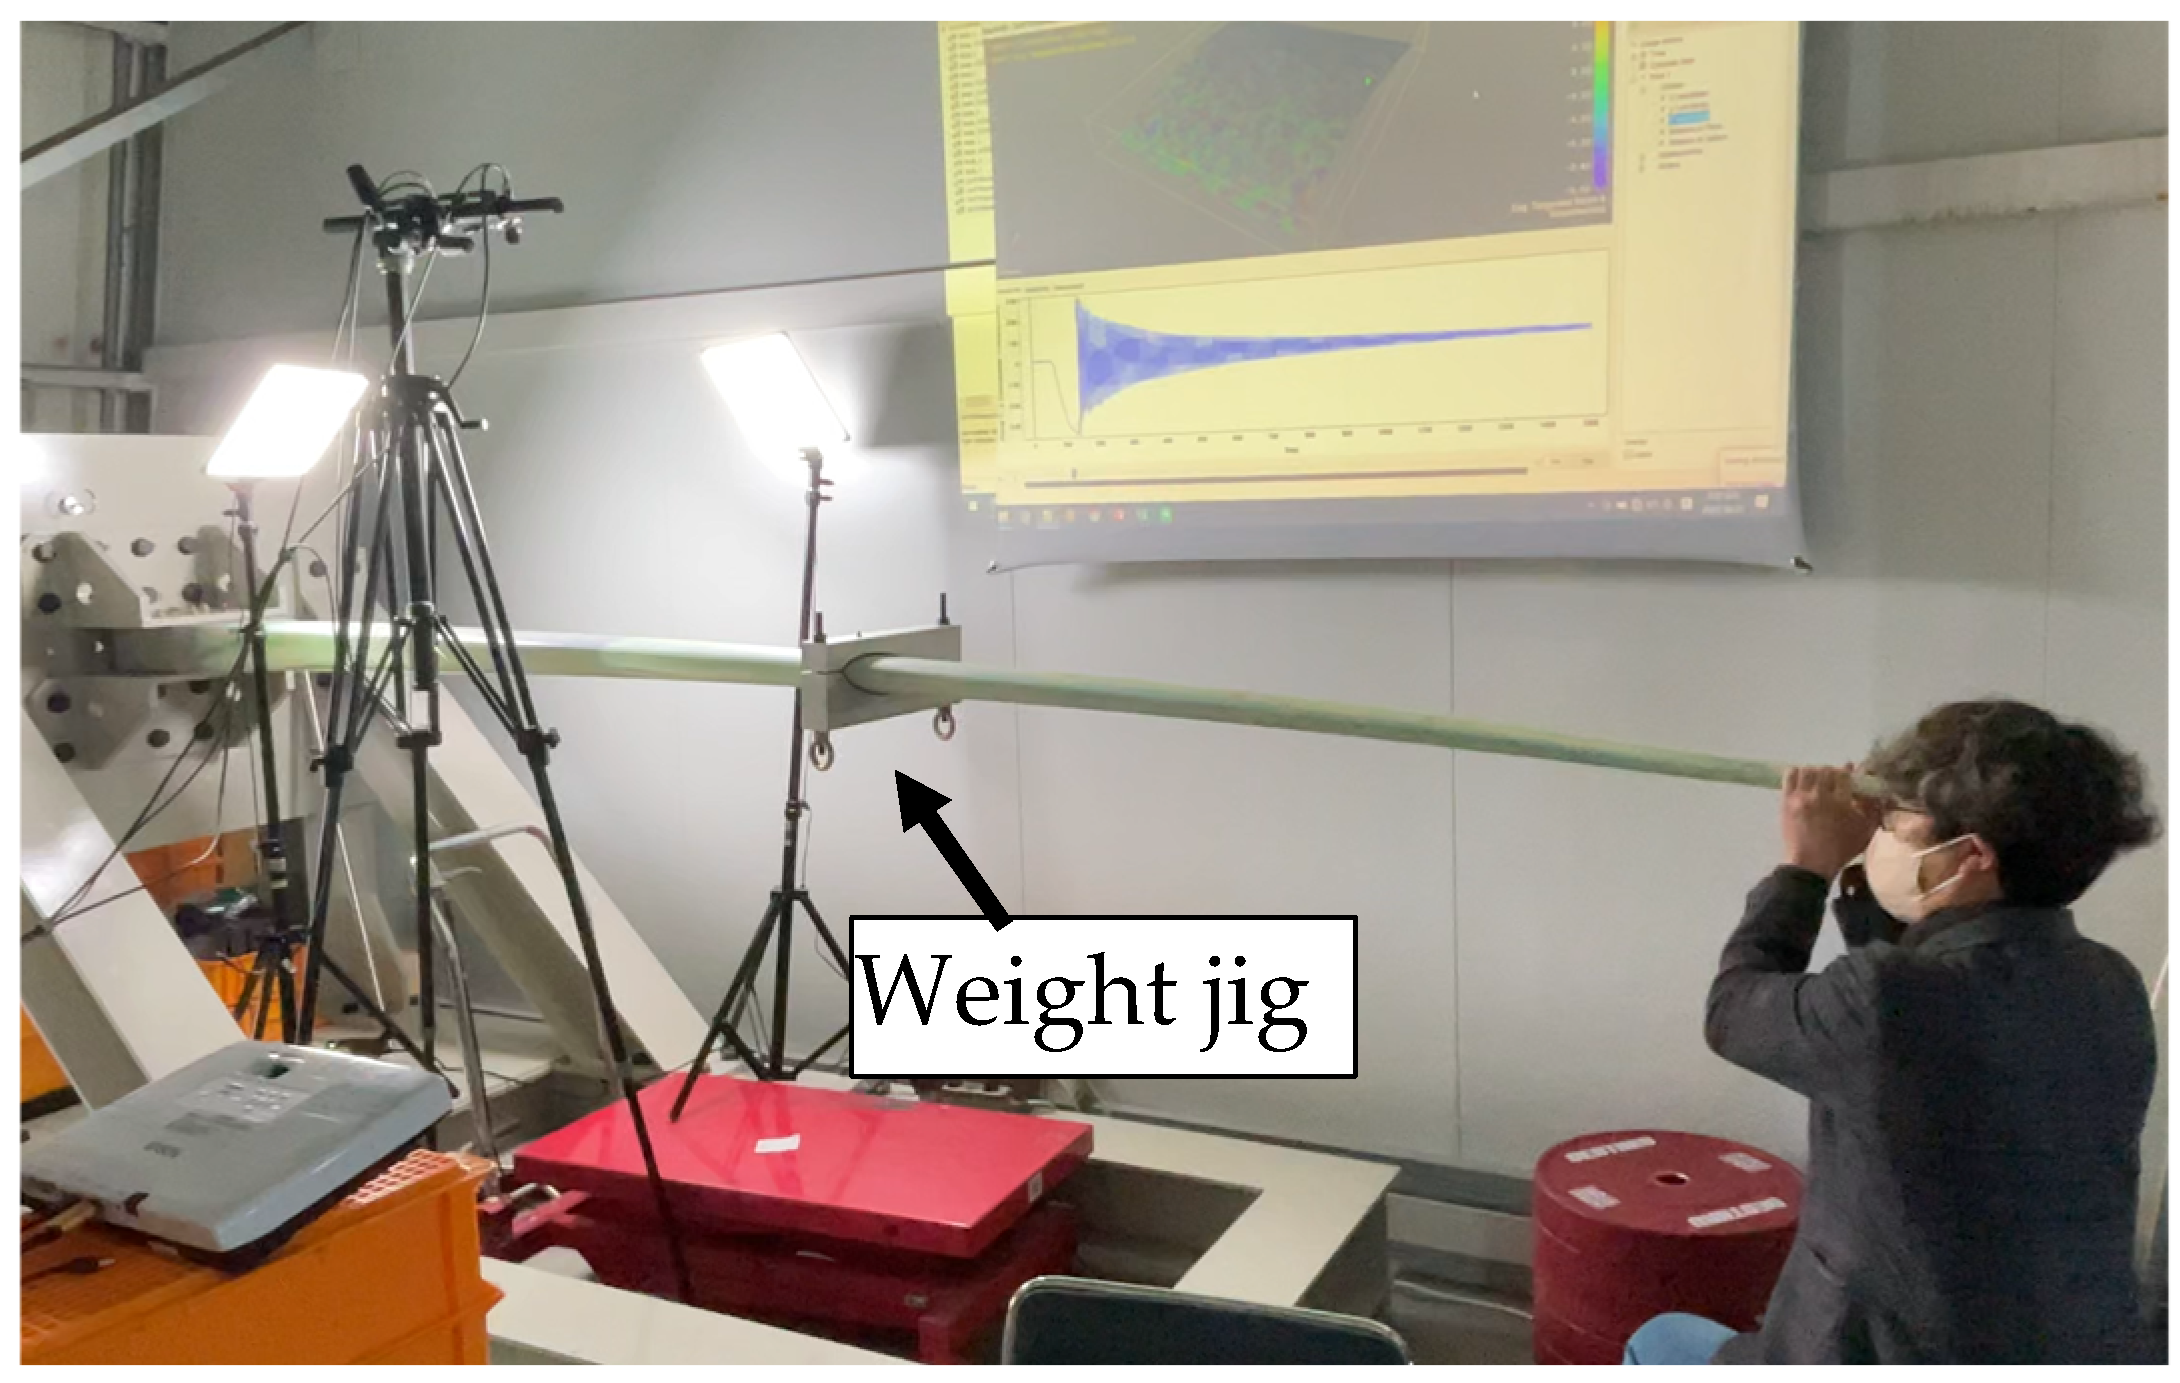
As shown in
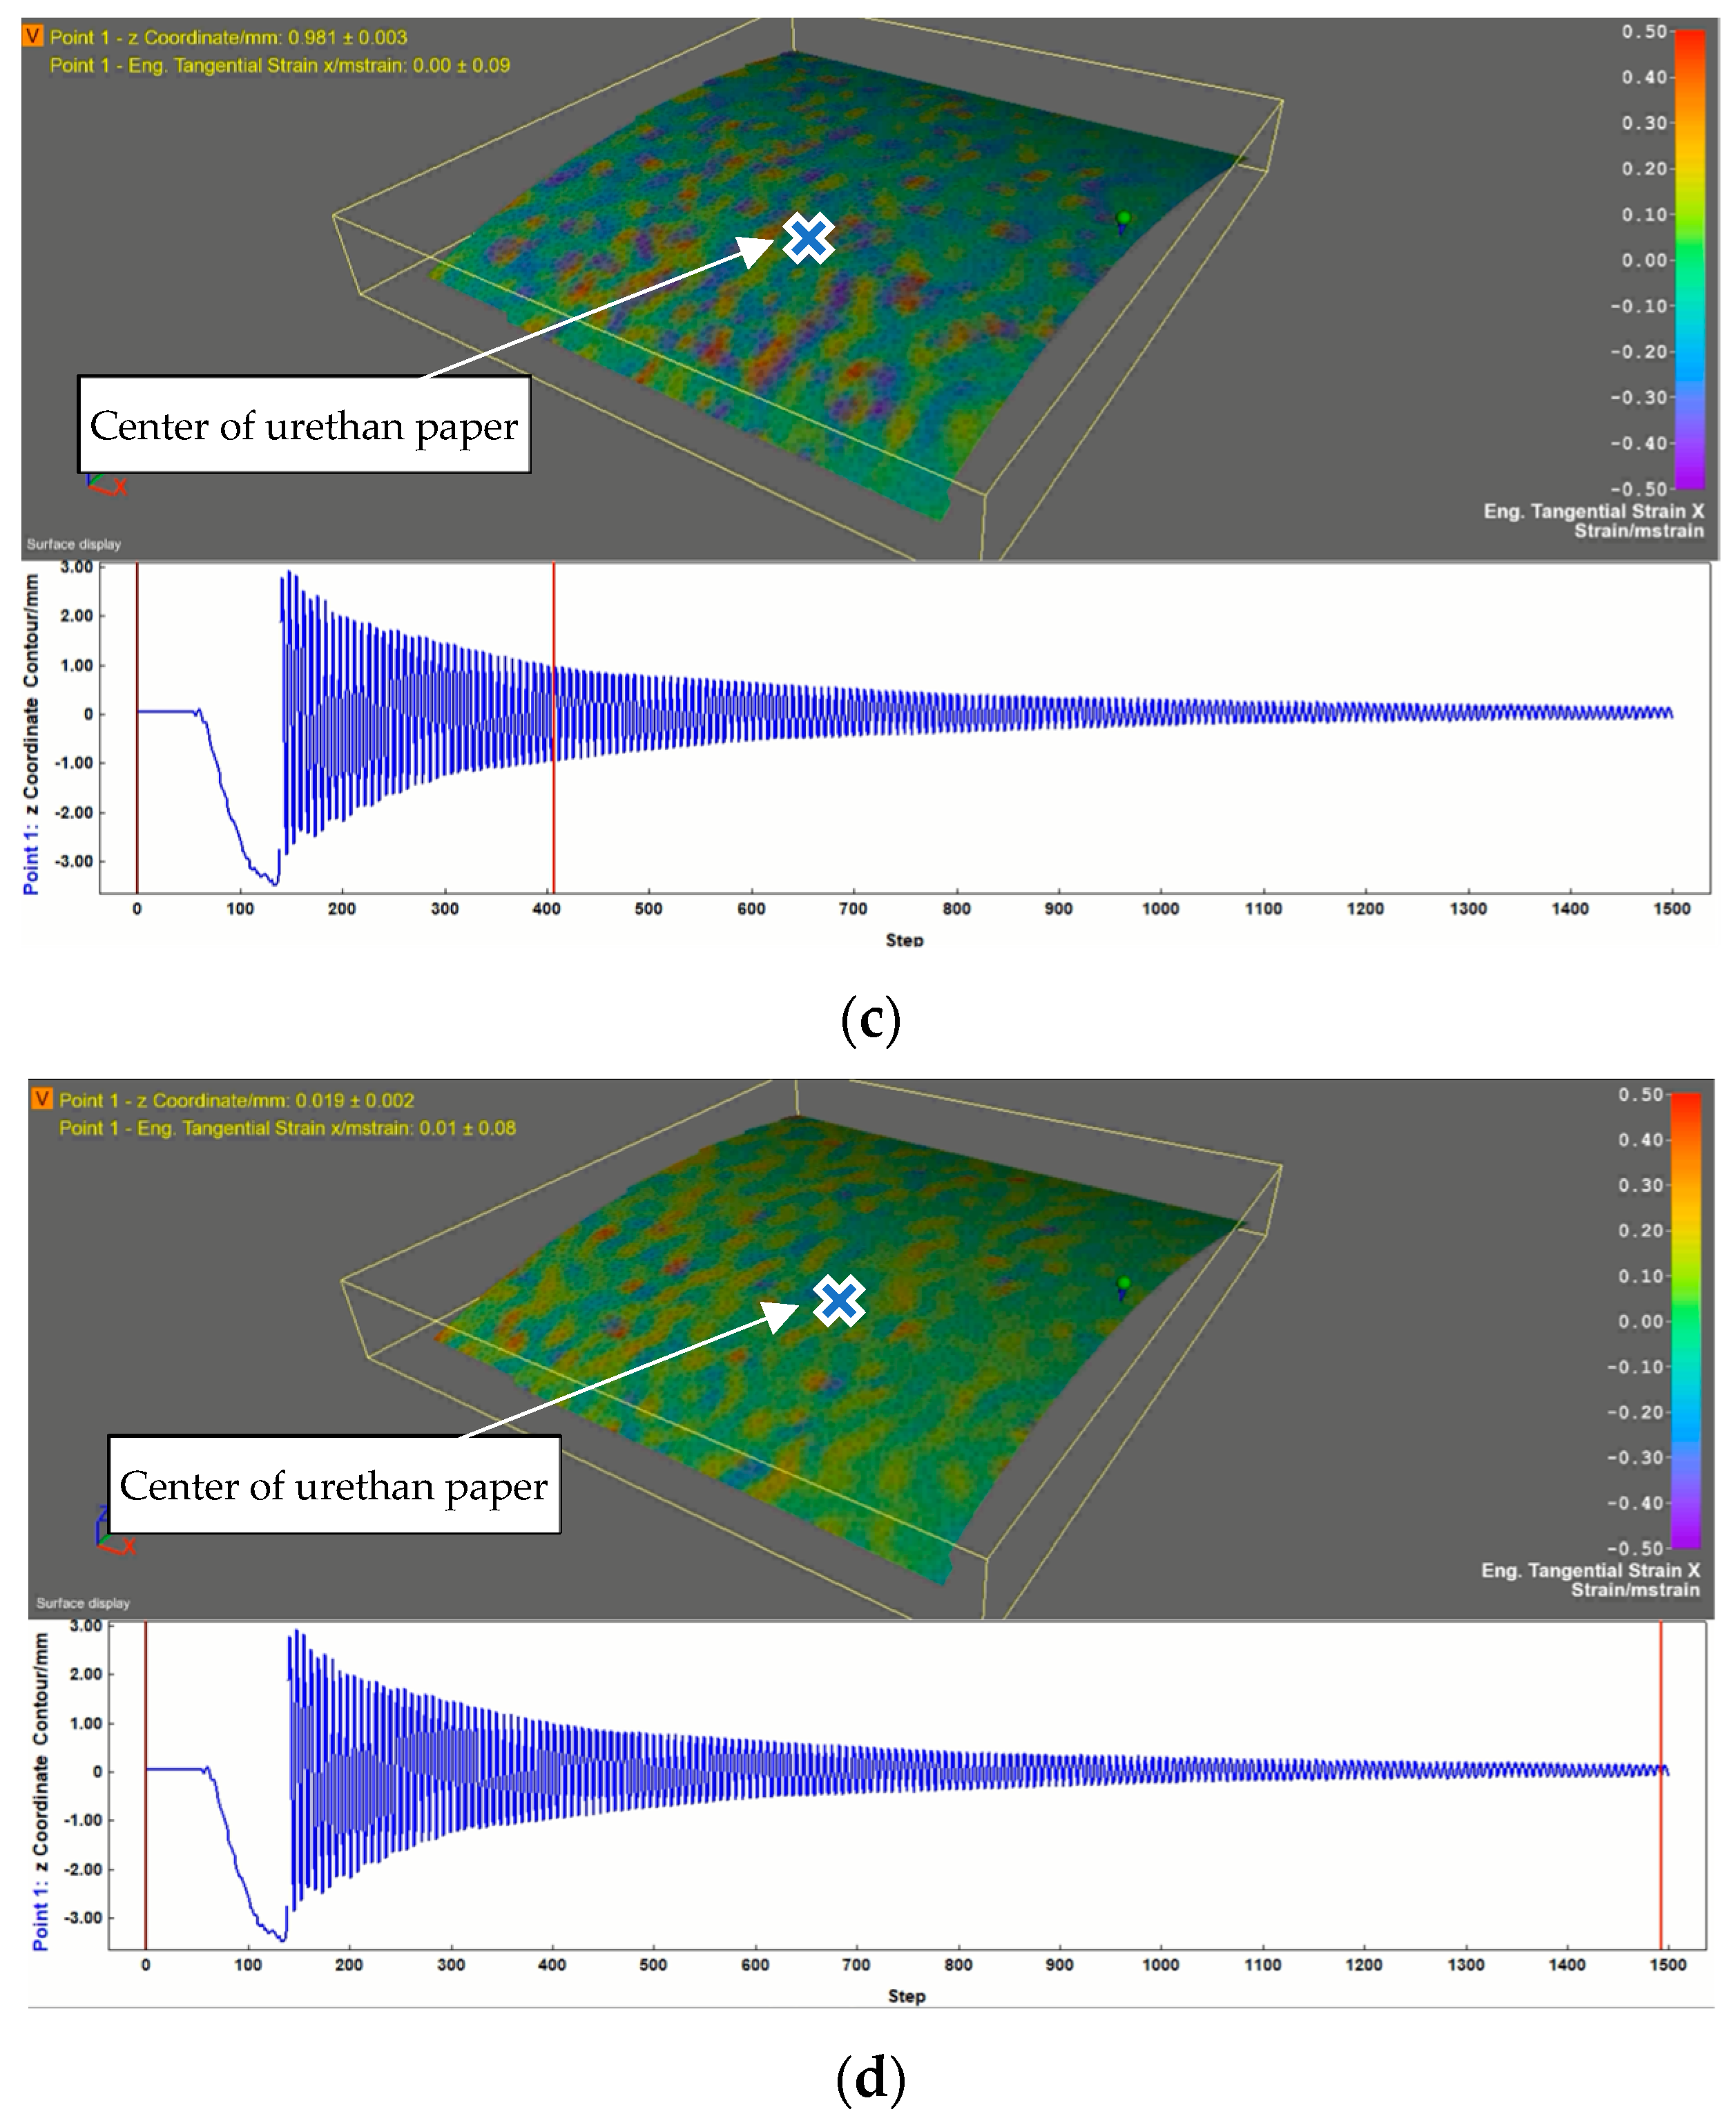
Figure 12, the DUT (a small blade) was forced by hand, and the responses obtained from the speckle pattern were recorded and visualized. To enable easy hand shaking and to boost amplitude, a weight jig was attached 2000 mm from the blade root.
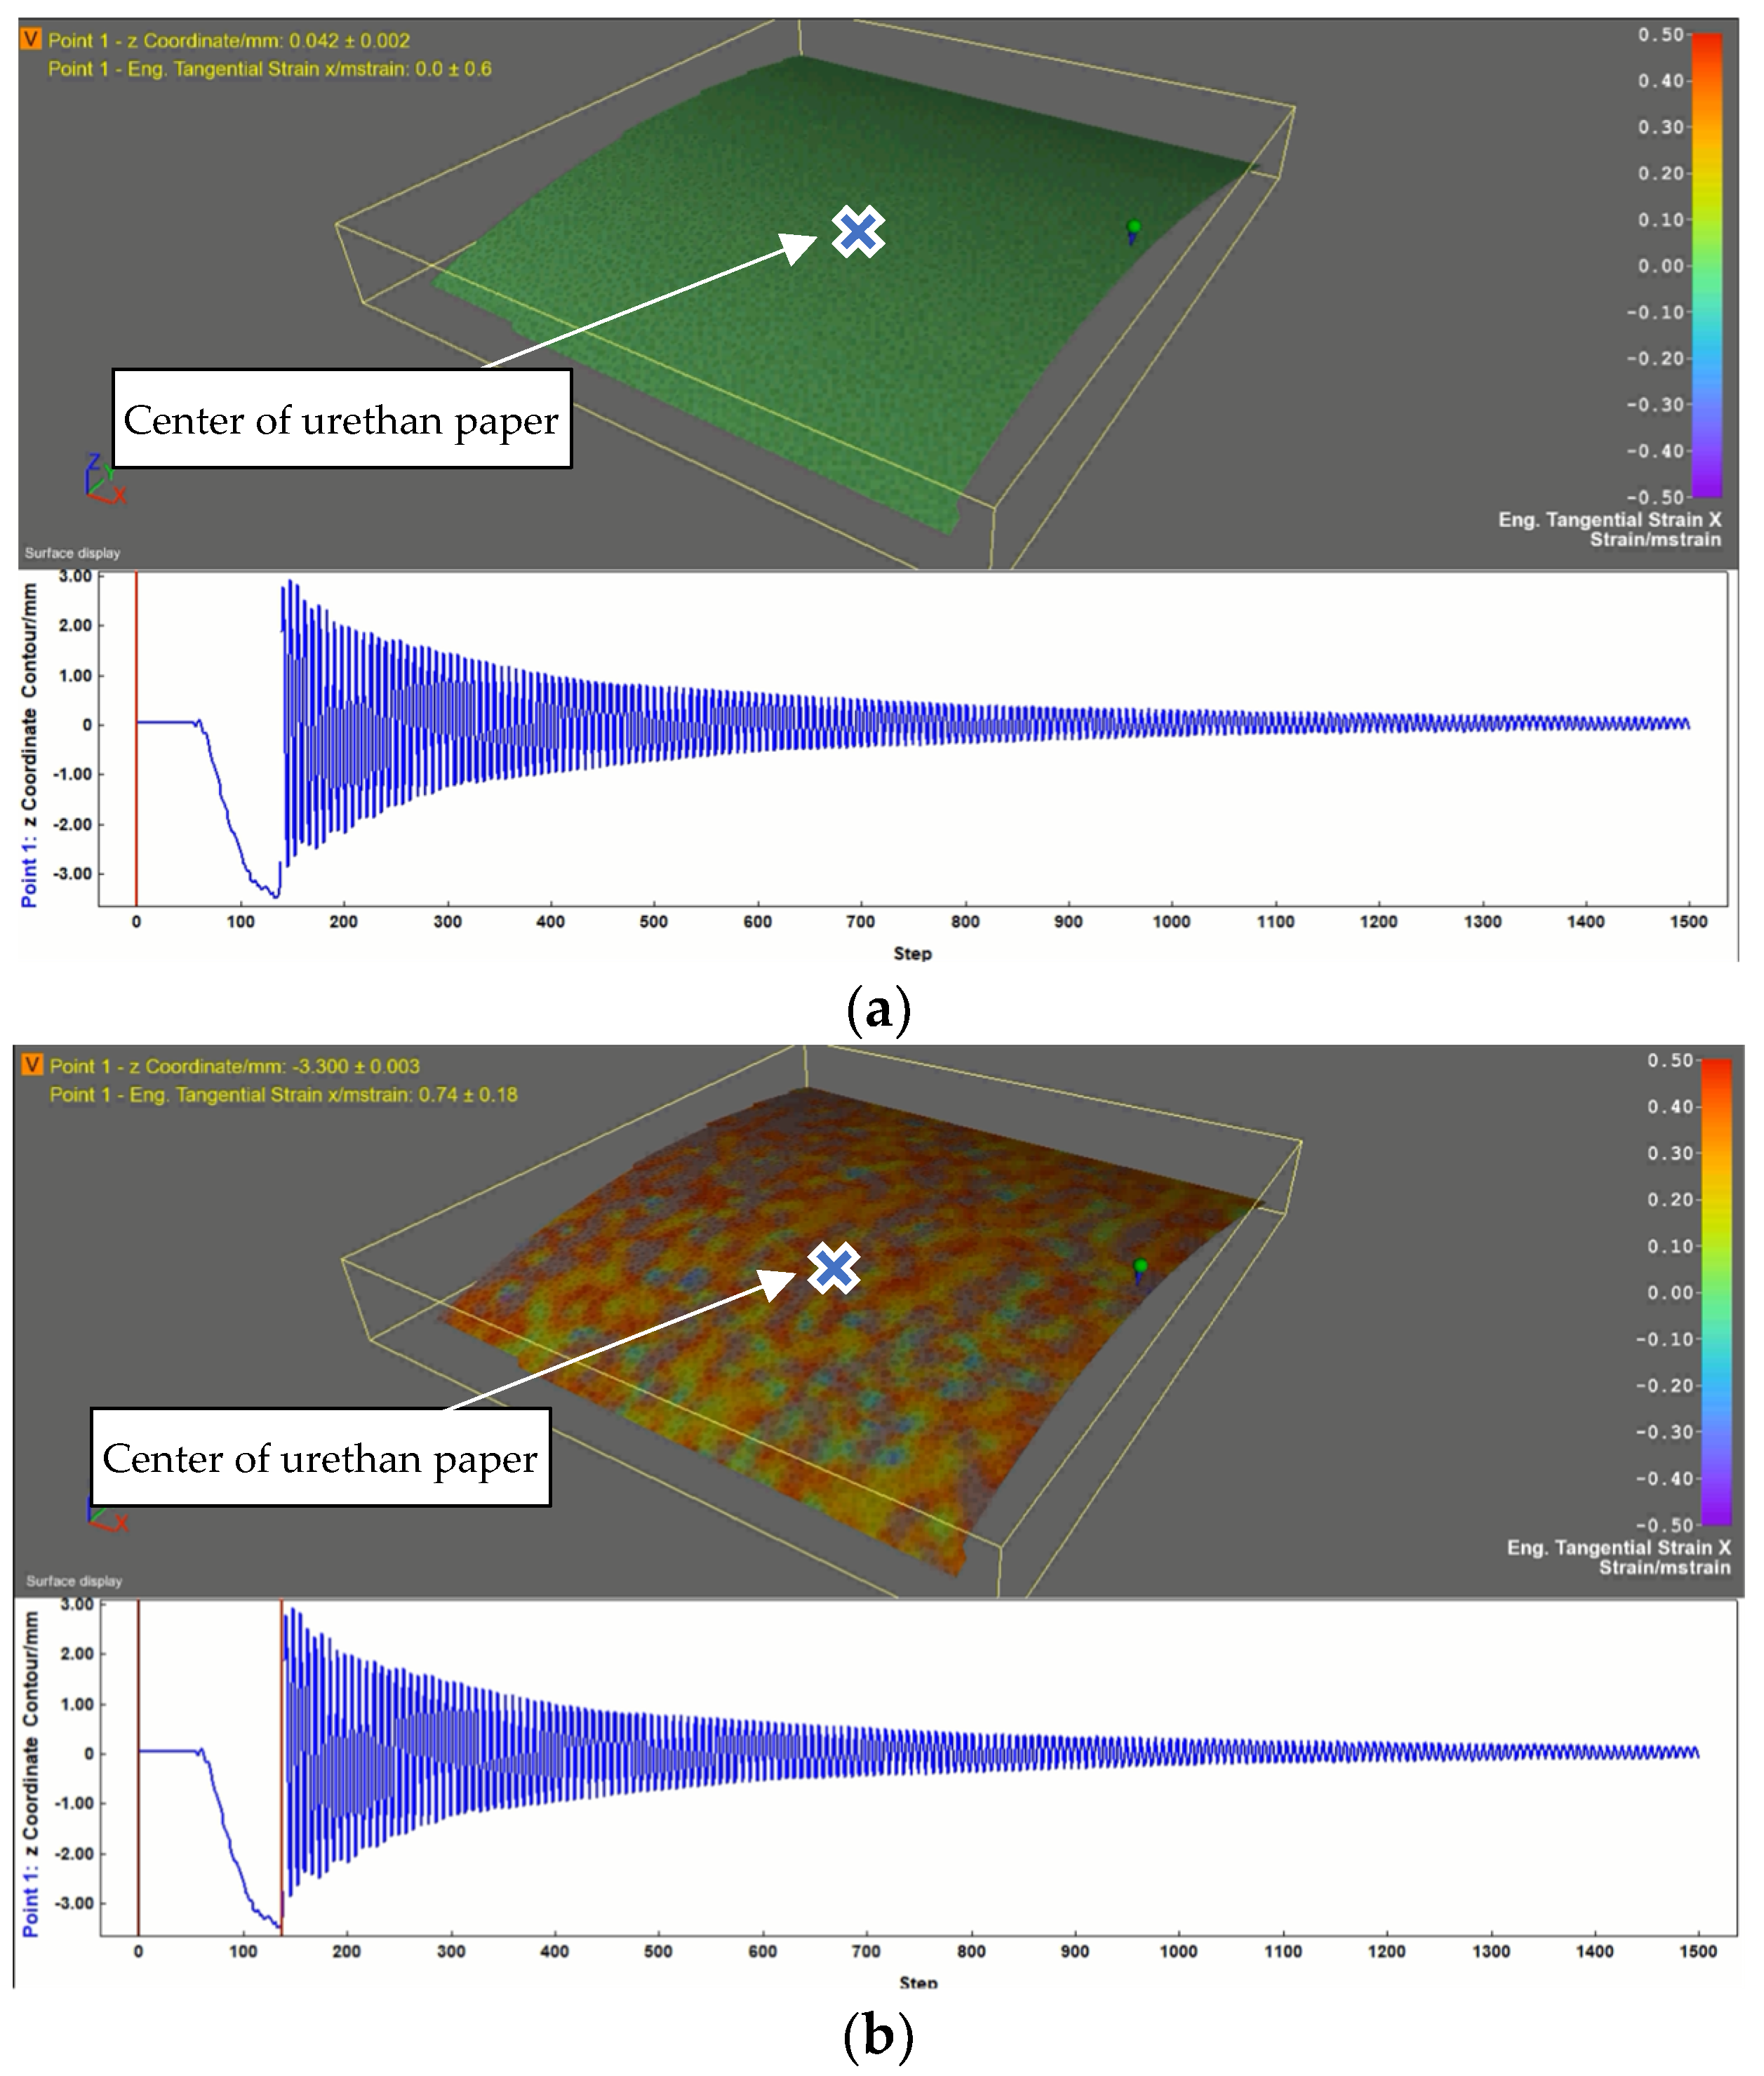
The experimental results of the test are illustrated in
Figure 13, which shows the deformation of the speckle pattern and displacement in the z-direction (flapwise direction), specifically at the center of the speckle pattern.
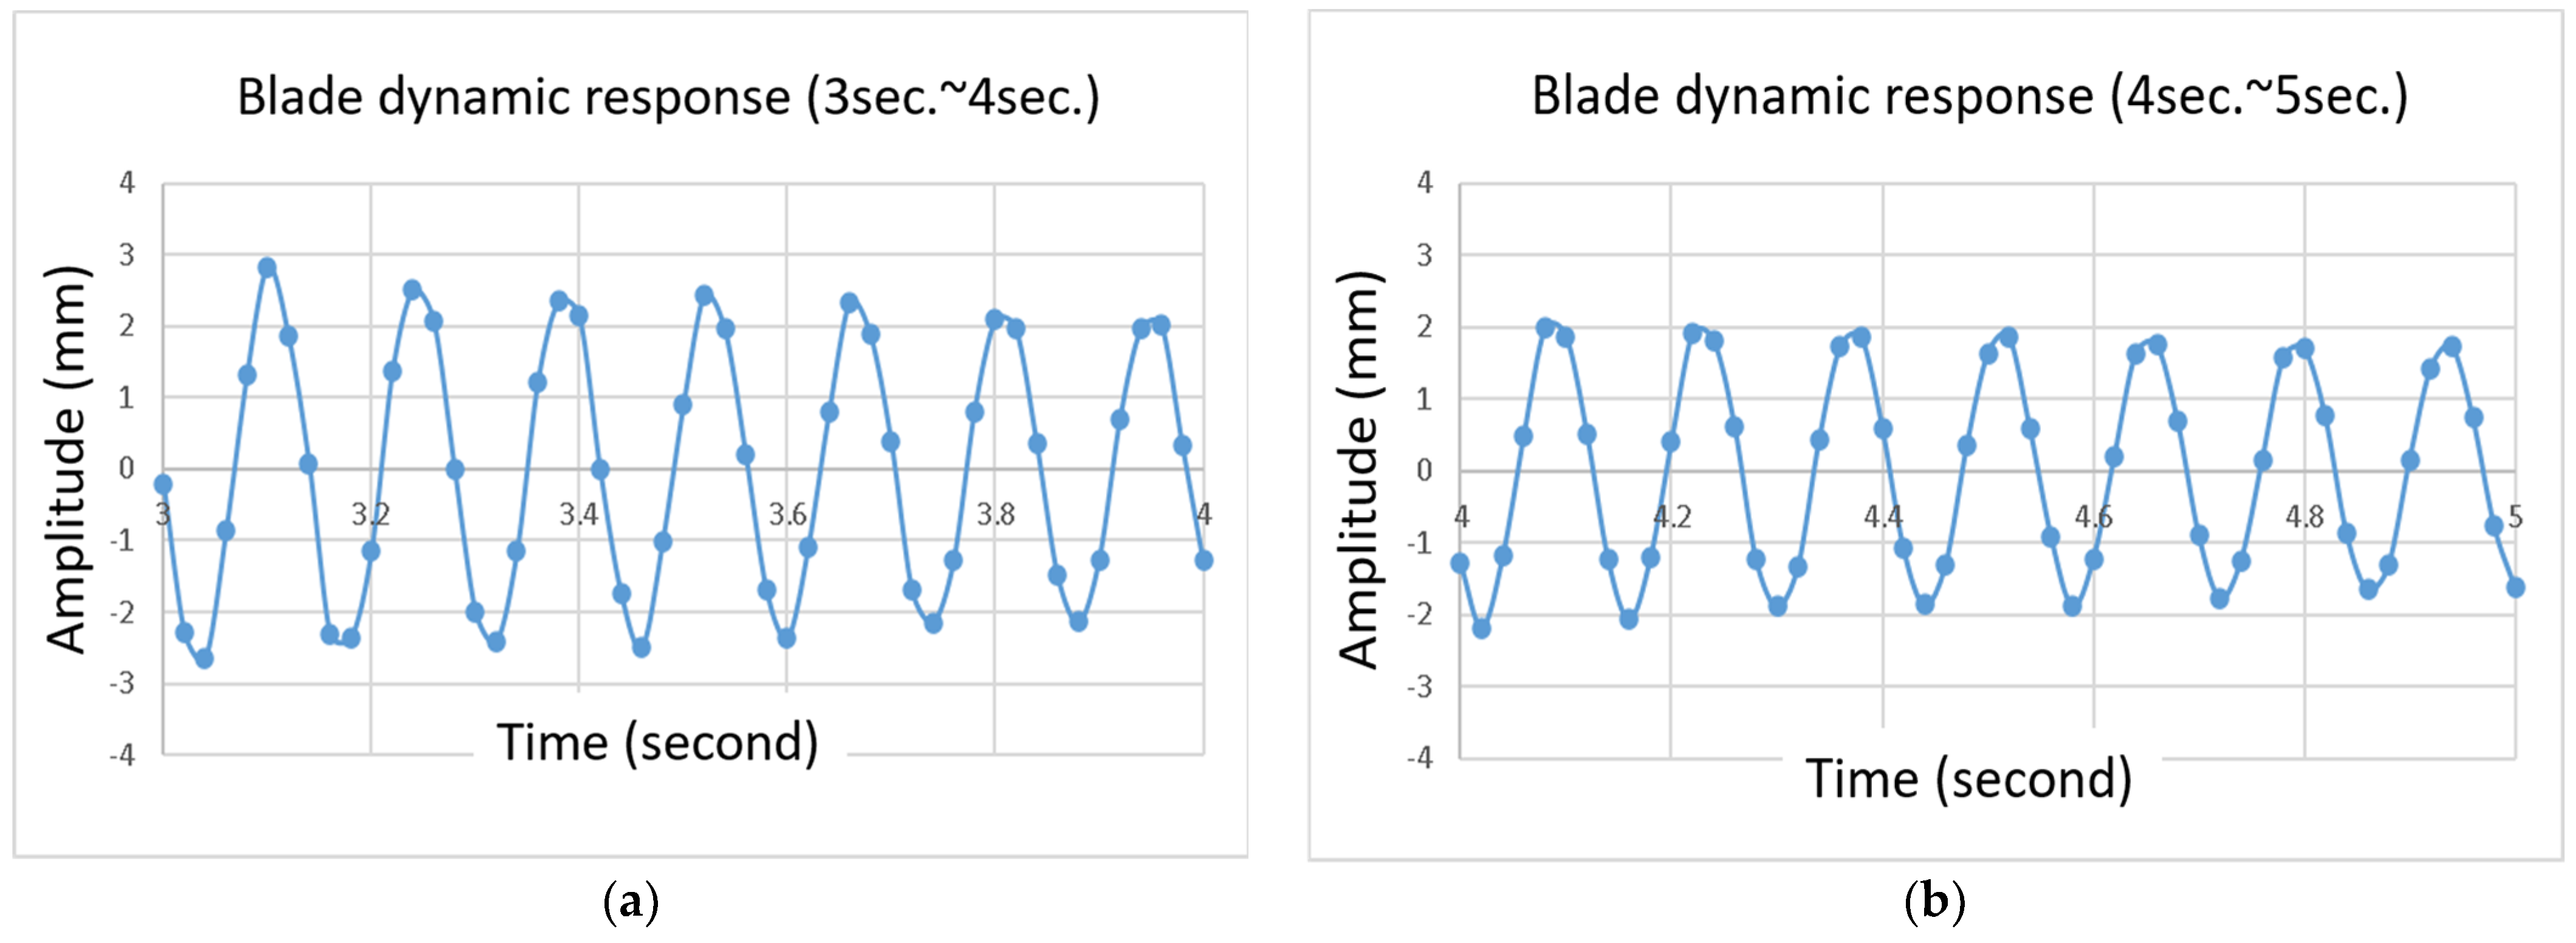
For clearer visibility of the blade displacement, the response graph between 3 and 5 s was enlarged, as shown in
Figure 14. According to the measurement data, the first flapwise frequency was found to be 7.75 Hz.
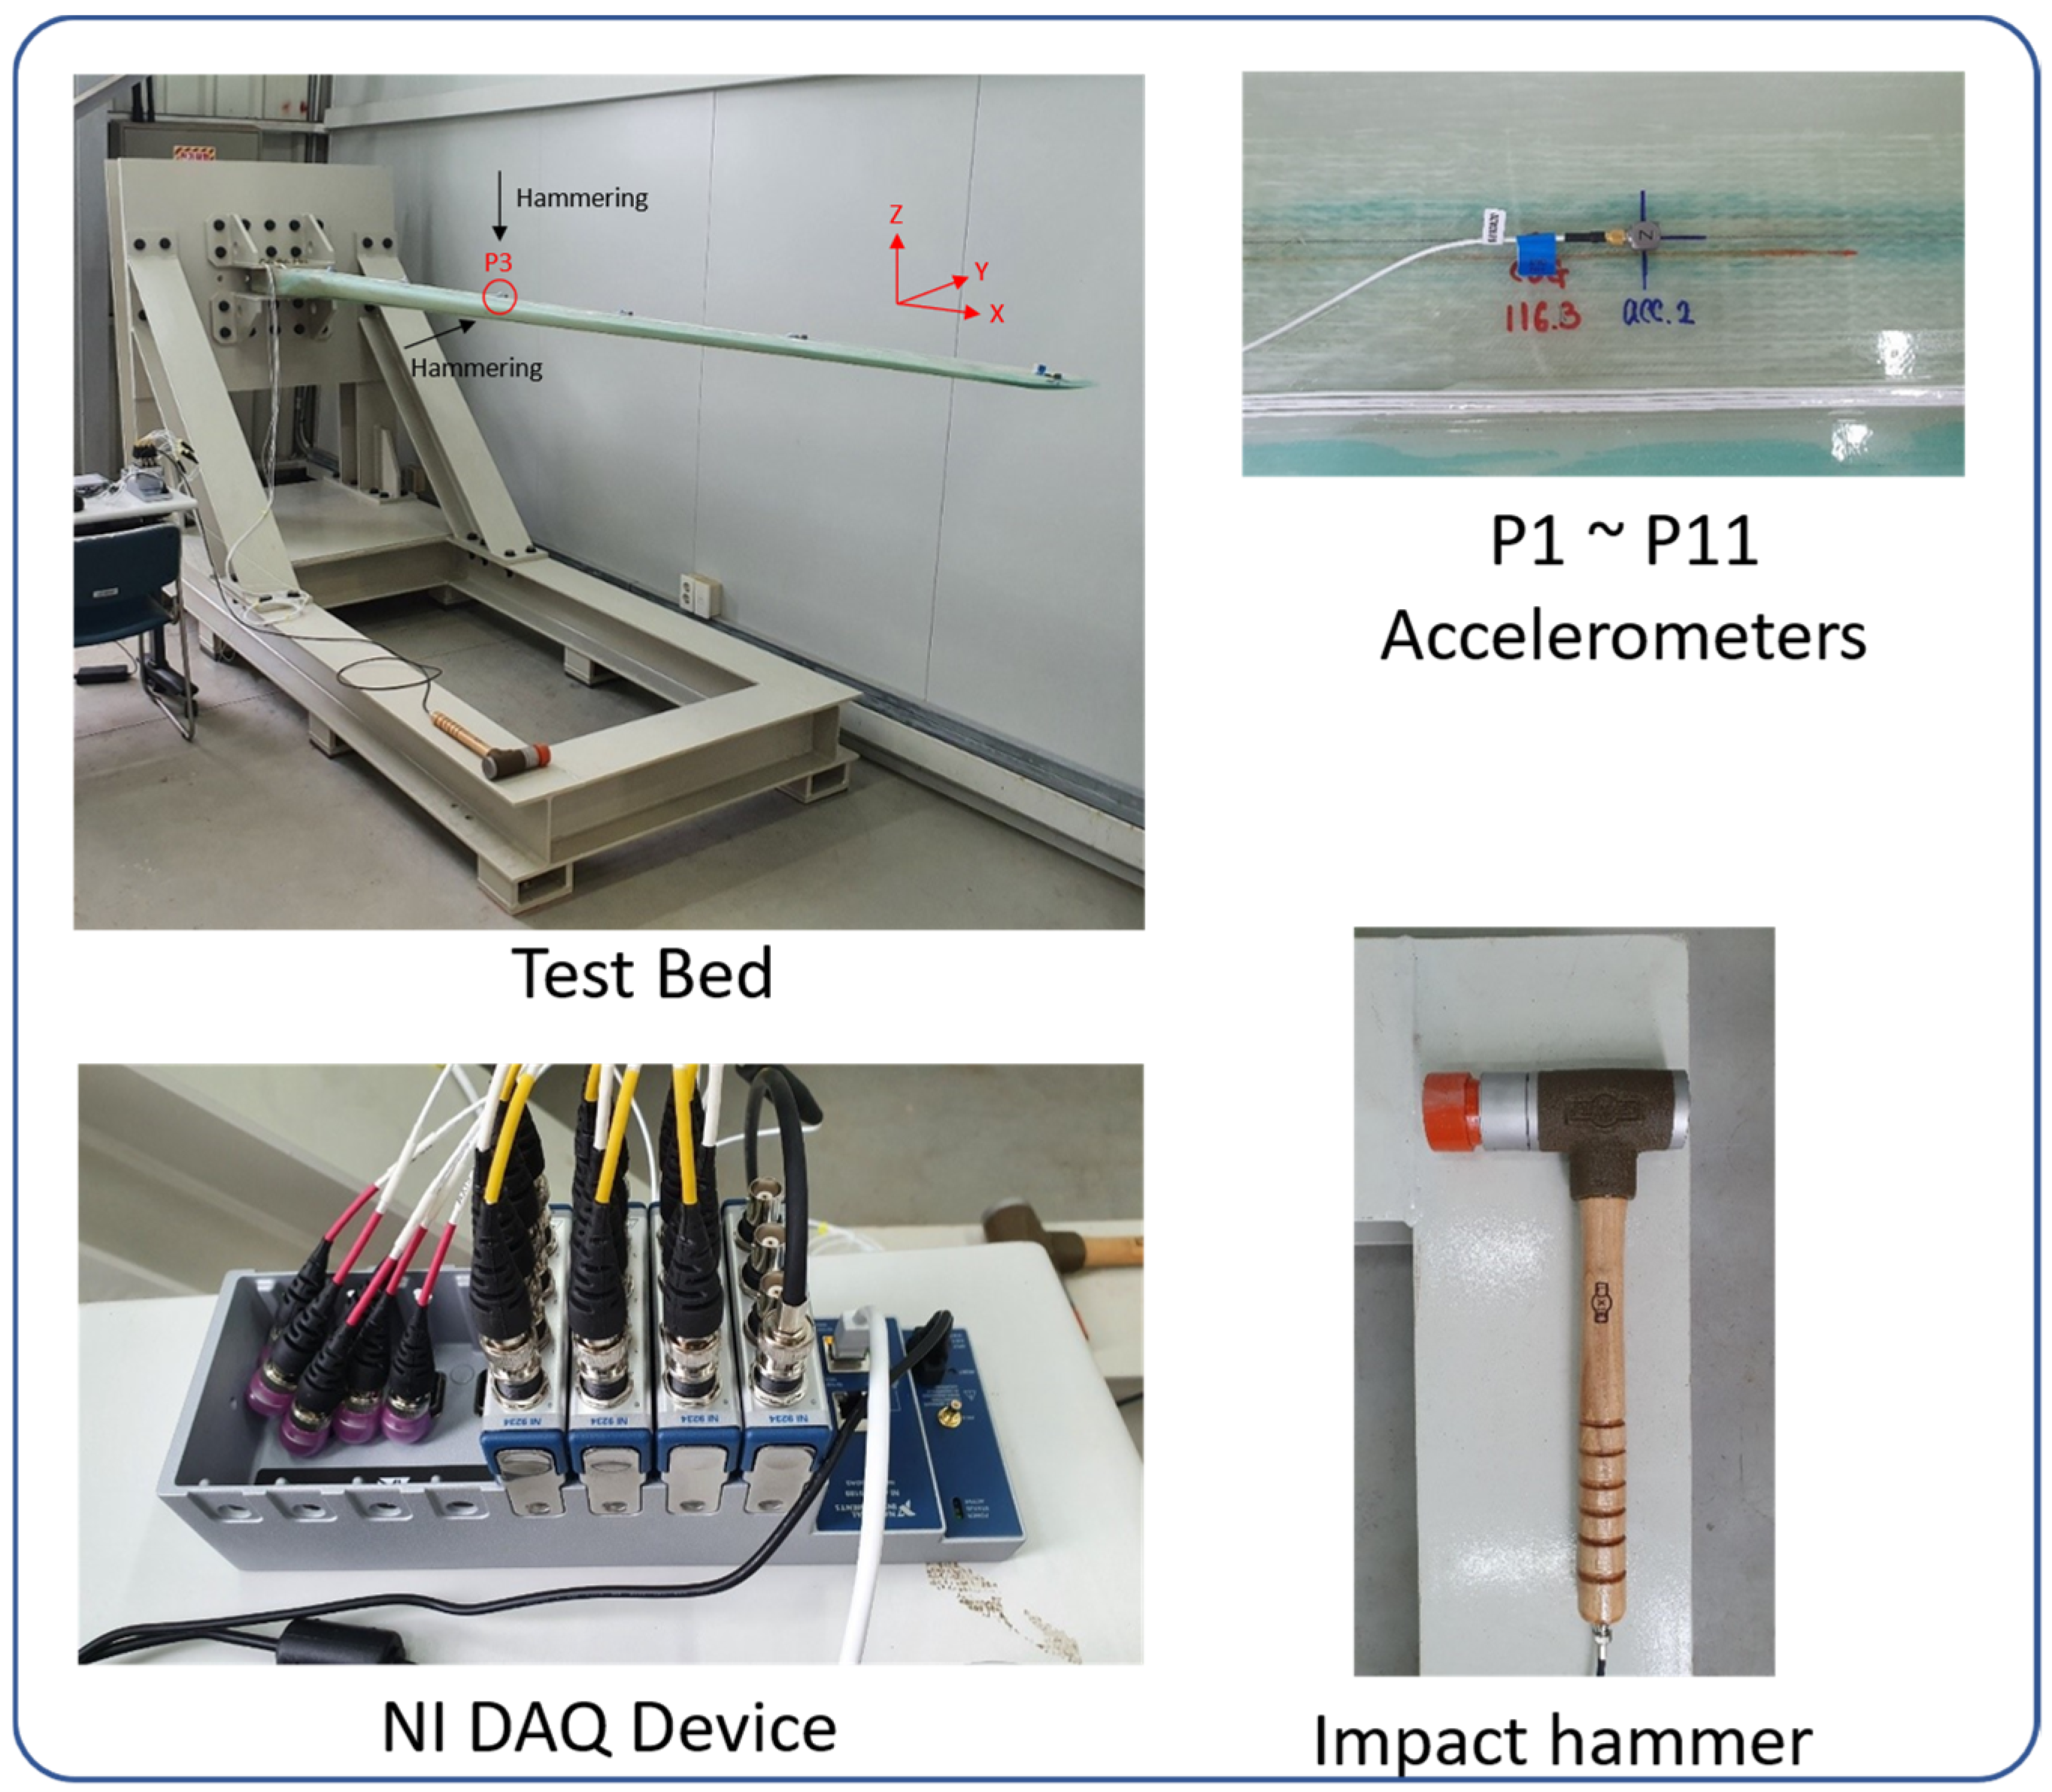
3.2.4. Validation of the 3D DIC Measurement Approach
To verify 3D DIC usage based on the first frequency, a modal test using a hammer was performed in which accelerometers were placed on the blade, as shown in
Figure 15. A modal test using an impact hammer is widely used for measuring eigenfrequencies [
30,
31,
32,
33]. The modal test configuration, consisting of a test bed, accelerometers, a DAQ device, and an impact hammer, is shown in
Figure 16.
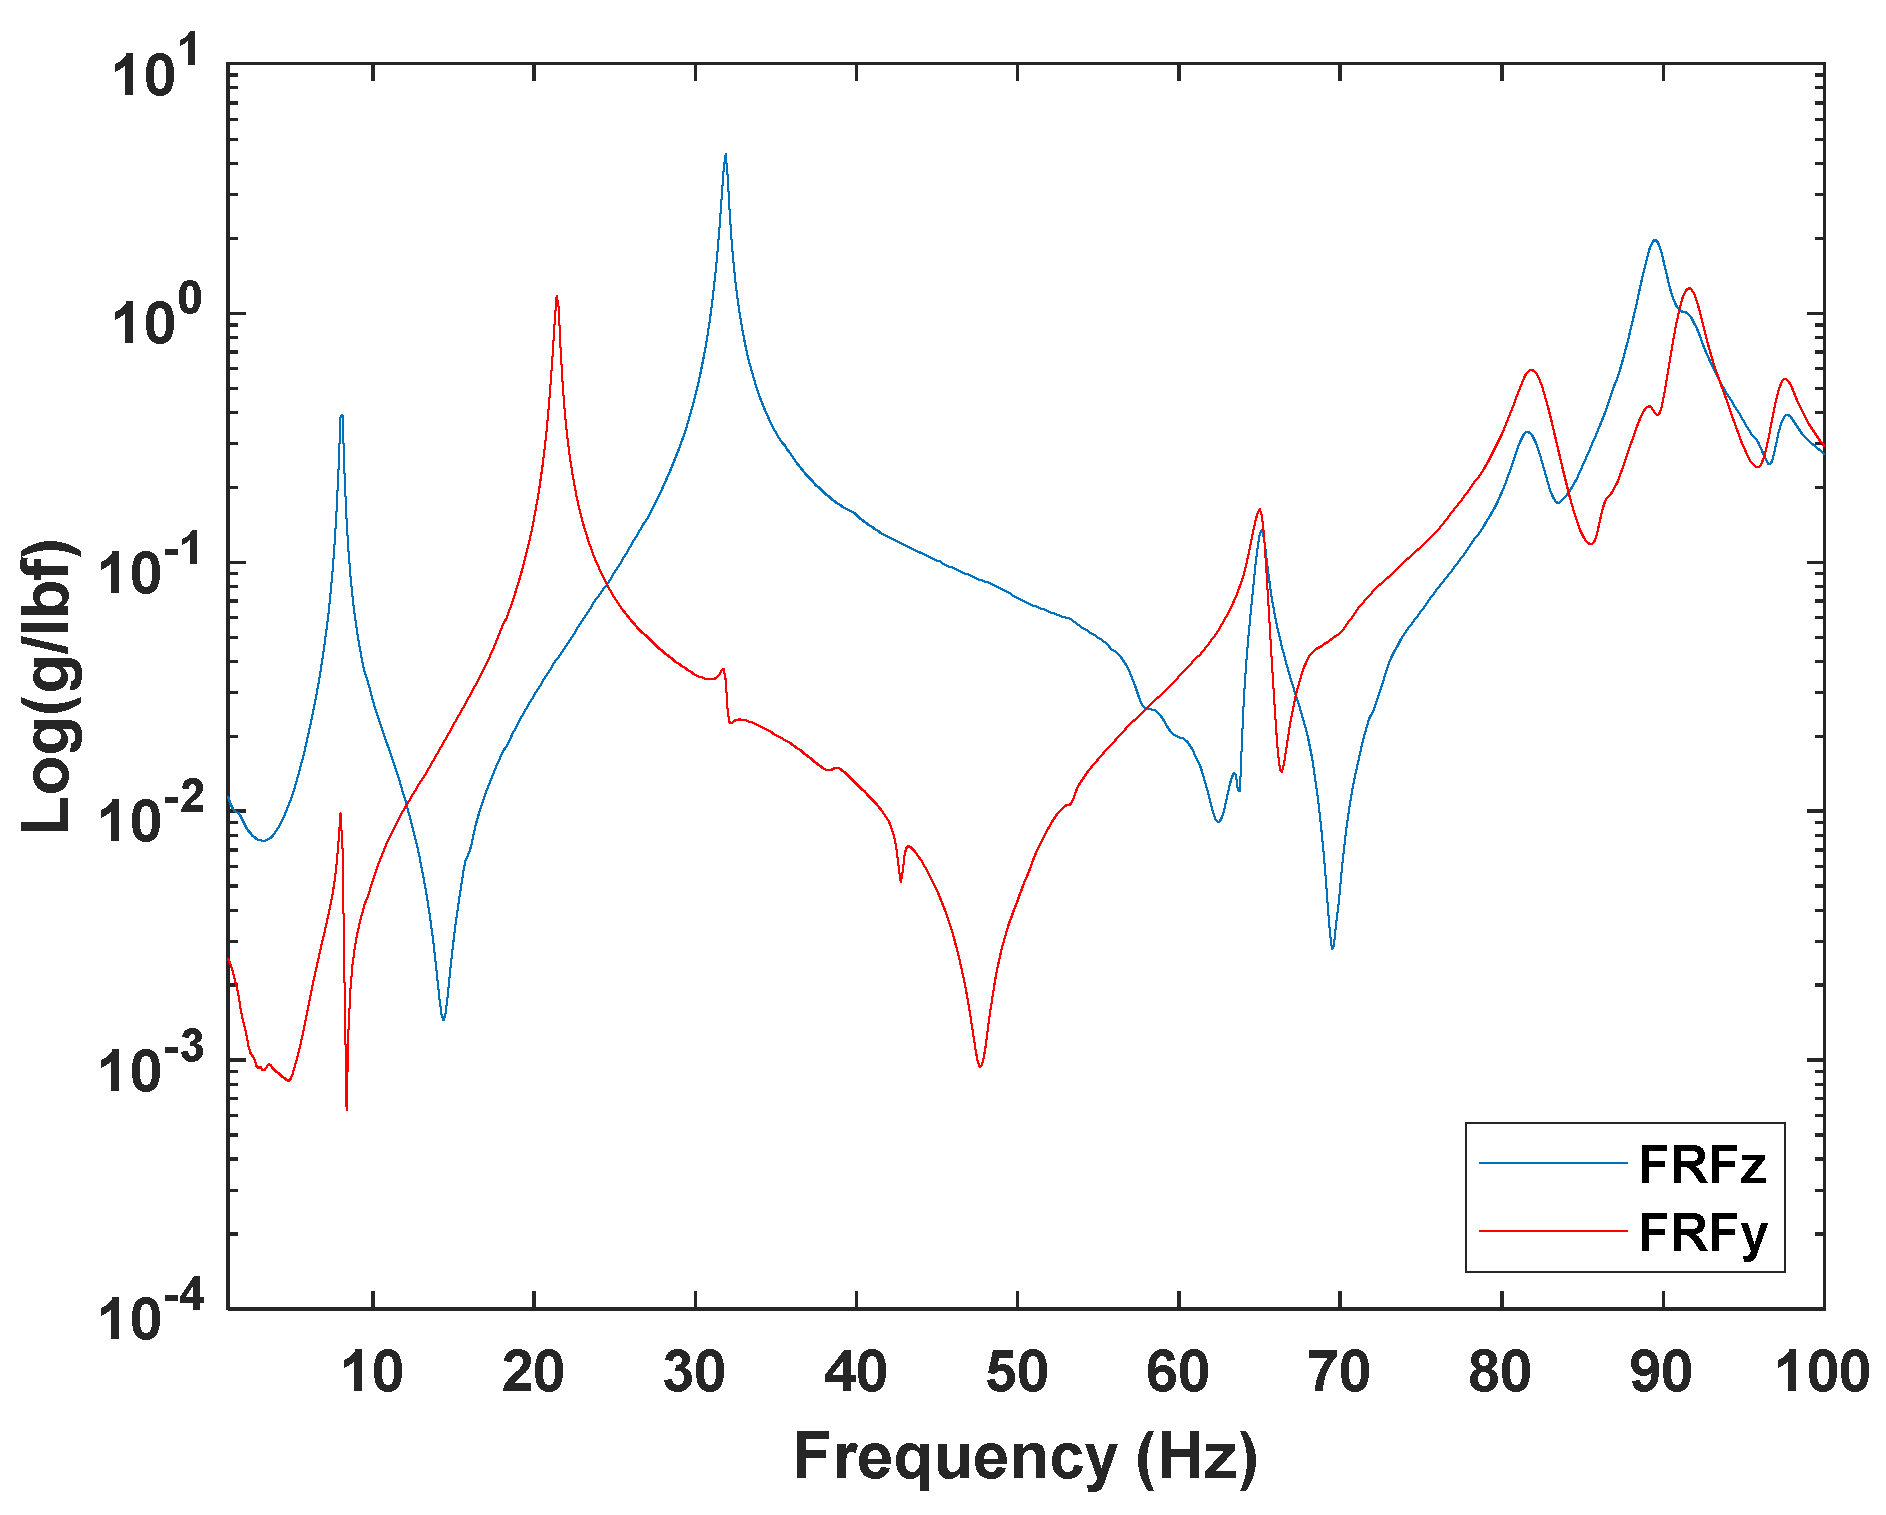
From the modal test, the measured frequency values were plotted in the frequency domain, as shown in
Figure 17. The first three natural frequencies are listed in
Table 3.
Table 4 compares the 3D DIC and modal test measurements. The first frequency values measured by these two experimental methods are very consistent.
4. Discussion
This study considered the application of a 3D DIC system in wind turbine blade property measurements that are required for blade certification, and validated this technique using traditional measurement methods, such as strain gauges and accelerometers.
Experimental tests showed that traditional measurement techniques using contact sensors can measure physical quantities only from installation points and require lengthy cables that cause signal noise. However, noncontact measurement techniques, such as 3D DIC, can generate full-field strains and displacements without any mechanical connections, such as cables, and can also provide directly observable data. In this study, a 3D DIC measurement technique was used for a feasibility study of a small wind blade certification test that measures the first frequency of the material properties of the GFRP used in blades. The feasibility and validation studies performed in this study are summarized in the following paragraphs.
First, a 3D DIC measurement approach was used to characterize the material properties and was validated using traditional contact measurement techniques, such as strain gauges. The 3D-DIC-measured values successfully matched the strain gauges in a specific direction (in this case, the longitudinal direction), and it also provided the deformation status quantitatively and visibly over the surface using speckle-patterned urethane paper. It is also noteworthy that the preparation time for 3D DIC measurement was significantly shorter than that for strain gauge measurement. When analyzing the DIC data, an oscillation issue was observed compared to the strain gauge data shown in
Figure 9, which resulted from the facet size setting in the image processing software. When the facet size was increased from 21 × 21 to 61 × 61, the oscillation effect diminished. It was found that the facet size should be adjusted depending on the structure and speckle pattern sizes. However, further sensitivity studies on DIC parameters have not been addressed in this study and will be conducted in the future.
Second, the 3D DIC method was applied to obtain the first frequency of a small blade in the flapwise direction and was validated with a modal test method using an impact hammer. In the comparison of the first frequency values, the 3D DIC technique showed very good correlation with the traditional modal test method with a 2.1% difference, in addition to the reduced preparation time of the 3D DIC method.
Based on the validated data resulting from the application of the 3D DIC system to the material properties and frequency measurements of a small wind turbine blade, it was found that the 3D DIC system could be effectively used for the entire certification process, with a reduction in blade development time and cost. Most importantly, the 3D DIC measurement technique can simplify the preparation for the blade test and post-processing time of the data obtained from the blade test.
5. Conclusions
The aim of the present study was to apply a 3D DIC measurement technique with two cameras to measure the material properties at the coupon size level and the structural dynamic behavior of a small wind blade. Through validation with a conventional contact measurement approach using strain gauges and accelerometers, it was found that the 3D DIC method is useful and could be an alternative technique for wind blade property measurements in the future.
This study showed that the 3D DIC technique can provide a valuable method of measuring wind turbine blade properties, ranging from material characterization to frequency measurement. Because this noncontact measurement system uses two cameras placed away from the DUT, it can provide full-field 3D displacement and strain fields, unlike the directional and point-oriented measurement values from the contact method using strain gauges. In addition, with the novel, easily bondable, and removable urethane paper, the preparation time related to the bonding and debonding process could be reduced compared to that for traditional device approaches, which include wire connection and bonding processes for strain gauge attachment and accelerometers, including long cables. The tests performed in this study show that 3D DIC methods could be utilized for the required certification process test items and offer reduced preparation time. However, further research is required to influence the revision of wind blade certification documents.
Author Contributions
Conceptualization, K.H.; methodology, M.K. and S.H.; software, D.K.; validation, K.H. and S.H.; formal analysis, M.K. and D.K.; investigation, M.K.; resources, S.H.; data curation, K.H. and D.K.; writing—original draft preparation, K.H.; writing—review and editing, C.Y.; visualization, D.K.; supervision, C.Y.; project administration, K.H. and C.Y.; funding acquisition, K.H. and C.Y. All authors have read and agreed to the published version of the manuscript.
Funding
This research was funded by the Korea Institute of Energy Technology Evaluation and Planning (KETEP) of the Republic of Korea (Grant No. 20213030020380, Title: Development of adhesive-type modular blades over 70 m for overcoming onshore transportation limitation). This research was also funded by the Korea Institute of Energy Technology Evaluation and Planning (KETEP) and the Ministry of Trade, Industry, and Energy (MOTIE) of the Republic of Korea (Grant No. 20223030020300, Title: Development of test and standardization technology for materials and components of wind turbine blades).
Data Availability Statement
Data are contained within the article.
Conflicts of Interest
The authors declare no conflict of interest.
References
- Hau, E. Wind Turbines: Fundamentals, Technologies, Application, Economics; Springer: Berlin/Heidelberg, Germany, 2013. [Google Scholar] [CrossRef]
- McKenna, R.; Hollnaicher, S.; Leye, P.O.v.d.; Fichtner, W. Cost-potentials for large onshore wind turbines in Europe. Energy 2015, 83, 217–229. [Google Scholar] [CrossRef]
- Musial, W.; Beiter, P.C.; Spitsen, P.; Nunemaker, J.; Gevorgian, V. 2018 Offshore Wind Technologies Market Report; U.S. Department of Energy: Washington, DC, USA, 2018.
- Castro-Santos, L.; Filgueira, A.; Alvarez, J.; Carral, L. Influence of size on the economic feasibility of floating offshore wind farms. Sustainability 2018, 10, 4484. [Google Scholar] [CrossRef]
- Lawrence Berkeley National Laboratory. “R&D Pathways for Supersized Wind Turbine Blades”, DNVGL, Document No.: 10080081-HOU-R-01; Lawrence Berkeley National Laboratory: Berkeley, CA, USA, 2019.
- Ha, K.; Truong, H.V.A.; Dang, T.D.; Ahn, K.K. Recent Control Technologies for Floating Offshore Wind Energy System: A Review. Int. J. Precis. Eng. Manuf.-Green Technol. 2021, 8, 281–301. [Google Scholar] [CrossRef]
- McMorland, J.; Collu, M.; McMillan, D.; Carroll, J. Operation and maintenance for floating wind turbines: A review. Renew. Sustain. Energy Rev. 2022, 163, 112499. [Google Scholar] [CrossRef]
- Ha, K.; Bätge, M.; Melcher, D.; Czichon, S. Development and feasibility study of segment blade test methodology. Wind. Energy Sci. 2020, 5, 591–599. [Google Scholar] [CrossRef]
- Peeters, M.; Santo, G.; Degroote, J.; Paepegem, W.V. The Concept of Segmented Wind Turbine Blades: A Review. Energies 2017, 10, 1112. [Google Scholar] [CrossRef]
- Rosemeier, M.; Basters, G.; Antoniou, A. Benefits of sub-component over full-scale blade testing elaborated on a trailing edge bond line design validation. Wind Energy Sci. 2018, 3, 163–172. [Google Scholar] [CrossRef]
- Scott, I.G. Pre-attachment matching of resistance strain gauges. J. Strain Anal. 1969, 4, 285–286. [Google Scholar] [CrossRef]
- Bøving, K.G. Chapter 29—Strain gauge technology. In NDE Handbook; Butterworth-Heinemann: Oxford, UK, 1989; pp. 295–301. ISBN 9780408043922. [Google Scholar] [CrossRef]
- Greaves, P.; Prieto, R.; Gaffing, J.; van Beveren, C.; Dominy, R.; Ingram, G. A novel method of strain—Bending moment calibration for blade testing. J. Phys. Conf. Ser. 2016, 753, 042014. [Google Scholar] [CrossRef]
- IEC. Wind Turbine Generator Systems—Part 13 (Measurement of Mechanical Loads); International Electrotechnical Commission: Geneva, Switzerland, 2015. [Google Scholar]
- Zhou, Y. Local Finite Element Refinement for Accurate Dynamic Stress via Modal Information. AIAA J. 2020, 58, 3593–3606. [Google Scholar] [CrossRef]
- Janeliukstis, R.; Chen, X. Review of digital image correlation application to large-scale composite structure testing. Compos. Struct. 2021, 271, 114143. [Google Scholar] [CrossRef]
- Wang, Y.; Tong, W. A high resolution DIC technique for measuring small thermal expansion of film specimens. Opt. Lasers Eng. 2013, 51, 30–33. [Google Scholar] [CrossRef]
- Bing, P.; Hui-Min, X.; Tao, H.; Asundi, A. Anand Asundi, Measurement of coefficient of thermal expansion of films using digital image correlation method. Polym. Test. 2009, 28, 75–83. [Google Scholar] [CrossRef]
- Poozesh, P.; Baqersad, J.; Niezrecki, C.; Avitabile, P. A Multi-Camera Stereo DIC System for Extracting Operating Mode Shapes of Large Scale Structures. In Advancement of Optical Methods in Experimental Mechanics, Volume 3: Conference Proceedings of the Society for Experimental Mechanics Series; Jin, H., Yoshida, S., Lamberti, L., Lin, M.T., Eds.; Springer: Cham, Switzerland, 2016. [Google Scholar] [CrossRef]
- LeBlanc, B.; Niezrecki, C.; Avitabile, P.; Chen, J.; Sherwood, J. Damage detection and full surface characterization of a wind turbine blade using three-dimensional digital image correlation. Struct. Health Monit. 2013, 12, 430–439. [Google Scholar] [CrossRef]
- Ozbek, M.; Rixen, D.J. Operational modal analysis of a 2.5 MW wind turbine using optical measurement techniques and strain gauges. Wind Energy 2013, 16, 367–381. [Google Scholar] [CrossRef]
- Winstroth, J.; Seume, J.R. Wind Turbine Rotor Blade Monitoring Using Digital Image Correlation: 3D Simulation of the Experimental Setup. In Proceedings of the EWEA 2014 Annual Event, Barcelona, Spain, 10–13 March 2014. [Google Scholar]
- Zhao, F.; Gao, Y.; Wang, T.; Yuan, J.; Gao, X. Experimental Study on Wake Evolution of a 1.5 MW Wind Turbine in a Complex Terrain Wind Farm Based on LiDAR Measurements. Sustainability 2020, 12, 2467. [Google Scholar] [CrossRef]
- Carr, J.; Baqersad, J.; Niezrecki, C.; Avitabile, P. Full-Field Dynamic Strain on Wind Turbine Blade Using Digital Image Correlation Techniques and Limited Sets of Measured Data from Photogrammetric Targets. Experimental Techniques. Soc. Exp. Mech. 2016, 40, 819–831. [Google Scholar] [CrossRef]
- IEC 61400-5; Wind Turbines Part 5: Wind Turbine Blades. International Electrotechnical Commission: Geneva, Switzerland, 2020.
- IEC 61400-23; Wind Turbines Part 23: Full-scale Structural Testing of Rotor Blades. International Electrotechnical Commission: Geneva, Switzerland, 2014.
- Wind Power—Innovative Vibration Tests on Rotor Blades, DLR (German Aerospace Center). 2018. Available online: https://www.dlr.de/en/latest/news/2018/2/20180524_wind-power-innovative-vibration-tests-on-rotor-blades_27829 (accessed on 1 September 2023).
- Samadian, K.; Hertelé, S.; De Waele, W. Using 3D Digital Image Correlation (3D-DIC) to Measure CTOD in a Semi-Elliptical Surface Crack. Proceedings 2018, 2, 451. [Google Scholar]
- ASTM D638-14; Standard Test Method for Tensile Properties of Plastics. ASTM International: West Conshohocken, PA, USA, 2014. Available online: http://www.astm.org (accessed on 1 September 2023).
- Larsen, C.G.; Hansen, M.H. Andreas Baumgart, Ingemar Carien, Modal Analysis of Wind Turbine Blades, Riso-R-1181(EN); Riso National Laboratory: Roskilde, Denmark, 2002.
- Pedersen, H.B.; Kristense, O.D. Applied Modal Analysis of Wind Turbine Blades, Risø-R-1388(EN); Risø National Laboratory: Roskilde, Denmark, 2003.
- Di Lorenzo, E.; Manzato, S.; Peeters, B.; Ruffini, V.; Berring, P.; Haselbach, P.U.; Branner, K.; Luczak, M.M. Modal Analysis of Wind Turbine Blades with Different Test Setup Configurations. In Topics in Modal Analysis & Testing; Conference Proceedings of the Society for Experimental Mechanics Series; Springer International Publishing: Berlin/Heidelberg, Germany, 2020. [Google Scholar] [CrossRef]
- Agilent Technologies. The Fundamentals of Modal Testing Application Note 243-3; Agilent Technologies: Santa Clara, CA, USA, 2000. [Google Scholar]
Figure 1.
Typical test pyramid for wind blade certification.
Figure 1.
Typical test pyramid for wind blade certification.
Figure 2.
Typical wind turbine blade vibration test configuration with more than 500 sensors including lengthy signal cables. Credit: DLR (CC-BY 3.0) [
27].
Figure 2.
Typical wind turbine blade vibration test configuration with more than 500 sensors including lengthy signal cables. Credit: DLR (CC-BY 3.0) [
27].
Figure 3.
A brief illustration of 2D and 3D DIC processes. Credit: Kaveh Samadian (CC-BY 4.0) [
28].
Figure 3.
A brief illustration of 2D and 3D DIC processes. Credit: Kaveh Samadian (CC-BY 4.0) [
28].
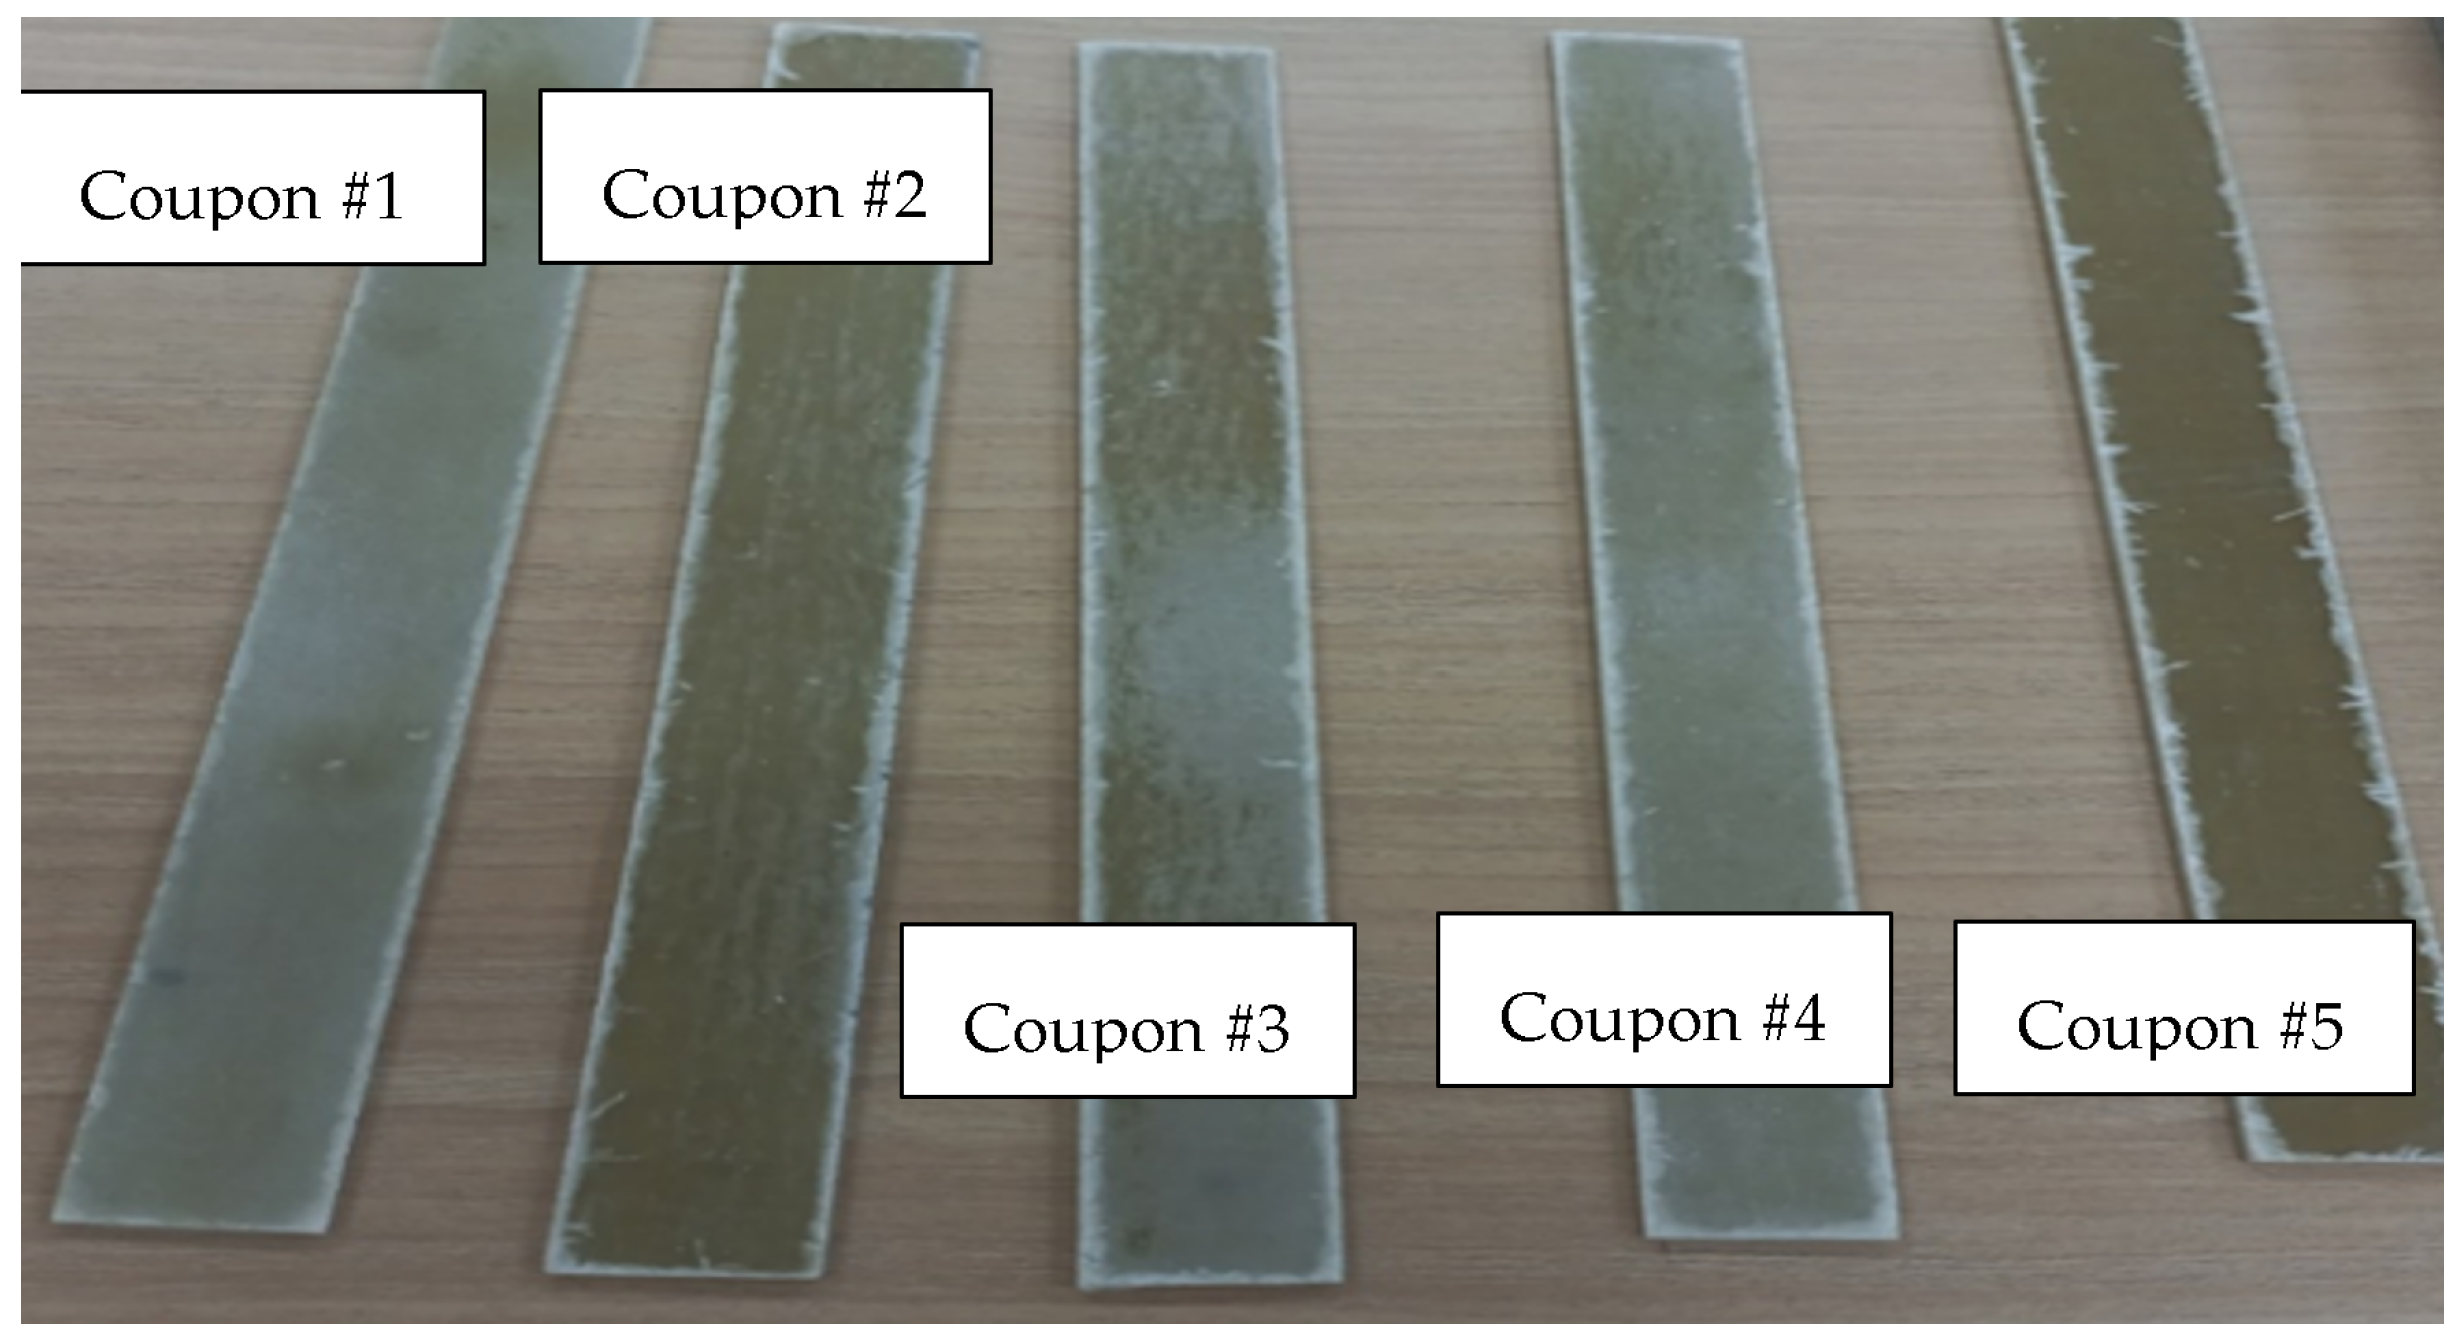
Figure 4.
Coupons made with GFRP.
Figure 4.
Coupons made with GFRP.
Figure 5.
Coupon preparation for DIC: (a) urethane paper printed with speckles; (b) speckle paper bonded on coupon; (c) strain gauges installed on coupons.
Figure 5.
Coupon preparation for DIC: (a) urethane paper printed with speckles; (b) speckle paper bonded on coupon; (c) strain gauges installed on coupons.
Figure 7.
Load recorded until specimen failure: (a) coupon #01 and (b) coupon #02.
Figure 7.
Load recorded until specimen failure: (a) coupon #01 and (b) coupon #02.
Figure 8.
Deformation course of coupon under tensile testing: (a) beginning stage (no load), (b) middle stage (under load), and (c) final stage (at ultimate load).
Figure 8.
Deformation course of coupon under tensile testing: (a) beginning stage (no load), (b) middle stage (under load), and (c) final stage (at ultimate load).
Figure 9.
Strain value comparison between strain gauges and the DIC system: longitudinal strains in blue and transverse strains in red. Solid line indicates strain gauges and dotted line indicates DIC: (a) coupon #03, (b) coupon #04, and (c) coupon #05.
Figure 9.
Strain value comparison between strain gauges and the DIC system: longitudinal strains in blue and transverse strains in red. Solid line indicates strain gauges and dotted line indicates DIC: (a) coupon #03, (b) coupon #04, and (c) coupon #05.
Figure 10.
A small blade (3.65 m) with a fixed boundary condition.
Figure 10.
A small blade (3.65 m) with a fixed boundary condition.
Figure 11.
Three-dimensional DIC test configuration to measure the blade frequency and speckle pattern paper bonded on the blade.
Figure 11.
Three-dimensional DIC test configuration to measure the blade frequency and speckle pattern paper bonded on the blade.
Figure 12.
Blade excitation by hand shaking.
Figure 12.
Blade excitation by hand shaking.
Figure 13.
Visibly observed response of the blade surface with speckle pattern and measured displacement data in the flapwise direction specific to the center of the urethane paper: (a) beginning stage (no load), (b) max. deflection (under load), (c) under free vibration, and (d) final stage (near rest) (blue line: continuously measured data).
Figure 14.
Flapwise dynamic response observed from DIC: (a) magnified response from 3 s to 4 s and (b) magnified response from 4 s to 5 s. (blue dot: measured point, blue line: spline curve).
Figure 14.
Flapwise dynamic response observed from DIC: (a) magnified response from 3 s to 4 s and (b) magnified response from 4 s to 5 s. (blue dot: measured point, blue line: spline curve).
Figure 15.
Accelerometer location on a small blade for a modal test.
Figure 15.
Accelerometer location on a small blade for a modal test.
Figure 16.
Modal test configuration including sensors, DAQ, and impact hammer.
Figure 16.
Modal test configuration including sensors, DAQ, and impact hammer.
Figure 17.
Frequency response measured by the modal test. FRFz: FRF in the direction of z (flapwise), FRFy: FRF in the direction of y (edgewise).
Figure 17.
Frequency response measured by the modal test. FRFz: FRF in the direction of z (flapwise), FRFy: FRF in the direction of y (edgewise).
Table 1.
Measured geometry of coupons.
Table 1.
Measured geometry of coupons.
| Coupon No. | Length (mm) | Width (mm) | Thickness (mm) |
|---|
| 1 | 250 | 26.1 | 2.68 |
| 2 | 250 | 26.5 | 2.59 |
| 3 | 251 | 26.2 | 2.61 |
| 4 | 250 | 26.1 | 2.55 |
| 5 | 250 | 16.2 | 3.19 |
Table 2.
Specification of systems used for test setup.
Table 2.
Specification of systems used for test setup.
| System | Specification | Supplier |
|---|
| Camera system | | Dantec Dynamics
(Holtsville, NY, USA) |
| Image processing system | |
| Lightning system | | #B-Light
(Villotta, Italy) |
| Urethane paper | Thickness: 13–15 μm Material: urethane
| Sunnyscopa
(Goyang-si, Republic of Korea) |
| Test machine | | Custom-built |
| Strain box | | Micro Measurements (VPG)
(Raleigh, NC, USA) |
| Accelerometer | | Dytran
(Chatsworth, CA, USA) |
| Impact hammer | | Dytran
(Chatsworth, CA, USA) |
Table 3.
Measured natural frequencies.
Table 3.
Measured natural frequencies.
| Mode No. | Mode Description | Natural Frequency (Hz) |
|---|
| 1 | 1st Flap | 7.92 |
| 2 | 1st Edge | 21.74 |
| 3 | 2nd Flap | 30.63 |
Table 4.
Comparison of 1st frequency values measured by the 3D DIC technique and modal test.
Table 4.
Comparison of 1st frequency values measured by the 3D DIC technique and modal test.
| Item | Measurement Methods | Difference (%) |
|---|
| Modal Test | 3D DIC |
|---|
1st frequency
(flapwise) | 7.92 | 7.75 | 2.1% |
| Disclaimer/Publisher’s Note: The statements, opinions and data contained in all publications are solely those of the individual author(s) and contributor(s) and not of MDPI and/or the editor(s). MDPI and/or the editor(s) disclaim responsibility for any injury to people or property resulting from any ideas, methods, instructions or products referred to in the content. |
© 2024 by the authors. Licensee MDPI, Basel, Switzerland. This article is an open access article distributed under the terms and conditions of the Creative Commons Attribution (CC BY) license (https://creativecommons.org/licenses/by/4.0/).


