Article

Charge Storage and Magnetic Properties Nitrogen-Containing Nanoporous Bio-Carbon

1
Faculty of Electrical Engineering, Czestochowa University of Technology, J. Dąbrowskiego Str. 69, 42-201 Częstochowa, Poland
2
Institute of Applied Mathematics and Fundamental Sciences, Lviv Polytechnic National University, Bandera Str. 12, 79013 Lviv, Ukraine
3
Faculty of Electronics and Computer Technologies, Ivan Franko Lviv National University, Universytetska Str. 1, 79005 Lviv, Ukraine
*
Author to whom correspondence should be addressed.
Energies 2024, 17(4), 903; https://doi.org/10.3390/en17040903
Submission received: 29 November 2023 / Revised: 30 January 2024 / Accepted: 13 February 2024 / Published: 15 February 2024
(This article belongs to the Section A4: Bio-Energy)

Abstract

:
This article presents the technology for the preparation of a nitrogen-containing nanoporous bio-carbon and investigates its properties. It has been shown that the synthesised bio-carbon is characterised by a high degree of homogeneity, which has been confirmed by energy dispersive spectroscopy. The obtained bio-carbon has a micromesoporous structure, which has been confirmed by the results of studies using the method of low-temperature nitrogen adsorption and desorption. It was found that the specific surface area of biochar is 1247 m2/g. The data on nitrogen adsorption and desorption were compared with the data on small-angle X-ray scattering, and it was found that the micropores in the synthesised bio-carbon are open pores, while mesopores remain closed. The energy dispersion analysis showed that the structure of the bio-carbon does not contain ferromagnetic atoms, but due to the addition of nitrogen, the synthesised bio-carbon in a magnetic field has the properties of a ferromagnet with a characteristic hysteresis of the specific magnetisation. It was found that this material has a saturation magnetisation σs of 1.4 A∙m2∙kg−1 and a coercive force Hc of 10 kA/m. Symmetric supercapacitors were fabricated from the synthesised bio-carbon material with 30% aqueous KOH and 1 M Na2SO4 as electrolytes. It was found that for bio-carbon synthesised at 800 °C, the specific capacitance in a 30% aqueous solution of KOH is 180 F/g, and in a 1 M aqueous solution of Na2SO4, it is 124 F/g. The cyclic voltammetry of the fabricated supercapacitors at different rates of potential expansion was investigated and analysed. Impedance studies on these supercapacitors were carried out. The equivalent electrical circuits describing the electrochemical processes in the studied supercapacitors were constructed and characterised.

1. Introduction

The technology of the first supercapacitors (SCs) was developed back in 1953, but scientists are still working to improve their efficiency. The main problem with these devices is their insufficient energy density, which is the basis for the fundamental contradiction between the growing needs of the latest circuitry and the capabilities of traditional technologies for autonomous energy generation and storage devices. The energy capacity of SC is being increased in two main ways: by increasing the specific capacitance of the active electrode material and by increasing the maximum operating voltage. The first task is to increase the capacity of the double electric layer of carbon materials, and the second is to use organic electrolytes and electrolytes based on ionic liquids [1,2].
Success in increasing the capacitance of carbon materials hinges on achieving an optimal combination of a porous structure and the corresponding electronic configuration of the material. Such a combination will facilitate unlocking the Helmholtz capacitance through the capacitance of the spatial charge region in a solid. For this purpose, carbon materials are modified by introducing ions of various impurities (atoms of O, N, B, S, P, Si, etc.) into their structures [3,4,5,6,7]. Nitrogen and oxygen are the most widely used. The effect of oxygen has been extensively examined due to its consistent presence in carbon materials. Oxygen functional groups can be readily incorporated into carbon materials through chemical reactions involving activating or oxidizing agents [8,9]. They play a crucial role in the capacitive characteristics by altering the surface wettability, reactivity, and electrical conductivity of the material. Meanwhile, nitrogen-functional groups are gaining growing interest as promising alternative options for modifying the carbon system. Their addition leads to an improvement in electrochemical behaviour, mainly through a contribution to the capacity of the double electric layer or to the pseudocapacitance [10,11,12,13,14], improved wettability [15,16], reduced reactivity of the material [17], and increased electron transfer rate [18,19]. Various techniques exist for introducing nitrogen-functional groups into nanoporous carbon materials. These include reaction with N-containing sources (NH3, NO, urea, etc.), carbonisation of N-containing precursors (such as melamine, pyridine, etc.), and the heat treatment of N-containing precursors infiltrated into the matrix [20,21,22,23,24,25,26,27,28]. Predominant nitrogen-functional groups include pyridine, pyrrole, and pyridine-N-oxide. The influence of nitrogen-functional groups on the supercapacitor’s performance was reported in [29]. It was highlighted that nitrogen-functional groups not only increase the capacity due to Faraday reactions, but also elevate hydrophilicity and electron transfer rates. Consequently, this improvement contributes to enhanced capacitive characteristics of the supercapacitor [30]. There are reports on the production of nitrogen-containing porous carbon materials by simple synthesis methods [31,32]. Direct pyrolysis for the synthesis of porous carbon materials without further activation is considered the most promising method of large-scale production [33].
Expanding the operating voltage range is the second strategic direction for improving the performance of supercapacitors. Organic electrolytes find extensive use in industrial supercapacitors owing to their electrochemical stability at voltages of 2.5–3.2 V. However, organic electrolytes have a number of disadvantages, including high cost, toxicity, low electrical conductivity, flammability, and the necessity of establishing specific working conditions (such as dew point control and an inert environment). Therefore, there has been a growing interest in substituting organic electrolytes with aqueous alternatives. The primary strategy involves elevating the operational voltage, which is constrained by the water decomposition potential. Research [34,35,36] has demonstrated that when using neutral electrolytes like Na2SO4 and Li2SO4, a symmetrical supercapacitor built with activated carbon and Na2SO4 as the electrolyte exhibits a robust stability voltage of 1.6 V, along with intriguing characteristics. In [37], it is reported that a symmetrical supercapacitor based on activated carbon using an aqueous solution of Li2SO4 as an electrolyte is distinguished by a substantial cell voltage of 1.9 V and commendable capacity retention even after 10,000 cycles. The elevated cell voltages are linked to a considerable overpotential at the negative electrode for the electrochemical reaction of hydrogen production and high solvation energy of dissolved ions. On the other hand [38], in asymmetric supercapacitors with an electrolyte of 1 M Na2SO4 and anodes based on Fe2O3 and MnO2 nanoparticles fixed on carbon nanotubes (FeO-CNT), the values of the anode capacity of 483.4 mF cm−2 at 1 mA cm−2 and the maximum voltage of 2.0 V were achieved. Therefore, it is important to develop technology for the synthesis of nanoporous carbon materials with high superpotential values for oxygen and hydrogen release reactions in order to expand the cell voltage. Under the conditions of high environmental safety requirements, it is necessary to abandon the use of harmful substances as feedstocks for carbonisation and precursors for their modification.
The objective of this study is to acquire a nitrogen-containing, environmentally friendly, nanoporous carbon material by means of direct pyrolysis without further activation, in order to analyse its structure, composition, porosity, and specific capacitive characteristics, as well as to assess the possibility of the obtained material operating in an extended operating voltage range with an aqueous solution of Na2SO4 as an electrolyte.

2. Conceptual Provisions and Experimental Methodology

2.1. Sample Preparation

Direct pyrolysis was employed to create a nitrogen-containing nanoporous carbon material (NCNM). The method described in [31] was used as a basis. The carbon source utilised was glucose, sodium bicarbonate served as the activator (porogen), and urea was introduced as a nitrogen source for carbon doping (alloying). These precursors were dissolved in water in equal mass ratios to form a clear solution. The resulting solution was then subjected to drying in an air atmosphere at 100 °C until a constant weight was achieved. The resulting product was subjected to pyrolysis in a tubular reactor at a suitable temperature for 2 h under an argon atmosphere. Pyrolysis was carried out at temperatures of 600 °C, 700 °C, and 800 °C. We considered it inappropriate to increase the carbonisation temperature above 800 °C, as graphitisation of carbon begins at such temperatures [39]. The process is accompanied by a decrease in the specific surface area due to a decrease in the micropore content, which would negatively affect the specific capacitive characteristics of SCs. The heating rate was 5 °C/min. The synthesised carbon material was washed in distilled water at room temperature to remove residual inorganic salts, then washed with ethanol and dried at 80 °C.

2.2. Research Methods

The macroscopic features of the particles of the carbon material synthesised in this work were studied using a Phenom ProX scanning electron microscope (ThermoFisher Scientific, Waltham, MA, USA). The elemental composition of the studied coal was determined with the help of an additional EDS energy dispersive microanalysis module of this microscope.
The study of adsorption/desorption of gases by porous bodies is often used to estimate the parameters of the porous structure within certain models, such as specific surface area, total pore volume, pore size distribution, average pore radius, etc. In our studies, the automated analyser NOVAtouch LX2 (Anton Paar QuantaTec, Boynton Beach, FL, USA) was used for such an assessment, which allowed us to determine the porous structure of the synthesised carbon material using nitrogen adsorption/desorption isotherms at a temperature of T = 77 K. The samples were preliminarily degassed in a vacuum at a temperature of 473 K. The duration of degassing was 16 h.
The X-ray diffraction method was used for the raw materials and for the carbonaceous material synthesised from them (NCNM). Diffractograms were obtained using an automated X-ray diffractometer DRON-3. Monochromatic CuKα- radiation with a wavelength of λ = 0.15418 nm was used to irradiate the samples, and X-ray diffractograms were measured in a continuous scanning mode with an angular velocity of 2 degrees/min in the range of diffraction angles 2θ = 5–120°. The methodology for the study of powder samples is described in detail in the monograph [40].
Taking into account the complex structure of the synthesised NCNM carbon material, information about its structure from the X-ray diffraction analysis is insufficient. Therefore, an additional source of data is the small-angle X-ray scattering (SAXS) technique. Such scattering is caused by the formation of inhomogeneities in the electron density distribution in a substance, so it is one of the most effective methods for studying the atomic structure of a substance in the size range from 1 to 100 nm. An important advantage of the method is the ability to study completely disordered objects, which also include amorphous carbon materials. The SAXS spectra were measured on a DRON-3 automatic diffractometer with monochromatized CuKα radiation. Primary and scattered beam collimators were used to limit the parasitic scattering of the monocrystal monochromator and entrance slits, and to reduce the intensity of background scattering in air. During the study, the NCNM powder samples were placed in a 1.5 mm high cuvette with the inlet and outlet holes covered with a 50 μm thick polyethylene film. Correction for background scattering and collimation correction for the height of the detector receiving slit were carried out on the SAXS intensity curves before their analysis.
The magnetic characteristics (saturation magnetisation, coercive force, etc.) of the material under study were calculated from the measured hysteresis loops. To obtain them, a vibration magnetometer was used [41], and measurements were performed at room temperature. The magnetometer was calibrated by comparison, using pure non-porous nickel with a density of ρ = 8.9 g cm−3 as a standard. The content of the magnetic phase in the obtained material was calculated based on the data of the saturation specific magnetisation measurement. During measurements in magnetic fields with insufficient strength, the measured magnetisation value is an ambiguous function of the amount of ferromagnetic phase in the sample. It also depends on the structure of the phase, its dispersion, stresses within it, etc. Therefore, quantitative measurements of saturation magnetisation for phase analysis should be performed in strong fields sufficient for complete saturation. For the carbon materials under study, the saturation specific magnetisation was measured in a magnetic field of 800 kA/m.
Electrochemical measurements were performed using a two-electrode scheme to investigate the behaviour of the synthesised carbon materials in a real supercapacitor. For this purpose, the materials under study with a binding agent (5% polyvinylidene fluoride) were pressed onto a 0.5 cm2 nickel mesh. The weight of the active material did not exceed 3 mg. A 30% aqueous solution of KOH and a 1 M aqueous solution of Na2SO4 were used as electrolytes.
The impedance measurements of the experimental electrochemical cells of supercapacitors were carried out in the frequency range of 10−2 ÷ 106 Hz using the measuring complex AUTOLAB PGSTAT-100 (Metrohm AG, Herisau, Switzerland), equipped with computer programs FRA-2 and GPES. The amplitude of the measuring signal was 5×10⁻³ V.

3. Results and Discussion

3.1. Galvanostatic Studies

In order for activated carbon to be used as an active material for supercapacitor electrodes, it must have good electrical conductivity and high specific capacitance. The specific capacitance was determined by galvanostatic charging and discharging of a laboratory supercapacitor cell (Figure 1a,b) using the following formula:
C = 2 I · t U · m
where I represents the current, t stands for the discharge time, U denotes the voltage drop during discharge, and m indicates the mass of the supercapacitor electrode.
The results of the calculation of the specific capacitance for each synthesised carbon are shown in Table 1. Each number in the table is an average value calculated from the study of three supercapacitors.
As can be seen from Table 1, NCNMs synthesised at 800 °C had the highest specific capacity. Therefore, all further studies were carried out for this carbon.
SCs made from NCNMs have high coulombic efficiency at a given charge/discharge current density (97% for the 30% KOH electrolyte and 94% for the 1 M Na2SO4 electrolyte). This means that the charge accumulation is mainly due to non-Faraday processes. Despite the lower capacity of NCNMs in 1 M Na2SO4 electrolyte, this electrochemical system accumulates 2.2 times more energy due to an increase in the charging limit voltage to 1.8 V.

3.2. SEM Microphotography and Surface Elemental Analysis

The behaviour of the synthesised carbons in different electrolytes can be explained by referencing the outcomes of structural and porous structure studies.
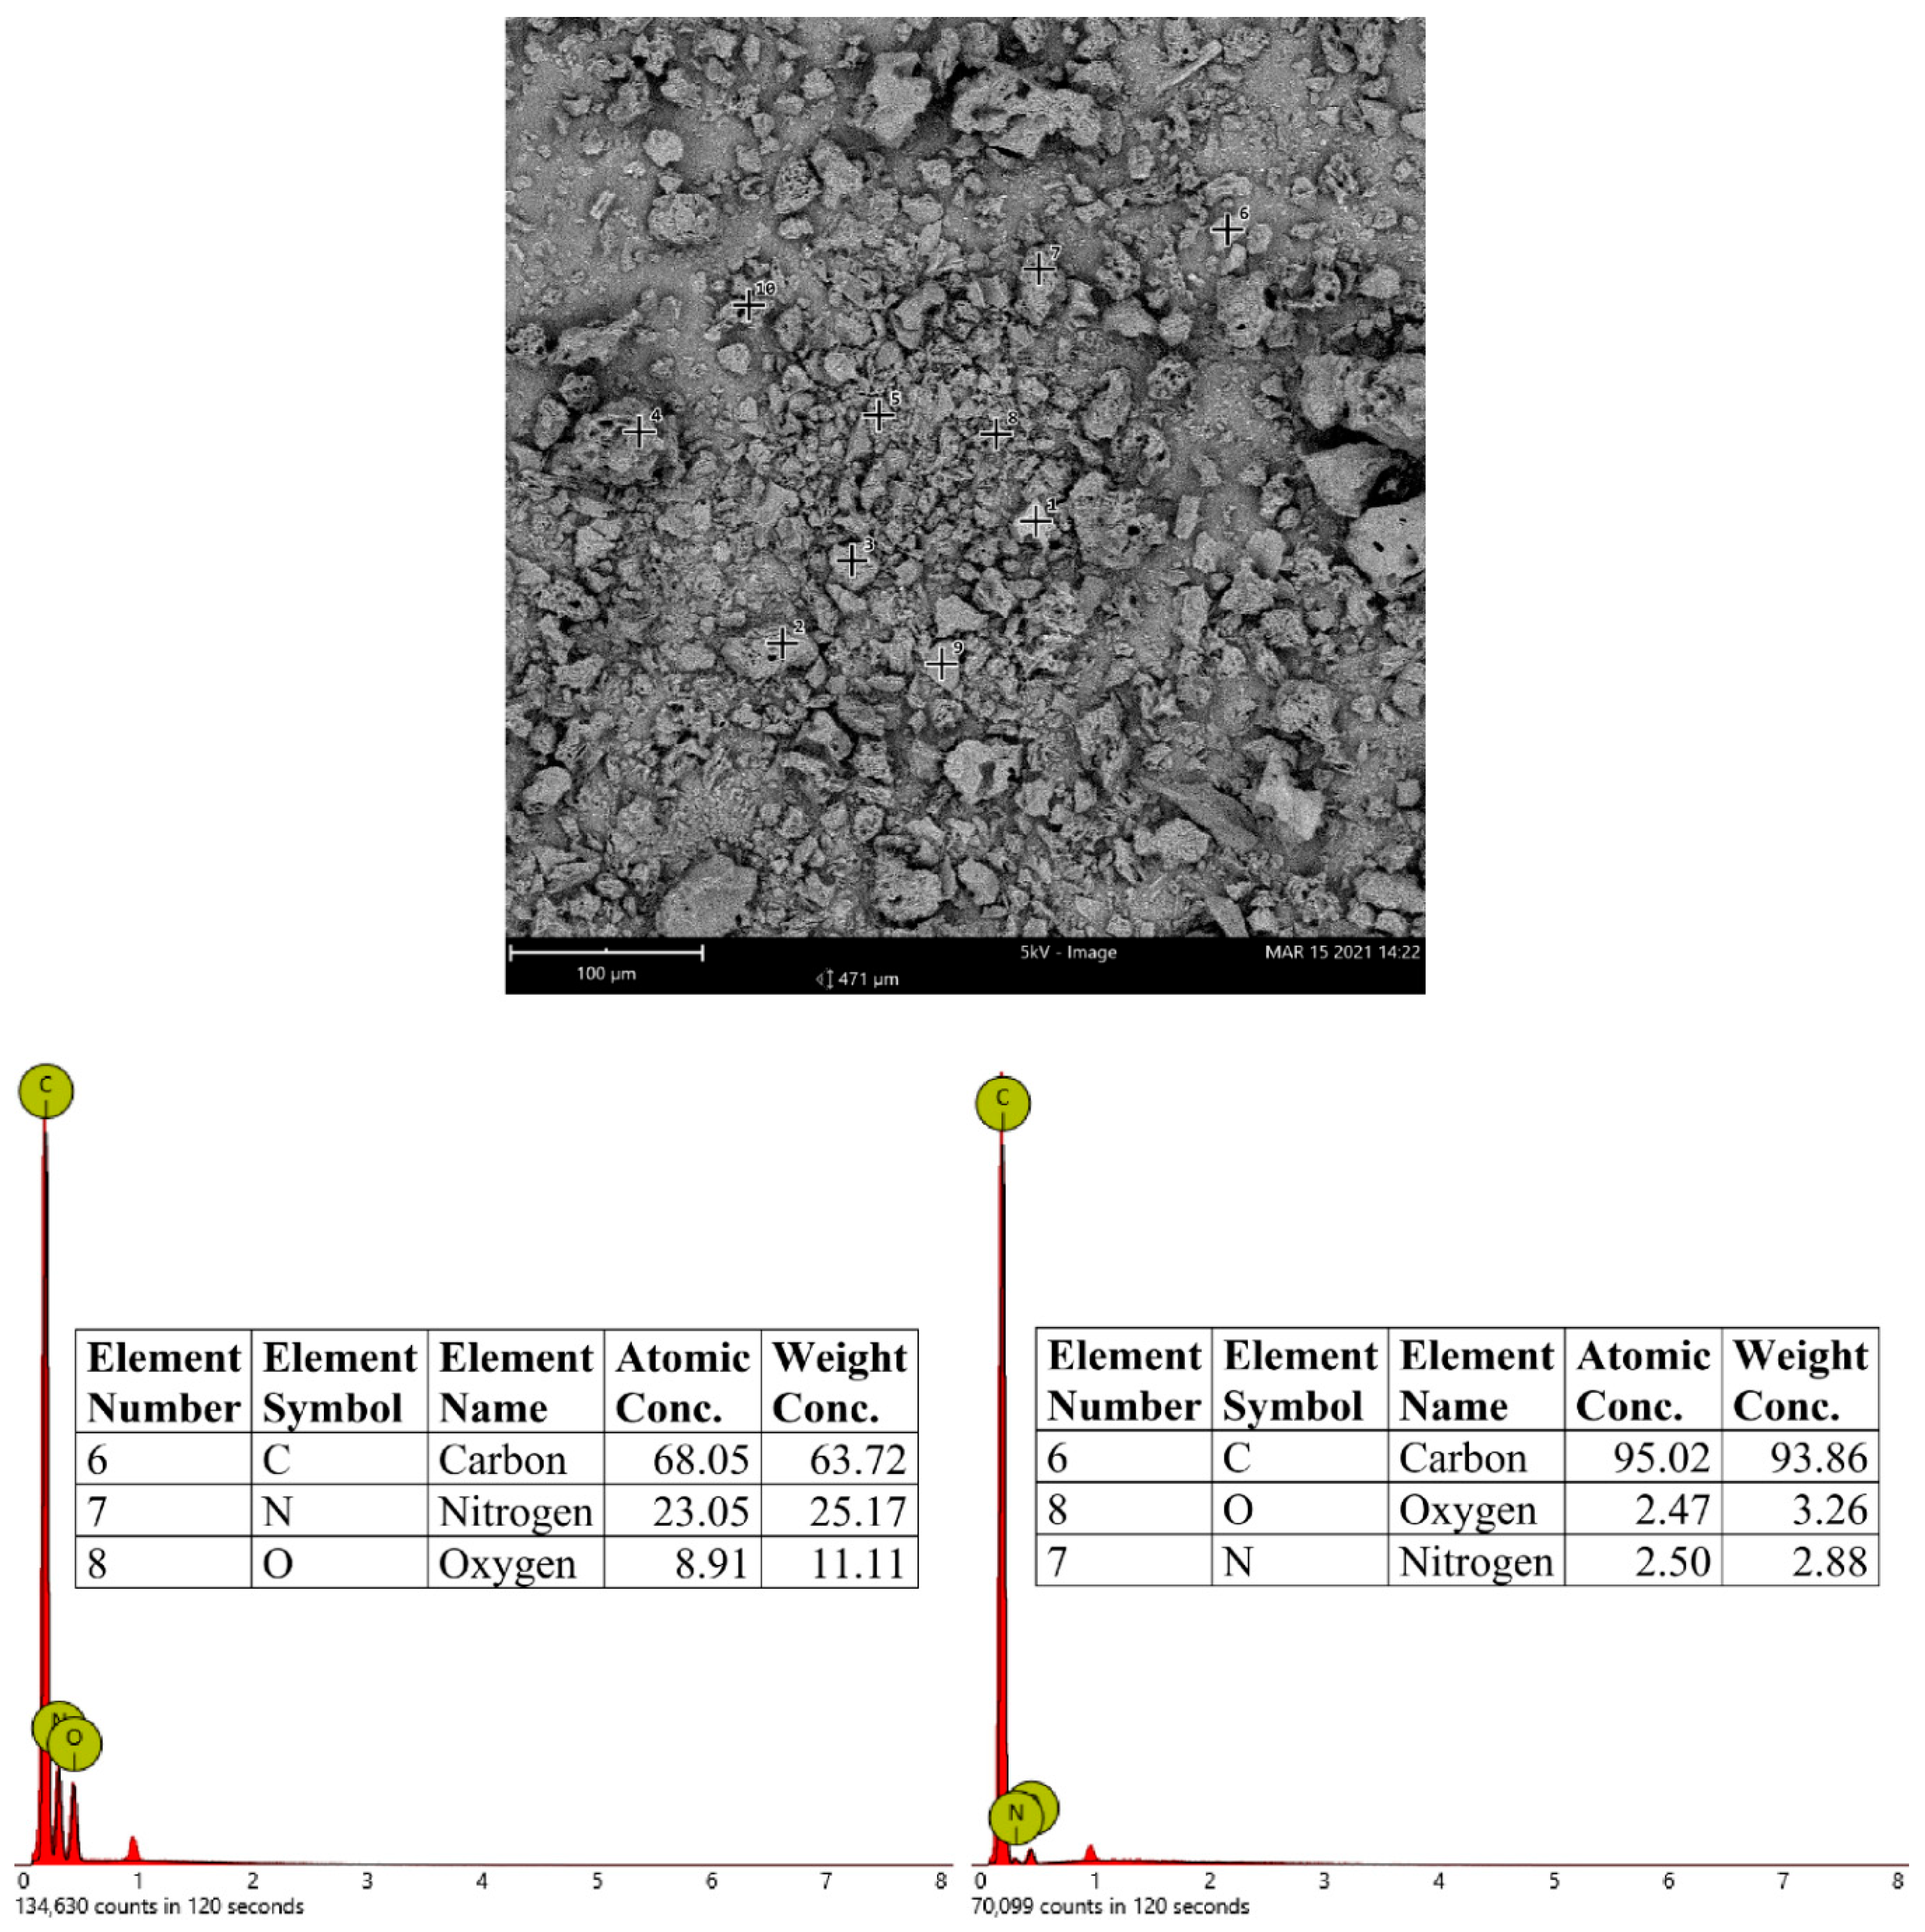
The structure of the synthesised NCNM, as is evident from the SEM images (Figure 2a,b), is homogeneous, and no inclusions of other phases are visible in the images. Large macropores cannot be observed, which may indicate the presence of mainly meso-, micro-, and nanoporous structures. The porous structure is spongy; the pores are cavities and channels in a continuous solid matrix (Figure 2c). The pores were apparently formed during the synthesis process as a result of the decomposition of sodium bicarbonate to form carbon dioxide and water. The closed pore configuration commonly found in traditional activated carbons significantly restricts the accessibility of pores to electrolyte ions. Carbon materials characterised by open pores are preferred for application in supercapacitors. In Figure 2d, one can see the gaps in the material that connect the pores to each other. The determination of the elemental composition of the synthesised NCNM showed the presence of three elements—C, N, and O (Figure 3). The contents of nitrogen and oxygen varied in different parts of the sample surface. Out of 10 measurements at different points, the lowest value of 2.88% wt. and the highest value of 25.17% wt. were obtained for the nitrogen content, and 3.26% wt. and 11.11% wt. for oxygen, respectively.

3.3. Nitrogen Adsorption/Desorption Porometry

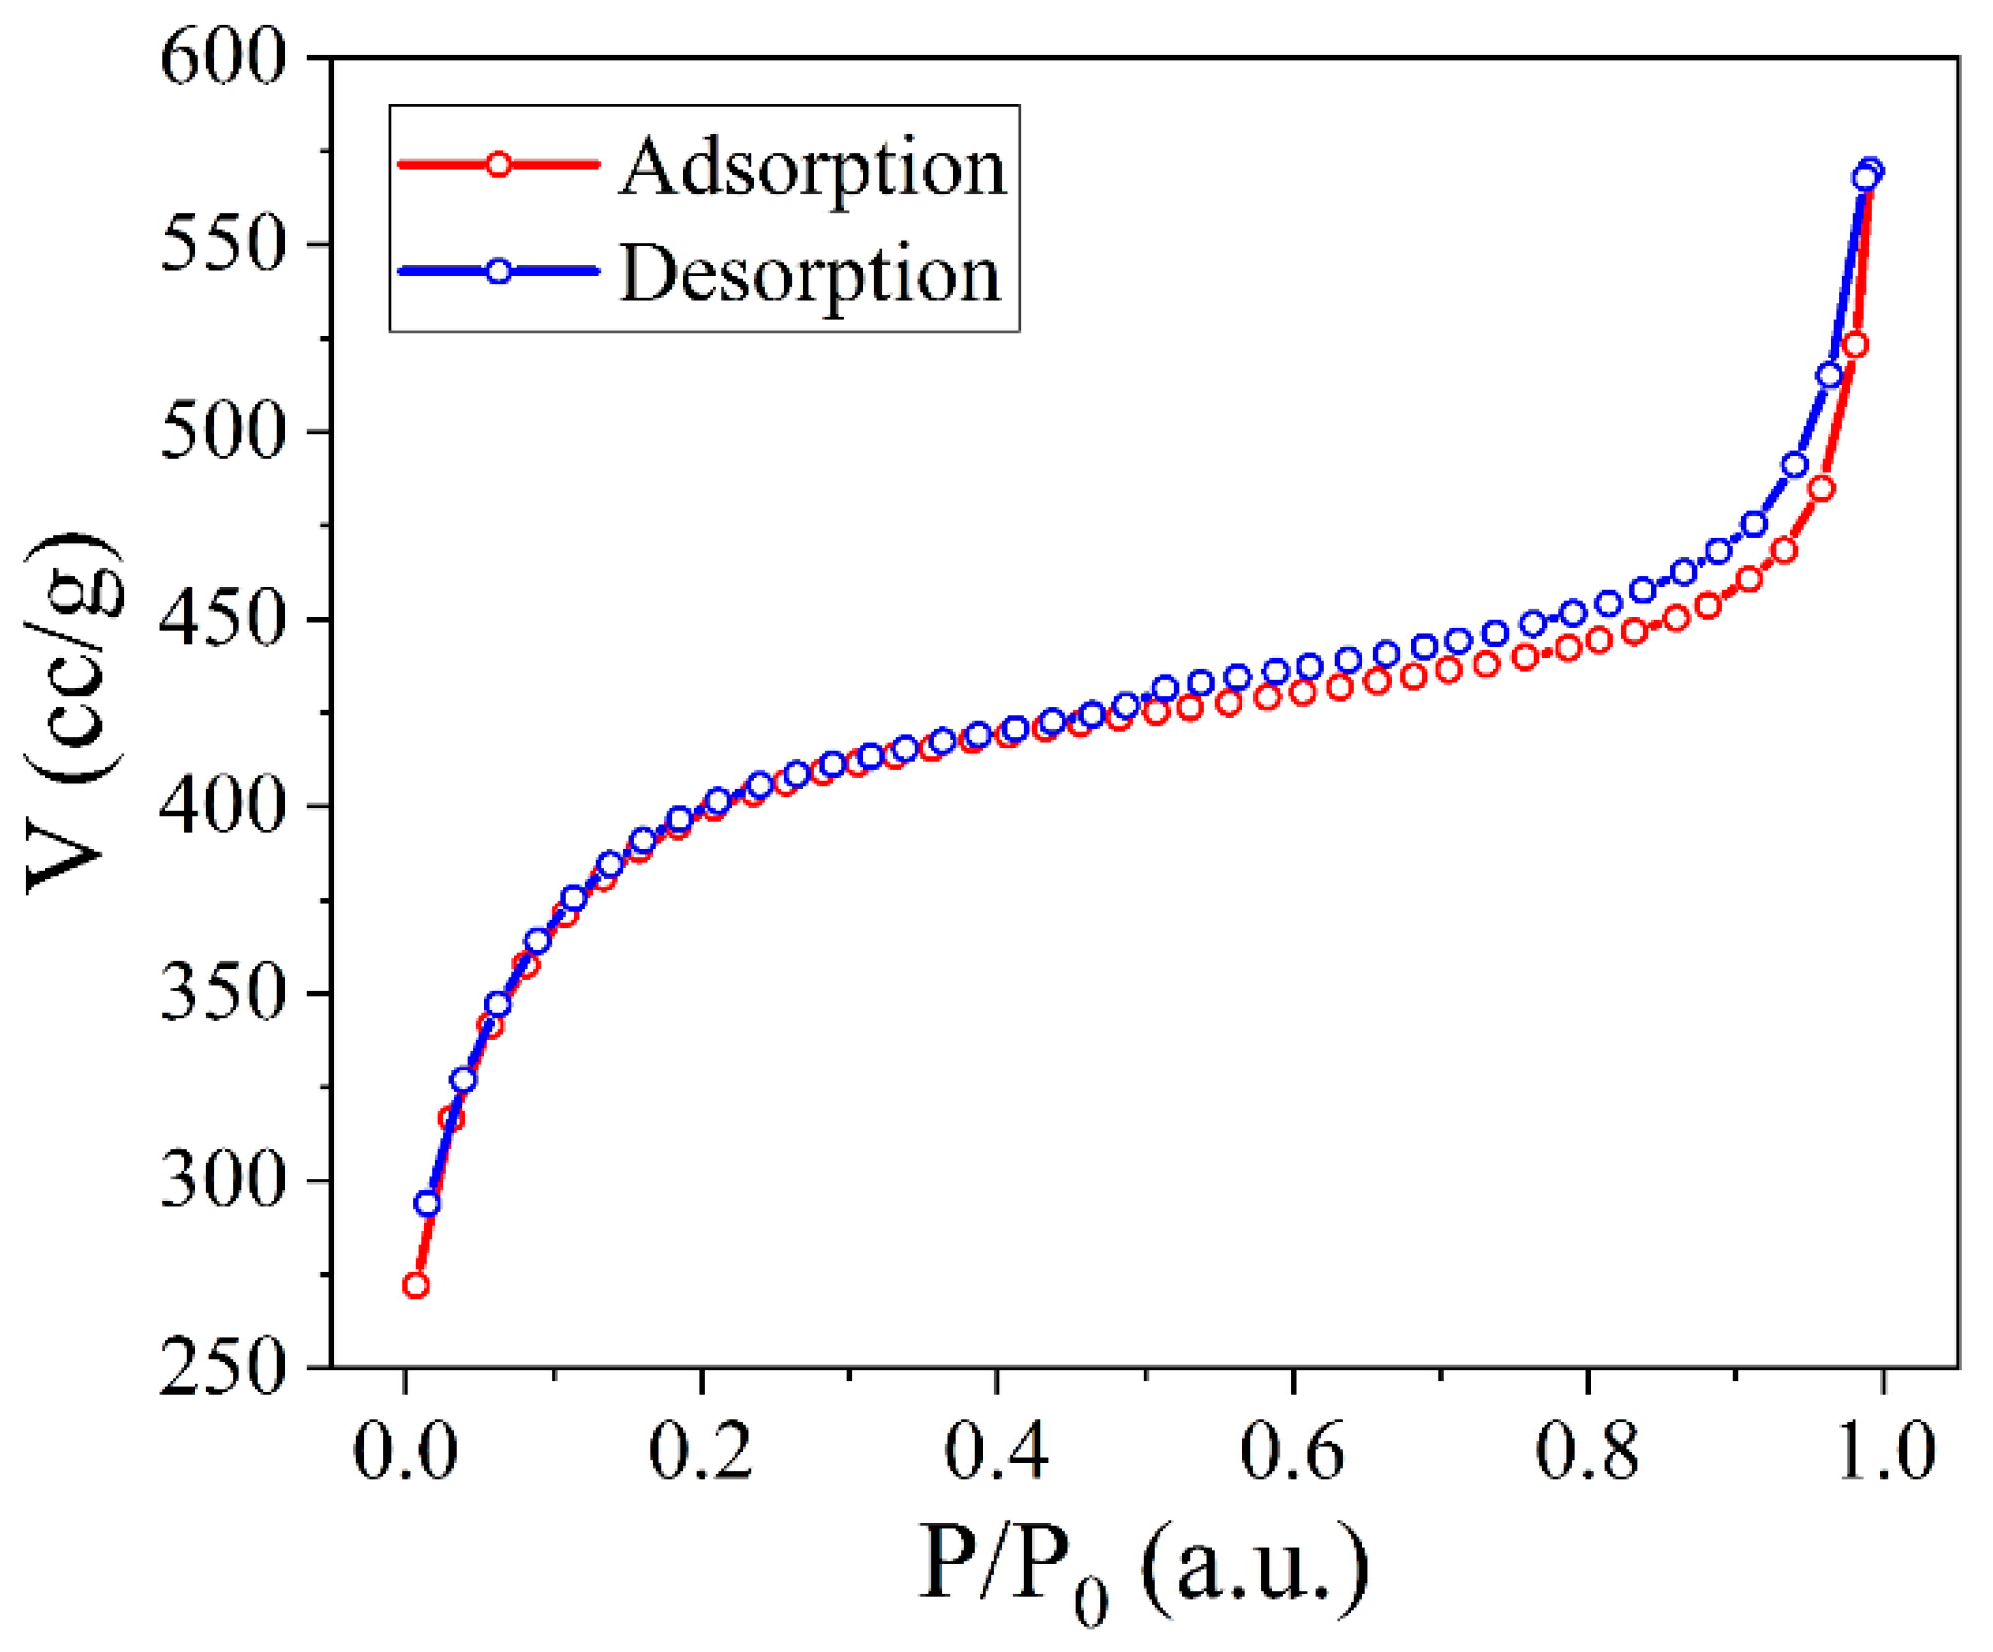
The shape of the adsorption isotherm (Figure 4) can be described in a certain approximation as a type I isotherm with elements of a type II isotherm [42]. Type I isotherms are characteristic of porous solids in which micropores predominate and the volume of other pores is much smaller. Type II isotherms are characteristic of macroporous solids. The presence of a hysteresis loop on the isotherms indicates additional vapour absorption as a result of capillary condensation of the adsorbed gas, as well as irreversible retention of adsorbate molecules in pores nearly matching the size of nitrogen molecules. However, in our case, the hysteresis is quite insignificant, indicating the commendable reversibility of the adsorption/desorption process within the porous structure of the examined activated carbon sample.
According to the form of hysteresis, it can be described as H4 hysteresis [42]. H4-type hysteresis loops are characteristic of aggregated zeolite crystals, mesoporous zeolites, and micro-mesoporous carbon. Electron microscopic studies of activated carbon with an H4-type hysteresis loop in the isotherm [43] typically reveal a porous structure characterised by slit-shaped pores.
To determine the parameters of the synthesised NCNM, the acquired isotherm underwent analysis using the Quantachrome TouchWin version 1.22 software. According to the shape of the isotherm and the hysteresis loop, the synthesised carbon had a micro-mesoporous structure. To ascertain the specific surface area, the multipoint BET method [43] was employed, which fit the experimental data with a linear approximation in the range of relative pressures P/P0 = 0.05 ÷ 0.35. Since, for microporous solids, the BET method can yield a large error in the calculation of the specific surface area, the BET Assistant subprogramme was used for correct calculations. This subprogramme allows calculations to be performed exclusively within the linearity range of the BET equation, which gives the most correct results. Table 2 displays the outcomes of the specific area calculation. The application of the BET model to simulate the adsorption curve revealed a relatively strong correlation coefficient between the model and the experimental data, as indicated in Table 2. Additionally, Table 2 presents the values for the specific pore volume and the average pore size.
Based on the isotherm’s configuration in Figure 4, it can be inferred that the synthesised sample primarily consisted of micropores and mesopores with small radii. For mesoporous materials, the Barret–Joyner–Halenda (BJH) method, relying on the Kelvin equation, can be employed to ascertain the pore size distribution [44]:
l n P P 0 = 2 γ V L R T r m
where γ represents the surface tension of nitrogen at its boiling point, VL is the molar volume of liquid nitrogen, R denotes the universal gas constant, and rm signifies the pore radius.
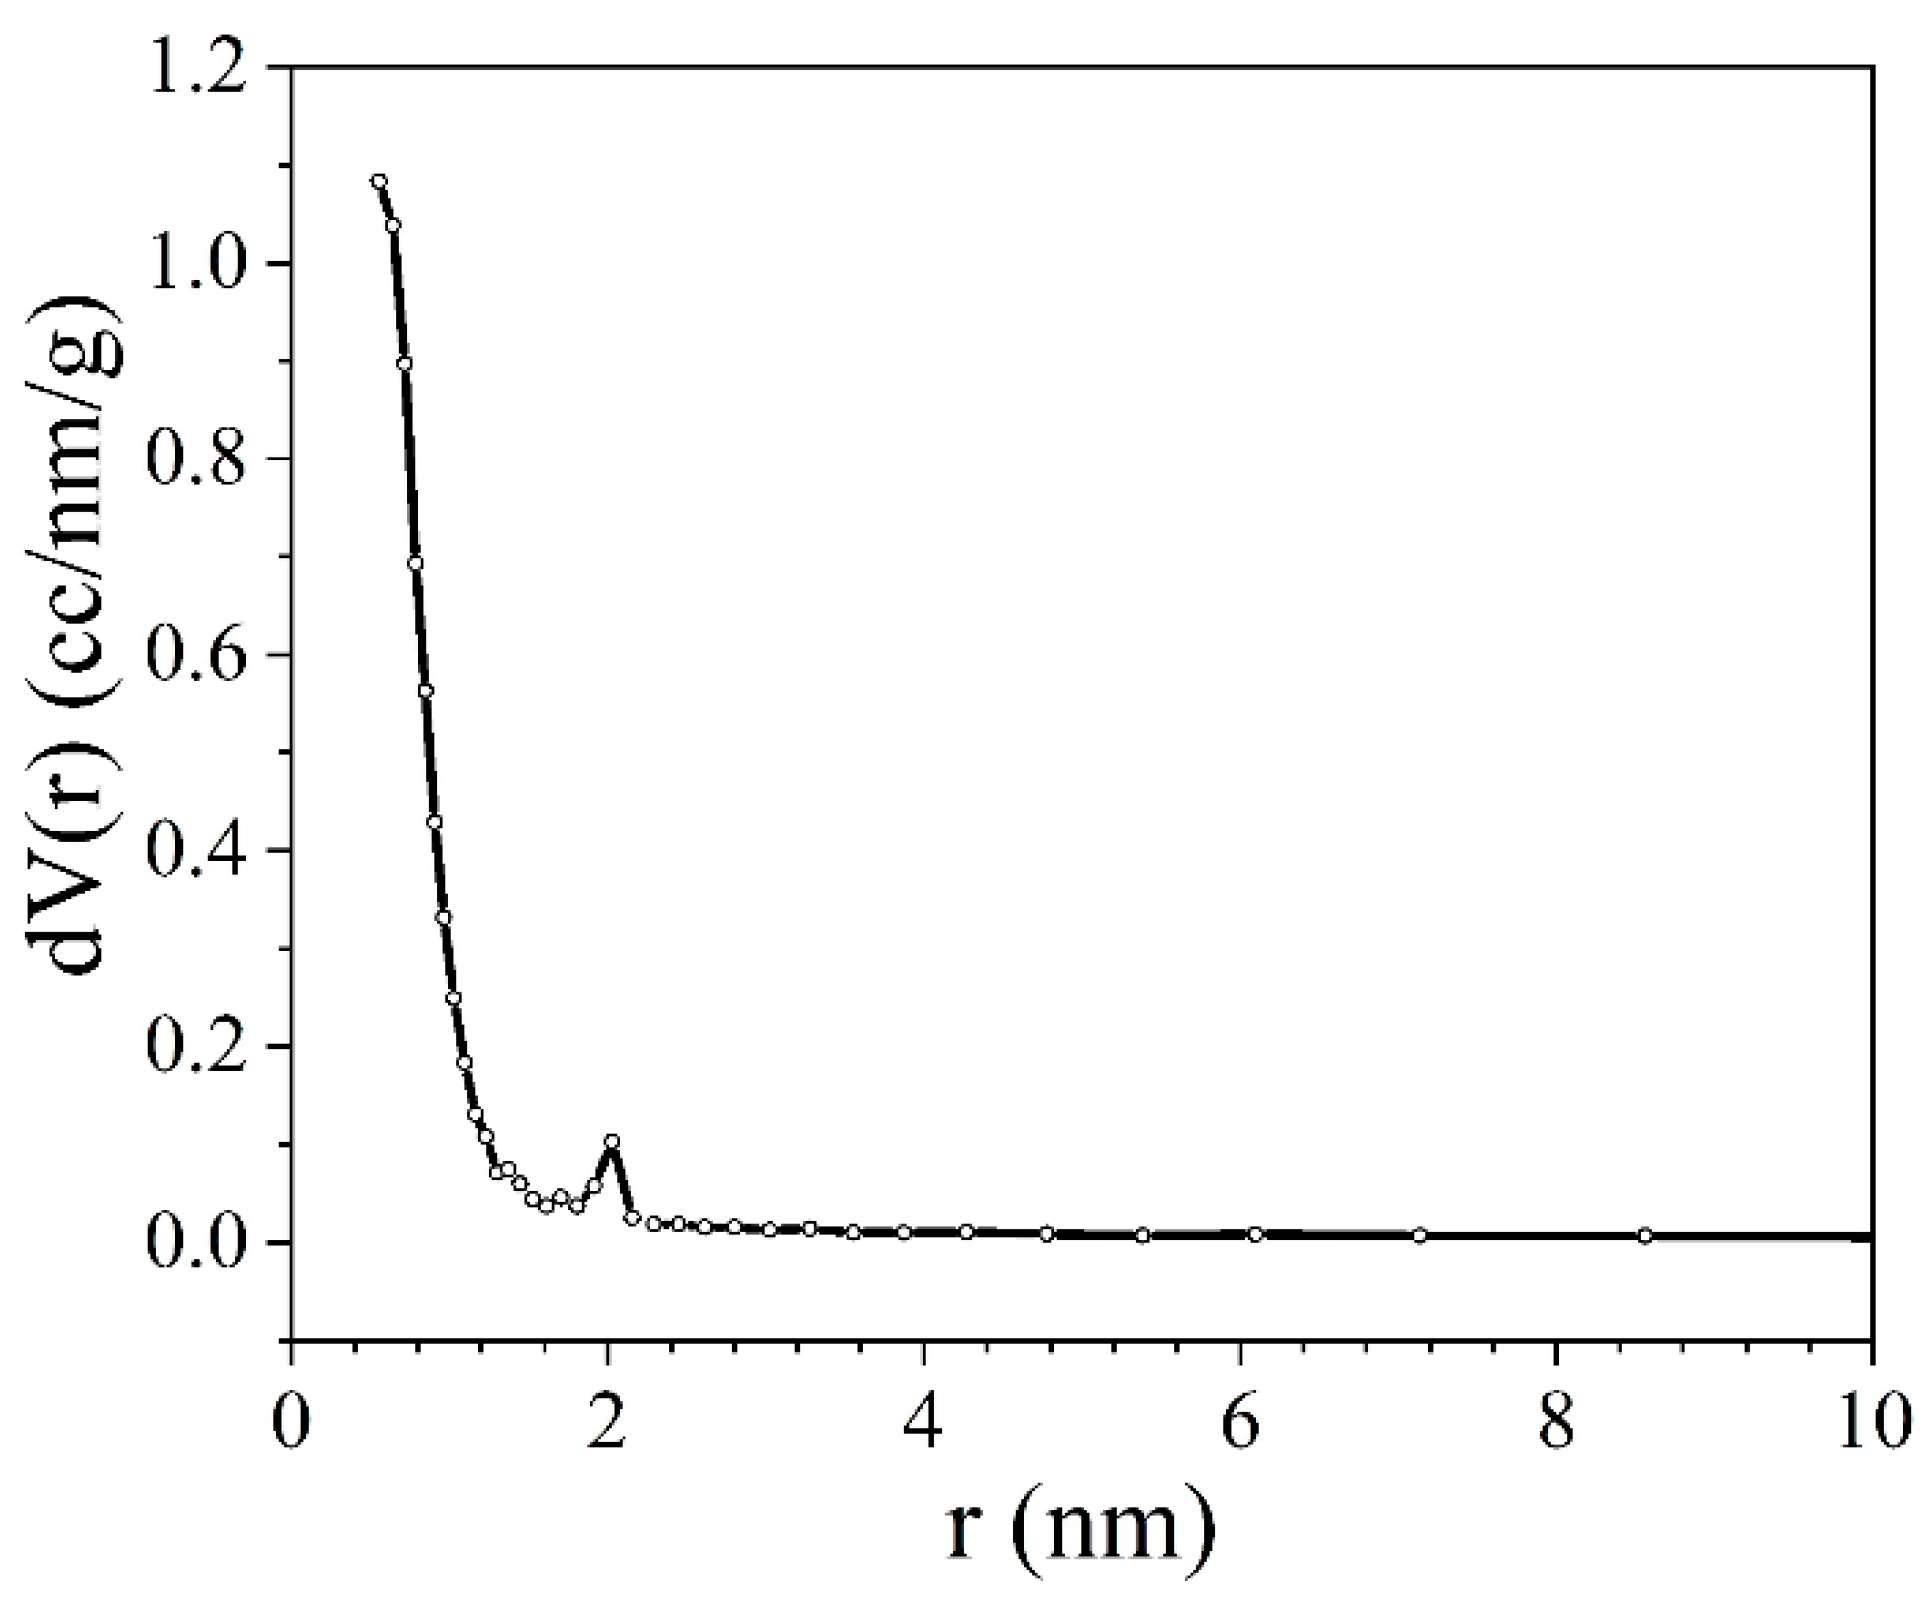
The pore distribution was determined using this method by analysing the desorption isotherm, which was closer to the genuine thermodynamic equilibrium (Figure 5).
Figure 5 shows that mesopores with sizes of 2 nm made a minor contribution to the porous structure of the sample, but the micropore content was more important. This made it possible to use the density functional theory (DFT) method for modelling. DFT relies on quantum mechanical calculations utilising fundamental molecular parameters that characterise gas–gas and gas–solid interactions within an adsorption system. The calculation results are depicted in Figure 6. Based on Figure 6, it can be deduced that the porous structure was predominantly microporous, with the pore distribution exhibiting multiple maxima for micropores measuring approximately 1 nm or less in size.
Thus, the substantial quantity of micropores explains the rather high specific capacity of the synthesised NCNM. Micropores play a crucial role in charge accumulation and ion adsorption. Additionally, the existence of mesopores proves beneficial for facilitating the transport of ions from the electrolyte volume to the electrode/electrolyte interface.

3.4. X-ray Diffraction Analysis

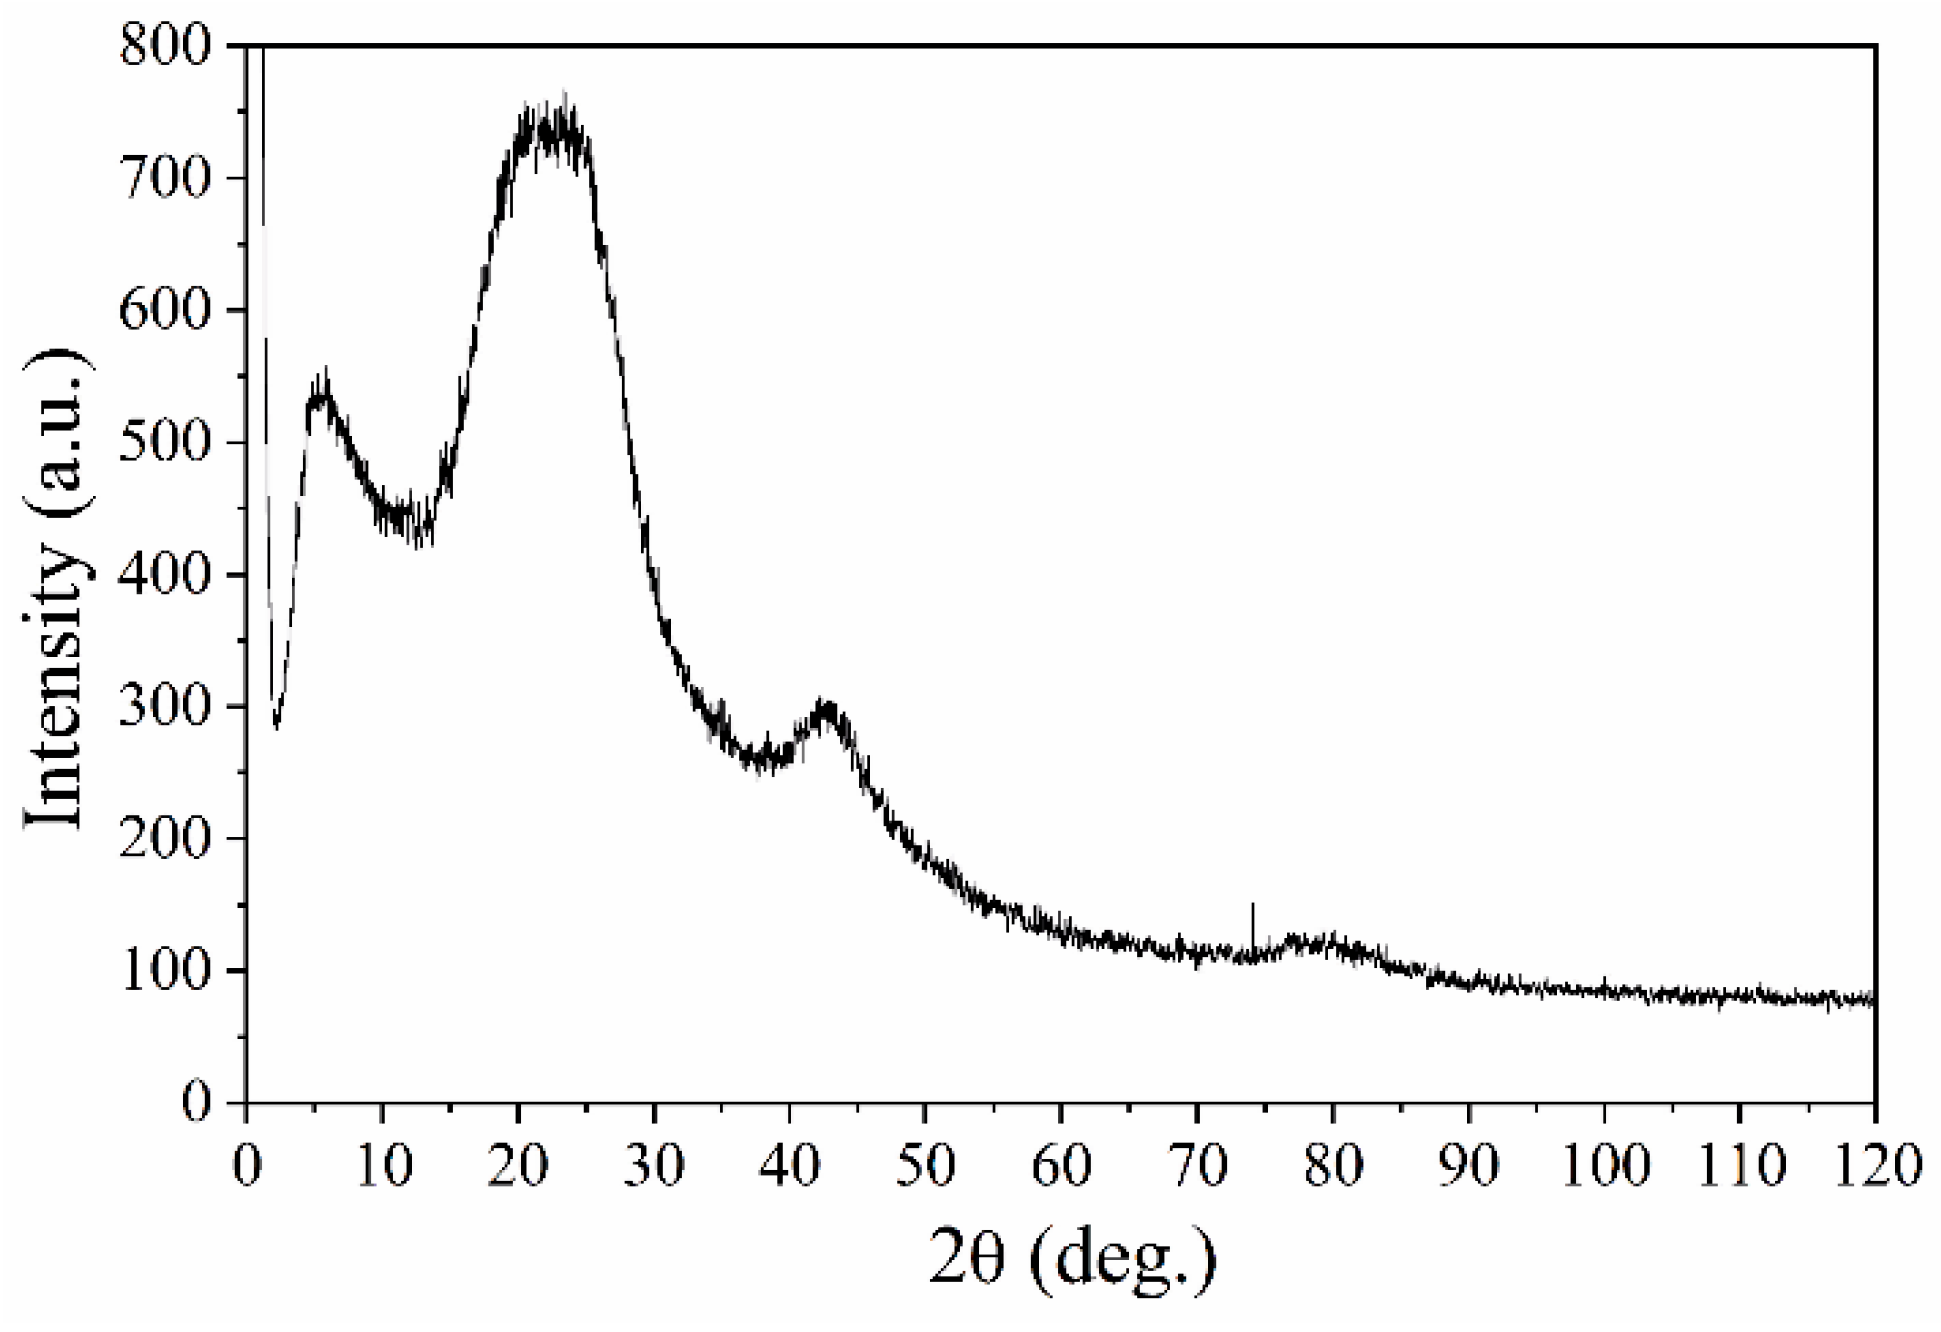
The X-ray diffractogram of the NCNM sample (Figure 7) has features that are located in the region of small diffraction angles (2θ ≈ 1–15°). The diffractogram shows a maximum with an angular position of 2θ ≈ 5.5°. It corresponds to an interplanar distance of d ≈ 1.6 nm, which is significantly higher than the interlayer distance in polycrystalline graphite (d = 0.335 nm).
Across a broad angular spectrum, the primary peak of the NCNM sample is localised near the diffraction angles of 2θ ≈ 22.5°, which corresponds to an interplanar distance d ≈ 0.395 nm. This position is displaced to the left in comparison to the diffraction peak of graphite (2θ ≈ 26.5°, d = 0.335 nm). It can be assumed that the appearance of this maximum is due to scattering from three-dimensional graphite-like clusters formed from parallel graphene layers. Note that the value d ≈ 0.395 nm corresponds to the characteristic distances between graphene layers. Along with the main maximum, the diffractogram shows blurred diffuse maxima localised at 2θ ≈ 42.5° and 2θ ≈ 78.5°, which are likely to be caused by scattering from individual isolated graphene layers.

3.5. Small-Angle X-ray Scattering

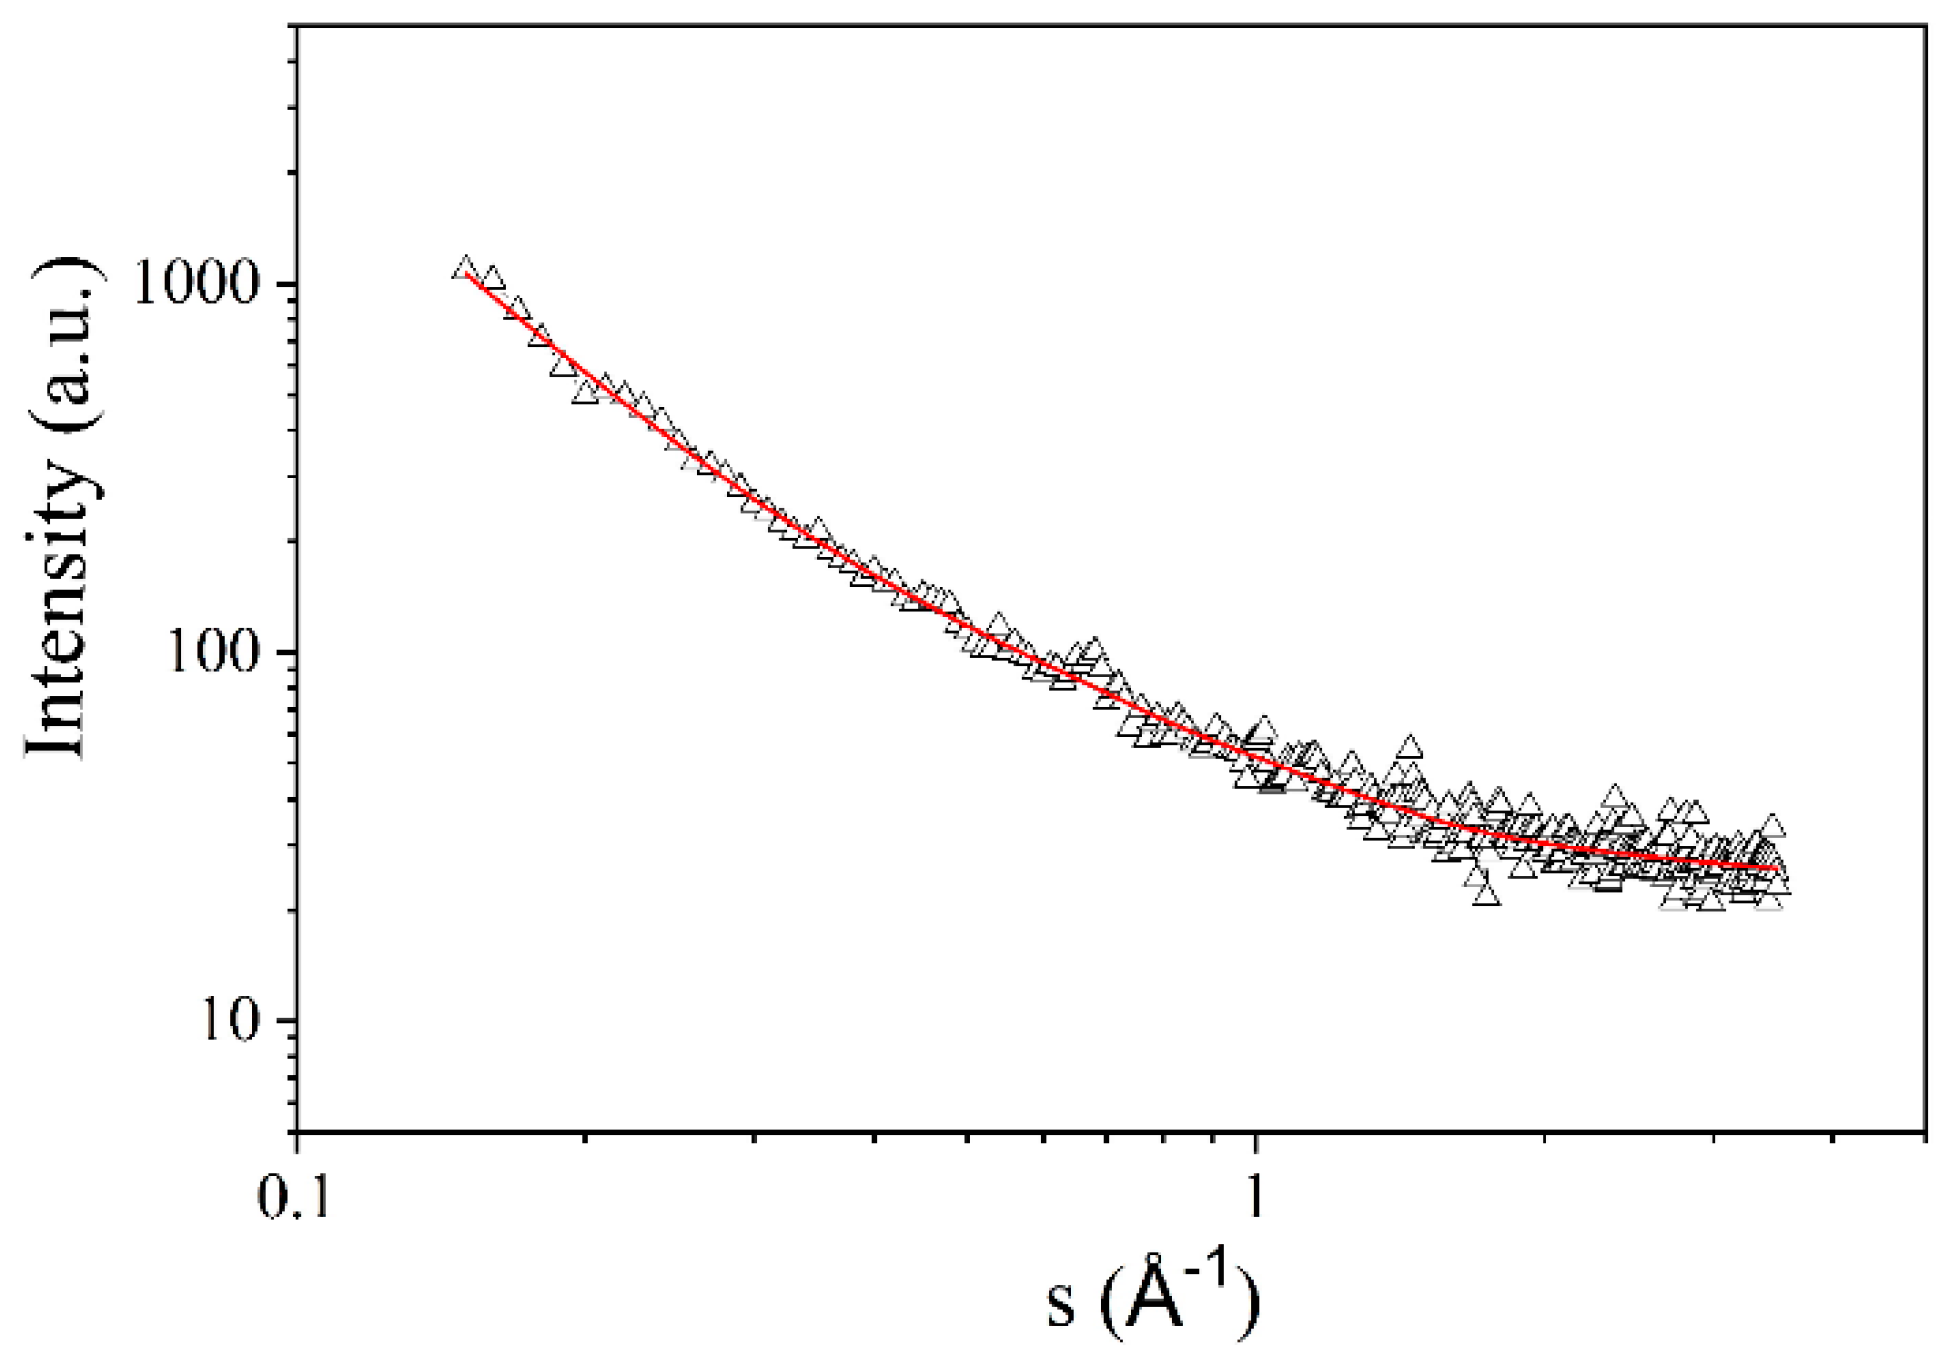
The porous structure of NCNM was also studied using the SAXS technique. In contrast to the isothermal nitrogen adsorption/desorption method, this method allows us to detect not only open pores, but also closed pores. Figure 8 shows the scattering intensity curve I(s) of X-rays by the examined sample, subsequent to applying a collimation correction for the height of the detector receiving slit—specifically, the transition from the slit to point collimation.
The resulting spectrum takes the form of a curve that consistently diminishes across the entire range of studied scattering angles. This pattern signifies a random distribution of scattering irregularities (pores) and, consequently, the absence of correlation in their spatial arrangement. To compute the distribution functions of pore inertia radii, a method was employed that involves representing the scattering intensity curve as a composite of several curves. Each of these curves was characterised using the Guinier formula [45]:
I s = k I k 0 e 1 3 s 2 R g k 2 .
Here, I k ( 0 ) represents the square of the total scattering length, R g k denotes the electronic radius of inertia of the k-th pore fraction, s = 4 π λ · s i n ( θ ) stands for the modulus of the scattering wave vector, and λ = 1.5418 Å is the radiation wavelength.
To construct dependence (3), we used the method of tangents, which is based on the following provisions:
1.
A tangent is drawn to the scattering curve constructed in Guinier coordinates [ s 2 , l n I ( s ) ] at the point of intersection with the ordinate axis;
2.
The slope of the tangent determines the radius of inertia of the smallest particles Rg1, and the point of intersection of the tangent with the ordinate axis gives the value I1(0);
3.
The contribution to the scattering intensity of the smallest particles is computed using the Guinier formula:
I 1 s = I 1 0 · e x p 1 3 s 2 · R g 1 2 ;
4.
The difference scattering curve I 2 ( s ) = I ( s ) I 1 ( s ) is calculated, and by performing similar calculations for this curve I2(s), the scattering invariants for the particles of the second fraction I2(0), Rg2 are determined;
5.
Applying the above method iteratively, the scattering invariants for particles of all fractions are determined until the scattering intensity curve calculated using formula (3) coincides with the experimental curve.
We can determine the volume fraction of pores with a specific radius of inertia using the formula
m k = I k 0 R g k 3 k I k 0 R g k 3 ,
considering that the contribution to the scattering volume from particles of the k-th fraction is proportional to I k ( 0 ) R g k 3 .
If the particle distribution is characterised by a Gaussian function with the assumption that the variance of the distribution is Δ R g k R g k , the particle distribution function can be expressed as follows:
F R g = 2 R g k k m k R g k exp R g R g k 2 R g k 2 .
By employing the formula ( R g s ) 3 = k = 1 N m k R g k 3 , where N is the number of pore fractions, we determined the average pore radius. For the assessment of the specific pore surface area, we computed integral characteristics of the scattering intensity curves, namely, the integral Porod invariant (Qp) and Porod constant (Kp). These values are directly proportional to the volume and surface area of the pores, respectively [46]:
σ = 16 ε 2 r 2 N π h a 0 e 2 r / a 0 e E a / k T .
Here, N is the number of trapping centres, r is the distance between them, ε is the material dielectric constant, a0 is the radius of wave-function localization, Ea is the activation energy, k is the Boltzmann constant, ћ is the Plank constant, and T is the temperature. Neglecting long-range interactions, the wave function for a system of two δ-wells separated by a distance r takes the form
Q p = 0 s m a x s 2 I s d s + K p s m a x ,
K p s m i n s m a x s 4 I s d s s m a x     s m i n .
Here, s m i n , s m a x represent the minimum and maximum values of the wave vector.
The formula
S p = π K p Q p
was used to calculate the specific surface area Sp.
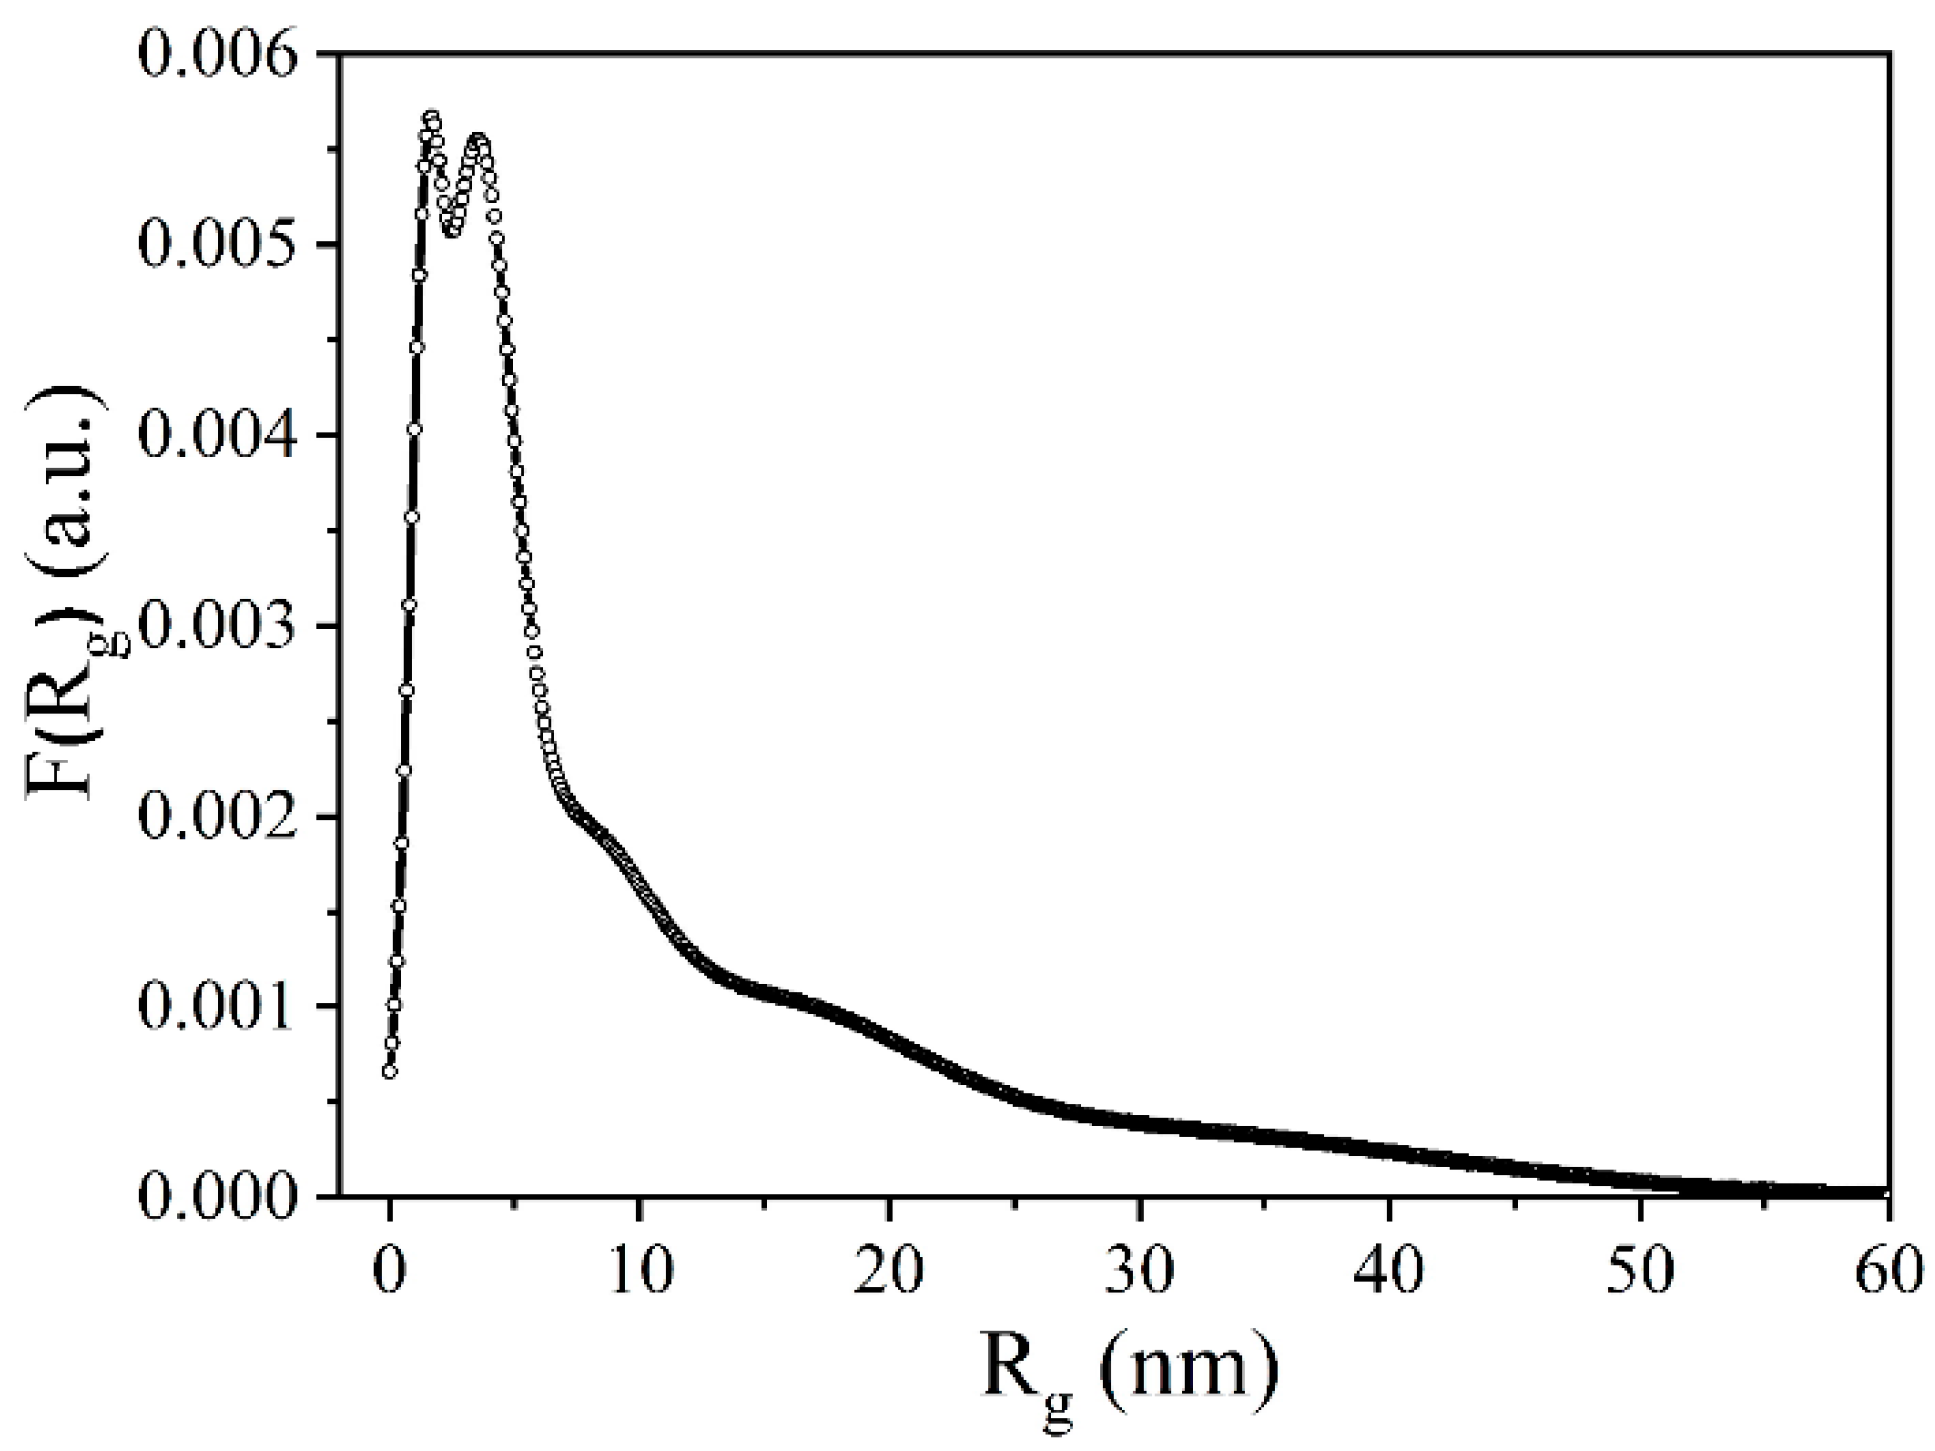
Figure 9 shows a graph of pore distribution by radius of inertia. From this figure, it is evident that the primary contribution to the pore volume came from micropores with a maximum radius of 1.4 nm and mesopores with a maximum radius of 3.4 nm. Additionally, larger inhomogeneities with effective radii of inertia up to 50 nm were present in the sample.
The calculated values of the integral scattering invariants (the Porod invariant Qp and the Porod constant Kp), which were used to determine the specific pore surface area, are given in Table 3. Also in Table 3, we have the average value of the pore radius of inertia Rgs and the specific surface area Sp, calculated per unit volume of the sample. If we take into account that the density of activated carbon is approximately 1.9 g/cm3, the calculated specific surface area is 1125 m2/g. This value is slightly lower than the value of 1247 m2/g obtained using the nitrogen adsorption/desorption method (Table 2). This difference may be due to the fact that the SAXS method uses a circular heterogeneity model for calculation, while the adsorption/desorption isotherms show a predominant content of slit-like pores. On the other hand, the average radius of inertia is almost twice as large as that calculated from the nitrogen adsorption/desorption isotherms. This observation suggests that the open micropores in the synthesised carbon are mainly micropores, with a limited number of mesopores remaining closed and inaccessible to nitrogen molecules.

3.6. Magnetometry

While working with the synthesised NCNM, it was accidentally noticed that it exhibited magnetic properties. The question arose as to what caused this. In the course of studying the magnetic properties of the synthesised NCNM, it was observed to exhibit ferromagnetic characteristics with a distinctive hysteresis in specific magnetisation (Figure 10). The saturation specific magnetisation of NCNM, measured in a magnetic field of 800 kA/m, was σs = 1.4 A∙m2∙kg−1, and the coercive force was Hc = 10 kA/m.
Unlike previously studied magnetic carbon structures [47,48,49], NCNM does not contain ferromagnetic metal atoms. It is obvious that the mechanism of magnetism formation in the synthesised carbon structures was different. In the review analysis of experimental data of synthesised high-temperature ferromagnets without metal atoms [48,49], five main types of carbon magnetic structures were identified:
  • Chains of interacting radicals;
  • Carbon structures containing trivalent elements, such as P, N, and B;
  • Structures that are a combination of sp2- and sp3-coordinated carbon atoms;
  • Graphite and nanographite;
  • Fullerenes.
In our case, subjecting a nitrogen-containing precursor to pyrolysis at relatively moderate temperatures (800 °C) resulted in the formation of a graphite-like material with a significant abundance of unpaired spins. This provided the potential for exchange interaction between these spins [50]. The material took on a three-dimensional structure composed of both sp2- and sp3-carbon atoms.
Examinations of ferromagnetic materials derived from diverse nitrogen-containing substances have indicated that their structures typically exhibit amorphous and disordered characteristics. An unambiguous correspondence was found: a higher content of amorphous carbon corresponds to an increased spontaneous magnetisation [50]. Another regularity of such materials is the close connection between magnetic properties and the presence of various radicals, particularly nitroxyl radicals, predominantly situated at the edges of graphite-like structures. It was assumed that ferromagnetic carbon material in its pure form has never been isolated, and that the ferromagnetic phase was present in the form of islands within a nonmagnetic matrix [51].
The inherent magnetism of carbon materials is theoretically explained by the presence of mixed carbon orbitals formed at the boundaries of impurities and defects [52,53]. These defects cause the appearance of quasi-localised states near the Fermi level, influencing the magnetic moment of the carbon atom network. The authors of [54] point out that it is possible to control the magnetisation in carbon through controlled generation of defects and alloying. The analysis of the X-ray diffraction patterns in Figure 7 shows an expansion in the interlayer distance between graphene layers in graphite-like clusters compared to polycrystalline graphite. This is the cause of additional structural defects. The disordered arrangement of graphene layers also adds to the defects. Thus, a combination of structural defects and nitroxyl radicals is the most likely cause of the ferromagnetic properties of the synthesised carbon material.
This specificity of the electronic structure of the synthesised NCNM would certainly affect its ability to accumulate an electric charge. Such studies have been conducted, for example, in the article [55], where it was shown that even with a decrease in the specific surface area, a change in the electronic structure and the position of the Fermi level increased the specific capacity of the carbon material. A corresponding effect was observed for the synthesised NCNM, which, with a relatively small surface area (only 1247 m2/g), demonstrated high values of the specific capacitance (124 F/g for the 30% KOH electrolyte and 180 F/g for the 1 M Na2SO4 electrolyte).

3.7. Cyclic Voltammetry and Impedance Studies

Figure 11 shows the cyclic voltammograms of supercapacitors whose electrodes were made of NCNM bio-carbon material and with different electrolytes. The study was conducted for scanning speeds of 5 ÷ 100 mV/s. As can be seen from both figures, not all the curves had obvious peaks of electrochemical reactions. This indicates that the supercapacitors charged and discharged at a pseudo-constant rate throughout the entire volt-current cycle. The shapes of the obtained curves indicate the predominantly capacitive behaviour of the electrochemical system, along with a good ionic response [56].
The peculiarity of the behaviour of the synthesised bio-carbon material in the 30% KOH electrolyte was a certain asymmetry relative to the zero current, especially at low potential scan rates (Figure 11a). This may have been due to the fact that at high potentials, the capacitance of the bio-carbon was caused mainly by negative electrolyte ions (OH groups), which actively entered the pores and interacted with the carbon surface. With an increase in the scanning speed to 100 mV/s, the resulting charge during the anodic and cathodic processes was levelled out by reducing the ability of ions to penetrate the electrode material [57,58]. Another possible process that may have affected the shape of the curves in Figure 11a is the interaction of electrolyte ions with surface functional groups. As the scanning speed increases, the efficiency of this interaction decreases significantly due to the resistance of the electrode material.
We were able to see quite symmetrical cyclic voltammetry patterns with respect to the zero current in the neutral electrolyte 1 M Na2SO4, in contrast to the alkaline electrolyte KOH (Figure 11b). This situation was due to the fact that simple charging and discharging of the double electric layer does not require very high ion mobility. When the porous structure of the electrode is well saturated with electrolytes, ions that are already at the electrode/electrolyte interface are attracted and repelled from the electrode over a short distance. However, at high scanning speeds (50–100 mV/s), the voltammograms, as shown in Figure 11b had a rather resistive character. It is well known that alkali metal ions are highly soluble in aqueous solutions [59]. Despite this, Na+ ions can migrate into the electrolyte volume during discharge, and their return to the electrode/electrolyte interface during charging may not be as fast. It should also be noted that the sulphate anion SO42− is one of the most strongly soluble inorganic anions, with a desolvation energy of approximately 108 kJ/mol per SO42−—H2O. The voltammograms in Figure 11b are shaped as a result of these two facts, which also account for the electrolyte’s higher resistance (1 M Na2SO4) and the bio-carbon material’s lower specific capacitance.
The impedance spectroscopy method is commonly employed for investigating electrochemical processes at both the electrode/electrolyte interface and within the volume of the electrode material. This method makes it possible to conduct research across a broad frequency range. To elucidate the correlation between the structure and capacitive parameters of the examined carbon, the experimental impedance hodographs −Im Z = f(Re Z) were modelled by equivalent circuitry. Such circuits serve as a simplified model representing real processes in the system under examination. The primary criterion for selecting an equivalent circuit is the physical significance of all its structural elements under the condition of optimal approximation.
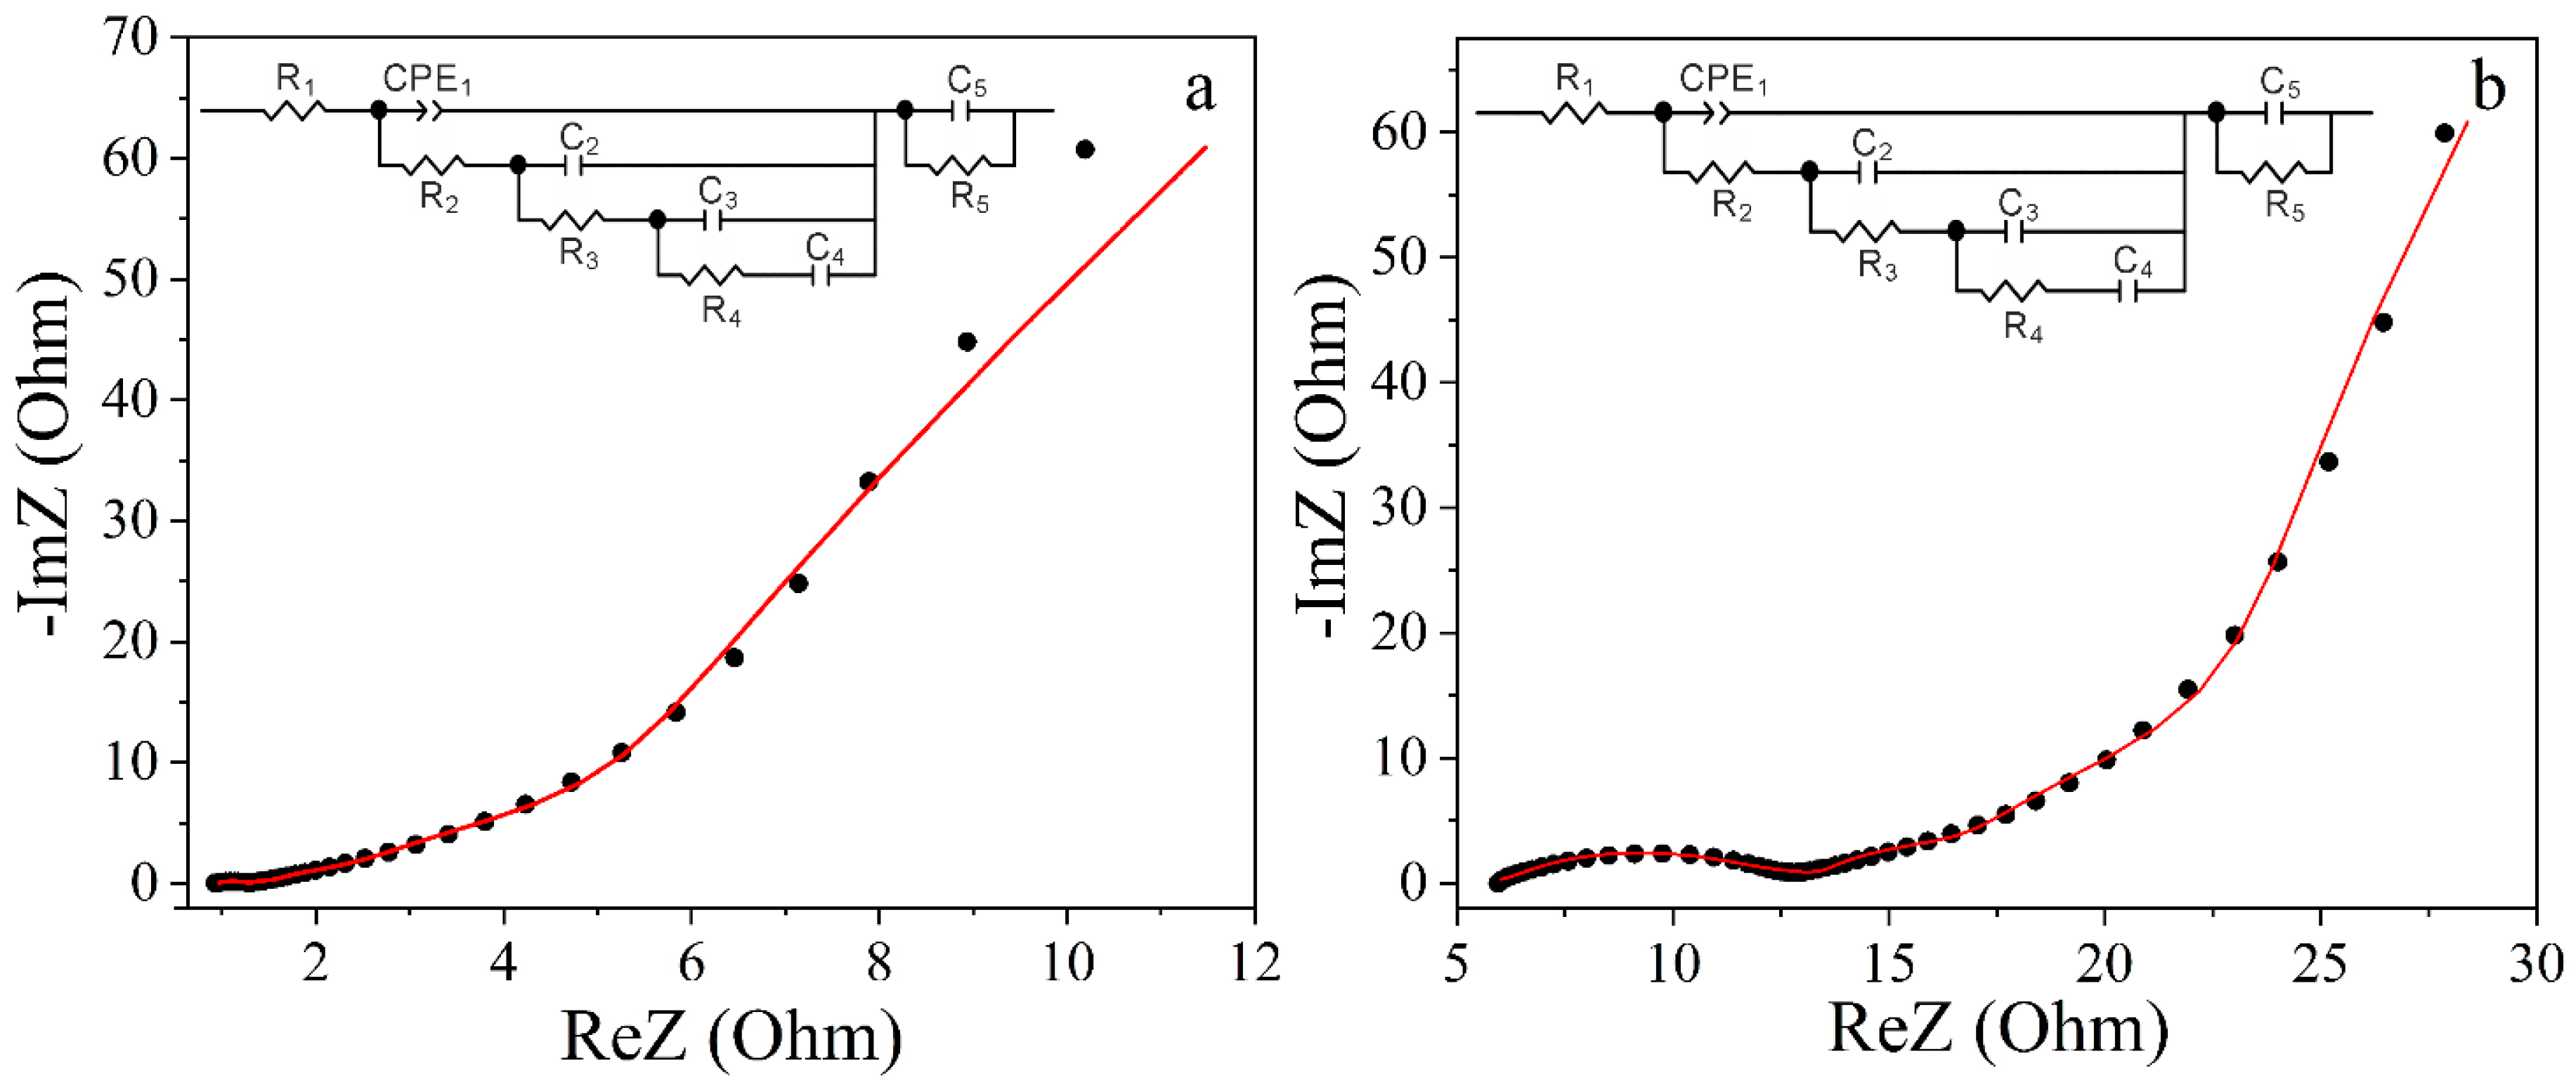
Experimental Nyquist diagrams and equivalent electrical circuits modelled on their basis are shown in Figure 12. As can be seen from these diagrams, there is a small semicircular pattern in the high frequency domain for the Na2SO4-based electrolyte. This observation suggests the occurrence of processes of charge transfer and accumulation involving Faraday processes or pseudocapacitance. For a supercapacitor with a KOH-based electrolyte, such a semicircular pattern is nearly negligible, signifying a substantial prevalence of double electric layer capacitance over capacitance attributed to redox reactions.
In the mid-frequency range, Nyquist diagrams look like sloping straight lines, indicating the course of diffusion processes in the system under study. At low frequencies, this line transitions to an almost vertical slope, suggesting the electrostatic capacitive accumulation of electric charge. The presented Nyquist diagrams were well modelled by the equivalent de Levie circuit, which was modified, in accordance with Voight’s approach [60], by the series connection of the parallel RSCCSC link. Here, RSC and CSC are, respectively, the resistance and capacitance of the spatial charge region (SCR) in the studied carbon. The calculated parameters of the equivalent electrical circuit, which are shown in the inset of Figure 12, are detailed in Table 4.
The element R1 encompasses the resistance of the electrolyte, lead wires, and contacts. Since the manufacturing technology of the supercapacitors was the same, we noted the higher resistance of the 1 M Na2SO4 electrolyte. The following elements of the circuit governed diffusion processes within the pores of the carbon material and the buildup of electric charges at the electrode/electrolyte interface. Specifically, the CRE1||R2 link primarily managed diffusion processes in transport pores (macro- and mesopores), and the C2||R3 and C3||R4-C4 links handled charge accumulation in micropores. When modelling the impedance hodographs, the constant phase element of the CPE was used, the impedance of which was determined according to the following equation [60]:
Z C P E = C P E T j ω C P E P .
The CPEP parameter considers the phase deviation, reflecting the nature of the modelled process. Specifically, when the CPEP value is close to 1, this element characterises the capacitive behaviour of the system, and when CPEP is close to 0.5, it is diffusive. The incorporation of this element can be attributed to the fractal structure of the carbon material [61] resulting in the heterogeneous distribution of charge carriers at the electrode/electrolyte interface. As can be seen from Table 4, as a result of modelling for the 1 M Na2SO4 electrolyte, the obtained value of the CPEP approached 0.5, which indicates a significantly greater influence of diffusion processes than in the KOH-based electrolyte.
The total effective surface area, as determined by the BET method (Table 2), amounted to 1247 m2/g. Comparing this value with the measured specific capacitance, we found that the differential capacitance of the synthesised nanoporous carbon in a 30% aqueous solution of KOH was ~14.4 μF/cm2, and in a 1 M aqueous solution of Na2SO4, ~9.6 μF/cm2. The corresponding value of the differential capacity in an aqueous solution of KOH was almost ~10% higher than the value for this type of N-doped carbon [62]. Instead, it should be taken into account that the theoretically possible differential capacitance for graphene is estimated to reach a maximum value of 21 μF/cm2.

4. Conclusions

  • A technology for synthesising the nitrogen-containing bio-carbon NCNM, characterised by a high degree of chemical composition homogeneity and a well-developed porous structure, has been introduced. This structure contributes to the superior energy performance of supercapacitors.
  • The correlation of the results obtained using the nitrogen adsorption/desorption method and small-angle X-ray analysis indicates the accessibility of pores for the electrolyte and their full contribution to the specific capacity for NCNM.
  • The NCNM exhibited specific saturation magnetisation values of σs = 1.4 A∙m2∙kg−1 and coercive force Hc = 10 kA/m when measured in a magnetic field of 800 kA/m. These magnetic properties arose from a graphite-like material containing numerous unpaired spins, enabling exchange interactions. The material formed a three-dimensional structure comprising both sp2- and sp3-carbon atoms.
  • In a symmetrical electrochemical supercapacitor (SC), the specific capacitance reached 180 F/g, surpassing existing market analogues by more than 50%. The differential capacitance of the synthesised nanoporous carbon in a 30% aqueous solution of KOH was ~14.4 μF/cm2, and in a 1 M aqueous solution of Na2SO4,9.6 μF/cm2. According to the results of impedance spectroscopy, it was found that, in the case of the 1 M Na2SO4 electrolyte, diffusion processes had a significantly greater influence on charge accumulation than in the KOH-based electrolyte.

Author Contributions

Conceptualisation, F.I., I.B. and A.B.; methodology, I.B., E.S., A.B. and Y.K.; validation, F.I., I.B. and Z.K.; formal analysis, M.K. and V.M.; investigation, E.S., V.M., A.B. and Y.K.; data curation, F.I., I.B. and E.S.; writing—original draft preparation, E.S., V.M. and A.B.; writing—review and editing, F.I. and I.B.; theoretical modelling, M.K.; software, Z.K.; visualisation, E.S. and V.M.; supervision, F.I. and I.B.; project administration, F.I. and I.B.; funding acquisition, Z.K. All authors have read and agreed to the published version of the manuscript.

Funding

The findings presented herein are derived from a project supported by the European Union’s Horizon 2020 research and innovation program, as per the Marie Skłodowska-Curie grant agreement No 778156. Additionally, we acknowledge the support received from science resources allocated during the years 2018–2022 for the execution of the international co-financed project with the reference number W13/H2020/2018 (Dec. MNiSW 3871/H2020/2018/2).

Data Availability Statement

Data are contained within the article.

Conflicts of Interest

The authors declare no conflict of interest.

References

  1. Maksymych, V.; Całus, D.; Ivashchyshyn, F.; Pidluzhna, A.; Chabecki, P.; Shvets, R. Quantum energy accumulation in semiconductor < ionic liquid > layered clathrates. Appl. Nanosci. 2022, 12, 1147–1153. [Google Scholar] [CrossRef]
  2. Chabecki, P. Quantum Energy Storage in Dielectric Porous Clathrates. Energies 2022, 15, 6069. [Google Scholar] [CrossRef]
  3. Hulicova-Jurcakova, D.; Puziy, A.M.; Poddubnaya, O.I.; Suárez-García, F.; Tascón, J.M.; Lu, G.Q. Highly stable performance of supercapacitors from phosphorus-enriched carbons. J. Am. Chem. Soc. 2009, 131, 5026–5027. [Google Scholar] [CrossRef]
  4. Deng, Y.; Xie, Y.; Zou, K.; Ji, X. Review on recent advances in nitrogendoped carbons: Preparations and applications in supercapacitors. J. Mater. Chem. A 2015, 4, 1144–1173. [Google Scholar] [CrossRef]
  5. Mostazo-López, M.J.; Ruiz-Rosas, R.; Morallón, E.; Cazorla-Amorós, D. Generation of nitrogen functionalities on activated carbons by amidation reactions and Hofmann rearrangement: Chemical and electrochemical characterization. Carbon 2015, 91, 252–262. [Google Scholar] [CrossRef]
  6. Xiang, S.; Yang, X.; Lin, X.; Chang, C.; Que, H.; Li, M. Nitrogen and sulfur co-doped polyurethane-based porous carbon materials as supercapacitors exhibit excellent electrochemical performance. J. Solid State Electrochem. 2017, 21, 1457–1465. [Google Scholar] [CrossRef]
  7. Inagaki, M.; Toyoda, M.; Soneda, Y.; Morishita, T. Nitrogen-doped carbon materials. Carbon 2018, 132, 104–140. [Google Scholar] [CrossRef]
  8. Wang, Y.; Xiao, J.; Zhang, T.; Ouyang, L.; Yuan, S. Single-Step Preparation of Ultrasmall Iron Oxide-Embedded Carbon Nanotubes on Carbon Cloth with Excellent Superhydrophilicity and Enhanced Supercapacitor Performance. ACS Appl. Mater. Interfaces 2021, 13, 45670–45678. [Google Scholar] [CrossRef] [PubMed]
  9. Wang, Y.; Zhang, T.; Xiao, J.; Tian, X.; Yuan, S. Enhancing electrochemical performance of ultrasmall Fe2O3-embedded carbon nanotubes via combusting-induced high-valence dopants. J. Mater. Sci. Technol. 2023, 134, 142–150. [Google Scholar] [CrossRef]
  10. Kwon, T.; Nishihara, H.; Itoi, H.; Yang, Q.-H.; Kyotani, T. Enhancement mechanism of electrochemical capacitance in nitrogen- /boron-doped carbons with uniform straight nanochannels. Langmuir 2009, 25, 11961–11968. [Google Scholar] [CrossRef] [PubMed]
  11. Yang, X.; Wu, D.; Chen, X.; Fu, R. Nitrogen-enriched nanocarbons with a 3-D continuous mesopore structure from polyacrylonitrile for supercapacitor application. J. Phys. Chem. C 2010, 114, 8581–8586. [Google Scholar] [CrossRef]
  12. Lei, Z.; Christov, N.; Zhang, L.L.; Zhao, X.S. Mesoporous carbon nanospheres with an excellent electrocapacitive performance. J. Mater. Chem. 2011, 21, 2274–2281. [Google Scholar] [CrossRef]
  13. Ornelas, O.; Sieben, J.M.; Ruiz-Rosas, R.; Morallón, E.; Cazorla-Amorós, D.; Geng, J.; Soin, N.; Siores, E.; Johnson, B.F.G. On the origin of the high capacitance of nitrogen-containing carbon nanotubes in acidic and alkaline electrolytes. Chem. Commun. 2014, 50, 11343–11346. [Google Scholar] [CrossRef] [PubMed]
  14. Wang, Y.; Xiao, J.; Wang, H.; Zhang, T.C.; Yuan, S. Binary doping of nitrogen and phosphorus into porous carbon: A novel di-functional material for enhancing CO2 capture and super-capacitance. J. Mater. Sci. Technol. 2022, 99, 73–81. [Google Scholar] [CrossRef]
  15. Wei, X.; Jiang, X.; Wei, J.; Gao, S. Functional groups and pore size distribution do matter to hierarchically porous carbons as high-rate-performance supercapacitors. Chem. Mater. 2016, 28, 445–458. [Google Scholar] [CrossRef]
  16. Candelaria, S.L.; Garcia, B.B.; Liu, D.; Cao, G. Nitrogen modification of highly porous carbon for improved supercapacitor performance. J. Mater. Chem. 2012, 22, 9884–9889. [Google Scholar] [CrossRef]
  17. Salinas-Torres, D.; Shiraishi, S.; Morallón, E.; Cazorla-Amorós, D. Improvement of carbon materials performance by nitrogen functional groups in electrochemical capacitors in organic electrolyte at severe conditions. Carbon 2015, 82, 205–213. [Google Scholar] [CrossRef]
  18. Seredych, M.; Hulicova-Jurcakova, D.; Lu, G.Q.; Bandosz, T.J. Surface functional groups of carbons and the effects of their chemical character, density and accessibility to ions on electrochemical performance. Carbon 2008, 46, 1475–1488. [Google Scholar] [CrossRef]
  19. Wang, X.; Liu, C.-G.; Neff, D.; Fulvio, P.F.; Mayes, R.T.; Zhamu, A.; Fang, Q.; Chen, G.; Meyer, H.M.; Jang, B.Z.; et al. Nitrogen-enriched ordered mesoporous carbons through direct pyrolysis in ammonia with enhanced capacitive performance. J. Mater. Chem. A 2013, 1, 7920. [Google Scholar] [CrossRef]
  20. Raymundo-Piñero, E.; Cazorla-Amorós, D.; Linares-Solano, A.; Find, J.; Wild, U.; Schlögl, R. Structural characterization of N-containing activated carbon fibers prepared from a low softening point petroleum pitch and a melamine resin. Carbon 2002, 40, 597–608. [Google Scholar] [CrossRef]
  21. Xia, Y.; Mokaya, R. Synthesis of ordered mesoporous carbon and nitrogen-doped carbon materials with graphitic pore walls via a simple chemical vapor deposition method. Adv. Mater. 2004, 16, 1553–1558. [Google Scholar] [CrossRef]
  22. Kruk, M.; Dufour, B.; Celer, E.B.; Kowalewski, T.; Jaroniec, M.; Matyjaszewski, K. Synthesis of mesoporous carbons using ordered and disordered mesoporous silica templates and polyacrylonitrile as carbon precursor. J. Phys. Chem. B 2005, 109, 9216–9225. [Google Scholar] [CrossRef]
  23. Bleda-Martínez, M.J.; Peng, C.; Zhang, S.; Chen, G.Z.; Morallón, E.; CazorlaAmorós, D. Electrochemical methods to enhance the capacitance in activated carbon/polyaniline composites. J. Electrochem. Soc. 2008, 155, A672–A678. [Google Scholar] [CrossRef]
  24. Inagaki, M.; Konno, H.; Tanaike, O. Carbon materials for electrochemical capacitors. J. Power Sources 2010, 195, 7880–7903. [Google Scholar] [CrossRef]
  25. Nishihara, H.; Kyotani, T. Templated nanocarbons for energy storage. Adv. Mater. 2012, 24, 4473–4498. [Google Scholar] [CrossRef] [PubMed]
  26. Shen, W.; Fan, W. Nitrogen-containing porous carbons: Synthesis and application. J. Mater. Chem. A 2013, 1, 999–1013. [Google Scholar] [CrossRef]
  27. Mostazo-López, M.J.; Ruiz-Rosas, R.; Morallón, E.; Cazorla-Amorós, D. Nitrogen doped superporous carbon prepared by a mild method. Enhancement of supercapacitor performance. Int. J. Hydrogen Energy 2016, 41, 19691–19701. [Google Scholar] [CrossRef]
  28. Quílez-Bermejo, J.; González-Gaitán, C.; Morallón, E.; Cazorla-Amorós, D. Effect of carbonization conditions of polyaniline on its catalytic activity towards ORR. Some insights about the nature of the active sites. Carbon 2017, 119, 62–71. [Google Scholar] [CrossRef]
  29. Zhao, J.; Lai, H.; Lyu, Z.; Jiang, Y.; Xie, K.; Wang, X.; Wu, Q.; Yang, L.; Jin, Z.; Ma, Y.; et al. Hydrophilic hierarchical nitrogen-doped carbon nanocages for ultrahigh supercapacitive performance. Adv. Mater. 2015, 27, 3541–3545. [Google Scholar] [CrossRef] [PubMed]
  30. Ostafiychuk, B.K.; Budzulyak, I.M.; Kuzyshyn, M.M.; Rachiy, B.I.; Zatorskiy, R.A.; Lisovskiy, R.P.; Mandzyuk, V.I. Nitrogen-Containing Nanoporous Coal for Electrodes of Supercapacitors. J. Nano Electron. Phys. 2013, 5, 03049. [Google Scholar]
  31. Tian, W.; Zhang, H.; Sun, H.; Tadé, M.O.; Wang, S. Template-free synthesis of N-doped carbon with pillared-layered pores as bifunctional materials for supercapacitor and environmental applications. Carbon 2017, 118, 98–105. [Google Scholar] [CrossRef]
  32. Zhu, C.; Li, H.; Fu, S.; Du, D.; Lin, Y. Highly efficient nonprecious metal catalysts towards oxygen reduction reaction based on three-dimensional porous carbon nanostructures. Chem. Soc. Rev. 2016, 45, 517–531. [Google Scholar] [CrossRef]
  33. Puthusseri, D.; Aravindan, V.; Madhavi, S.; Ogale, S. 3D micro-porous conducting carbon beehive by single step polymer carbonization for high performance supercapacitors: The magic of in situ porogen formation. Energy Environ. Sci. 2014, 7, 728–735. [Google Scholar] [CrossRef]
  34. Bichat, M.P.; Raymundo-Piñero, E.; Béguin, F. High voltage supercapacitor built with seaweed carbons in neutral aqueous electrolyte. Carbon 2010, 48, 4351–4361. [Google Scholar] [CrossRef]
  35. Demarconnay, L.; Raymundo-Piñero, E.; Béguin, F. A symmetric carbon/carbon supercapacitor operating at 1.6 V by using a neutral aqueous solution. Electrochem. Commun. 2010, 12, 1275–1278. [Google Scholar] [CrossRef]
  36. Chen, Y.; Zhang, J.; Li, M.; Yang, C.; Zhang, L.; Wang, C.; Lu, H. Strong interface coupling and few-crystalline MnO2/Reduced graphene oxide composites for supercapacitors with high cycle stability. Electrochim. Acta 2018, 292, 115–124. [Google Scholar] [CrossRef]
  37. Gao, Q.; Demarconnay, L.; Pineroa, E.R.; Beguin, F. Exploring the large voltage range of carbon/carbon supercapacitors in aqueous lithium sulfate electrolyte. Energy Environ. Sci. 2012, 5, 9611–9617. [Google Scholar] [CrossRef]
  38. Wang, Y.; Zhang, T.; Zheng, X.; Tian, X.; Yuan, S. Enhancing Energy Storage via Confining Sulfite Anions onto Iron Oxide/Poly(3,4-Ethylenedioxythiophene) Heterointerface. ACS Appl. Mater. Interfaces 2023, 15, 59413–59421. [Google Scholar] [CrossRef] [PubMed]
  39. Inagaki, M. Structure and Texture of Carbon Materials. Carbons Electrochem. Energy Storage Convers. Syst. 2009, 37–76. [Google Scholar] [CrossRef]
  40. Pecharsky, V.K.; Zavalij, P.Y. Fundamentals of Powder Diffraction and Structural Characterization of Materials; Springer: New York, NY, USA, 2009. [Google Scholar]
  41. Bordun, I.; Pidluzhna, A.; Ivashchyshyn, F.; Borysiuk, A.; Całus, D.; Chwastek, K. Structural and magnetic properties of Ni/C composites synthesized from beet pulp and corn stems. Magnetochemistry 2021, 7, 31. [Google Scholar] [CrossRef]
  42. Thommes, M.; Kaneko, K.; Neimark, A.; Olivier, J.; Rodriguez-Reinoso, F.; Rouquerol, J.; Sing, K. Physisorption of gases, with special reference to the evaluation of surface area and pore size distribution (IUPAC Technical Report). Pure Appl. Chem. 2015, 87, 1051–1117. [Google Scholar] [CrossRef]
  43. Rouquerol, J.; Rouquerol, F.; Llewellyn, P.; Maurin, G.; Sing, K. Adsorption by Powders and Porous Solids: Principles, Methodology and Applications, 2nd ed.; Academic Press: Oxford, UK, 2014. [Google Scholar]
  44. Lozano-Castelló, D.; Suárez-Garsía, F.; Cazorla-Amoróz, D.; Linares-Solano, Á. Porous texture of carbons. In Carbon for Electrochemical Energy Storage Systems; Beguin, F., Frackowiak, E., Eds.; CRC Press, Taylor and Francis Group: Boca Raton, FL, USA; New York, NY, USA, 2002. [Google Scholar]
  45. Guinier, A.; Fournet, G. Small-Angle Scattering of X-rays; Wiley: New York, NY, USA, 1955. [Google Scholar]
  46. Porod, G. General theory. In Small-Angle X-ray Scattering; Glatter, O., Kratky, O., Eds.; Academic Press: London, UK, 1982. [Google Scholar]
  47. Soloviy, C.; Malovanyy, M.; Bordun, I.; Ivashchyshyn, F.; Borysiuk, A.; Kulyk, Y. Structural, magnetic and adsorption characteristics of magnetically susceptible carbon sorbents based on natural raw materials. J. Water Land Dev. 2020, 47, 160–168. [Google Scholar] [CrossRef]
  48. Makarova, T.L. Magnetic properties of carbon structures. Semiconductors 2004, 38, 615–638. [Google Scholar] [CrossRef]
  49. Murata, K.; Ushijima, H.; Ueda, H.; Kawaguchi, K. A stable carbon-based organic magnet. J. Chem. Soc. Chem. Commun. 1992, 7, 567–569. [Google Scholar] [CrossRef]
  50. Ushijima, H.; Murata, K.; Ueda, H.; Kawaguchi, K. Preparation of amorphouslike carbons by pyrolysis of organic compounds and their magnetic properties. Mol. Cryst. Liq. Cryst. Sci. Technol. Sect. A Mol. Cryst. Liq. Cryst. 1993, 233, 351–360. [Google Scholar] [CrossRef]
  51. Setnescu, R.; Jipa, S.; Setnescu, T.; Kappel, W.; Kobayashi, S.; Osawa, Z. IR and X-ray characterization of the ferromagnetic phase of pyrolysed polyacrylonitrile. Carbon 1999, 37, 1–6. [Google Scholar] [CrossRef]
  52. Yazyev, O.V.; Helm, L. Defect-induced magnetism in graphene. Phys. Rev. B—Condens. Matter Mater. Phys. 2007, 75, 125408. [Google Scholar] [CrossRef]
  53. Son, Y.W.; Cohen, M.L.; Louie, S.G. Half-metallic graphene nanoribbons. Nature 2006, 444, 347–349. [Google Scholar] [CrossRef]
  54. Zhang, Y.; Talapatra, S.; Kar, S.; Vajtai, R.; Nayak, S.K.; Ajayan, P.M. First-principles study of defect-induced magnetism in carbon. Phys. Rev. Lett. 2007, 99, 10720. [Google Scholar] [CrossRef] [PubMed]
  55. Bordun, I.; Chabecki, P.; Malovanyy, M.; Pieshkov, T.; Chwastek, K. Changes in the Electrical Charge Accumulation Ability of Nanoporous Activated Carbon under Ultrasonic Radiation Exposure. Isr. J. Chem. 2020, 60, 615–623. [Google Scholar] [CrossRef]
  56. Wang, D.W.; Li, F.; Cheng, H.M. Hierarchical porous nickel oxide and carbon as electrode materials for asymmetric supercapacitor. J. Power Sources 2008, 185, 1563–1568. [Google Scholar] [CrossRef]
  57. Taberna, P.; Simon, P.; Fauvarque, J. Electrochemical characteristics and impedance spectroscopy studies of carbon-carbon supercapacitors. J. Electrochem. Soc. 2003, 150, 292–300. [Google Scholar] [CrossRef]
  58. Frackowiak, E.; Jurewicz, K.; Delpeux, S.; Béguin, F. Nanotubular materials for supercapacitors. J. Power Sources 2001, 97–98, 822–825. [Google Scholar] [CrossRef]
  59. Fic, K.; Lota, G.; Meller, M.; Frackowiak, E. Novel insight into neutral medium as electrolyte for high-voltage supercapacitors. Energy Environ. Sci. 2012, 5, 5842–5850. [Google Scholar] [CrossRef]
  60. Barsoukov, E.; Macdonald, J.R. Impedance Spectroscopy: Theory, Experiment, and Applications; John Wiley & Sons Inc.: Hoboken, NJ, USA, 2018. [Google Scholar]
  61. Mandzyuk, V.I.; Myronyuk, I.F.; Sachko, V.M.; Rachiy, B.I.; Kulyk, Y.O.; Mykytyn, I.M. Structure and Electrochemical Properties of Saccharide-derived Porous Carbon Materials. J. Nano-Electron. Phys. 2018, 10, 02018. [Google Scholar] [CrossRef]
  62. Wu, Q.; Yang, L.; Wang, X.; Hu, Z. Mesostructured carbon-based nanocages: An advanced platform for energy chemistry. Sci. China Chem. 2020, 63, 665–681. [Google Scholar] [CrossRef]
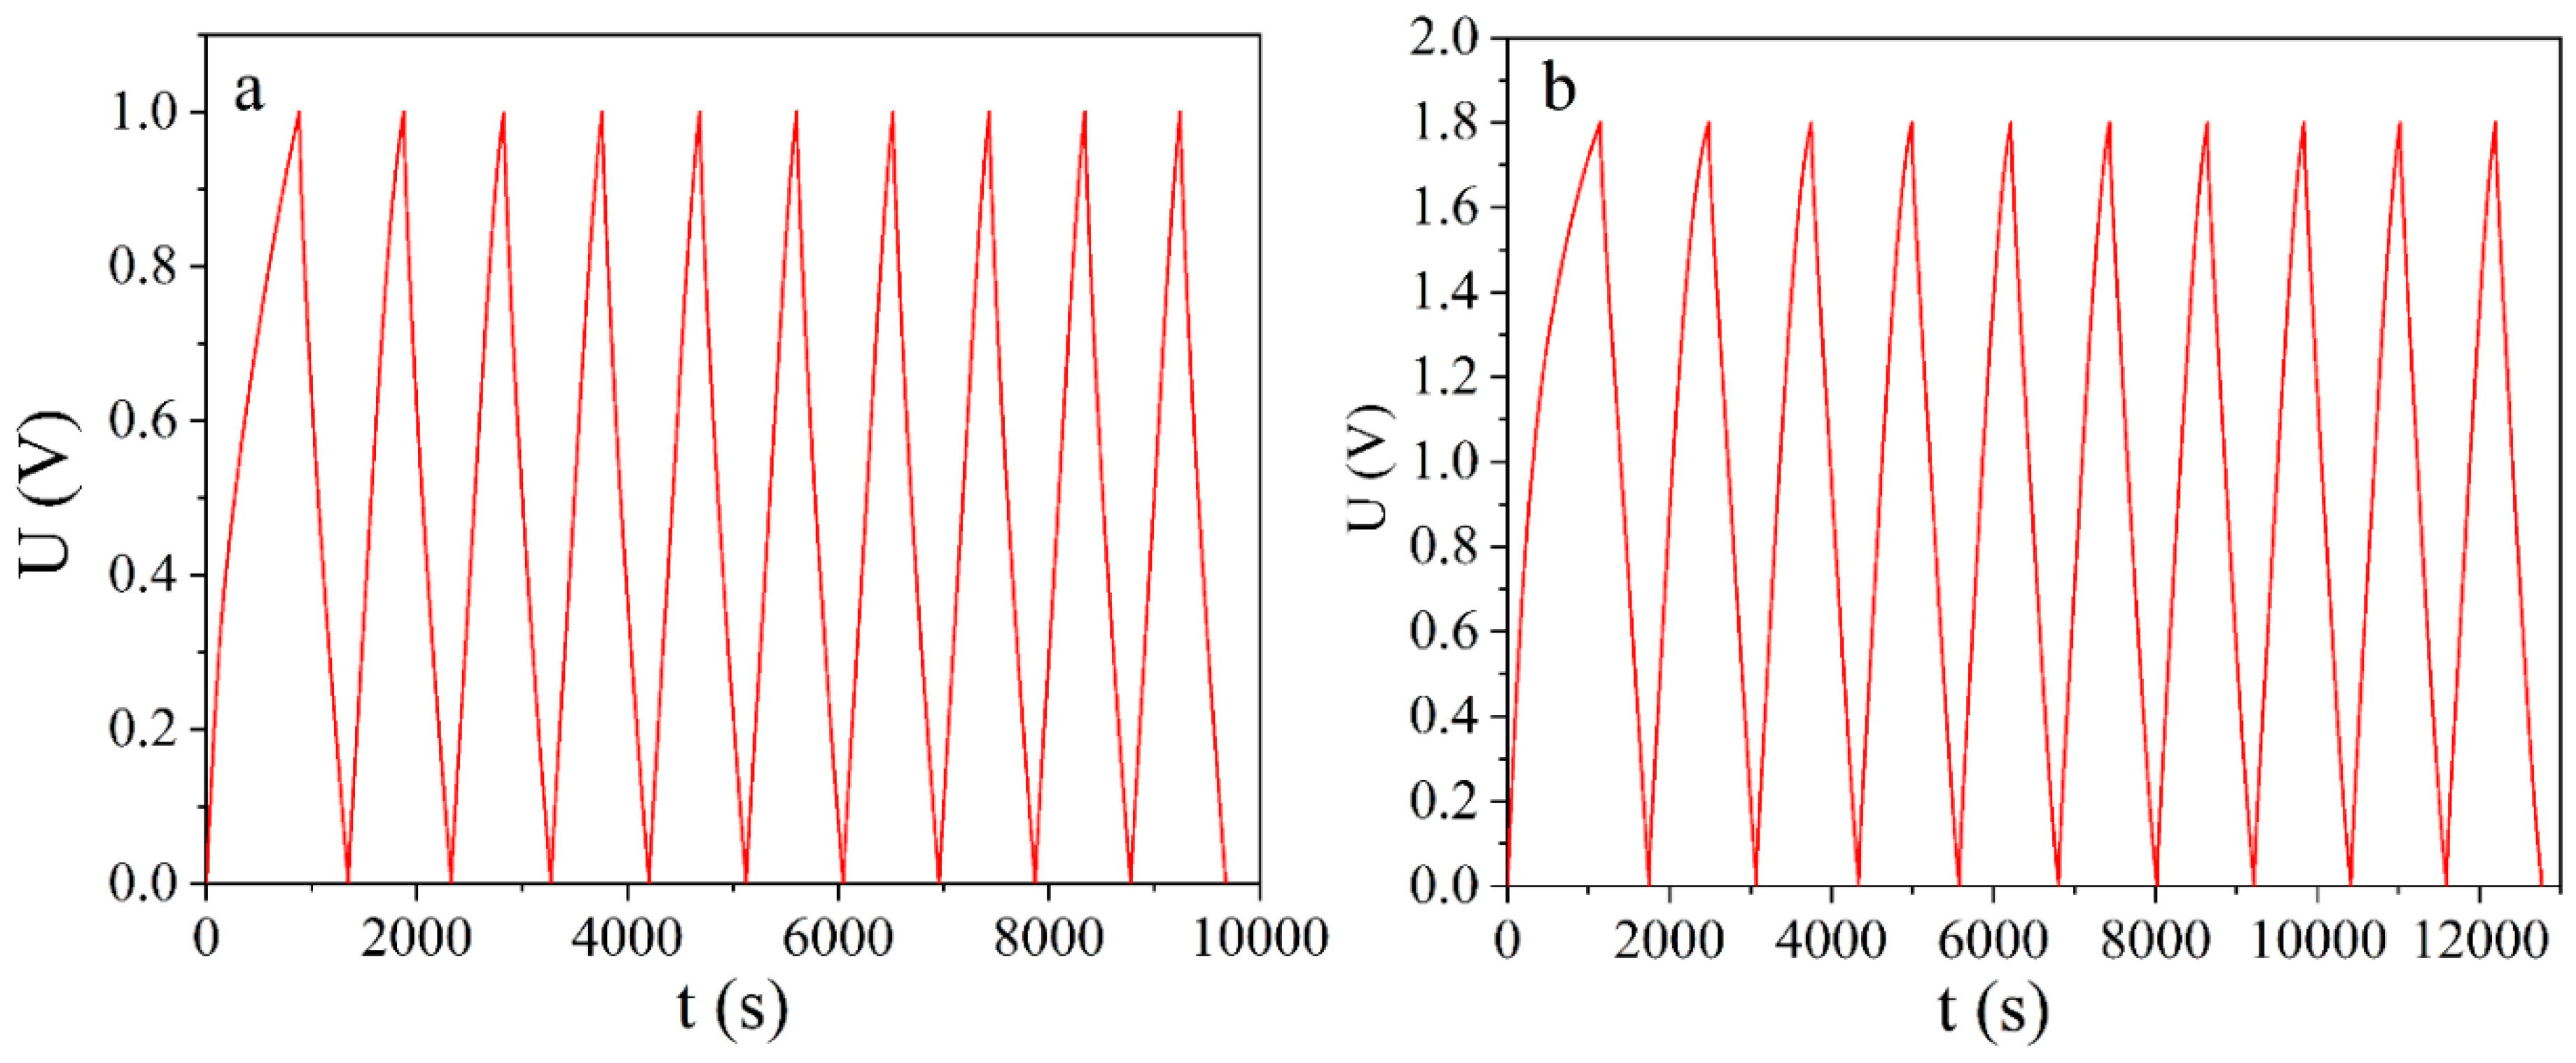
Figure 1. Galvanostatic charge–discharge cycles for the bio-carbon material NCNM, synthesised at 800 °C in 30% KOH electrolyte (a) and in 1 M Na2SO4 (b).
Energies 17 00903 g001
Figure 2. SEM images of NCNM at high magnification: 550× (a), 2250× (b), 9500× (c), and 9600× (d).
Energies 17 00903 g002
Figure 3. SEM images and analysis of NCNM energy dispersive X-ray spectroscopy.
Energies 17 00903 g003
Figure 4. Nitrogen adsorption/desorption isotherm NCNM.
Energies 17 00903 g004
Figure 5. Pore size distribution for the synthesised NCNM, calculated by the BJH method.
Energies 17 00903 g005
Figure 6. Pore size distribution for the synthesised NCNM calculated using the DFT method.
Energies 17 00903 g006
Figure 7. X-ray diffractogram of NCNM sample.
Energies 17 00903 g007
Figure 8. Intensity curve of the NCNM small-angle scattering (dots—experimental data corrected for background scattering, solid curve—smoothing by spline approximation).
Energies 17 00903 g008
Figure 9. Volumetric functions of NCNM pore distribution by radii of inertia.
Energies 17 00903 g009
Figure 10. Magnetic moment hysteresis loop for NCNM.
Energies 17 00903 g010
Figure 11. Cyclic voltammograms of supercapacitors made from bio-carbon material NCNM with electrolyte 30% KOH (a) and 1 M Na2SO4 (b).
Energies 17 00903 g011
Figure 12. Nyquist diagram of synthesised bio-carbon from glucose in KOH electrolyte (a) and Na2SO4 electrolyte (b). The dots represent the experimental dependences, and the solid lines are modelled by the equivalent electrical circuits shown in the inset.
Energies 17 00903 g012
Table 1. Specific capacity of synthesised carbon materials in different electrolytes (charge/discharge current density: 0.5 A/g).
ElectrolyteSynthesis Temperature NCNM, °С
600700800
C, F/g30% KOH20109180
1 M Na2SO4968124
Table 2. Structural parameters of the studied carbon.
SampleS, m2/gV, cm3/g r ¯ , nmCorrelation Coefficient according to the BET Model
NCNM12470.881.420.996
Table 3. Structural characteristics of the investigated bio-carbon using the SAXS method.
SampleKp·104, nm−4Qp·103, nm−3Rgs, nmSp,
m2/cm3
NCNM0.88349.52.95592
Table 4. Parameters of the equivalent circuit for the investigated bio-carbon.
ElectrolyteR1, ОhmCPE1R2, ОhmC2, FR3, OhmC3, FR4, ОhmC4, FR5, OhmC5, mF/g
TP
30% KOH0.9580.0520.7850.840.0373.8390.06623.70.0630.3150.131
1 M Na2SO45.6390.0070.4295.6080.0326.3760.099320.0983.1140.045
Disclaimer/Publisher’s Note: The statements, opinions and data contained in all publications are solely those of the individual author(s) and contributor(s) and not of MDPI and/or the editor(s). MDPI and/or the editor(s) disclaim responsibility for any injury to people or property resulting from any ideas, methods, instructions or products referred to in the content.