Abstract
In this article, the control of a DC/DC converter was carried out using the proposed methods of conventional PI, PSO-based PI, PSO-based FOPI, GA-based PI, and GA-based FOPI controllers in order to improve the performance of PEMFCs. Simulink models of a PEMFC model with two inputs—hydrogen consumption and oxygen air flow—and with controllers were developed. Then, the outputs of a system based on conventional PI were compared with the proposed methods. IAE, ISTE, and ITAE were employed as fitness functions in optimization algorithms such as PSO and GA. Fitness function value, maximum overshoot, and rising time were utilized as metrics to compare the performance of the methods. PI and FOPI parameters were optimized with the proposed methods and the results were compared with traditional PI in which the optimum parameters were determined by an empirical approach. This research study indicates that the proposed methods perform better than the conventional PI method. However, it becomes apparent that the GA-FOPI approach outperforms the others. The simulation result also shows that the PEMFC model with conventional PI and FOPI controllers in which the controller parameters are tuned using PSO and GA has an acceptable control performance.
1. Introduction
Fuel cells are an electrochemical system that directly converts the chemical energy of fuel into electrical energy. With their numerous benefits, including high efficiency, low gas emissions, and adaptable modular structure, they hold considerable potential as a significant distributed power source in the future. Fuel cells employ proton-exchange membranes (PEMs), which are a type of ion-conductive substance. A PEM is a thin, selectively permeable material that allows for the transport of protons (H+ ions) while preventing the flow of electrons and other ions [1]. Various types of fuel cells have been developed, often using hydrogen as fuel. These include proton-exchange membrane fuel cells (PEMFCs) and their important features are as follows: they are compact and lightweight; they have high output power density at low temperatures; they have low environmental impact; and they have good start-up/shutdown performance [2]. These advantages have led to the use of PEMs in many applications. Some of these applications are power supplies in transportation vehicles, compact cogeneration constant power supplies, portable power supplies, and emergency backup power supplies. However, problems such as substandard performance, uncontrolled voltage, and high fuel consumption are parameters that prevent the widespread use of PEMFCs in commercial applications [3]. Therefore, it is necessary to obtain an appropriate control design for PEMFCs. With this in mind, in this study, in order to improve the performance of PEMFCs, simulink models of conventional PI, particle swarm optimization (PSO)-based PI, PSO-based fractional order proportional and integral (FOPI), genetic algorithm (GA)-based PI, and GA-based FOPI controllers were developed and the performance rates of these methods were compared.
It can be seen in the literature that studies related to the optimization problems of PEM fuel cells or different systems have been carried out. In order to solve the targeted problems throughout the studies, various parameters were determined for different optimization methods. In this context, various case studies and findings seen in the literature are briefly explained below.
It is seen that conventional PID (proportional–integral–derivative) or PI controllers are used in the optimization of various parameters in PEMFCs. A PID controller is a kind of feedback control system that is frequently used to regulate a process or system in industrial and engineering applications. Proportional (P), integral (I), and derivative (D) components are used to reduce the difference between the desired setpoint and the actual system response by adjusting the control output [4]. More precisely, an adequate design of a system with conventional integer-order PID is possible by optimizing the parameters of the controller. In determining these parameters, apart from the Ziegler–Nichols method, which was developed to find PID coefficients experimentally, heuristic methods and artificial intelligence techniques are also widely used [5]. However, these methods are incapable of inspecting real-world objects or performing fractional operations optimally. The reason for this is that the variables to be controlled have a non-linear characteristic [3]. Because of these drawbacks, studies often choose fractional-order controllers because they are more flexible, more robust, and make more accurate findings.
Various approaches are used to optimize parameters in conventional PID and fractional-order PID (FOPI) controller-based PEMFC studies. Some of these methods are heuristic optimization approaches such as genetic algorithm (GA), ant colony optimization (ACO), particle swarm optimization (PSO) and artificial bee colony (ABC). With such intuitive optimization approaches, it is not guaranteed that the optimum solution will be found, but the optimal result is achieved within the capability of the method. Various improvements have been made in PEMFCs with PID controllers whose parameters are determined by intuitive optimization methods. Some of these studies are listed in Table 1.

Table 1.
PEMFC studies using PID controllers with optimized parameters.
The difficulty of theoretical analysis of the ACO, the uncertainty of the required convergence time, and the change in probability distribution in each iteration are important parameters taken into consideration in the studies. On the other hand, the gray wolf optimization (GKO) algorithm is taken into consideration in studies because it is less reliable, has low error tolerance, and is an extremely complex technique at low speed. Unlike the aforementioned optimization methods, the PSO optimization method is simple, effective and easily applicable. Therefore, the PSO method was preferred in this study.
This article presents the implementation of several controllers, including conventional PI, PSO-based PI (PSO-PI), PSO-based FOPI (PSO-FOPI), GA-based PI (GA-PI), and GA-based FOPI (GA-FOPI), to improve the performance of PEMFC. The fitness function value, maximum overshoot percent (MP%), and settling time (Ts) were all factors considered when comparing the methods.
The rest of this paper is organized as follows: Section 2 presents the PEM fuel cell, the conventional PI-controlled DC/DC converter, FOPI, PSO and PSO-FOPI, GA and GA-FOPI, fitness functions such as ITAE, ISTE, and IAE, and the proposed model. Section 3 presents the results obtained with IAE, ITAE, and ISTE. Finally, Section 4 presents the conclusions.
2. Material and Methods
The methodologies employed in this research are outlined within this section. The utilized methodologies encompass the PEM fuel cell and the conventional PI-controlled DC/DC converter, as well as the PSO, PSO-based FOPI, and GA-based FOPI approaches employed for the optimization of PI parameters. The model proposed in this research and its details are also explained in this section. Additionally, the performance of the overall system was examined through simulation in MATLAB/SIMULINK software. Specifically, the Simscape module was used for PEMFC.
2.1. PEM Fuel Cell
The PEM fuel cell has the highest energy density among fuel cells. This situation arises from the characteristics of the structure and materials that make up the fuel cell. The chemical reaction process taking place in a fuel cell is the reverse of electrolysis. Figure 1 illustrates the configuration and operational principles of the PEM fuel cell, which has two metallic electrodes: a negative electrode known as the anode, and a positive electrode known as the cathode. Hydrogen and oxygen, as shown in the figure, utilize the anode and cathode inputs, respectively. Hydrogen atoms are split into protons and electrons in the anode section by the action of a catalyst (such as compounds containing platinum). The anode reaction in a PEM fuel cell:
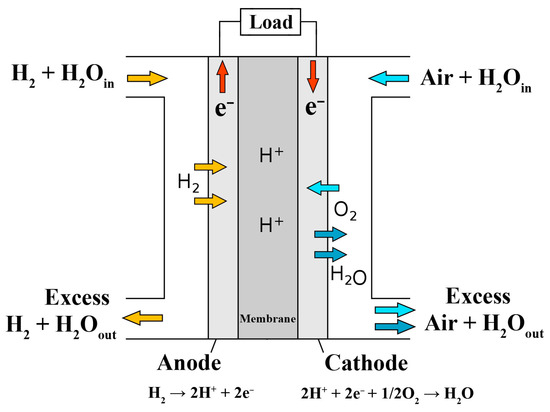
Figure 1.
Fuel cell structure and working mechanism.
While the separated protons pass through the proton-conducting electrolyte called the membrane, the electric current generated by the movement of electrons is passed through the electrical circuit located outside the system. Protons passing through the electrolyte recombine with electrons passing through the electrical circuit and combine with oxygen, producing heat along with pure water vapor [9]. Heat is important because high temperatures can cause thermal stresses that can damage the device and reduce its expected lifetime. Accurately modeling and controlling the temperature of power devices used in inverters can help improve their performance and reduce their susceptibility to damage. Hence, it is evident that the literature has presented real-time temperature control models [15,16].
The cathode reaction and total reactions in the PEM fuel cell are respectively:
It is widely recognized that this technology has potential applications in both current and future contexts. It is capable of functioning at low operating temperatures ranging from 60 to 80 °C, has quick start-up time, promptly adapts to fluctuations in power demand, is lightweight and requires minimal hardware, and exhibits high power density [17].
The characteristics of a fuel cell are typically represented by the polarization curve, which denotes the loss curve of the PEM fuel cell (Figure 2). As can be seen from the figure, the V/I change of the cell has a non-linear characteristic. Nonlinearity depends on factors such as current density, cell temperature, membrane humidity, and reactant partial pressure [18].
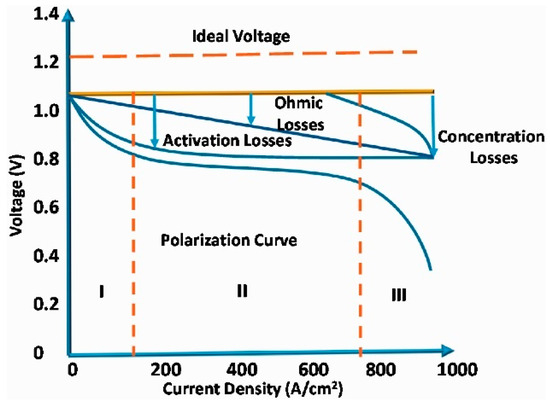
Figure 2.
Polarization curve of PEM fuel cell [19].
2.2. The Conventional PI-Controlled DC/DC Converter
Nowadays, it has become necessary for the power sources that provide the electrical energy needed in the industry to be stable. Addressing this requirement can be achieved with switching power supply [19]. DC-DC converters are preferred for their benefits, including smooth speed control, high efficiency and dynamic response.
A DC-DC converter is employed for the dual purpose of voltage regulation and voltage amplitude reduction. The output voltage of the DC-DC converter is controlled by adjusting the duty ratio of the input pulse and turning the converter switch on and off during each cycle.
Regardless of any variations in the load value or input voltage of DC-DC converters, it is imperative for the output values to stay consistent [20,21]. PID control approaches are commonly preferred at this level [22]. Studies have focused on obtaining the best performance by adjusting the stability and controller coefficients of the control system in order to get the best performance from the PID controller. The most basic methods known in the literature are Ziegler–Nichols, the Cohen–Coon rules, the Ǻström–Häggland method, and advanced Ziegler–Nichols method [23].
In this study, a PI-controlled DC-DC converter was employed at the output of the PEMFC. The PI coefficients were determined using PSO, PSO-FOPI, GA, and GA-FOPI approaches. The Matlab-Simulink model of the converter used in this study is discussed in the following sections.
2.3. Fractional Order Proportional and Integral (FOPI)
The fractional order PID (PIλDµ) controller, initially developed by Pudlobny [19,23], has demonstrated remarkable performance in recent years when applied to the control of nonlinear systems [23,24].
It is stated in the reference that the PIλDµ controller provides better control performance and stability for control systems. The difference of the classical PID method compared to the PIλDµ type fractional order method; in fractional order controllers, the derivative and integral order can be any real number [24]. The Dµ controller is commonly expressed as shown in Equation (1).
The transfer function obtained by the Laplace transformation of the above equation is given in Equation (2).
where and express the fractional degree of the derivative and integral terms, respectively. The gain coefficients , and represent the proportional, integral, and derivative gain, respectively.
In this study, a PIλ-controlled DC-DC converter was employed at the output of the PEMFC. The PIλ coefficients were optimized using PSO and GA approaches.
2.4. Particle Swarm Optimization (PSO) and PSO-Based FOPI (PSO-FOPI)
Particle swarm optimization is a method discovered in the mid-1990s by transforming the foraging behavior of flocks of birds or fish into an algorithm, and it was developed by Kennedy and Eberhart [25]. The most important advantage of the PSO method is that it is a simple method for solving complex systems.
It is assumed in the PSO approach that every particle in the swarm represents a potential solution for the optimization problem and that every particle wanders in the solution space. The position of the particle is affected by two parameters. These parameters refer to the optimal location that each individual has ever visited () and the optimal position visited by any individual in the whole group (). The performance of each particle is evaluated using the predetermined cost (fitness) function.
The position () and velocity () of each particle are calculated as stated in Equations (3) and (4) [25].
where and terms are random numbers chosen in the range [0, 1] and the term represents the inertia weight. and are acceleration constants. Additionally, the terms and in the equation refer to the current position and the new particle position, respectively.
The particle’s velocity is constrained to specific boundaries to prevent it from entering into uncontrollably oscillations. Currently, Equation (5) is employed.
In many applications, the PSO approach is used to optimize parameters. The use of the PSO method is often preferred in optimizing the (, , ) parameters for classical PID and (, , , and ) parameters for FOPI (PIλDµ).
The determination of the c1 and c2 coefficients in PSO plays a crucial role in optimizing parameters. That is, the c1 parameter in the conventional PSO approach pulls the particle to its own local best position, while the c2 parameter drives the particle to the global best position. On the other hand, altering the values of c1 and c2 in the PSO-FOPI approach produces four distinct situations: the exploration, the useful, the convergence, and the exclusion. Table 2 explains how to alter the c’s in these situations.

Table 2.
The approach followed for c’s in different situations in PSO-FOPI [26,27,28,29,30].
In the present study, conventional PI and FOPI (PIλ) approaches are utilized to control DC-DC converters. The (Kp, Ki) and (Kp, Ki, and ) parameters are optimized for PI and FOPI (PIλ), respectively. The PSO method is commonly favored when investigating the optimization of these parameters.
2.5. Genetic Algorithm (GA) and GA-Based FOPI (GA-FOPI)
The genetic algorithm (GA) is a widely used method in solving multivariate optimization problems and is a rather complex algorithm that is considered quite difficult among conventional optimization methods based on genetic logic. GA optimizes functions through the modeling of biological processes [31,32], utilizing an evolutionary algorithm. In the field of biology, GA parameters symbolize genes, and the chromosome is composed of the assembled set of parameters. Every chromosome is encoded with binary or decimal number sequences and has a fitness in the solution space. The fitness of the population is maximized or minimized within certain rules. Each new generation is formed via the combination of surviving sequences, which are randomly altered through information changes [32,33]. In executing GA, first the copying process is performed according to the observed performance of the chromosomes in the population. Thus, better chromosomes have a greater chance of producing copies, and these chromosomes are more likely to contribute to the new population [34]. Then, in each generation, GA creates a new population using genetic operators such as crossover and mutation. After a few generations, the population contains members with better fitness. GA involves coding solutions, calculating fitness, and applying proliferation, crossover, and mutation operators [35]. GA starts the optimization process with a randomly generated population containing chromosomes that could be a possible solution to the problem [36]. As in other optimization methods, the objective function, parameters, and limits are defined in GA. The algorithm ends by checking convergence in the same way [37].
In this study, conventional PI and FOPI (PIλ) approaches are utilized to control DC-DC converters. The (Kp, Ki) and (Kp, Ki, and ) parameters are optimized for PI and FOPI (PIλ), respectively. In this study, the GA method was preferred for optimization of parameters.
2.6. Fitness Functions (ITAE, ISTE, and IAE)
For the optimizer, the integral of square time error (ISTE), integral of absolute error (IAE), and integral of time absolute error (ITAE) were chosen as the fitness/objective functions. The most ideal values were determined by minimizing the errors for the deviation in the route. The theoretical expressions of the objective functions are given in Table 3.

Table 3.
Expression of the fitness/objective functions used in this study.
As can be seen from Table 3, is the error and can be expressed as , where denotes the reference voltage and represents the output voltage of the DC/DC converter.
2.7. Proposed Model
In this article, the control of the DC/DC converter was carried out using conventional PI controllers, PSO-based PI controllers, PSO-based FOPI controllers, GA-based PI controllers, and GA-based FOPI controllers in order to improve the performance of PEMFC. The simulink model proposed in this study is given in Figure 3. As seen in figure, hydrogen consumption [L/min] and oxygen air flow [m3/s] are taken as the input for the PEMFC. The parameter values and V/I characteristic of the PEMFC model employed in this study are depicted in Figure 4.
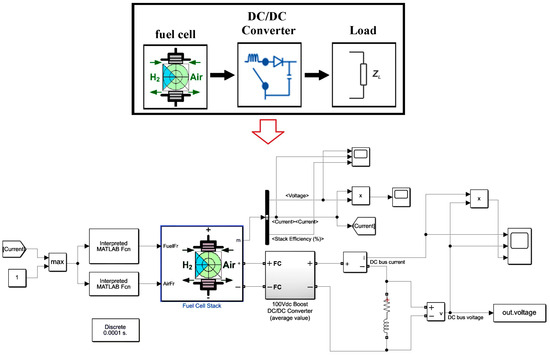
Figure 3.
The simulink model proposed in this study.
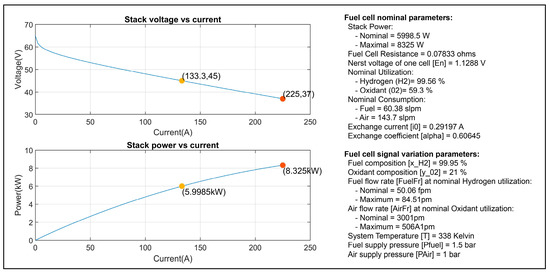
Figure 4.
PEMFC model parameters and V/I characteristic used in this study.
Maximum efficiency is achieved when a fuel cell is loaded with a load in the range of 70% to 80% [32]. For that reason, a 6 kW fuel cell was used in this study and the system load was selected as 4.5 kW with a 75% loading rate. A constant RL load is taken as ZR = 4.5 kΩ and ZL = 4500 Ω.
The DC voltage value obtained at the output of the PEMFC was applied to the input of the DC/DC converter. Figure 5 illustrates the simulink sub-model that was used for the DC/DC converter. As can be seen from the figure, two types of controllers such as PI and PIλ are employed for a DC/DC converter and the parameters of them are optimized with PSO and GA methods. In determining the optimum values, the process steps shown in Figure 6 are repeated for each fitness function such as IAE, ITAE, and ISTE.
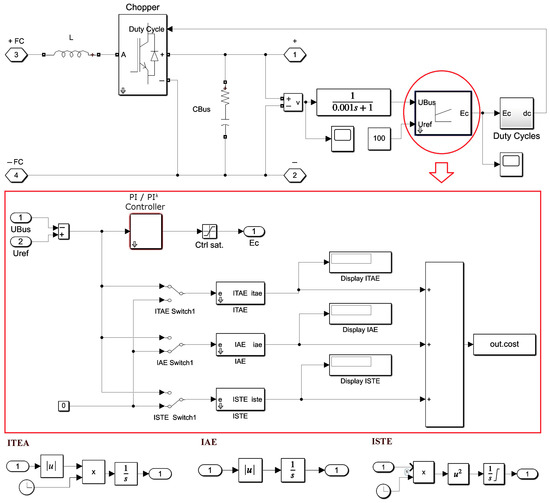
Figure 5.
PI- and PIλ-controlled DC/DC converter simulink sub-model.
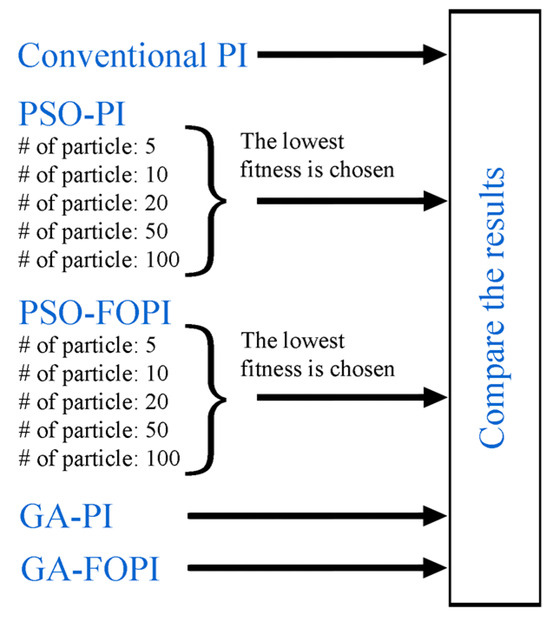
Figure 6.
Process steps applied for each fitness function in determining optimum values.
3. Results
In this paper, the control of a DC/DC converter was carried out using conventional PI, PSO-PI, PSO-FOPI, GA-PI, and GA-FOPI controllers in order to improve the performance of PEMFC. This section presents the results of the applications.
For the conventional PI application, the empirical technique was used to determine the parameters of PI values, resulting in Kp = 0.001 and Ki = 0.15.
PSO-PI application: The PI coefficients (Kp, Ki) were determined via the PSO method in this application. It has been observed in our PSO studies that changing the position of the particles in the swarm with 100 iterations increases the potential for producing the optimum solution. Therefore, in our entire article, all PSO applications were executed with 100 iterations. The other parameter values chosen in the PSO algorithm for each fitness function are acceleration constants such as c1 and c2 being 2 and inertia weight (w) being 1. The PSO method was employed with these parameters for the swarms having 5, 10, 20, 50, and 100 particles.
PSO-FOPI application: In this application, the DC/DC converter was controlled with a fractional-order PIλ controller and the parameters of the controller were determined with PSO. The parameter values used in the previous PSO application were repeated here as well. Only three parameter values (Kp, Ki, and λ) were optimized in this application, not just two.
GA-PI and GA-FOPI applications: The (Kp, Ki) and (Kp, Ki, and λ) parameters were optimized for PI and FOPI (PIλ), respectively, in MATLAB. In this study, the GA method was preferred for the optimization of parameters and the chosen parameters/functions are as follows: crossover fraction is 0.8, mutation function is Gaussian, selection function is @selectionstochunif, population size is 50, and migration direction and fraction are forward and 0.2, respectively.
In this study, we tried to determine the lowest values of the fitness functions (IAE, ITAE, and ISTE). Parameter values corresponding to the minimum value obtained were accepted as optimum values. Since three different fitness/object functions (IAE, ITAE, ISTE) were used in this study, the results obtained are explained under three different subheadings.
3.1. Results Obtained with IAE
The procedures outlined in Figure 6 were used for obtaining the findings with the IAE fitness function. The results obtained with the specified steps are shown in Figure 7. As seen in the figure, PSO-PI and PSO-FOPI applications were tested with 5, 10, 20, 50, and 100 particles in 100 iterations. The particles with the lowest fitness function were determined. In the PSO-PI study, the lowest fitness function value was obtained with 100 particles, while in the PSO-FOPI study, the lowest fitness function value was obtained with 20 particles. In the next stage, the optimum values obtained with PSO-PI and PSO-FOPI were compared with the optimum values obtained with other approaches (conventional PI, GA-PI, and GA-FOPI). Using the optimum controller coefficients determined by the proposed methods, the output voltage changes of the system were observed and compared.
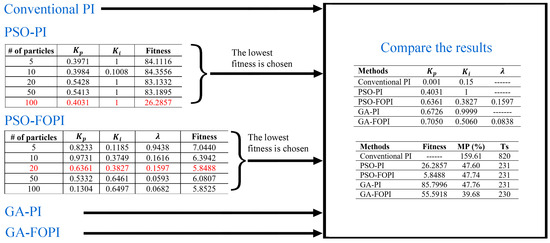
Figure 7.
Results obtained with fitness function IAE.
The optimum parameter values determined using the proposed methods (PSO-PI, PSO-FOPI, GA-PI, and GA-FOPI) for the controllers were determined using the fitness function IAE. As shown in Figure 7, determined optimum parameters were also listed with fitness function, maximum overshoot percent (MP%), and settling time (Ts) for each method. It can be observed that the suggested approaches outperform the conventional PI method when taking into account the MP% and Ts values. Specifically, it was noted that the GA-FOPI approach yielded the best performance, with MP% = 39.68.
The voltage changes that were achieved at the system output with determined optimal parameters are shown in Figure 8. As seen from the figure, two points stand out in the voltage changes obtained using the methods. These are the MP% value and voltage oscillations at the initial stage. The overshoot value at system startup is directly proportional to the power consumption. According to this correlation, while a power consumption much higher than the nominal value is observed with the conventional PI approach at the initial stage, it is seen that the power consumption is lower with other proposed methods. The MP% values obtained at the end of the study are as follows: 159.61 V for conventional PI, 47.60 V for PSO-PI, 47.74 V for PSO-FOPI, 47.76 V for GA-PI, and 39.68 V for GA-FOPI. On the other hand, when we consider the change in output voltage, the largest oscillation was seen in the traditional PI approach (var 898.22, std 29.97). The observed values of the proposed methods are: (var 26.29, std 5.13) for PSO-PI, (var 85.80, std 9.26) for PSO-FOPI, (var 85.80, std 9.26) for GA-PI, and (var 55.59, std 7.46) for GA-FOPI. The presence of fluctuation might be read as the determined parameters not being at the optimal value but having reached a certain point. While the best performance according to MP% value was obtained with the GA-FOPI method, the best performance according to (var, std) values was obtained with the PSO-PI method.
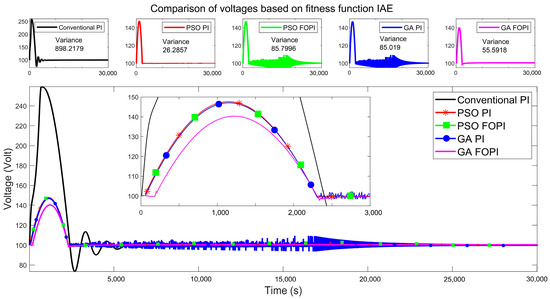
Figure 8.
Comparison of voltages based on fitness function IAE.
While the coefficient of variation () itself may not be a direct indicator of robustness in a control system, variations in system parameters or disturbances could influence the performance of the system. In some cases, a system with low CV may be more robust to variations in parameters or disturbances, as it suggests a more consistent performance. So, the CV could be used as a measure of the relative magnitude of variability in the system’s response or output [38]. In this context, the CV values obtained are as follows: CV = 27.99 for traditional PI, CV = 5.09 for PSO-PI, and CV = 7.29 for GA-FOPI.
Figure 9 illustrates the voltage–current–power relationship, allowing for a clearer distinction between conventional PI and GA-FOPI. The changes in the conventional PI and GA-FOPI method are shown in Figure 9a,b, respectively. As seen in Figure 9a, since the voltage change at the system output obtained with conventional PI is in a wide band, the band range of the required power according to the change of current is wide. On the other hand, the proposed GA-FOPI method ensured that the voltage change at the system output was in a narrow band (Figure 9b). It is desirable for the voltage change to be in a narrow band range. This condition appears to be successfully achieved with GA-FOPI. In Figure 9c, for example, the voltage changes are displayed in different colors on the same graph to compare IAE-based approaches (conventional PI and GA-FOPI). It has been observed that, due to overshoot, the conventional PI works in a wide voltage band such as [73.52 259.40], while the GA-FOPI method operates in a narrow band such as [97.5 140.3].
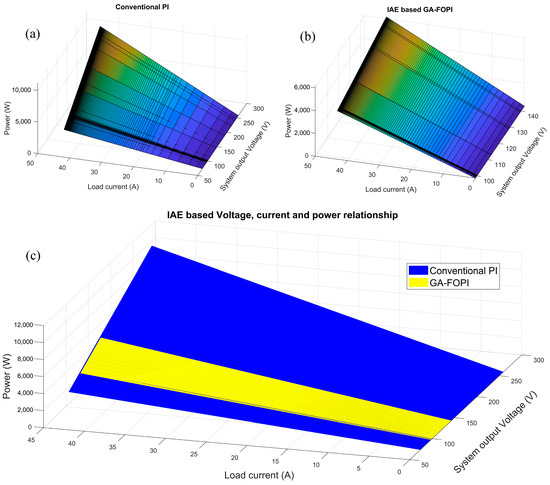
Figure 9.
Voltage–current–power relationship based on IAE (a) for conventional PI, (b) for GA-FOPI, (c) for both conventional PI and GA-FOPI.
3.2. Results Obtained with ITAE
The procedures described in Figure 6 were employed to acquire the results using the ITAE fitness function. Figure 10 presents the outcomes attained by following the given procedures. As in the previous analysis, PSO-PI and PSO-FOPI applications were tested with 5, 10, 20, 50, and 100 particles in 100 iterations. Particles with the lowest fitness function were determined. In the PSO-PI study, the lowest fitness function value was obtained with 100 particles, while in the PSO-FOPI study, the lowest fitness function value was obtained with 20 particles. Subsequently, the optimum findings from PSO-PI and PSO-FOPI were compared with the optimum outcomes from the other methods (conventional PI, GA-PI, and GA-FOPI).
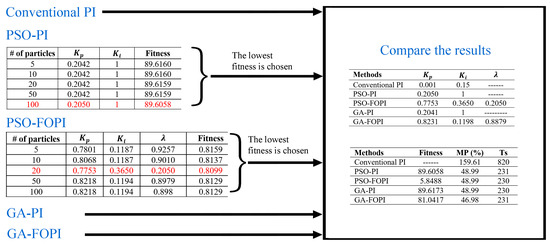
Figure 10.
Results obtained with fitness function ITAE.
The optimum parameter values for the controllers were determined using the fitness function ITAE. As shown in Figure 10, it can be observed that the suggested approaches outperform the conventional PI method when taking into account the MP% and Ts values. Specifically, it was noted that the GA-FOPI approach yielded the best performance, with MP% = 46.98.
The voltage changes that were achieved at the system output with these optimal parameters are shown in Figure 11. The MP% and oscillation parameters considered within the scope of the IAE fitness function are also taken into account in this section. While a power consumption much higher than the nominal value is observed with the conventional PI approach in the initial stage, it is seen that the power consumption is lower during the system startup with other proposed methods such as PSO-PI, PSO-FOPI, GA-PI, and GA-FOPI. The MP% values at system startup associated with ITAE are as follows: conventional PI 159.61V, PSO-PI 48.99V, PSO-FOPI 48.99V, GA-PI 48.99V, and GA-FOPI 46.98V. As in the previous application, when we consider the output voltage change, the observed values of the proposed methods are: (var 898.22, std 29.97) for traditional PI, (var 89.60, std 9.46) for PSO-PI, (var 89.62, std 9.47) for PSO-FOPI, (var 89.62, std 9.47) for GA-PI, and (var 81.03, std 9.00) for GA-FOPI. The best performance according to MP% and (var, std) criteria was obtained with the GA-FOPI method. However, if we consider the issue in the context of robustness, the best-performing GA-FOPI approach yielded a CV of 8.80, while the traditional PI method produced a CV of 27.99. Based on these parameters, the optimal outcome, however marginally, was once again achieved with GA-FOPI. To illustrate the distinction between conventional PI and GA-FOPI, Figure 12 depicts the relationship of V-I-P parameters for the PEMFC system. In Figure 12a,b, the alterations produced by the conventional PI and GA-FOPI approaches are illustrated, respectively. The voltage range seen in fitness function IAE was seen in ITAE. Precisely as a result of overshoot, the conventional PI operates within a broad voltage range, as illustrated in [73.52 259.61], whereas the GA-FOPI method operates within a more limited range, as demonstrated in [98.83 146.94]. For the purpose of comparing ITAE-based methods (Conventional PI and GA-FOPI), the voltage changes are shown in Figure 12c in different colors on the same graph. As can be seen from the figure, the voltage change in a narrower band range is obtained with the proposed GA-FOPI method compared to the conventional PI method.
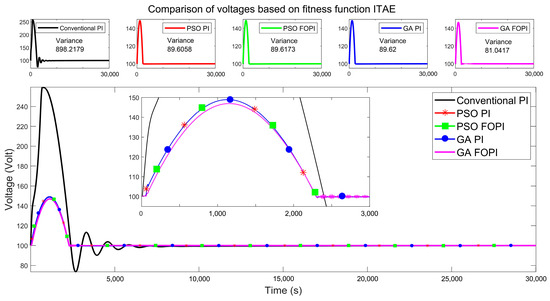
Figure 11.
Comparison of voltages based on fitness function ITAE.
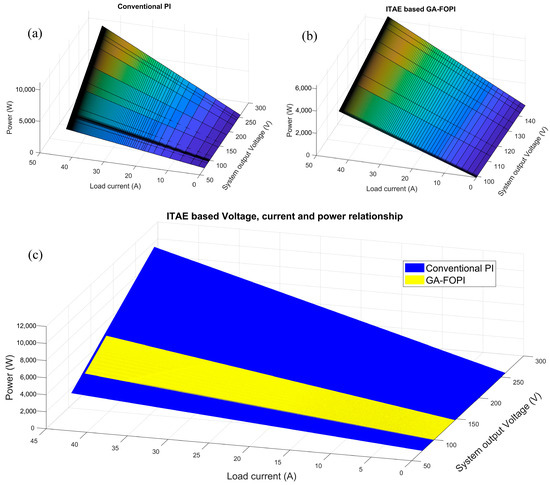
Figure 12.
Voltage–current–power relationship based on ITAE (a) for conventional PI, (b) for GA-FOPI, (c) for both conventional PI and GA-FOPI.
3.3. Results Obtained with ISTE
As in previous applications, the procedure described in Figure 6 was used to obtain results using the ISTE fitness function. The results obtained by following the specified procedures are shown in Figure 13.
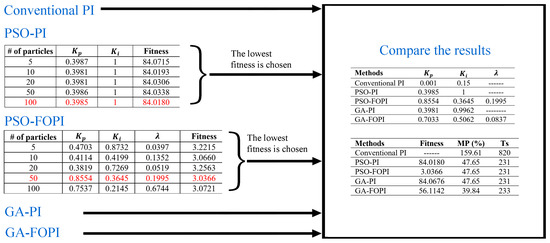
Figure 13.
Results obtained with fitness function ISTE.
The optimum parameter values for the controllers were determined using the fitness function ISTE. The ISTE fitness function was used to calculate the optimum parameter values for the controllers. Figure 13 shows that the proposed alternatives outperform the conventional PI method when MP% and Ts values are considered. Specifically, the GA-FOPI technique produced the greatest results, with MP% = 39.84.
The voltage changes that were achieved at the system output with these optimal parameters is shown in Figure 14. The overshoot and oscillation parameters mentioned in the previous IAE and ITAE fitness functions are also taken into account in this section. In the early stage, the conventional PI methodology is seen to have a power consumption substantially higher than the nominal value; nevertheless, proposed approaches such as PSO-PI, PSO-FOPI, GA-PI, and GA-FOP show a lower power consumption. The overshoot values at system startup determined via ISTE are as follows: conventional PI 159.61V, PSO-PI 47.65V, PSO-FOPI 47.65V, GA-PI 47.65V, and GA-FOPI 39.84V. As in the previous applications, when we consider the change in output voltage, the observed values of the proposed methods are: (var 898.22, std 29.97) for traditional PI, (var 84.01, std 9.16) for PSO-PI, (var 84.06, std 9.16) for PSO-FOPI, (var 84.06, std 9.17) for GA-PI, and (var 56.11, std 7.49) for GA-FOPI. The best performance according to MP% and (var, std) criteria was obtained with the GA-FOPI method. However, if we consider the issue in the context of robustness, the best-performing GA-FOPI approach yielded a CV of 7.33, while the traditional PI method produced a CV of 27.99. According to these values, GA-FOPI once again produced the best results, but only marginally better than the others. As in the previous sections, the voltage–current–power relationship is shown in Figure 15 to better see the difference between conventional PI and GA-FOPI. The changes in the conventional PI and GA-FOPI method are shown in Figure 15a,b, respectively. In Figure 15c, the changes are shown together to see the difference more clearly. As can be seen from the Figure 15c, the voltage change in a narrower band range is obtained with the proposed GA-FOPI method compared to the conventional PI method. Due to overshoot, conventional PI operates in a wide voltage band [73.52 259.61], but GA-FOPI works in a tight band [97.42 140.46]. The voltage range that was seen in fitness functions IAE and ITAE was observed in ISTE as well.
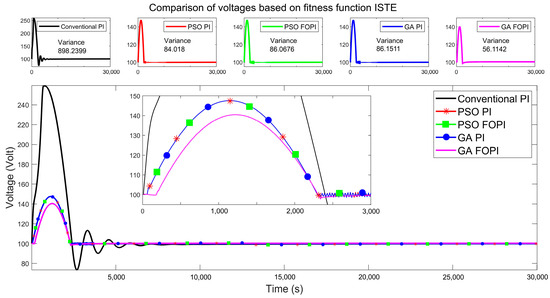
Figure 14.
Comparison of voltages based on fitness function ISTE.
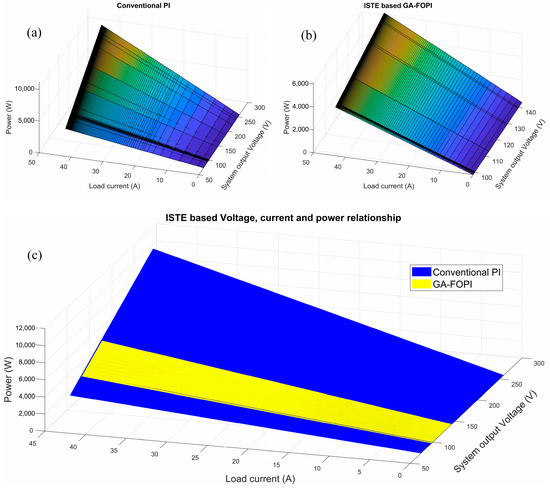
Figure 15.
Voltage–current–power relationship based on ISTE (a) for conventional PI, (b) for GA-FOPI, (c) for both conventional PI and GA-FOPI.
3.4. Interpretations of the Findings
When we examine the system outputs obtained using optimum parameters, possible inferences are listed below.
- -
- This study consists of roughly two stages. The proposed methods (PSO-PI, PSO-FOPI, GA-PI, and GA-FOPI) were applied in the first stage, and the fitness function was utilized to identify the optimum parameters. In the second stage, the best of the proposed method was determined by using maximum overshoot percent (MP%) and time settling (Ts) criteria. It has been observed that the overshoot parameter is effective in determining the best-performing method.
- -
- While the settling time (Ts) values of the proposed methods for all three fitness functions were observed in the [230 233] band range, a value of 820 was found using the conventional PI method.
- -
- It has been shown that the GA-FOPI method performs slightly better than the other approach while taking into account the fitness function, maximum overshoot percent (MP%) and settling time (Ts) criteria.
- -
- Applying the proposed methods to the system produced voltage oscillations at the output, allowing variance and standard deviation calculations. It was determined that the GA-FOPI method, which showed the best performance, had the lowest MP% for all three fitness functions. Namely, MP% = 39.68 for IAE, MP% = 46.98 for ITAE, and MP% = 39.84 for ISTE.
- -
- The findings indicate that the performance achieved through the implementation of the PSO-PI, PSO-FOPI, GA-PI, and GA-FOPI methodologies is much better compared to that of the conventional PI approach for fitness functions such as IAE, ISTE, and ITAE.
- -
- The overshoot value at system startup is directly proportional to the power consumption. According to this correlation, while a power consumption much higher than the nominal value is observed with the conventional PI approach during system startup, it is seen that the power consumption is lower with other proposed methods such as PSO-PI, PSO-FOPI, GA-PI, and GA-FOPI.
- -
- The CV value, an indicator of the relative magnitude of variability in the system’s response or output, was computed for the conventional PI method and the highest-performing model before being contrasted. Thus, it is possible to conclude that the proposed method has the potential to be more robust.
4. Conclusions
In this article, the control of the DC/DC converter was carried out using conventional PI, PSO-PI, PSO-FOPI, GA-PI, and GA- FOPI controllers in order to improve the performance of PEMFC. IAE, ISTE, and ITAE were employed as fitness functions in the developed simulink models and the system outputs with optimum parameters were compared.
Fitness function value, maximum overshoot percent, and settling time were utilized as metrics to compare the performances of the methods. This study consists of roughly two stages. The proposed methods (PSO-PI, PSO-FOPI, GA-PI, and GA-FOPI) were applied in the first stage, and the fitness function was utilized to identify the optimum parameters. In the second stage, the best of the proposed method was determined by using maximum overshoot percent and time settling criteria. In the second stage, when the maximum overshoot percent and settling time criterion were taken into consideration, the fitness functions obtained from IAE and subsequently ISTE demonstrated the highest level of performance. The research outcomes indicate that the performances of the PSO-PI, PSO-FOPI, GA-PI, and GA-FOPI approaches, which were proposed, are higher than that of the conventional PI approach. When considering the overshoot parameter, it is evident that the conventional PI methodology results in a power consumption significantly greater than the nominal value during system startup. Conversely, the proposed methods provide reduced power consumption. The observed result is consistent with the findings reported in the literature. In addition, it is confirmed in this study that the PSO, GA, and FOPI methods preferred in the literature exhibit good performance in optimization studies. The simulation result also shows that the PEMFC model having two inputs, hydrogen consumption and oxygen air flow, with conventional PI and FOPI (PIλ) controllers where the controller parameters are tuned using PSO and GA has acceptable control performance.
Future research will involve the development and application of the methodologies that were provided in this study to a variety of diverse systems.
Funding
This research received no external funding.
Data Availability Statement
Data are contained within the article.
Conflicts of Interest
The author declares no conflicts of interest.
References
- Shi, D.; Cai, L.; Zhang, C.; Pan, D.C.Z.; Kang, Z.; Liu, Y.; ve Zhang, J. Fabrication methods, structure design and durability analysis of advanced sealing materials in proton exchange membrane fuel cells. Chem. Eng. J. 2023, 454, 139995. [Google Scholar] [CrossRef]
- Laurencelle, F.; Chahine, R.; Hamelin, J.; Agbossou, K.; Fournier, M.; Bose, T.K. Characterization of a Ballard MK5-E proton exchange membrane fuel cell stack. Fuel Cells J. 2001, 1, 66–71. [Google Scholar] [CrossRef]
- Singh, S.; Tayal, V.K.; Singh, H.P.; Yadav, V.K. Dynamic Performance Enhancement of PEM Fuel Cell Using PSO Optimized Fractional Order PI Controller. Suranaree J. Sci. Technol. 2022, 29, 1–9. [Google Scholar]
- Johnson, M.A.; Moradi, M.H.; Crowe, J.; Tan, K.K.; Lee, T.H.; Ferdous, R.; Katebi, M.R.; Huang, H.P.; Jeng, J.C.; Tang, K.S.; et al. PID Control: New İdentification and Design Methods; Springer: London, UK, 2005. [Google Scholar] [CrossRef]
- Lopez-Sanchez, I.; Moreno-Valenzuela, J. PID control of quadrotor UAVs: A survey. Annu. Rev. Control 2023, 56, 100900. [Google Scholar] [CrossRef]
- Pruthiraj, S.; Debashisha, J. PID control design for the pressure regulation of PEM fuel cell. In Proceedings of the 2015 International Conference on Recent Developments in Control, Automation and Power Engineering (RDCAPE), Noida, India, 12–13 March 2015; pp. 286–291. [Google Scholar] [CrossRef]
- Qi, Z.; Tang, J.; Pei, J.; Shan, L. Fractional controller design of a DC-DC converter for PEMFC. IEEE Access 2020, 8, 120134–120144. [Google Scholar] [CrossRef]
- Singh, S.; Tayal, V.K.; Singh, H.P.; Yadav, V.K. Design of PSO-tuned FOPI & Smith predictor controller for nonlinear polymer electrolyte membrane fuel cell. Energy Sources Part A Recovery Util. Environ. Eff. 2022, 1–22. [Google Scholar] [CrossRef]
- Singh, S.; Tayal, V.K.; Singh, H.P.; Yadav, V.K. Dynamic performance improvement of proton exchange membrane fuel cell system by robust loop shaping and artificial intelligence optimized fractional order PI controllers. Energy Sources. Energy Sources Part A Recovery Util. Environ. Eff. 2023, 45, 9308–9324. [Google Scholar] [CrossRef]
- Gao, Z.; Wei, J.; Liang, C.; Yan, M. Fractional-order particle swarm optimization. In Proceedings of the 26th Chinese Control and Decision Conference (2014 CCDC), Changsha, China, 31 May–2 June 2014; pp. 1284–1288. [Google Scholar] [CrossRef]
- Routh, A.; Ghosh, S.; Rahaman, M. Ghosh Fractional PIλDµ controller design for non-linear PEM fuel cell for pressure control based on a genetic algorithm. Indian Chem. Eng. 2023, 65, 125–142. [Google Scholar] [CrossRef]
- Kumar, H.; Gupta, B.; Singh, P.; Sandhu, A. Genetic algorithm-based higher-order model reduction of proton exchange membrane fuel cell. Int. J. Energy Res. 2022, 46, 24197–24207. [Google Scholar] [CrossRef]
- Fathy, A.; Rezk, H.; Alanazi, T.M. Recent Approach of Forensic-Based Investigation Algorithm for Optimizing Fractional Order PID-Based MPPT with Proton Exchange Membrane Fuel Cell. IEEE Access 2021, 9, 18974–18992. [Google Scholar] [CrossRef]
- Sun, L.; Jin, Y.; You, F. Active disturbance rejection temperature control of open-cathode proton exchange membrane fuel cell. Appl. Energy 2020, 261, 114381. [Google Scholar] [CrossRef]
- Dini, P.; Ariaudo, G.; Botto, G.; Greca, F.L.; Saponara, S. Real-time electro-thermal modelling and predictive control design of resonant power converter in full electric vehicle applications. İET Power Electron. 2023, 16, 2045–2064. [Google Scholar] [CrossRef]
- Dini, P.; Saponara, S.; Chakraborty, S.; Hosseinabadi, F.; Hegazy, O. Experimental characterization and electro-thermal modeling of double side cooled SIC MOSFETs for accurate and rapid power converter simulations. IEEE Access 2023, 11, 79120–79143. [Google Scholar] [CrossRef]
- Yu, D.; Duan, C.; Gu, B. Design and evaluation of a novel plan for thermochemical cycles and PEM fuel cells to produce hydrogen and power: Application of environmental perspective. Chemosphere 2023, 334, 138935. [Google Scholar] [CrossRef]
- Kraytsberg, A.; Ein-Eli, Y. Review of Advanced Materials for Proton Exchange Membrane Fuel Cells. Energy Fuels 2014, 28, 7303–7330. [Google Scholar] [CrossRef]
- Hirschenhofer, J.H. Fuel cell status: 1996. IEEE Aerosp. Electron. Syst. Mag. 1997, 12, 23–28. [Google Scholar] [CrossRef]
- Gilani, I.H.; Amjad, M.; Khan, S.S. PEMFC application through coal gasification along with cost-benefit analysis: A case study for South Africa. Energy Explor. Exploit. 2021, 39, 1551–1587. [Google Scholar] [CrossRef]
- Hart, D.W. Power Electronics, 1st ed.; McGraw-Hill: New York, NY, USA, 2010; pp. 196–264. [Google Scholar]
- Guldemir, H. Study of Sliding Mode Control of DC-DC Buck Converter. Energy Power Eng. 2011, 3, 401–406. [Google Scholar] [CrossRef]
- Hong-bo, M.; Quan-yuan, F. Optimized PID Controller Design for Buck DC-DC Switching Converters. Sch. Inf. Sci. Technol. Jiaotong Univ. 2008, 12, 640–643. [Google Scholar]
- Zhuang, M.; Atherton, D.P. Automatic tuning of optimum PID. IEE Proc. D–Control. Theory Appl. 1993, 140, 216–224. [Google Scholar] [CrossRef]
- Podlubny, I. Fractional-order systems and PI/sup/spl lambda//D/sup/spl mu//-controllers. IEEE Trans. Autom. Control 1999, 44, 208–214. [Google Scholar] [CrossRef]
- Kennedy, J.; Eberhart, R.C. Particle swarm optimization. IEEE IJCNN 1995, 4, 1942–1948. [Google Scholar]
- Padula, F.; Visioli, A. Tuning rules for optimal PID and fractional-order PID controllers. J. Process Control 2011, 21, 69–81. [Google Scholar] [CrossRef]
- Luo, Y.; Chen, Y.Q.; Wangc, C.Y.; Pi, Y.G. Tuning fractional order proportional integral controllers for fractional order systems. J. Process Control 2010, 20, 823–831. [Google Scholar] [CrossRef]
- Petras, I. Control Quality Enhancement by Fractional Order Controllers. Acta Montan. Slovaca 1998, 3, 143–148. [Google Scholar]
- Shi, Y.; Eberhart, R.C. A modified particle swarm optimizer. In Proceedings of the IEEE Internation Conference on Evolutionary Computation, Anchorage, AK, USA, 4–9 May 1998; pp. 69–73. [Google Scholar]
- Pahnehkolaei, S.M.A.; Alfib, A.; Machado, J.A.T. Analytical stability analysis of the fractional-order particle swarm optimization algorithm. Chaos Solitons Fractals 2022, 155, 111658. [Google Scholar] [CrossRef]
- Mazumder, P.; Runick, E.M. Genetic Algorithm for VLSI Design, Layout & Test Automation; Prentice Hall PTR: Hoboken, NJ, USA, 1999. [Google Scholar]
- Goldberg, D.E. Genetic Algorithms in Search, Optimization and Machine Learning; Addison Wesley Publishing Company Inc.: Boston, MA, USA, 1989. [Google Scholar]
- Holland, J.H.; Miller, J.H. Artificial Adaptive Agents in Economic Theory. Am. Econ. Rev. 1991, 81, 365–370. [Google Scholar]
- Haupt, R.L.; Haupt, S.E. Practical Genetic Algorithms, 2nd ed.; Wiley-Interscience Publication: Hoboken, NJ, USA, 2004. [Google Scholar]
- Öztürk, N.; Çelik, E. Application of Genetic Algorithms to Core Loss Coefficient Extraction. Prog. Electromagn. Res. M 2011, 19, 133–146. [Google Scholar] [CrossRef]
- Çetin, E.; Yiğit, T. Genetic Algorithm Based On-line Tuning of a PI Controller for a Switched Reluctance Motor Drive. Electr. Power Compon. Syst. 2007, 35, 675–691. [Google Scholar]
- Fan, R.; Chang, G.; Xu, Y.; ve Zhang, Y. Investigating the transient electrical behaviors in pem fuel cells under various platinum distributions within cathode catalyst layers. Appl. Energy 2024, 359, 122692. [Google Scholar] [CrossRef]
Disclaimer/Publisher’s Note: The statements, opinions and data contained in all publications are solely those of the individual author(s) and contributor(s) and not of MDPI and/or the editor(s). MDPI and/or the editor(s) disclaim responsibility for any injury to people or property resulting from any ideas, methods, instructions or products referred to in the content. |
© 2024 by the author. Licensee MDPI, Basel, Switzerland. This article is an open access article distributed under the terms and conditions of the Creative Commons Attribution (CC BY) license (https://creativecommons.org/licenses/by/4.0/).