Article

Multivariable Algorithm Using Signal-Processing Techniques to Identify Islanding Events in Utility Grid with Renewable Energy Penetration

1
Institute of Automotive Engineers, Hubei University of Auomotive Technology, Shiyan 442002, China
2
Hanjiang Water Resources and Hydropower (Group) Co., Ltd. Hydropower Company, Shiyan 442002, China
*
Author to whom correspondence should be addressed.
These authors contributed equally to this work.
Energies 2024, 17(4), 877; https://doi.org/10.3390/en17040877
Submission received: 22 November 2023 / Revised: 25 December 2023 / Accepted: 28 December 2023 / Published: 14 February 2024

Abstract

:
This paper designs a multi-variable hybrid islanding-detection method (HIDM) using signal-processing techniques. The signals of current captured on a test system where the renewable energy (RE) penetration level is between 50% and 100% are processed by the application of the Stockwell transform (ST) to compute the Stockwell islanding-detection factor (SIDF) and the co-variance islanding-detection factor (CIDF). The signals of current are processed by the application of the Hilbert transform (HT), and the Hilbert islanding-detection factor (HIDF) is computed. The signals of current are also processed by the application of the Alienation Coefficient (ALC), and the Alienation Islanding Detection Factor (AIDF) is computed. A hybrid islanding-detection indicator (HIDI) is derived by multiplying the SIDF, CIDF, AIDF, and an islanding weight factor (IWF) element by element. Two thresholds, designated as the hybrid islanding-detection indicator threshold (HIDIT) and the hybrid islanding-detection indicator fault threshold (HIDIFT), are selected to detect events of islanding and also to discriminate such events from fault events and operational events. The HIDM is effectively tested using an IEEE-13 bus power network, where solar generation plants (SGPs) and wind generation plants (WGPs) are integrated. The HIDM effectively identified and discriminated against events such as islanding, faults, and operational. The HIDM is also effective at identifying islanding events on a real-time distribution feeder. The HIDM is also effective at detecting islanding events in the scenario of a 20 dB signal-to-noise ratio (SNR). It is established that the HIDM has a small non-detection zone (NDZ). The effectiveness of the HIDM is better relative to the islanding-detection method (IDM) supported by the discrete wavelet transform (DWT), an IDM using a hybridization of the slantlet transform, and the Ridgelet probabilistic neural network (RPNN). An IDM using wavelet transform multi-resolution (WT-MRA)-based image data and an IDM based on the use of a deep neural network (DNN) were used. The study was performed using the MATLAB software (2017a) and validated in real-time using the data collected from a practical distribution power system network.

1. Introduction

Globally, renewable energy (RE) is integrated into utility grids to meet future energy demand due to the depletion of fossil fuels, the price fluctuations of oil and natural gas, and the adverse impact of these energy sources on the environment. RE sources include mini or micro hydroelectric plants, wind generation plants (WGPs), solar photovoltaic (PV) plants, fuel cells, geothermal energy, and biomass energy [1]. These RE sources are integrated into the utility grid in the form of large plants and distributed generators (DGs). DGs are connected to the grid network near the load center. A condition or operating scenario in which a part of the utility network remains connected to one or more DGs where the load is still energized by the DGs and, at the same time, is isolated from the main grid is called islanding [2]. Islanding may be intentional (pre-planned) for the condition of load shedding and during the maintenance period to the ensure security and protection of the power system from cascade failure. Another form of islanding is unintentional, which is initiated because of a fault or the failure of equipment. This may create problems regarding power quality (PQ), grid safety, and stability [3]. Unintentional islanding events are undesirable and need to be identified as soon as they occur in the network. Different islanding-detection techniques have been developed, which are mainly categorized into two categories: remote (communication-based) islanding and local islanding-detection methods [4].

1.1. Review of Literature

A comprehensive review of the methods used for islanding events and a comparative study of passive, active, and hybrid islanding-detection methods (IDMs) are included in [5]. This study detailed the types of islanding methods. Local IDM methods such as passive, active, and hybrid were described. Remote IDMs, including the power line signaling scheme, transfer trip scheme, and impedance insertion method, were elaborated in detail. Different international standards for islanding detection were also discussed. A comparative study of local and remote IDMs considering the working principle, response time, non-detection zone (NDZ), maloperation possibility of IDMs, cost, impact on power quality (PQ), and multiple RE generators was presented, which is effective at selecting an IDM suitable for a particular grid topology and quantum of generation. In [6], the authors designed a predictive Goertzel model algorithm for active islanding detection with solar PV plants. This algorithm used the discrete Fourier transform (DFT) to resolve the issue of the non-detection zone (NDZ). This method obtains results at a minimum computation time considering the N+2 number of operations. However, to ensure high efficiency, additional 2N+1 operations are also required. It performed this by calculating the magnitude and phase of a particular frequency in discrete form. Hence, the performance of the IDM is dependent on the method of approximation. In [7], the authors designed an IDM that leveraged the micro phasor measurement unit ( μ P M U ) to detect islanding events with the minimum chance of a cyber attack. However, the working of the μ P M U is mainly dependent on the communication network used to transmit the data. This communication network is prone to cyber attacks, which is the drawback of this method. This requires additional steps in the treatment of the data, which increase the computational time and burden. This IDM effectively used the difference in the angle between the positive and negative sequence components to detect islanding events. In [8], the authors presented a secured-communication-based passive anti-islanding technique. This IDM uses the phase angle difference of the information related to the superimposed impedance at the point of the DG connection and the point of common coupling (PCC). This method is effective at detecting islanding conditions even with low power mismatches and distinguishing islanding events from fault and switching events. This IDM is fast, free from fixed threshold settings, easy to implement, and securely discriminates the island from the fault, as well as the switching events. However, due to the use of communication channels, the cost of the IDM’s implementation is high. In [9], the authors proposed a hybrid passive–active systematic methodology for the detection of islanding events. This IDM is effective at overcoming the drawbacks of the passive IDM. A fuzzy classifier for different circumstances, including the NDZ, is effectively used in this method. This IDM has high accuracy, is robust and fast, and can be easily implemented for inverter-based RE generators. This IDM is effective at maintaining the quality of power. However, in instances where the fuzzy rule fails to detect the islanding, the active mode of the inverter starts and reactive power injection is initiated. In [10], the authors presented a detailed study on the analysis and verification of IDMs for grid-integrated PV plants. This method is effective against false-positive detection due to the transients injected into the grid from outside sources.

1.2. Research Gaps

After a detailed analysis of the existing literature, it is seen that the performance of IDMs based on the use of one type of mathematical formulation suffers from any one of the demerits such as low efficiency, a high NDZ, false tripping, failure when external transients are available, etc. The performance of these IDMs might be improved by a hybrid combination of the signal analysis methods, which is the research objective for this paper.

1.3. Research Contributions

The following are the research contributions:
  • An HIDM based on the hybrid combination of the ST, HT, and ALC is designed. This considers the processing of the current signals using the ST to compute the SIDF and CIDF. Currents are also processed using the HT and ALC to compute the HIDF and AIDF, respectively. The SIDF, CIDF, HIDF, AIDF, and IWF are multiplied to compute the HIDI. This HIDM combines the merits of the ST, HT, and ALC, which resulted in the following merits of the proposed HIDM:
    -
    The HIDM is effective at detecting islanding conditions and discriminating these events, fault events, and the operational conditions using the threshold HIDIT and HIDIFT
    -
    The HIDM is effective at detecting the islanding condition in the availability of the noise of 20 dB SNR.
    -
    The HIDM has a small non-detection zone.
    -
    The performance of the HIDM is not affected even with a 100% RE penetration level. However, the performance of the HIDM considering individual applications of either of the ST, HT, or ALC deteriorate when the RE penetration level increases above 50%.
  • The HIDM was effectively tested on an IEEE-13 node network with a 50% and 100% contribution in the generation mix from RE plants (both solar and wind).
  • The HIDM can effectively be used to identify the islanding conditions in a real-time distribution feeder of a practical utility grid.
  • The performance of the HIDM is better relative to an IDM considering the DWT, an IDM using a combination of the slantlet transform and RPNN, an IDM using the wavelet transform multi-resolution (WT-MRA)-based image data, and an IDM based on the use of a Deep Neural Network (DNN).

1.4. Structure of the Paper

The contents of the paper are organized into nine sections. The Introduction, literature review, background of the research, research gaps, research contribution, and organization of the paper are discussed in Section 1. The test power grid and technical parameters are detailed in Section 2. The HIDM and related mathematical formulations are elaborated in Section 3. Section 4 elaborates on the results and their discussion for the detection of islanding events. The results and discussion for the detection of fault events are elaborated in Section 5. The results and their discussion to detect operational events are elaborated in Section 6. The real-time validation of the HIDM is included in Section 7. The relative performance comparison of the HIDM is elaborated in Section 8. The research work summary and conclusions are included in Section 9.

2. Test Utility Grid

The IEEE-13 node test system, rated at 5 MVA and 4.16 kV, was used to perform the study of islanding event detection in utility networks where a high RE generation mix is available. This was an electric power distribution system that consists of thirteen buses, twelve branches, six loads, and one generator. A generator was implemented to represent a large-area network of power. A solar generation plant (SGP) of a capacity of 1 MW and a wind generation plant (WGP) of a capacity of 1.5 MW were connected to 680 nodes of the test network using the transformers SGP-GT and WGP-GT, respectively. This ensured a 50% and 100% contribution of RE in the generation mix to meet the load demand of the test system. The test system configuration and network topology are described in Figure 1. This test system was integrated into a large-area utility network using a utility grid transformer (UG-T). A distribution feeder transformer (DF-T) was equipped between nodes 633 and 634, which helps to maintain node 634 at 0.48 kV. An island formation switch (IFS) was equipped near node 650, which was used for island formation in the test system. The details of the loads and transformers in the test system are included in Table 1 and Table 2, respectively [11,12]. The SGP was formed by a solar photovoltaic (PV) array, which was formed by the integration of 66 parallel strings. Each string consisted of five modules integrated in series. The SGP plant was integrated into node 680 of the test system using a DC/DC converter, a DC/AC converter, and the SGP-GT. The details of the various components of the SGP and associated equipment are available in [13,14]. The WGP was formed by a doubly fed induction generator (DFIG) and wind mills. The WGP plant was connected to node 680 of the test system with the help of the WGP-GT. The details of the various components of the WGP and associated equipment are available in [15,16]. This test system was modeled using the MATLAB software (2017a).

3. Multi-Variable Hybrid Islanding Detection Method

This section demonstrates the various steps used for the design of the hybrid islanding-detection method (HIDM). A hybrid islanding-detection indicator (HIDI) was designed to recognize the islanding conditions in the utility grid with a high RE mix in the generation. The HIDI also discriminated between islanding events and faulty and operational events. The HIDI was computed using the Hilbert islanding-detection factor (HIDF), the Stockwell islanding-detection factor (SIDF), the covariance islanding-detection factor (CIDF), and the Alienation-Coefficient-based islanding-detection factor (AIDF). The HIDF, SIDF, CIDF, AIDF, and HIDI are elaborated in this section in detail. All the steps of the HIDM to detect and discriminate the islanding events from operational and faulty events are elaborated in Figure 2. The mathematical formulation of all the steps of the HIDM was designed using the MATLAB software.

3.1. Hilbert Islanding-Detection Factor

The HIDF was computed by processing the currents of all the phases using the Hilbert transform (HT). The current of phase A ( i 1 ( τ ) ) was processed using the HT to compute the HIDF for phase A (HIDFA) as detailed below [17]:
H I D F A = 1 π + i 1 ( τ ) ( t τ ) d τ
where t is the time and τ is the sampling time interval. Equation (1) is solved using the convolution of the current signal considering periodic summation [18]. Similarly, the HIDF for phase B (HIDFB) and the HIDF for phase C (HIDFC) were computed by processing the current of phase B ( i 2 ( τ ) ) and the current of phase C ( i 3 ( τ ) ), respectively. The HIDF was computed by taking the arithmetic mean of the HIDFA, HIDFB, and HIDFC as detailed below:
H I D F = H I D F A + H I D F B + H I D F C 3

3.2. Stockwell Islanding-Detection Factor

The SIDF was obtained by processing the currents of all the phases using the Stockwell transform (ST). The current of phase A ( i 1 ( t ) ) was processed using the ST to compute the output matrix with absolute values for phase A (STMA) as detailed below [19]:
S T M A = + i 1 ( t ) | f | 2 π e f 2 ( τ t ) 2 2 e j 2 π f t d t
where f is the frequency and t is the time. Equation (3) was solved using the discrete version, and the approximation was performed by considering f n / N T and τ j T . Here, n: the instantaneous sample number, N: the total number of samples, and T: the time period of the current signal. The STMA is a complex matrix, which has signal information. The rows and columns of this matrix represent the time and frequency spectrum, respectively. The matrix elements compute the time–frequency contours and can be used to compute the energy vector of the instantaneous frequency using Parseval’s theorem [20,21]. The currents of phase B ( i 2 ( t ) ) and phase C ( i 3 ( t ) ) are also processed using Equation (3) for computing the ST output matrix with absolute values for phase B (STMB) and phase C (STMC), respectively. We compute the summation of every element of each column of matrix STMA (STMAS) as described below:
S T M A S = Σ j = 1 j = 384 Σ i = 1 i = 768 S T M A
where i and j indicate the row numbers and column numbers of the STMA matrix, respectively. Similarly, the summation of every element of each column of the matrix STMB (STMBS) and the summation of every element of each column of the matrix STMC (STMCS) are computed. The median of the STMA (STMAM) is computed by the relation below:
S T M A M = m e d i a n ( S T M A )
Each element of the STMAM matrix indicates the median of the respective column of the STMA matrix, which is computed as described below:
m e d i a n = ( n 2 ) t h t e r m + ( n 2 + 1 ) t h t e r m 2
Here, n is the total row numbers in the STMA matrix, which equal 384. Similarly, the median of the STMB and STMC matrices are computed to obtain the STMBM and STMCM, respectively. The Stockwell islanding-detection factor for phase A (SIDFA)is evaluated by element by element multiplication of the STMAS and STMAM as described below:
S I D F A = S T M A S × S T M A M
The Stockwell islanding-detection factor for phase B (SIDFB) is evaluated considering the element by element multiplication of the STMBS and STMBM. Similarly, the Stockwell islanding-detection factor for phase C (SIDFC) is evaluated considering the element by element multiplication of the STMCS and STMCM. The Stockwell islanding-detection factor (SIDF) is evaluated by taking the arithmetic mean of the SIDFA, SIDFB, and SIDFC
S I D F = S I D F A + S I D F B + S I D F C 3

3.3. Co-Variance Islanding-Detection Factor

The co-variance islanding-detection factor for phase A (CIDFA) is computed by considering samples of the current cycle (X) and samples of the previous cycle (healthy nature cycle) (Y) of the STMAS as described below:
C I D F A = Σ X i Y i N
Here, N indicates the number of scores in each set of data, which is 64 samples per cycle. X represents the mean of the N scores in the current cycle data set, and Y represents mean of the N scores in the previous cycle data set. This operation is performed using the inbuilt function of MATLAB as detailed below:
C I D F A = c o v ( S T M A S )
The co-variance islanding-detection factor for phase B (CIDFB) and co-variance islanding-detection factor for phase C (CIDFC) are computed from the STMBS and STMCS, respectively. The co-variance islanding-detection factor is computed by taking the arithmetic mean of the CIDFA, CIDFB, and CIDFC as detailed below:
C I D F = C I D F A + C I D F B + C I D F C 3

3.4. Alienation Islanding-Detection Factor

The Alienation islanding-detection factor (AIDF) is computed by processing the currents of all phases using the Alienation Coefficient (ALC). The Alienation islanding-detection factor for phase A (AIDFA) is computed by the sample-based Alienation Coefficients of the current of phase A taking a sampling frequency of 3.84 kHz. The AIDF for phase A (AIDFA) is evaluated considering the relation below [22]:
A I D F A = 1 R A 2
Here, R A indicates the correlation coefficient of the variables x and y for phase A. Here, the variable x represents the mean of the N scores in the current cycle data set, and the variable y represents the mean of the N scores in the previous cycle data set. The correlation coefficient R A is computed using the formulation below [22].
R A = N s x y ( x ) ( y ) [ N s x 2 ( x ) 2 ] [ N s y 2 ( y ) 2 ]
where N s indicates the sample numbers, which equal 64. Similarly, the AIDF for phase B (AIDFB) and AIDF for phase C (AIDFC) are computed by processing the currents of phase B and phase C, respectively. The AIDF is computed by taking the arithmetic mean of the AIDFA, AIDFB, and AIDFC as detailed below:
A I D F = A I D F A + A I D F B + A I D F C 3

3.5. Hybrid Islanding-Detection Indicator

The hybrid islanding-detection indicator (HIDI) is computed by multiplying the HIDF, SIDF, CIDF, and AIDF element by element and an islanding weight factor (IWF) as detailed below:
H I D I = H I D F × S I D F × C I D F × A I D F × I W F
Here, the IWF is considered equal to 8 × 10 6 . Two thresholds were selected for detecting the islanding conditions and also to discriminate such events from fault events and operational events. The first threshold is known as the hybrid islanding-detection indicator threshold (HIDIT), which is considered equal to 200. The second threshold is known as the hybrid islanding-detection indicator fault threshold (HIDIFT), which is considered equal to 10 10 . The magnitudes of the HIDIT and HIDIFT were considered after testing the algorithm on 25 data sets of all events investigated in this research. This data set was evaluated by varying the event incidence angle, fault impedance, different levels of RE generation, events at different nodes of the test system, etc. Different zones for the detection of islanding, faults, and operational events are shown in Figure 3. For the event for which the peak magnitude of the HIDI is higher than the HIDIFT, then the event will be identified as a fault event. For the event for which the peak value of the HIDI is lower than the HIDIT, then the event will be identified as an operational event. If the peak value of the HIDI is higher than the HIDIT and less than the HIDIFT, then the event will be identified as an islanding event.

4. Detection of Islanding Events: Simulation Results and Discussion

The results of the simulation and their discussion for the identification of islanding events with generation from both the WGP and SGP, generation from the SGP, and generation from the WGP are discussed in this section. The results for the analysis of the impact of the islanding incidence angle on the efficacy of the HIDM are also discussed in this section. The results for islanding detection in noisy scenarios are also discussed. The results to determine the non-detection zone (NDZ) are also discussed in this section. The results are plotted for a 12-cycle time period. The current signals used to obtain the results of islanding detection demonstrated in this section were synthetically generated by simulation studies performed on the test system of a utility network with the RE generators described in Figure 1 using the MATLAB software. The results of this section are related to the event of sudden islanding, where the complete network with all generators, loads, capacitors, and reactors is in a circuit and also in an energized state.

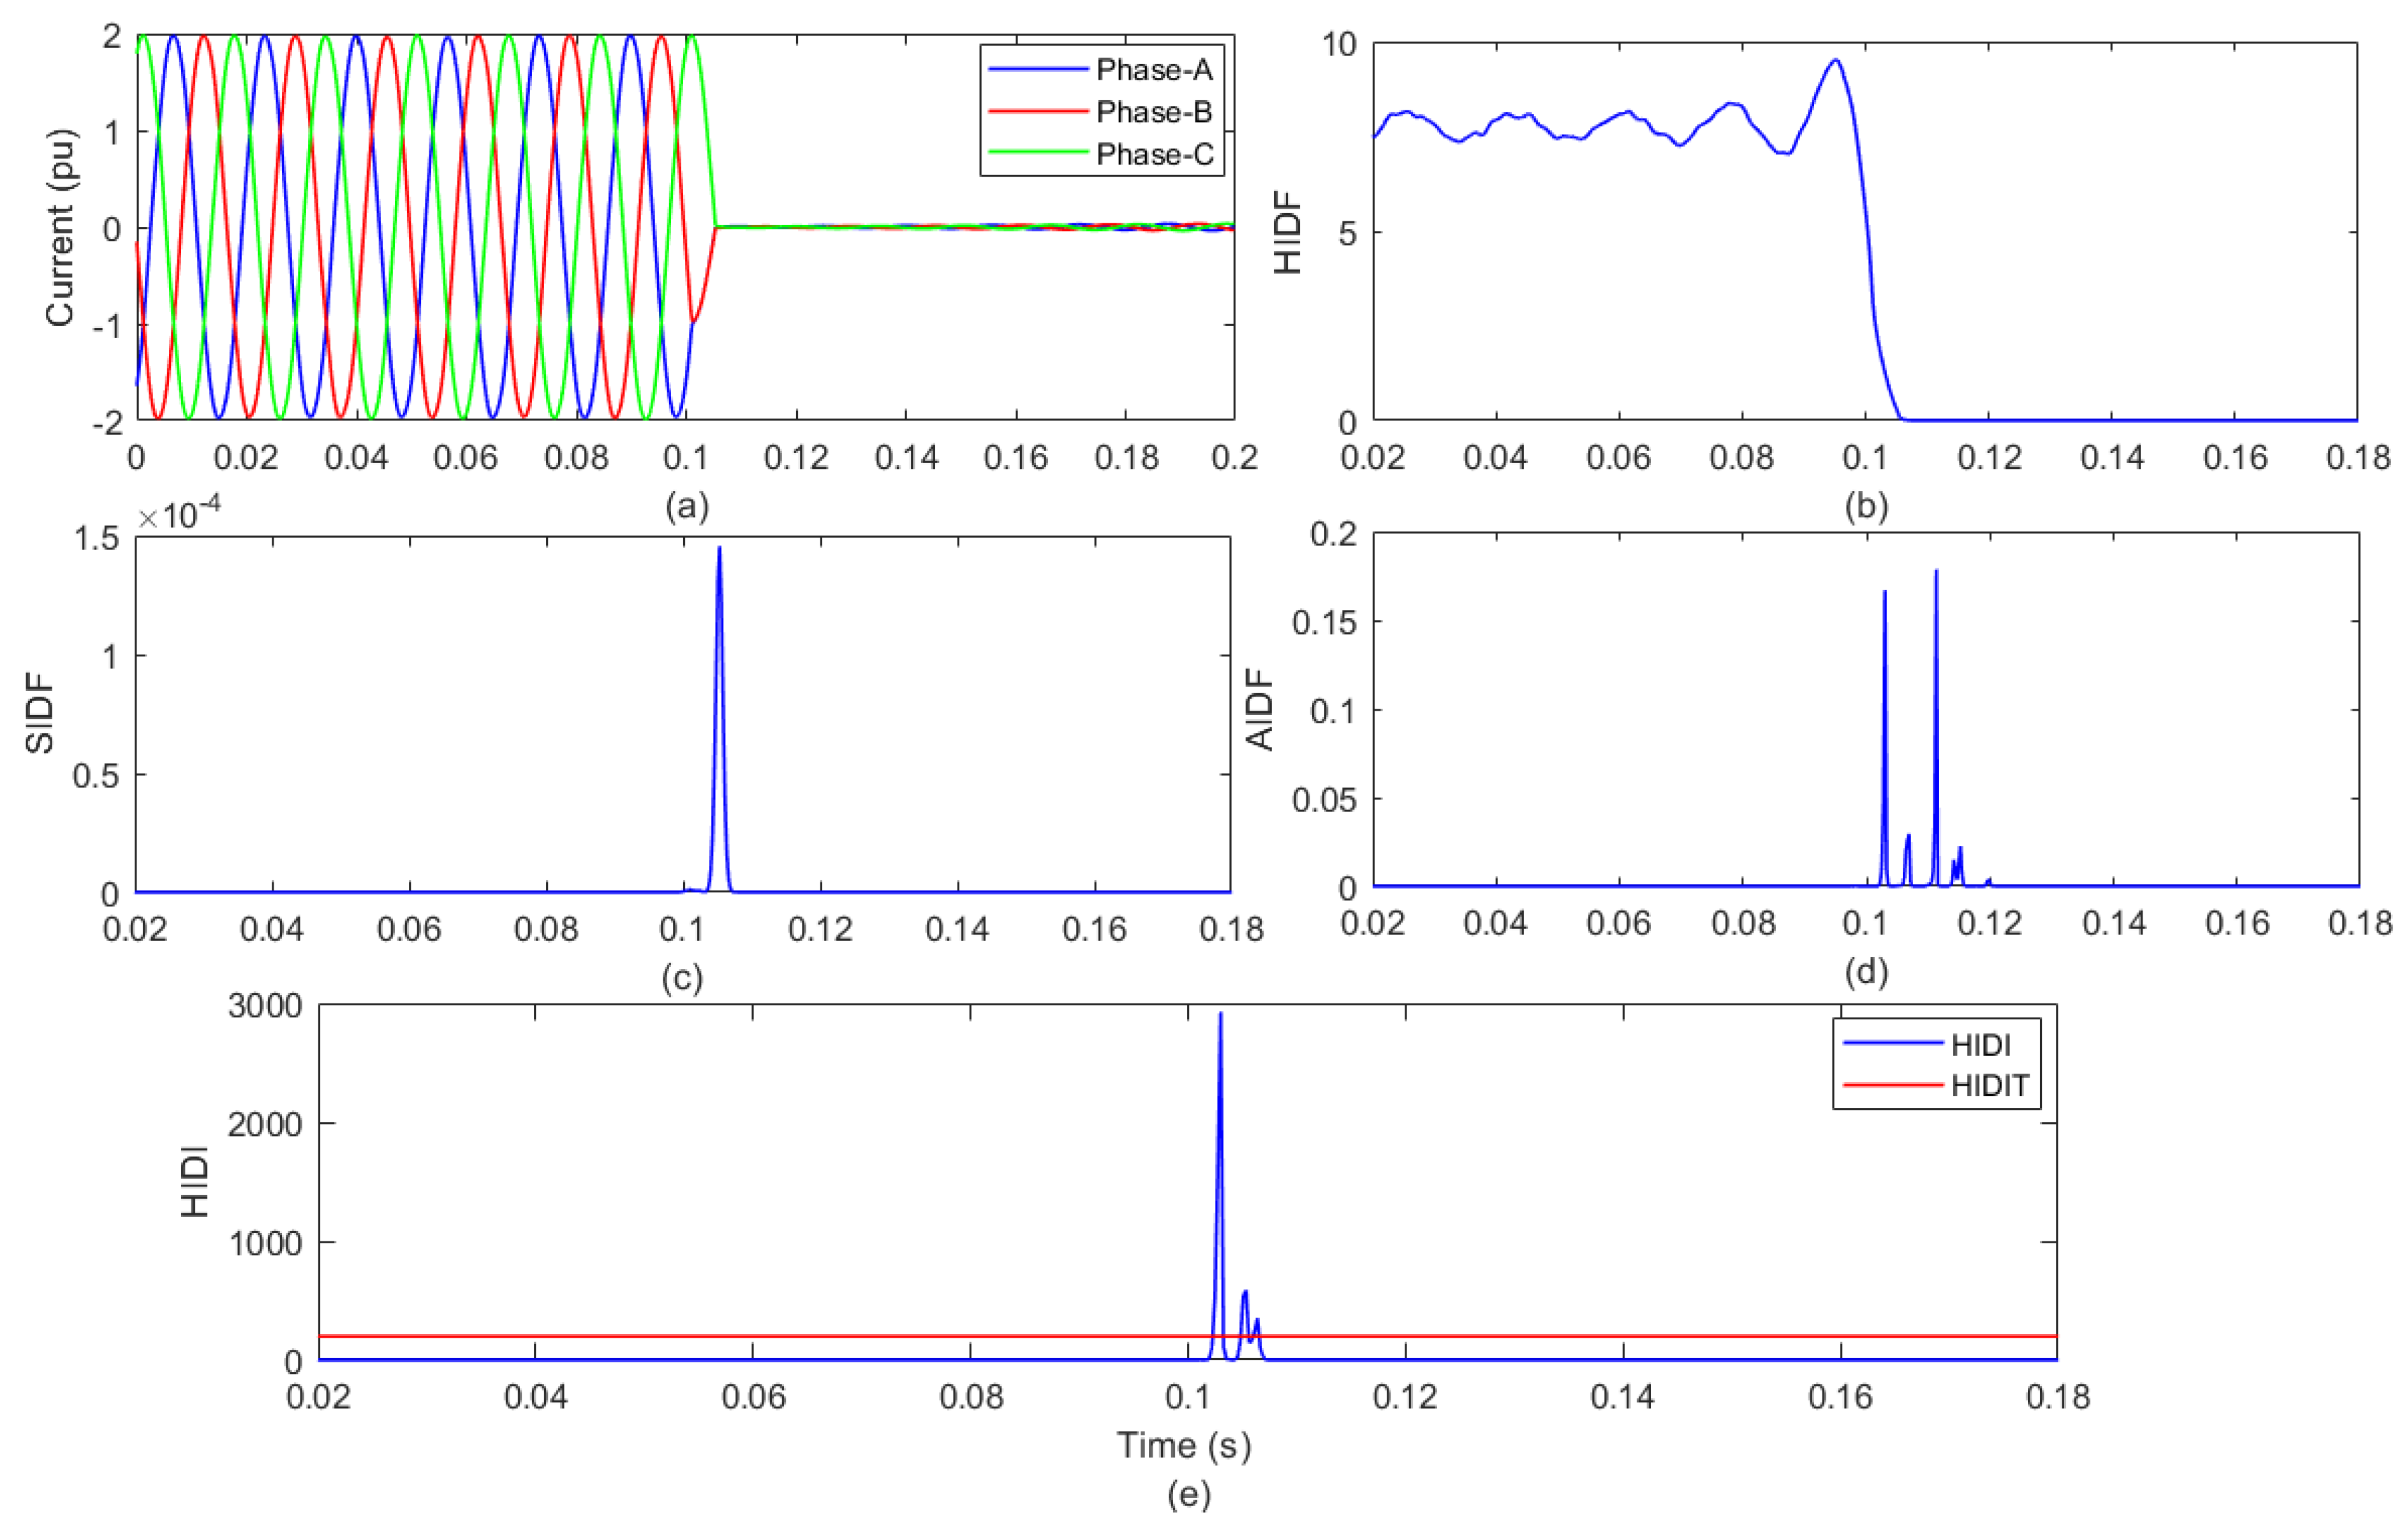
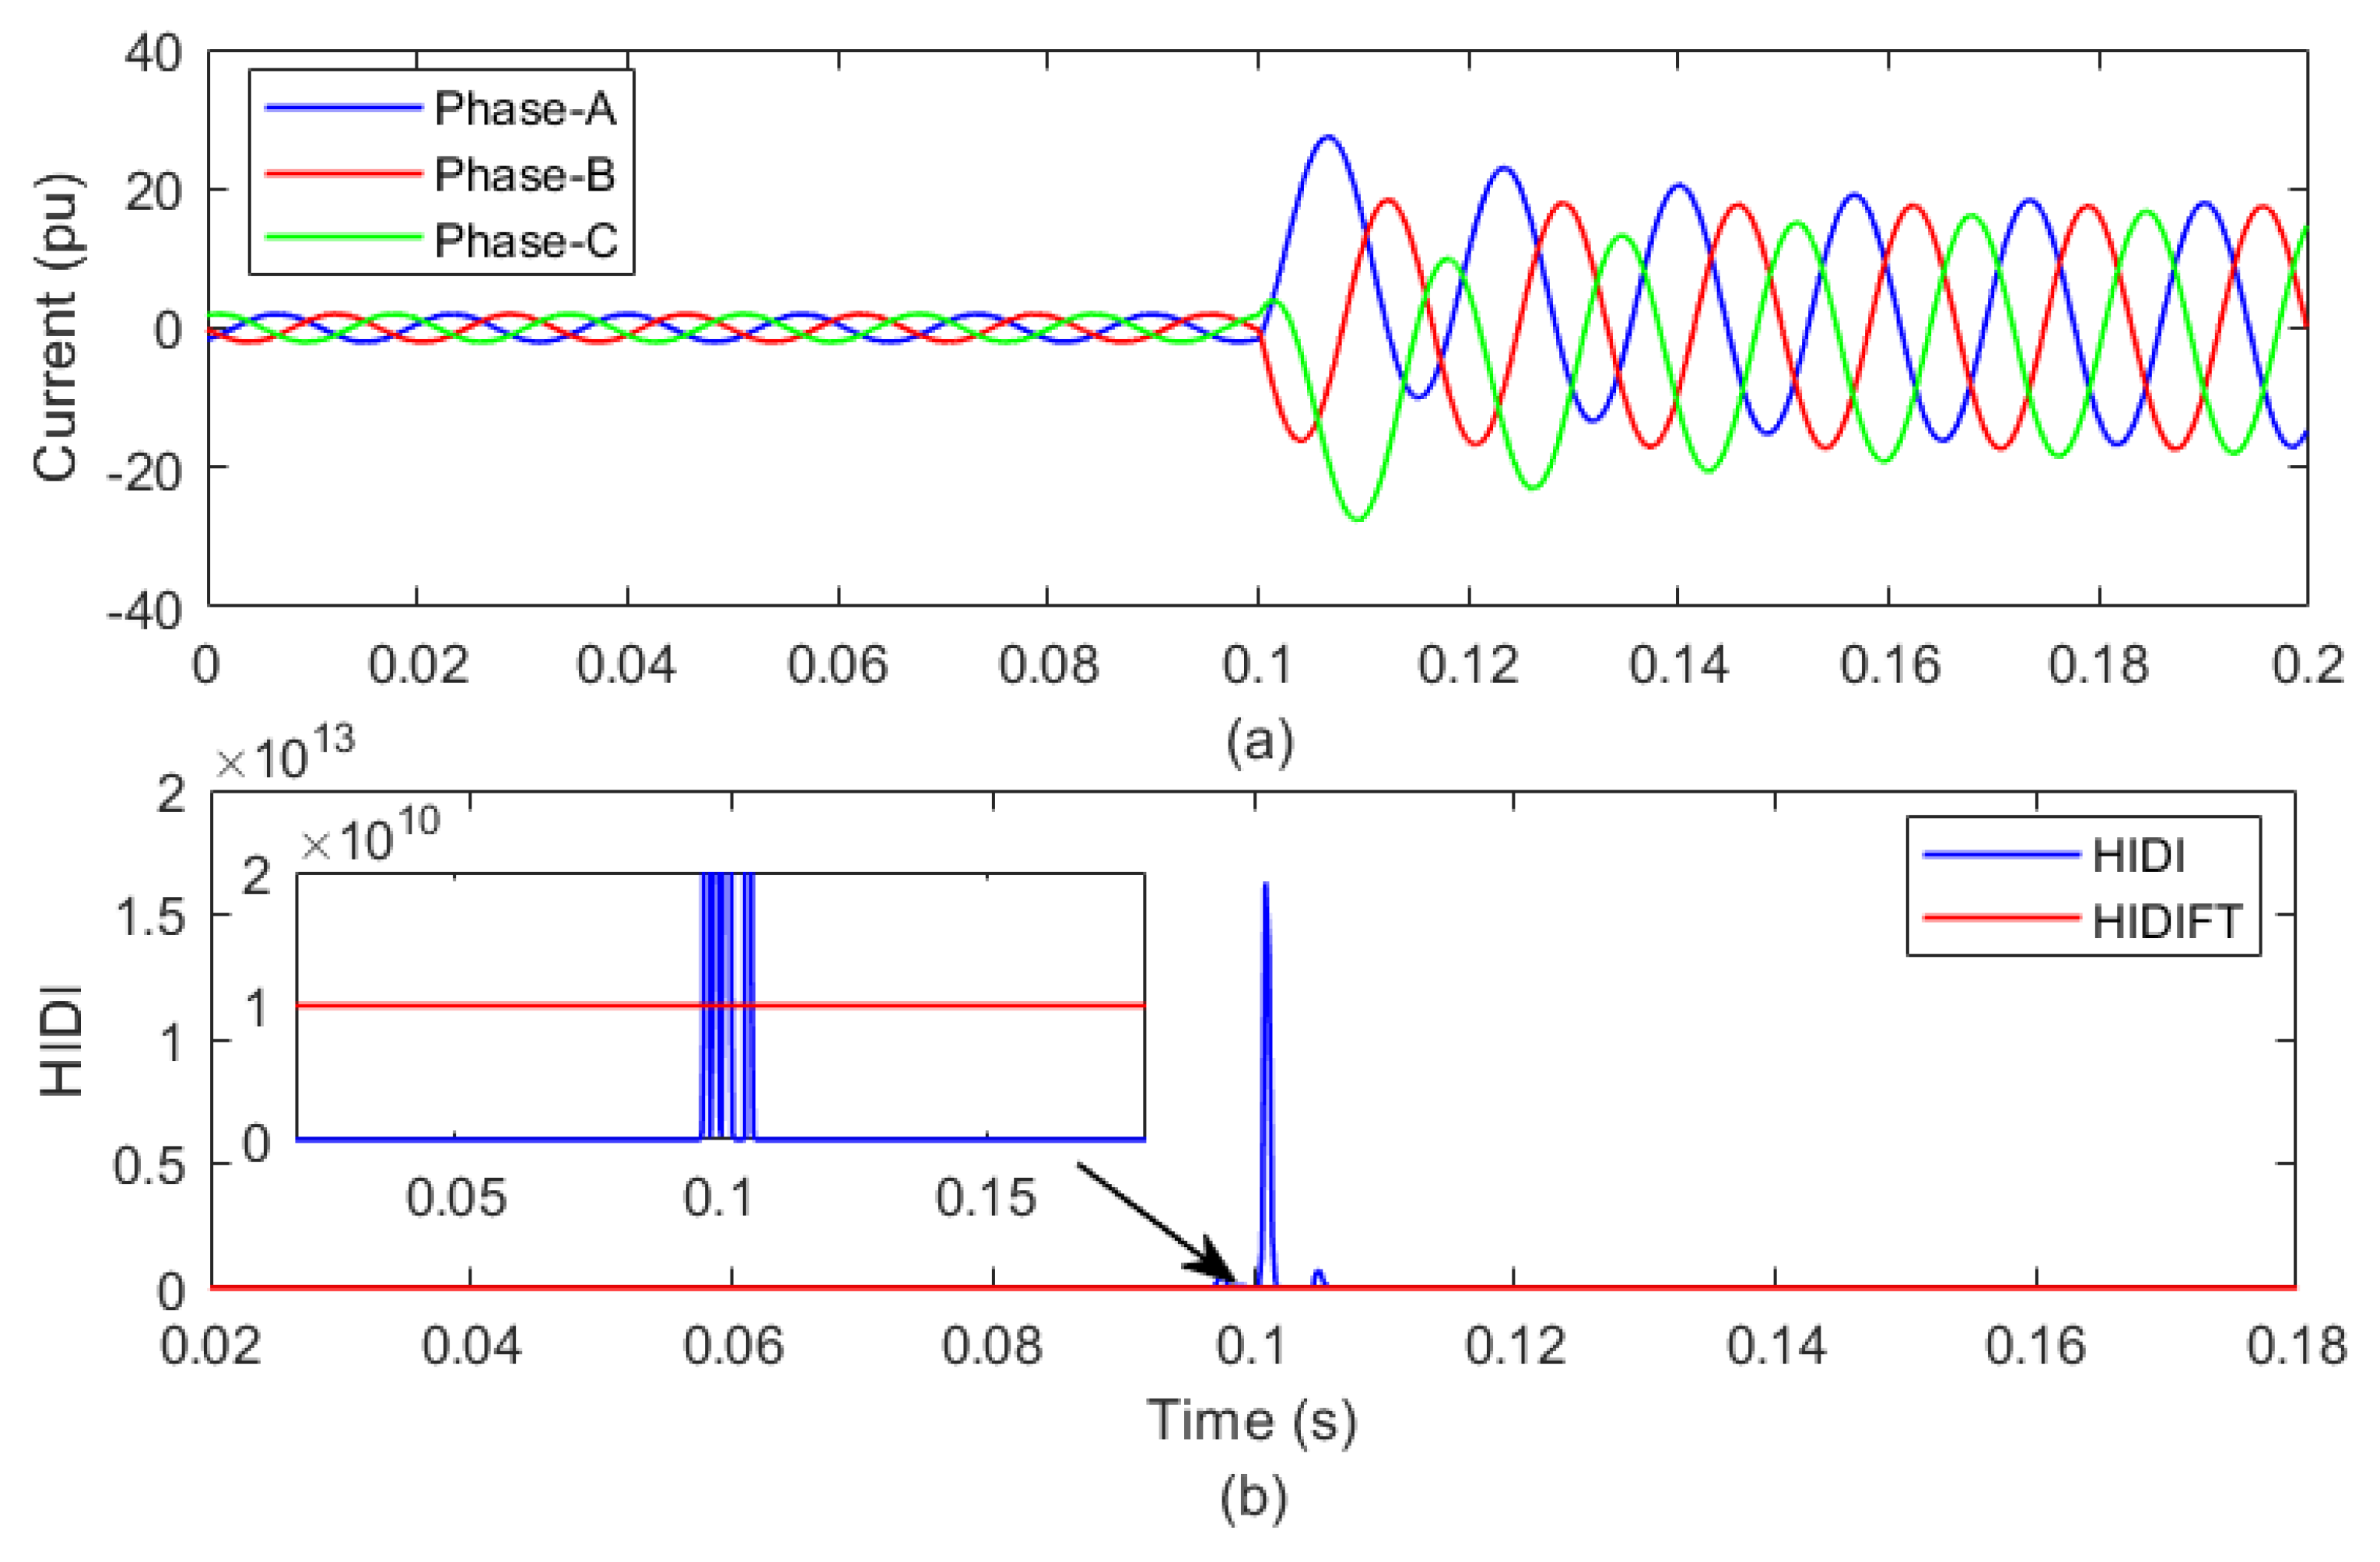
4.1. Detection of Islanding Event with Generation from WGP and SGP

The test system was simulated with generation from both the WGP and SGP. The IFS switch was opened at 0.1 s to form the island of the test system. The currents of all phases were captured on node 632 of the test system. The current signals were processed using the HIDM to evaluate the HIDF, SIDF, AIDF, and HIDI. The current waveform of all phases, HIDF, SIDF, AIDF, and HIDI, is depicted in Figure 4a–e in the respective sequence. The maximum magnitude of the HIDI and the computational time of the HIDM are tabulated in Table 3 and Table 4, respectively.
Figure 4a indicates the decrease in current due to the islanding event at 0.1 s. The magnitude of the HIDF is also reduced after an islanding event, as illustrated in Figure 4b. Figure 4c elaborates that the SIDF has a zero value before and after islanding incidence and becomes high at the instant of islanding incidence. Figure 4d represents that the value of the AIDF is zero before and after islanding incidence and becomes high at the moment of islanding event occurrence. However, spikes are observed for a window of one cycle. Figure 4e elaborates that the value of the HIDI is zero prior to island formation and becomes higher than the HIDIT. However, the peak magnitude is lower relative to the HIDIFT. Hence, the peak of the HIDI falls in the islanding event zone. Hence, islanding with WGP and SGP generation is effectively detected, as well as discriminated from fault and operational events. The computational time of the HIDM for islanding detection with both the WGP and SGP is 0.278454 ms.

4.1.1. Testing of HIDM for Different Islanding Incidence Angles

The HIDM was tested to identify islanding conditions with generation from the WGP and SGP for occurrence angles of 0 ° , 30 ° , 60 ° , 90 ° , 120 ° , 150 ° , and 180 ° . The peak magnitude of the HIDI for the different occurrence angles is included in Table 5. This shows that the peak value of the HIDI is less than the HIDIFT and higher than the HIDIT. Hence, it falls in the islanding event zone, which indicates that islanding events are effectively recognized for different incidence angles, and this event is also differentiated from fault conditions and operational events.

4.1.2. Impact of Noise on HIDM Performance

The HIDM was tested for detecting the islanding event with generation from the WGP and SGP in the scenario of 20 dB SNR noise. The islanding event was simulated, and the currents were captured on test bus 632. The noise of level 20 dB SNR is superimposed on the current waveform. The current with noise was decomposed by the application of the HIDM, and the HIDI was evaluated, which is illustrated in Figure 5. The peak magnitude is equal to 4.28326 × 10 6 , which falls in the islanding event zone. Hence, the islanding condition with generation from the WGP and SGP in the scenario of a 20 dB SNR noise level is effectively detected using the proposed HIDM.

4.1.3. Determination of NDZ of Islanding Event

A non-detection zone (NDZ) is an operational zone in which an islanding event is not detected by the HIDM. This indicates a mismatch between the power taken by the load and the generated power. The following mathematical formulation is used to detect the NDZ [23]:
Δ P = 3 V × I 3 ( V + Δ V ) × I = 3 Δ V × I
where V = 4.16 kV is the network rated voltage and I represents the current supplied by the utility grid to the test network. The NDZ range was considered to be 0.92 pu to 1.1 pu. A mismatch in real power was obtained by changing the generated power from the WGP and SGP. Various operating scenarios of power mismatch and voltage are included in Table 6. The NDZ limits where the islanding condition is not detected are marked as IND (islanding not detected), and limits where the islanding event is identified are marked as ID (islanding detected). It is observed that the NDZ limits for the HIDM in terms of power mismatch and voltage are indicated as (a) Δ P = 4 kW to Δ P = 5 kW at V = 1.0 pu and (b) V = 0.96 pu to V = 1.1 pu at Δ P = 0 kW. Δ P is taken as positive for the scenario when the power generated on the island is high relative to the load on the island and vice versa. The NDZ limits of the HIDM are normal and permissible in general conditions. For these limits of the NDZ, the proposed HIDM will work well.

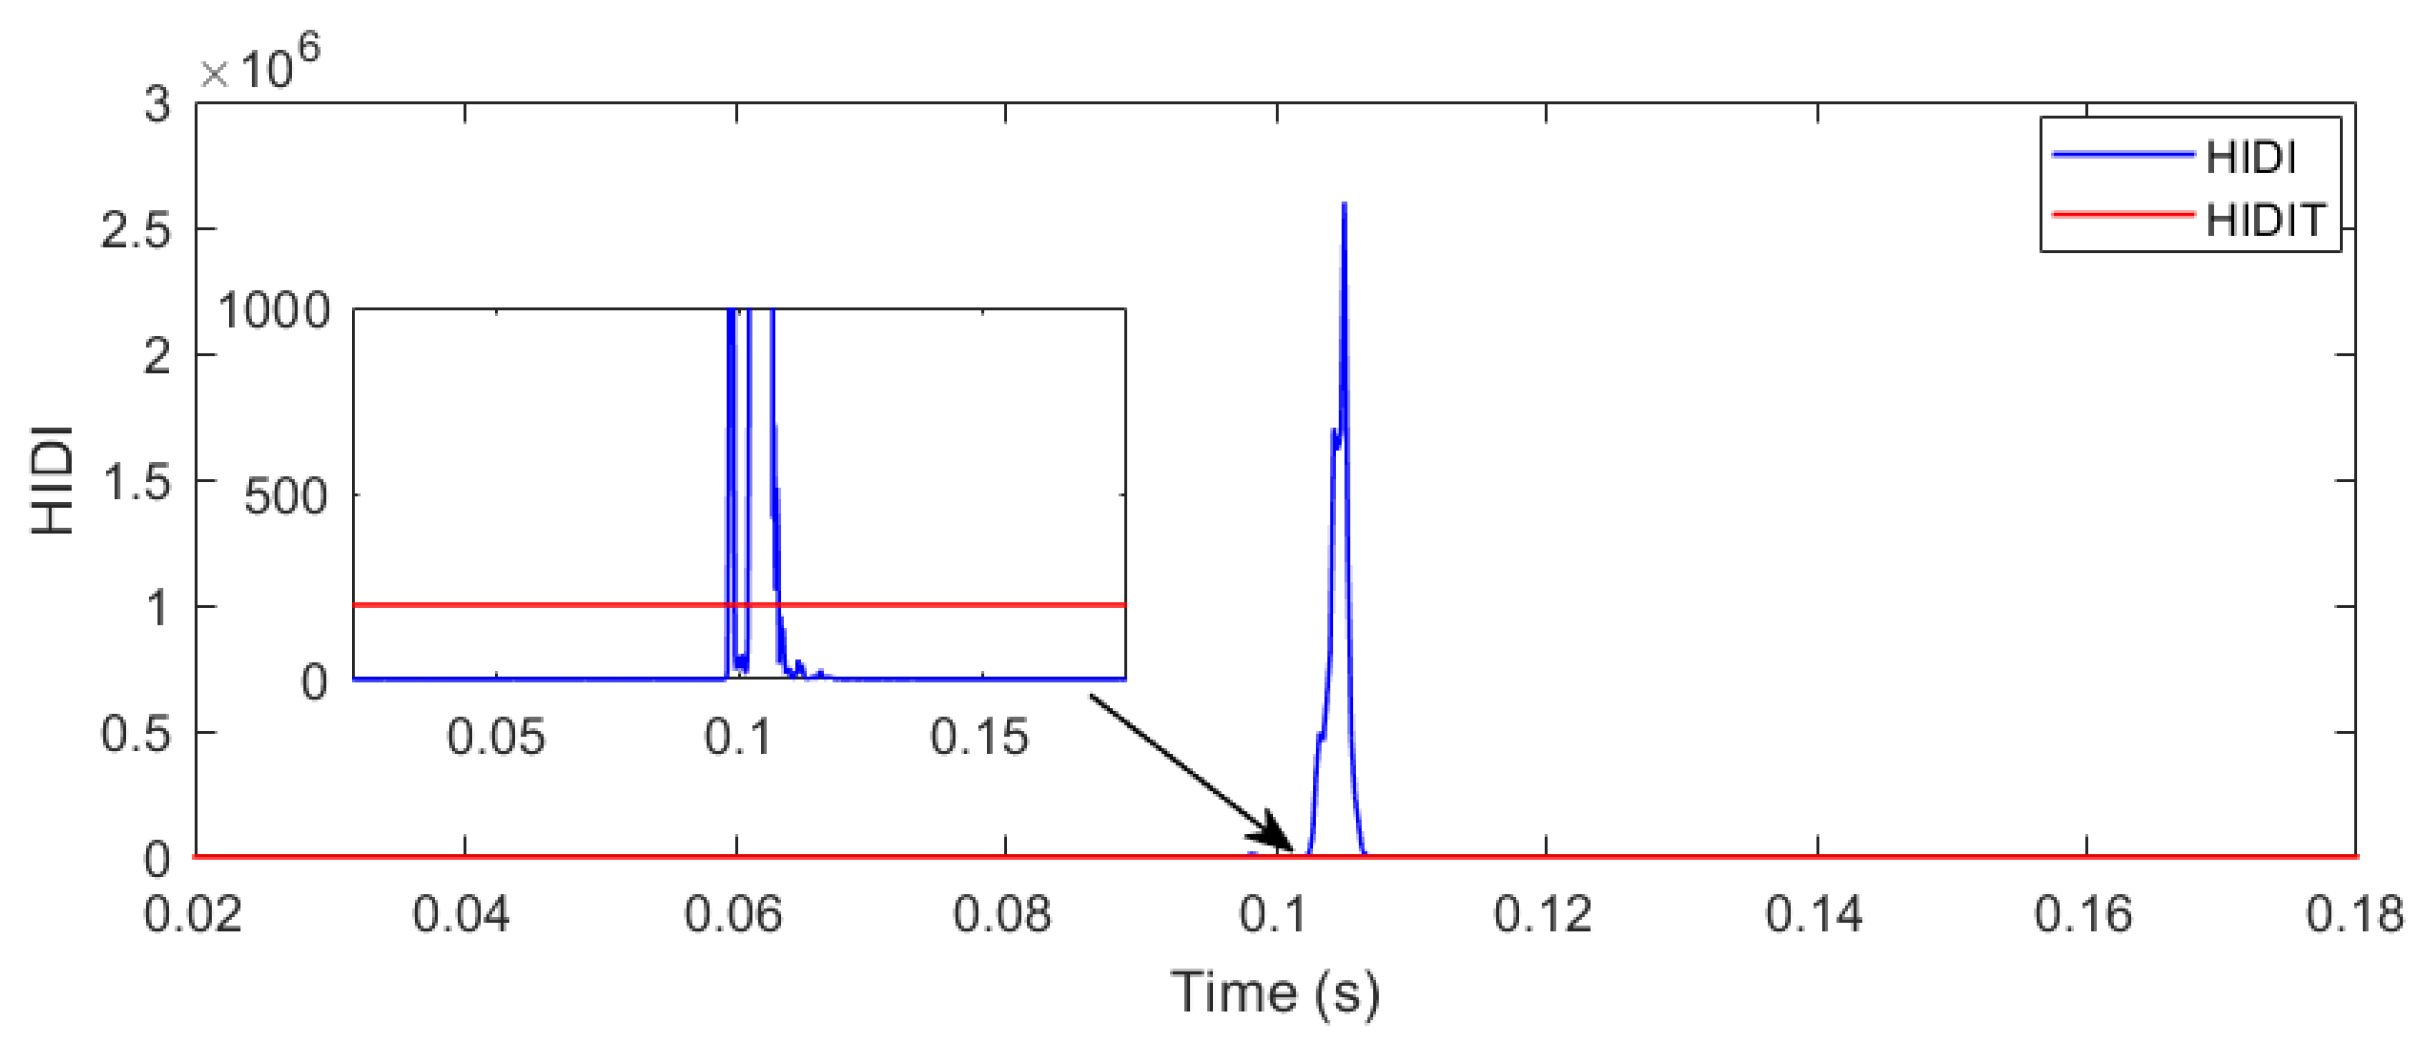
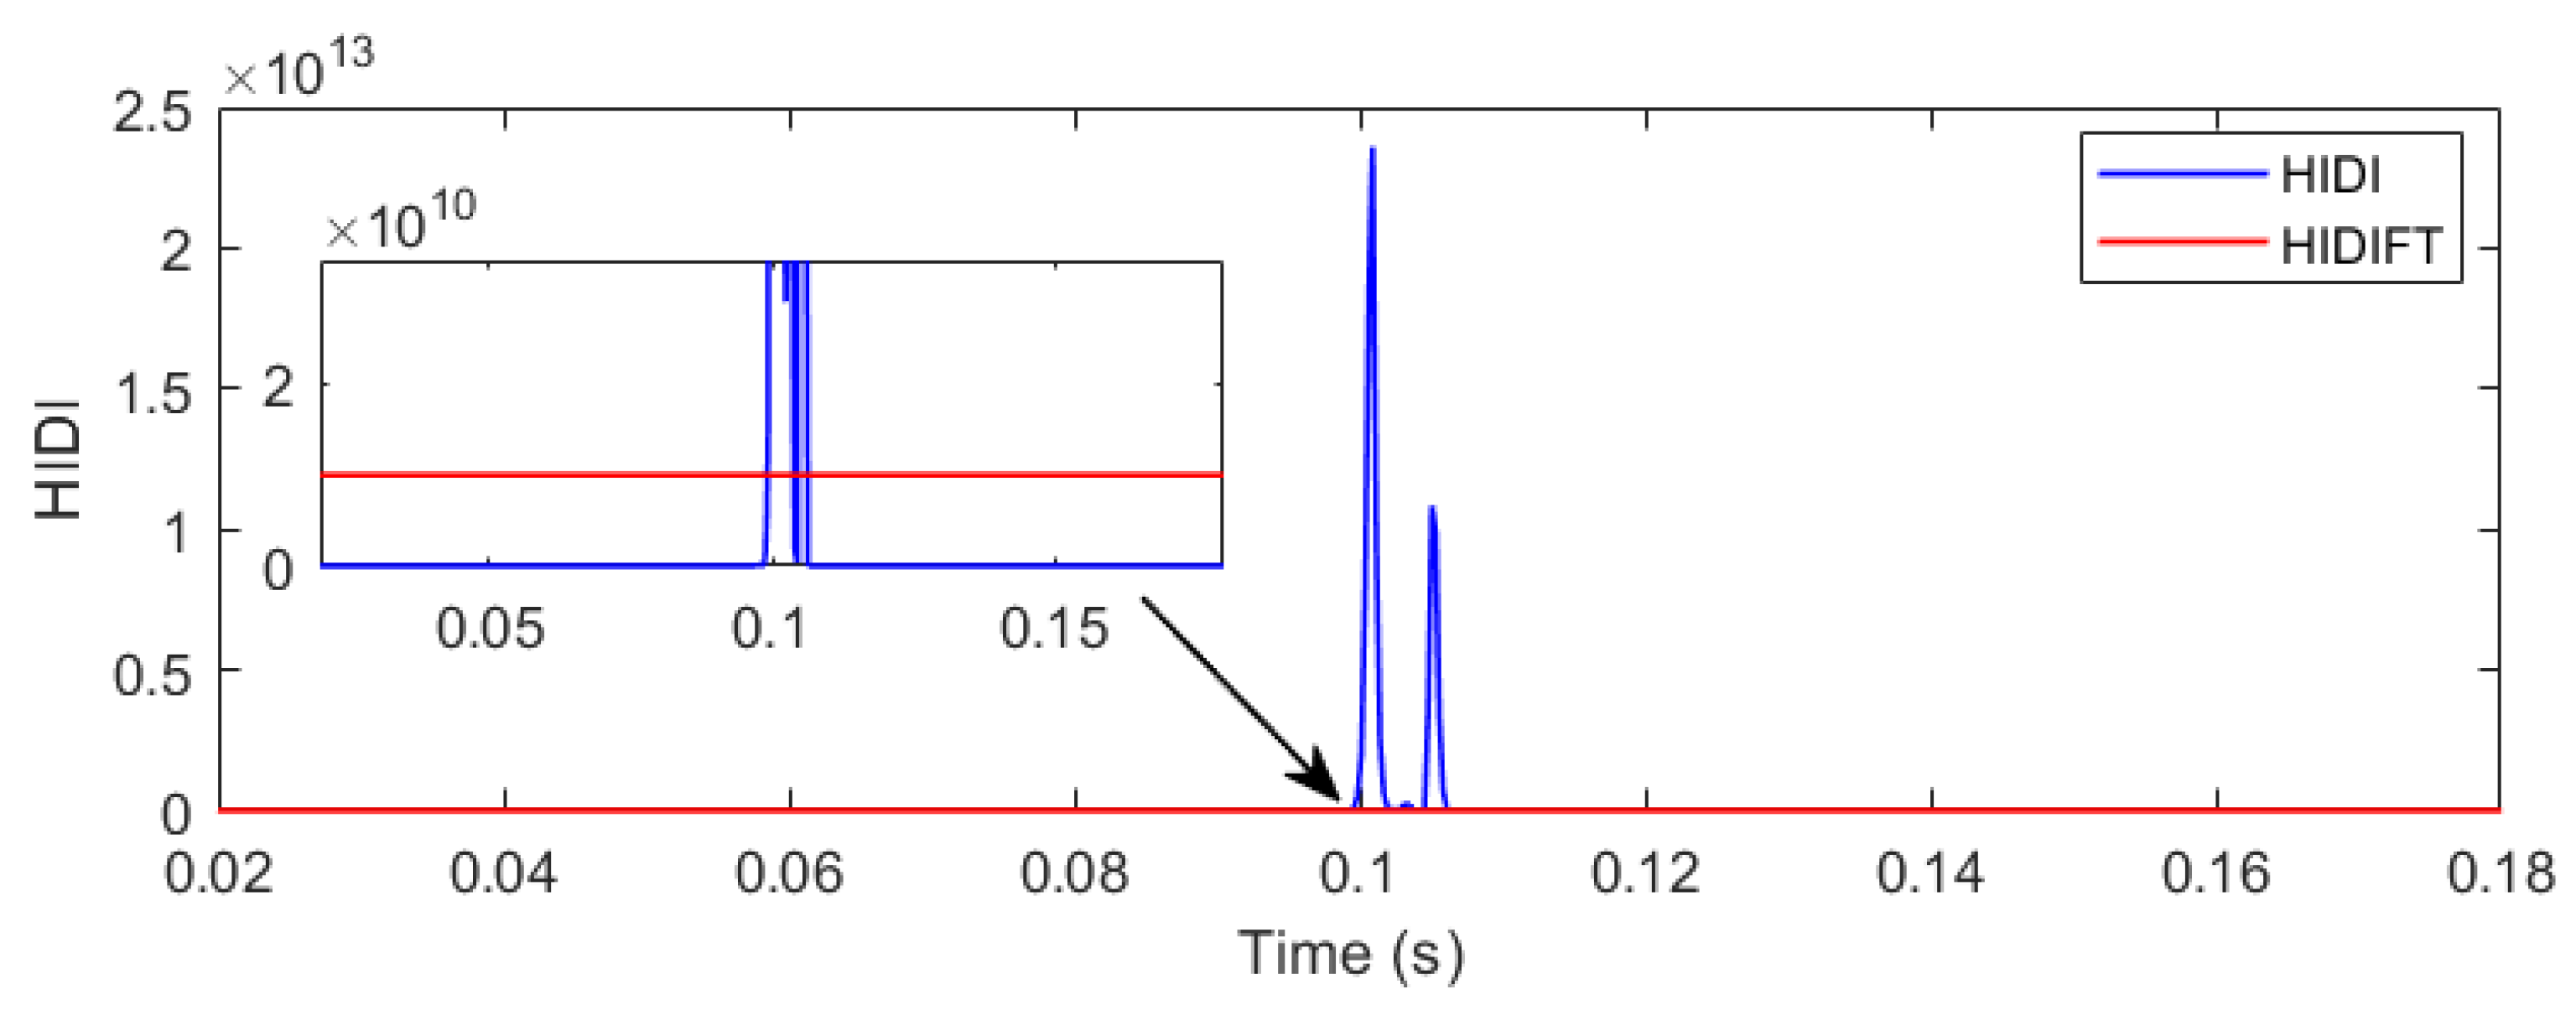
4.2. Detection of Islanding with SGP

The test system was simulated with data from the SGP. The IFS switch was opened at 0.1 s to form the island of the test network with solar generation. The currents of all phases were captured on node 632 of the test system. The current signals were analyzed using the proposed method to compute the HIDF, SIDF, AIDF, and HIDI. The current waveforms of all phases, HIDF, SIDF, AIDF, and HIDI, are depicted in Figure 6a–e in their respective sequences. The maximum magnitude of the HIDI and the computational time of the HIDM are included in Table 3 and Table 4, respectively.
Figure 6a illustrates that the current decreases and becomes zero at the moment of the islanding condition at 0.1 s. The magnitude of the HIDF is also reduced after an islanding event, as elaborated in Figure 6b. Figure 6c elaborates that the value of the SIDF becomes high at the moment of islanding condition incidence, which is zero before and after islanding condition incidence. Figure 6d elaborates that the value of the AIDF is zero before and after the islanding condition and becomes high at the instant of the islanding event occurrence. However, spikes are observed for a window of one cycle. Figure 6e elaborates that the magnitude of the HIDI is zero before island formation and becomes higher than the HIDIT. However, the peak magnitude is low relative to the HIDIFT. Hence, the peak value of the HIDI falls in the islanding event zone. Therefore, islanding conditions with the SGP are effectively detected, as well as differentiated from both faulty and operational conditions. The computational time of the HIDM for islanding detection with both the WGP and SGP is 1.650991 ms.

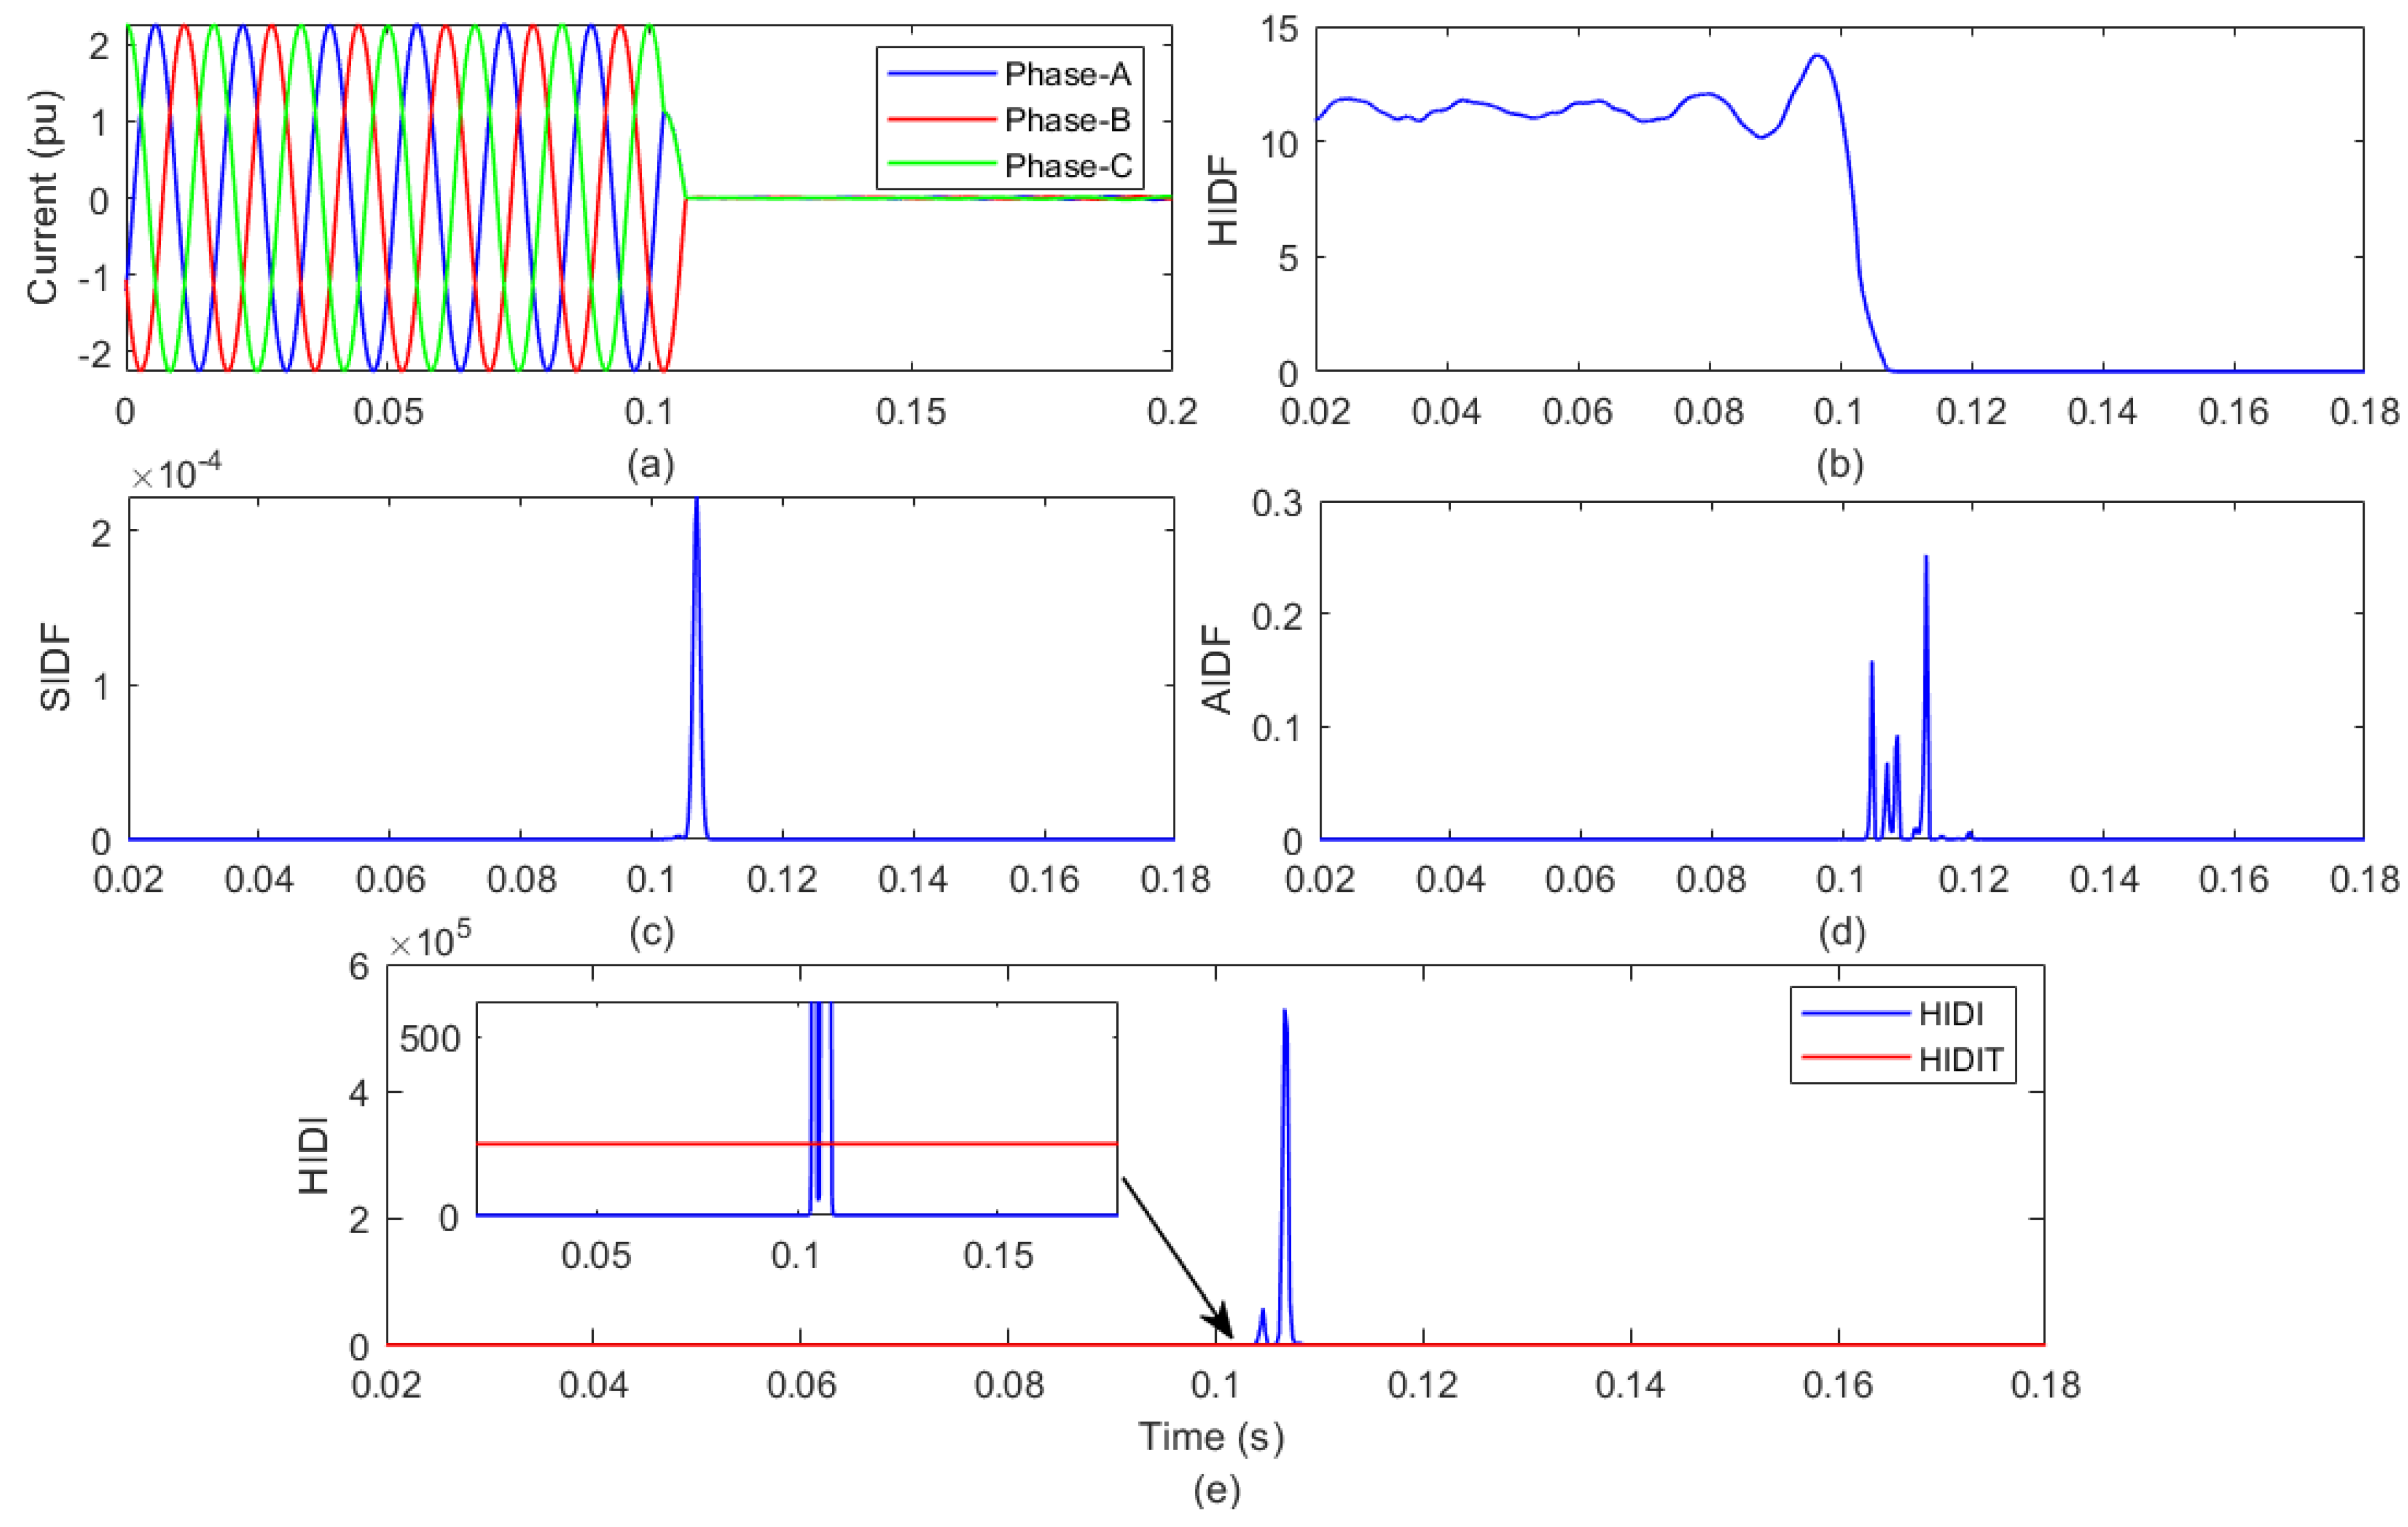
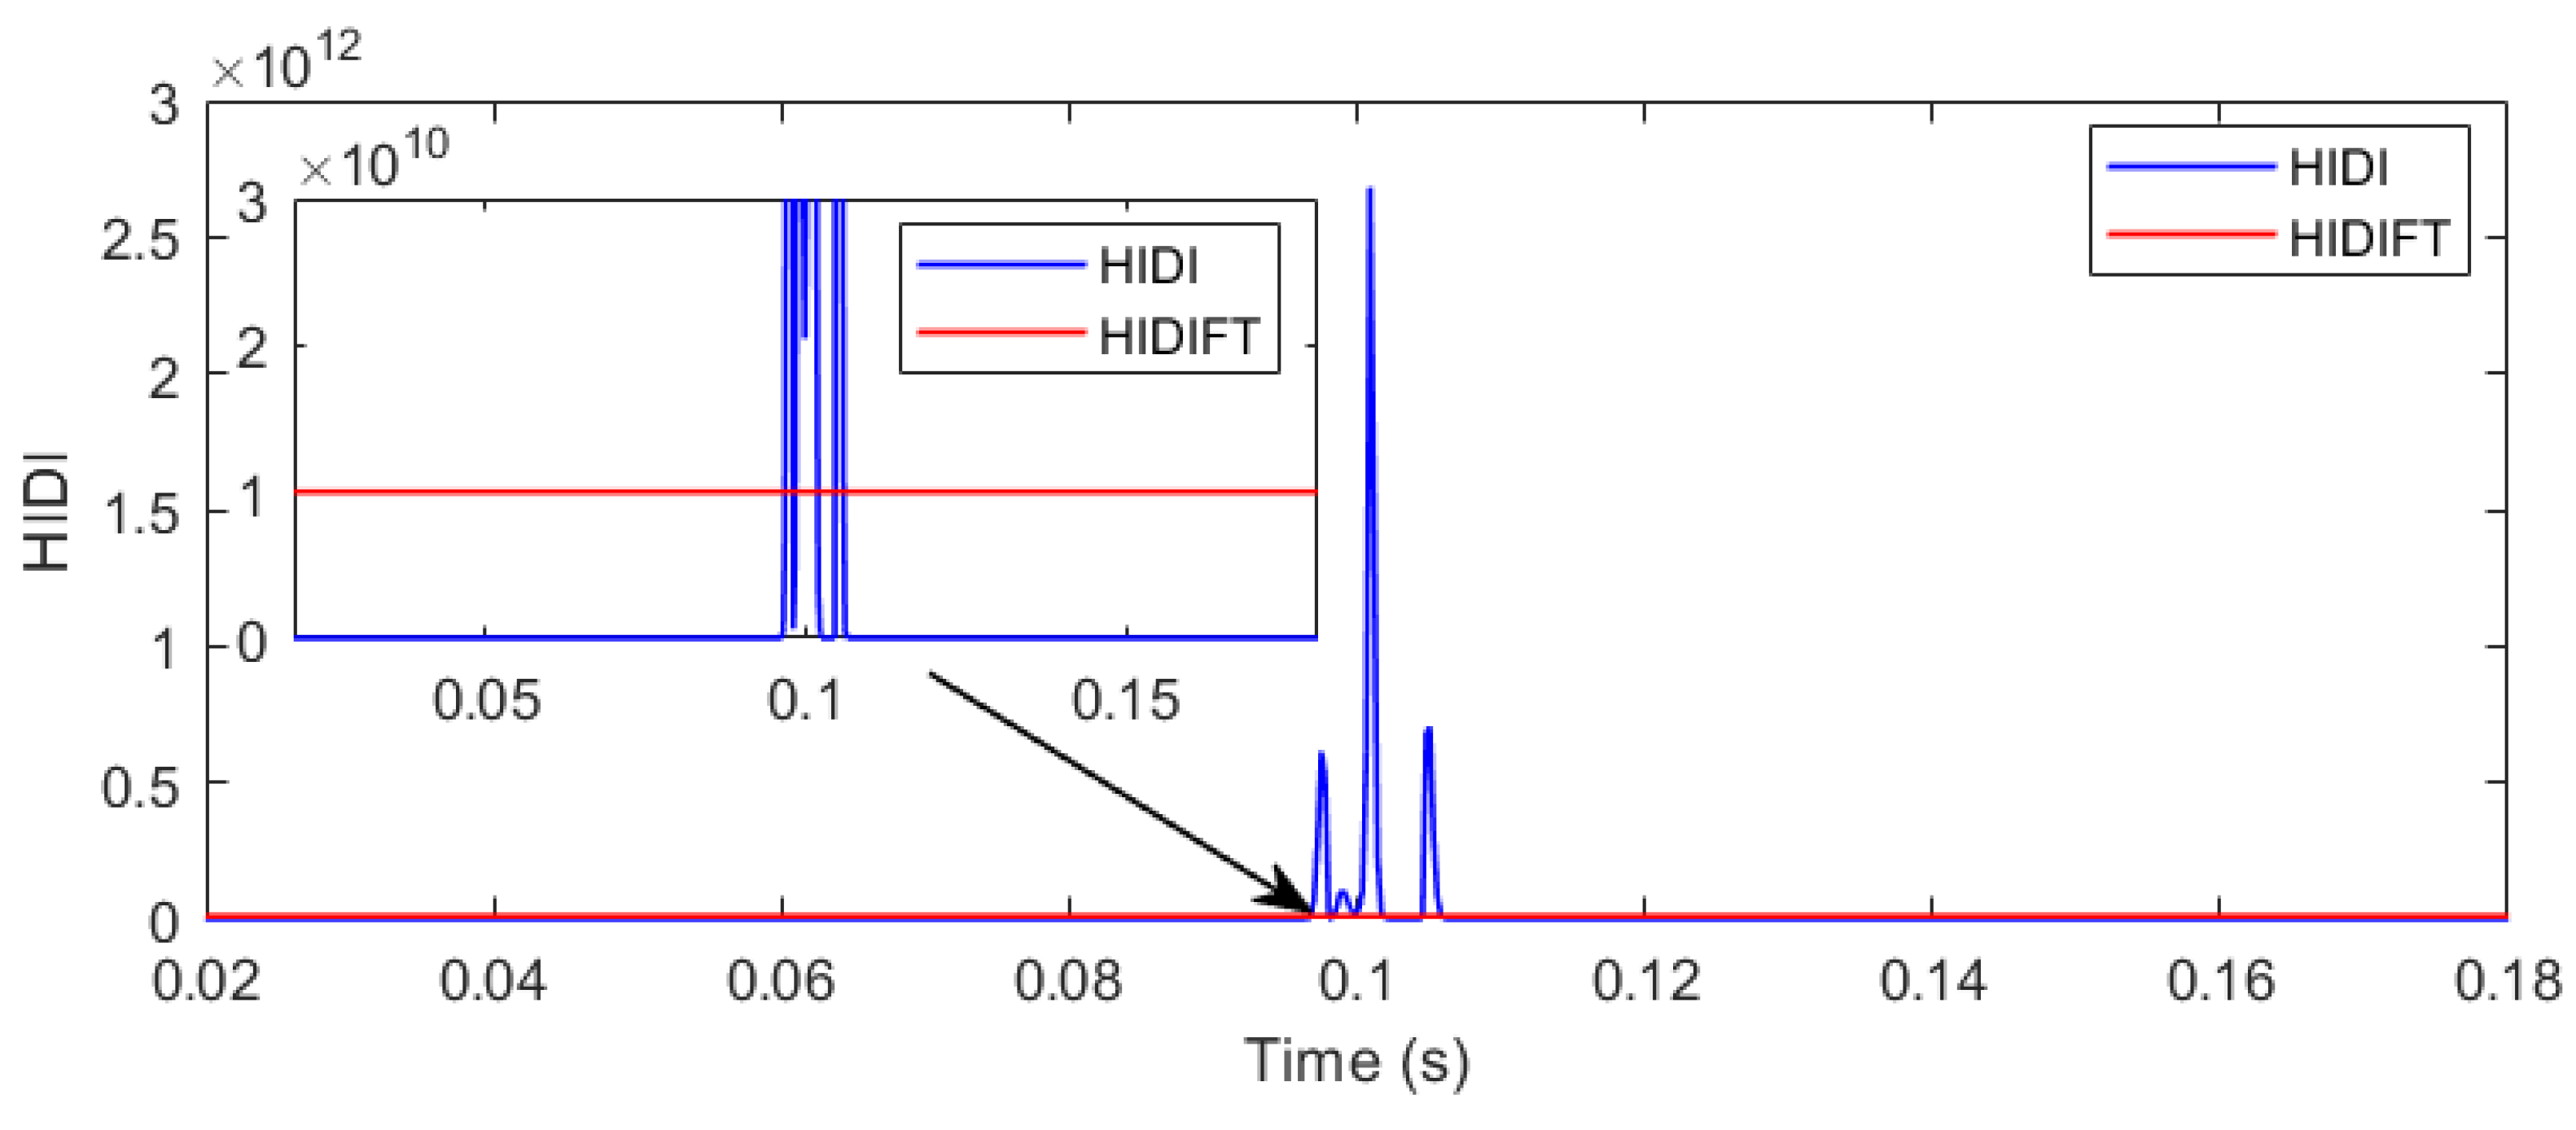
4.3. Detection of Islanding with WGP

The test system was simulated with data from the WGP. The IFS switch was opened at 0.1 s to form the island of the test system with wind generation. The currents of all phases were captured on node 632 of the test system. The current signals were analyzed using the HIDM to compute the HIDF, SIDF, AIDF, and HIDI. The current waveforms of all phases, HIDF, SIDF, AIDF, and HIDI, are depicted in Figure 7a–e in their respective orders. The maximum magnitude of the HIDI and the computational time of the HIDM are tabulated in Table 3 and Table 4, respectively.
Figure 7a illustrates that the current decreases and becomes zero due to island formation at 0.1   s . The magnitude of the HIDF is also reduced after an islanding event, as depicted in Figure 7b. Figure 7c elaborates that the value of the SIDF becomes high at the moment of islanding event incidence, which is zero before and after the islanding condition. Figure 7d indicates that the magnitude of the AIDF is zero before and after the islanding condition and becomes high at the moment of the islanding condition. However, spikes are observed for a window of one cycle. Figure 7e elaborates that the magnitude of the HIDI is zero before island formation and becomes higher than the HIDIT due to island formation. However, the peak magnitude is low relative to the HIDIFT. Hence, the peak value of the HIDI falls in the islanding event zone. Therefore, islanding conditions with the WGP are effectively detected, and this is differentiated from both faulty and operational events. The computational time of the HIDM for islanding detection with the WGP is 0.443420 ms.

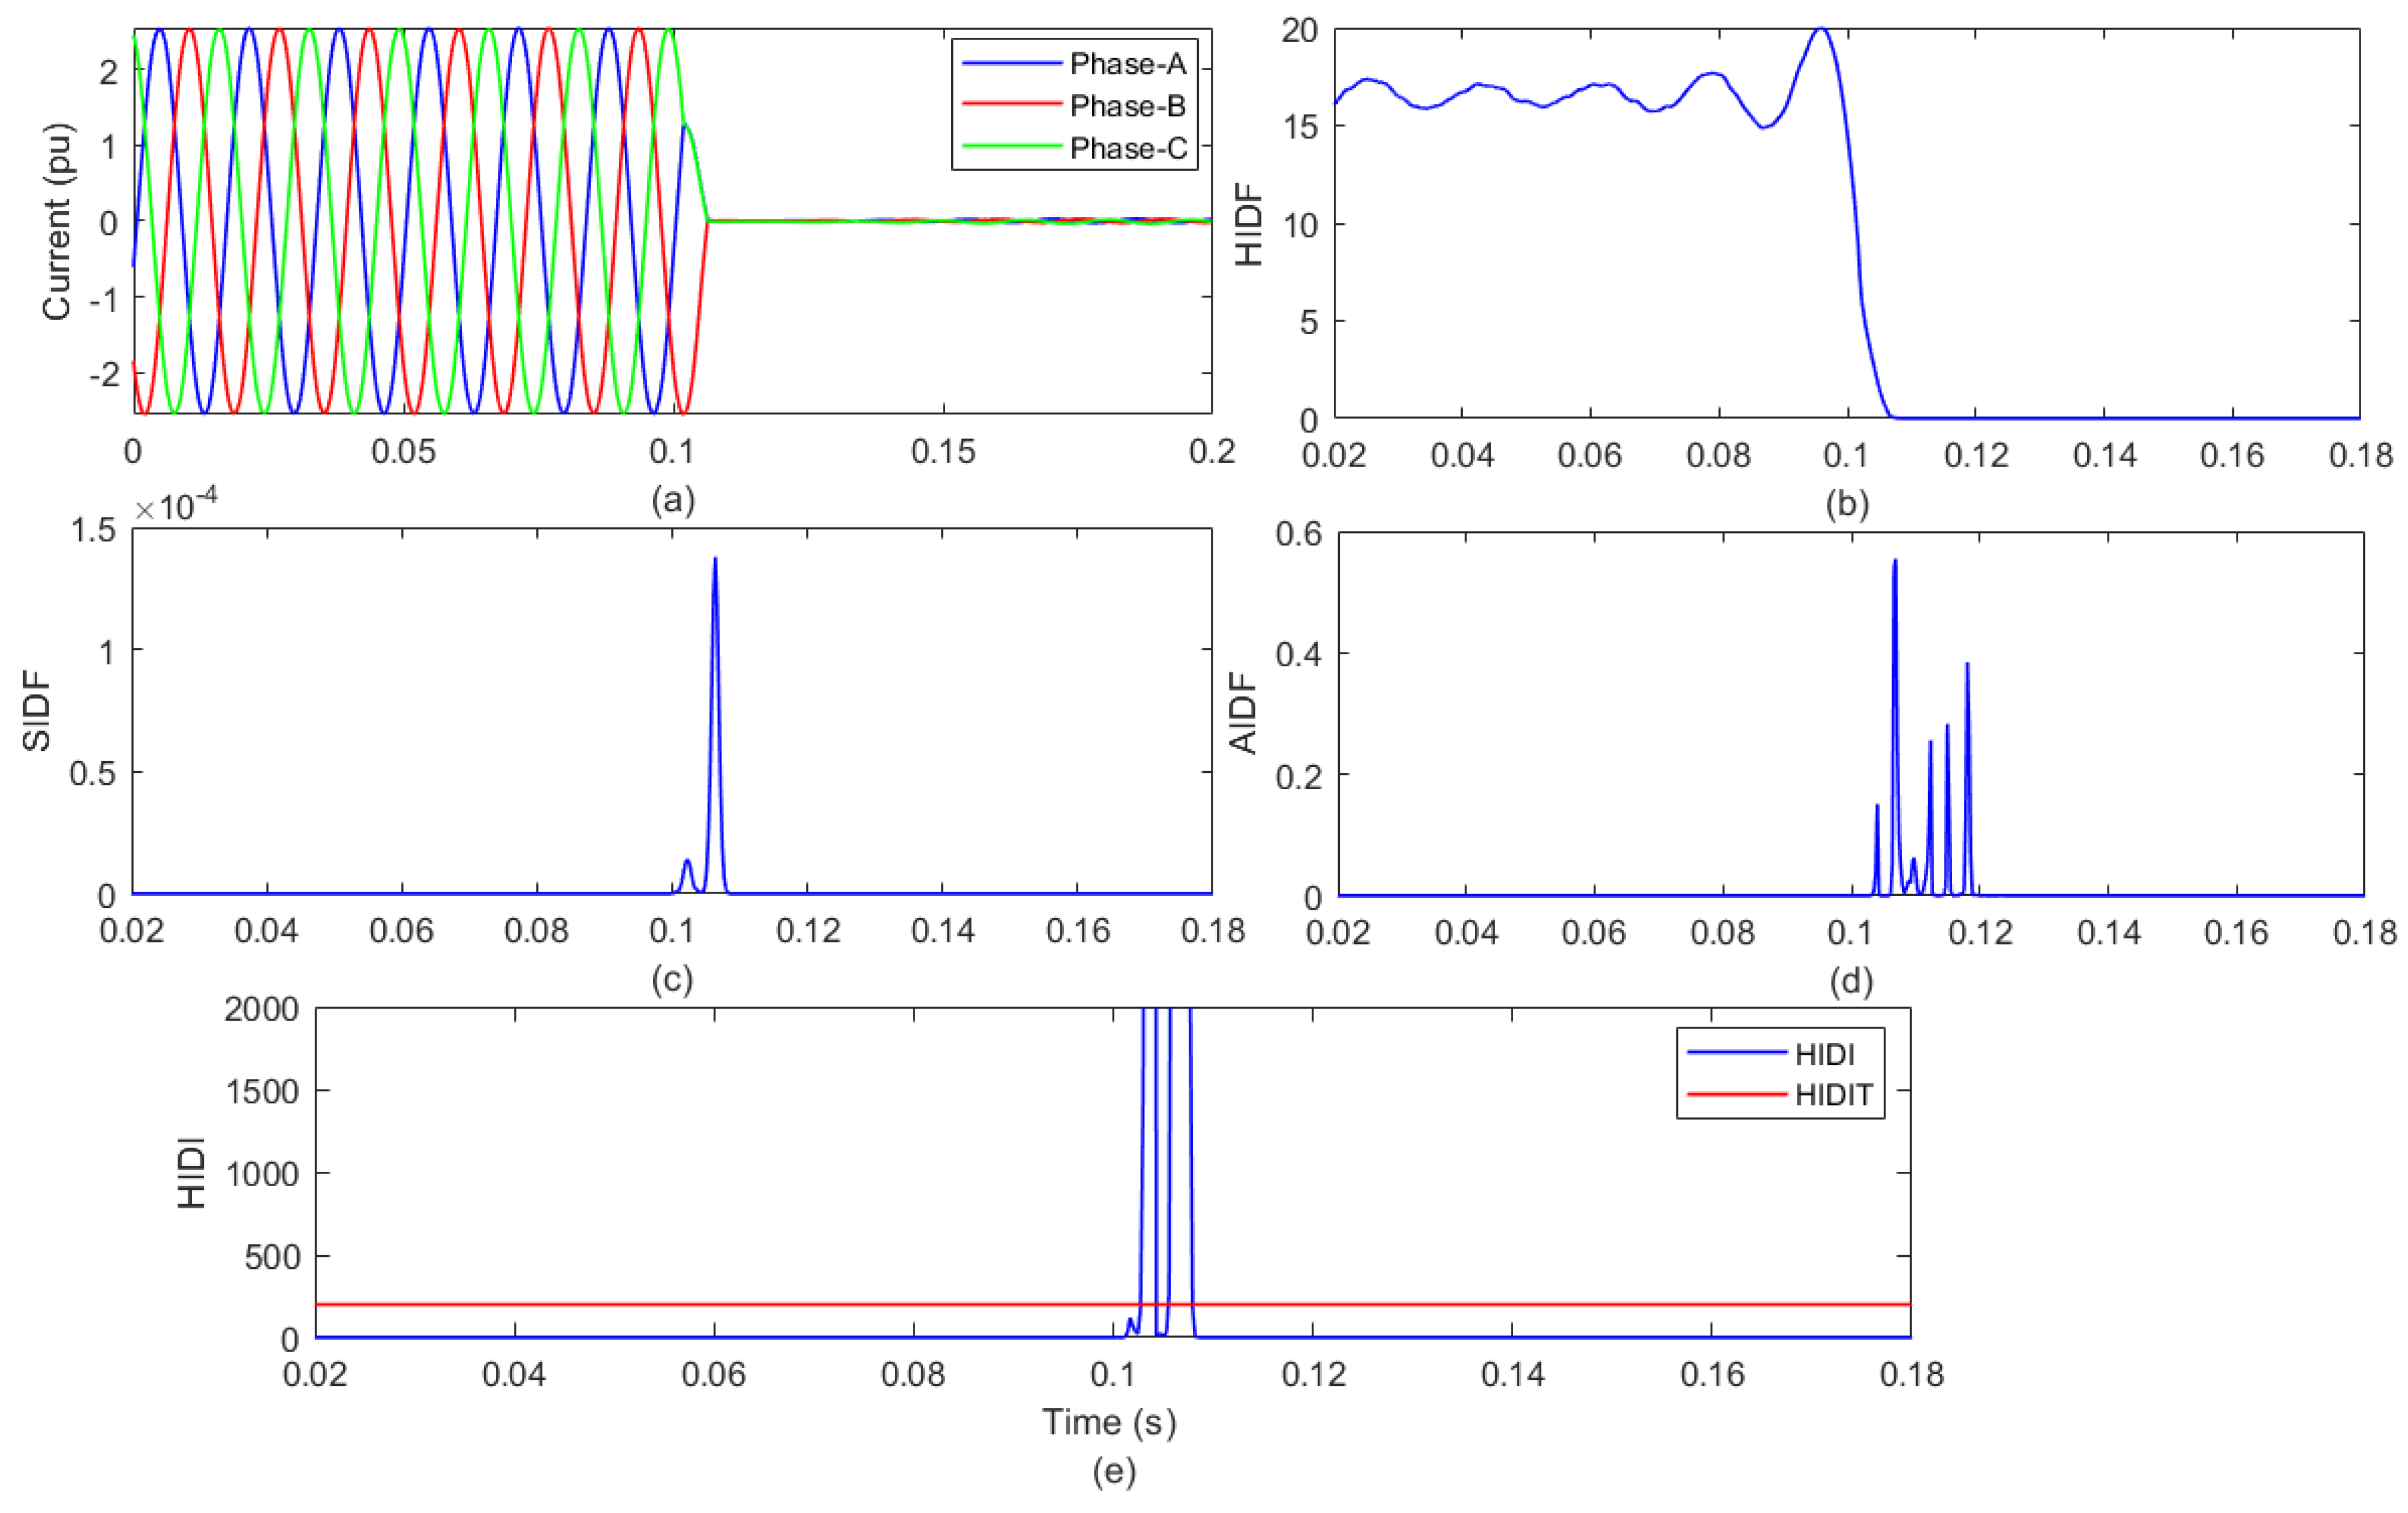
4.4. High Penetration Level of RE (100%)

The test system was simulated considering a generation mix of 2 MW solar power and 3 MW wind power to meet the load demand of the test system of 5 MVA. Hence, an RE penetration level of 100% was achieved. The IFS switch was opened at 0.1 s to form the island of the test system. The currents of all phases were captured on node 632 of the test system. The current signals were processed using the HIDM to evaluate the HIDI, as demonstrated in Figure 8. It was inferred that the peak magnitude of the HIDI is zero before island formation and becomes higher than the HIDIT. However, the peak magnitude is low relative to the HIDIFT. Hence, the peak value of the HIDI falls in the islanding event zone. Therefore, an islanding condition with a 100% RE penetration level is effectively detected, and this is differentiated from both faulty and operational events. Further, the peak magnitude of the HIDI for 100% RE penetration is higher compared to the scenario of 50% RE penetration.

5. Testing of HIDM to Identify and Discriminate the Fault Events from Islanding Events: Simulation Results and Discussion

In this section, the discussion of the results for the identification of fault conditions and discriminating the same from islanding events is included. The investigated fault conditions include phase to ground (LG), phase to phase (LL), two phases to ground (LLG), three phases (LLL), and three phases to ground (LLL). The current signals used to obtain the results of fault detection demonstrated in this section were synthetically generated by simulation studies performed on the test system of a utility network with the RE generators described in Figure 1 using the MATLAB software.

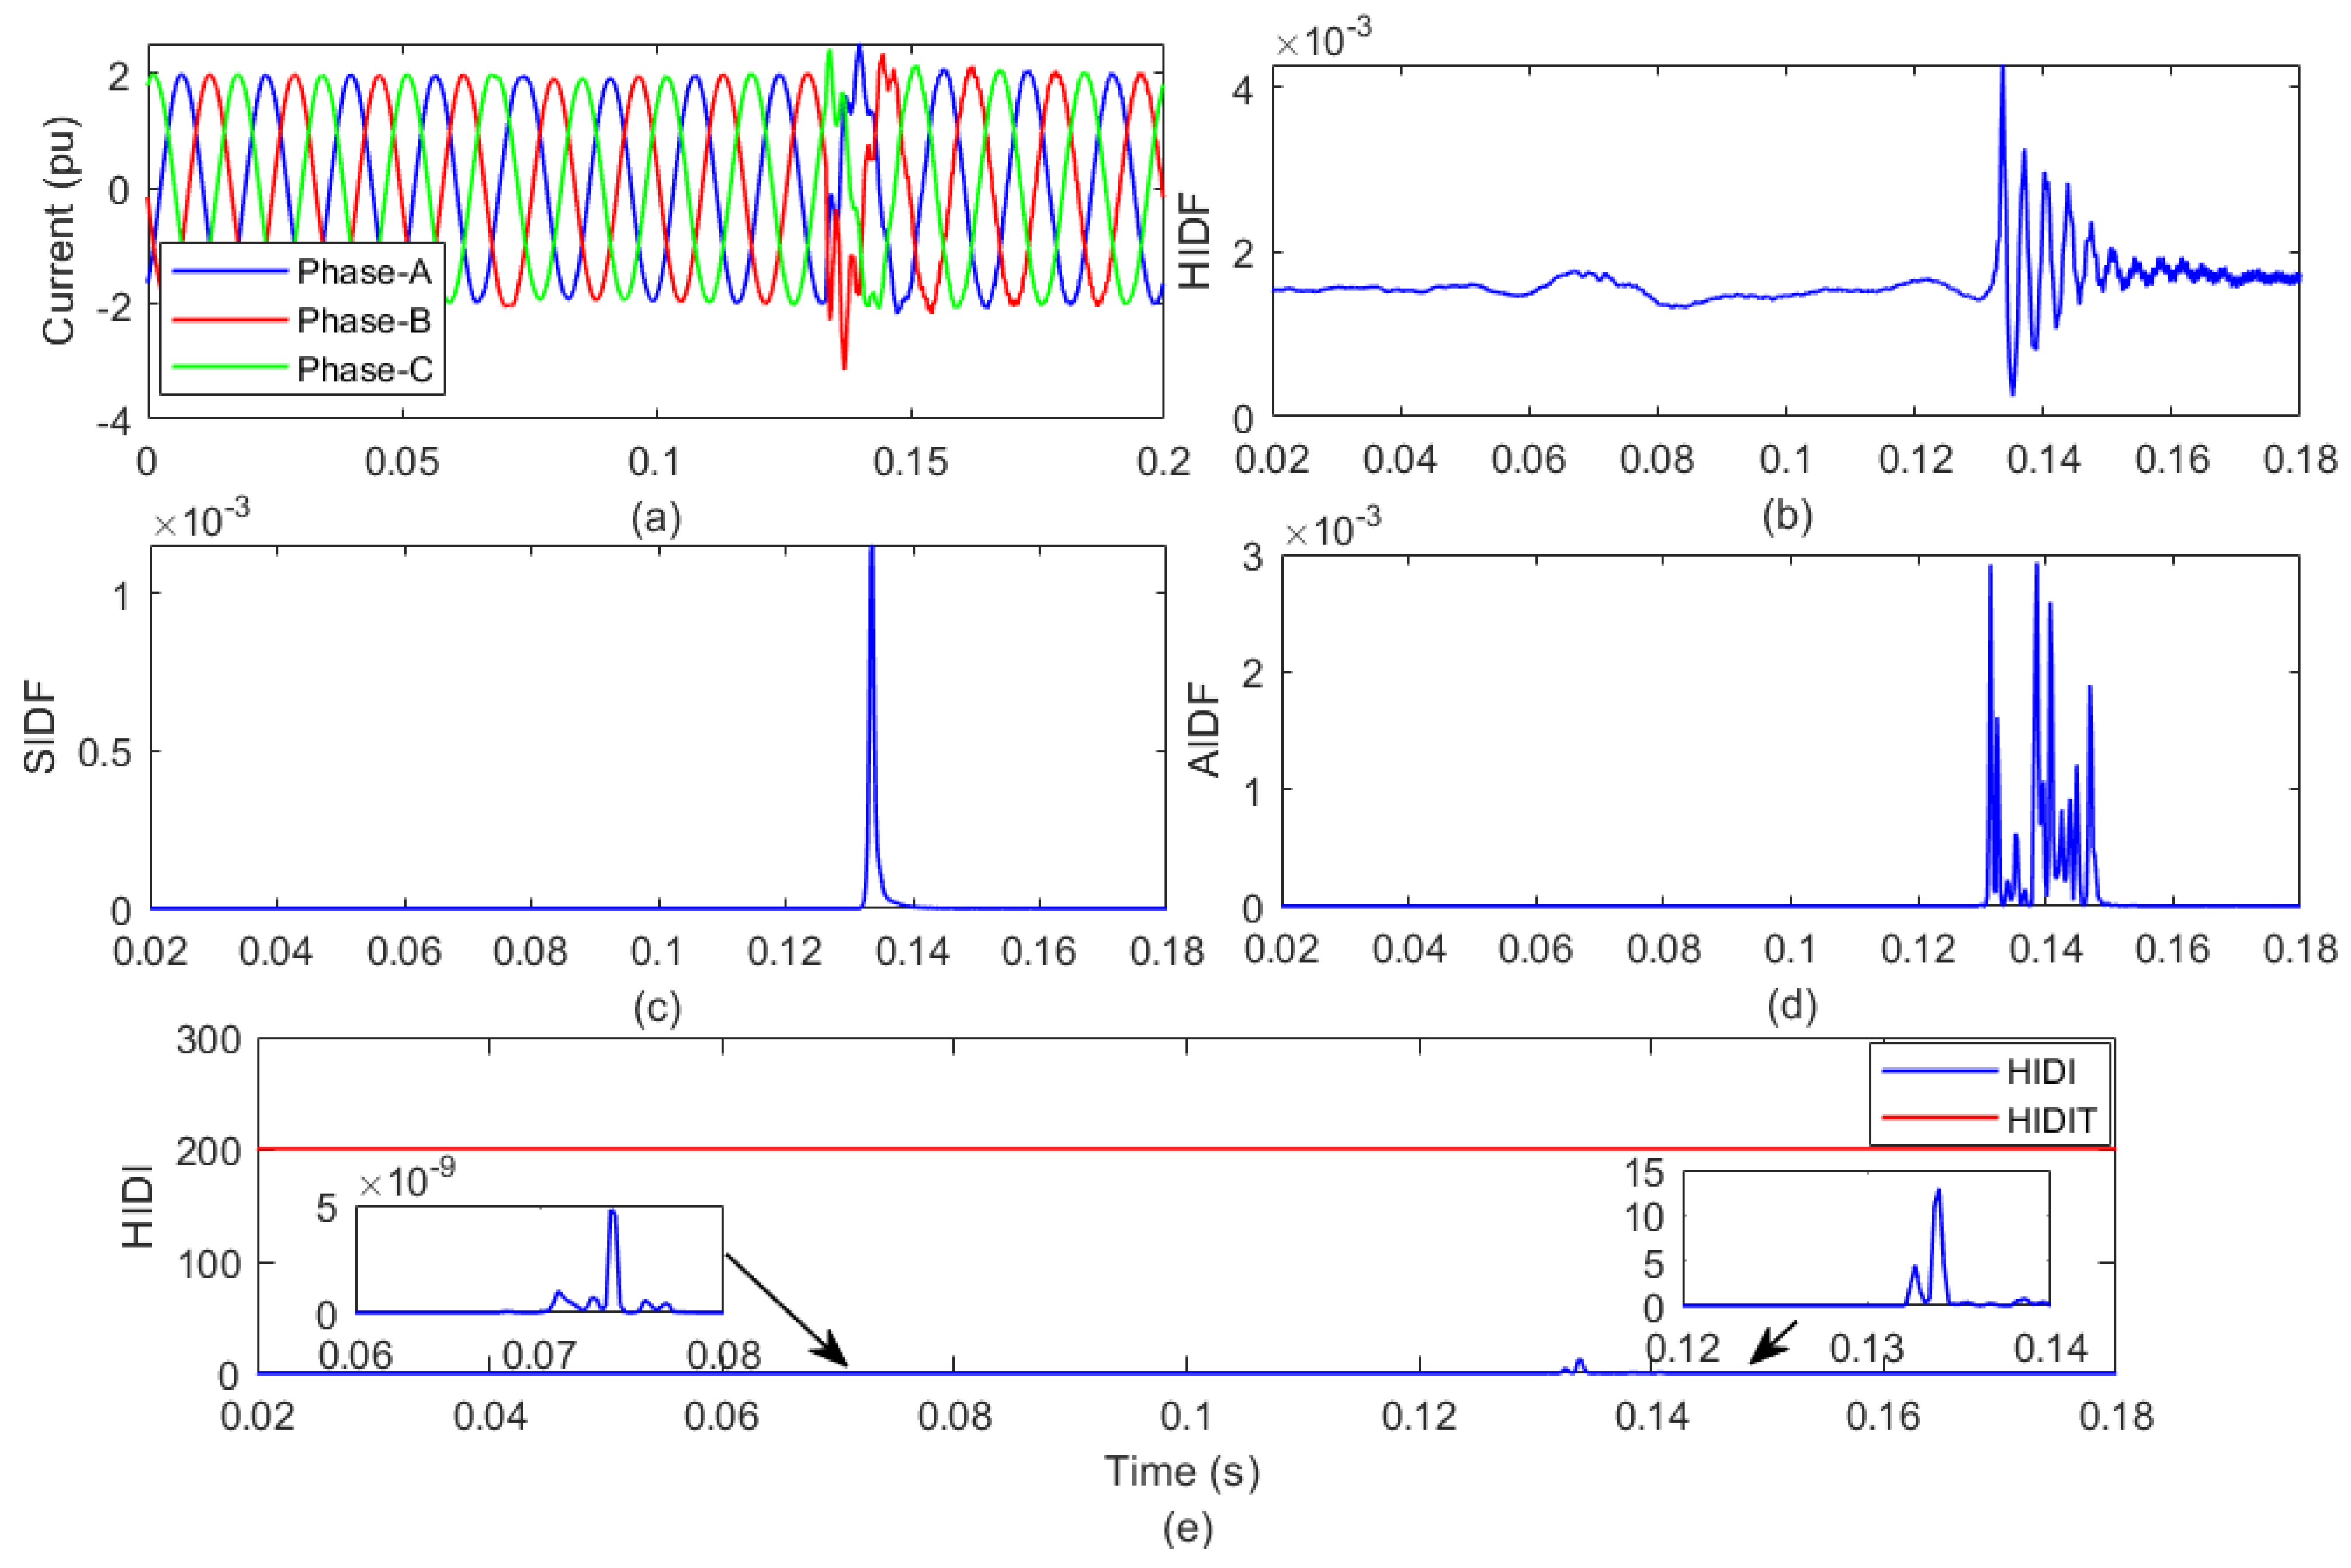
5.1. Phase to Ground Fault

The test system was simulated with generation from both the WGP and SGP. An LG fault was realized at 0.1 s on junction 671 of the test system. The currents of each phase were captured at junction 632 of the test system. The current signals were processed using the proposed method to compute the HIDF, SIDF, AIDF, and HIDI. The current waveform of all phases with the LG fault, HIDF, SIDF, AIDF, and HIDI, are depicted in Figure 9a–e in their respective order. The maximum magnitude of the HIDI and the computational time of the HIDM for the condition of the LG fault are included in Table 3 and Table 4, respectively.
Figure 9a depicts that the current of phase A increases after the LG fault at 0.1 s, while the currents of phases B and C remain at the same value. The peak of the HIDF increased after the LG fault, as elaborated in Figure 9b. Figure 9c elaborates that the value of the SIDF becomes high at the moment of LG fault occurrence, which is zero before and after the LG fault. Figure 9d illustrates that the value of the AIDF is zero prior to and after the LG fault and becomes high at the moment of the LG fault. However, spikes are observed for a window of one cycle. Figure 9e elaborates that the value of the HIDI is zero prior to the LG fault event and becomes higher than the HIDIFT at the moment of fault. Hence, the peak value of the HIDI falls in the fault event zone. Therefore, LG fault events in the presence of both the WGP and SGP are effectively detected and also differentiated from both islanding and operational conditions. The computational time of the HIDM for LG fault event detection with both the WGP and SGP is 1.320318 ms.

5.2. Phase to Phase Fault

The test system was simulated with generation from both the WGP and SGP. An LL fault was realized at 0.1 s on junction 671 of the test system. The currents of every phase were captured at junction 632 of the test system. The current signals were decomposed using the HIDM for computing the HIDF, SIDF, AIDF, and HIDI. The current waveforms of all phases with the LL fault and HIDI are elaborated in Figure 10a,b, respectively. The maximum value of the HIDI and the computational time of the HIDM for the LL fault are included in Table 3 and Table 4, respectively.
Figure 10a depicts that the current of phases A and B becomes high due to the LL fault event at 0.1 s, while the current of phase C remains unaltered. Figure 10b elaborates that the magnitude of the HIDI is zero prior to the LL fault and becomes higher than the HIDIFT due to the LL fault. Hence, the peak value of the HIDI falls in the fault event zone. Therefore, LL fault events with both the WGP and SGP are efficiently detected and also differentiated from both the islanding and operational conditions. The computational time of the HIDM for LL fault event detection with both the WGP and SGP is 1.631831 ms.

5.3. Two Phases to Ground Fault

The test system was simulated with generation from both the WGP and SGP. An LLG fault was realized at 0.1s on junction 671 of the test system. The currents of every phase were captured at junction 632 of the test system. The current signals were decomposed using the HIDM for computing the HIDF, SIDF, AIDF, and HIDI. The HIDI for the LLG fault event is depicted in Figure 11. The maximum magnitude of the HIDI and the computational time of the HIDM for the LLG fault are included in Table 3 and Table 4, respectively.
Figure 11 illustrates that the magnitude of the HIDI is zero prior to the LLG fault event and attains values higher than the HIDIFT due to the LLG fault. Hence, the peak magnitude of the HIDI falls in the fault event zone. Therefore, LLG fault events with the WGP and SGP are efficiently detected and also differentiated from both islanding and operational conditions. The computational time of the HIDM for LLG fault event detection with both the WGP and SGP is 0.418473 ms.

5.4. Three-Phase Fault

The test system was simulated with generation from both the WGP and SGP. An LLL fault was realized at 0.1s on node 671 of the test system. The currents of every phase were captured at junction 632 of the test system. The current signals were processed by applying the HIDM to compute the HIDF, SIDF, AIDF, and HIDI. The current waveform of all phases with the LLL fault and HIDI is depicted in Figure 12. The maximum magnitude of the HIDI and the computational time of the HIDM in the event of an LLL fault are included in Table 3 and Table 4, respectively.
Figure 12a depicts that the current of every phase increases due to the LLL fault at 0.1 s. Figure 12b elaborates that the magnitude of the HIDI is zero before the LLL fault event and becomes higher than the HIDIFT due to the LLL fault. Hence, the peak magnitude of the HIDI falls in the fault event zone. Therefore, LLL faults with both the WGP and SGP are efficiently detected and also differentiated from both the islanding and operational conditions. The computational time of the HIDM for LLL fault event detection with both the WGP and SGP is 1.397293 ms.

5.5. Three Phases to Ground Fault

The test system was simulated with generation from both the WGP and SGP. An LLLG fault was realized at 0.1s on junction 671 of the test system. The currents of every phase were recorded at junction 632 of the test system. The current signals were processed using the HIDM for computing the HIDF, SIDF, AIDF, and HIDI. The HIDI for the LLLG fault is depicted in Figure 13. The maximum magnitude of the HIDI and the computational time of the HIDM for the LLL fault are included in Table 3 and Table 4, respectively.
Figure 13 elaborates that the magnitude of the HIDI is zero prior to the LLLG fault and becomes higher than the HIDIFT due to the LLLG fault. Hence, the peak magnitude of the HIDI falls in the fault event zone. Therefore, LLLG faults with the WGP and SGP are efficiently detected and also differentiated from both islanding and operational conditions. The computational time of the HIDM for LLLG fault event detection with both the WGP and SGP is 0.629446 ms.

6. Testing of HIDM to Identify and Discriminate the Operational Events from Islanding Events: Simulation Results and Discussion

This section discusses the results to detect operational conditions and differentiate them from islanding conditions. The investigated operational events include the feeder operation, capacitor operation, and load operation. The current signals used to obtain the results of operational event detection demonstrated in this section were synthetically generated by simulation studies performed on the test system of a utility network with the RE generators described in Figure 1 using the MATLAB software. These switching events may be for maintenance purposes or for load curtailment purposes.

6.1. Feeder Operation

The test system was simulated with generation from both the WGP and SGP. A feeder opening event was simulated by opening the switch between junctions 671 and 692 at 0.0667 s and re-closing at 0.133 s. The currents of every phase were captured at junction 632 of the test system. The current signals were processed by applying the HIDM for computing the HIDF, SIDF, AIDF, and HIDI. The current waveform of all phases with feeder operation events (HIDF, SIDF, AIDF, and HIDI) is depicted in Figure 14a–e, respectively. The maximum magnitude of the HIDI and the computational time of the HIDM for the event of feeder operation are tabulated in Table 3 and Table 4, respectively.
Figure 14a illustrates that small-magnitude variations of the current in all phases are observed at the moments of feeder opening and closing. The value of the HIDF decreases at the moment of feeder opening and, again, increases at the moment of feeder closing with small-magnitude oscillations, as detailed in Figure 14b. Figure 14c elaborates that the value of the SIDF becomes high at the moment of feeder opening and closing. At all other times, the SIDF is zero. Figure 14d elaborates that the value of the AIDF becomes high at the moment of feeder opening and closing. Figure 14e elaborates that the value of the HIDI becomes high at the moment of feeder operation and closing, but the peak value is always less than the HIDIT, which falls in the operational event zone. Therefore, feeder operation events in the presence of both the WGP and SGP are effectively detected and also differentiated from both islanding and fault conditions. The computational time of the HIDM for operational event detection with both the WGP and SGP is 0.247305 ms.

6.2. Capacitor Operation

The test system was simulated with generation from both the WGP and SGP. A capacitor operation condition was simulated by disconnecting the capacitor of rating 600 kVAR connected on junction 675 of the test system at 0.0667 s and re-connecting at 0.133 s. The currents of all phases were captured at junction 632 of the test system. The current signals were processed by the application of the HIDM for computing the HIDF, SIDF, AIDF, and HIDI. The HIDI for the capacitor operation event is depicted in Figure 15. The maximum magnitude of the HIDI and the computational time of the HIDM in the event of capacitor operation are tabulated in Table 3 and Table 4, respectively.
Figure 15 elaborates that the magnitude of the HIDI becomes high at the time of capacitor disconnecting and re-connecting, but the peak magnitude is always less than the HIDIT, which falls in the operational event zone. Therefore, capacitor operation events in the presence of both the WGP and SGP are efficiently detected and also differentiated from both islanding and fault conditions. The computational time of the HIDM for the capacitor operation event detection with both the WGP and SGP is 0.282738 ms.

6.3. Load Operation

The test system was simulated with generation from both the WGP and SGP. The load operation condition was simulated by disconnecting the load of 843 kW and 462 kVAR connected on junction 675 of the test system at 0.0667 s and re-connecting at 0.133 s. The current signals were processed using the HIDM for computing the HIDF, SIDF, AIDF, and HIDI. The HIDI for the load operation event is depicted in Figure 16. The maximum magnitude of the HIDI and computational time of the HIDM for the event of load operation are tabulated in Table 3 and Table 4, respectively.
Figure 16 elaborates that the magnitude of the HIDI becomes high at the time of load disconnecting and re-connecting, but the peak magnitude is always less than the HIDIT, which falls in the operational event zone. Therefore, load operation events in the presence of both the WGP and SGP are effectively detected and also differentiated from both islanding and fault conditions. The computational time of the HIDM for load operation event detection with both the WGP and SGP is 0.344931 ms.

7. Real-Time Validation of HIDM

This section validates the HIDM by extracting the current signals from a practical distribution network facility. The HIDM was tested for detecting the islanding event that occurred on a practical distribution power system network in Rajasthan State, India. The investigated distribution feeder is rated at 33 kV and emanates from a 33/11 kV grid sub-station (GSS). The details of the load and RE plants connected to the distribution feeder are included in Table 7. This feeder was manually tripped from the 33/11 kV GSS, and the current was captured for a period of 0.2 s. The current samples were recorded using a disturbance recorder (DR) installed on the feeder. The sampling rate used by the disturbance recorder is 2.5 × 10 4 samples per second. The main components of the DR include the central processing unit (CPU) module, measurement input module, binary input module with hysteresis of input current levels, and power supply module. The modules are integrated into internal communication buses. Communication is performed using an Ethernet network channel and various protocols. This current is processed using the HIDM, and the HIDI was evaluated, which is illustrated in Figure 17. It was observed that the peak value of the HIDI was equal to 1.5881 × 10 6 , which falls in the islanding event zone of the proposed HIDM. Hence, it has been established that the HIDM effectively detected the islanding condition incident on the real-time distribution feeder.

8. Relative Performance of HIDM

The performance of the multi-variable HIDM was compared with the islanding-detection method (IDM) using the DWT [24], the IDM using a combination of the slantlet transform and RPNN [25], the IDM using the wavelet transform multi-resolution (WT-MRA)-based image data [26], and the IDM based on the Deep Neural Network (DNN) [27]. The performance was compared in terms of the RE penetration level for which the IDM detects events effectively, the sampling frequency, the computational time, the noise level for which the performance of the IDM is not affected, and the NDZ. A performance comparison study of the considered IDMs is provided in Table 8. This shows that, in terms of the parameters considered for the comparison study, the performance of the HIDM is better compared to that of the IDMs using DWT, a hybrid combination of the slantlet transform and RPNN.

9. Conclusions

A multi-variable hybrid islanding-detection method supported by a hybrid combination of the ST, HT, and ALC to process the current signals to design the HIDI has been presented. The proposed HIDM is efficient in detecting islanding conditions in the presence of generation from the WGP, SGP, and both from the WGP and SGP with a minimal NDZ. This was achieved for RE penetration levels of 50% and 100% in the test network. The HIDM is efficient for detecting islanding conditions in the scenario of a high noise level of 20   d B SNR. The HIDM is also effective at detecting fault conditions like LG, LL, LLG, LLL, and LLLG. The HIDM effectively discriminates between islanding conditions and fault ones. The HIDM effectively discriminates between islanding conditions and operational ones. The HIDM is also effective at identifying the islanding condition on a real-time distribution feeder of a practical utility grid. The performance of the HIDM is better compared to islanding-detection methods using DWT, an IDM using WT-MRA-based image data, an IDM using DNN, and an IDM using a combination of the slantlet transform and RPNN in terms of the RE penetration level for which the IDM detects events effectively, the sampling frequency, the computational time, the noise level for which the performance of the IDM is not affected, and also the NDZ. The study was completed on an IEEE-13 bus test feeder using the MATLAB software.

Author Contributions

All authors contributed equally. All authors have read and agreed to the published version of the manuscript.

Funding

This research received no external funding.

Data Availability Statement

Data are contained within the article.

Conflicts of Interest

Author Peixiong Liu was employed by the company Hanjiang Water Resources and Hydropower (Group) Co., Ltd. Hydropower Company. The remaining authors declare that the research was conducted in the absence of any commercial or financial relationships that could be construed as a potential conflict of interest.

Abbreviations

The following abbreviations are used in this manuscript:
AC  Alternating current
AIDF  Alienation islanding-detection factor
ALC  Alienation Coefficient
CIDF  Co-variance islanding-detection factor
CPU  Central processing unit
DC  Direct current
DF-T  Distribution feeder transformer
DFIG  Doubly fed induction generator
DG  Distributed generator
DNN  Deep Neural Network
DR  Disturbance recorder
DWT   Discrete wavelet transform
GSS  Grid sub-station
HIDF  Hilbert islanding-detection factor
HIDI  Hybrid islanding-detection indicator
HIDIFT  Hybrid islanding-detection indicator fault threshold
HIDIT  Hybrid islanding-detection indicator threshold
HIDM  Hybrid islanding-detection method
HT  Hilbert transform
IDM  Islanding-detection method
IEEE  Institute of Electrical and Electronics Engineering
IFS  Island formation switch
IWF  Islanding weight factor
LGPhase to ground fault
LLPhase to phase fault
LLGTwo phases to ground fault
LLLThree-phase fault
LLLGThree phases to ground fault
MATLABMatrix laboratory
NDZNon-detection zone
PMUPhasor measurement unit
PCCPoint of common coupling
PQPower quality
PVPhotovoltaic
RERenewable energy
RPNNRidgelet probabilistic neural network
SGPSolar generation plant
SGP-GTSolar generation plant generator transformer
SIDFStockwell islanding-detection factor
SNRSignal-to-noise ratio
STStockwell transform
UG-TUtility grid transformer
WGPWind generation plant
WGP-GTWind generation plant generator transformer
WT-MRAWavelet transform multi-resolution

References

  1. Wei, W.; Shao, C.; Huang, H.; Zhuang, W. A novel formula for plastic hinge length of reinforced concrete columns in seismic regions. Struct. Infrastruct. Eng. 2022, 1–16. [Google Scholar] [CrossRef]
  2. Alhasnawi, B.N.; Jasim, B.H. A new energy management system of on-grid/off-grid using adaptive neuro-fuzzy inference system. J. Eng. Sci. Technol. 2020, 15, 3903–3919. [Google Scholar]
  3. Alhasnawi, B.N.; Jasim, B.H.; Rahman, Z.A.S.A.; Guerrero, J.M.; Esteban, M.D. A Novel Internet of Energy Based Optimal Multi-Agent Control Scheme for Microgrid including Renewable Energy Resources. Int. J. Environ. Res. Public Health 2021, 18, 8146. [Google Scholar] [CrossRef]
  4. Timbus, A.; Oudalov, A.; Ho, C.N. Islanding detection in smart grids. In Proceedings of the 2010 IEEE Energy Conversion Congress and Exposition, Atlanta, GA, USA, 12–16 September 2010; pp. 3631–3637. [Google Scholar] [CrossRef]
  5. Larik, N.A.; Tahir, M.F.; Elbarbary, Z.S.; Yousaf, M.Z.; Khan, M.A. A comprehensive literature review of conventional and modern islanding-detection methods. Energy Strategy Rev. 2022, 44, 101007. [Google Scholar] [CrossRef]
  6. Kumari, J.S.; Lenine, D.; Satish, A.; Kumar, T.S.; Kalaivani, C.; Kumar, M.D.; Swamy, G.K.; Suresh, Y.V.; Reddy, J.N.; Kumar, J.K.; et al. A model predictive Goertzel algorithm based active islanding detection for grid integrated photovoltaic systems. Microprocess. Microsystems 2022, 95, 104706. [Google Scholar] [CrossRef]
  7. Shukla, A.; Dutta, S.; Sadhu, P.K. An island detection approach by μ-PMU with reduced chances of cyber attack. Int. J. Electr. Power Energy Syst. 2021, 126, 106599. [Google Scholar] [CrossRef]
  8. Nale, R.; Biswal, M.; Kishor, N. A passive communication based islanding-detection technique for AC microgrid. Int. J. Electr. Power Energy Syst. 2022, 137, 107657. [Google Scholar] [CrossRef]
  9. Elshrief, Y.A.; Asham, A.D.; Bouallegue, B.; Ahmed, A.; Helmi, D.H.; Abozalam, B.A.; Abd-Elhaleem, S. An innovative hybrid method for islanding detection using fuzzy classifier for different circumstances including NDZ. J. Radiat. Res. Appl. Sci. 2022, 15, 129–142. [Google Scholar] [CrossRef]
  10. Alsabban, M.; Bertozzi, O.; Ahmed, S. Analysis and Verification of Islanding Detection Techniques for Grid-integrated PV Systems. In Proceedings of the 2023 IEEE PES Conference on Innovative Smart Grid Technologies—Middle East (ISGT Middle East), Abu Dhabi, United Arab Emirates, 12–15 March 2023; pp. 1–5. [Google Scholar] [CrossRef]
  11. Shaik, A.G.; Mahela, O.P. Power quality assessment and event detection in hybrid power system. Electr. Power Syst. Res. 2018, 161, 26–44. [Google Scholar] [CrossRef]
  12. Kersting, W. Radial distribution test feeders. IEEE Trans. Power Syst. 1991, 6, 975–985. [Google Scholar] [CrossRef]
  13. Mahela, O.P.; Shaik, A.G. Detection of power quality events associated with grid integration of 100kW solar PV plant. In Proceedings of the 2015 International Conference on Energy Economics and Environment (ICEEE), Greater Noida, India, 27–28 March 2015; pp. 1–6. [Google Scholar] [CrossRef]
  14. Mahela, O.P.; Shaik, A.G. Comprehensive overview of grid interfaced solar photovoltaic systems. Renew. Sustain. Energy Rev. 2017, 68, 316–332. [Google Scholar] [CrossRef]
  15. Mahela, O.P.; Shaik, A.G. Comprehensive overview of grid interfaced wind energy generation systems. Renew. Sustain. Energy Rev. 2016, 57, 260–281. [Google Scholar] [CrossRef]
  16. Mahela, O.P.; Shaik, A.G. Power Quality Detection in Distribution System with Wind Energy Penetration Using Discrete Wavelet Transform. In Proceedings of the 2015 Second International Conference on Advances in Computing and Communication Engineering, Dehradun, India, 1–2 May 2015; pp. 328–333. [Google Scholar] [CrossRef]
  17. Derviškadić, A.; Frigo, G.; Paolone, M. Beyond Phasors: Modeling of Power System Signals Using the Hilbert Transform. IEEE Trans. Power Syst. 2020, 35, 2971–2980. [Google Scholar] [CrossRef]
  18. Feldman, M. Hilbert transform in vibration analysis. Mech. Syst. Signal Process. 2011, 25, 735–802. [Google Scholar] [CrossRef]
  19. Arranz, R.; Ángel, P.; Rodríguez, A.; Muñoz, F. Fault location in Transmission System based on Transient Recovery Voltage using Stockwell transform and Artificial Neural Networks. Electr. Power Syst. Res. 2021, 201, 107569. [Google Scholar] [CrossRef]
  20. Rodríguez, A.; Aguado, J.; Martín, F.; López, J.; Muñoz, F.; Ruiz, J. Rule-based classification of power quality disturbances using S-transform. Electr. Power Syst. Res. 2012, 86, 113–121. [Google Scholar] [CrossRef]
  21. Ray, P.K.; Kishor, N.; Mohanty, S.R. Islanding and Power Quality Disturbance Detection in Grid-Connected Hybrid Power System Using Wavelet and S-Transform. IEEE Trans. Smart Grid 2012, 3, 1082–1094. [Google Scholar] [CrossRef]
  22. Rathore, B.; Shaik, A.G. Wavelet-Alienation based protection scheme for multi-terminal transmission line. Electr. Power Syst. Res. 2018, 161, 8–16. [Google Scholar] [CrossRef]
  23. Samet, H.; Hashemi, F.; Ghanbari, T. Minimum non detection zone for islanding detection using an optimal Artificial Neural Network algorithm based on PSO. Renew. Sustain. Energy Rev. 2015, 52, 1–18. [Google Scholar] [CrossRef]
  24. Sharma, R.; Singh, P. Islanding detection and control in grid based system using wavelet transform. In Proceedings of the 2012 IEEE Fifth Power India Conference, Murthal, India, 19–22 December 2012; pp. 1–4. [Google Scholar] [CrossRef]
  25. Ahmadipour, M.; Hizam, H.; Othman, M.L.; Radzi, M.A.M.; Murthy, A.S. Islanding detection technique using Slantlet Transform and Ridgelet Probabilistic Neural Network in grid-connected photovoltaic system. Appl. Energy 2018, 231, 645–659. [Google Scholar] [CrossRef]
  26. Kong, X.; Xu, X.; Yan, Z.; Chen, S.; Yang, H.; Han, D. Deep learning hybrid method for islanding detection in distributed generation. Appl. Energy 2018, 210, 776–785. [Google Scholar] [CrossRef]
  27. Hussain, A.; Mirza, S.; Kim, C.H. Islanding detection and classification of non-islanding disturbance in multi-distributed generation power system using deep neural networks. Electr. Power Syst. Res. 2023, 224, 109807. [Google Scholar] [CrossRef]
Figure 1. Test utility network with renewable energy generators.
Energies 17 00877 g001
Figure 2. Hybrid islanding-event-detection algorithm.
Energies 17 00877 g002
Figure 3. Different zones of events.
Energies 17 00877 g003
Figure 4. Detection of islanding with WGP and SGP generation: (a) current waveform; (b) HIDF; (c) SIDF; (d) AIDF; (e) HIDI.
Energies 17 00877 g004
Figure 5. HIDI for islanding event with generation from both WGP and SGP in the scenario of 20 dB SNR noise.
Energies 17 00877 g005
Figure 6. Detection of islanding event with generation from SGP: (a) current waveform; (b) HIDF; (c) SIDF; (d) AIDF; (e) HIDI.
Energies 17 00877 g006
Figure 7. Detection of islanding event with generation from WGP: (a) current waveform; (b) HIDF; (c) SIDF; (d) AIDF; (e) HIDI.
Energies 17 00877 g007
Figure 8. HIDI for islanding with 100% RE penetration.
Energies 17 00877 g008
Figure 9. Testing of HIDM for LG fault: (a) current waveform; (b) HIDF; (c) SIDF; (d) AIDF; (e) HIDI.
Energies 17 00877 g009
Figure 10. Testing of HIDM for LL fault: (a) current waveform; (b) HIDI.
Energies 17 00877 g010
Figure 11. HIDI for testing the HIDM to identify LLG fault.
Energies 17 00877 g011
Figure 12. Testing of HIDM for LLL fault event: (a) current waveform; (b) HIDI plot.
Energies 17 00877 g012
Figure 13. HIDI for the event of LLLG fault.
Energies 17 00877 g013
Figure 14. Testing of HIDM for feeder operation: (a) current waveform; (b) HIDF; (c) SIDF; (d) AIDF; (e) HIDI.
Energies 17 00877 g014
Figure 15. HIDI for the event of capacitor operation.
Energies 17 00877 g015
Figure 16. HIDI for the event of load operation.
Energies 17 00877 g016
Figure 17. HIDI for islanding event on a practical distribution feeder.
Energies 17 00877 g017
Table 1. Load details of test system.
S. No.Node NumberLoad Detail
1634400 kW and 290 kVAr
2645170 kW and 125 kVAr
3646230 kW and 132 kVAr
4652128 kW and 86 kVAr
56711255 kW and 718 kVAr
6675843 kW and 462 kVAr
7692170 kW and 151 kVAr
8611170 kW and 80 kVAr
9632–671200 kW and 116 kVAr distributed load
Table 2. Technical data of transformers equipped in test system.
S. No.Transformer SymbolMAV RatingVoltage Ratio
1UG-T10 MVA115 kV/4.16 kV
2DF-T5 MVA4.16 kV/0.48 kV
3WGP-GT5 MVA4.16 kV/0.575 kV
4SGP-GT1 MVA4.16 kV/0.270 kV
Table 3. Maximum magnitude of HIDI.
S. No.Islanding/Fault/Operational EventMaximum HIDI
1Islanding event with WGP and SGP generation2928.9
2Islanding event with generation from SGP 5.9226 × 10 8
3Islanding event with generation from WGP 5.2911 × 10 5
4Phase to ground fault 1.9427 × 10 11
5Phase to phase fault 2.441 × 10 11
6Two phases to ground fault 2.3601 × 10 13
7Three-phase fault 1.6289 × 10 13
8Three phases to ground fault 2.6822 × 10 12
9Feeder operation9.028
10Capacitor operation49.782
11Load operation 5.699 × 10 6
Table 4. Islanding detection time of the HIDM.
S. No.Islanding/Fault/Operational EventComputational Time (ms)
1Islanding event with WGP and SGP generation0.278454
2Islanding event with generation from SGP1.650991
3Islanding event with generation from WGP0.443420
4Phase to ground fault1.320318
5Phase to phase fault1.631831
6Two phases to ground fault0.418473
7Three-phase fault1.397293
8Three phases to ground fault0.629446
9Feeder operation0.247305
10Capacitor operation0.282738
11Load operation0.344931
Table 5. Peak magnitude of HIDI for different incidence angles.
S. No.Islanding Incidence AnglePeak Magnitude of HIDI
1 0 ° 2928.9
2 30 ° 1.5447 × 10 5
3 60 ° 1.5447 × 10 5
4 90 ° 64,472
5 120 ° 64,472
6 150 ° 4.1167 × 10 5
7 180 ° 4.1167 × 10 5
Table 6. Islanding NDZ of HIDM.
Δ P Voltage (pu)
(kW) 0.92 0.94 0.96 0.98 0.99 1.0 1.02 1.06 1.1
7IDIDIDIDIDIDIDIDID
6IDIDIDIDIDIDIDIDID
5IDIDIDIDIDINDIDIDID
4IDIDIDIDINDINDINDIDID
3IDIDIDIDINDINDINDINDID
2IDIDIDINDINDINDINDINDIND
1IDIDIDINDINDINDINDINDIND
0IDIDINDINDINDINDINDINDIND
−1IDIDIDINDINDINDINDINDIND
−2IDIDIDIDINDINDINDINDIND
−3IDIDIDIDINDINDINDINDID
−4IDIDIDIDIDINDINDIDID
−5IDIDIDIDIDIDIDIDID
−6IDIDIDIDIDIDIDIDID
−7IDIDIDIDIDIDIDIDID
Table 7. Load and RE generation details of real-time distribution feeder.
S. No.Name of ParameterQuantity of Parameter
1Load9.28 MW
2Rooftop solar plant0.9 MW
3Solar PV plant3.40 MW
4Wind power plant1.0 MW
Table 8. Islanding non-detection zone of HIDM.
S. No.ReferenceTechniqueRE Penetration LevelSampling FrequencyComputational TimeNoise Level for Performance of Algorithm Is Not DeterioratedNDZ
1[24]DWT 20 % 6.4 kHz2 s40 dB SNRHigh
2[25]Slantlet transform+RPNN 10 % 19.8 kHz0.17 s25 dB SNRHigh
3[26]WT-MRA-based image data40%6.4 kHz0.18 s20 dB SNRModerate
4[27]DNN 46.67 % 3.84 kHz2 s30 dB SNRNot investigated
5Proposed HIDMST + HT + ALC 50 % and 100 % 3.84 kHzt < 2 ms20 dB SNRModerate
Disclaimer/Publisher’s Note: The statements, opinions and data contained in all publications are solely those of the individual author(s) and contributor(s) and not of MDPI and/or the editor(s). MDPI and/or the editor(s) disclaim responsibility for any injury to people or property resulting from any ideas, methods, instructions or products referred to in the content.

