1. Introduction
Globally, the implementation of sustainable energy sources has emerged as a prominent approach towards achieving a shift in the global energy landscape and mitigating the effects of climate change [
1,
2]. The global recognition and appreciation of geothermal resources as a promising source of energy for the future, as well as for energy conservation and the reduction in emissions, is widely acknowledged by nations worldwide [
3]. Geothermal energy is a kind of sustainable energy that has grown in popularity because of its several advantages [
4], including the capacity to generate electricity, heat or cool buildings, and assist industrial activities [
5]. It is regarded as a clean energy source with minimum environmental effect, generates low amounts of greenhouse gases, and is widely available. These benefits have made geothermal energy a popular choice for many people, and it is recognized as a stable source of continuous power generation [
6,
7]. China has abundant geothermal resources, accounting for 7.9% of the world’s total geothermal energy reserves with a value of 3.06 × 10
18 kWh/yr [
2,
8]. Geothermal resource assets, dissemination, and growth in China are investigated, and the key challenges facing geothermal resource exploration and development in China are highlighted by [
7,
9]. The subterranean thermal water resources that operate at middle and low temperatures are predominantly situated in various basins such as North China, Songliao, Ordos, Northern Jiangsu, and Hanjiang. Additionally, these resources are also found in the mountainous regions of the southeast coast and Jiaodong Peninsula [
10,
11]. Taiwan and Southern Tibet, Western Yunnan, Western Sichuan, and other locations have the most high-temperature subterranean thermal water resources [
12].
Reshi Town has an excellent location and an abundance of geothermal resources, including hot springs with temperatures exceeding 49 °C. The multi-level recycling process of these resources sets them apart. The development of geothermal energy in Reshi Town is compatible with the 13th Five-Year Plan’s aim of encouraging the use of new energy sources while ensuring sustainable resource development [
13]. The regions of contemporary volcanic activity and fault zones are rich in high-temperature geothermal resources [
14]. The circulation of thermal fluid requires both the existence of a deep high-temperature zone and the presence of tectonic faults [
15,
16]. Magnetotelluric, induced polarization, and joint profile methods are some of the geophysical methods that may be employed to scan the subsurface geothermal fluid and measure its electrical resistivity. Characterizing the geological structure that regulates the flow of geothermal fluid relies heavily on this kind of data [
17,
18]. Exploration depths range from a few tens of meters to more than 10 km using the MT technique, which relies on the Earth’s naturally occurring electromagnetic fields as a source to learn about the lateral and vertical resistivity variation in the subsurface [
19,
20]. The induced polarization (IP) approach is used for the purpose of obtaining anomalies in the form of a contrast between resistivity and chargeability values [
21]. To evaluate the very diverse subsurface formation, a single geophysical approach by itself is insufficient due to its lack of clarity [
22].
In this particular instance, the joint profile method was used first to determine the plane position distribution of fault structures in the study area; secondly, the magnetotelluric sounding method was used to determine the structural scale, deep occurrence, and water content of the main fault zones or broken zones; and thirdly, the main anomaly was determined by analyzing the results of the joint profile method and the magnetotelluric sounding method. The IP sounding work that was completed in the region had two purposes: it provided a foundation for establishing the site of the drilling as well as the water distribution along the fault structure, and it was performed to find out the water distribution along the fault structure.
2. Study Area
The Reshi Town is situated 64 km north of Taoyuan County in Hunan Province, near Cili County and Shimen County. It is in the low-temperature geothermal resource area and is situated in the southeast extension zone of the northeastern end of the Huayuan–Zhangjiajie–Cili regional deep, large heat-controlling fault in Hunan Province. The main structures of the regional structure are the Reshi anticline, the Qigushan compressive fault (F1), the Zhoujiarong torsional fault (F2), the Reshi extensional fault (F3), and the tension–torsion fracture of Xianniang Temple (F5). In addition, a torsional translational fault (F4) forms in the Reshihe Valley hot spring outcropping region.
The predominant lithology of the primary exposed strata in the region comprises medium-thick dolomite that is grey or off-white in color. This dolomite belongs to the Loushanguan Group, specifically the Middle and Upper Cambrian (∈
2-3 ls) strata. The geological formations present in the area include the Ordovician Nanjinguan Formation (O
1n), Fenxiang Formation (O
1f), and Honghuayuan Formation (O
1h), which consist of limestone, dolomitic limestone, and other related rocks. The Ordovician Dawan Formation (O
1d) is composed of limestone, marl limestone, and silicified limestone. The Middle Ordovician (O
2) is characterized by limestone and marl, while the Upper Ordovician (O
3) is composed of marl and siliceous rock. The Silurian (S) is represented by shale and sandy shale. The Middle Devonian system rock, specifically the quartz sand of the Yuntaiguan Formation (D
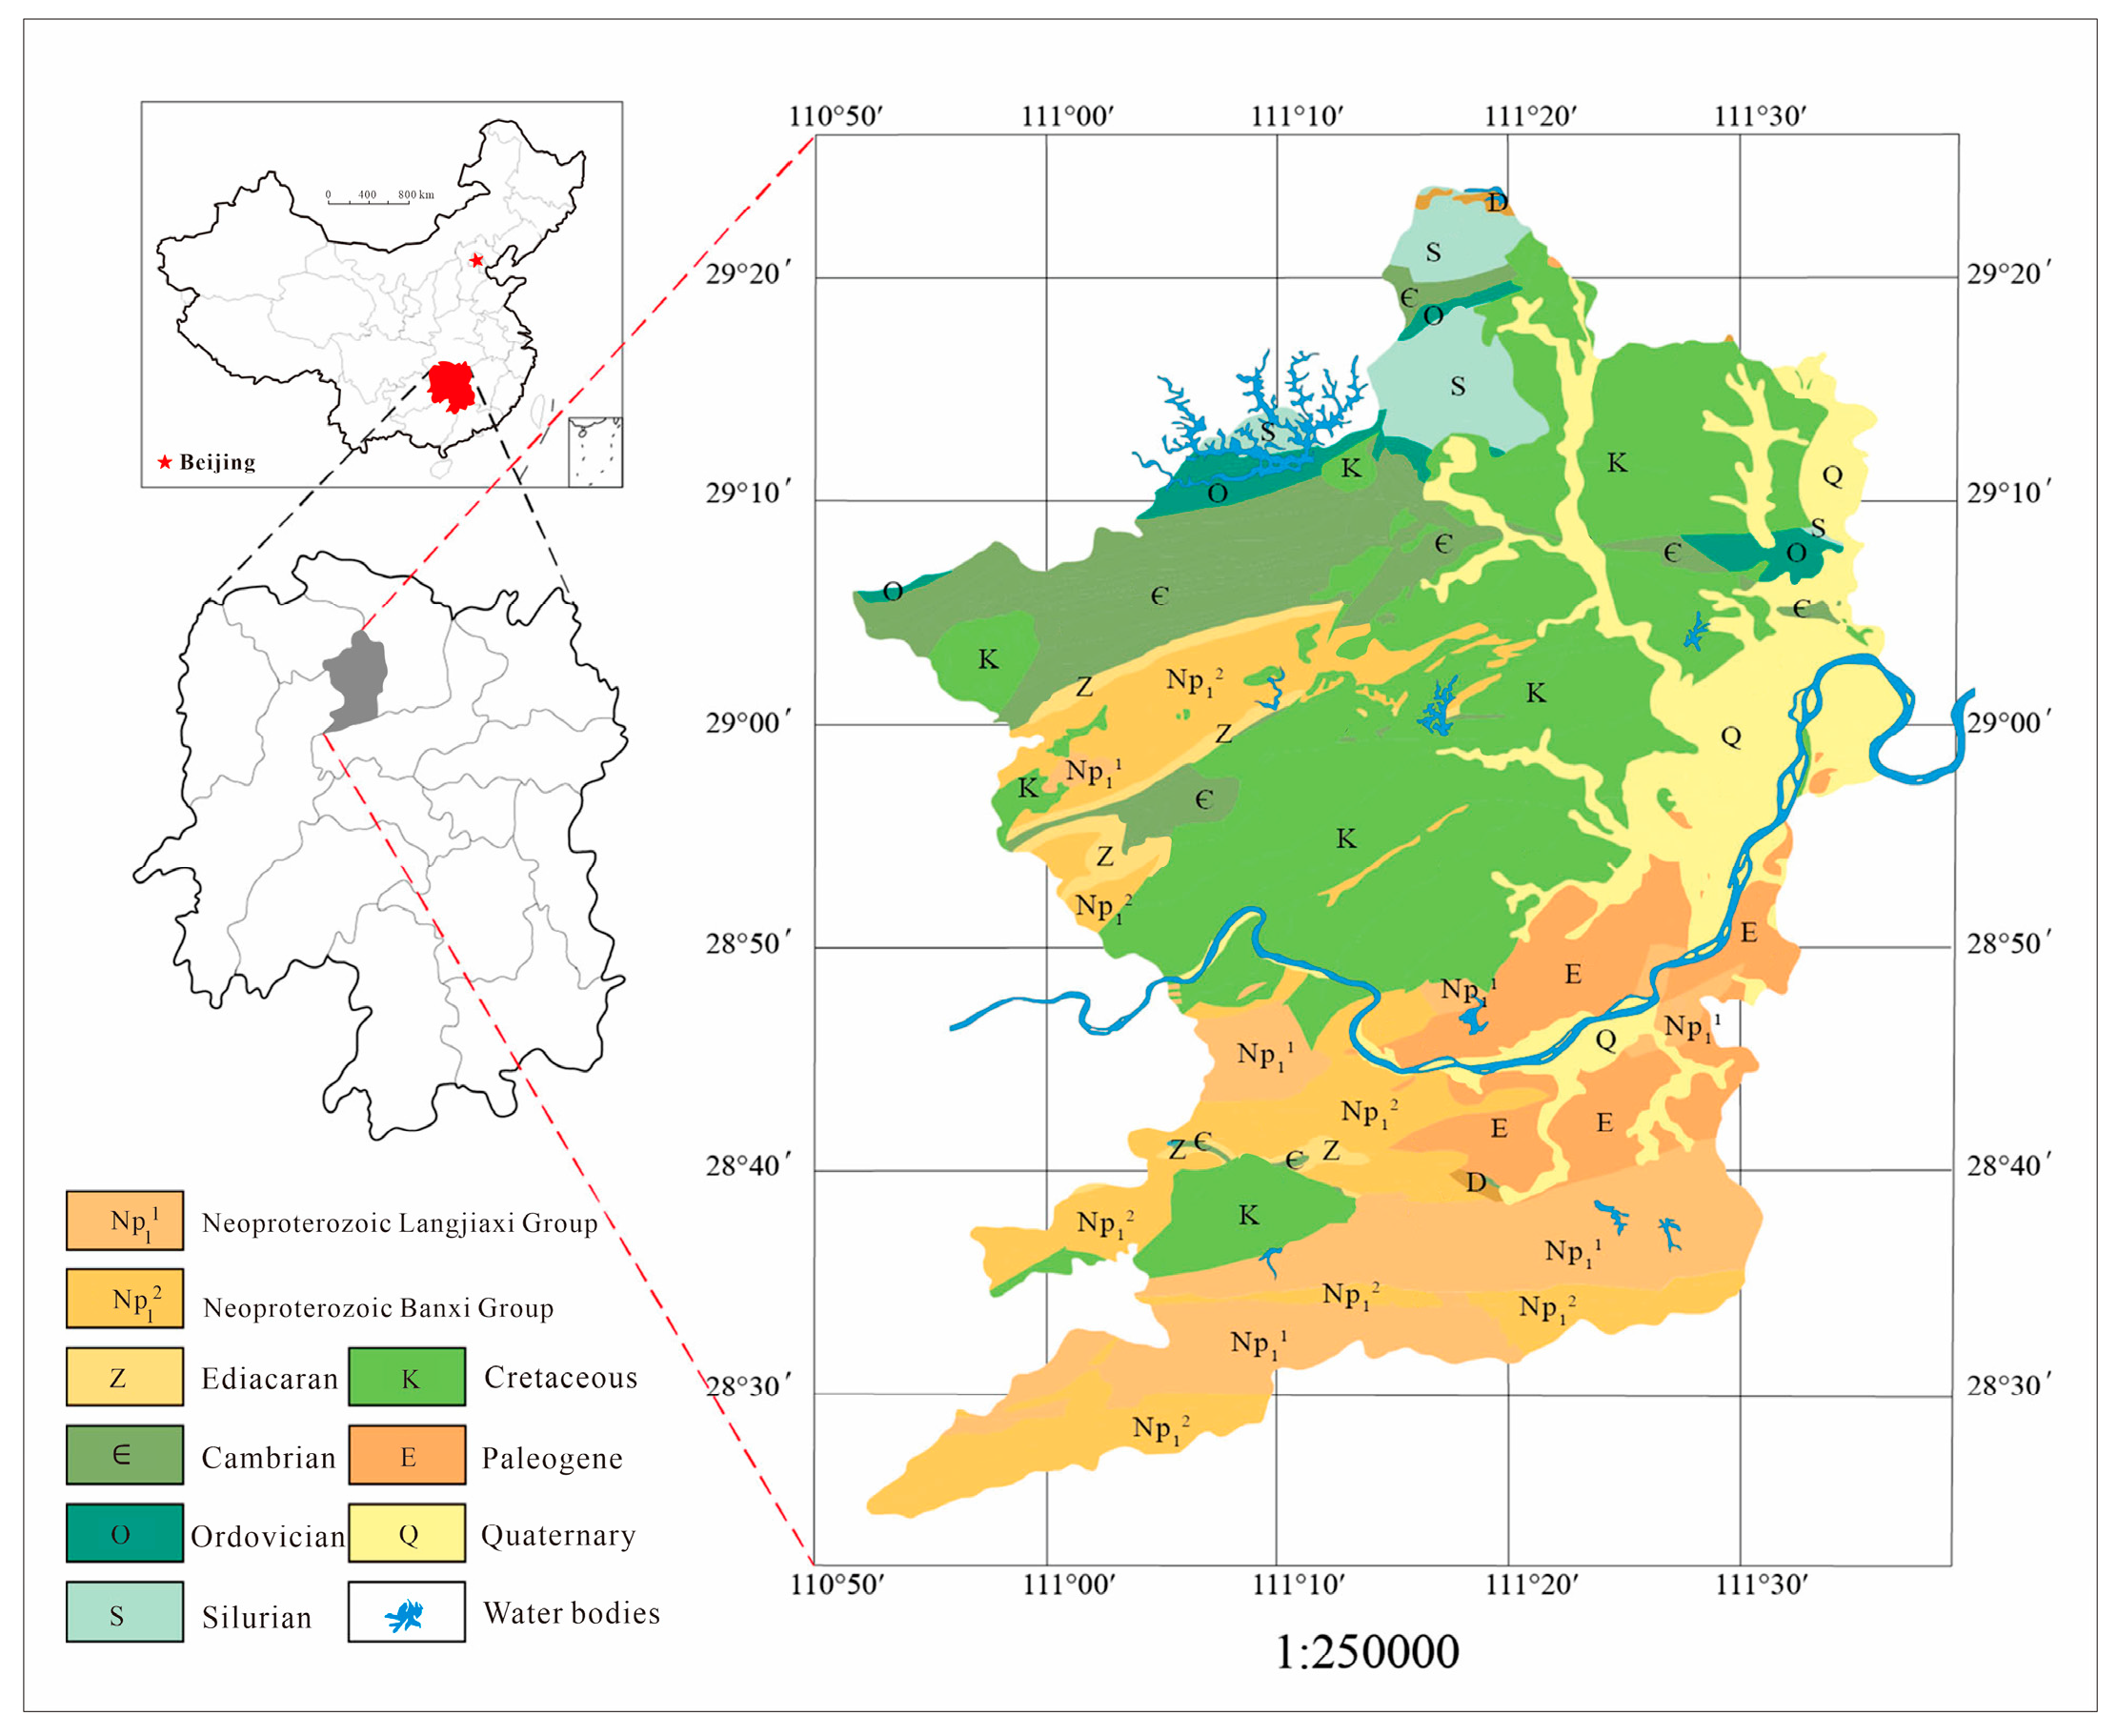
2yn), is composed of gray–yellow sandy shale. The Cretaceous (K) is characterized by argillaceous, calcareous siltstone, fine sandstone, and sandy mudstone interbedded with sandstone. The Tertiary (K) is composed of calcareous sandstone, siltstone, and related rocks. The Quaternary (Q
4) is characterized by clay, sand, glutenite, and other related rocks as shown in
Figure 1 [
16,
23].
The findings from the hydrogeological survey indicate that the strata in the region are mostly composed of dolomite from the Cambrian period, limestone from the Ordovician period, calcareous rock from the Cretaceous period, argillaceous siltstone, and overburden from the Quaternary period. Both the resistivity of sandstone and the resistivity of Quaternary overburden are quite low, with values ranging from 50 Ω·m to ~300 Ω·m. The high (200 Ω·m~4000 Ω·m) (
Table 1) resistivity zone is mainly caused by intact limestone. The resistivity of groundwater is typically less than 100 Ω·m, and the resistivity of the structural fracture zone containing water or mud is often low, just tens of ohms. Additionally, there is a substantial electrical difference between the fracture zone and the rock around it.
3. Working Principle of Geophysical Methods
3.1. Magnetotelluric Method
In order to differentiate between the surrounding rock and the target rock underground or to solve other geological problems like tectonics, the magnetotelluric sounding method uses the difference in electrical conductivity and magnetic permeability between the two as its main geophysical premise and then studies the distribution of the electromagnetic field in space and time in accordance with the principle of electromagnetic induction [
24]. Magnetotelluric sounding uses electromagnetic waves, and the penetration depths of these waves vary depending on their period. Due to the skin effect at high frequencies, the electromagnetic field may be limited to the shallow medium and not penetrate further into the Earth’s crust [
25]. Since the apparent resistivity is determined by the resistivity distribution of the deep medium, increasing the duration of the electromagnetic wave signal will cause it to penetrate deeper and deeper into the medium. The magnetotelluric method provides more interpretation parameters than the traditional direct current method, including magnetic (electric) reflection coefficient, anisotropy parameter, two-dimensional deviation, electrical axis orientation, inclination, etc., and can therefore be explored deeper than the latter [
26].
The magnetotelluric method (MT) uses the natural magnetotelluric field as the field source (frequency range is 0.001 Hz~10,000 Hz), belongs to the passive source electromagnetic method, and observes the electric field (Ex, Ey) and magnetic field components (Hx, Hy). The method has the advantages of light equipment, flexible work, and low cost. Its biggest weakness is that the signal of the natural electromagnetic field is too weak, and the measurement results are easily affected by human electromagnetic interference.
3.1.1. Instrument Used and Working Device
The Canadian Phoenix Geophysical Company’s V8 electrical technique workstation was chosen. It is stable and anti-interference. Filters eliminate external interference and improve field data collection.
Two pairs of horizontal electrodes and two magnetic sensors are set orthogonally; the azimuth variation is less than 1°; and the top of the horizontal magnetic coil is 8–10 m from the center. Two sets of electrodes and horizontal magnetic coils face true north (X) and true east (Y) (
Figure 2).
3.1.2. Data Processing
After the equipment calibration and acquisition, data processing has been completed. The magnetotelluric technique uses the subsurface medium’s resistivity distribution as its primary variable of interest. In order to analyze the distribution features of subsurface strata and structural changes, raw field data must be processed further using inversion to reveal the electrical structure’s distribution from the surface to depths of several kilometers. The goal of the data interpretation process is to increase the reliability and accuracy of the data by naturally combining electrical data with drilling.
Data processing has two stages: preprocessing and inversion. Denoising methods are used during the preprocessing step to eliminate noise and obtain precise impedance components. Data superposition is one method for reducing uncorrelated noise and ensuring that the noise at measurement sites is independent of the noise at the reference point to suppress correlated noise. Impedance is estimated using reliable technologies, such as M-estimation regression methods and the Hilbert transform, to provide unbiased results. Further, editing and smoothing techniques are used to remove distortions in the apparent resistivity and phase curves that arise from natural and cultural noise. Curve editing is the process of analyzing adjacent curves, eliminating distorted spots, and safeguarding delicate information. Commonly used for this purpose are static correction methods, such as spatial filtering and manual translation. The second step involves performing inversion processing to transform the frequency domain data into a geophysical model that accurately depicts the correlation between resistivity and depth. This methodology takes into account the topography and static displacement effects, leading to enhanced precision in the inversion outcomes.
3.2. Induced Polarization Sounding Method
The Chongqing Pentium CNC Research Institute’s WDJD-4 multipurpose DCIP equipment was chosen. The instrument’s stability and anti-interference capability mean it can shield itself from outside influences and keep data collected in the field accurate. A total of one Japanese Zeteng 5 kW generator, one DC transformer, two laptop computers, five walkie-talkies, five chargers, and seven thousand three hundred meters of power supply and measurement cables round out the auxiliary equipment.
3.2.1. Array Used
The array DCIP electric sounding technique was used for this geophysical prospecting (
Figure 3). In the field, first set the measuring electrode arrays P1, P2, Pn−1, and Pn of the multi-channel receiving system along the measuring line, then progressively extend the current electrode pair from the central position to both sides. All neighboring electrode pairs receive it simultaneously. To obtain shallow geoelectric information, the current electrode distance is gradually increased at arithmetic intervals inside the measurement profile and exponentially outside. A lengthy measurement profile requires numerous measurement configurations. The current electrode AB grows in distance until the maximum current electrode spacing is achieved, ending the first measurement configuration. Move the whole measurement array ahead by one array and progressively provide electricity to the electrode distance AB from big to tiny until the minimum electrode spacing is attained and the second measurement array terminates. Repeat until the measuring profile is complete.
In the context of the present study, each measurement configuration (e.g., 200, 240, 280, 320, 360, and 400) was subjected to scrutiny with respect to the current electrode distance parameters. Notably, the maximum current electrode spacing, denoted as AB, was set at 3240 m.
3.2.2. Data Processing
Following approval, compile and preserve diverse primary sources such as records, graphs, discs, and survey line coordinates in a cataloged and archived format. To ensure data reliability, it is recommended to remove any abrupt variations or inconsistent points. It is advisable to create visual representations such as curves or plane diagrams for ease of interpretation. Perform two-dimensional inversion processing on the induced polarization (IP) sounding data and produce a map of the resulting inversion outcome. Based on the processed outcomes of the maps and in close conjunction with geological information, it is recommended to adhere to the principles and procedures of proceeding from the known to the unknown, from point to surface, from simple to complex, and from local to the entire area.
3.3. Joint Profile Method
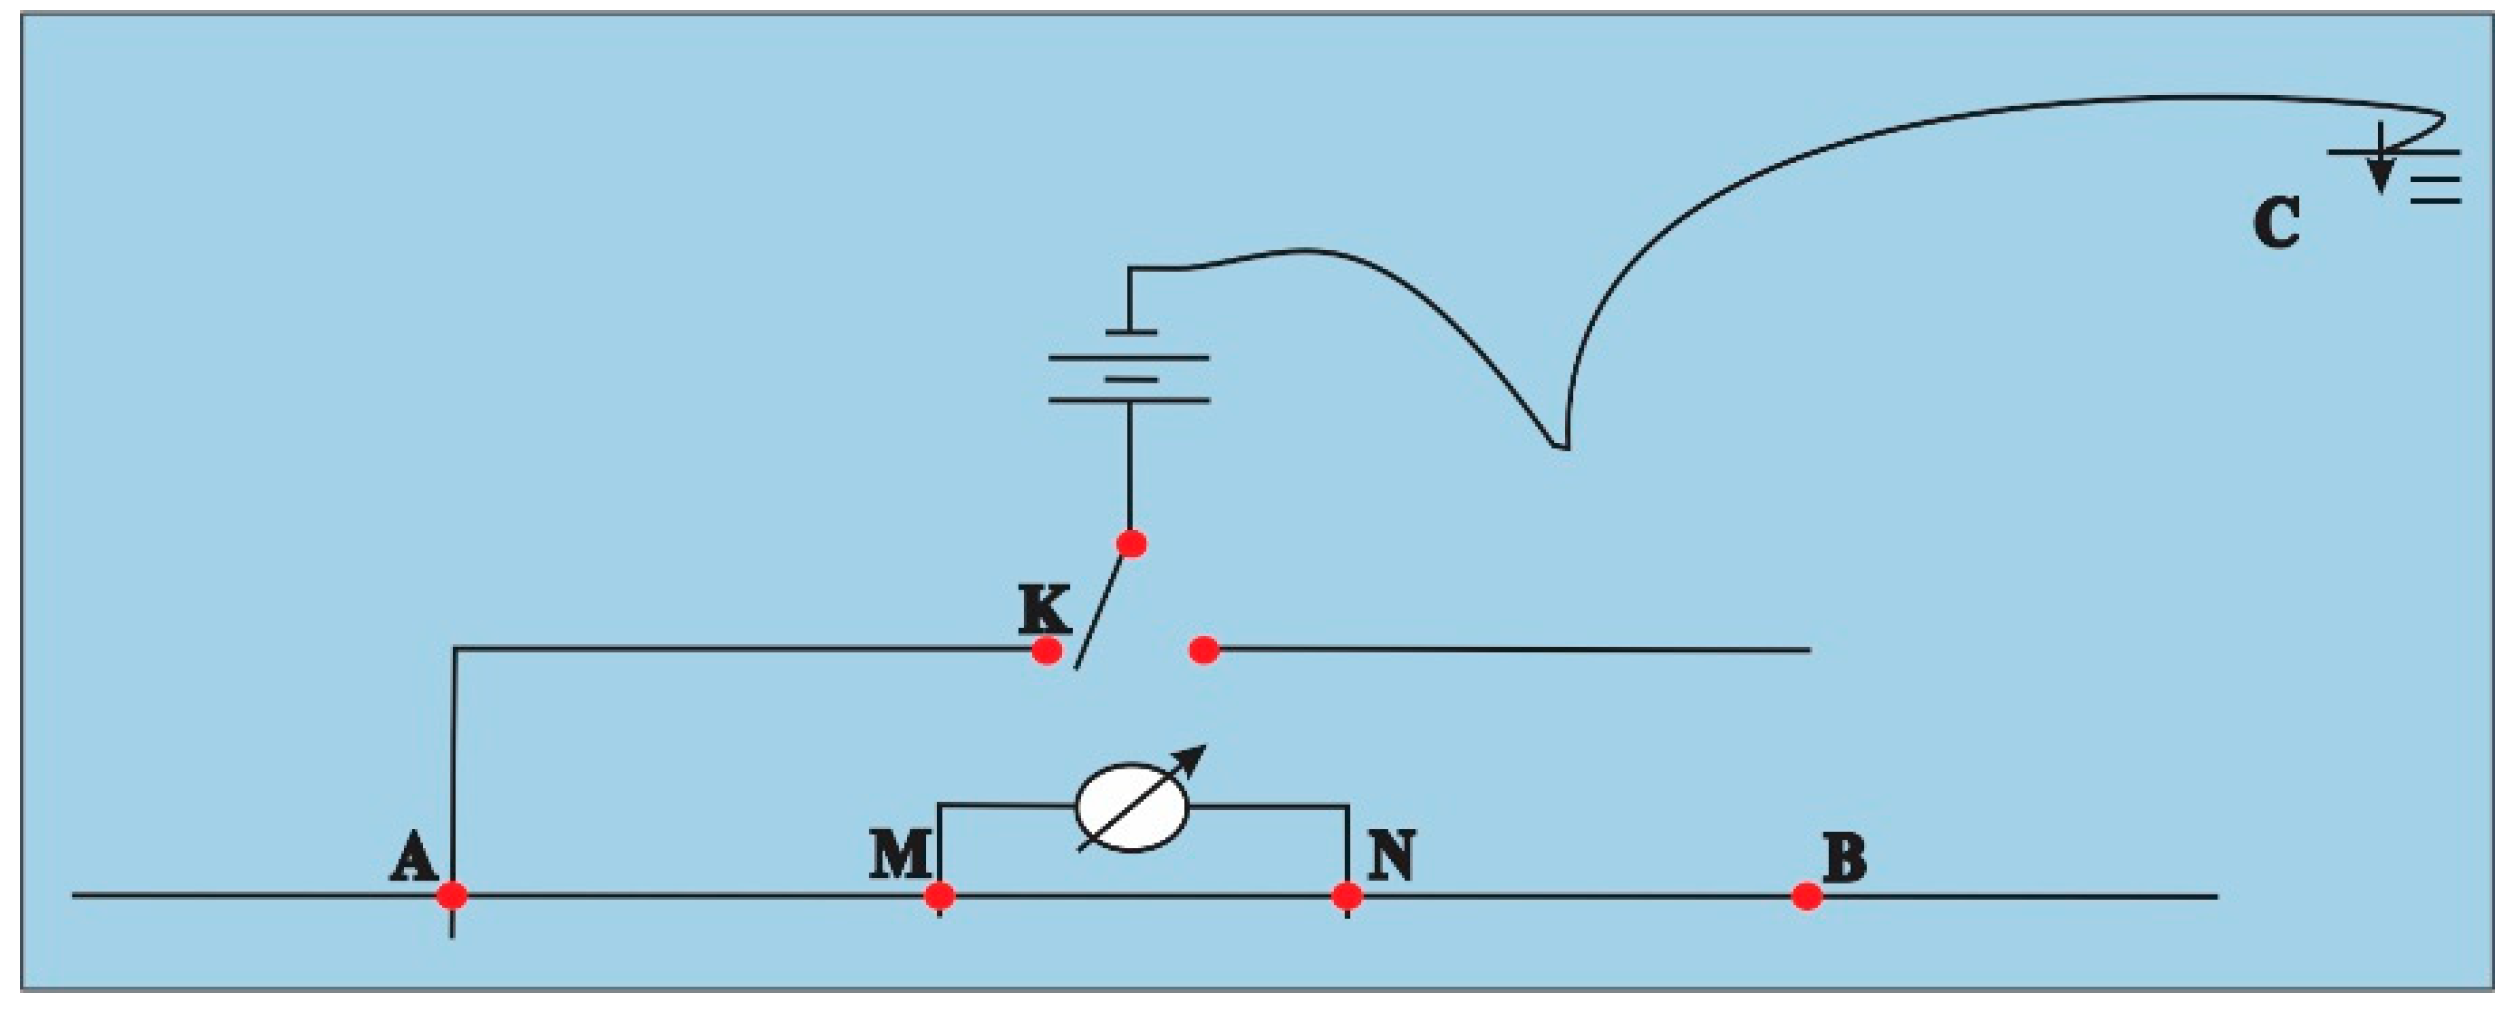
The joint profile approach combines AMN∞ and MNB∞ pole–dipole. Pole–dipole arrangements have one current electrode at infinity, replaced with the joint profile approach that combines AMN∞ and MNB∞ pole–dipole array. Pole–dipole arrays have one current electrode at infinity. AO = BO if O is the midway point between measuring electrodes M and N. The current electrode C is usually placed on the vertical line of the survey line and is more than five times AO (CO > 5AO) from it. Roll the four AMNB electrodes along the measuring line, keeping the spacing between them constant, and use the midway O as the measurement point (
Figure 4). Each measurement point measured the AMN arrangement and MNB arrangement
ρsA and
ρsB. AMN and BMN measurement results will create an orthogonal point above the low-resistivity body or show synchronized decreased resistivity. The junction point and curve asymmetry indicate the presence and form of the low-resistivity body.
The joint profile technique offers notable benefits such as high resolution and clear identification of low resistance anomalies, making it the optimal approach for detecting and tracking well-conductive steep structures [
27,
28].
3.3.1. Data Collection
AO = BO = 70 m–150 m, MN = 20 m, point distance = 10 m. In the field, electric leakage inspections were performed before, during, and after work to ensure that the wires did not leak electricity. Between 5 and 10 points were assigned a point number, and suspicious, mutational, and abnormal points were repeatedly observed.
3.3.2. Data Processing
Based on the findings of prior human prospecting endeavors, the principle of interpretation from known to unknown was followed in conjunction with the data obtained from drilling verification results to explicate the outcomes of this geophysical prospecting undertaking. The seamless mixture of geophysical prospecting and geological work throughout the entire process also reduces the geophysical prospecting work more effectively. The enhancement of quality has resulted in a boost in the reliability of the geophysical findings’ interpretation. Based on the resistance orthogonal point anomaly observed in the two branches of the joint profile curve, it can be deduced that the fault structure zone or karst development zone is present. The inclination of the fault and its approximate dip are to be ascertained.
4. Methodology
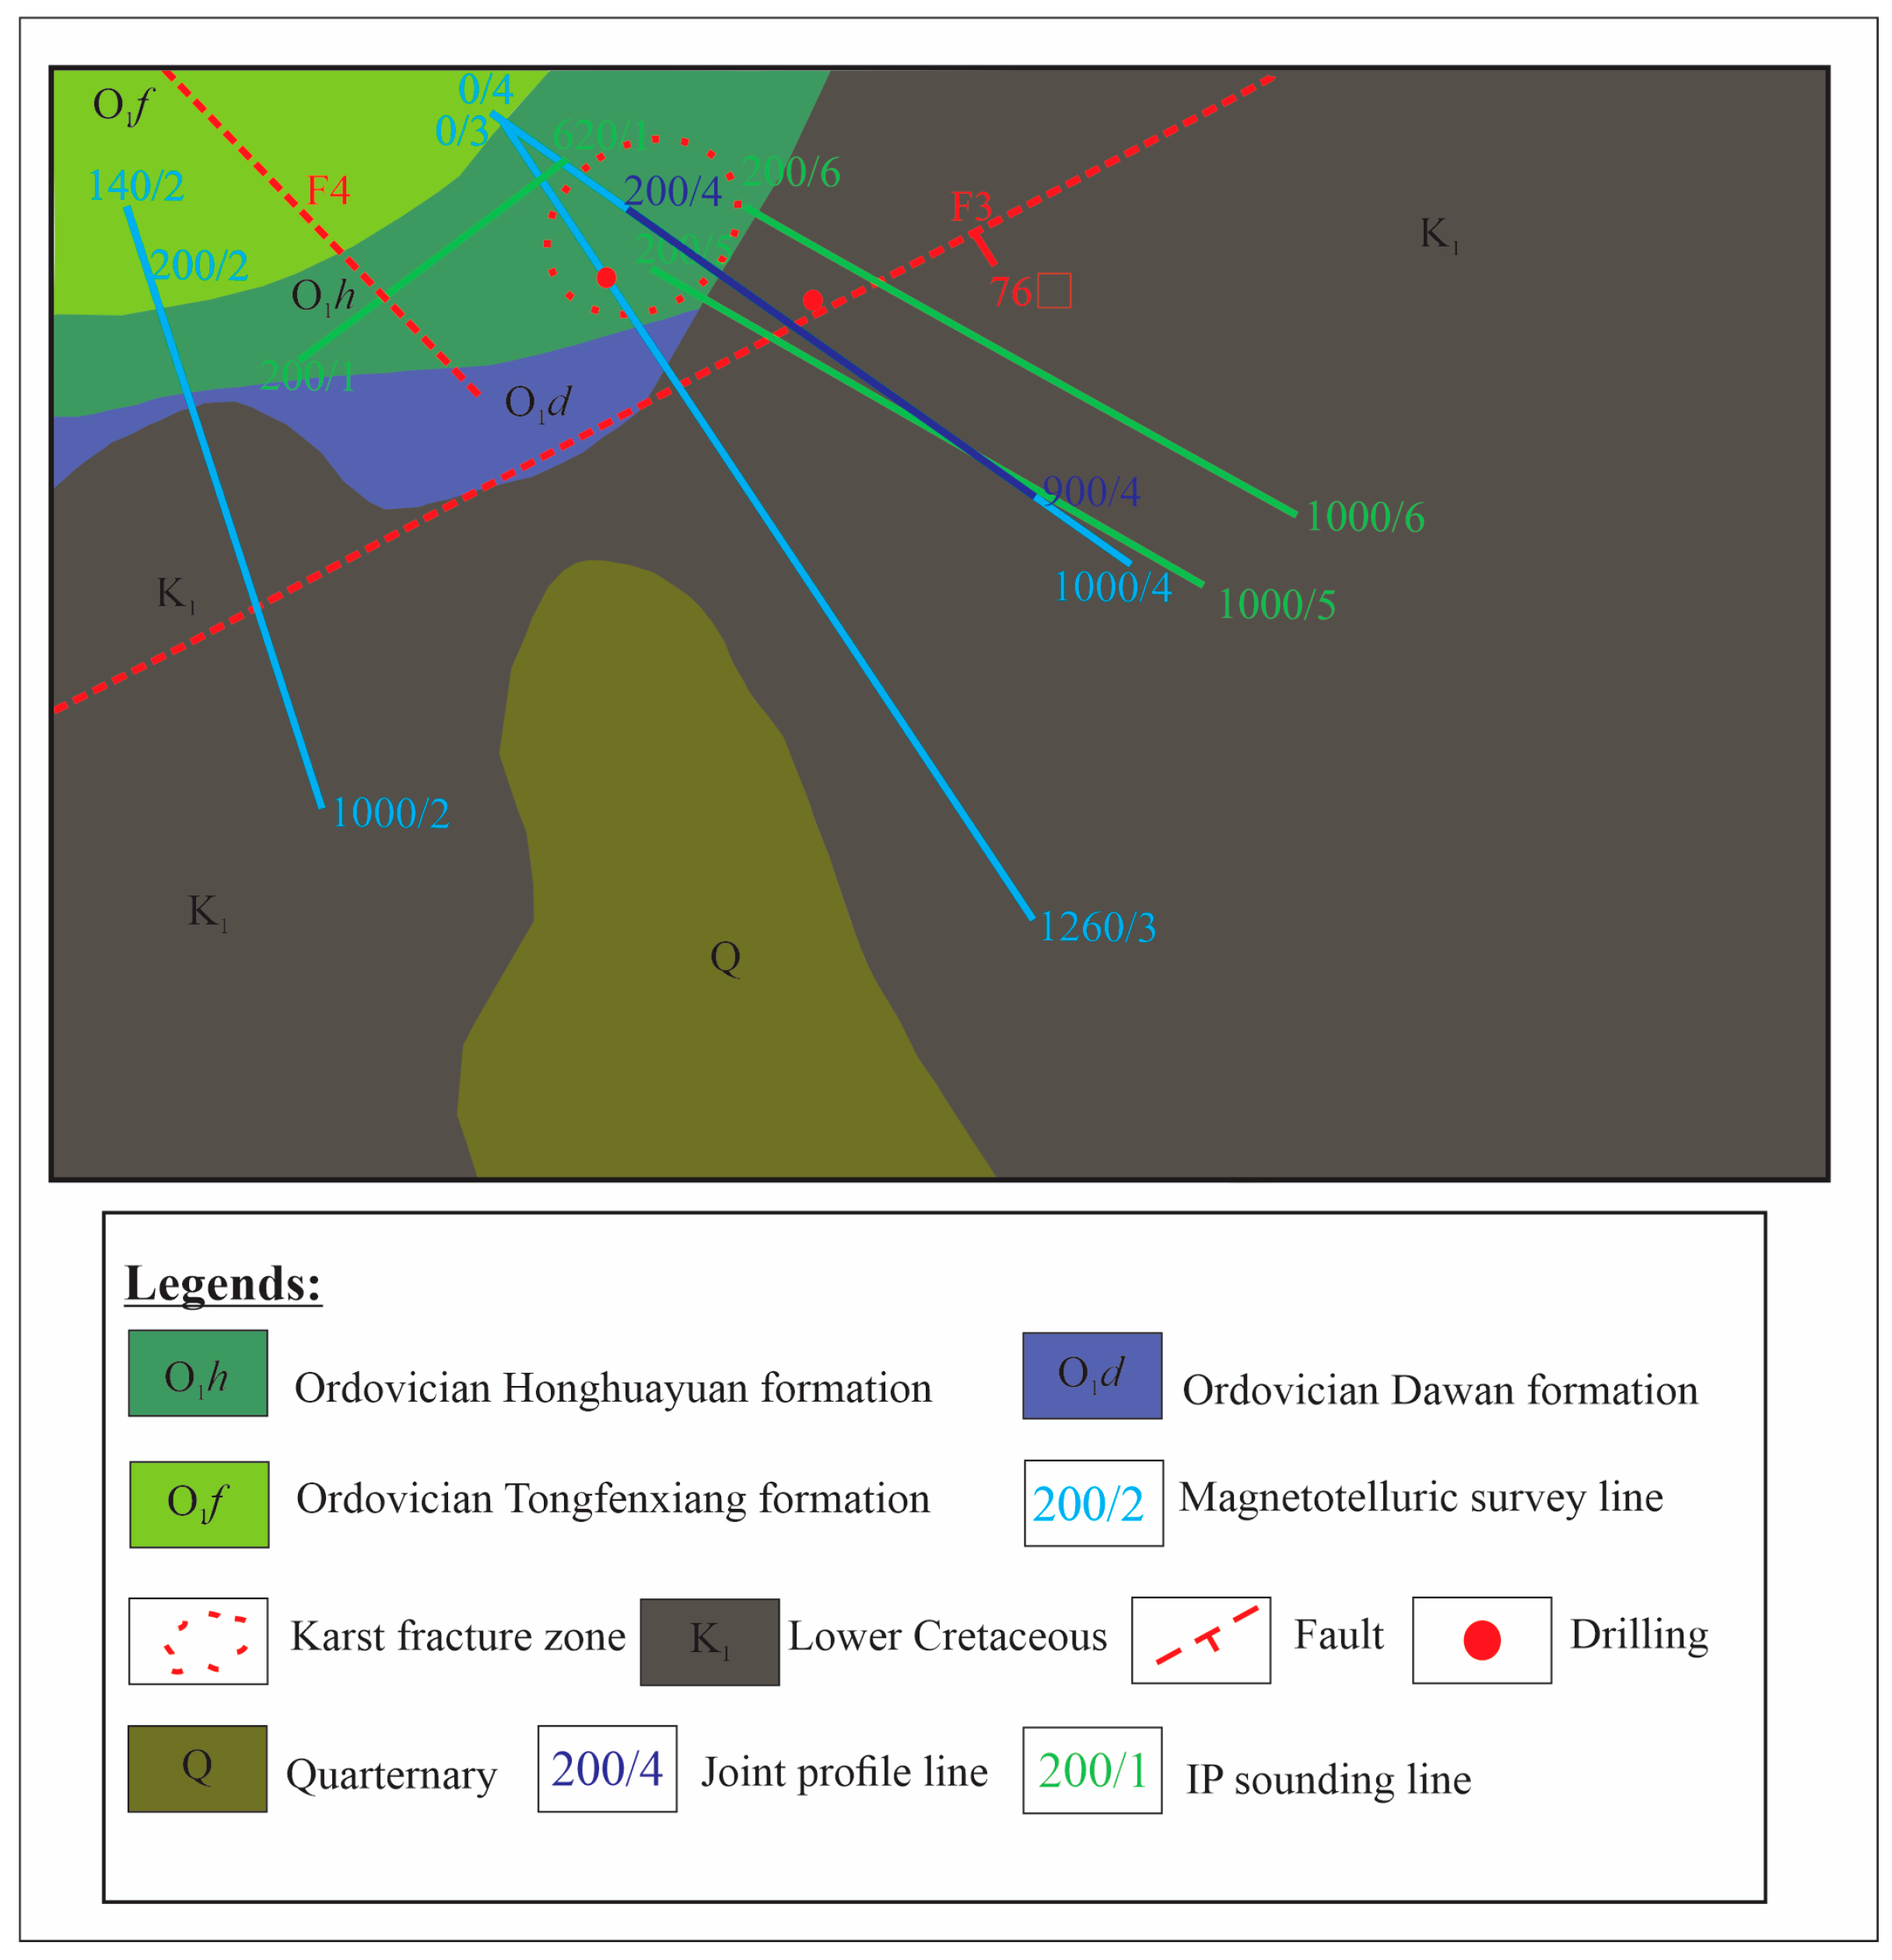
The investigation of geothermal resources within the designated study region employs three techniques: magnetotelluric sounding, induced polarization, and joint profile method. A total of six survey lines have been established for this purpose. The measuring lines and points have been designated as L1, L2, L3, L4, L5, and L6 lines based on the principle of smaller values towards the west and south, and larger values towards the east and north, as illustrated in (
Figure 5). All survey lines’ workload statistics are shown in (
Table 2). The study employed various survey methods to gather data, including the magnetotelluric sounding method, which utilized three survey lines (L2, L3, and L4 lines). Geothermal exploration measurements utilizing MT technique facilitate identification of resistivity anomalies linked to productive geothermal structures such as faults and cap rocks and enable estimation of geothermal reservoir temperatures at different depths [
29]. The induced polarization method utilized three survey lines (L1, L5, and L6 lines) and the joint profile method utilized four survey lines, L1 to L4.
The magnetotelluric sounding method has been identified as the primary technique utilized in the region. This method has been deemed crucial for conducting research and obtaining data. The aforementioned methods exhibit traits such as significant exploration depth, absence of obstruction by high-resistivity strata, and robust capability to discern high-conductivity strata. It has the capability to accurately identify geothermal origins. The determination of drilling locations is based on the fault structure’s positioning and the basement structure’s configuration. The task at hand involves the measurement of the horizontal components of the electric field, namely Ex and Ey, at an electrode spacing of 40 m, as well as the horizontal components of the magnetic field, Hx and Hy, at a magnetic sensor distance of 20 m. The measurement is to be conducted at a single field for a duration of no less than 60 min.
The utilization of the induced polarization sounding method is based on the magnetotelluric sounding (P3) measurement outcomes to ascertain the water content, location, and occurrence of fault structures within the research region. This method also helps in identifying the optimal placement of geothermal exploration boreholes. The data acquisition methodology employed a Schlumberger sounding array, with a measuring electrode distance of MN = 40 m and a maximum current electrode distance of AB/2 = 1620 m. The specific electrode distance arrangement was set at intervals of 40 m, ranging from 40 m to 1620 m, with additional points at 80 m, 120 m, 160 m, 200 m, 240 m, 280 m, 320 m, 360 m, 400 m, 460 m, 520 m, 580 m, 640 m, 700 m, 760 m, 840 m, 920 m, 1000 m, 1080 m, 1180 m, 1280 m, 1380 m, 1500 m, and 1620 m. The utilization of the IPInv DC IP inversion interpretation system from Central South University is employed for data processing [
27,
30].
5. Geophysical Results Interpretation
5.1. Interpretation of IP Survey Lines Data
5.1.1. Line 1
The cross-section, inference, and interpretation results of 2D line 1 are shown in
Figure 5. At 260 and 500 m along the survey line, Ordovician limestone from the Fenxiang Formation in the Lower Ordovician System is exposed. Between 40 and 220 m down, the resistivity value is relatively high (200–1500 ohm), suggesting that this is also Ordovician limestone from the Fenxiang Formation in the Lower Ordovician System. The total cross-section has a low resistivity (less than 400 ohms) between a depth of 600 and 800 m, which is interpreted to represent Cambrian dolomite. The outcome of this inferential analysis is shown in
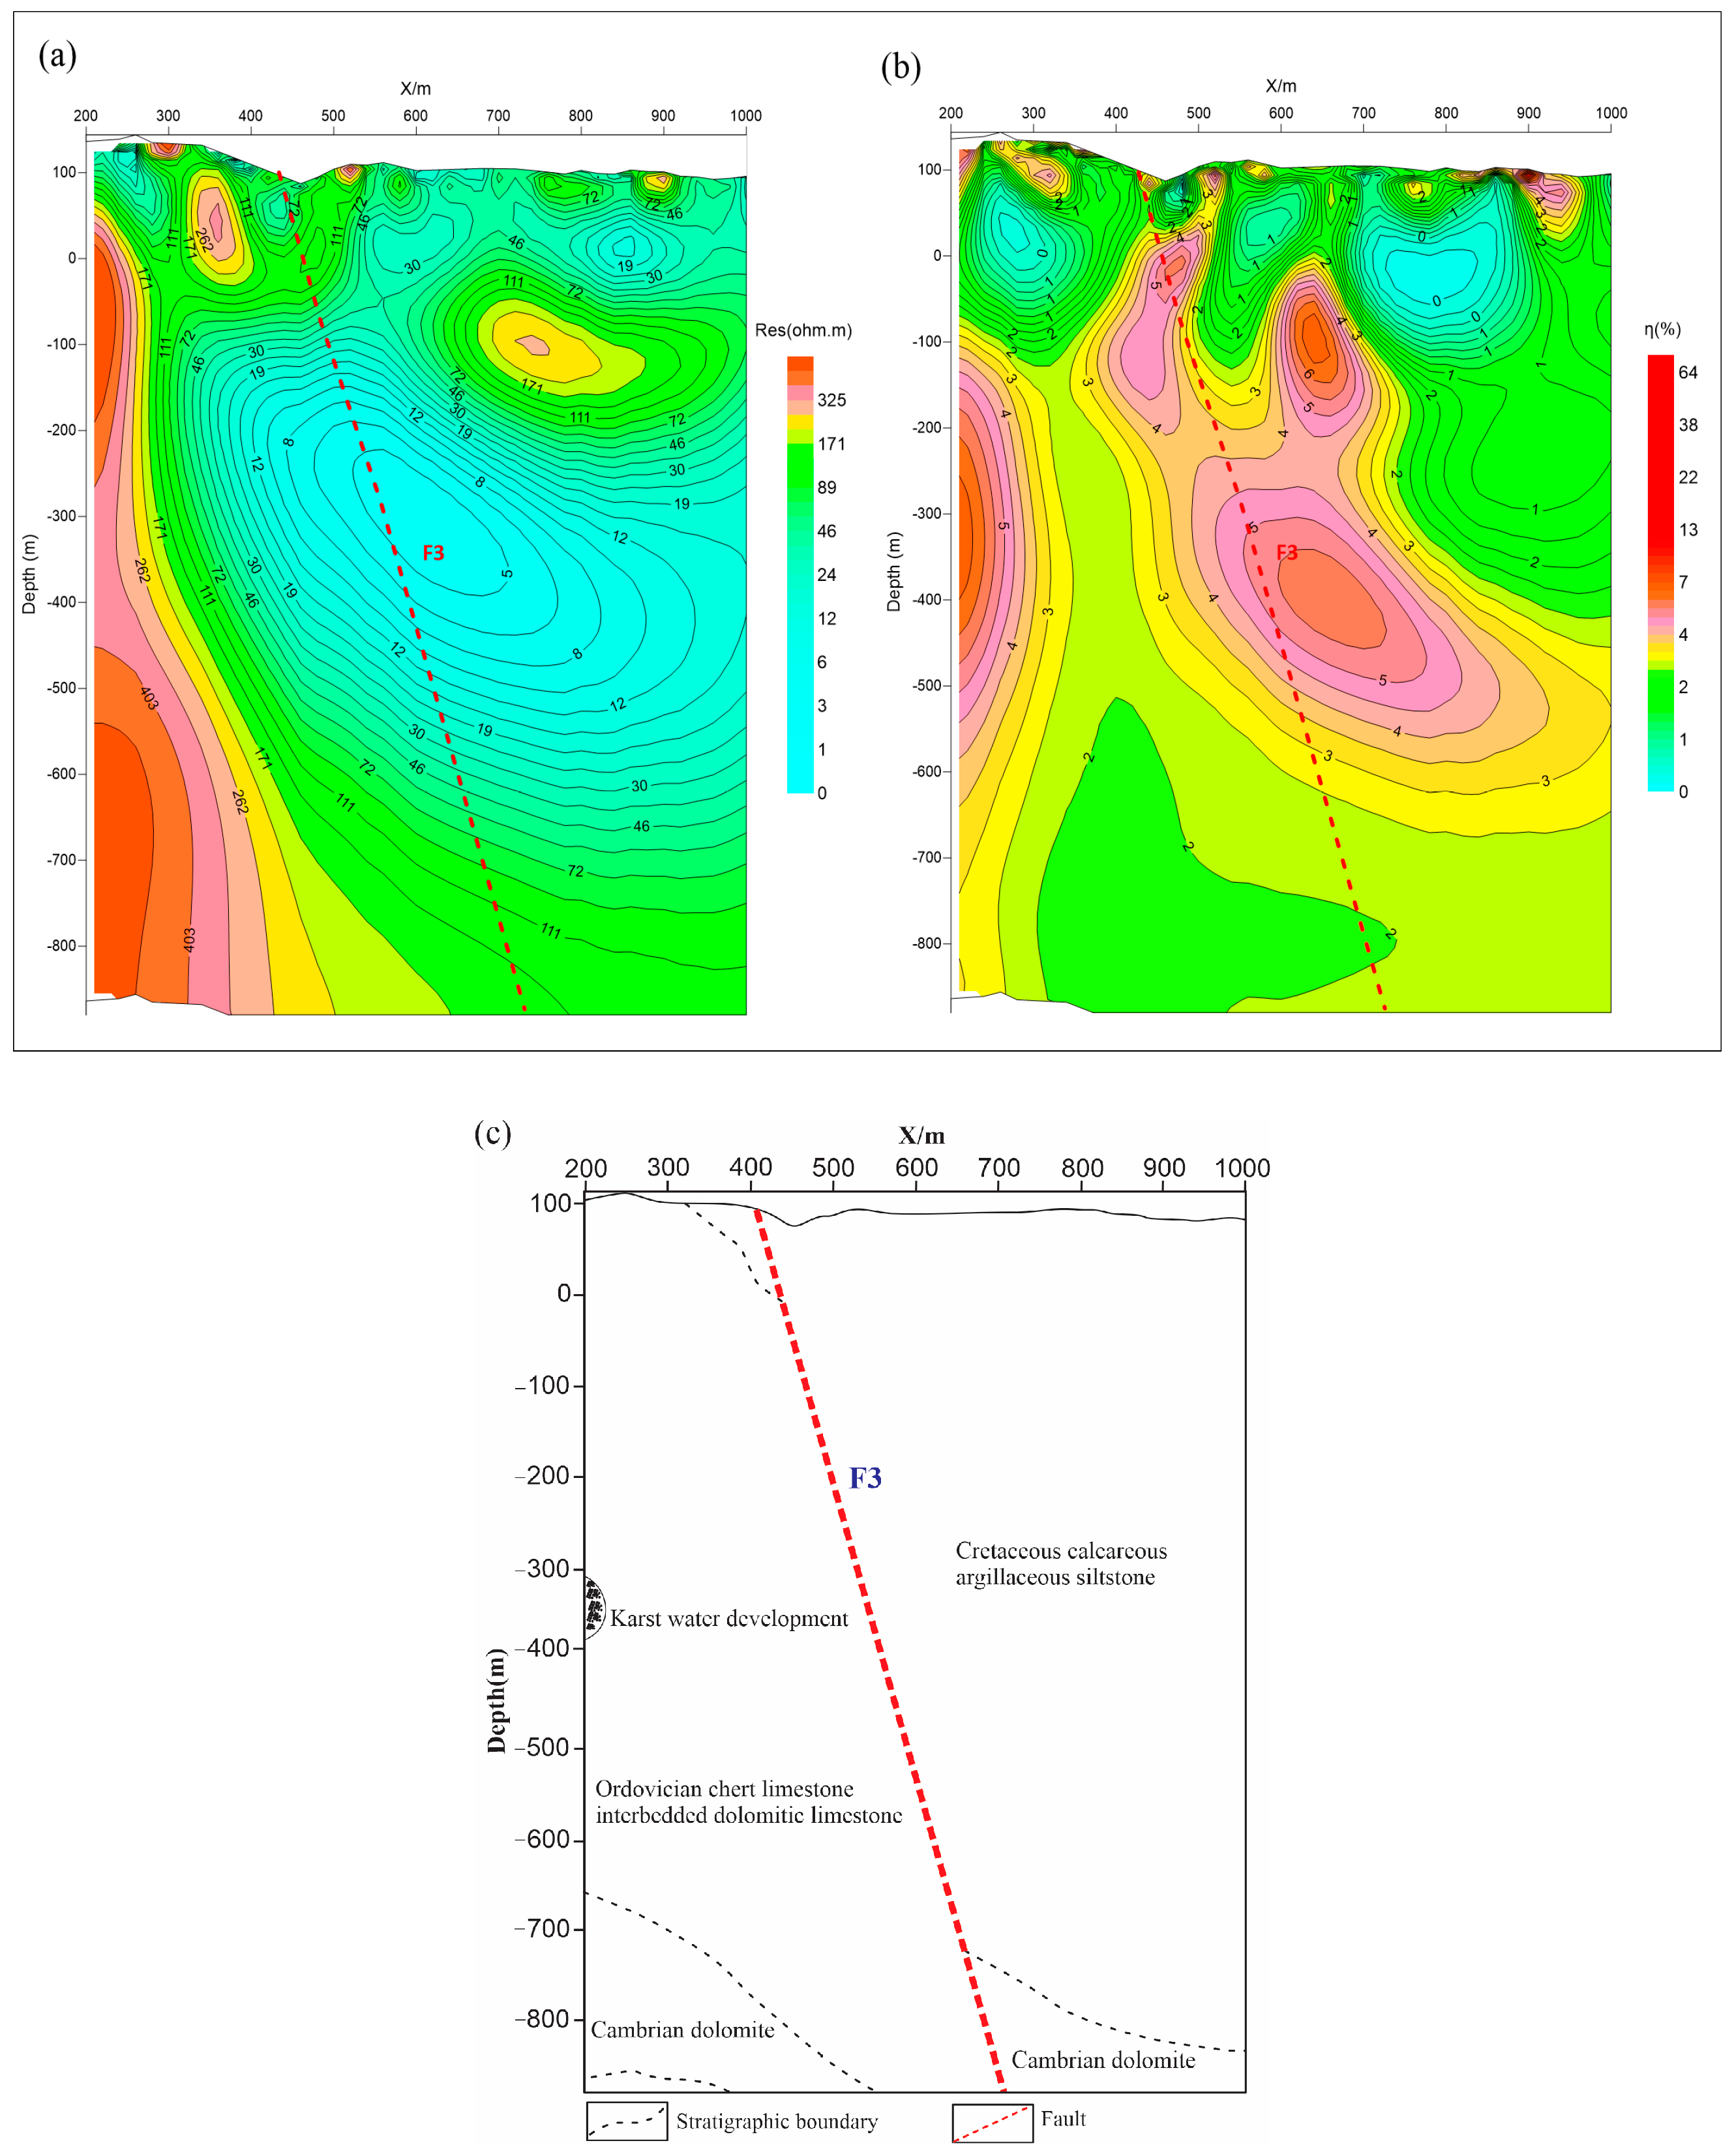
Figure 6. A structural fracture zone, identified as the F4 fault, is thought to be reflected in the resistivity contour for about 300 m, where there is a considerable gradient shift in the lateral direction. The F4 fault has a dip angle of roughly 81°, and there is a notable change in resistivity close to the fault zone compared to the surrounding region. The rocks close to the fault zone seem to be more fractured, suggesting better conditions for water containment. The downward extension of the fault is inferred from the longitudinal variation trend of the contour lines close to the fault zone, which is more than 800 m.
The first line is oriented in the northeast direction. Based on the diagram of the joint profile method of line 1, it can be observed that the apparent resistivity curve is characterized by a relatively uniform value, with an approximate value of 60 Ω·m for the apparent resistivity. The points situated on the left and right sides are regarded as anomalous reflections of the orthogonal points. These orthogonal points are believed to be reflections of the fault F4.
5.1.2. Line 5
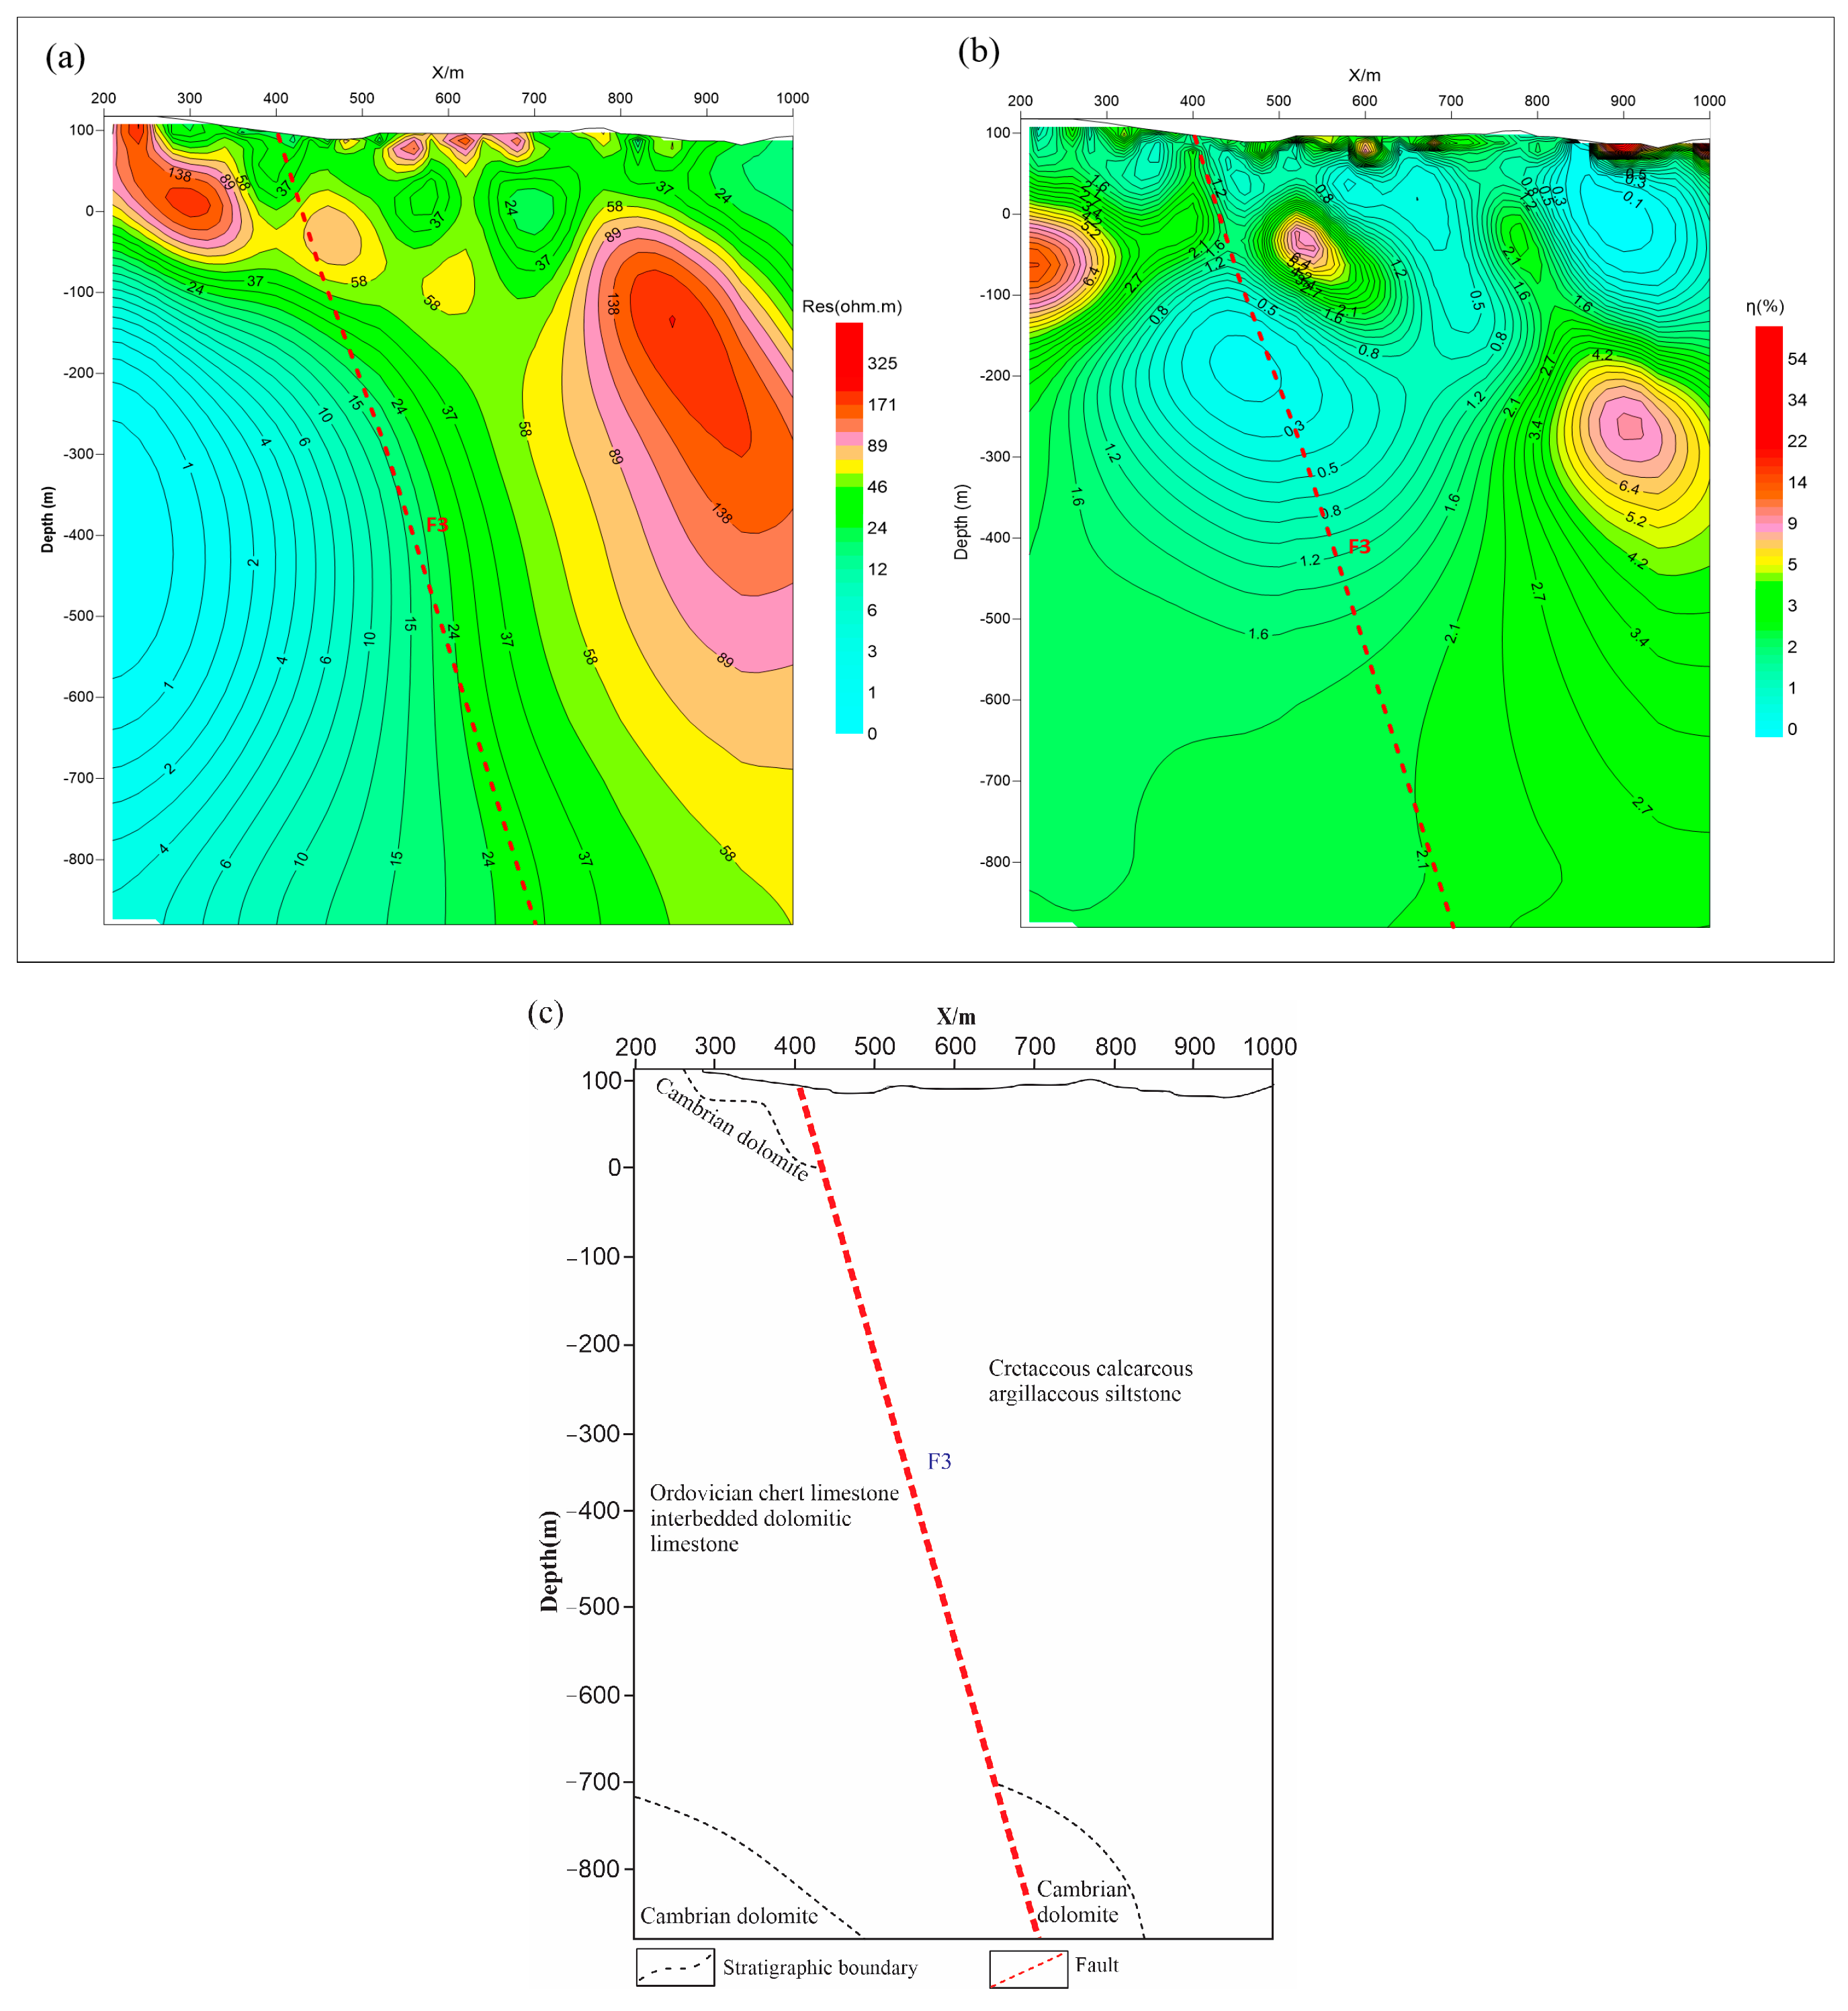
The diagram presented in
Figure 7 represents the 2D inversion cross-section of the DC-induced sounding resistivity of line 5, alongside the inference and interpretation result diagram, and the 2D inversion cross-section diagram of the DC-induced sounding polarizability. The Cretaceous strata are revealed at a distance of 70 m from the survey line. The resistivity of the section is typically low while exhibiting significant lateral variability. Within the depth interval of 100 to −100 m, the geological formation exhibits notable resistivity features ranging from 30 to 300 ohm.m. This is indicative of the presence of Cretaceous calcareous and argillaceous siltstone, which is characterized by a significant formation dip. In the subsequent depth range of −100 to −800 m, further geological features are observed. The text outlines the features of a material exhibiting low resistivity, measuring below 40 ohm.m. This is believed to be a type of chert limestone from the Ordovician period, which is intermixed with dolomitic limestone. The data indicates that the fault zone exhibits a notable degree of polarizability, which suggests favorable water-bearing characteristics.
The resistivity contour exhibits a significant gradient alteration in the horizontal direction at a distance of 400 m, which is believed to be indicative of the structural fracture zone known as the F3 fault. The dip angle of the fault is estimated to be approximately 76° based on the morphological characteristics of the contour line of the section. A notable resistivity difference is observed in the vicinity of the fault zone. The rocks in proximity to the fault zone exhibit a higher degree of fragmentation, and the hydrogeological conditions are comparatively more favorable to water retention.
5.1.3. Line 6
The outcomes in
Figure 8 show the 2D inversion diagram for the line 6 polarizability, resistivity, and geological interpretation section. At 130 m from the survey line, the exposed Cretaceous strata show relatively low resistivity with notable lateral variation. The survey line exhibits significant resistivity in the 200–400 m range (50–300 ohm.m), which is assumed to represent Ordovician chert limestone interbedded with dolomitic limestone. The Cretaceous calcareous and argillaceous siltstone is predicted to have low resistivity (less than 40 ohm.m.) and a significant formation dip in the 400–1000 m range. Notably, as demonstrated in
Figure 8b, the polarizability is particularly high close to the fault zone, indicating strong water-bearing characteristics. At 440 m, the resistivity contour exhibits a considerable gradient shift in the lateral direction, pointing to a structural fracture zone known as the F3 fault. According to the contour line morphology, the fault has a dip angle of around 76° and an apparent resistivity differential close to the fault zone. This suggests that the rocks close to the fault are comparatively broken up and that the conditions for water-bearing are better here. The fault seems to continue for more than 900 m, according to analysis of the contour lines’ longitudinal variation trend.
5.2. Interpretation of MT Survey Lines Data
5.2.1. Line 2
The results of the line 2 magnetotelluric sounding are shown in
Figure 9. On the survey line, an outcropping of the Honghuayuan Formation of the Lower Ordovician system is observed at a distance of 180 m, while the Dawan Formation is observed at 265 m. The resistivity in the depth range of 0 to −200 m is low, indicating the presence of Cretaceous calcareous and argillaceous siltstone with a large dip angle. In contrast, the resistivity significantly increases (2000–3000 ohm.m) in the depth range of −200–800 m, which is inferred to be Ordovician chert limestone interbedded with dolomitic limestone. The area covering from −800 to −300 exhibits a notable change in high resistivity, surpassing 3000 ohms. This is believed to be indicative of Cambrian siliceous dolomite.
At a depth of 750 m, the resistivity contour exhibits a significant lateral gradient change, and the low resistivity characteristic extends to great depths. This is supposed to be indicative of the structural fracture zone, which is identified as the F3 fault. Based on the morphological features of the contour line of the section, it can be deduced that the F3 fault exhibits a relatively steep inclination, with an estimated dip angle of approximately 76°. The variation in resistivity is conspicuous in the vicinity of the fault zone, leading to the inference that the rock in the vicinity of the fault zone is comparatively fractured and the hydrogeological conditions are more conducive to water storage. Based on the longitudinal variation pattern of the contour lines in proximity to the fault zone, it can be deduced that the fault has a downward extension of at least 1200 m.
Based on the apparent resistivity curve obtained from the line 2 joint profile method, it can be observed that the curve exhibits a zigzag pattern, and the corresponding apparent resistivity value is approximately 60 Ω·m. The ρs curves of the current electrode spacing demonstrate orthogonal anomalies in the vicinity of point 605, which indicates fault F3.
5.2.2. Line 3
The findings and interpretations of the line 3 magnetotelluric sounding are presented in
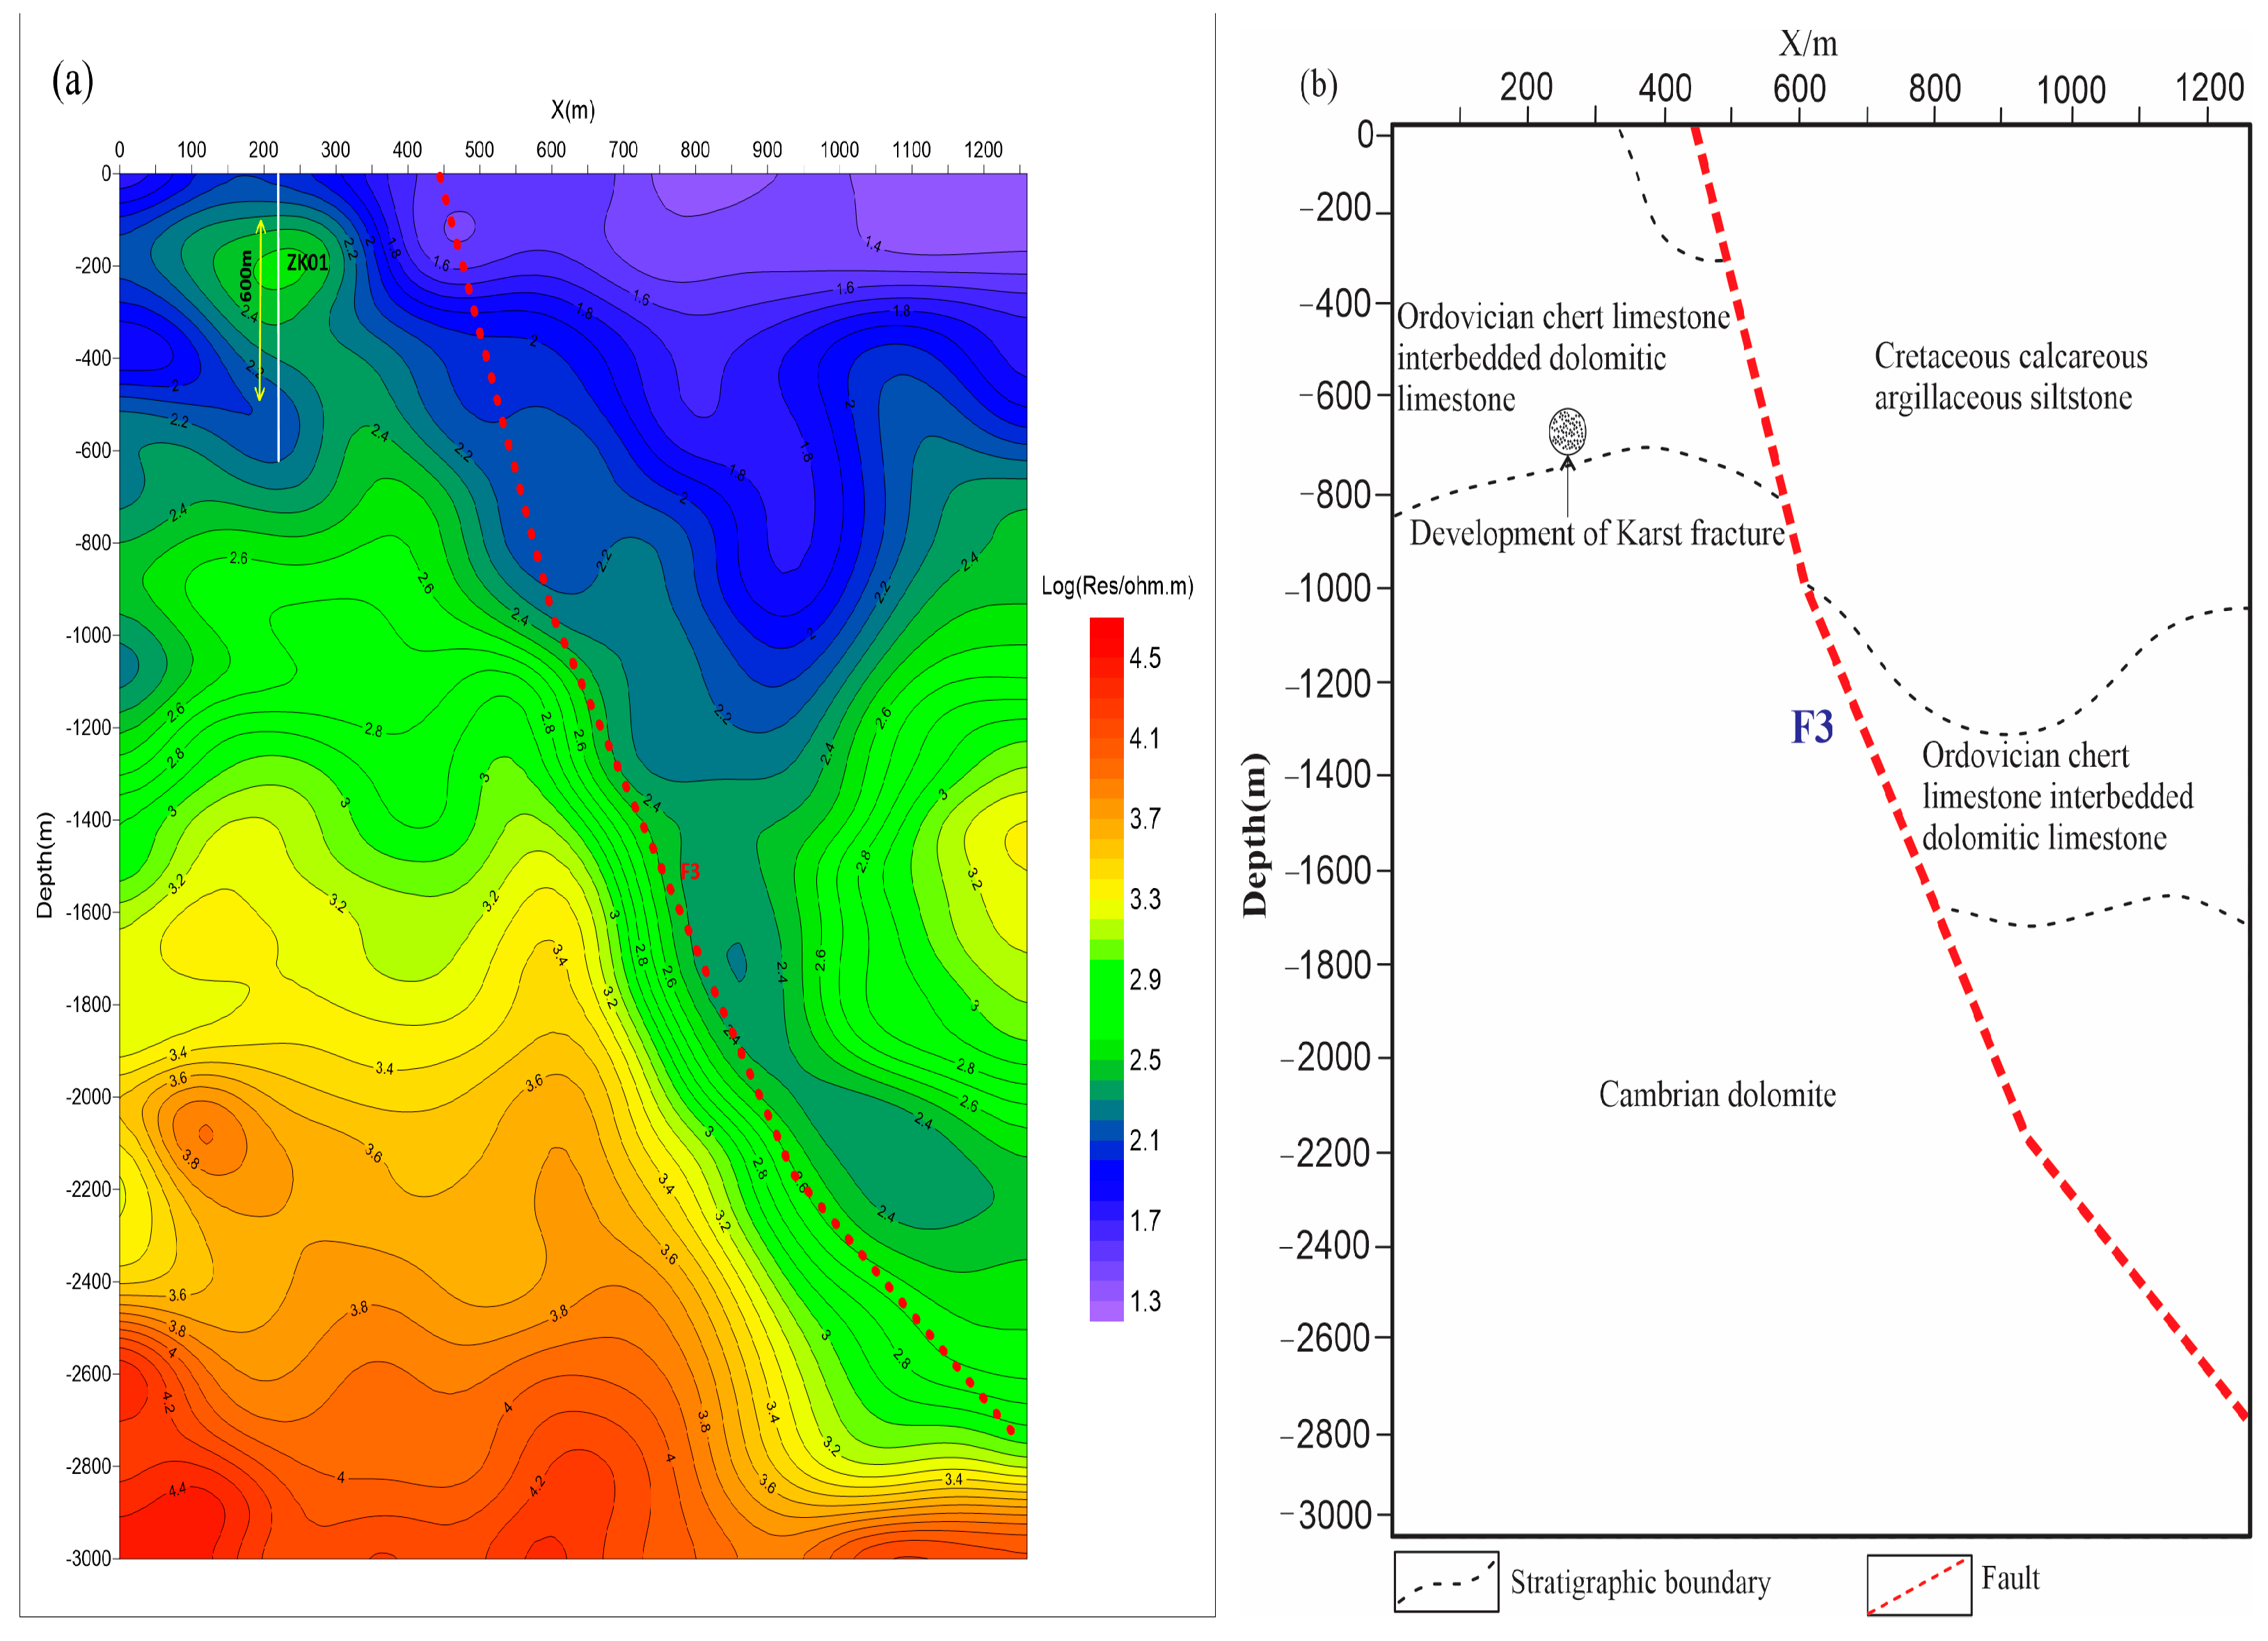
Figure 10. The geological strata consist of the Honghuayuan Formation of the Lower Ordovician system, the Dawan Formation, and the Middle Ordovician system, which are, respectively, exposed at distances of 60 m, 160 m, and 250 m from the survey line. The values obtained within a few meters are generally low, ranging from 10 to 600 ohm.m. This is indicative of the presence of Cretaceous calcareous and argillaceous siltstone, which is characterized by a large formation dip. At depths ranging from −400 to −1000 m, there is a significant increase in resistivity, with values ranging from 2000 to 3000 ohm.m. This is inferred to be due to the presence of Ordovician chert limestone interbedded with dolomitic limestone. At depths ranging from −1000 to −3000 m, the resistivity characteristics are high, with values greater than 3000 ohm.m. This is indicative of the presence of Cambrian intercalated silicon-textured dolomite.
The resistivity contour exhibits a significant lateral gradient shift at a distance of 450 m, which is indicative of the structural fracture zone referred to as the F3 fault. Based on the contour line of the section, it can be inferred that the shallow fault has a dip angle of approximately 76°, and this angle appears to decrease gradually as the depth increases. The variation in resistivity is visible in the vicinity of the fault zone. The rock in the vicinity of the fault zone appears to be extensively fractured and exhibits characteristics indicative of the presence of water.
Based on the apparent resistivity curve obtained from the line 3 joint profile method, it can be observed that the small end exhibits a high apparent resistivity value, whereas the large end exhibits a relatively low value. The interface between the high and low apparent resistivity values at point 590 on the ρs curve is believed to correspond to the stratigraphic boundary. The orthonormal anomaly observed at point 650 on the ρs curve is assumed to correspond to fault F3. The analysis of the field data suggests that the observed anomaly can be attributed to the disruptive impact of the pool constructed on the surface.
5.2.3. Line 4
The results of inference and interpretation of the line 4 magnetotelluric sounding are presented in
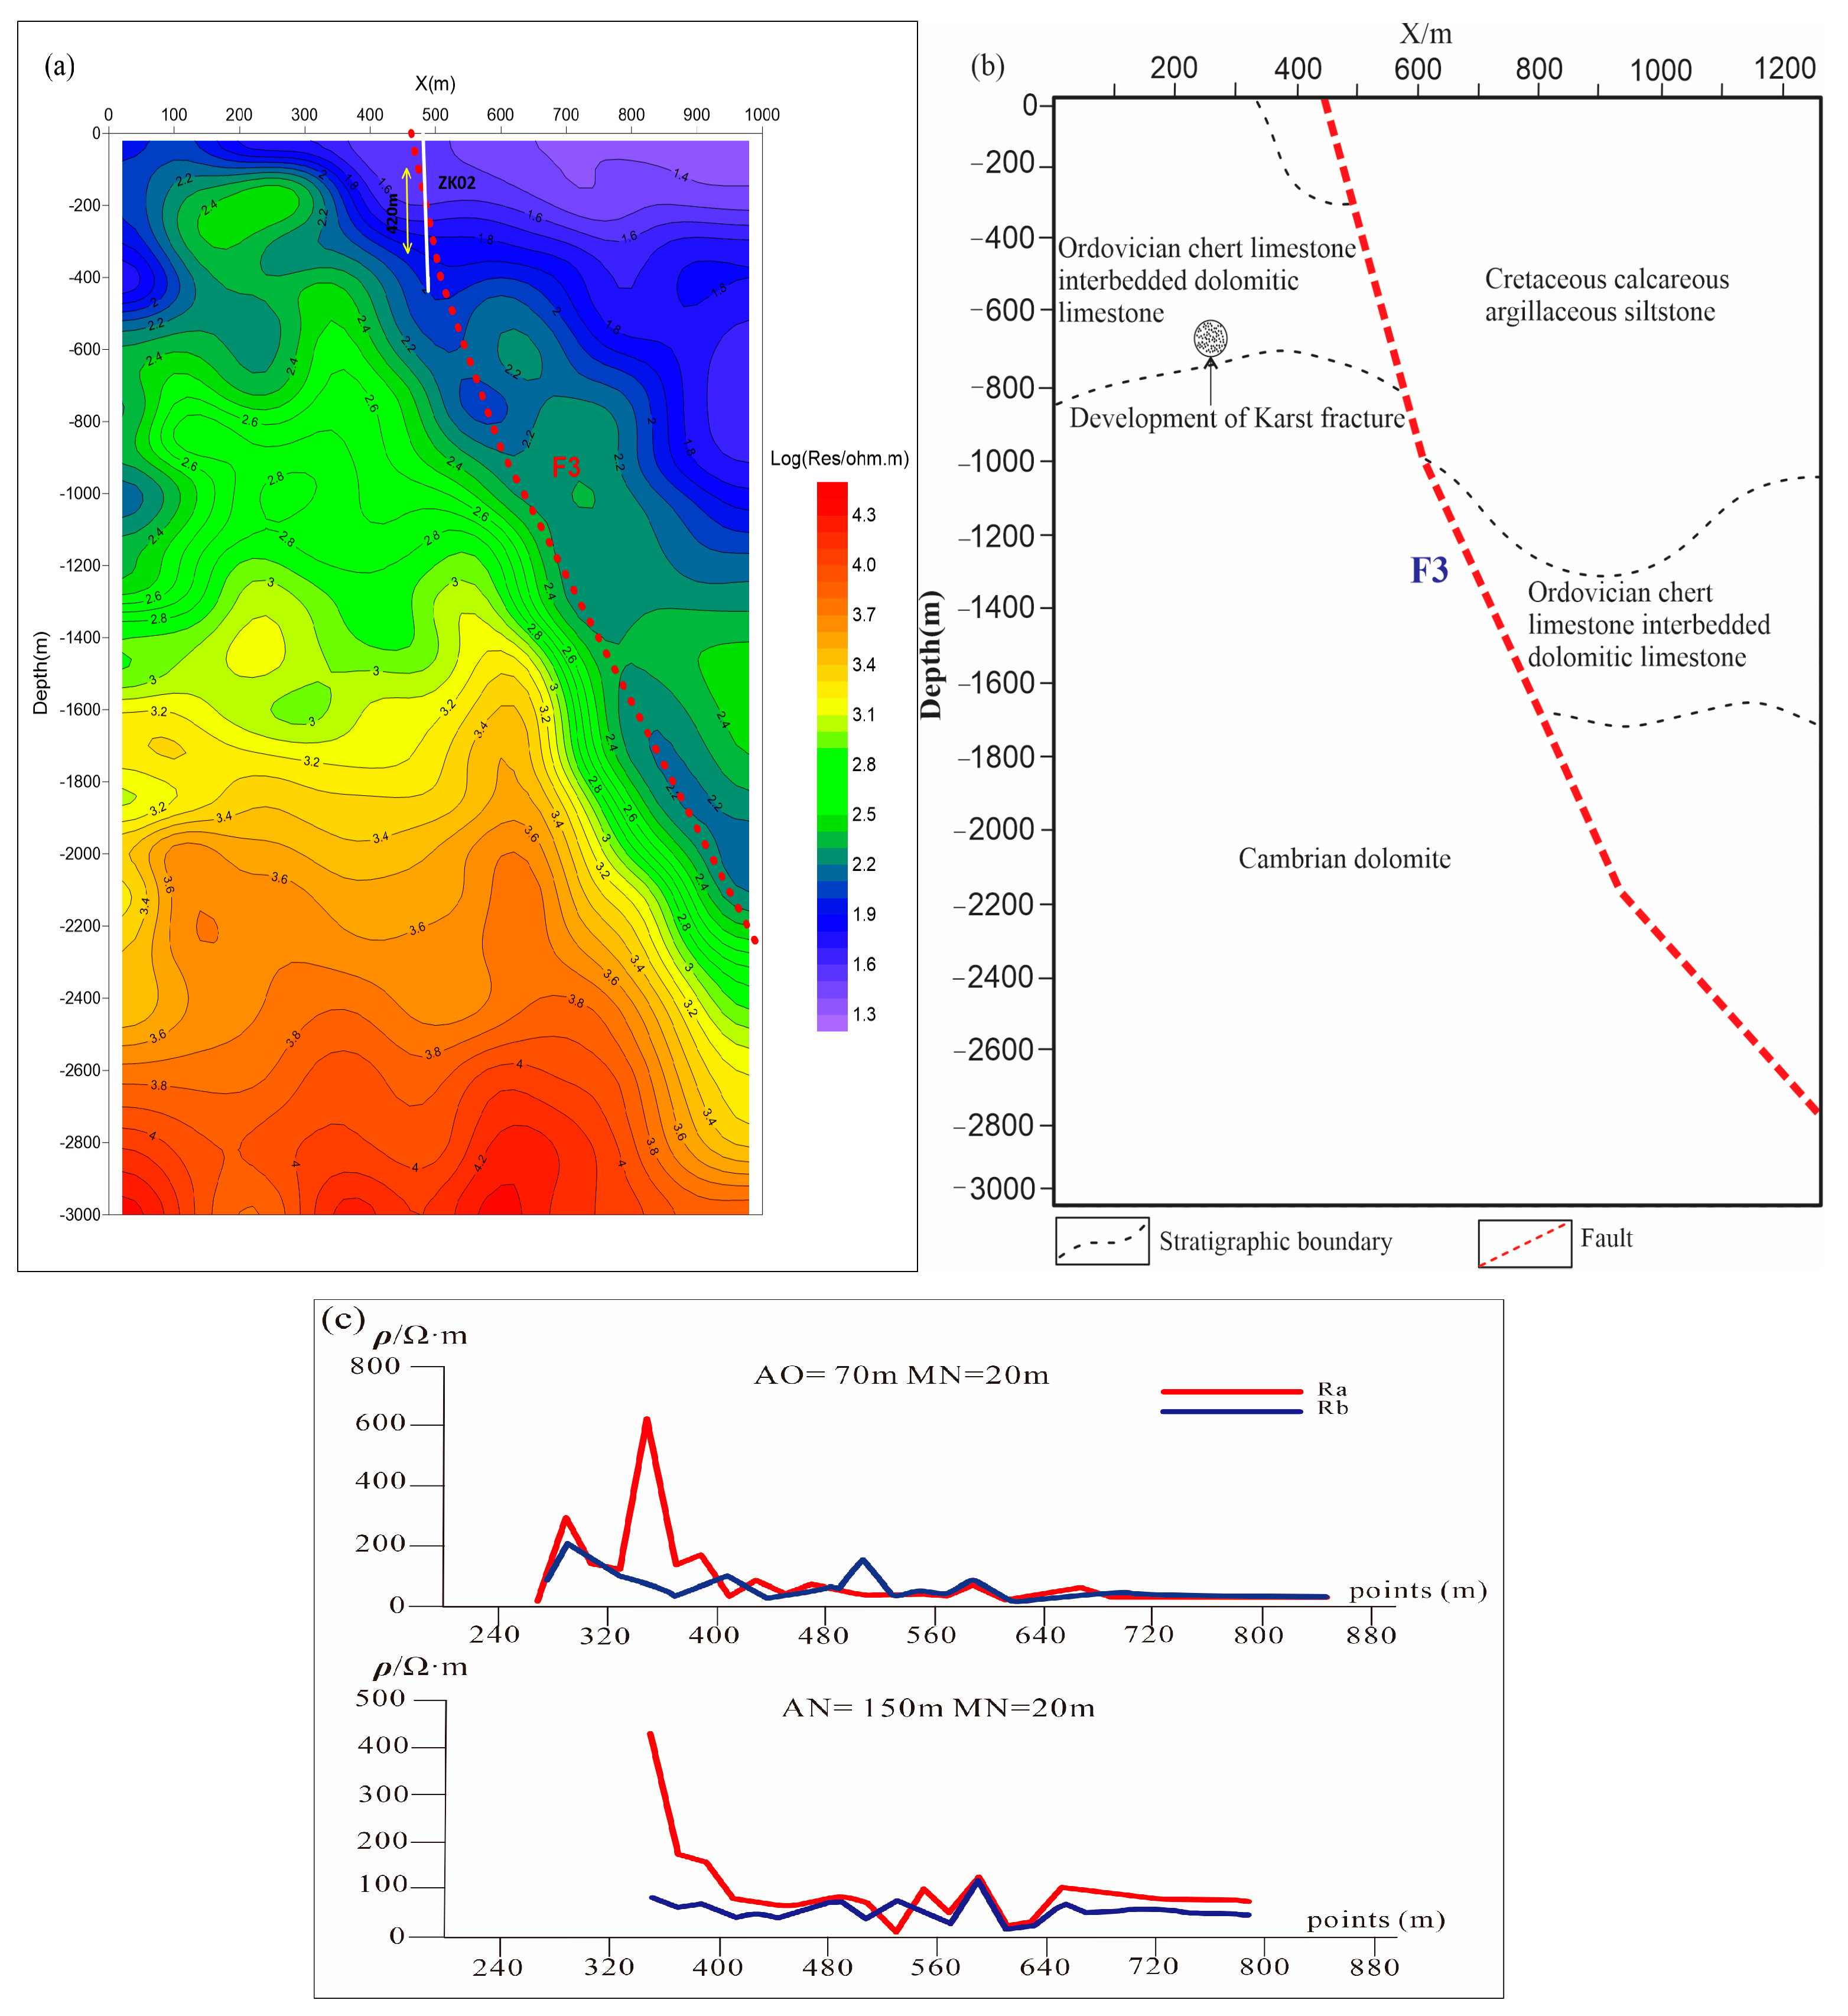
Figure 11. At a distance of 80 m, the geological strata exposed along the survey line including the Honghuayuan Formation of the Lower Ordovician system, the Dawan Formation at a distance of 175 m, and the Middle Ordovician Formation at a distance of 265 m. These observations pertain to the depth range of 0 to −400 m. The resistivity values within a few meters are generally low, ranging from 10 to 600 ohm.m. This is indicative of Cretaceous calcareous and argillaceous siltstone with a steep dip angle. At depths between −400 and −800 m, there is a significant increase in resistivity, which suggests the presence of Ordovician chert limestone interbedded with dolomitic limestone. At depths between −800 and −3000 m, the resistivity values are high, exceeding 2000 ohm.m. This is inferred to be Cambrian interlaced siliceous dolomite.
The resistivity contour exhibits a significant lateral gradient change at a distance of 460 m, which is interpreted as an indication of the structural fracture zone known as the F3 fault. Based on the morphological features of the contour line of the section, it can be inferred that the shallow fault has a dip angle of approximately 76°, which appears to decrease gradually as depth increases. The variation in resistivity is visible in close proximity to the fault zone. The rock in the vicinity of the fault zone appears to exhibit a state of fragmentation and possesses conditions favorable to the presence of water. Based on the longitudinal variation pattern of the contour in closeness to the fault zone, it can be realized that the fault has a downward extension of at least 2300 m.
The joint profile method employs a current electrode distance of between 70 and 150 m. The joint profile curve corresponding to current electrode spacing AO of 70 m exhibits a low-resistance orthogonal point at 490, while the joint profile curve corresponding to current electrode spacing AO of 150 m exhibits this feature at point 520. Point No. 1 delineates the attributes of an orthogonal point with low resistance, which may be indicative of a structural fault zone. The F3 fault has been recognized, exhibiting a dip of approximately 76° towards the southeast. This observation aligns with the typical outcomes of the magnetotelluric sounding method.
5.3. Drilling Results
Based on the findings of geophysical prospecting and in conjunction with hydrogeological data, it has been determined that the ZK01 geothermal resource drilling site is situated at a distance of 220 m in line 3, as shown in
Figure 10a. By drilling record data, the geological composition of the area can be described: The interval ranging from 72.7 m to 211 m is characterized by casing, while the interval from 211 m to 280 m is composed of limestone and dolomitic limestone. The geological formation found within the depth range of 280 m−355 m is composed predominantly of limestone. The geological strata between 355 m and 389 m are composed of limestone containing calcite, while the strata between 389 m and 395.6 m consist of siliceous rock intermixed with limestone. The geological stratum between 395.6 m and 407 m comprises limestone that is intercalated with calcite and a minor quantity of fissure water. The subsequent stratum, ranging from 407 m to 410 m, is composed of limestone. The geological formation at the specified depth range of 410 m to 415 m consists of limestone that is interspersed with siliceous rock and calcite. The geological strata at depths ranging from 415 m to 425 m comprise limestone with calcite, while the layer from 425 m to 428 m consists of calcite with limestone. The subsequent layer from 428 m to 437 m is composed of limestone with calcite, followed by a layer from 437 m to 439 m that is characterized by calcite intercalated limestone. The layer from 439 m to 440.5 m is also composed of calcite intercalated limestone and serves as an aquifer for downward recharge. The geological formation ranging from 440.4 m to 537 m is composed of dolomitic limestone.
The positioning of ZK02 in relation to line 4 at a distance of 480 m has been established through the analysis of geophysical prospecting data and in conjunction with hydrogeological information (
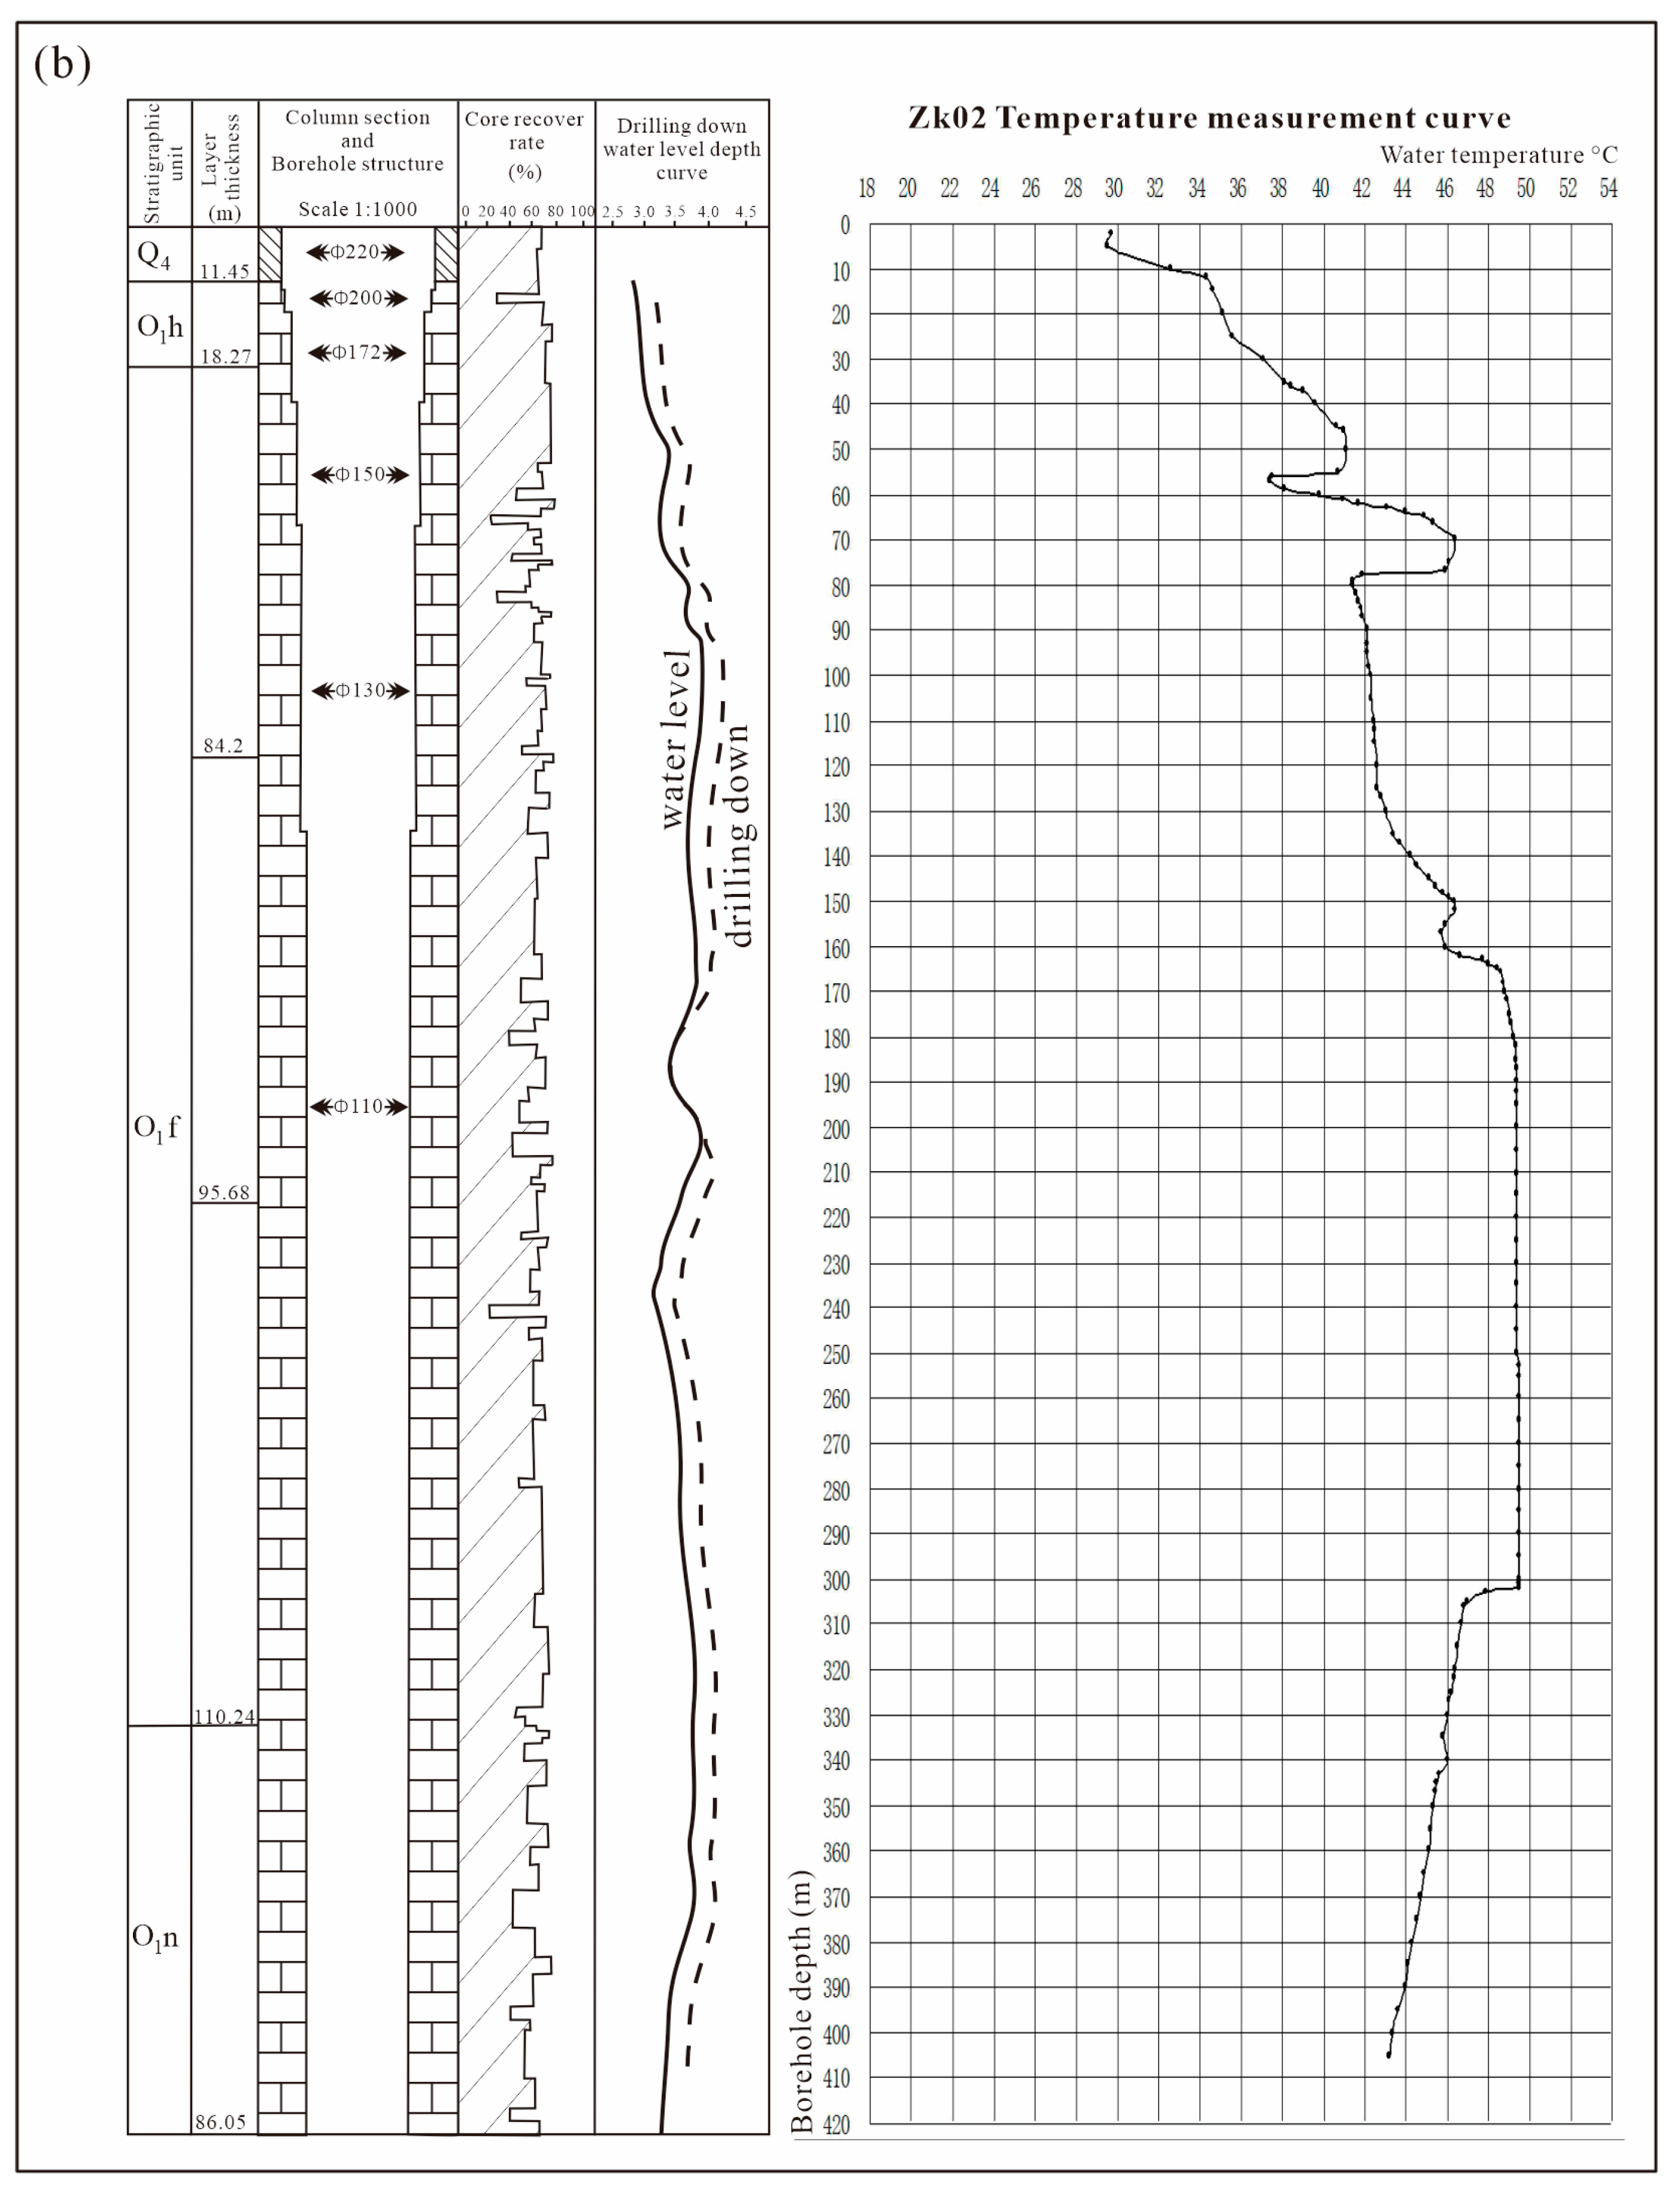
Figure 11a). The drilling data of ZK02 indicates that the geological composition of the area from 74 m to 93 m comprises argillaceous limestone, followed by a layer of limestone intermixed with argillaceous limestone from 93 m to 143.5 m. The subsequent layer from 143.5 m to 147.1 m is characterized by argillaceous limestone with a minor presence of fissure water, while the layer from 147.1 m to 176.8 m is composed of muddy limestone. The geological strata in the area can be classified as: the interval ranging from 176.8 m to 198 m is composed of limestone, while the interval from 198 m to 258.1 m is characterized by the presence of limestone with calcite. The interval from 258.1 m to 275.9 m is identified as limestone with shale, whereas the interval from 275.9 m to 286.3 m is composed of limestone. The limestone aquifer is situated between 286.3 m and 288.3 m, and it is recharged from the top. The interval from 288.3 m to 354.5 m is identified as dolomitic limestone. The temperature curve at different depths is shown in
Figure 12.
The analysis of the drilling outcomes from borehole ZK01 indicates that the primary aquifer zone inside the hole spans from a depth of 439 m to 440.50 m. This region of the aquifer is characterized by downward recharge. Additionally, a limited quantity of fissure water is present in the designated area, aligning with the inferred karst fissure growth zone as determined by MT line 3.
The analysis of drilling data from borehole ZK02 reveals that the primary aquifer interval spans from a depth of 286.3 m to 288.3 m. This aquifer is characterized by upward replenishment, and the temperature of the water at the outflow section measures 45.3 °C. The lithology associated with the water-bearing section is limestone. The sample has a small amount of fissure water, which matches the fracture zone found by line 6 induced polarization (IP) and line 4 magnetotelluric sounding.
6. Discussion
This study presents the outcomes of the geothermal investigation conducted in Reshi Town, Taoyuan County, Hunan, China, utilizing integrated geophysical techniques. The research employed a three-way approach, encompassing magnetotelluric (MT) methodology for three lines (L2, L3, and L4), induced polarization (IP) methodology for three lines (L1, L5, and L6), and a joint profile methodology for four lines (L1, L2, L3, and L4). The primary aim of the present research was to examine underground geological features and ascertain prospective regions for the purpose of harnessing geothermal resources.
The previous study’s conclusion that the geothermal fluid supply mostly originates from atmospheric precipitation corresponds with our findings of consistently high temperatures and steady flow in the hot spring water, suggesting the existence of sufficient subsurface hot water. The prior research also recognized a profound geothermal system characterized by the upward flow of thermal energy from deep under the Earth’s crust through fault structures and its interaction with karst water [
23]. This aligns with our results that faults F3 and F4 serve as pathways for geothermal fluids.
The utilization of the joint profile method yields a heightened level of resolution and visible reflection of anomalies, thereby enabling the identification of fault structures’ plane position and occurrence characteristics within the designated research region. The magnetotelluric sounding technique exhibits notable operational efficiency, significant detection depth, and robust vertical resolution capabilities. The process has the ability to efficiently partition the electrical properties of the geological formation. The method in question is appropriate for identifying extensive and profound heat-regulating faults in a particular region and outlining geothermal zones. However, its resistance to interference is limited, requiring more stringent environmental conditions. The induced polarization sounding technique exhibits notable resistance to interference and a clear reaction to geothermal water that contains minerals. However, its capacity for detecting subsurface features is restricted, thus rendering it a suitable complement to the magnetotelluric sounding method’s shallow layer data.
The outcomes of the magnetotelluric (MT) technique revealed that lines L2, L3, and L4 exhibit regions of decreased resistivity, which could potentially be linked to subsurface reservoirs of thermal water. The present study employed the induced polarization (IP) method to examine the geological formations of lines L1, L5, and L6. The findings indicate that line 1 exhibits the most high chargeability values, which may indicate the existence of a geothermal reservoir with high-temperature characteristics. The study employed the joint profile method to examine the characteristics of lines L1, L2, L3, and L4. The findings indicated the existence of faults F3 and F4, which could serve as viable conduits for geothermal fluids. Subsequent to the analysis of geophysical data, drilling operations were conducted at two distinct locations, namely ZK01 situated on L3 and ZK02 located on line 4. The drilling activities led to the discovery of subsurface hot water. The drilling results have confirmed the existence of faults F3 and F4, indicating that these faults may serve as significant conduits for geothermal fluids. The findings of the IP survey suggest that drilling a new well on line 6 is advisable, given its notably high chargeability values.
The limestone of the Fenxiang Formation (O1f), and Honghuayuan Formation (O1h), contain abundant warm water, the temperature of which is 38~50.7 °C. According to the drilling data, the water inflow of a single borehole is 14.68 L/s and the water temperature is 49.6 °C at a depth of 283 m. The water-bearing rock groups are the Loushanguan Group (∈2–3 ls) dolomite of the Upper Middle Cambrian system and the lumpy marl of the Dawan Formation (O1d) of the Lower Ordovician system, and the bottom is altered into silicified limestone. These strata dip towards the southeast, which is suggested for further exploration of the surroundings.
7. Conclusions
The study has demonstrated the effectiveness of integrated geophysical methods in identifying prospective regions for the purpose of geothermal resource exploitation. This conclusion has been reached based on the findings of the research. The study’s findings have revealed the existence of subterranean hot water reservoirs and plausible routes for geothermal fluids. Deep faults, the development of fault fracture zones, and karst fissures are just a few of the distinctive geological features that limit the origin, storage, and movement of groundwater in the study area. The degree of the thermal reservoir defines its capacity and water content conditions. Structural intersections, particularly fault zones, often serve as conduits for the accumulation of groundwater. These areas are considered the optimal path for future geothermal resource research. The outcomes of this investigation hold potential value for forthcoming geothermal prospecting and establishment within the examined region.
