Article

A Voltage-Aware P2P Power Trading System Aimed at Eliminating Unfairness Due to the Interconnection Location

Department of Electrical and Electronic Systems Engineering, Osaka Metropolitan University, Sakai City 599-8531, Japan
*
Author to whom correspondence should be addressed.
Energies 2024, 17(4), 841; https://doi.org/10.3390/en17040841
Submission received: 28 December 2023 / Revised: 3 February 2024 / Accepted: 8 February 2024 / Published: 10 February 2024
(This article belongs to the Special Issue Forecasting and Risk Management Techniques for Electricity Markets II)

Abstract

:
P2P power trading is necessary for efficiently using consumer electricity not subject to FIT. However, the execution rules for P2P power trading do not include restrictions on voltage, and there is a trade-off between the activation of the P2P power trading market through the mass introduction of PV and the optimization of the voltage of the power distribution system. In addition, there is a tendency for output curtailment to be biased toward consumers connected to the end of the grid. Since consumers cannot choose the interconnection location, there are concerns about unfairness. In this study, we investigate a new P2P model that includes voltage constraints for the execution rules of P2P power trading to avoid voltage deviation while ensuring benefits and fairness for the participants. In the proposed model, to increase the incentive to participate in the P2P power trading market, we consider compensating consumers who receive output curtailment signals due to voltage constraints. In addition, the profit is secured by differentiating the compensation cost unit price depending on the contract’s availability. A case study was conducted on this model using the IEEE 33 bus system. The results show that the proposed model is superior.

1. Introduction

In August 2009, the Japanese government introduced a “new purchase program for photovoltaic power generation” to transition to a low-carbon society. The “new purchase program for photovoltaic power generation” is a system that obliges general electric utilities to purchase surplus electricity from qualifying photovoltaic power generation facilities at a fixed price for a certain period. It is called the surplus power purchase program. The purchase price per kWh for the first year was 48 yen for residential use and 24 yen for non-residential use, about twice the voluntary purchase price of electric utilities. In August 2011, the “Act on Special Measures Concerning the Procurement of Renewable Electricity by Electric Utilities” was implemented on a trial basis. In July 2012, a feed-in tariff system was introduced, which obliges general electric utilities to purchase surplus electricity from renewable energy generation facilities that meet the requirements at a fixed price for a certain period [1]. The power supply subject to the feed-in tariff program was the power supply subject to the surplus power purchase program.
On the other hand, residential solar power generation with an output of less than 10 kW, for which the ten-year purchase period, gradually expires in November 2019. The cumulative number of residential photovoltaic power generation systems the purchase period of which ended by 2021 is said to total 1 million, and the cumulative amount of power generated is said to total 3.96 million kW [2]. Households whose purchase period has expired must have the option of increasing consumption or selling excess electricity at a lower price. However, due to the uneven output of solar power, the price of electricity sold is below 10 JPY/kWh for many businesses, which means the price will drop significantly. As a new trading venue for such surplus power, P2P power trading, which utilizes blockchain to conduct power transactions, is being considered [3,4,5,6]. P2P is an abbreviation for Peer to Peer, meaning transactions between equals, and the P2P power trading market is a market where consumers who sell surplus power (hereinafter referred to as “prosumers”) and consumers who purchase power (hereinafter referred to as “consumers”) exchange power. In P2P power trading, a blockchain (BC)-based power trading system has been proposed and tested [7]. In these studies, we evaluate automatic bidding, matching, profit in P2P power trading use, and intelligent contract processing capability in power trading built on BC. Because the unit price for purchasing PV power at the end of the purchase period has become very low, the prosumers will benefit from participating if they can sell power at a slightly higher unit price in P2P power trading. Similarly, if consumers can purchase electricity at a unit price lower than the retail electricity rate, they can reduce their electricity bills. In other words, P2P power trading has potential benefits for participants.
On the other hand, with the expansion of PV installation, the surplus power generated by PV exceeds the electricity demand during the hours when PV generation is high. As a result, the voltage rises that cause the end-of-consumer voltage to deviate from the specified range have become apparent. For this reason, installing power conditioners for PV systems (PV-PCS) with the output curtailment method is mandatory. However, in the conventional output curtailment method using a PV-PCS [8], the increase in the own-end voltage is suppressed by suppressing the active power output, resulting in inequity in the surplus power sold depending on the installation location in the power distribution system. Therefore, P2P power trading is recommended for systems that tend to be low-voltage with large interconnected loads [9].
However, for grids that tend to be high-voltage with a low interconnected load or when considering the future increase in the surplus power due to the spread of PV, the problem of voltage rise may occur. To solve the voltage rise problem, P2P power trading that takes the grid voltage into account has been studied [10,11,12,13]. These papers solve the over-voltage problem in addition to increasing profits. However, since these papers estimate the effects of voltage and power flow on a per-matching, unfairness occurs depending on the interconnection location of the distribution system, such that trading fails when voltage problems arise. In addition, these P2P rules lost trading opportunities because the tradable power is equalized and limited in advance to deal with grid voltage problems. Furthermore, there was a significant profit difference depending on the interconnection location within the distribution network.
In this study, we propose a P2P power trading system that considers the unfairness caused by voltage constraints. Inequity here refers to the fact that the amount of PV output curtailment varies depending on the location of the grid connection because the output curtailment of PV is required by considering voltage constraints. We contribute to developing P2P power trading systems by constructing a P2P power trading system that eliminates this unfairness and increases the benefits to the participants. Specifically, we propose a P2P power market system that introduces financial compensation for PV output curtailment, which is necessary to manage grid voltage to consider the unfairness of interconnection locations due to voltage constraints. In this system, we introduce a contract price as a variable cost to compensate for the source of financial compensation for PV output curtailment. The proposed method sets different unit prices of output curtailment for the availability of P2P transactions by prosumers. Then, the amount of PV output curtailment for each consumer is determined to minimize the total compensation cost for output curtailment. The amount of output curtailment is selected to reduce the total compensation within the voltage constraints.
The remainder of this paper is organized as follows. Section 2 describes the P2P power trading model proposed in this paper. Section 3 describes the kernel density estimation methodology to create PV output scenarios. In Section 4, we simulate using the IEEE 33 bus system and evaluate the effectiveness of the proposed P2P model. Finally, in Section 5, a brief conclusion of this paper is given.

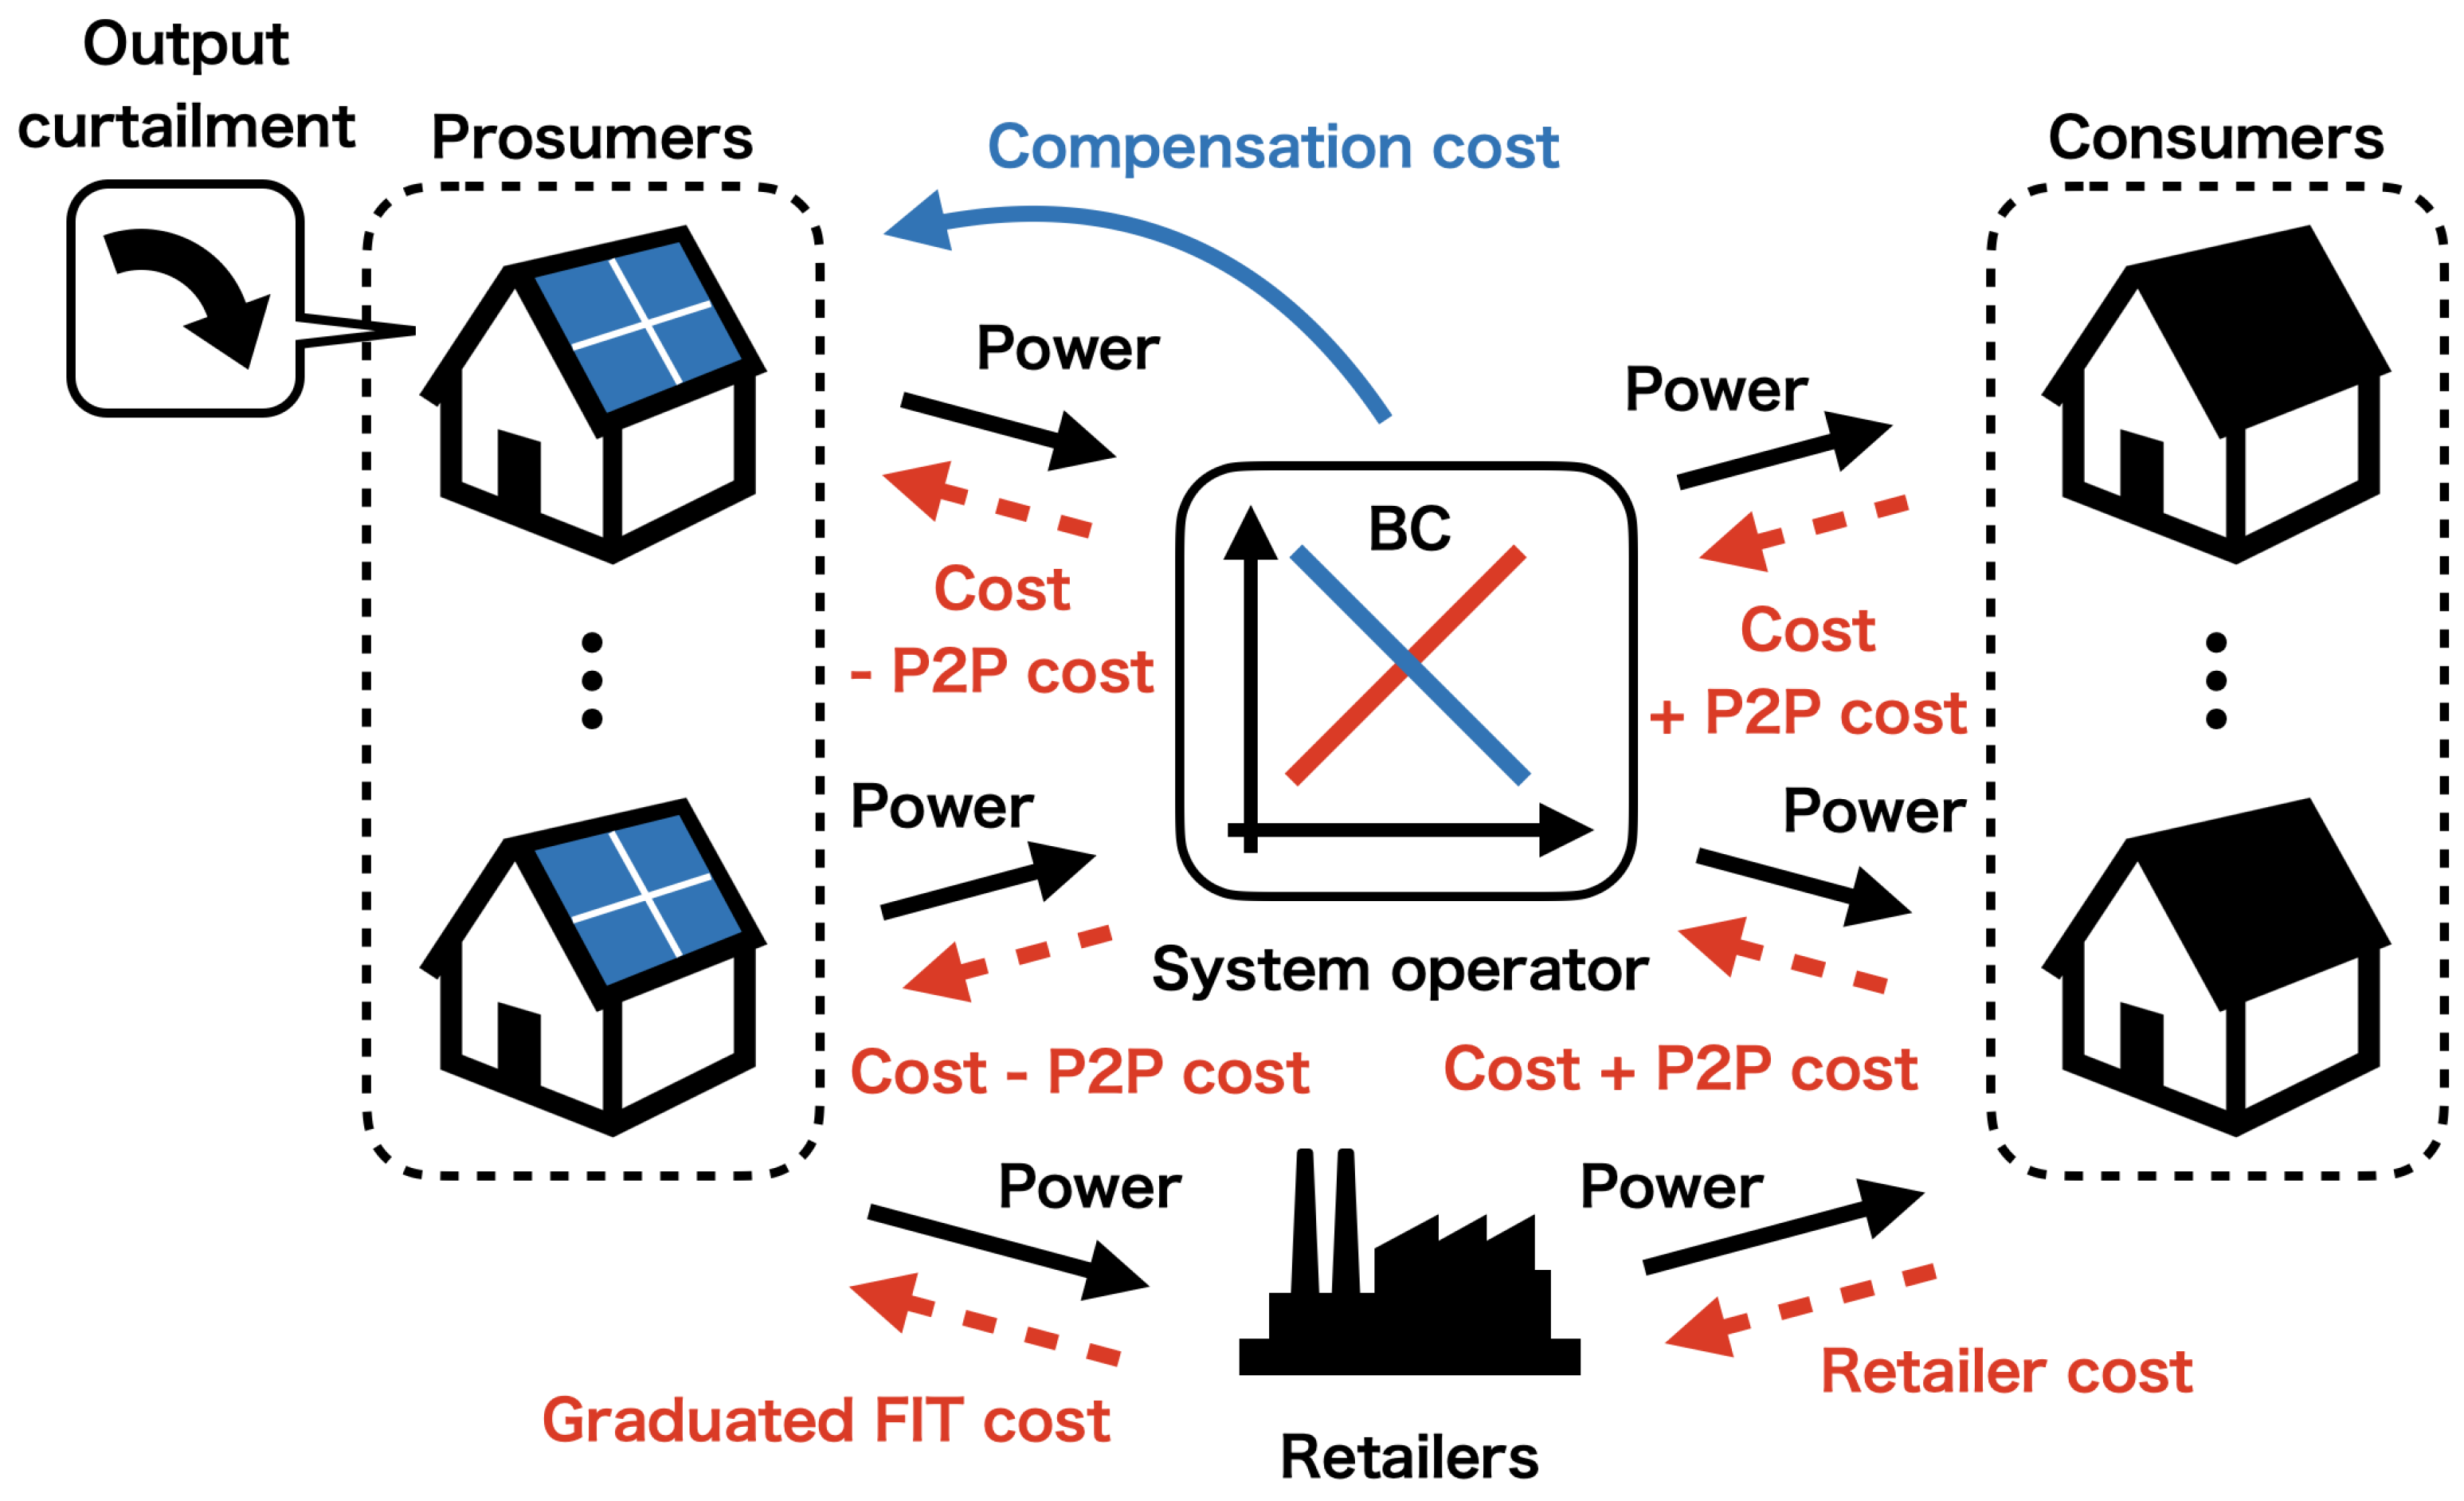
2. Proposed P2P Power Trading System
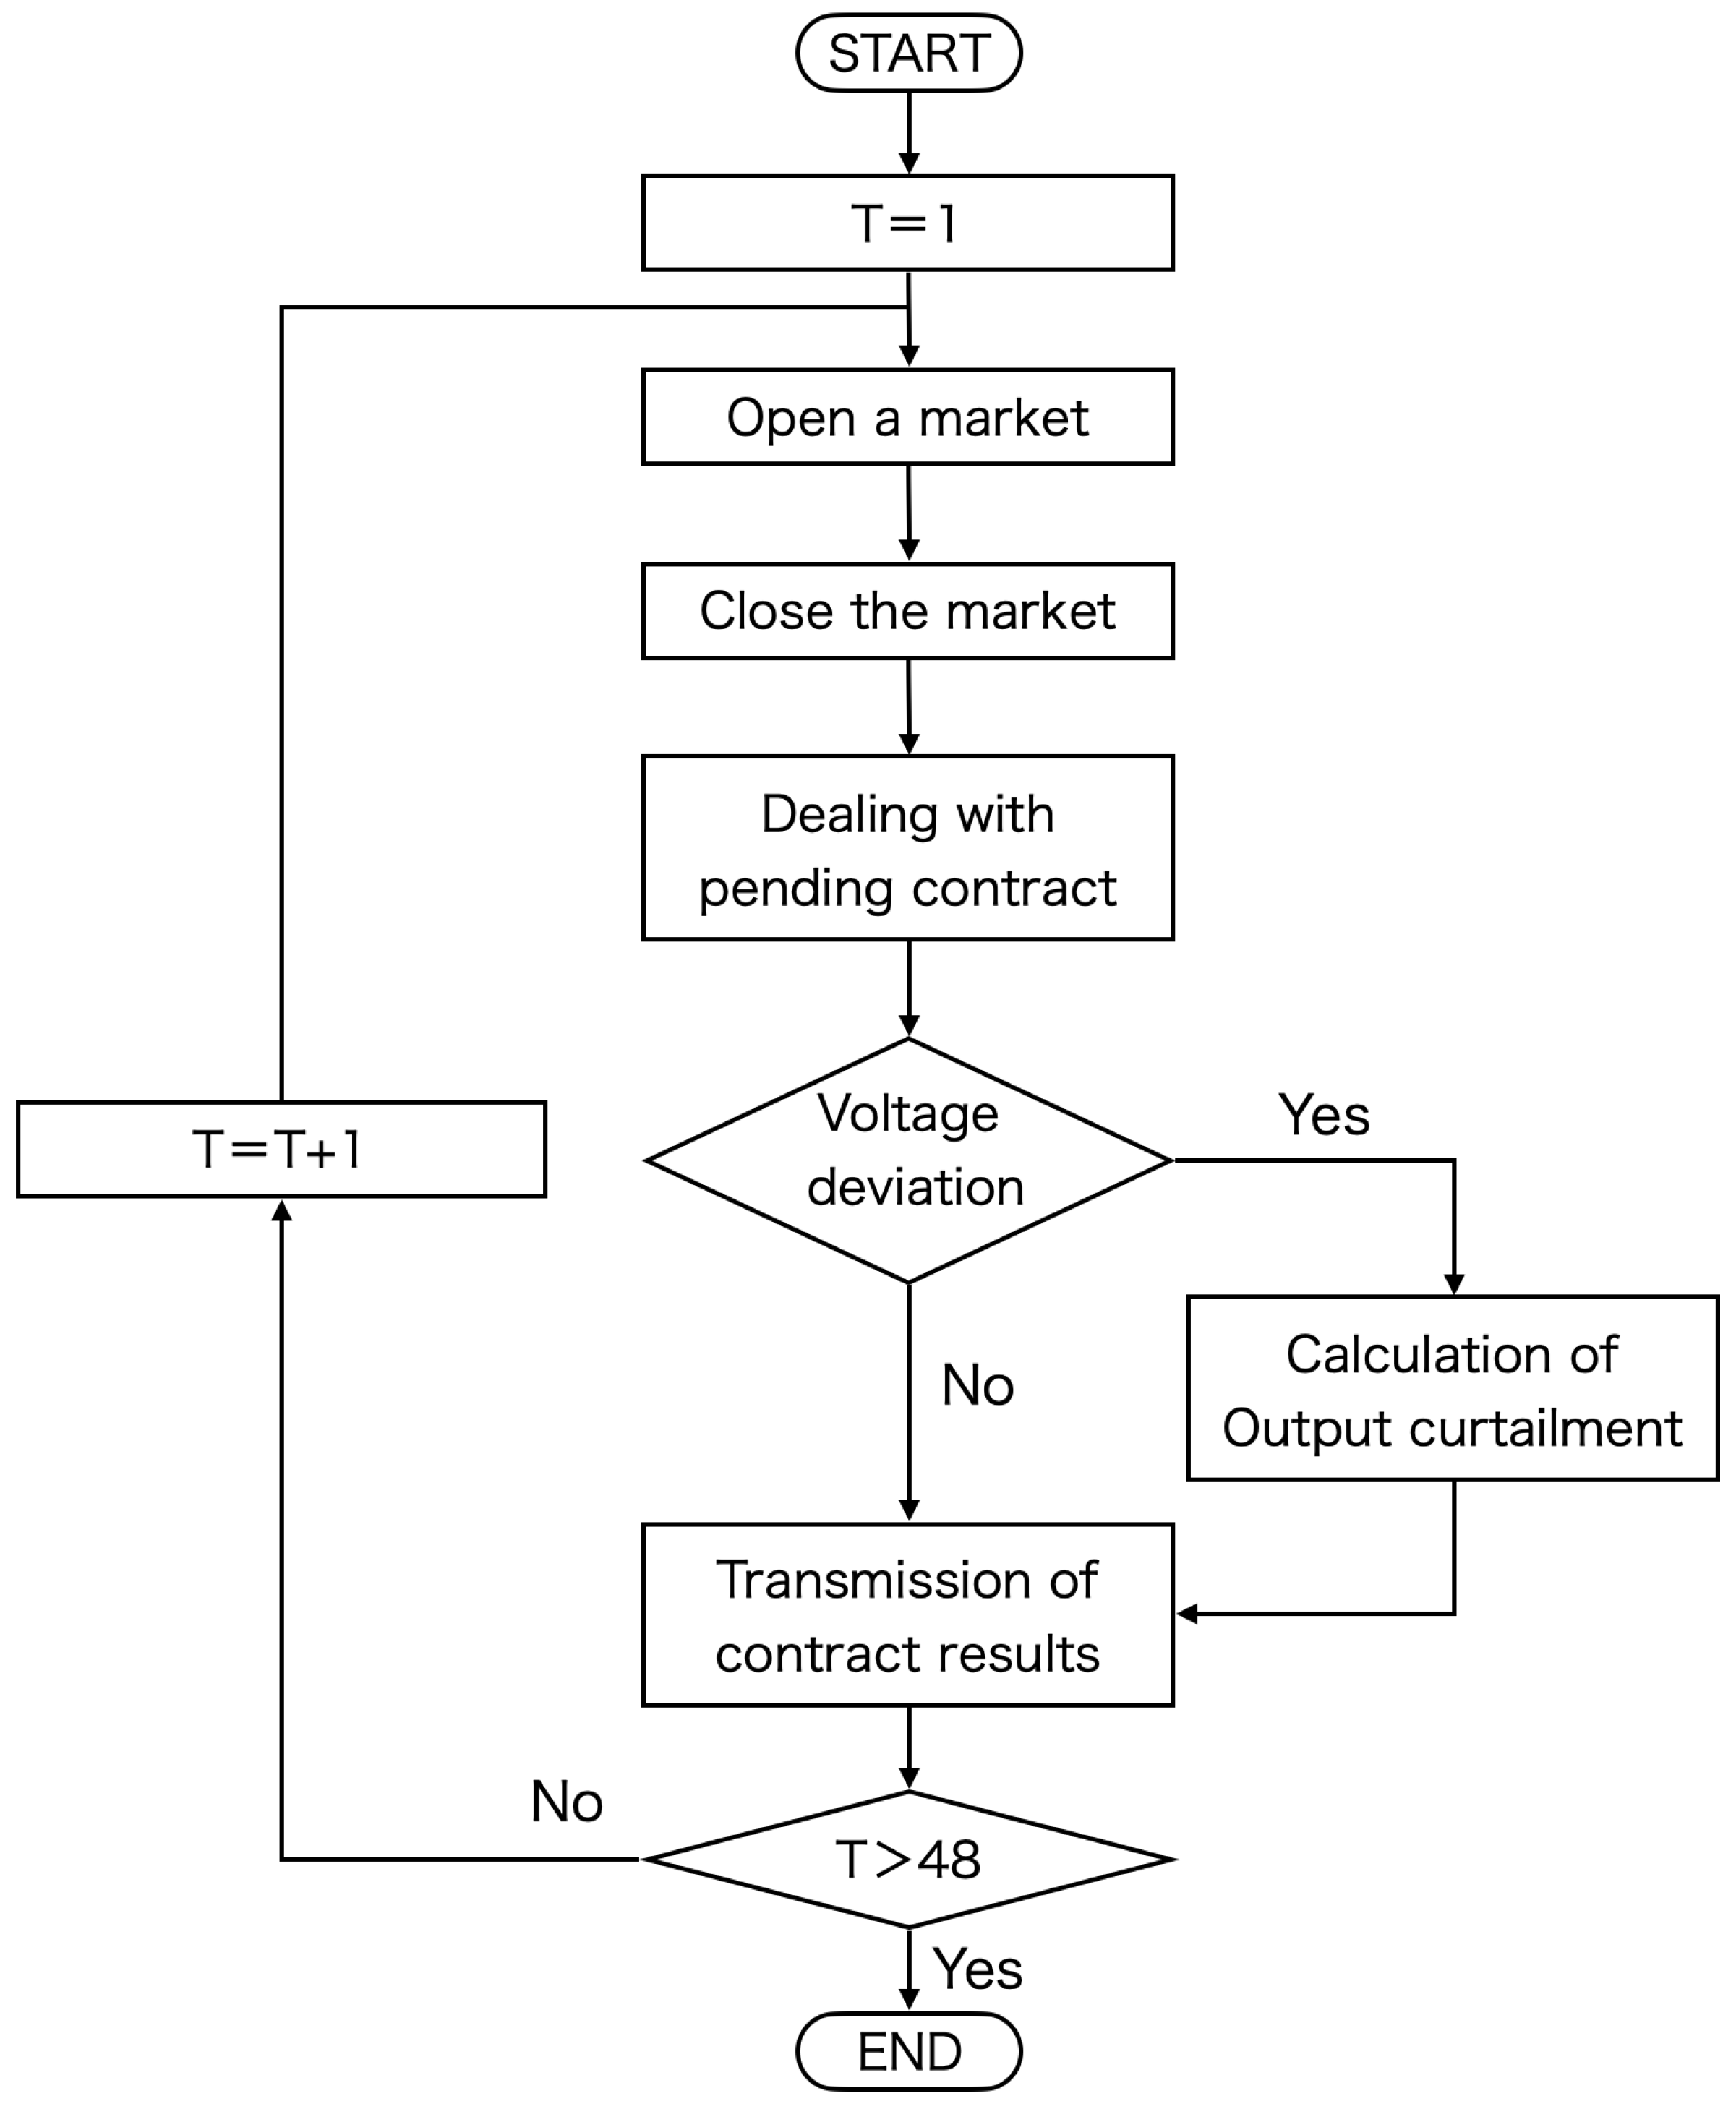
2.1. Outline

A schematic diagram of the proposed P2P electricity trading system in this study is shown in Figure 1. This paper has four players in this market system: consumers, prosumers, system operators, and retail electricity providers. The consumers are the residences that consume electricity and do not have PV systems. They procure electricity from the P2P electricity market. If they cannot procure electricity from the P2P electricity market, they procure electricity from retailers.
Prosumers supply their demand with PV power and earn profits by bidding their surplus power to the P2P power market. If they cannot sell their surplus power in the P2P power market, they can sell it to the retailers at the graduated FIT unit price.
The system operator needs to manage the grid voltage and can request the prosumers to curtail the PV surplus output if the grid voltage is expected to deviate from the regulated range. This study supposes that the system operator introduces proposed P2P power trading. In other words, if the introduction of P2P power trading rules eliminates voltage deviations, there will be no need to install new equipment and a cost benefit for the system operator.
On the other hand, the voltage distribution in the distribution system during times of heavy reverse power flow tends to increase at the end of the distribution system. Suppose the grid operator requests consumers to curtail their output without specific measures. In that case, consumers connected to the end of the distribution system receive many curtailment signals, leading to a cost disadvantage for the consumers connected to the end. Therefore, this paper proposes that the grid operator pays a compensation fee to consumers who receive output curtailment signals for output curtailment. This compensation fee is calculated by multiplying the indicated amount of output curtailment by the unit price. Consumers who have established P2P power trading contracts receive a compensation fee equal to the clearing price if targeted for output curtailment, which means that the grid operator fully compensates the prosumer for the cost of output curtailment. Conversely, prosumers who fail to make a contract receive compensation lower than the FIT unit price. Initially, if P2P power trading is not implemented, there is no financial compensation for output curtailment. However, if they participate in P2P power trading, they will be financially compensated by the grid operator even if they are subject to output curtailment. This will encourage further prosumer participation, thus stimulating P2P power trading. However, if the P2P market compensates more than the FIT unit price, the advantage of selling electricity in the P2P market will be lost. So, the unit compensation price for output curtailment will be 8 JPY/kWh or less in subsequent studies.
The daily flow of a P2P power market is shown in Figure 2. First, the system operator opens the P2P electricity market. Then, prosumers and consumers bid on the P2P market. The system operator makes a pending contract based on their bidding. The contracting scheme is described in detail in Section 2.2, which refers to the reference in [14]. The system operator then checks the voltage profile based on the calculation result using the pending contract result and the system information. When the voltage at each node is controlled within the regulated range, the system operator decides to execute the contract with the pending contract. When there is a voltage deviation, the system operator determines the prosumer’s output curtailment and updates the contract result. The method of determining the output curtailment is described in Section 2.3. Finally, the system operator sends the updated contract result to the participant.

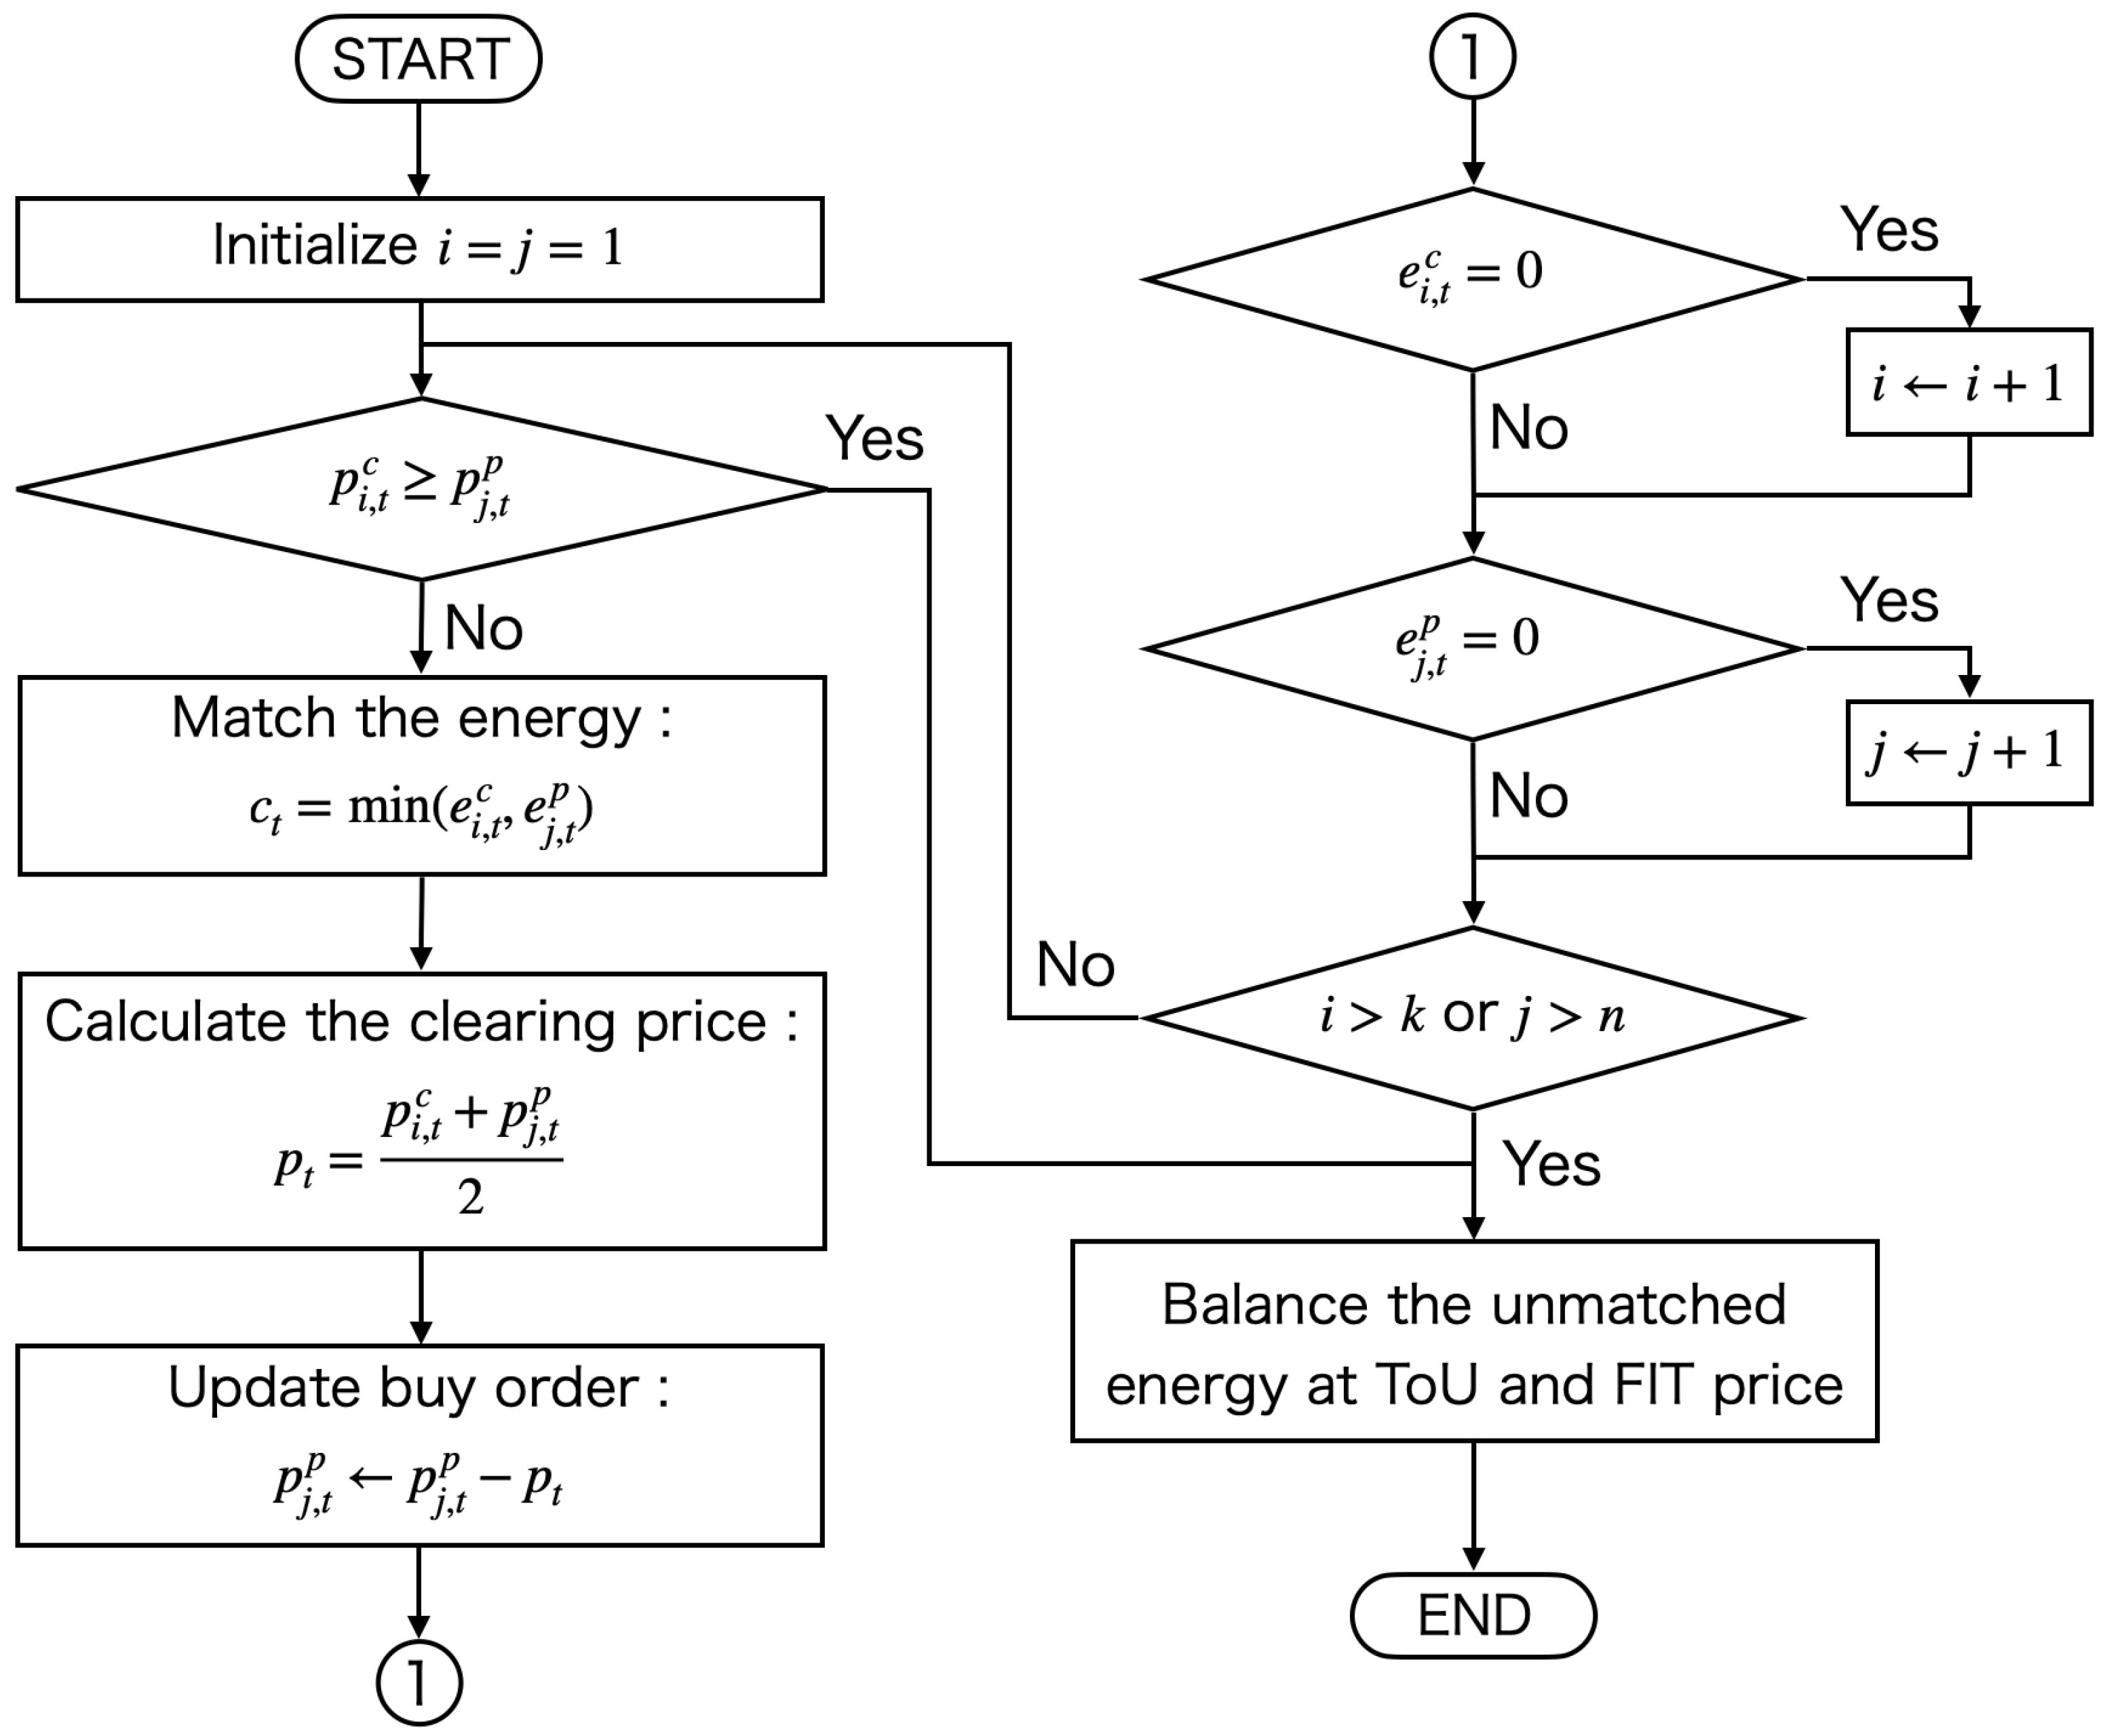
2.2. Contract Scheme

The flowchart of the matching process applied in this paper is shown in Figure 3, where p represents the bid price, e represents the bid quantity, i represents the consumer number, j represents the prosumer number, k represents the total number of consumers at time t, and n represents the total number of prosumers at time t. At the beginning of the auction period, market participants submit their trade prices and energy quantities to the market. The system operator sorts the prosumers’ and consumers’ bidding information based on the price to create supply and demand curves. Then, the market clearing price between the matched buy and sell prices is calculated using the matching method shown in Figure 3. The matching method used in this paper is a double auction. The system operator determines the clearing price by half the price from the consumer with the highest bid and the prosumer with the lowest bid. When there is a difference in the contracted power between the consumer with the highest bid and the prosumer with the lowest bid, the system operator matches the remaining bidding power with the next participant. The transaction volume equals the minimum volume between the matched orders. Finally, at the end of the auction period, orders that do not match the energy residuals are balanced by the retail electric utility at the ToU and FIT prices. Note that the pricing strategies of all the market participants will be bound between the FiT and the ToU to ensure economic benefits.

2.3. Calculation of Output Curtailment

As mentioned above, the system operator pays a compensation fee for the output curtailment to the consumer who receives the output curtailment signal. However, the unit price of the compensation fee varies depending on the contract’s execution. This paper formulates the problem of determining the amount of PV output curtailment as an optimization problem. In the proposed P2P power market transaction, the system operator compensates the prosumers who suppress their output to maintain the system voltage. By reducing the total amount of compensation, the participation fee and transaction fee for P2P power market transactions paid by prosumers and consumers, which are the source of funds, are reduced, and the system operator reduces the compensation risk, creating a win–win relationship for all players. Therefore, this paper sets the objective function of the optimization problem to minimize the financial compensation to the prosumers who have implemented output curtailment to maintain the system voltage. The optimization formulation is shown below.
min i = 1 n P i c u r · C t P 2 P + j = 1 m P j c u r · C c o m
P i P i c u r = V i k = 1 n + m V k { G i k cos θ i θ k + B i k sin θ i θ k }
P j P j c u r = V j k = 1 n + m V k { G j k cos θ j θ k + B j k sin θ j θ k }
Q i = V i k = 1 n + m V k { G i k sin θ i θ k B i k cos θ i θ k }
Q j = V j k = 1 n + m V k { G j k sin θ j θ k B j k cos θ j θ k }
V min V k V max ( k = 1 n + m )
π θ k π ( k = 1 n + m )
0 P k c u r P k ( k = 1 n + m )
where i denotes the number of prosumers contracted, j denotes the number of prosumers not contracted, P c u r denotes the amount of output curtailment, C P 2 P denotes the clearing price for the P2P power transaction, C c o m denotes the compensation fee for the PV output curtailment, P denotes the amount of active power bid, Q denotes the reactive power, V denotes the node voltage, θ denotes the phase angle of the node, and P s u r denotes the surplus power. G and B denote the conductance and susceptance components between nodes, and V min and V max denote the minimum and maximum voltage in the specified range of the node voltage, respectively.
Equation (1) shows the objective function formulated to minimize the sum of compensation charges for consumers who have contracted in P2P power trading and those who have not. This paper considers that the prosumers who could contract in P2P power trading set the contracted price to the compensation unit price to prevent opportunity losses due to output curtailment, and the compensation unit price for prosumers who could not contract is considered a parameter. Equations (2)–(5) show the tidal equations for active and reactive power, respectively, and by adding a term for PV output curtailment P c u r to Equations (2) and (3), the voltage upper and lower limit constraints are satisfied by substituting a value for P c u r when the voltage upper and lower limit constraints shown in Equation (6) are not satisfied. Equation (7) shows the phase angle constraints for each node, and Equation (8) shows the upper bound constraints on the amount of output curtailment so that no more curtailment than surplus power is allowed.

2.4. P2P Cost Determination Method

When the voltage conditions are considered in determining the contract quantity and price for P2P power trading, the frequency of output curtailment varies depending on the interconnection location, causing inequity among consumers. To reduce this inequity, we implement monetary compensation for output curtailment by prosumers. The system operator needs to compensate prosumers financially for the opportunity loss to curtail electricity sales due to output curtailment. However, since consumers can receive supply from retail electricity suppliers even if the transaction cannot be executed, this study supposes that the system operator does not provide monetary compensation to consumers. In addition, for the system operator to provide monetary compensation, it must have financial resources. We consider that the system operator collects P2P costs from P2P market participants and uses them as the resource; the P2P costs consist of participation fees from the market participants, shown in Equation (9), and the transaction fees (meaning consignment fees) for contracts, shown in Equation (10).
F b = k = 1 n + m C p f
F c o n = k = 1 n + m ω · C P 2 P · ( P K P k c u r )
where F b denotes the total participation fee from all the participants, which is determined based on the profit that the system operator wishes to secure in this study; the participation fee is considered necessary for the operation of the P2P power trading system. We considered it to correspond to the profit of the system operator in this study. However, it is necessary to determine the participation fee while considering the profit of the participants in P2P power trading because if the participants in P2P power trading are disadvantaged, it will lead to the decline of the market; C p f denotes the participation fee per consumer. In this study, the system operator settles and collects a uniform amount of C p f from the participants based on their profit performance so that the profit of the least profitable participant equals the profit of the system operator. Note that the participation fee is collected once a month, like a basic fee. F c o n is the total compensation for PV output curtailment; ω is the percentage of the transaction fee; and C P 2 P is the clearing price of a contract. Since P k P k c u r indicates the final contracted quantity, we set the market participant to pay the system operator ω % of the traded amount in the P2P power transaction. The transaction fee is necessary for grid maintenance and is considered equivalent to the consignment fee in the current system. In Japan, the demand side bears 100% of the transmission charges. However, to expand the introduction of renewable energy in the future, a study is underway to make cost-sharing more equitable by requiring power generators and grid users to bear a portion of the charges along with consumers. In this study, the generation side is the prosumer, and the retail side is the consumer, referring to the previous study. Hence, the prosumers are supposed to bear 10% of the transaction fee and the consumers 90%. This study reduces the burden of grid usage fees for prosumers to increase PV installation and stimulate P2P power trading.

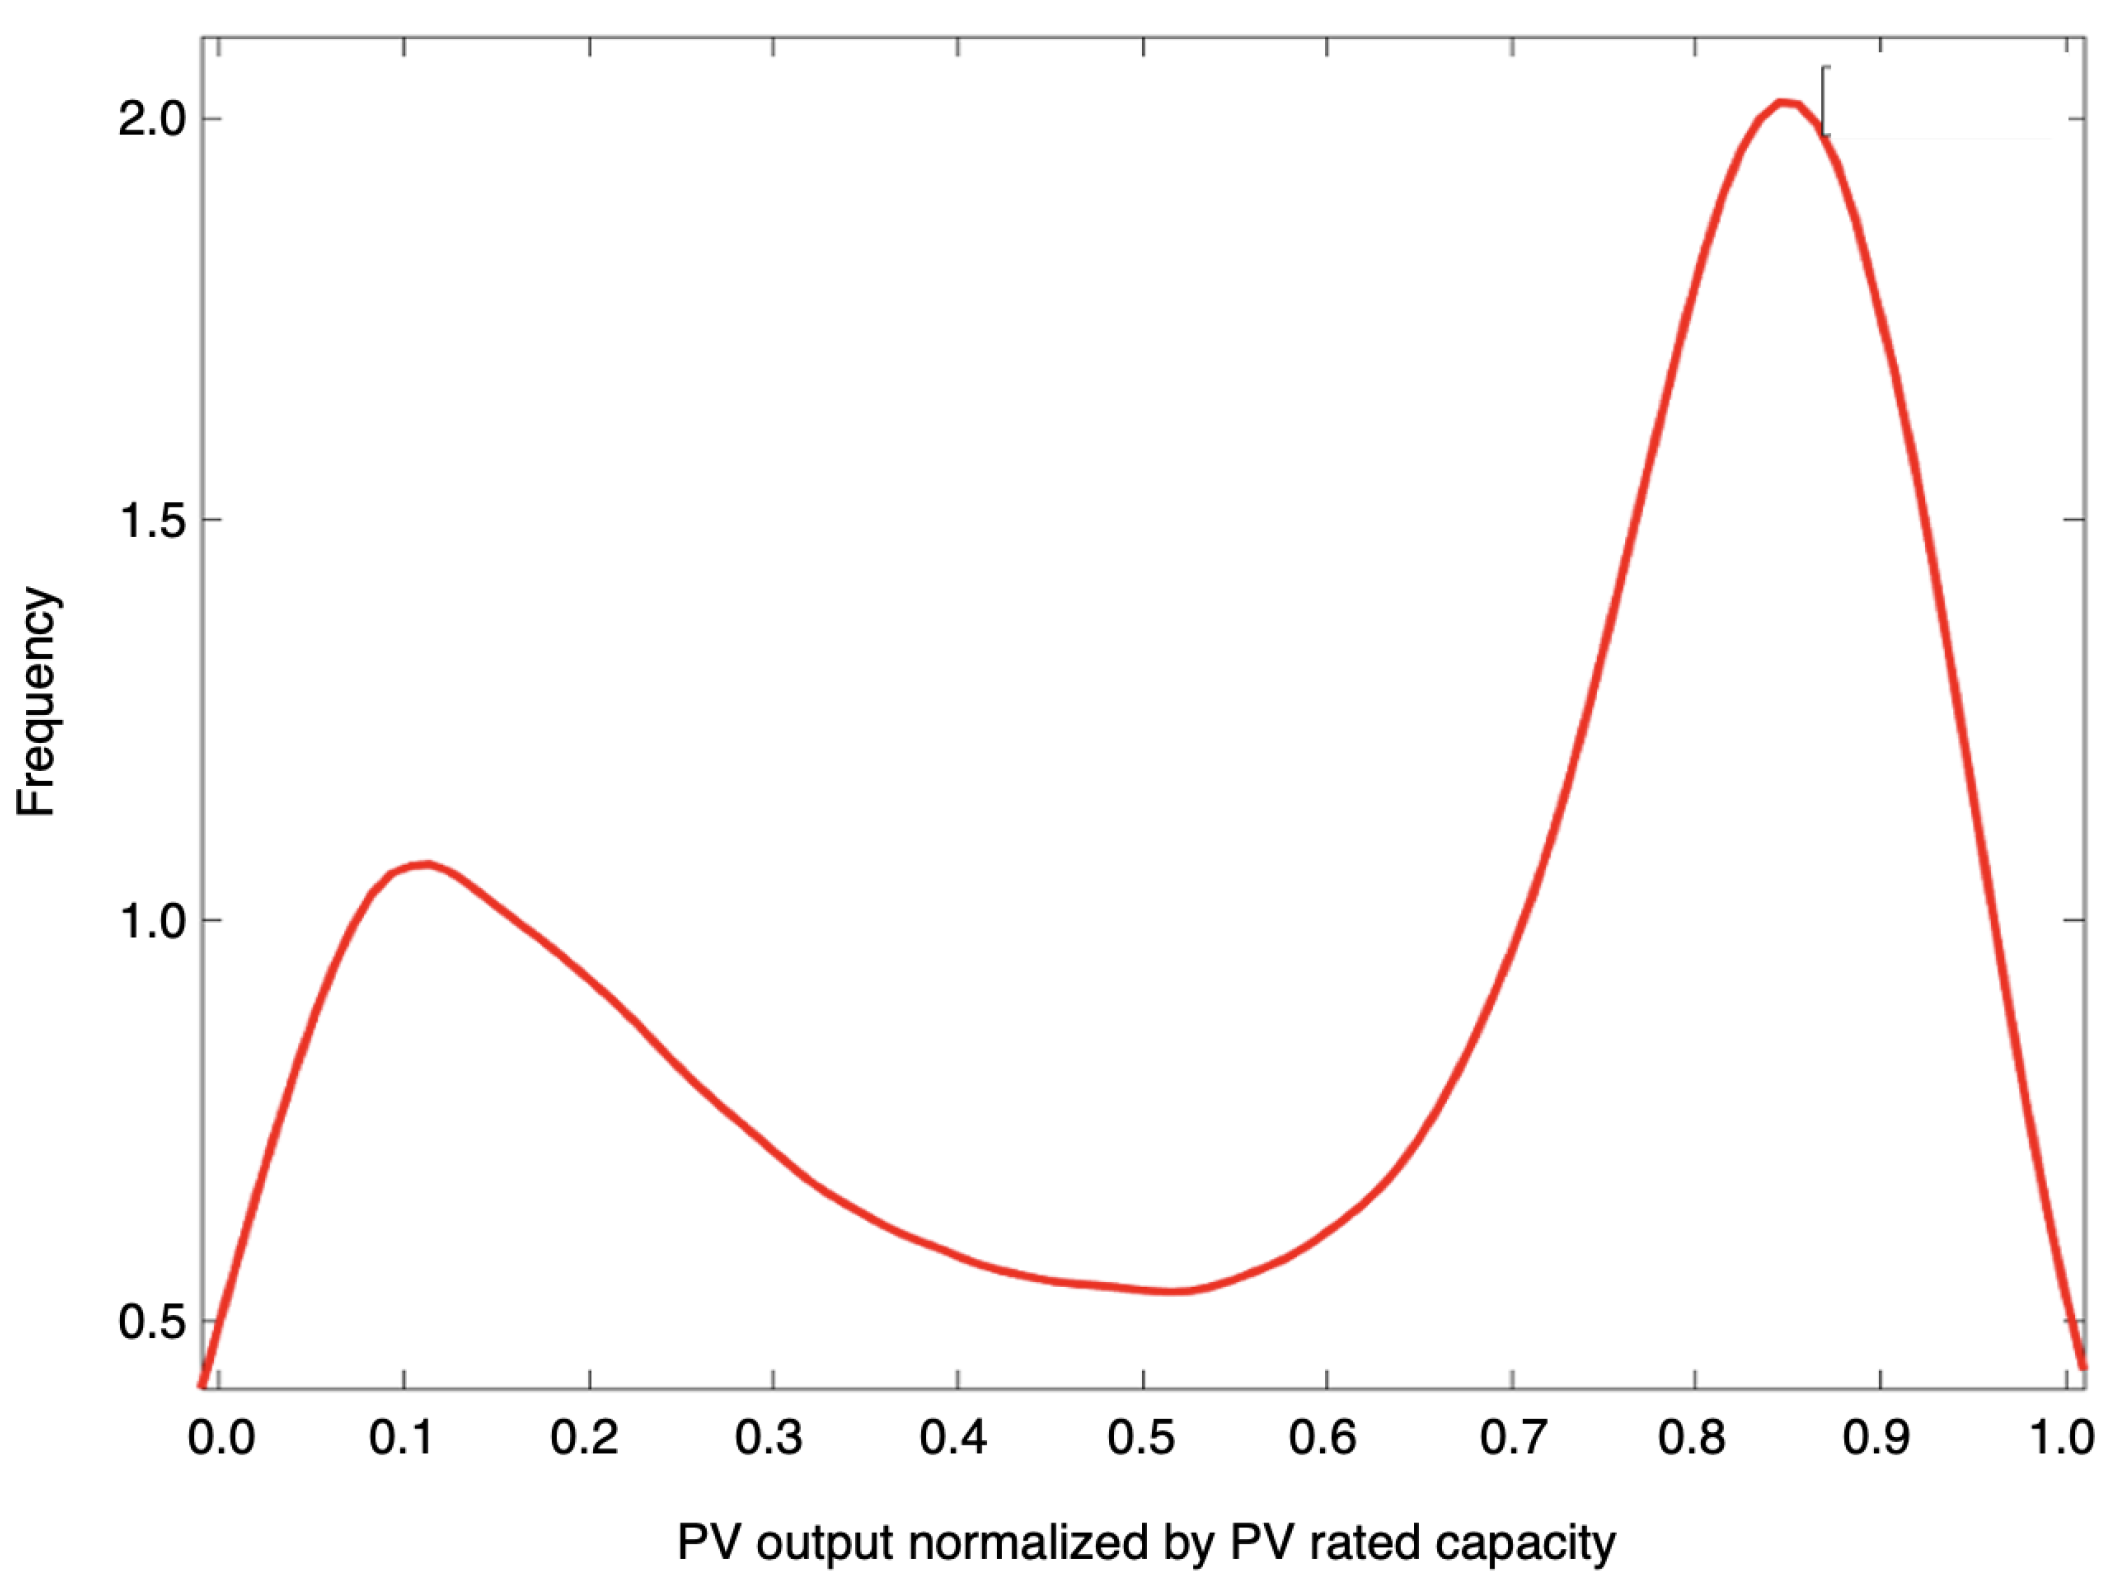
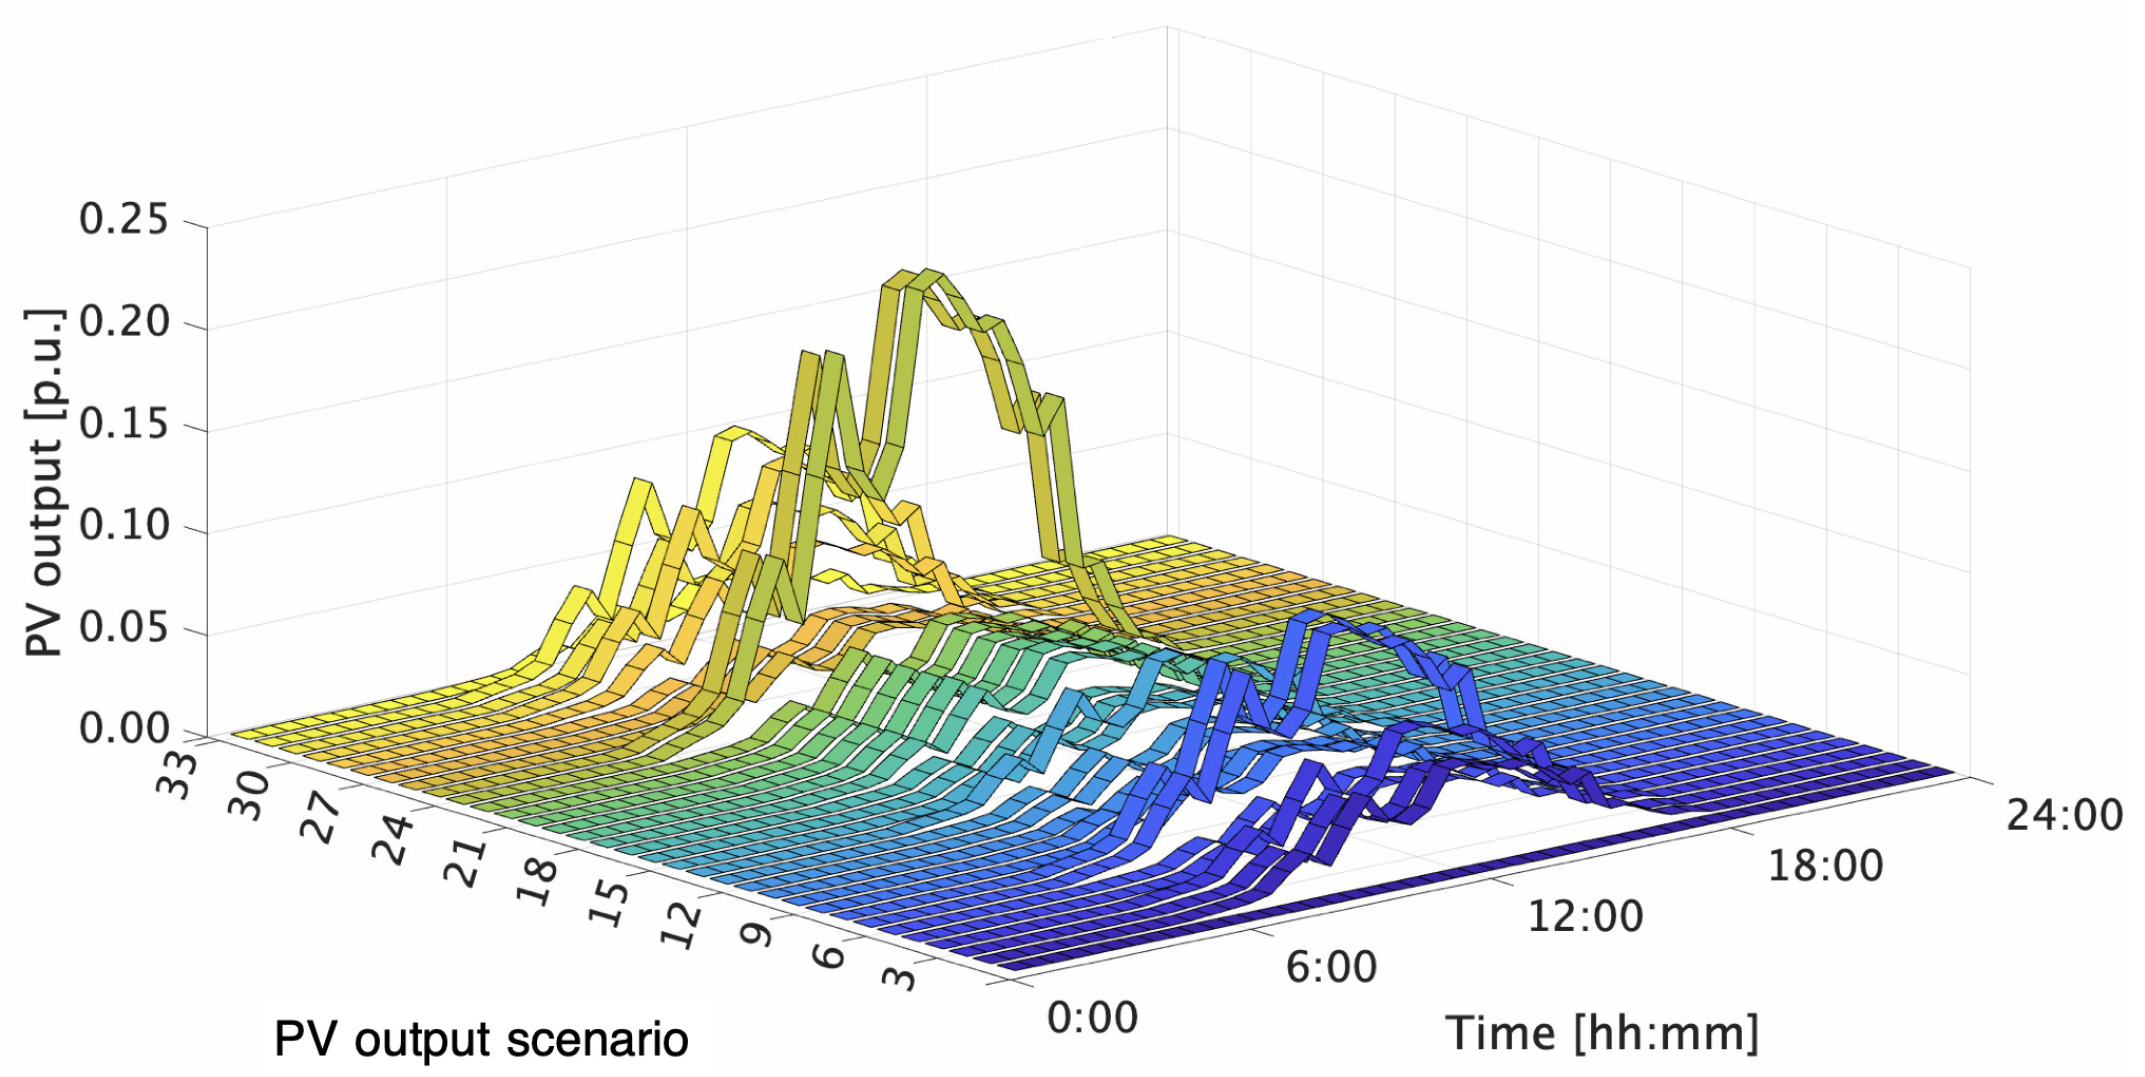
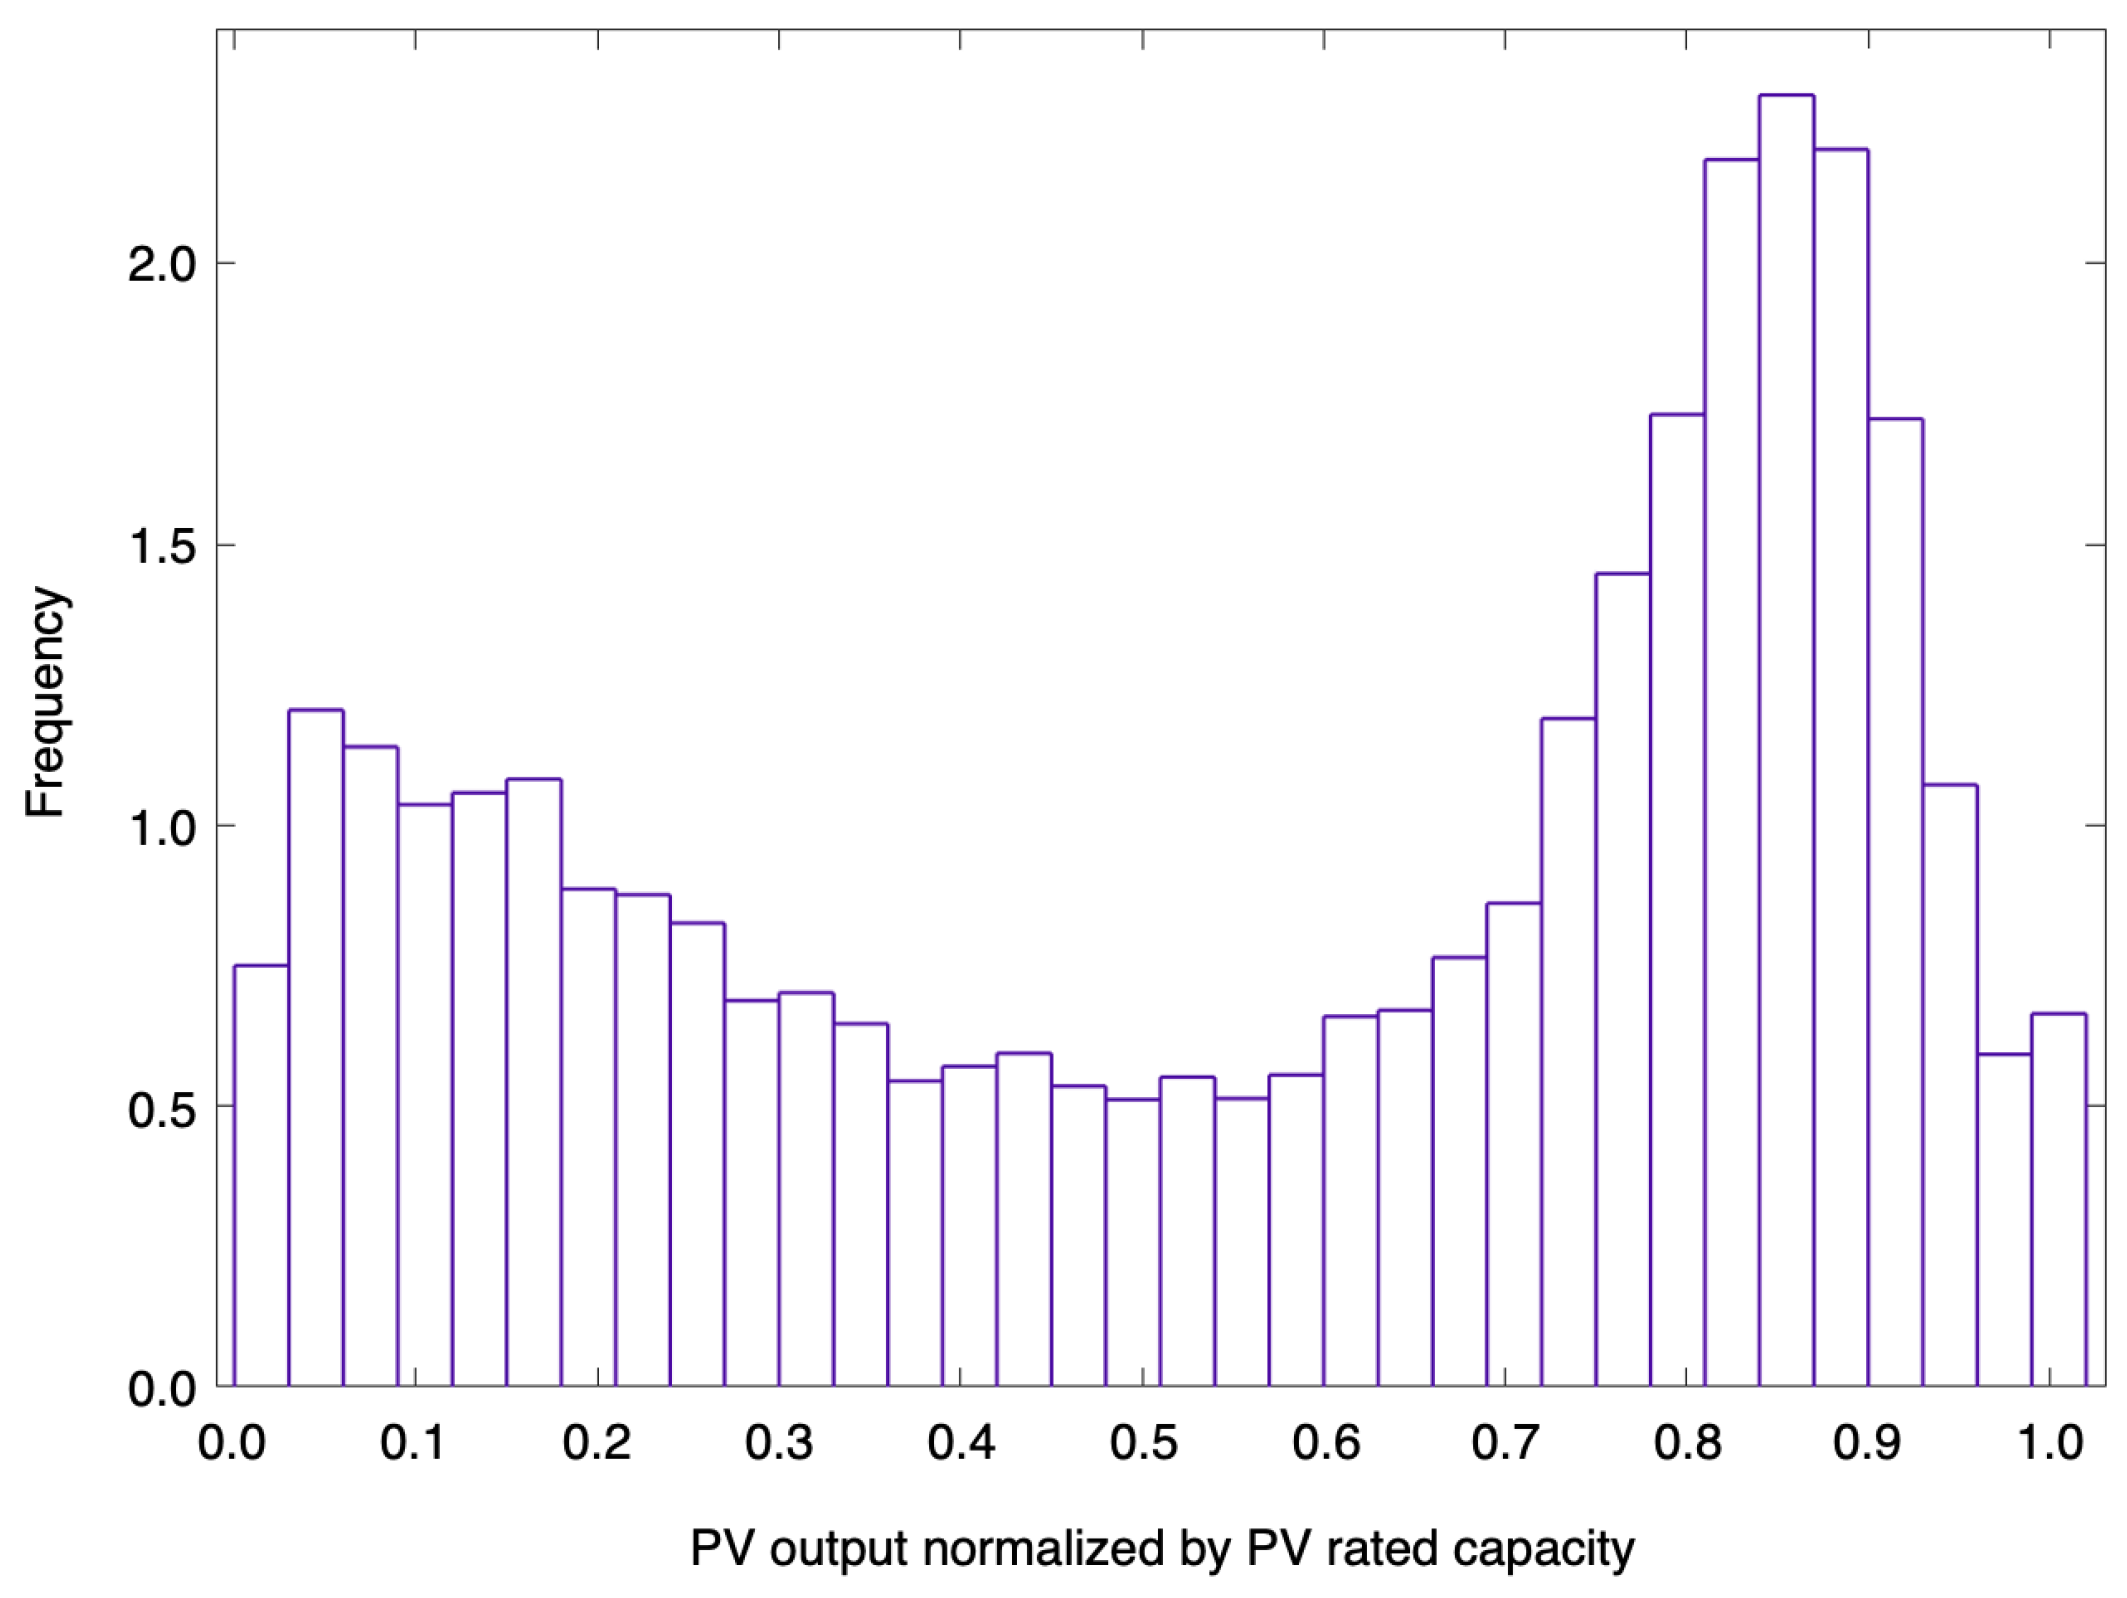
3. Generation of Scenario of PV Output

This paper evaluates the proposed method’s usefulness using PV data over a long period and in various weather conditions. It also creates multiple PV scenarios based on actual data. In particular, we applied kernel density estimation to the probability distribution of the PV outputs from measurement data. This chapter aims to estimate the probability density of the PV output. Figure 4 shows the normalized statistical results of the PV output. As shown in Figure 4, two peaks are caused by sunny and rainy days. Using the parametric model for the probability density estimation of the PV output is difficult. The authors employed kernel density estimation, a nonparametric method. In particular, reference [15] shows that the Epanechnikov kernel can be used as the kernel function to transition the probability density with reasonable accuracy, and this paper uses the Epanechnikov kernel to estimate the PV output distribution in this study.
When the data X 1 , X 2 , and X n are observed according to an unknown distribution q, the kernel density estimator for that distribution is defined as
f ^ x ( x , h ) = 1 n h i = 1 n K x X i h
where K is the kernel function, and h is the bandwidth. The kernel function has the following properties.
K ( u ) d u = 1
u K ( u ) d u = 0
u 2 K ( u ) d u = σ K 2 <
The Gaussian and the Epanechnikov kernel, expressed in equation (15), have been used as kernel functions in various studies. In this study, the Epanechnikov kernel, which provides a probability density function with high accuracy, was used [16].
K E P A ( u ) = 3 4 ( 1 u 2 ) ( | u | 1 ) 0 ( o t h e r w i s e )
Then, we consider the integration of the mean square error of the density function for the bandwidth, and by transforming and approximating, we obtain Equation (16).
I S M E f ^ x ( x , h ) 1 n h K ( t ) 2 d t + 1 4 h 4 k 2 2 f ( x ) 2 d x
where
k 2 = t 2 K ( t ) d t
Let h ^ be the h for which Equation (16) is minimal, and we can derive Equation (18).
h ^ = k 2 2 / 5 K ( t ) 2 d t 1 / 5 f ( x ) 2 d x 1 / 5 n 1 / 5
Then, we created PV scenarios using the probability density function obtained from the kernel density estimation, using PV data measured at the Osaka Metropolitan University in April and May 2011. Due to the limited number of data, we normalized the PV-rated capacity at each period during the two months to 1.0 p.u. We created one probability distribution for each period when the PV generated power. The probability density distribution for the period between 11:30 and 12:00, obtained by the kernel density estimation, is shown in Figure 5. The vertical axis shows the probability density, and the horizontal axis shows the normalized PV output. As in Figure 5, the probability density distribution has two peaks representing sunny and cloudy weather; we can model the PV output appropriately.
Finally, Figure 6 shows an example of the PV output data, which was converted from p.u. to kW using the values used for normalization at each period, with upper and lower limit constraints placed on the PV output variation to prevent abrupt PV output fluctuations from occurring. Note that different colors indicate different scenarios.

4. Numerical Verification

In this chapter, we use the PV scenario to verify the P2P electricity market transactions numerically. We describe the simulation’s content and assumptions, followed by its results and discussion. We used “fmincon” in MATLAB2021a’s Optimization toolbox, precisely the sequential quadratic programming method within “fmincon”.

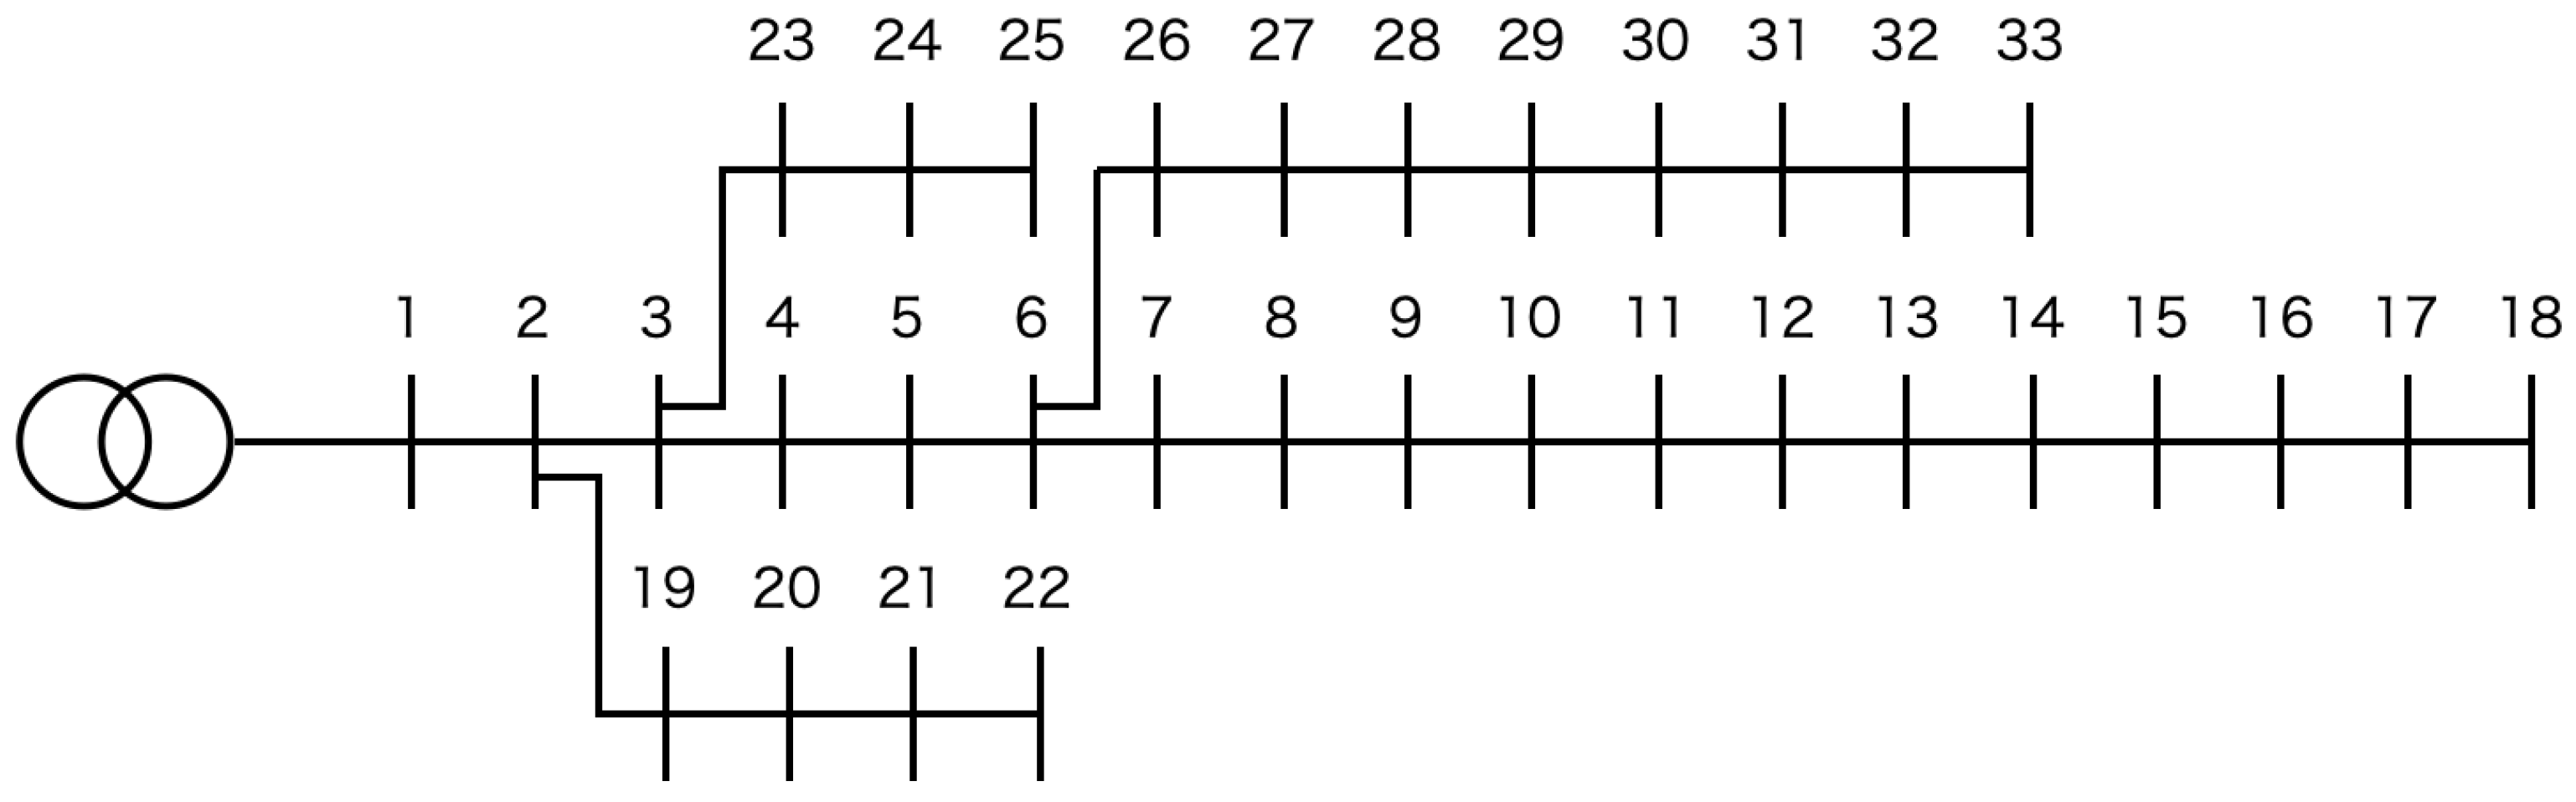
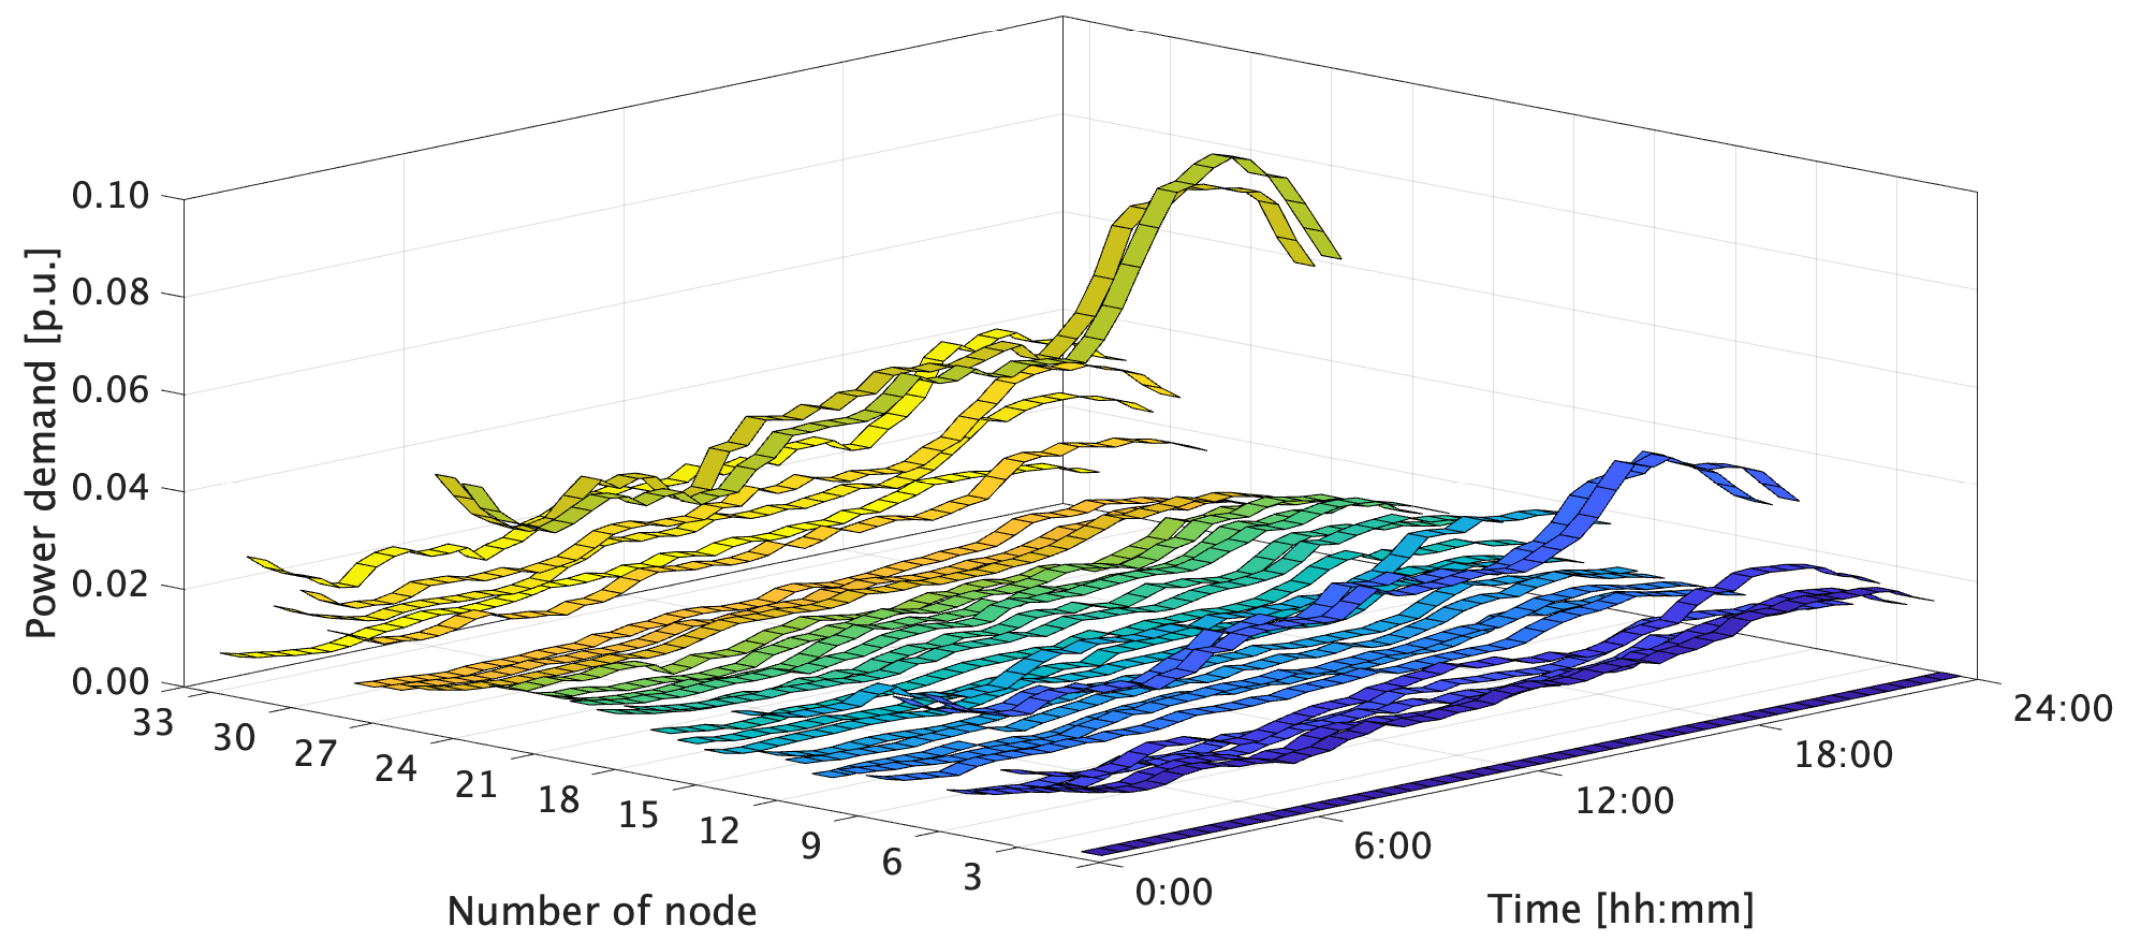
4.1. Simulation Conditions for the Distribution Network

Figure 7 shows the middle-voltage grid model of the IEEE 33 bus system [17] used in this study. There are 30 consumers installed at each node of the simulation model, and an aggregator manages each node. The aggregator determines and notifies the next day’s bid volume and price on the previous day. The specific bid amounts and bid prices are described below in Section 4.2. In addition, we consider a pattern for the PV installation: to install the PV at even-numbered nodes to alternate the PVs’ locations.
We used the power demand data of consumers in Ota City, Gunma Prefecture, Japan, measured within the NEDO demonstration project. We modified the number of consumers so that their MW values matched those of the demand data listed in the IEEE 33-bus system (Figure 8). Note that different colors indicate different nodes of the IEEE 33-bus system.

4.2. Simulation Conditions for the P2P Power Trading

This section describes a model of the bidding behavior of market participants. The prosumers bid the amount of surplus PV output, and the consumers bid the required amount of demand for P2P electricity trading. The market participants also set their bid prices between 8 and 20 yen using uniform random numbers. We set these conditions concerning the electricity prices and the purchase price of the PV surplus power of the Kansai Electric Power Co., Inc. Multiple simulations under these conditions simulate various bidding behaviors and evaluate the effectiveness of the proposed model based on statistical indices.
As mentioned above, C P 2 P sets the unit price equal to the clearing price to compensate for the profit to the prosumer who could execute the transaction. Conversely, the compensation unit price C c o m for prosumers who could not perform the transaction is between 1 and 8 yen, referring to the unit price of the surplus PV output purchase. Note that we consider the compensation unit price by varying it as a parameter.

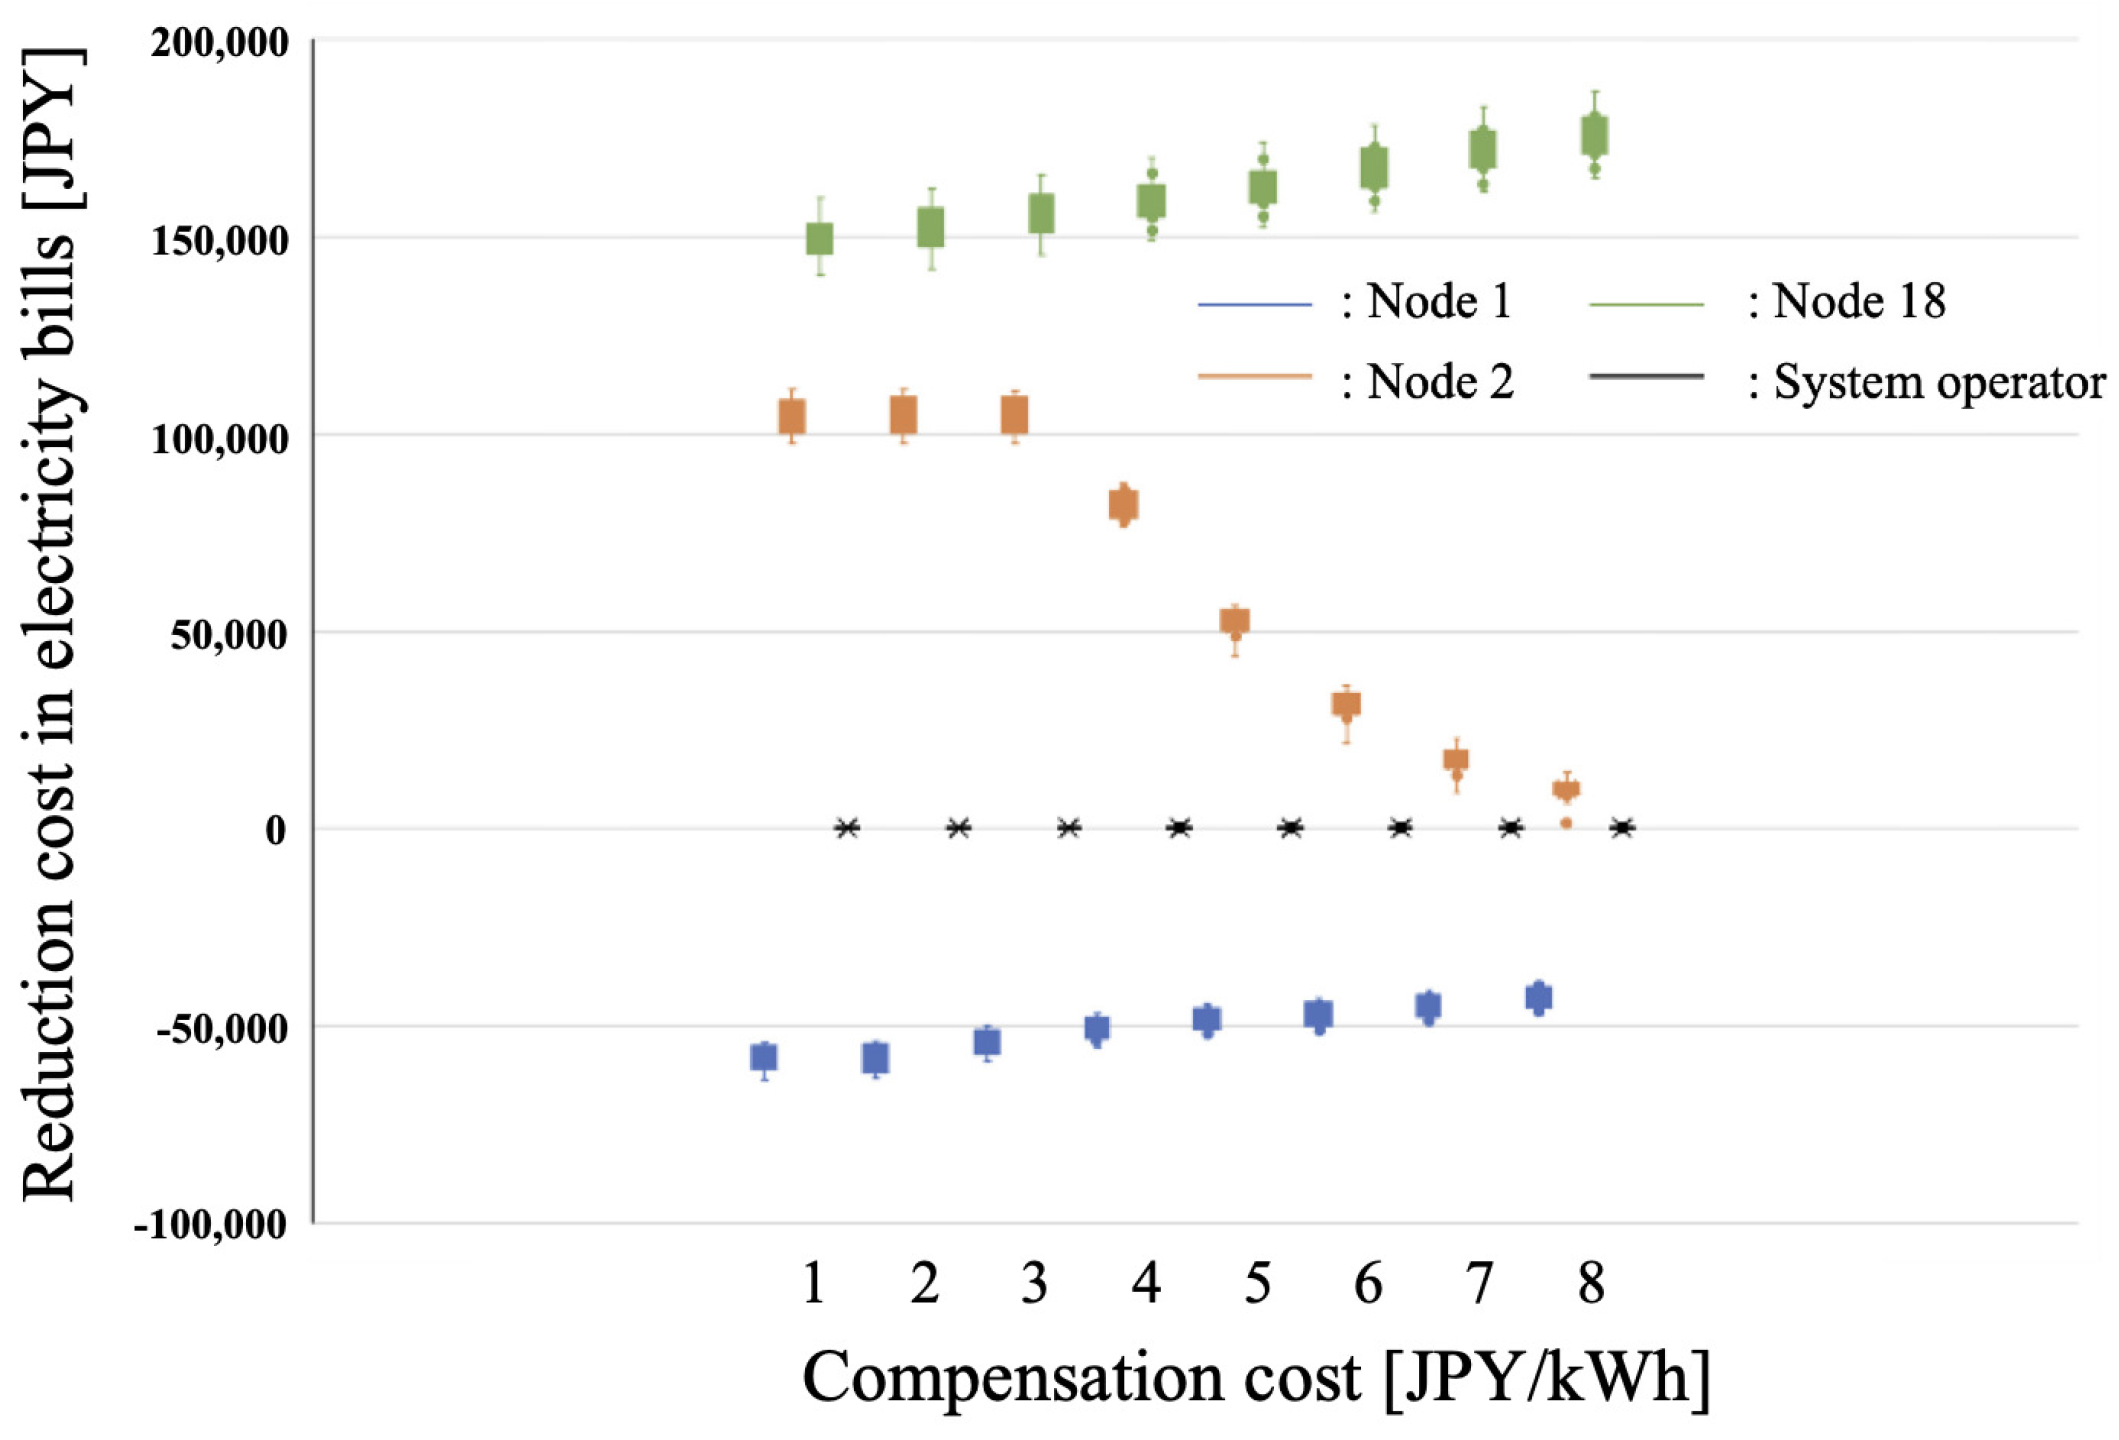
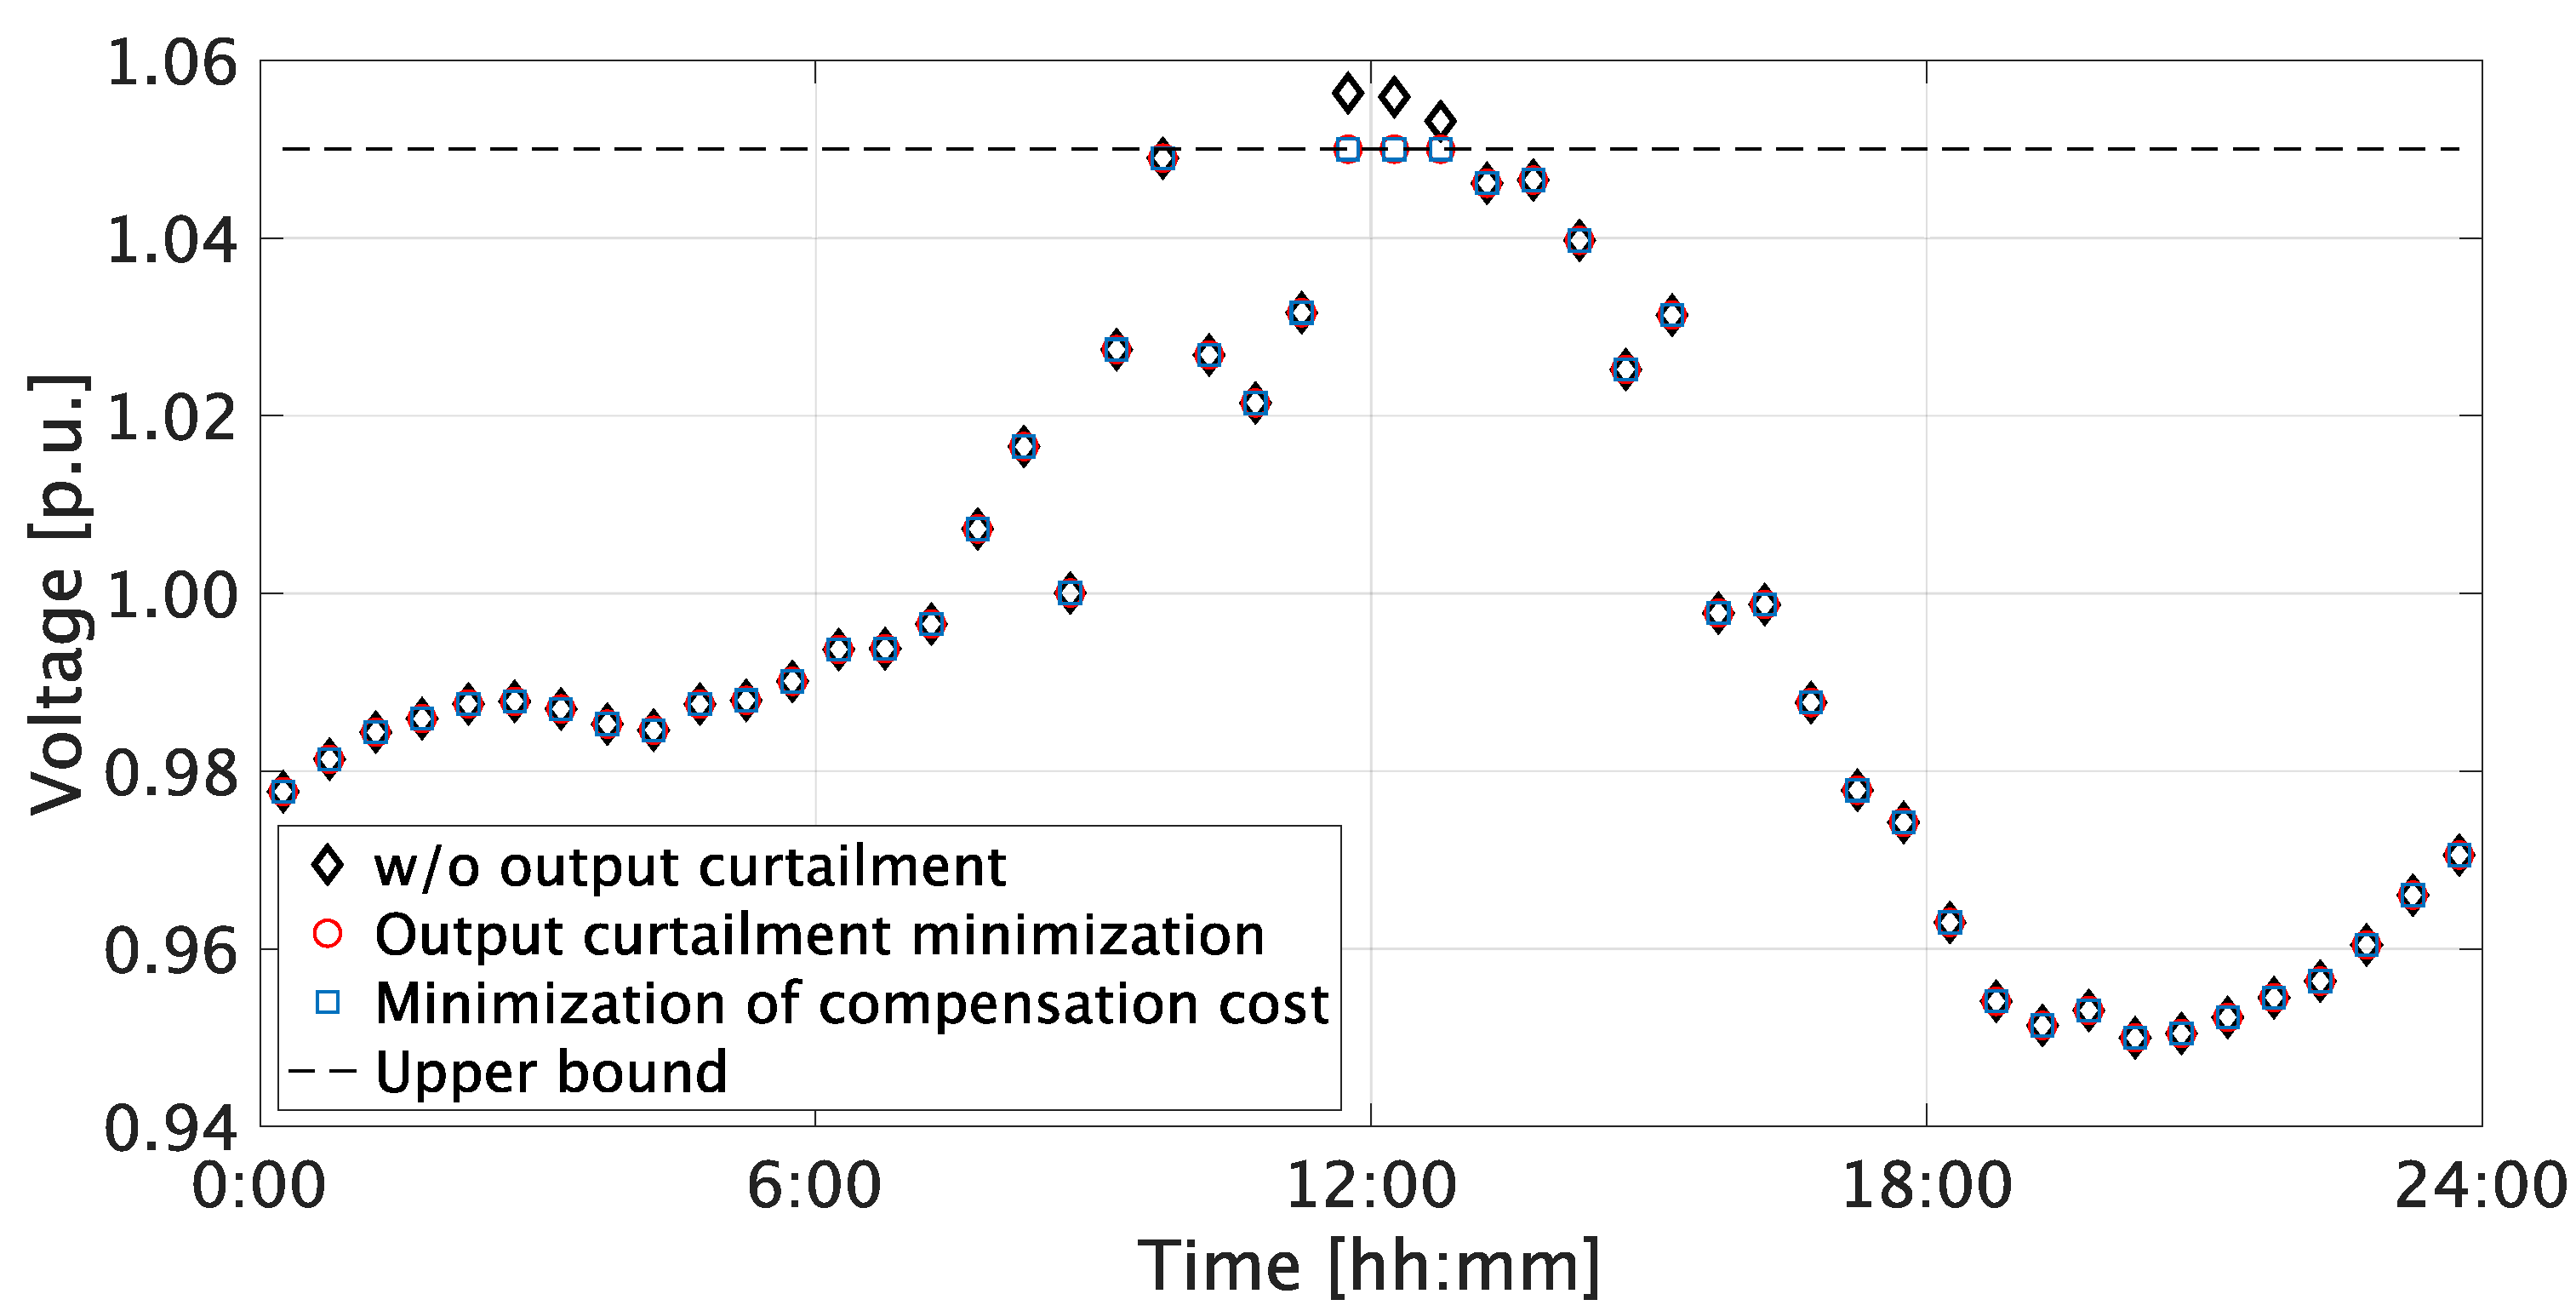
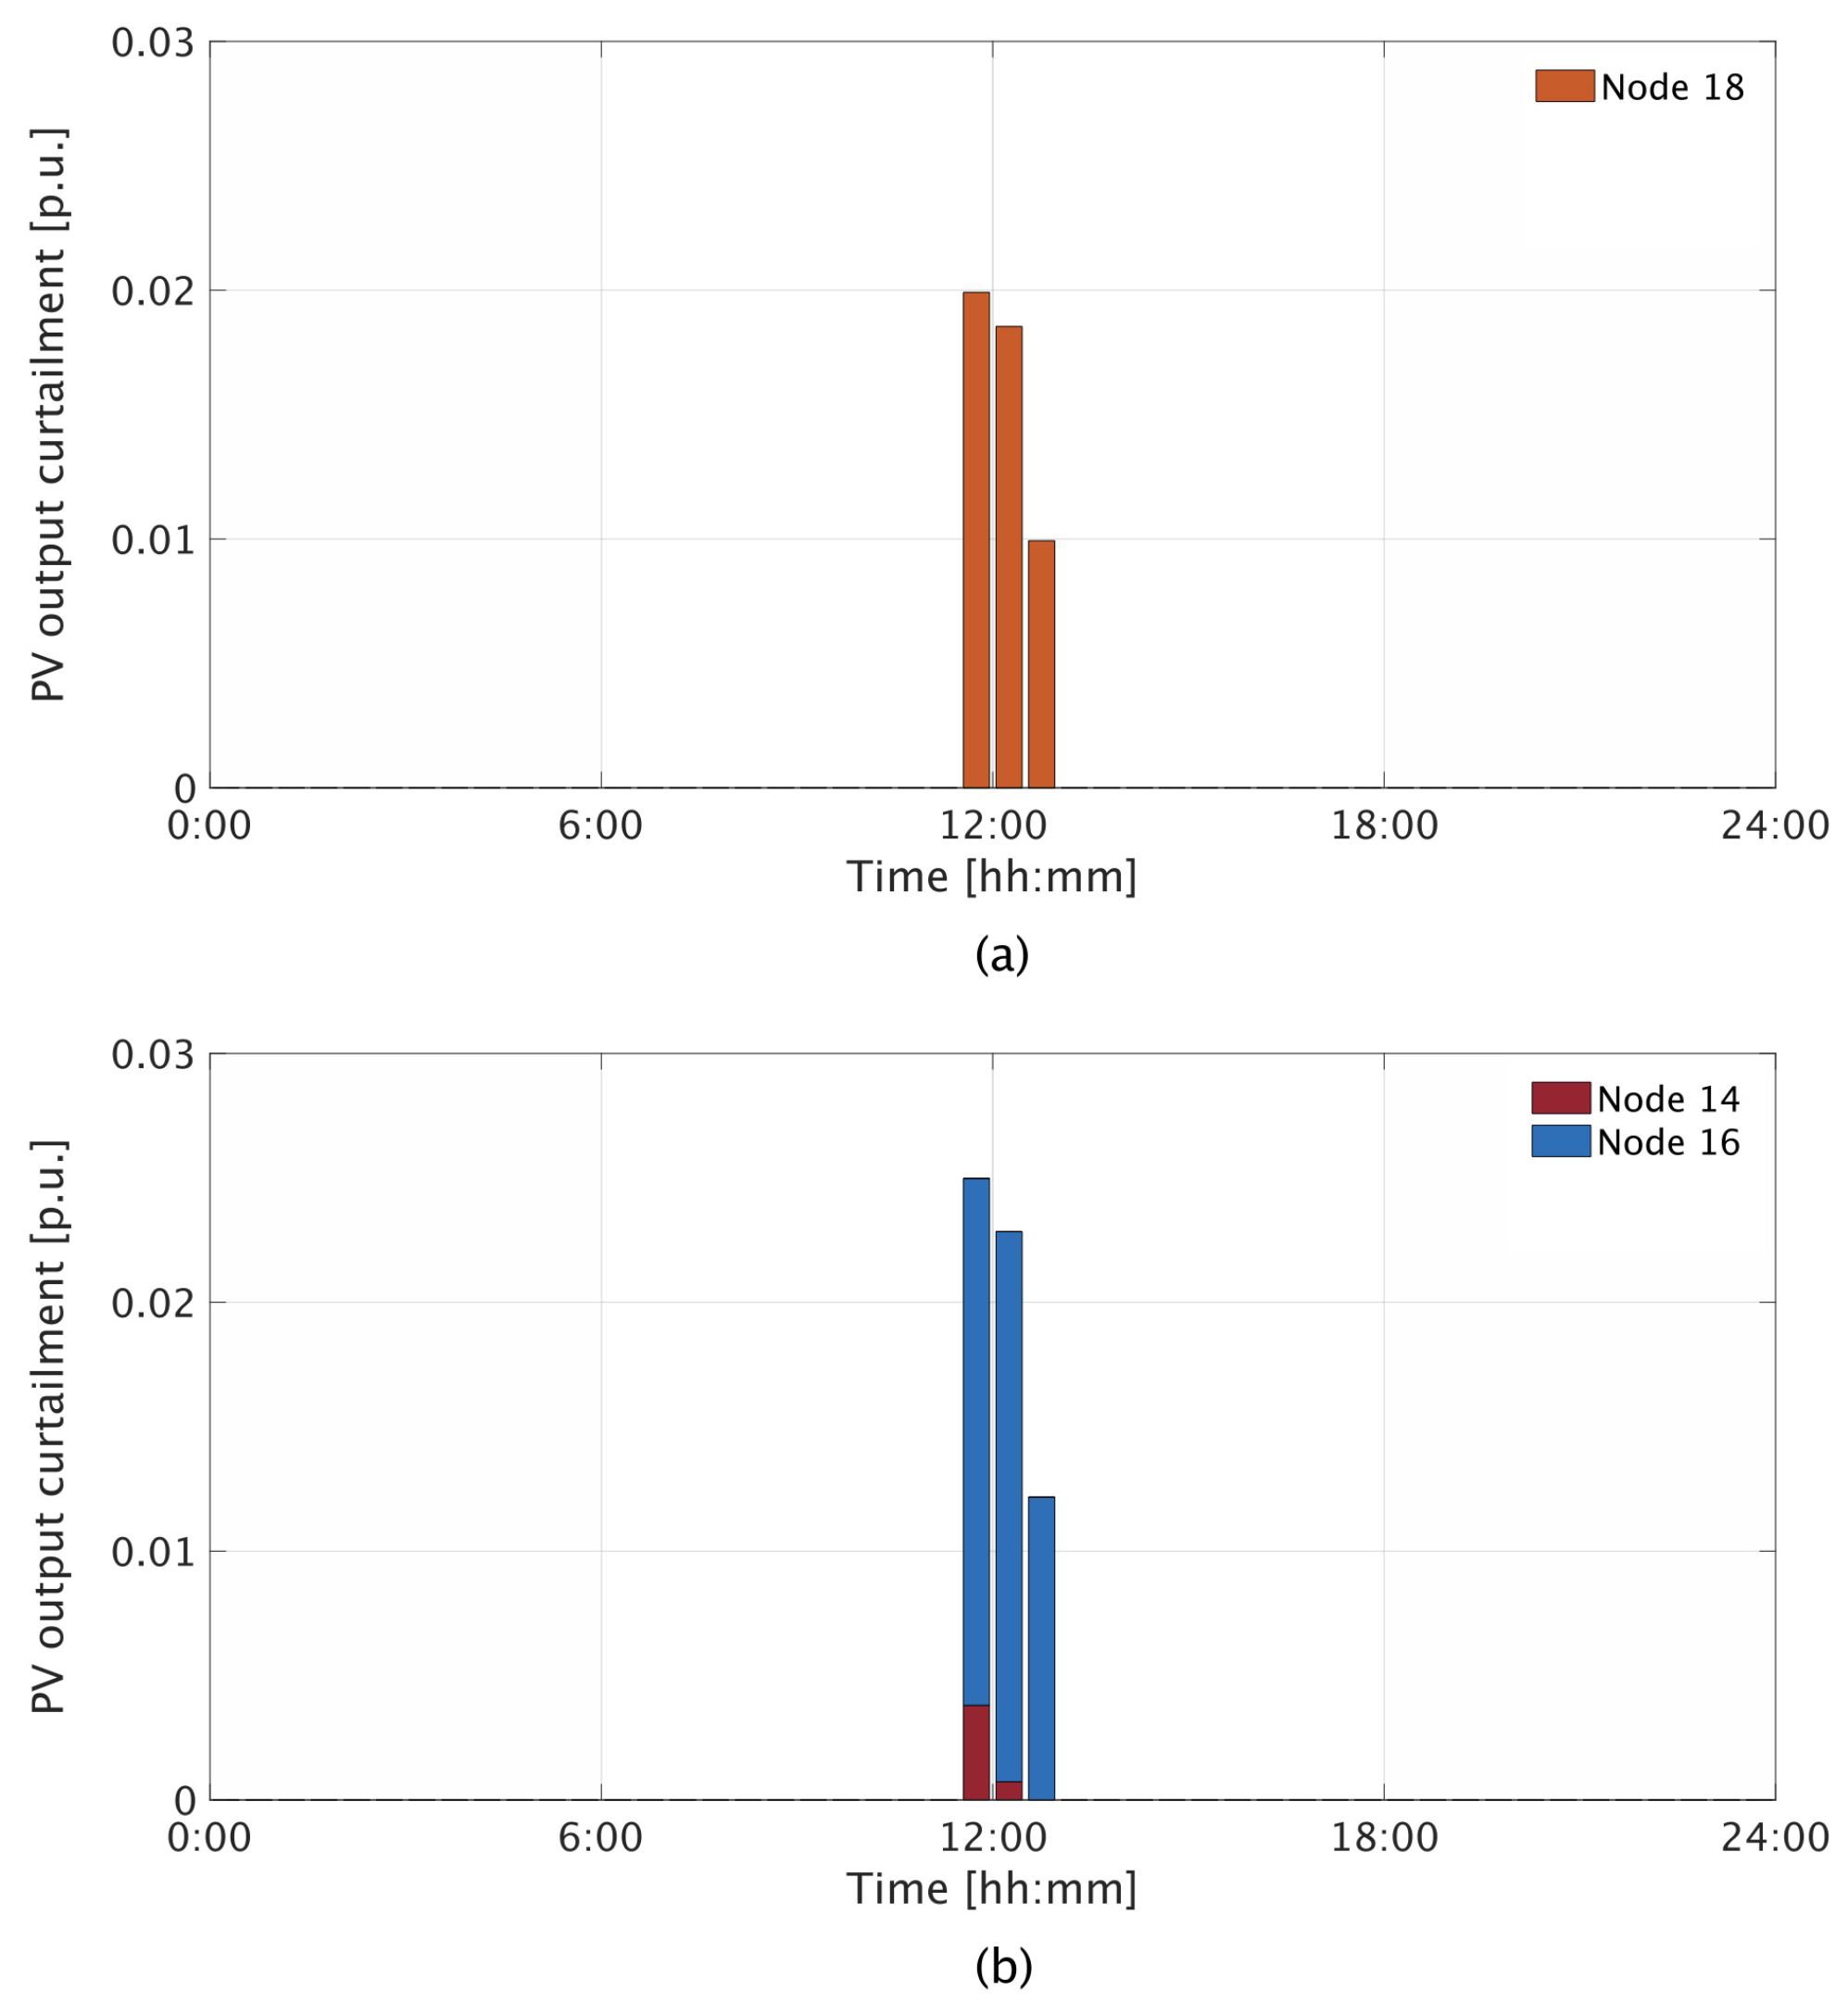
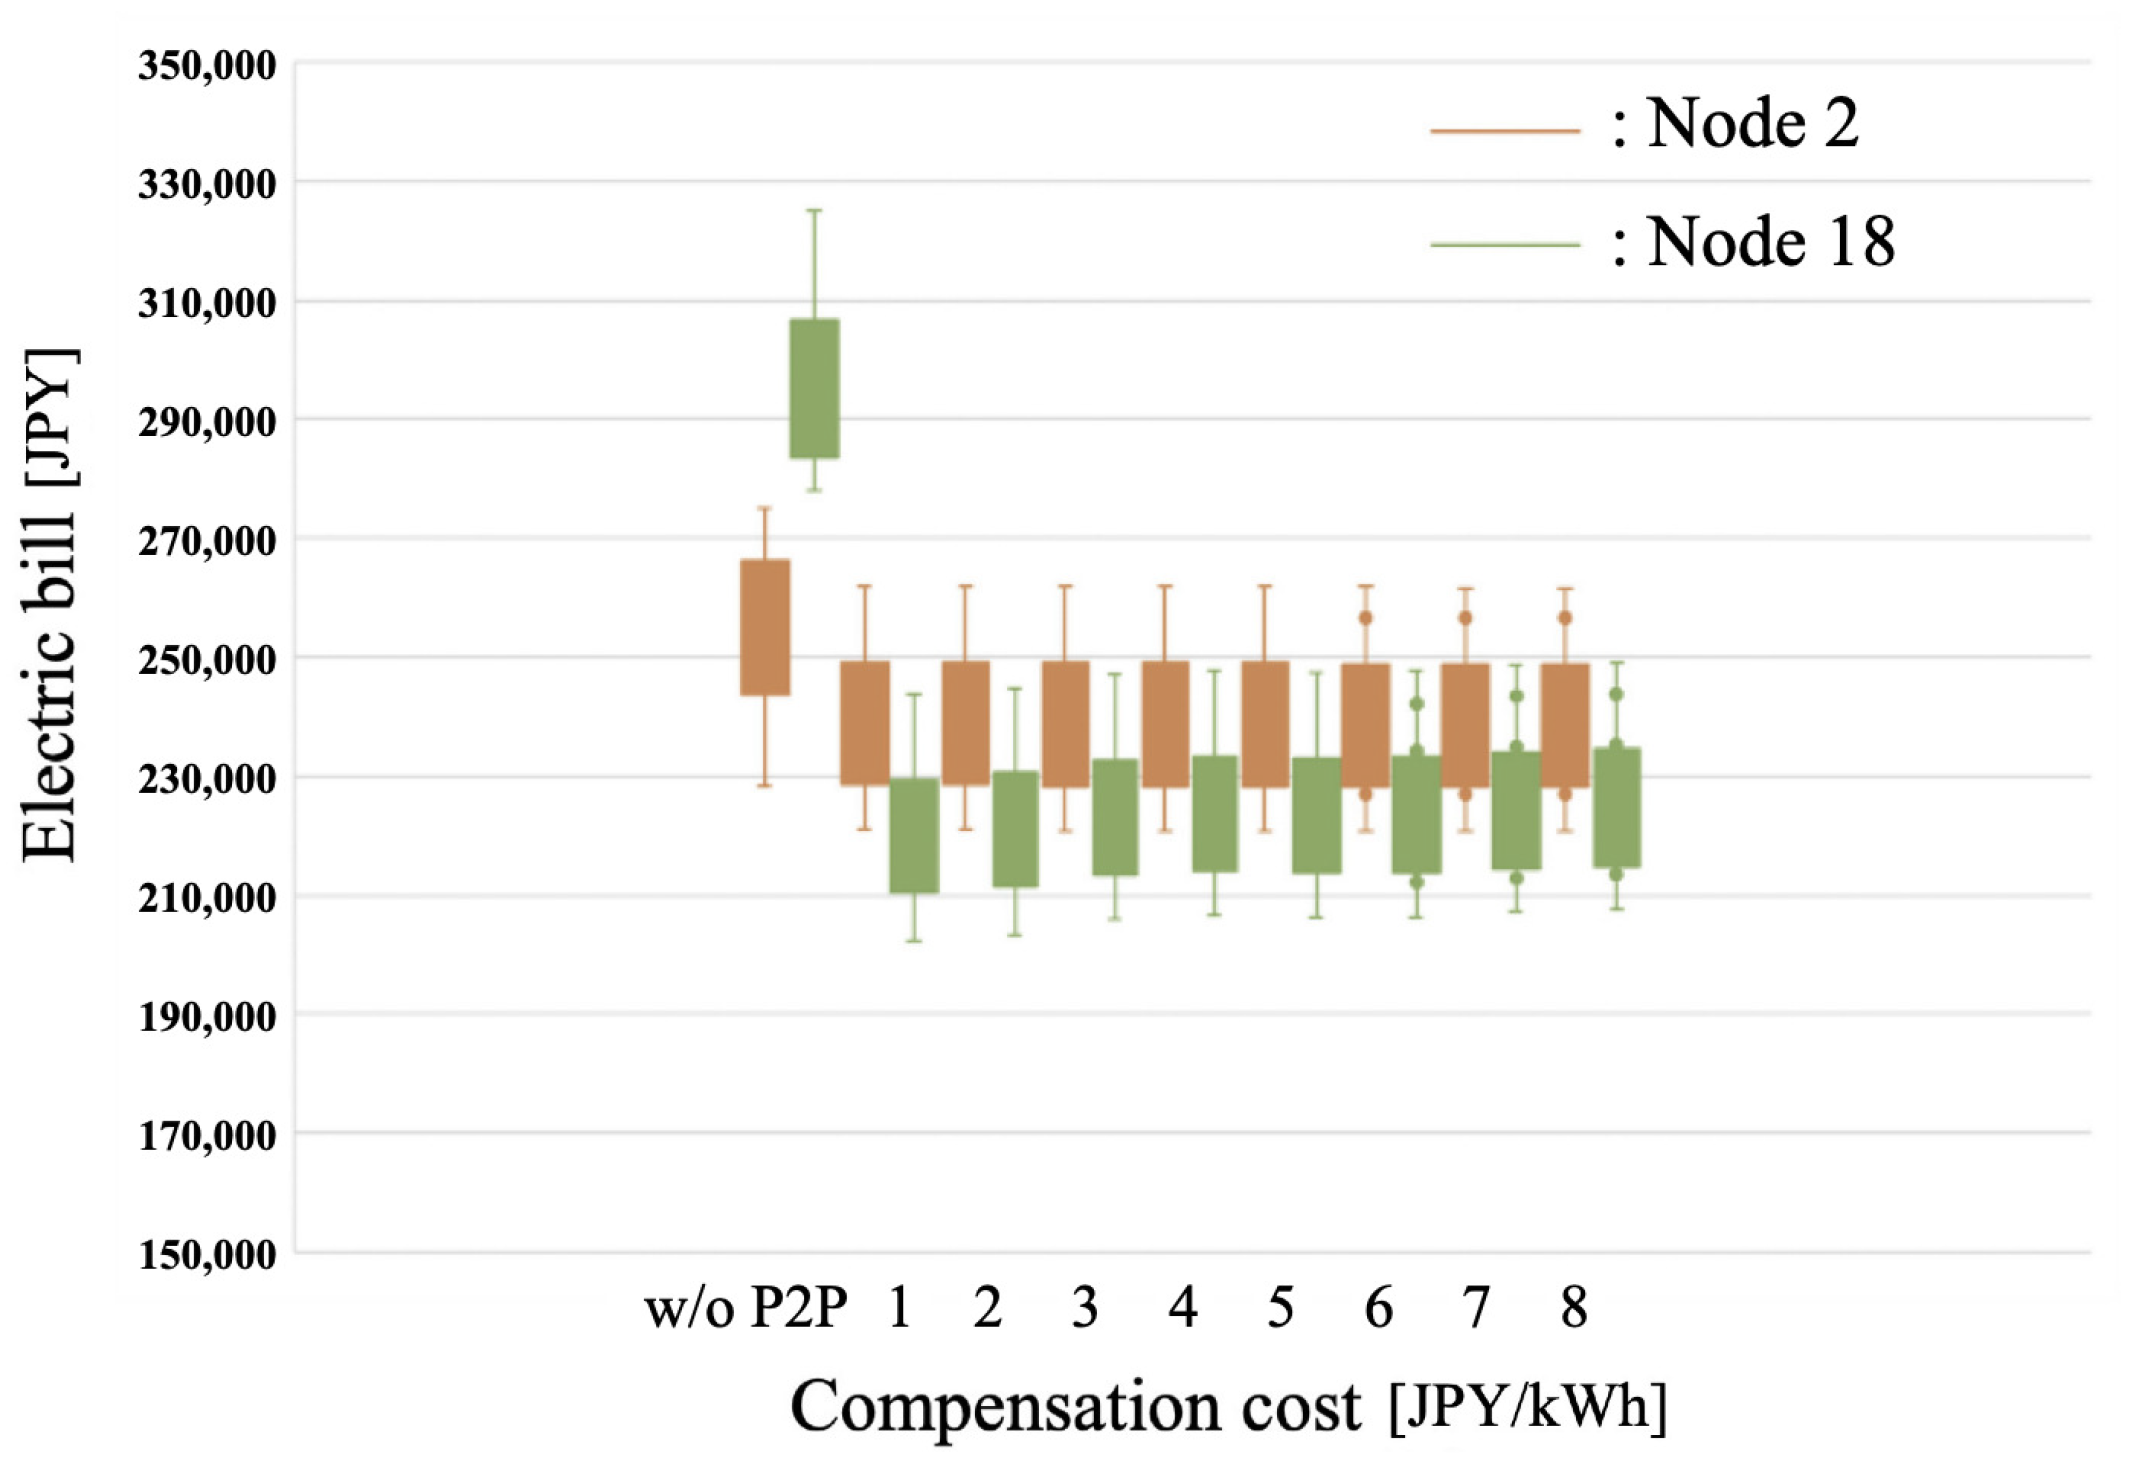
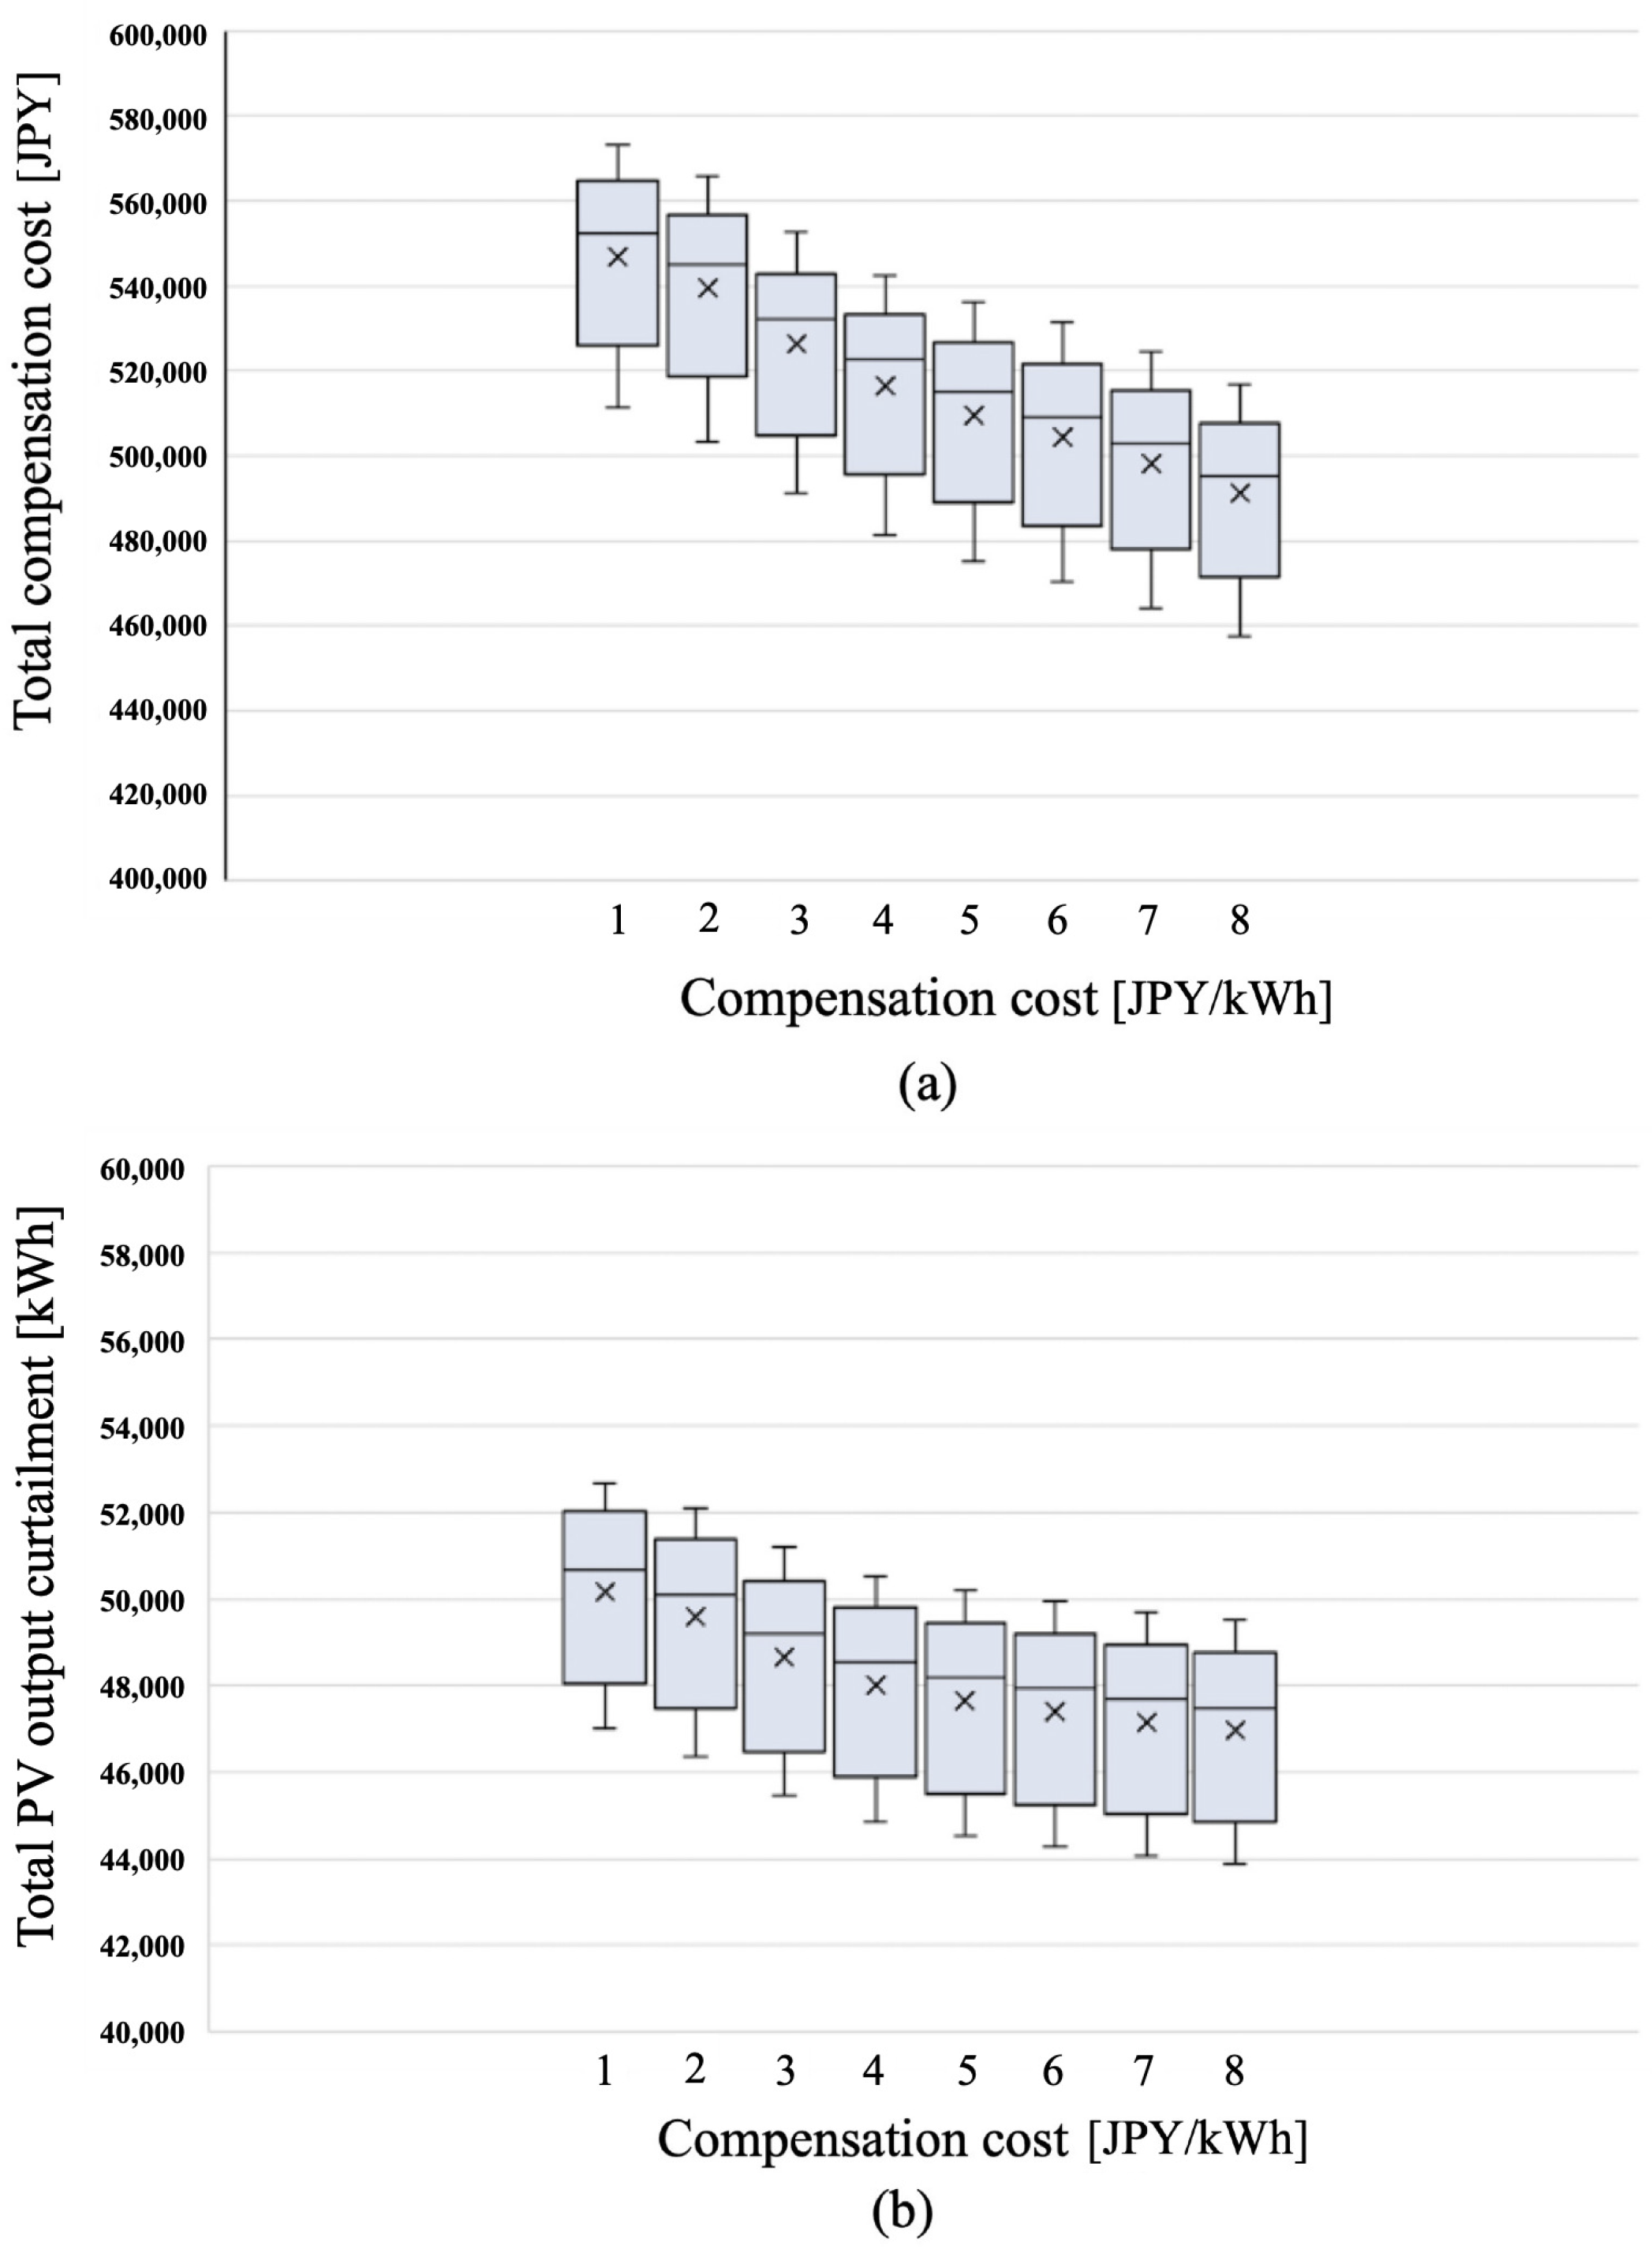
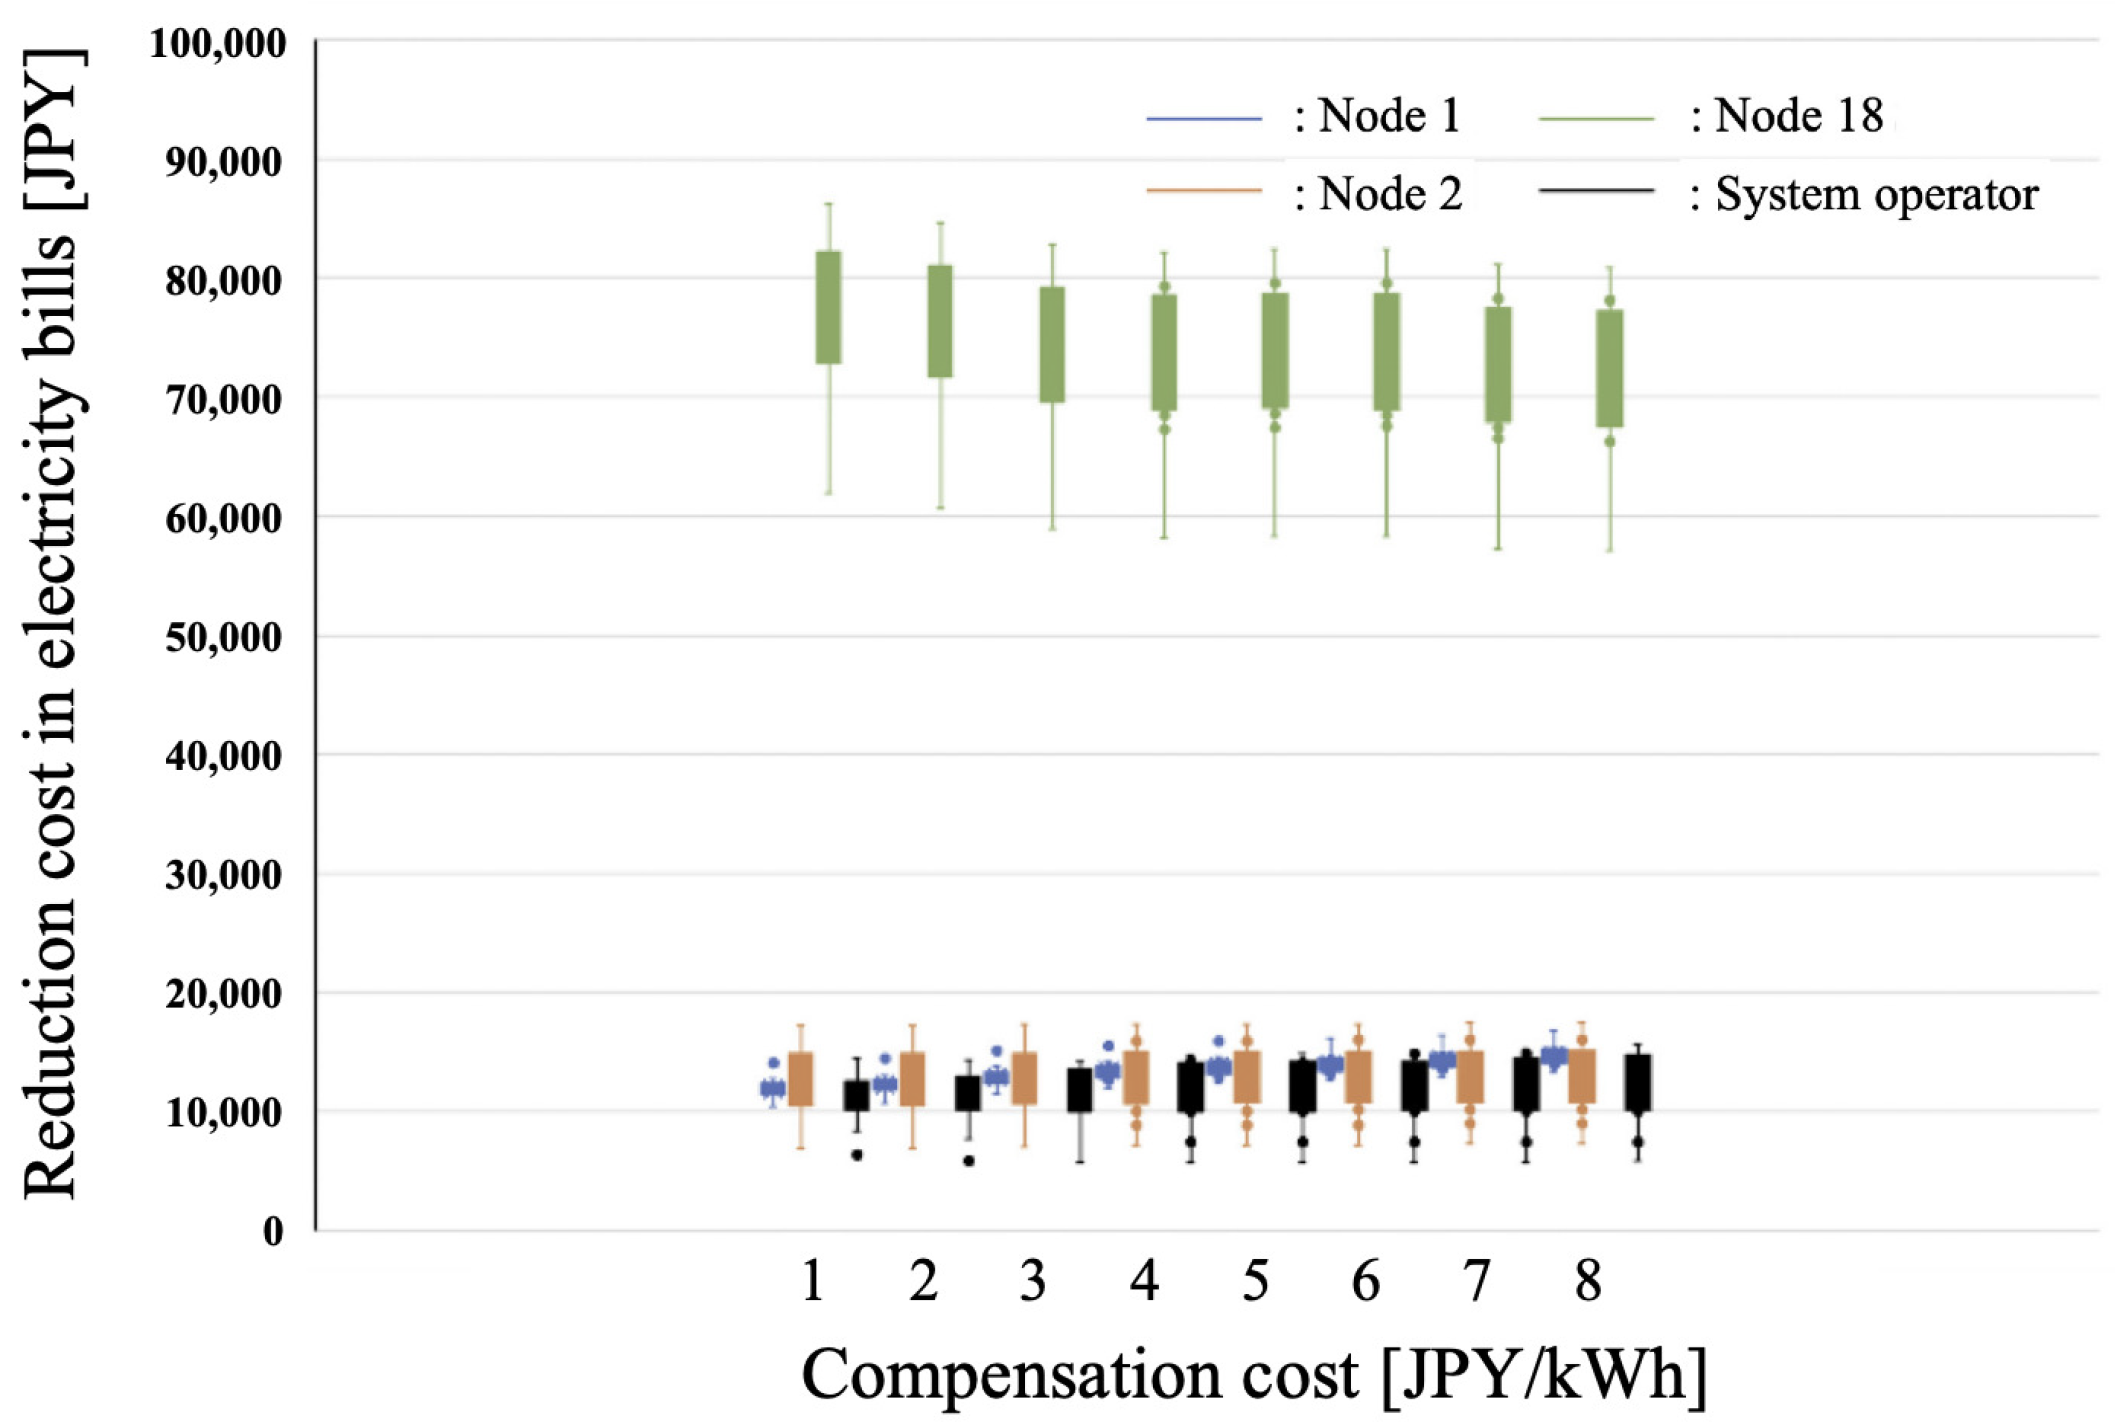
4.3. Simulation Results

Figure 9 shows the voltage transition for each method when setting either output curtailment minimization or compensation cost minimization as the objective function. In addition, we show the voltage transition when all the reverse power is supplied to the grid for comparison.
As shown in Figure 9, when the PV output is not curtailed, the voltage exceeds the upper bound of 1.05 p.u. In contrast, the proposed optimization method can keep the voltage within the regulation range by curtailing the PV output. Note that there is almost no difference in the amount of output curtailment due to the difference in the objective function, and the voltage transition is nearly the same.
Then, we evaluate the PV output curtailment for different objective functions. Figure 10 shows each objective function’s PV output curtailment results. Figure 10a shows the result of minimizing the PV output curtailment, and Figure 10b shows the result of reducing the compensation cost.
As shown in Figure 10a, the PV output of node 18, the end node, is curtailed because each node’s output curtailment power is determined to minimize the PV output curtailment. On the other hand, from Figure 10b, since node 18 was able to contract, the compensation cost is higher, and as a result, node 18 avoided the PV output curtailment. Therefore, the profit of node 18 from the P2P power transaction is not impaired. Conversely, the PV output of nodes 14 and 16, which could not contract, is curtailed. Thus, both objective functions can keep the voltage within the specified range, as shown in Figure 9. However, the PV output curtailment of each node varies depending on the difference in the objective function. Therefore, the results suggest that the proposed P2P model can achieve voltage management while eliminating the unfairness of output curtailment.
Figure 11 shows the improvement in electricity prices with and without P2P electricity trading. As shown in Figure 11, the electricity price of node 18, which is the prosumer at the end of the grid, is more significant than that of node 2, which is the prosumer at the beginning of the grid. We considered that these are losses of the end prosumers’ electricity sales associations due to the impact of the output curtailment. However, after the introduction of P2P power trading, the difference in electricity prices becomes smaller. In other words, a P2P power trading system that introduces financial compensation for PV output curtailment to maintain voltage can contribute to eliminating the unfairness caused by grid interconnection locations. Financial compensation for prosumers at the end of the grid, where output curtailment is relatively common, will help to eliminate inequity due to grid interconnection location. Compared to the situation before the introduction of the P2P power trading system, the electricity prices of P2P power trading participants have decreased regardless of the unit price of compensation. Therefore, the prosumers at the beginning of the grid with less output curtailment also benefit from the system. Moreover, the study sets the same compensation cost unit price at a discrete value for all consumers, which results in the terminal consumers benefiting unfairly. Thus, this problem can be solved by formulating and solving the setting of compensation unit costs as an optimization problem.
Figure 12 shows the total compensation amount and total output curtailment at each compensation unit price. The horizontal axis of Figure 12 shows the unit price of compensation for monetary compensation for the PV output curtailment of prosumers who were unable to commit. Figure 12a shows that increasing the compensation’s unit price decreases the total compensation amount. Figure 12b shows that increasing the compensation’s unit price decreases the total output curtailment amount. These results suggest that when determining the amount of output curtailment, the total compensation amount is minimized by appropriately implementing the necessary amount of output curtailment on the required portion as the compensation unit price increases.
Table 1 shows the transaction fees determined based on the above-mentioned simulation results and Equations (9) and (10) and Table 2 show the P2P participation fees to secure the source of the compensation costs. As shown in Table 1, since expanding the market participants increases the overall market’s profit, the system operator determines transaction fees to ensure no participants lose money when applying the proposed rule. Moreover, the consumer fee was about 40% of the transaction profit, and the prosumer fee was about 4% of the transaction profit. In addition, we set the participation fee to ensure that the profit of the system operator is equal to the profit of the participants before and after the introduction of P2P power trading, resulting in a fee of approximately 350 JPY per participant. Figure 13 shows the reduction in electricity costs with and without P2P power trading for node 1 (consumer), node 2 (prosumer), node 18 (prosumer), and the system operator. The horizontal axis in Figure 13 corresponds to the first row of Table 1. For example, the system operator collects a transaction fee of 4.42 [%] of the contract profit from the prosumers and 39.8 [%] of the contract profit from the consumers to compensate 1 [yen/kWh] to the prosumers, subject to output curtailment, respectively. We can see from Figure 13 that the participation fee is charged so that the profit of the system operator is appropriately secured. Thus, the profit of the participant and the system operator are comparable. These results suggest that the P2P electricity trading participants’ profits can be increased while maintaining the grid voltage and ensuring the profits of the system operator.
Finally, the case where PV is installed at nodes 8, 9, 10, 11, 12, 13, 14, 15, 16, 17, 18, 29, 30, 31, 32, and 33, which are the terminal nodes of the system with severe voltage increases, is examined and discussed. Figure 14 shows the reduction in the power costs with and without P2P power trading for each node at the terminal connection. Figure 14 shows that when PV is concentrated at the end node, the electricity cost reduction is always negative for node 1, the consumer. This is because more PV is suppressed than before due to P2P power trading, including voltage constraints, which reduces the amount of electricity consumers can purchase from the market. It is also because we set the ratio of commission rates at 9:1 (consumers: prosumers), suggesting the need to re-set commission rates according to the PV interconnection status. On the other hand, for other participants and grid operators, it can be confirmed that the introduction of P2P power trading generates cost benefits.

5. Conclusions

This paper studies the introduction of monetary compensation for PV output curtailment in a P2P power trading system, which is necessary for grid voltage management. The study aims to increase the benefits for participants and the system operator. First, simulations were performed using PV scenarios. In each scenario, we determined the transaction fee and participation fee that would be the source of compensation and showed that increasing the profits of the participants and the system operator is possible. Introducing a P2P power trading system could eliminate the inequity in electricity prices. In addition, by increasing the unit price of compensation, the total amount of compensation and the total amount of output curtailment can be reduced, which will benefit participants in the P2P power trading system and those using clean energy. In addition, since the overall profit of all the P2P power trading system participants will increase, even if PV is unevenly distributed in the grid, all the participants can benefit if they cooperate in sharing the profits. Next, we determined the transaction fees and participation rates from the simulation of the previous scenario. The results showed that transaction fees and participation rates can be defined in advance while ensuring that the P2P electricity trading system benefits participants and the system operator. Future work includes examining the distribution of profits between market participants and system operators and when market participants have bidding strategies. Furthermore, we plan to study and evaluate the stability of real-time control and P2P power markets in relation to the [18]. The method of determining the percentage of prosumer and consumer transaction fees is also an issue for future work.

Author Contributions

S.T.; Conceptualization, methodology, software, validation, formal analysis, investigation, resources, data curation, writing—original draft preparation, visualization, project administration, supervision, funding acquisition, A.I.; writing—review and editing. All authors have read and agreed to the published version of the manuscript.

Funding

This work was supported by JSPS KAKENHI Grant Number JP20K04420.

Data Availability Statement

Data are contained within the article.

Conflicts of Interest

The authors declare that they have no known competing financial interests or personal relationships that could have appeared to influence the work reported in this paper.

References

  1. Kimura, K. Feed-in Tariffs in Japan: Five Years of Achievements and Future Challenges; Renewable Energy Institute: Minato, Japan, 2017. [Google Scholar]
  2. IEA. World Energy Outlook 2022. Available online: https://www.iea.org/reports/world-energy-outlook-2022 (accessed on 28 December 2023).
  3. Khubrani, M.M.; Alam, S. Blockchain-Based Microgrid for Safe and Reliable Power Generation and Distribution: A Case Study of Saudi Arabia. Energies 2023, 16, 5963. [Google Scholar] [CrossRef]
  4. Eltamaly, A.M.; Ahmed, M.A. Performance Evaluation of Communication Infrastructure for Peer-to-Peer Energy Trading in Community Microgrids. Energies 2023, 16, 5116. [Google Scholar] [CrossRef]
  5. Damisa, U.; Nwulu, N.I.; Siano, P. Towards Blockchain-Based Energy Trading: A Smart Contract Implementation of Energy Double Auction and Spinning Reserve Trading. Energies 2022, 15, 4084. [Google Scholar] [CrossRef]
  6. Matsuda, Y.; Yamazaki, Y.; Oki, H.; Takeda, Y.; Sagawa, D.; Tanaka, K. Demonstration of Blockchain Based Peer to Peer Energy Trading System with Real-Life Used PHEV and HEMS Charge Control. Energies 2021, 14, 7484. [Google Scholar] [CrossRef]
  7. Nagatsuka, T.; Sano, M.; Yamaguchi, N. Experiment of Execution Time in Decentralized Transaction System of Surplus PV Output using Bloackchain. IEEJ Trans. Power Energy 2019, 3, 176–185. (In Japanese) [Google Scholar] [CrossRef]
  8. Yokoyama, A. Toward Deregulated, Smart and Resilient Power Systems with Massive Integration of Renewable Energy in Japan. IEEJ Trans. Elec. Electron. Eng. 2022, 17, 1242–1254. [Google Scholar] [CrossRef]
  9. Paudel, A.; Khorasany, M.; Gooi, H.B. Decentralized local energy trading in microgrids with voltage management. IEEE Trans. Ind. Inform. 2021, 17, 1111–1121. [Google Scholar] [CrossRef]
  10. Azim, M.I.; Tushar, W.; Saha, T.K. Regulated P2P energy trading: A typical Australian distribution network case study. In Proceedings of the IEEE Power and Energy Society General Meeting, Montreal, QC, Canada, 2–6 August 2020; pp. 1–5. [Google Scholar]
  11. Guerrero, J.; Chapman, A.C.; Gregor, V. Decentralized P2P Energy Trading Under Network Constraints in a Low-Voltage Network. IEEE Trans. Smart Grid 2019, 10, 5163–5173. [Google Scholar] [CrossRef]
  12. Park, S.W.; Cho, K.S.; Son, S.Y. Voltage management method of distribution system in P2P energy transaction environment. IFAC-PapersOnLine 2019, 52, 324–329. [Google Scholar] [CrossRef]
  13. Azim, M.I.; Wayes, T.; Saha, T.K. Coalition Graph Game-based P2P Energy Trading with Local Voltage Management. IEEE Trans. Smart Grid 2021, 12, 4389–4402. [Google Scholar] [CrossRef]
  14. Qiu, D.; Wang, J.; Wang, J.; Strbac, G. Multi-Agent Reinforcement Learning for Automated Peer-to-Peer Energy Trading in Double-Side Auction Market. In Proceedings of the Thirtieth International Joint Conference on Artificial Intelligence, Montreal, QC, Canada, 19–27 August 2021; pp. 2913–2920. [Google Scholar]
  15. Wand, M.P.; Jones, M.C. Kernel Smoothing; Taylor and Francis: Abingdon, UK, 1994. [Google Scholar]
  16. Trashchenkov, S.; Pimentel, S.P.; Astapov, V.; Annuk, A.; Marra, E.G. Kernel Density Estimation for Stochastic Modeling of PV Power Output. In Proceedings of the 2018 7th International Conference on Renewable Energy Research and Applications (ICRERA), Paris, France, 14–17 October 2018; pp. 1179–1183. [Google Scholar] [CrossRef]
  17. Dolatabadi, S.H.; Ghorbanian, M.; Siano, P.; Hatziargyriou, N.D. An Enhanced IEEE 33 Bus Benchmark Test System for Distribution System Studies. IEEE Trans. Power Syst. 2021, 36, 2565–2572. [Google Scholar] [CrossRef]
  18. Ma, D.; Liu, M.; Zhang, H.; Wang, R.; Xie, X. Accurate Power Sharing and Voltage Regulation for AC Microgrids: An Event-Triggered Coordinated Control Approach. IEEE Trans. Cybern. 2022, 52, 13001–13011. [Google Scholar] [CrossRef] [PubMed]
Figure 1. Schematic diagram of the proposed P2P electricity trading system in this study.
Energies 17 00841 g001
Figure 2. Daily flow of proposed P2P power market.
Energies 17 00841 g002
Figure 3. Flowchart of the matching process.
Energies 17 00841 g003
Figure 4. Frequency distribution of PV output.
Energies 17 00841 g004
Figure 5. The probability density function of PV output obtained from the kernel density estimation.
Energies 17 00841 g005
Figure 6. The PV output scenario from the kernel density estimation.
Energies 17 00841 g006
Figure 7. The IEEE 33-bus system model.
Energies 17 00841 g007
Figure 8. Demand load data in a certain day.
Energies 17 00841 g008
Figure 9. Voltage transition in each method.
Energies 17 00841 g009
Figure 10. PV output curtailment for each objective function; (a) PV output curtailment minimization; (b) compensation cost minimization.
Energies 17 00841 g010
Figure 11. Electricity bills with introduction of P2P power trading system.
Energies 17 00841 g011
Figure 12. Total compensation cost and total PV output curtailment for each compensation cost; (a) total compensation cost; (b) total PV output curtailment.
Energies 17 00841 g012
Figure 13. Reduction cost in electricity bills in each node.
Energies 17 00841 g013
Figure 14. Reduction cost in electricity bills in each node when PV is interconnected to the end node.
Energies 17 00841 g014
Table 1. Transaction cost for compensation cost based on the simulation result.
[%]12345678
Prosumer4.424.364.254.174.114.084.033.97
Consumer39.839.238.337.637.136.736.235.7
Table 2. Participation cost for compensation cost based on the simulation result.
[JPY]12345678
Participants340343352360365368373376
Disclaimer/Publisher’s Note: The statements, opinions and data contained in all publications are solely those of the individual author(s) and contributor(s) and not of MDPI and/or the editor(s). MDPI and/or the editor(s) disclaim responsibility for any injury to people or property resulting from any ideas, methods, instructions or products referred to in the content.

