1. Introduction
Relay protection equipment (RPE) is the first line of defense to ensure the safe and stable operation of a power system; its performance not only affects the ability of a power system to resist fault shocks, but also affects the feeder reconfiguration of the power system [
1,
2]. With the improvement of packaging technology and integration requirements, the core components of RPE are integrated into chips with small sizes. Power density, therefore, continuously grows, and heat dissipation becomes a challenging issue for packaging design. The overheating problem of electronic components seriously affects the reliability of RPE [
3]. Therefore, an accurate thermal model is necessary, based on which the development trend of the temperature of core components of RPE can be predicted. And reasonable maintenance strategies can be formulated subsequently.
Many studies have shown that over 55% of electronic device failures are caused by high operating temperatures, which can lead to deterioration of or even damage to device performance [
4]. The reliability of semiconductor chips decreases with the increase in temperature [
5,
6]. Therefore, the overheating of electronic components can lead to a decrease or instability in the performance of RPE, and in severe cases, it will affect the reliable operation of RPE. Normally, one can use temperature sensors or infrared detectors to measure the heating temperature of RPE. However, such methods cannot predict the trend of shaft temperature changes and can only be used for on-site monitoring after abnormalities occur, without taking preventive measures in advance. This thus spawned the development of finite element methods (FEMs). Researchers can optimize layouts of electronic components or other parameters to reduce the heating temperature of the equipment based on FEMs [
7,
8,
9,
10]. The FEM was born in 1960s, the purpose of which is to solve nonlinear partial differential equations [
11]. The modern numerical method and computer techniques allow the possibility to the solution of larger-scale finite element problems. Some commercial software companies have researched and developed large-scale simulation software such as Comsol, Ansys, Abaqus, etc. Either 2D or 3D models can be built in the above software to calculate the thermal characteristics of devices [
12]. At present, simulation software-based thermal analysis methods have gradually replaced other methods and become the mainstream thermal analysis method of electronic devices. It has been shown that the hotspot temperature of electronic components can be significantly changed by changing the integrated materials and component layouts. It should be note that the layout of electronic components can also be optimized by optimization algorithms [
13]. However, this type of method also has several limitations. Due to the numerous components and complex structure of electronic devices, it is impossible to build simulation models that correspond to the actual device perfectly. This is because some simplifications are made to complete calculation [
14]. If the device models are diverse, this type of method will bring about a huge computation overhead. It can be concluded that the effective monitoring of the thermal characteristic of RPE and further mastering its development trends is difficult. Therefore, a novel method to overcome the above problem is needed.
In recent years, by utilizing IoT technology and sensor networks, the comprehensive monitoring and data collection of RPE have accumulated massive data resources [
15,
16]. Then, with the help of intelligent technology, the fast prediction of the hotspot temperature of RPE becomes possible. This type of method is called data a driven-based method, which means staff do not need to have a detailed understanding of the heating mechanism, they just need to master the data-driven approach [
17]. By training the monitoring data, an intelligent technology can build predictors, based on which the future thermal development of electronic devices can be easily predicted [
18]. It can be seen that the quality of monitoring data directly affects the predictive accuracy. In general, recording enough data to train a predictive model is difficult, especially when electronic components are packaged inside larger device. Lacking efficient data is a general defect in machine learning tasks, which usually leads to noise and no-labeling [
19]. In response to this, researchers have proposed numerous techniques to improve the availability of monitoring data, such as data generation, semi-supervised learning and transfer learning [
20,
21]. Among them, generative adversarial networks (GAN) have acquired much attention in recent years due to their excellent capacity for data generation. GAN mainly have two structures, namely, generator and discriminator. Via the adversarial training of a generator and discriminator, GAN can generate fake data that are very similar to real data [
22,
23]. They can thus alleviate the problem of data deficiency. When generating data, existing studies usually use rand noise, which may lack generation guidance. Simulation data were used as the input of the generator of the GAN in this study. This leads to feature transfer between simulation data and actual data. Furthermore, a predictor, can be built by the training of regression technology, such as support vector machine (SVM), random forest (RF), extreme learning machine (ELM), etc. Given that one model cannot behave well in all situations, a stacked ensemble model was built in this study.
It is indeed a significant gap that few studies have focused on monitoring and predicting the hotspot temperature of RPEs. Through the method proposed in this study, the gap is filled.
The main contribution is the hardware implementation of the solution proposed, which is summarized as follows:
- (1)
A novel method to monitor the hotspot temperature of RPEs. Different from direct measurement, this method is an inversion method, which is not limited by working conditions, and it has good scalability in trend prediction;
- (2)
Less dependence on labeled data. A physical-model-aided generative adversarial network is constructed, based on which feature transferring can be achieved from simulation data to actual data, as a result of which lots of pseudo-real data are generated for the training of the predictive model. This strategy can also be used in other similar tasks, such as fault diagnosis and remaining lifetime prediction;
- (3)
Robust hotspot predictive framework. To improve the predictive stability, a stacked ensemble framework is built. Lots of trained RFs are stacked together to build a high-performance predictive model. Fewer hyperparameters and human intervention make this predictive framework robust.
Given the above, the goal of this study is to resolve the difficulty of monitoring and predicting hotspot temperature in key electronic components of RPE. Specifically, a physical-model-aided data-driven method was proposed, whose effectiveness was verified by experiments. The subsequent chapters are structured as follows.
Section 2 introduces the basic principle of the proposed method.
Section 3 describes the experiment setup.
Section 4 shows the predicted results of the proposed method and discusses the results. Finally, this paper ends with a conclusion in
Section 5.
2. Materials and Methods
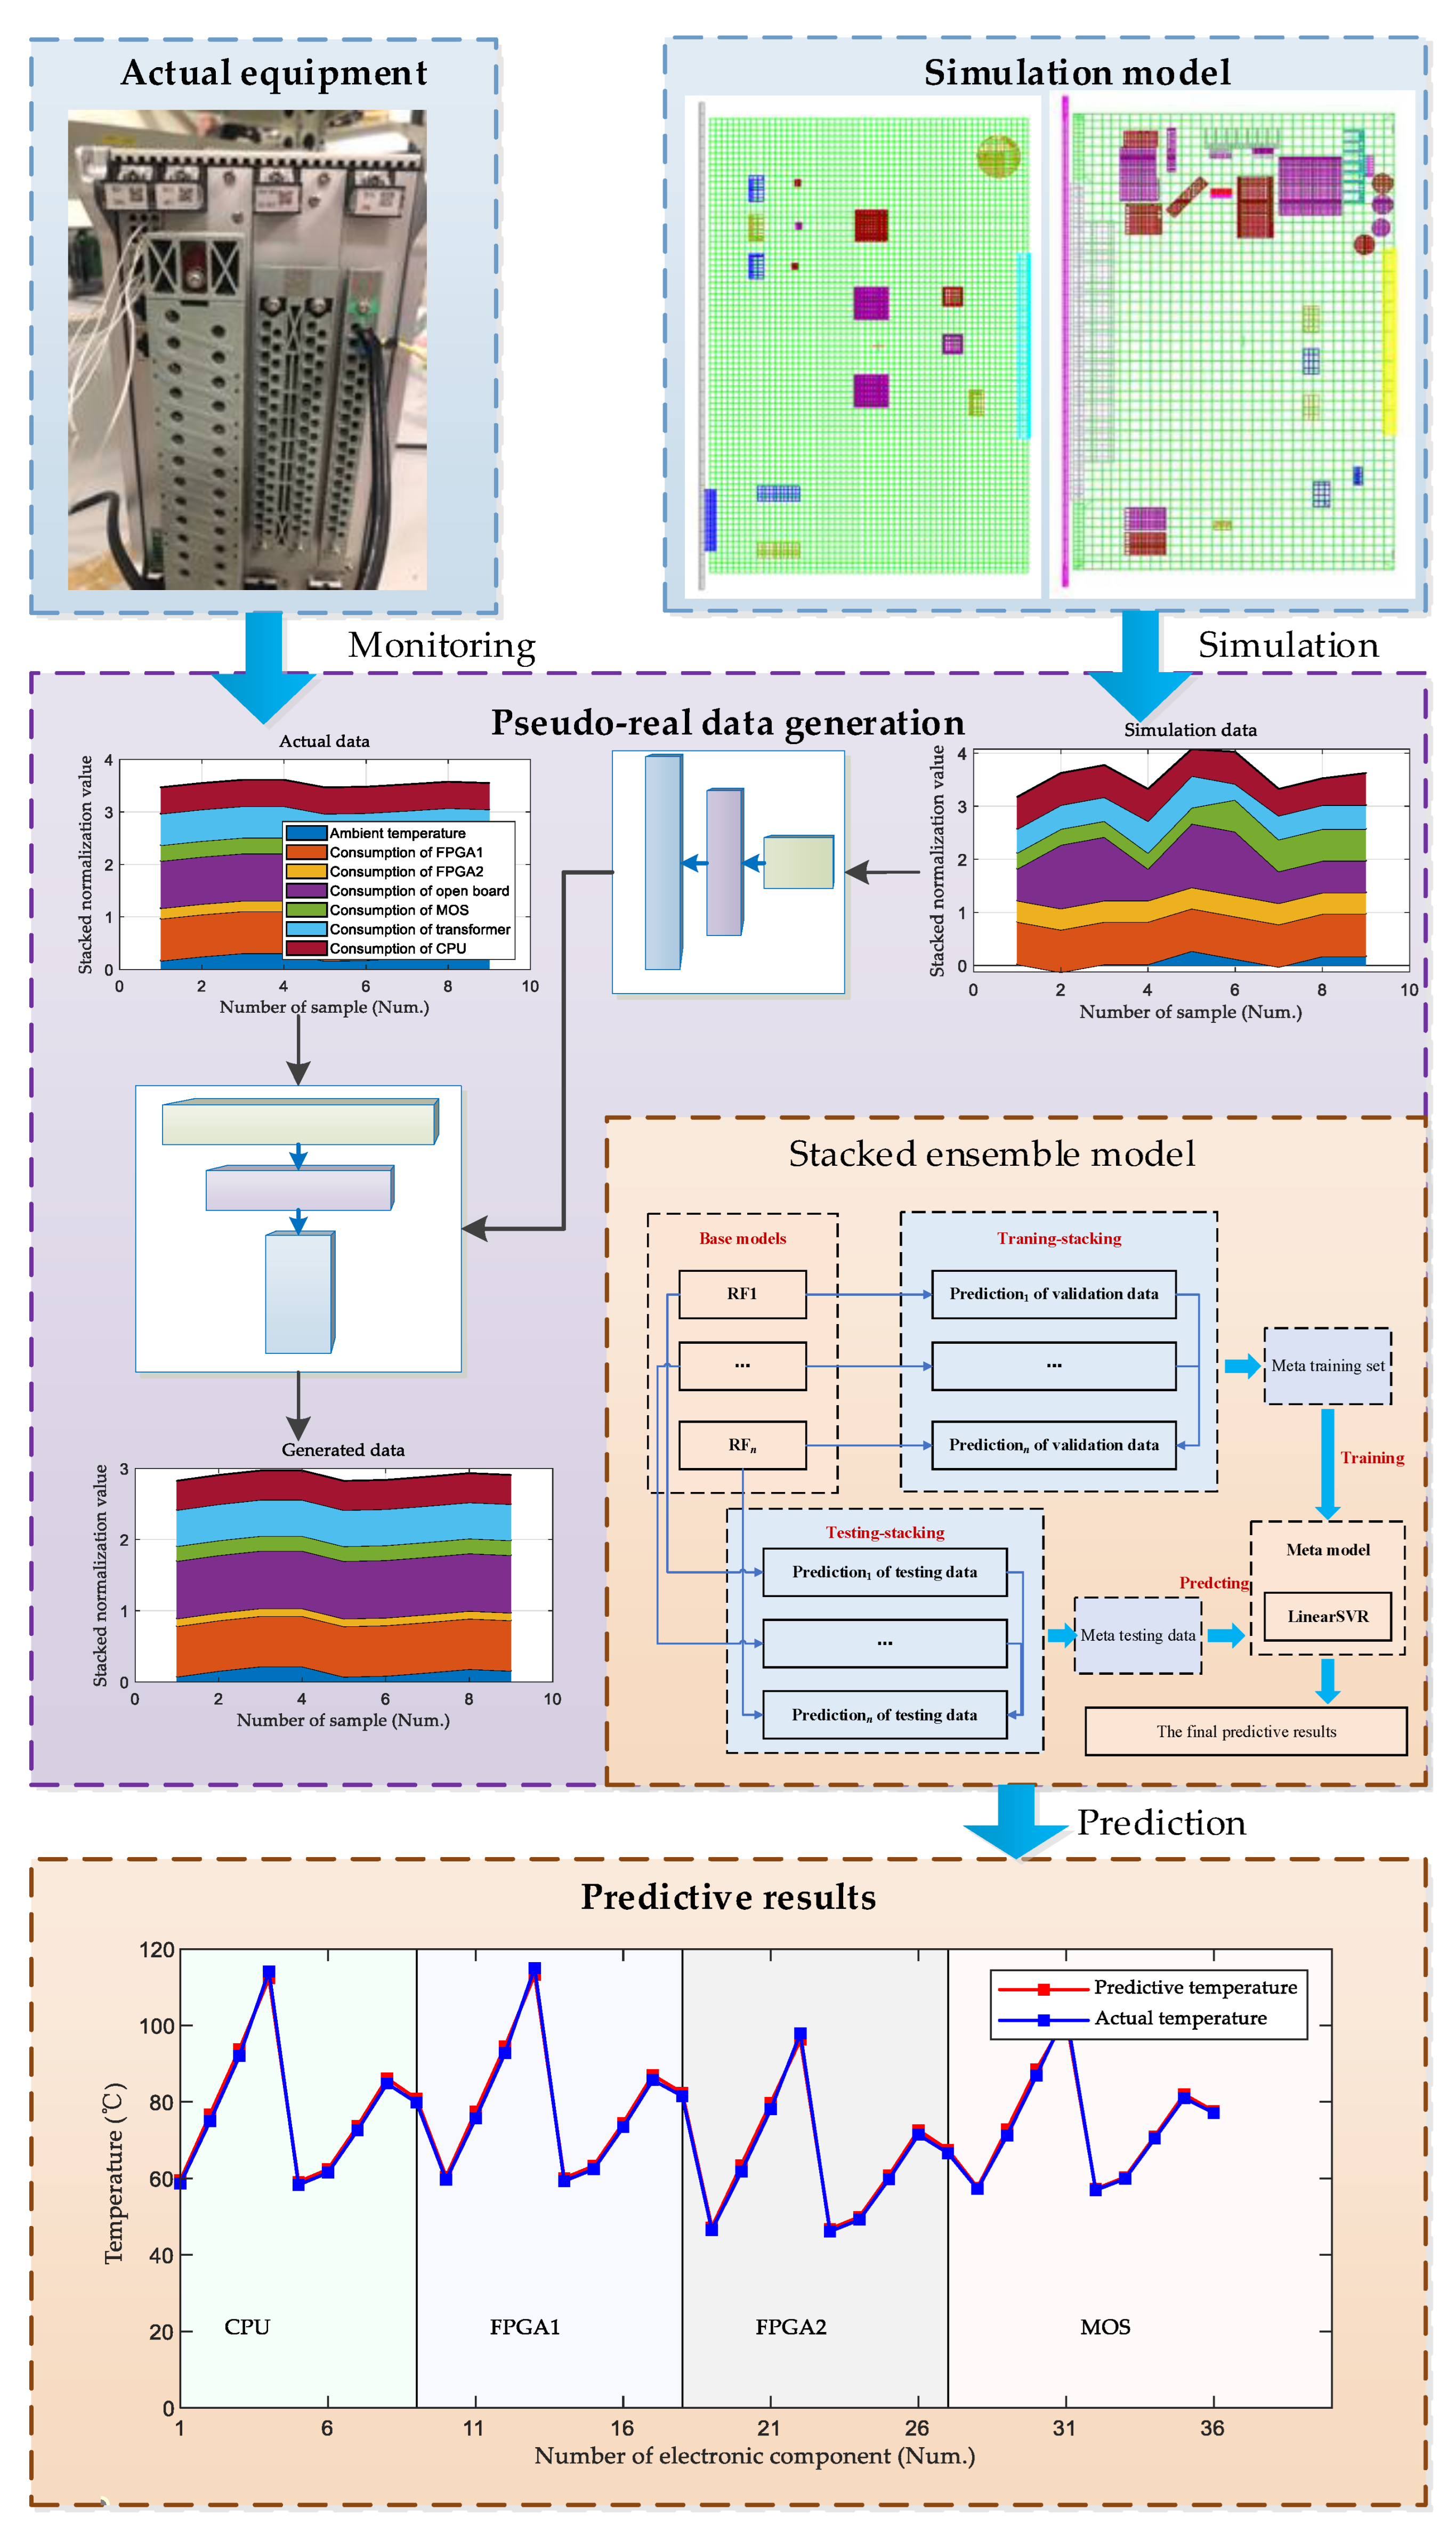
With the increasing integration of devices, it is becoming difficult to enact the direct measurement of electronic components’ temperature. Simulation methods cannot be used for real-time monitoring. Given this, a data-driven method that combines GAN and stacked ensemble was proposed. It is an inverse method that attempts to monitor the hotspot temperature of key electronic components of RPE based on some temperature-related features. The proposed method has good scalability in the health management of RPE since it does not require much history data. Specifically, with the help of GAN and a stacked ensemble model, monitoring data are used to predict the thermal characteristics of RPE, as shown in
Figure 1. Firstly, a finite element simulation model was built to study the influence of some parameters on the hotspot temperature of the key electronic components of RPE (as shown in the upper right box of
Figure 1). The simulation model was built corresponding to a 35 kV RPE. The simulation model was then used to output a few data, including hotspot temperature and its corresponding feature vectors. Secondly, an experimental platform was built to record actual hotspot temperature data (as shown in the upper left box of
Figure 1). A GAN model was then trained based on simulation data and actual monitoring data (as shown in the middle purple box of
Figure 1). Thirdly, an ensemble predictive model was built based on the stacking of random forests (as shown in the middle orange box). Every random forest was trained based on the data generated by the trained GAN. Finally, the hotspot temperature of the key electronic components was predicted by the trained predictive model (as shown in the bottom orange box of
Figure 1).
2.1. Generative Adversarial Network (GAN)
GAN was proposed by Ian Goodfellow [
22]. It is a generation model aiming to elucidate the appearance of real data and predict the distribution or density of real data. Due to the above characteristics, GAN can generate new data according to learned knowledge.
A GAN is formed from a generator and discriminator, the principle of which is shown in
Figure 2. A generator and a discriminator are two separate deep neural networks. A generator aims to generate data to fit the distribution of the training data. A discriminator aims to discover whether the generated data are real or fake. Through the continuous games of the generator and discriminator, GAN can generate ideal data. Consequently, the goals of the generator and the discriminator are respectively expressed as:
where
G denotes generator,
D denotes discriminator,
V denotes cross entropy,
z is the input vector of generator and is the noise vector that follows the distribution
z~
Pz(
z), and
x is the real data.
Combine Equations (1) and (2) to formula the total optimization goal:
Equation (3) shows that the main principle of the adversarial mechanism is first to fix G to search for the D that can maximize the loss function, and then fix D to search for the G that can minimize the loss function. The above adversarial learning will be terminated once Nash equilibrium between G and D is achieved. Finally, the fake data that have a similar distribution to the real data can be generated by the trained GAN.
2.2. Stacked Ensemble Model Based on Random Forests
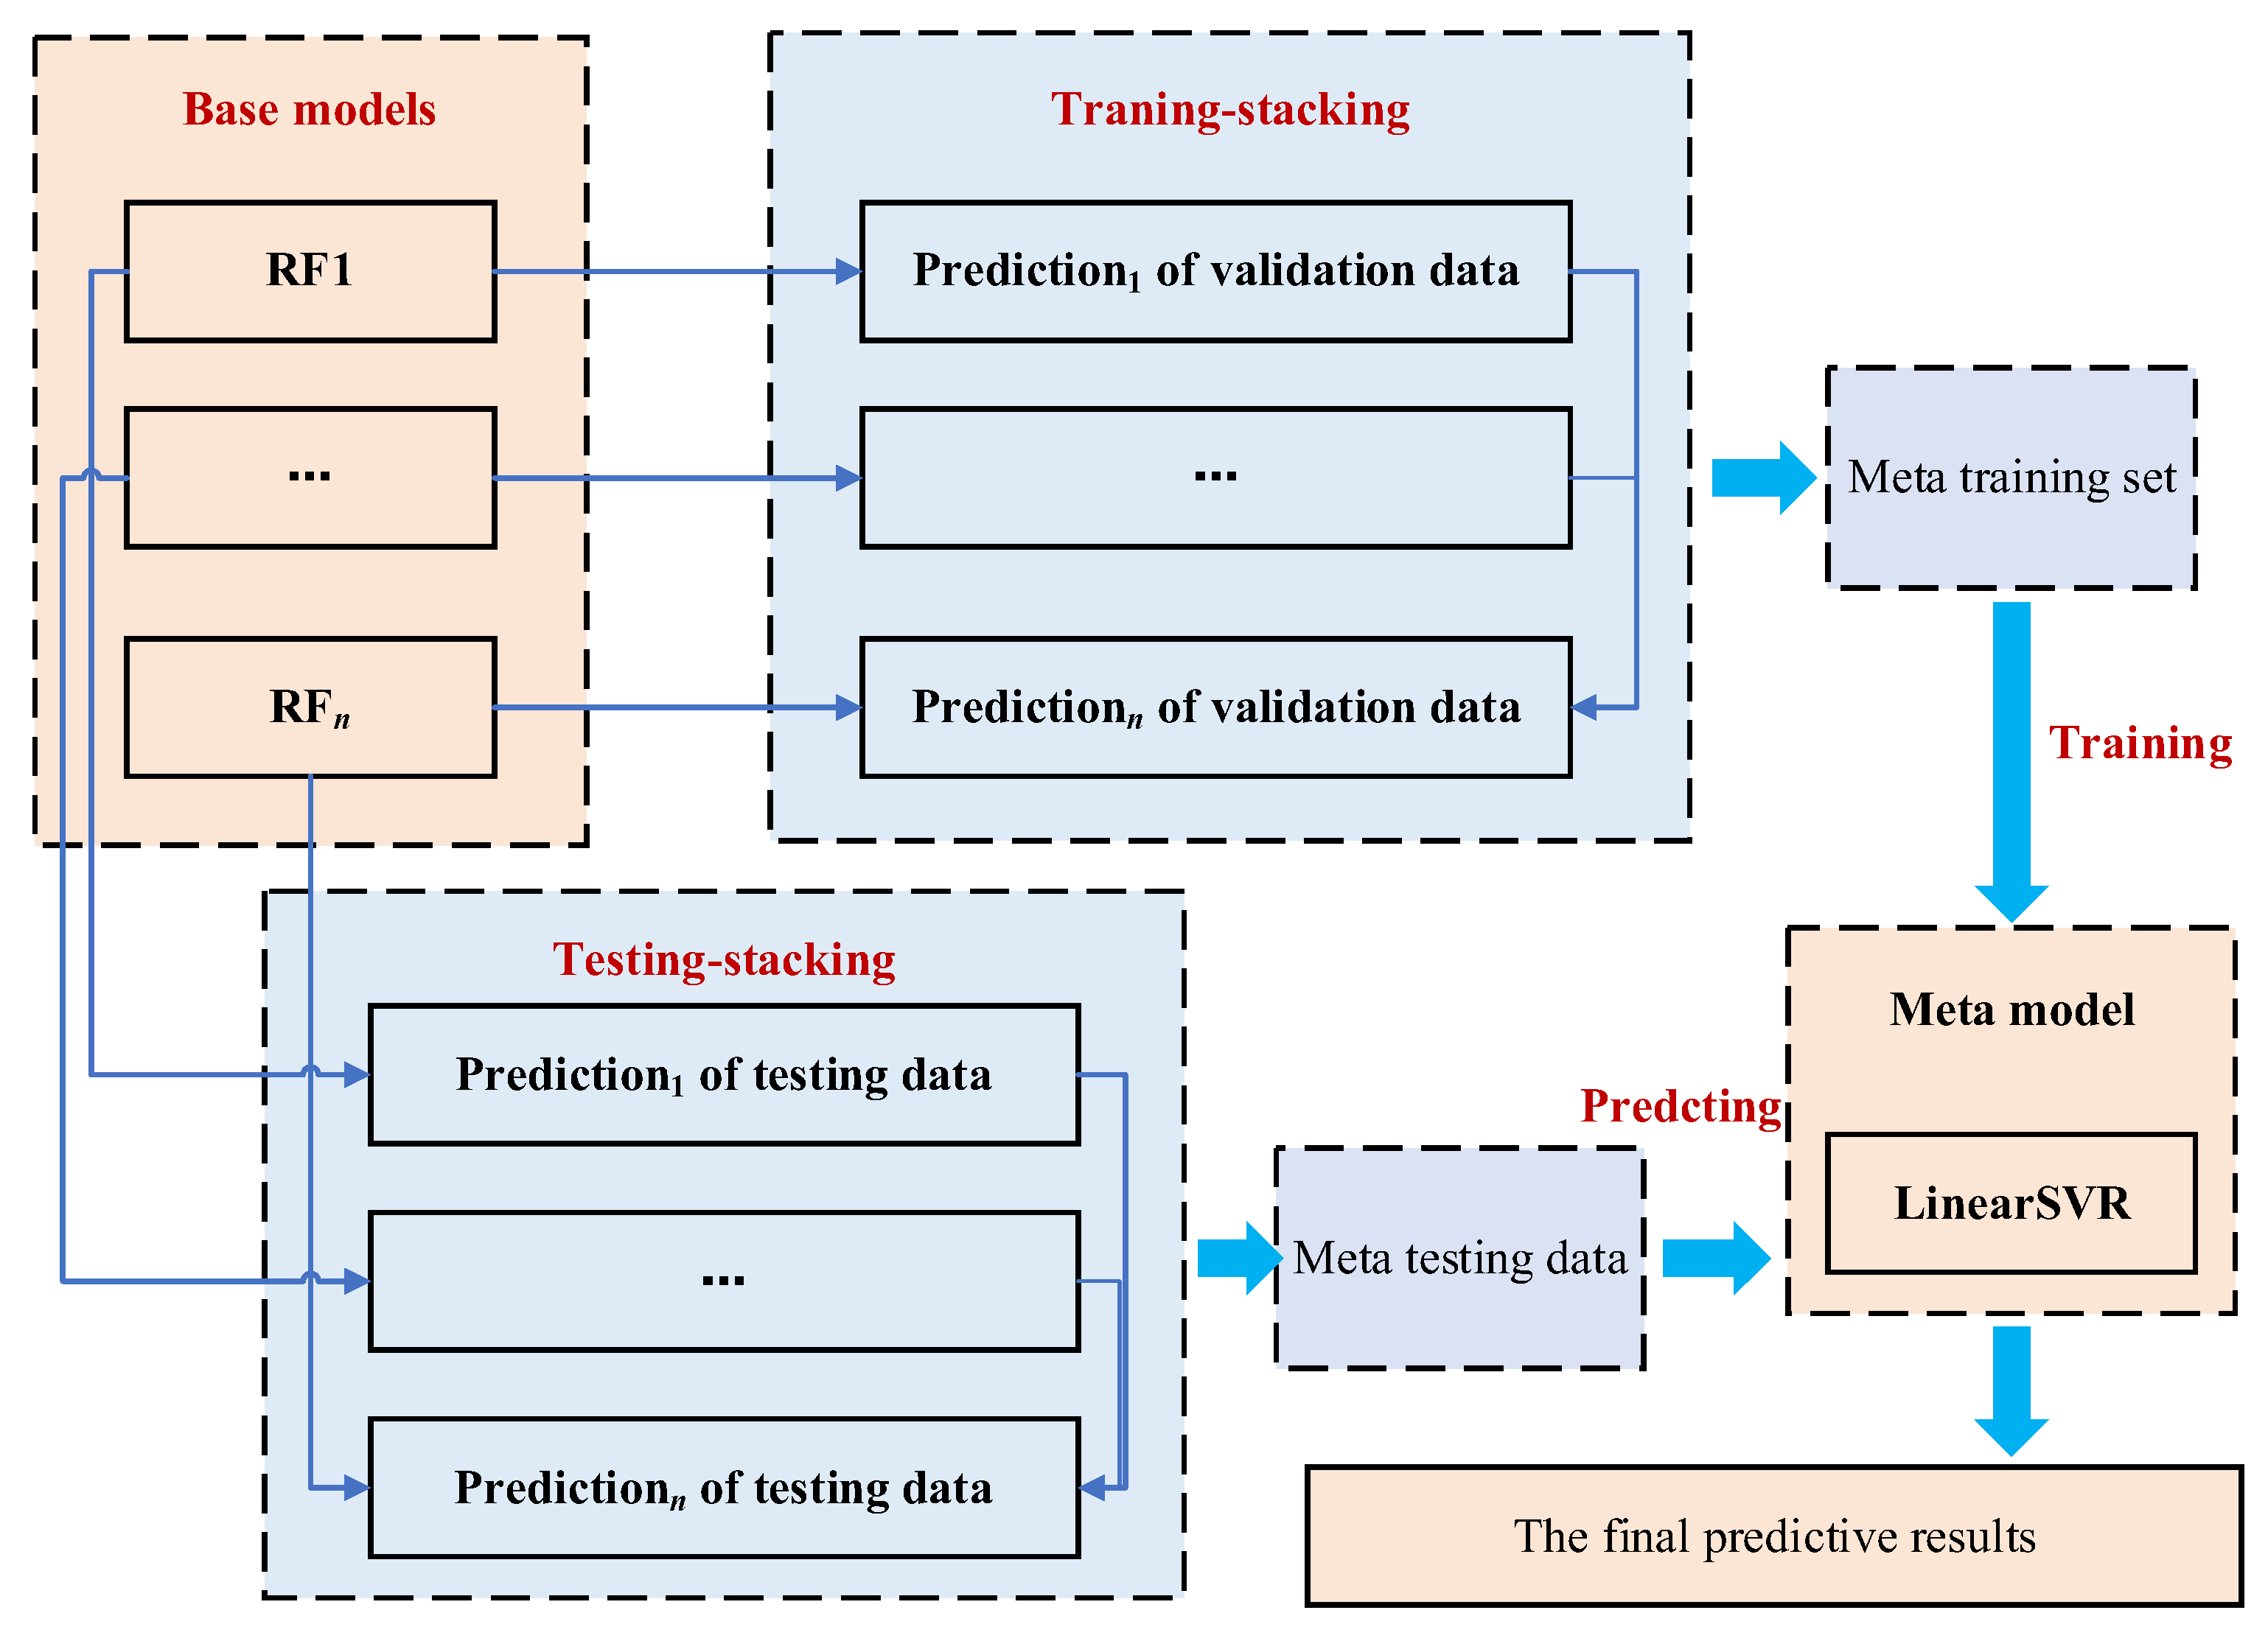
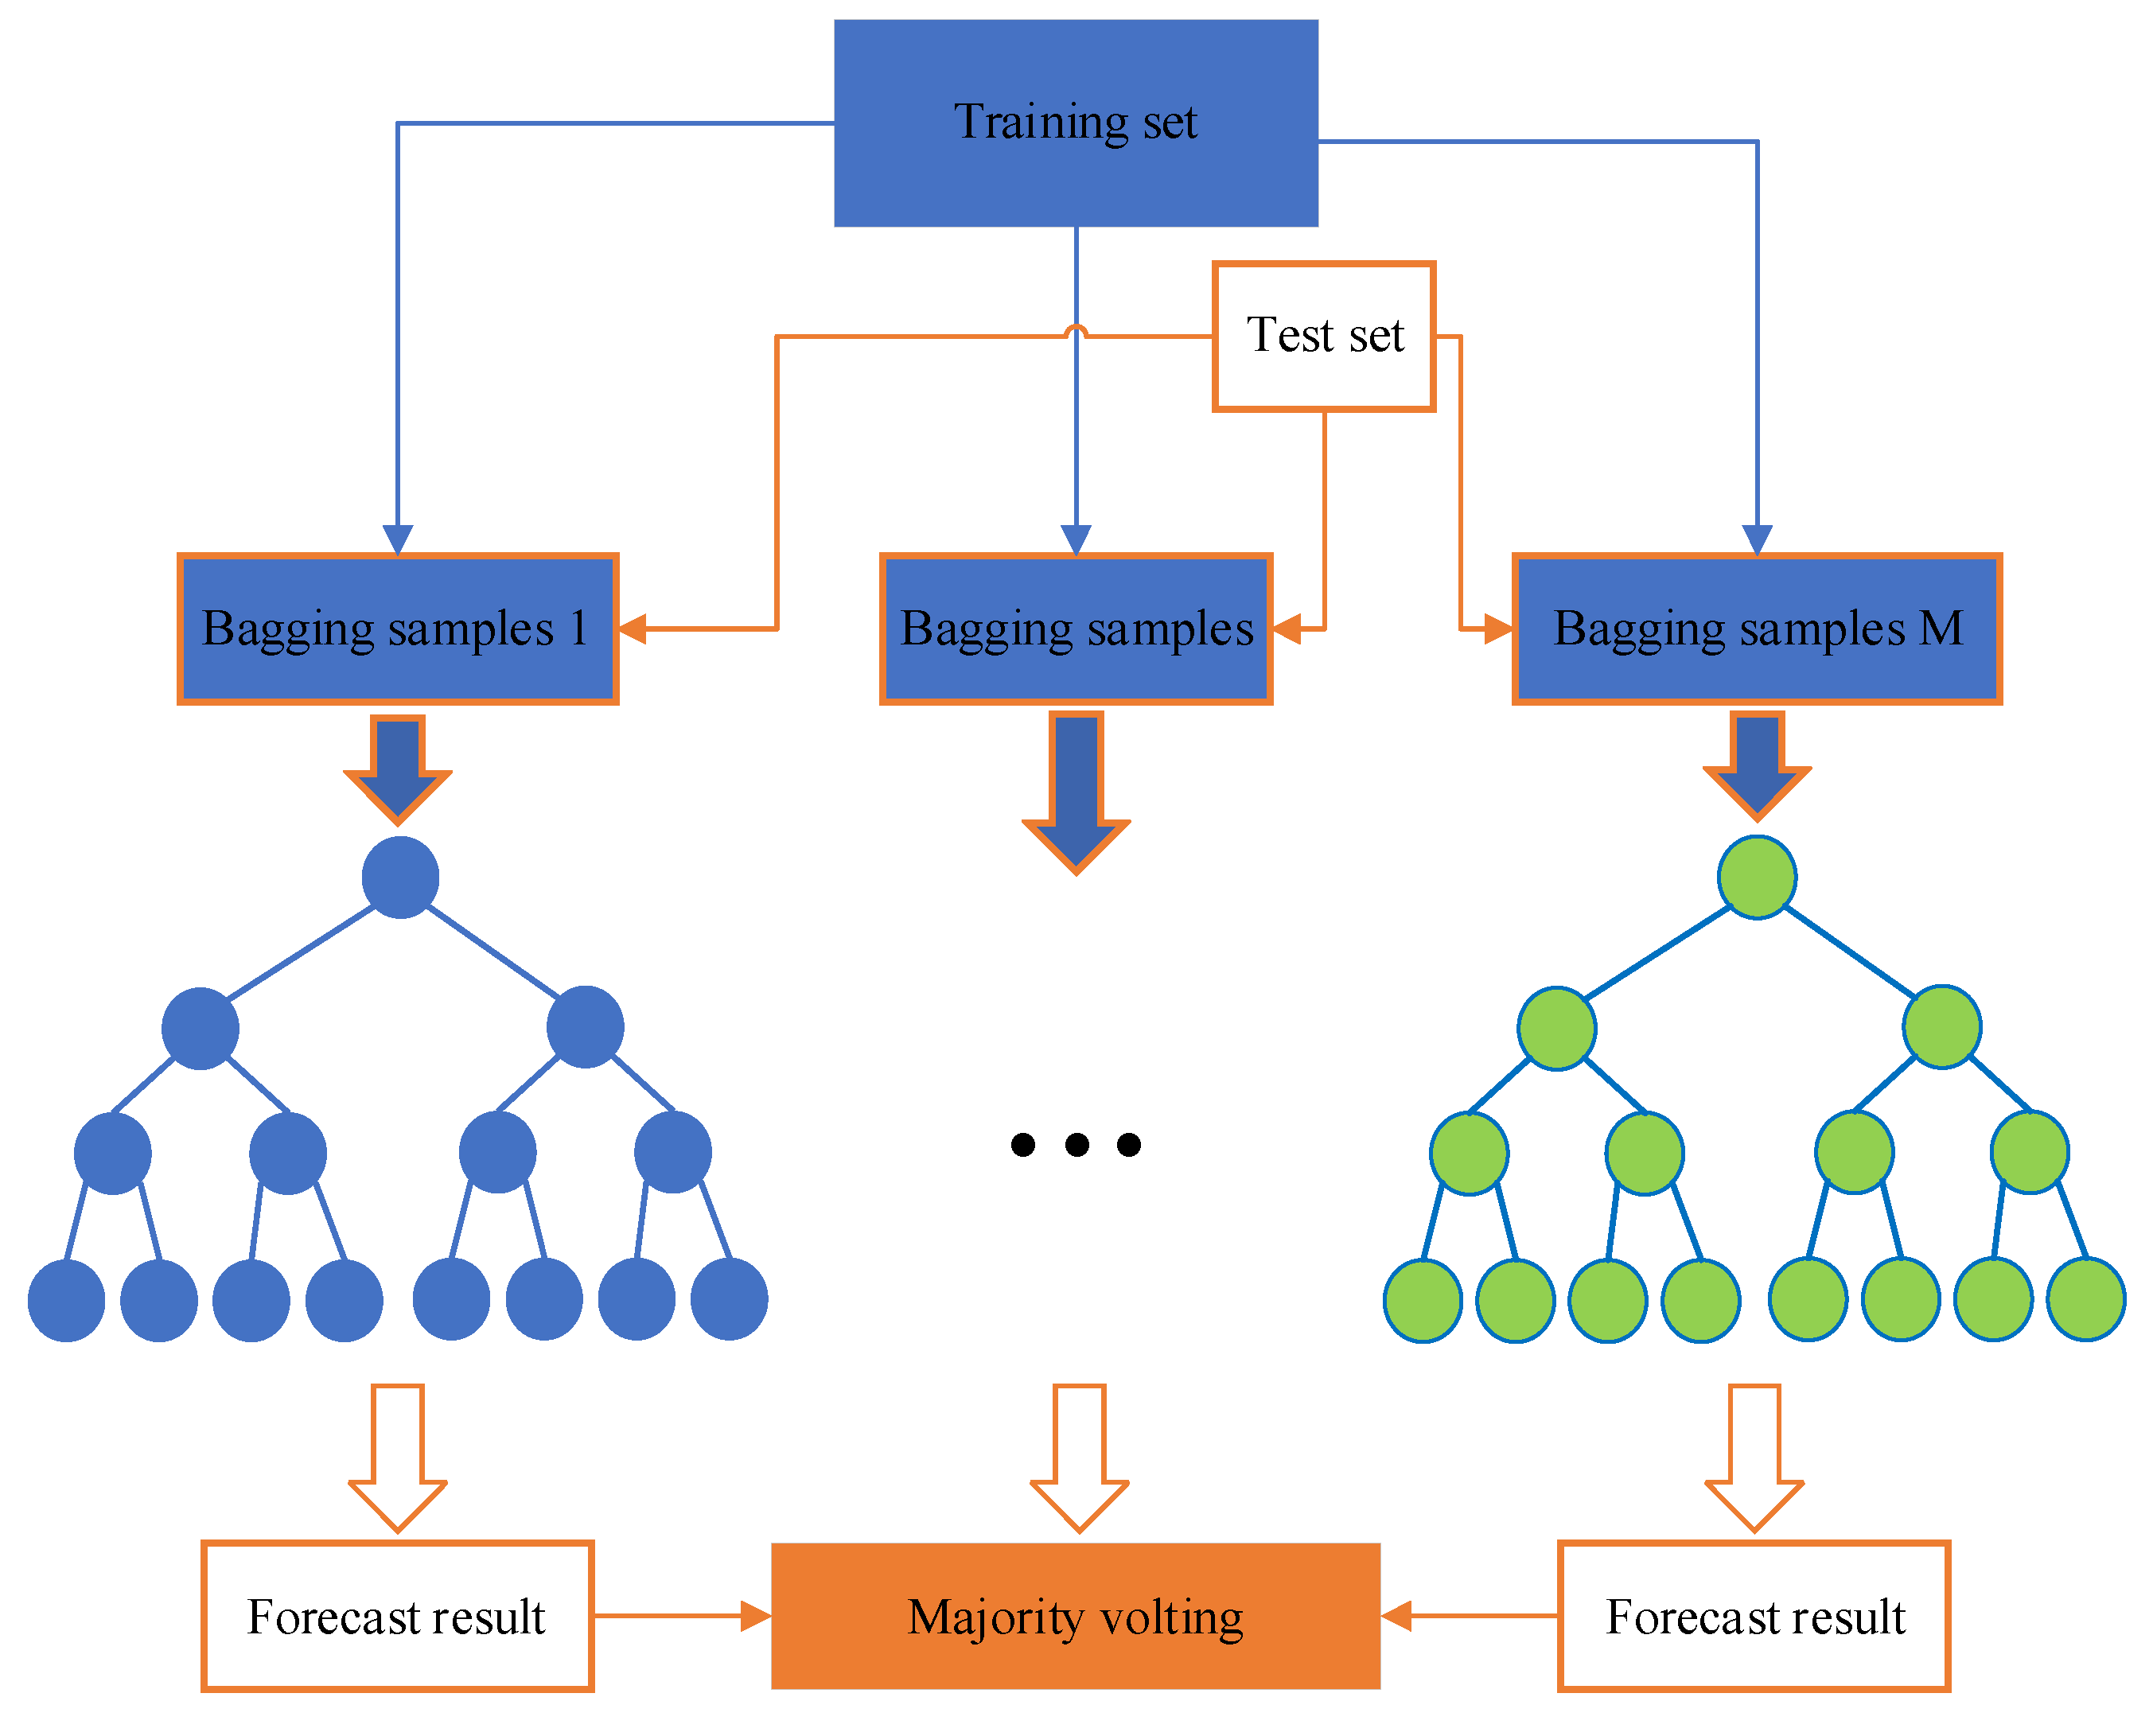
A stacked ensemble model usually has a two-layer structure, as shown in
Figure 3. The first layer divides the original training set into multiple sub-training sets and multiple validation sets through cross-validation. Subsequently, it trains multiple base classifiers based on these sub-training sets. Secondly, it uses the trained base classifier to predict the validation set and test set separately. Then, it combines the prediction results of all base classifiers on the validation sets into a new training set (meta training set), and combines the average prediction results of the test sets into a new testing set (meta testing set). The second layer of the meta classifier is trained based on the meta training set, and the trained meta classifier is used to predict the meta testing set. At this point, the final prediction result of the testing set is obtained. In this study, random forest was used as the base classifier, whose principle is stated as follows.
Random forest was first proposed by Breiman in 2001 [
24]. It is based on decision trees and incorporates random selection attributes during training through bagging techniques. Random forest is a set of ensemble algorithms that have the characteristics of simple principles, easy implementation, and low computational complexity. We have already demonstrated its excellent performance in classification and regression tasks. It is known as “the method representing the level of ensemble learning technology”. The structure of RF is shown in
Figure 4.
The decision tree, as the component of RF, is a widely used tree-like predictive model. Its name comes from the splitting of nodes. The node-splitting starts from the root node and will not stop until the stopping condition is satisfied. It should be noted that the splitting is not random, but rather a manifestation of the search for the optimal splitting attribute. The root node represents the testing of a certain feature, and the path from the root node to the leaf node represents decision rules [
25]. Based on the rules, predictive results can be obtained, which are represented by leaf nodes.
The decision tree predicts samples based on nodes and rules. When predicting, the decision tree starts from the root node and determines the only path to the leaf node. By tracking the path from the root node to the leaf node, the predictive process can be obtained. And the predictive result is the result of a vote between samples in the leaf mode.
The purity of a dataset can be expressed by its entropy value. According to the definition of entropy in information theory, the higher the information entropy, the lower the purity of the data. The information entropy of dataset
X is
where
c denotes the number of data categories, and
pi denotes the proportion of the
i-th category in the total data.
After the action of feature
A, sample
X is divided into
n sub-datasets
Xj,
j = 1,2, …
n, and the information entropy of sample
X is expressed as follows:
where
j denotes the
j-th category.
The information gain can be obtained by
The greater the information gain, the better the classification effect using feature A. This is why RF can be used as the feature selector.
When constructing a decision tree, the first step is to determine the information gain of each feature for the final predictive result and use the feature with the highest information gain as the root node. Then, the dataset is divided into two categories, and the information gain of each feature on the split dataset is determined as the root node of the split dataset, which is the leaf node of the entire dataset. The above steps are repeated until the dataset cannot be further divided.
Subsequently, RF uses the bootstrap sampling method to extract samples from the original data, and constructs a decision tree using the extracted samples. The number of decision trees needs to be defined in advance. The prediction result of a random forest is the voted-upon value of predictive results of decision trees.
3. Simulation and Experimental Setup
To quickly predict hotspot temperature, a data-driven method is a good choice. However, its utilization is limited by the deficiency of historical monitoring data. To alleviate this, a novel pseudo-real data generation method combined virtual experiments with GAN was proposed. Virtual experiments were conducted in Icepak to measure the hotspot temperature of the key electronic components by changing their temperature-sensitive characteristics such as power consumption, ambient temperature, and altitude.
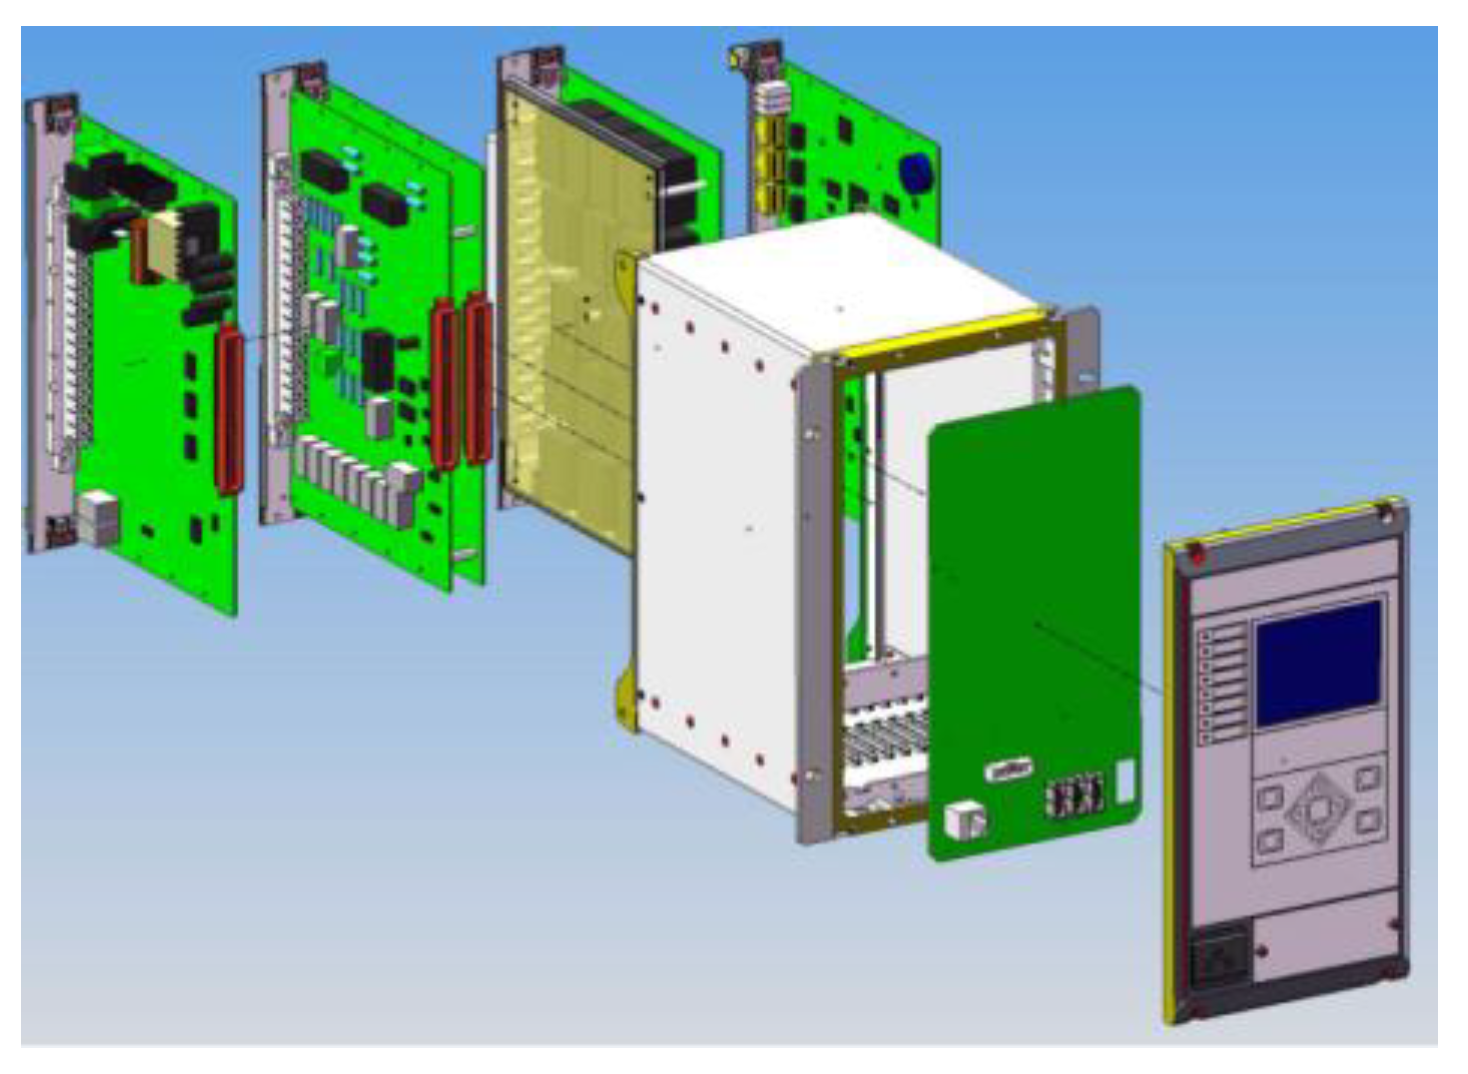
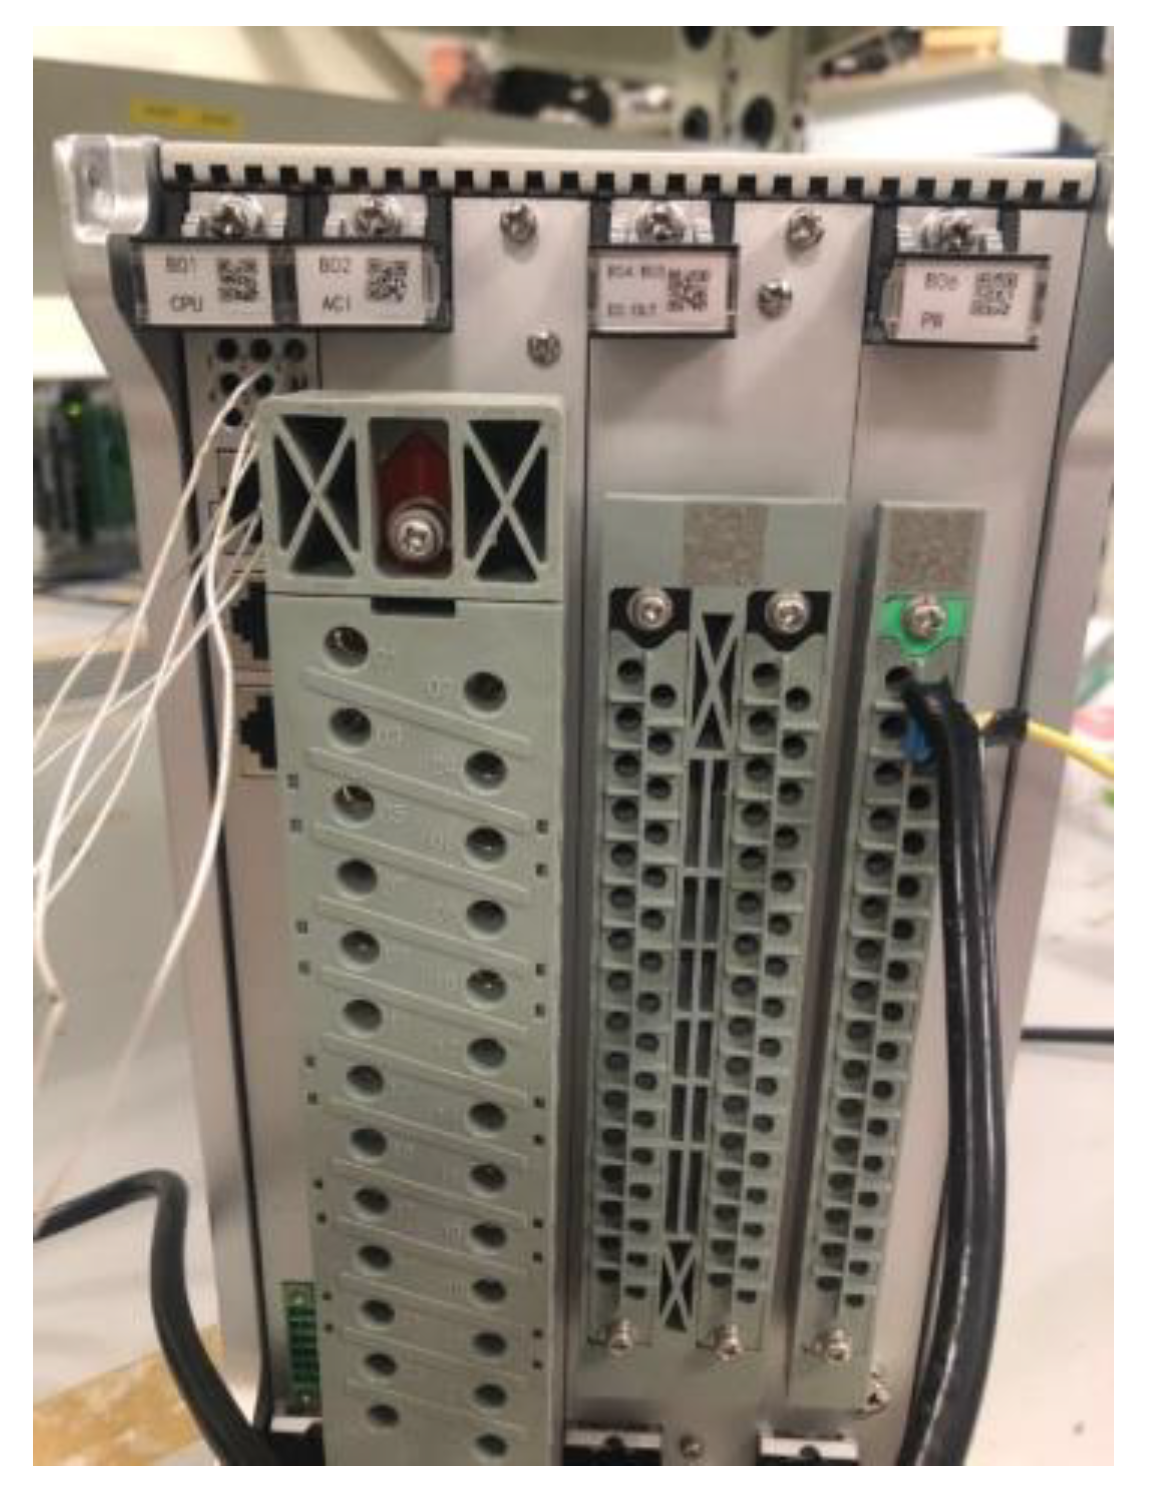
A 35 kV piece of RPE with typical structural characteristics was selected as the research object. It includes common functional plugins and basically covers the main types of components, whose structure and composition are shown in
Figure 5.
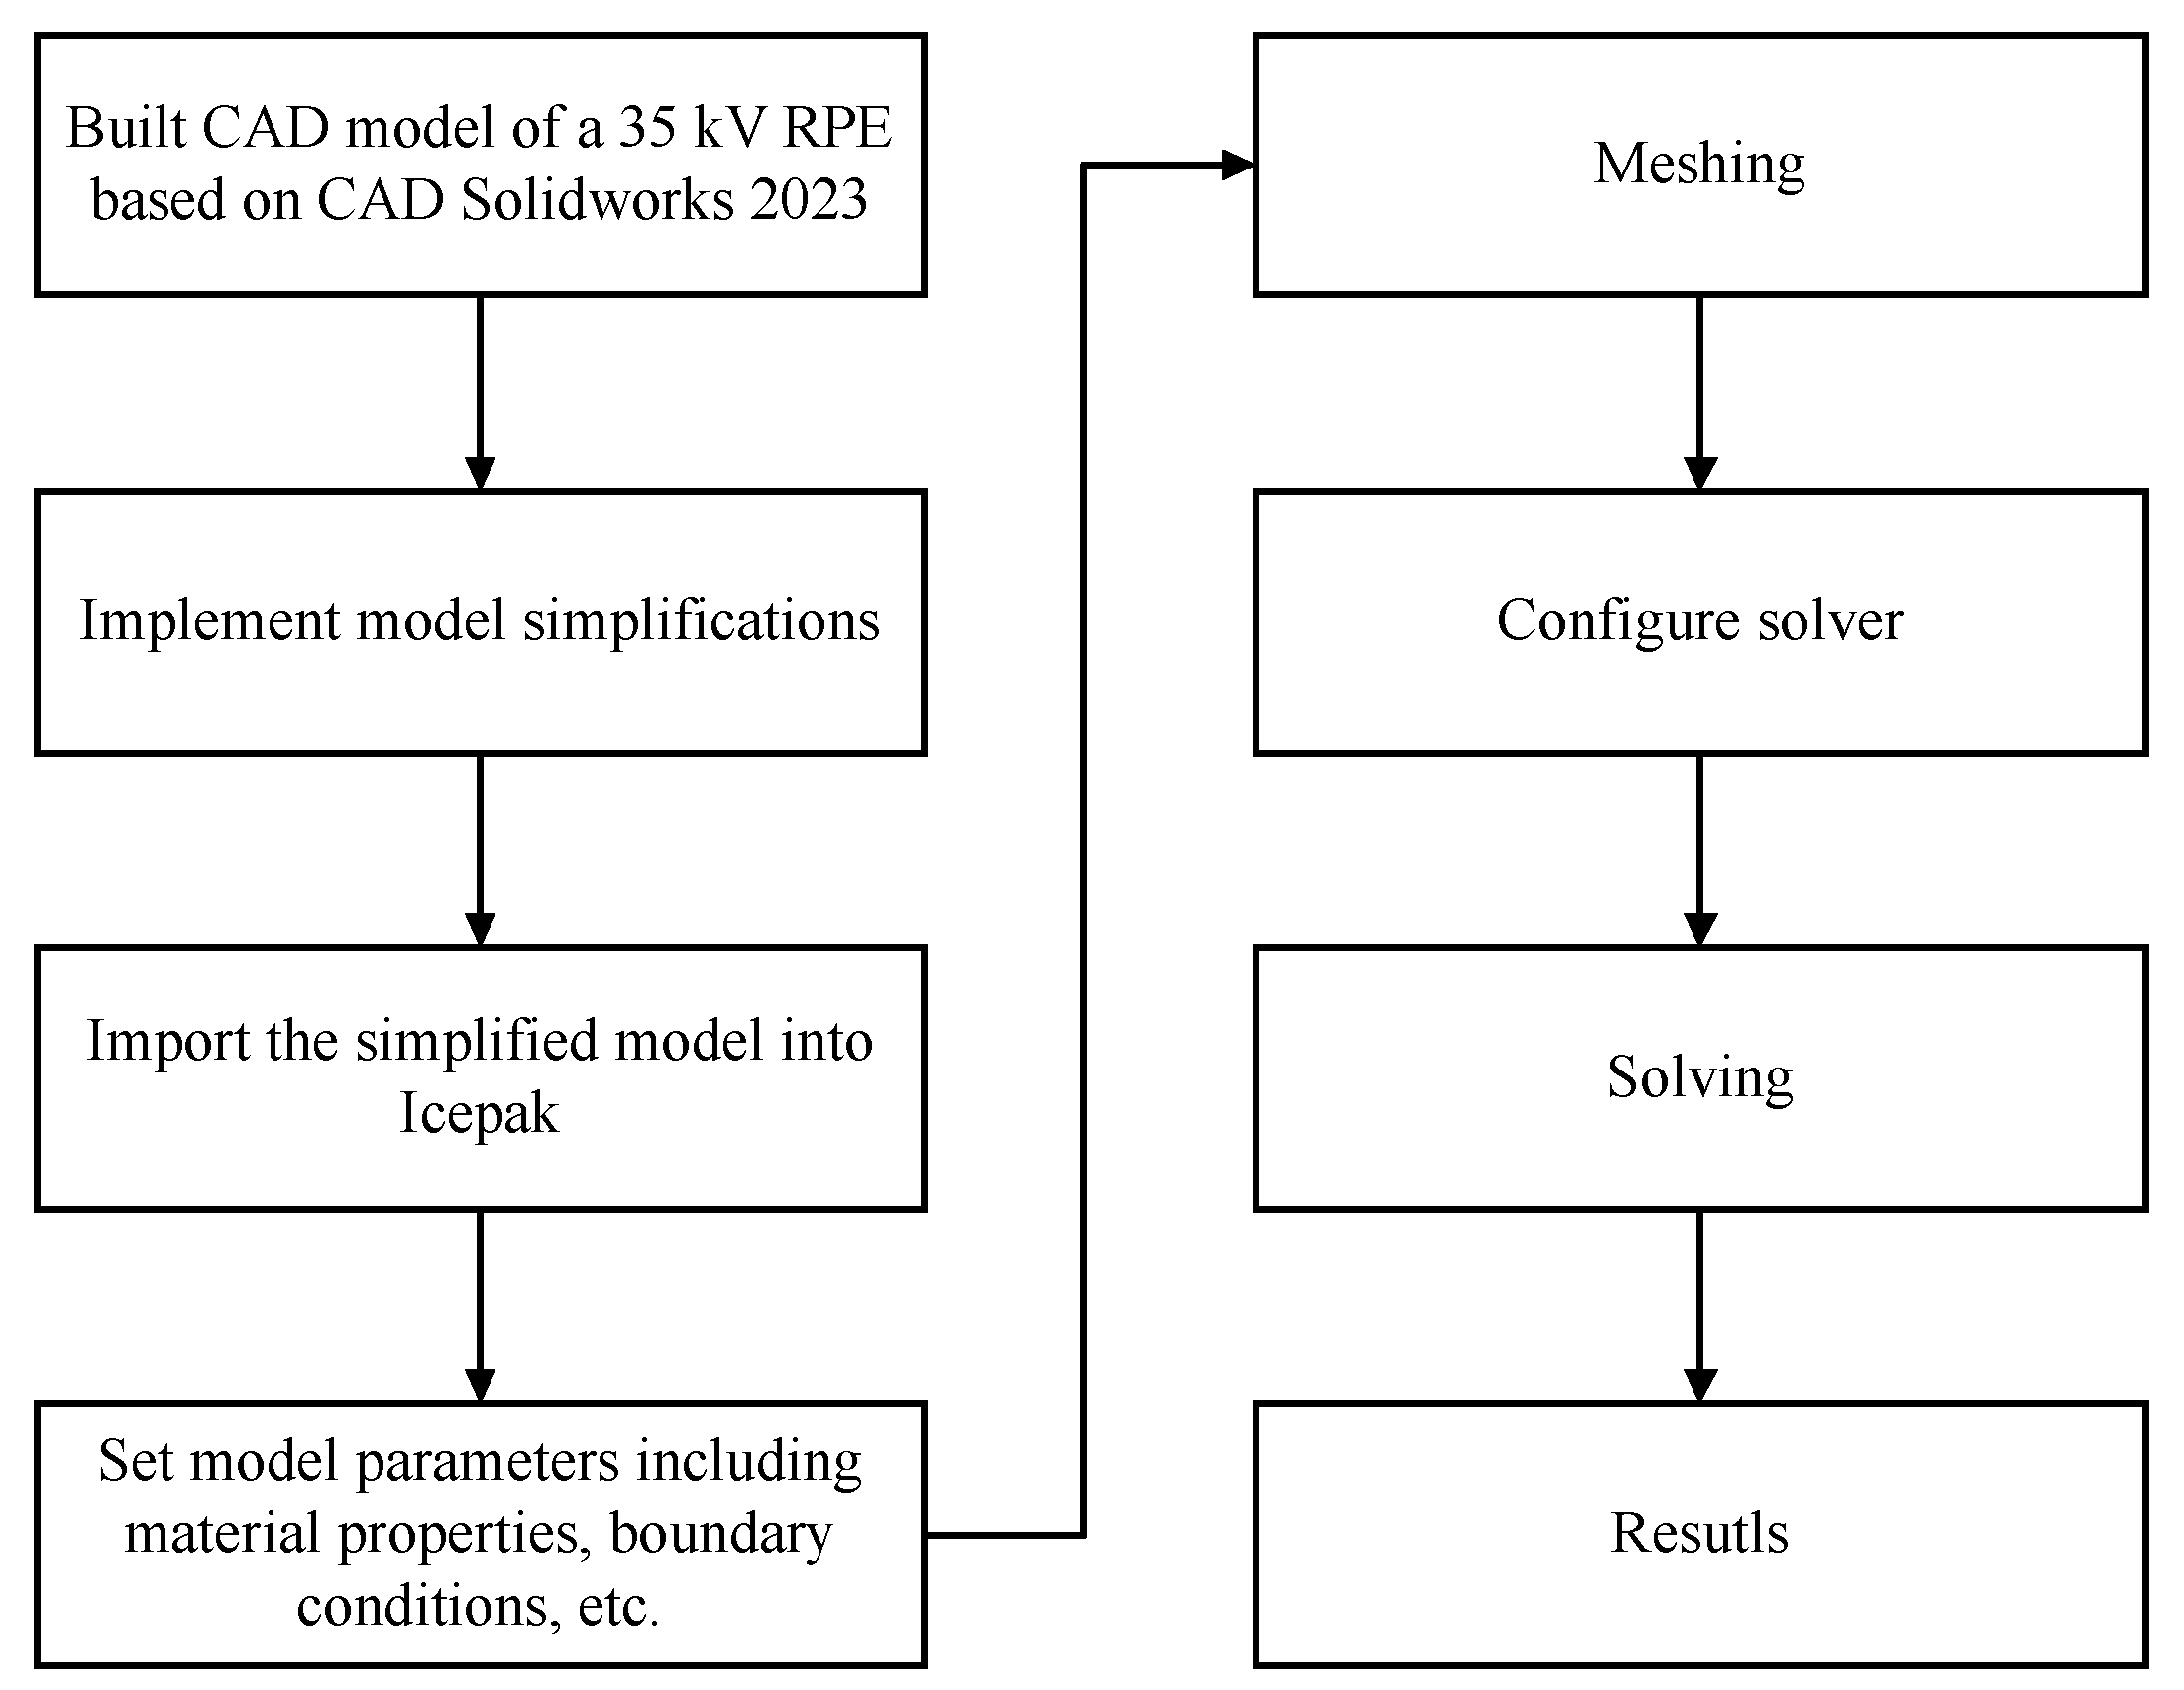
Correspondingly, a finite element simulation model was built in Icepak. The simulation flow is shown in
Figure 6. It should be noted that some simplification was performed to improve computational speed and ensure final convergence. Specifically, the components and simplified features that do not affect heat dissipation according to the principle of maximizing the preservation of the original heat dissipation path were deleted during the modeling of the box. And during the modeling of the PCB boards, the high-loss electronic components and gas-hinder electronic components were left, while the low-loss and gas-hinder-free electronic components were deleted. The consumption of the deleted electronic components is integrated into that of the PCB board.
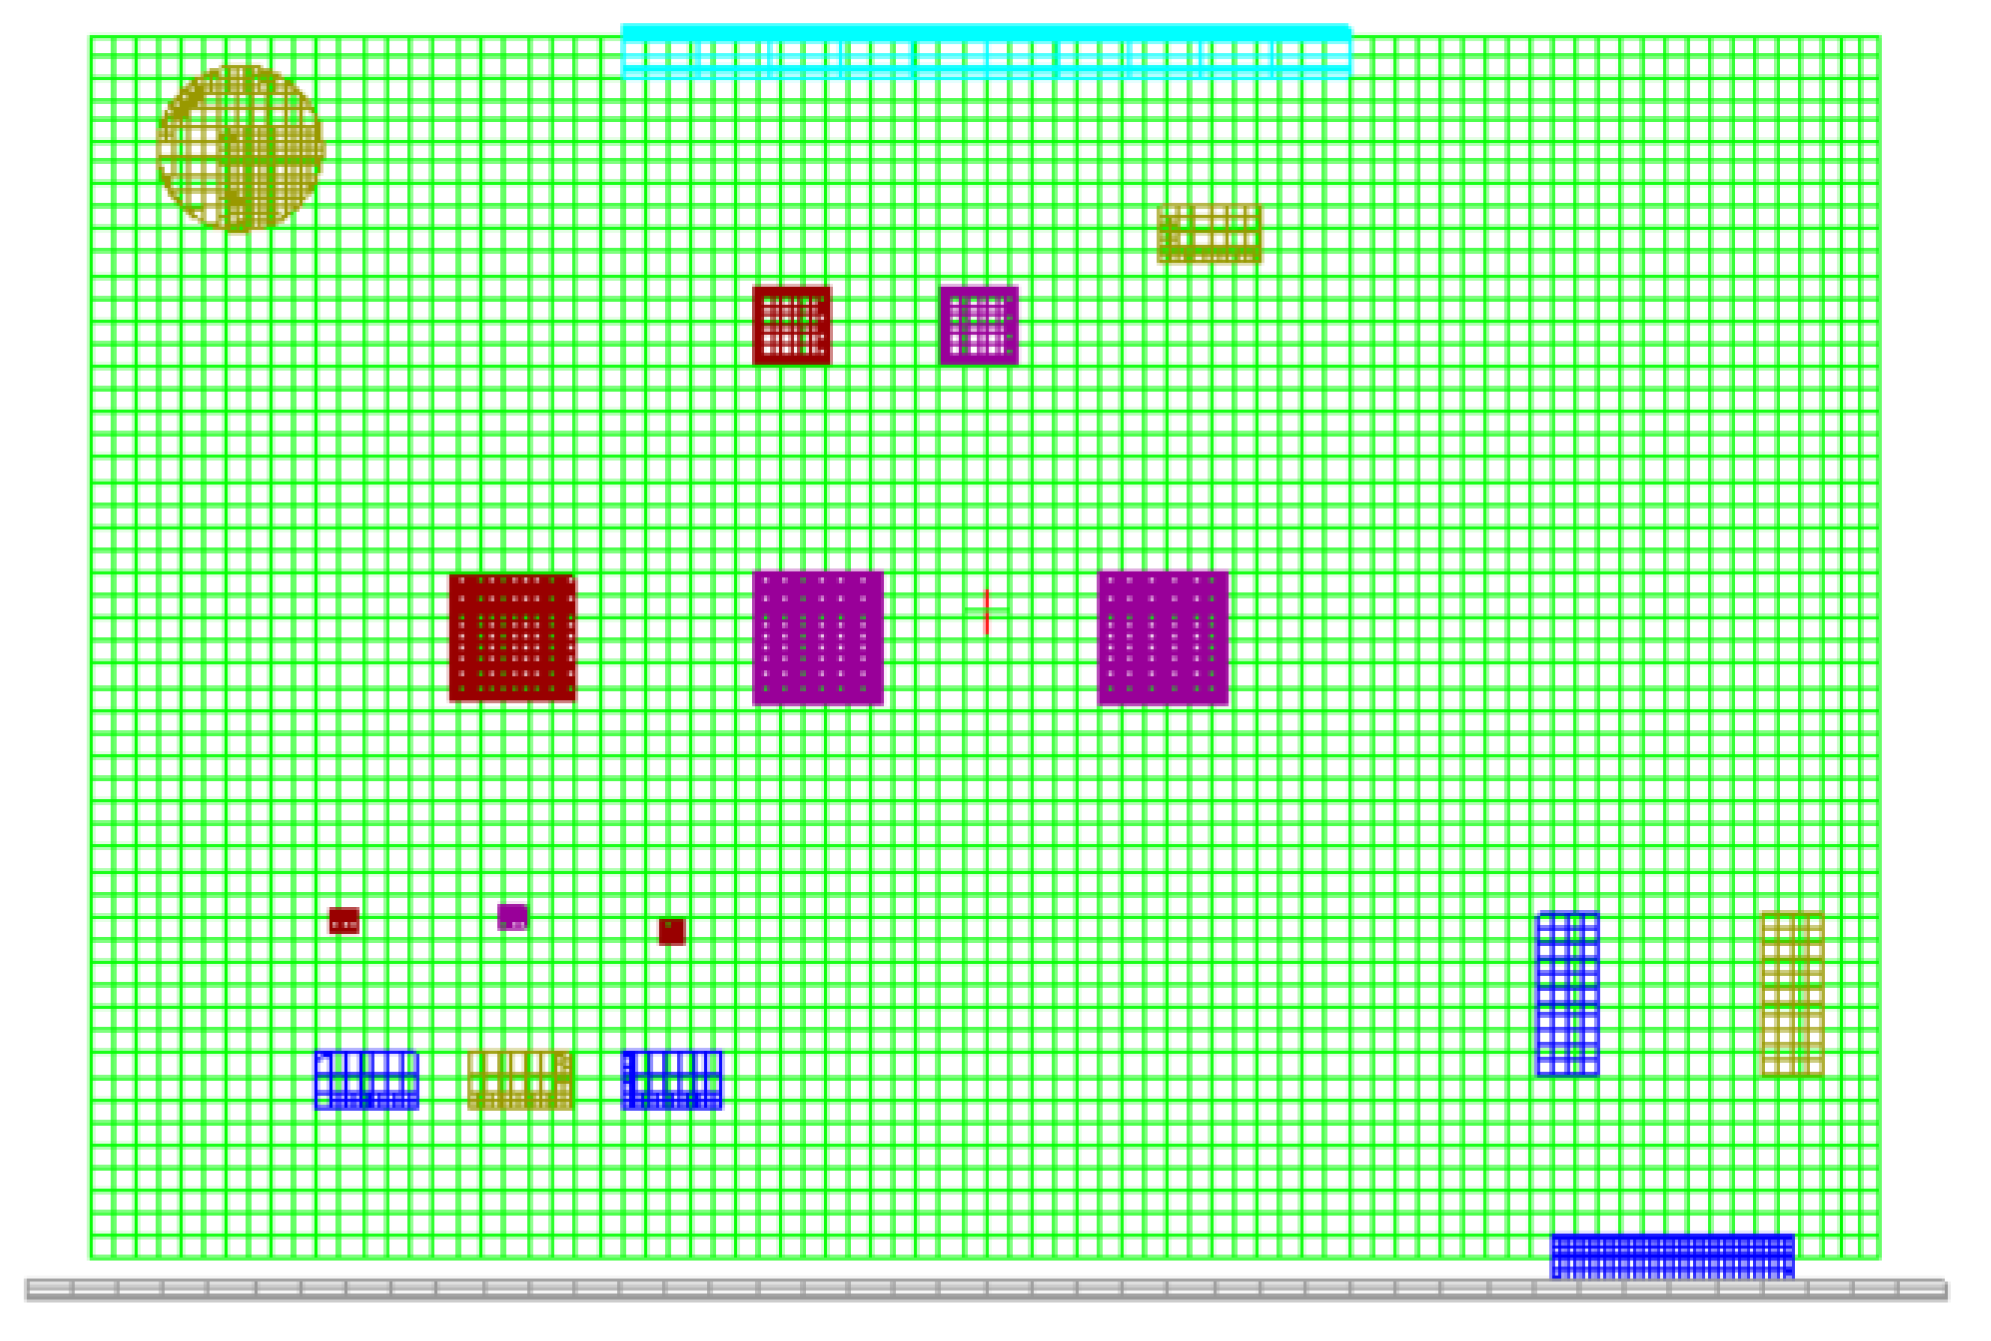
Subsequently, the model parameters including material properties, boundary, and incentives were set for the model. Before solving, meshing had to be performed, the output of which is known as the finite element. Meshing took into consideration simulation speed and precision, namely, the air duct components adopted a large unit while the heat and dissipation-related components such as chips and MOS tubes adopted a smaller unit. Taking the CPU board as an example, the meshing result is shown in
Figure 7.
Afterward, the solver of Icepak was configured to calculate the heating temperature of the simulation model. To simulate different thermal characteristic of RPE, it is necessary to change external and internal incentives such as ambient temperature, altitude, consumption, and thermal conductivity. Then, following the same principle of meshing and solving, a few hotspot temperatures of CPU were recorded.
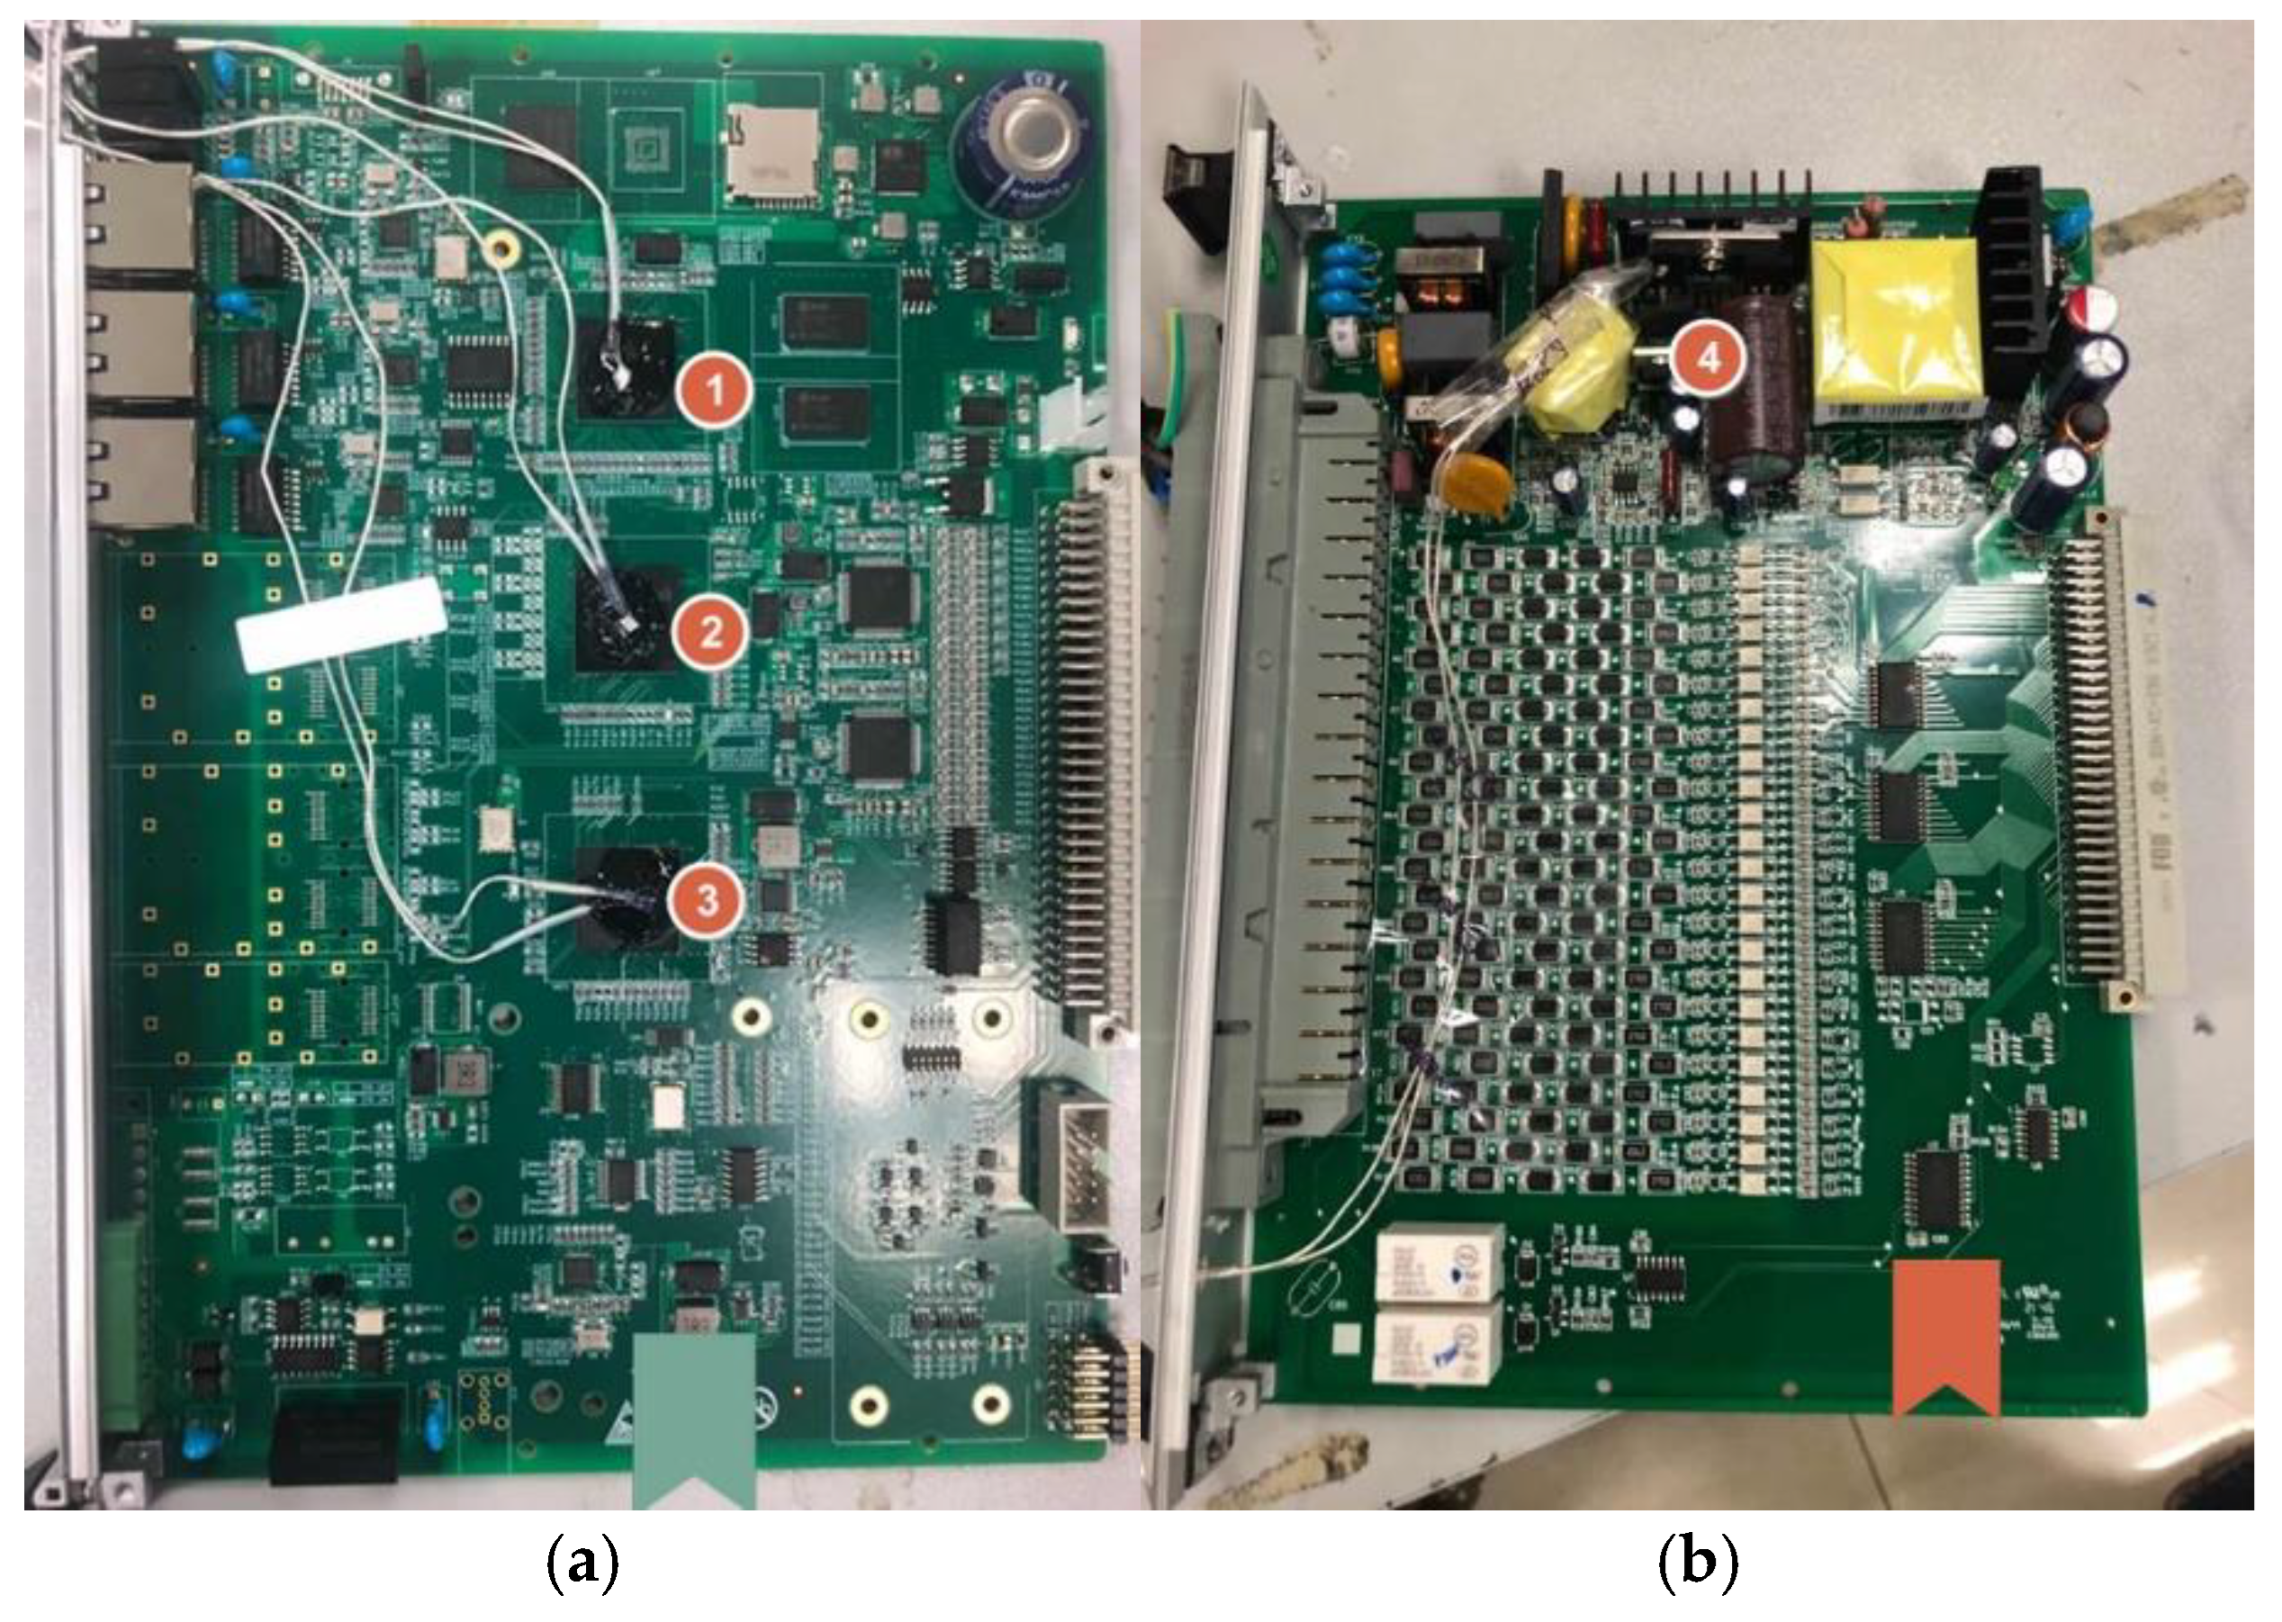
On the other hand, the proposed data generation model requires real data. RPE with some temperature measurement probes attached was put in a high–low-temperature test box. The specific measurement positions are shown in
Figure 8 (corresponding to
Figure 7). The attached temperature measurement probes, which correspond to the numbers 1, 2, 3, and 4 in
Figure 8, were used to measure the temperatures of the CPU, FPGA1, FPGA2, and MOS tube, respectively. And
Figure 9 shows the lead out position of the signal lines used for temperature probes. It should be noted that the temperatures of electronic components can be measured up until the point at which the RPE has operated at the set ambient temperature for over an hour. The ambient temperatures were set at 30 °C, 45 °C, 50 °C, 55 °C, and 80 °C to measure the thermal characteristics of the RPE.
4. Results
In the real scenario, it is difficult to measure the hotspot temperature of the RPE because chips are packed in the metal structures and the entire RPE is further installed in a metal cabinet. It is thus difficult to produce intelligent predict models based on a small amount of monitoring data recorded in laboratory alone. Though simulation can generate lots of data, they cannot be used directly to train predictive models due to the simplification. To effectively utilize simulation data and actual measurement data, GAN was used to apply feature transfer in this study, based on which lots of pseudo-real data to be used for the training of intelligent prediction models can be generated.
Taking FPGA1 as an example,
Figure 10 show the characteristic maps of measured data, simulation data, and generated data (partial data), respectively. Intuitively, there is a certain similarity between the generated data, simulation data, and measured data. The data distribution between the generated data and the real data shown in
Figure 10 has significant similarity.
To more accurately reflect the effects of feature transfer, the transferred data were used to build predictive models, and then the predictive results were evaluated by Mean Absolute Percentage Error (
MAPE), Mean Absolute Error (
MAE), and Root Mean Squared Error (
RMSE) [
26]. The definitions of the above metrics are as follows:
A stacked ensemble model was used to predict the hotspot temperature of RPE. RF was used as the base predictor in the stacked ensemble model, and linear SVM was used as the meta predictor. The predictive results of base predictors were used as the input of the meta predictor.
In order to suppress overfitting in the stacked ensemble model, cross-validation was used to train base predictors. By using cross-validation (five-fold), five groups of sub-training and validation sets were divided. The sub-training set was used to train the base classifier. The predictive results of validation sets were used as the training input feature of the meta learner, and the average probability predictive result of the testing set was used as the test input feature of the meta learner. It should be noted that the original training set is derived from GAN, while the testing set comes from the real experiment. The predictive results are shown in
Figure 11.
It can be intuitively seen that the predictive results show good agreement with the actual data. To verify the superiority of the proposed predictive method, it was compared with some well-known intelligent technologies, namely, SVM, ELM, generalized regression neural network (GRNN), and long short-term memory (LSTM). The comparative results are shown in
Table 1,
Table 2 and
Table 3.
It can be seen that the method proposed in this study is significantly superior to conventional methods. The three metrics indicate that the mean errors of the proposed method are basically one-third of those of other methods, respectively. Further, the mean error of the proposed method is lower than 2 °C, or 2%. Since there is a wide consensus that a 5% error is allowed in engineering, the performance of the proposed method is quite acceptable. The superiority of the proposed method is related to the ensemble learning, which allows for the random sampling of samples so as to build a lot of variant predictive models that are ensembled to a strong predictor, which reduces hyperparameter settings while improving prediction accuracy for hotspot temperature and ensemble model generalization.
Further, to demonstrate the superiority of the generated pseudo-real data, the predictive model built based on them was compared with the predictive model built based on simulation data. The comparative results of transferred data and simulation data are shown in
Table 4.
Comparing
Table 4 with
Table 1,
Table 2 and
Table 3, it can be seen that the predictive model trained by pseudo-real data performed better than that trained by simulation data over MAPE, MAE, and RMSE metrics, which demonstrates the effectiveness of the proposed data-generation method.


