Article

Carbon Dioxide, Nitrous Oxide, and Methane: What Types of Greenhouse Gases Are Most Affected by Green Investments and Renewable Energy Development?

1
Department of Management, Faculty of Applied Sciences, WSB University, 41-300 Dabrowa Gornicza, Poland
2
The London Academy of Science and Business, London W1U 6TU, UK
3
Academic and Research Institute of Business, Economics and Management, Sumy State University, 40-007 Sumy, Ukraine
4
Faculty of Economics, Dresden University of Applied Sciences (HTWD), 01-069 Dresden, Germany
5
Institute of Public Administration and Business, Lubelska Akademia WSEI, 20-209 Lublin, Poland
6
Faculty of Commerce, University of Economics in Bratislava, 852-35 Bratislava, Slovakia
7
Faculty of Economics and Management, West Ukrainian National University, 46027 Ternopil, Ukraine
*
Author to whom correspondence should be addressed.
Energies 2024, 17(4), 804; https://doi.org/10.3390/en17040804
Submission received: 30 November 2023 / Revised: 17 January 2024 / Accepted: 6 February 2024 / Published: 7 February 2024

Abstract

:
The article aims to analyze the impact of green investments and the development of renewable energy on greenhouse gas emissions based on 223 countries in 2011–2021. The information base is the International Renewable Energy Agency, Our World in Data, Climate Policy Initiative, and FTSE Russell. Correlation analysis was used to check the data multicollinearity, multivariate regression analysis with stepwise variable entry—to formalize functional relationships. All variables characterizing the dynamics of green investments and the development of alternative energy, the number of annual investments in off-grid renewable energy has the largest impact on the amount of CO2 and N2O. Thus, an annual investment increase of USD 1 million leads to a CO2 emission increase of 4.5 kt and an N2O emission increase of 0.272 kt. Simultaneously, the green economy’s market capitalization level has the largest impact on the amount of CH4. In this case, a capitalization increases of USD 1 trillion leads to a CH4 emission increase of 129.53 kt. The dynamics of renewable energy development have a statistically significant effect on only one of the three studied greenhouse gases—CO2 emissions. Here, 1 MW growth of an absolute increase in off-grid renewable energy capacity leads to a 1171.17 kt reduction of CO2 emissions. Checking input data for lags confirmed a time lag of one year between the level of green investments and the level of greenhouse gas emissions. That is, the impact of green investments on the level of greenhouse gas emissions is delayed by one year. The results of regression models taking into account lags confirmed that an increase in the level of green investments has a positive effect on reducing the level of greenhouse gas emissions (an increase in off-grid renewable energy annual investments of USD 1 million leads to a decrease in CO2 of 1.18 kt and N2O of 1.102 kt; the increase in green economy market capitalization of USD 1 trillion leads to a decrease in CH4 emissions of 0.64 kt).

1. Introduction

In recent decades, the world community has faced several important tasks, the achievement of which should become a guarantee of sustainable development in society. These global tasks were outlined in “Transforming our world: the 2030 Agenda for Sustainable Development”, a resolution adopted by the United Nations General Assembly in the form of the 17 Sustainable Development Goals [1]. This resolution singles out the need for countries to transition to clean energy and the introduction of energy-efficient technologies as Goal 7, and the importance of combating climate change and its consequences as Goal 13.
The need to combat climate change has been established in several international documents. Among such documents, one can single out the United Nations Framework Convention on Climate Change (UNFCCC), the purpose of which is to establish the need to stabilize the level of greenhouse gases in the atmosphere at a level that would prevent dangerous anthropogenic influence on the Earth’s climate [2]. As part of the tasks set by the UNFCCC, the Kyoto Protocol was concluded in 1997, which was a legally formalized obligation of developed countries and countries with transition economies to reduce greenhouse gas emissions in 2008–2012 to the level of 1990 [3]. Also, within the framework of the UNFCCC in 2015, the Paris Agreement was concluded, which should replace the Kyoto Protocol. This agreement aims to regulate measures to reduce carbon dioxide emissions by 2020 [4]. Unlike the Kyoto Protocol, the Paris Agreement stipulates that all countries, regardless of their economic development, undertake to reduce greenhouse gas emissions into the atmosphere.
The annual increase in greenhouse gas emissions into the atmosphere causes global warming. The latter, in turn, provokes the melting of glaciers, coastal flooding, and weather changes in the Earth’s climatic zones. The primary sources of greenhouse gas emissions are the energy industry, transport sector, manufacturing, and agriculture.
Also, tourist islands significantly contribute to the volume of greenhouse gas emissions due to the active use of air transport [5].
Humanity’s concern for emerging climate problems, including human-induced ones, prompts politicians and scientists to search for effective mechanisms to reduce the harmful effects of atmospheric air pollution. According to the International Energy Agency (IEA), about two-thirds of greenhouse gas emissions in the world come from the energy industry. Meanwhile, the latter is 80% generated by fossil fuels, the main source of carbon dioxide emissions [6]. One of the ways to reduce greenhouse gas emissions is to develop energy-efficient technologies and an alternative energy industry that works with renewable energy sources [7].
Significant financial flows are directed specifically to the development of innovations aimed at reducing the negative effect of human activity on the biosphere. This ultimately aids in improving environmental quality. These financial flows themselves are called “green investments”, as they are aimed at environmental goals such as preventing or reducing the level of environmental pollution and preserving the planet’s natural resources and biodiversity [8]. Therefore, research on issues related to improving environmental quality and reducing negative human impact is important for the protection of the planet and the well-being of society.

2. Literature Review

The construction of a high-quality, safe environment requires a systematic approach to the development and implementation of an effective security policy in various sectors of the economy. This is why issues related to greenhouse gases, renewable energy, and green investments have often become important research objects in recent years. Accordingly, scholars consider such issues in the context of the impact of global changes on economic and environmental security [9,10], energy security [11], and ensuring sustainable development [12,13,14]. Alongside this, the studied concepts occupy a leading place in the development of a new economic model called the “circular economy”. This model is based on the implementation of closed cycles in the processes of production, circulation, and consumption, which in the long run leads to a reduction in the negative impact on the environment [15,16]. In [17,18], authors reviewed publications on the subject of green finance and investments.
Nowadays, scientists highlight various aspects of the relationship between greenhouse gas emissions, in particular carbon dioxide, the development of renewable energy sources, and green investments. Thus, author [19], using co-integration methods, the Granger causality model, and the data of Vietnam, empirically proved the existence of cointegration between such pairs of variables as consumption of renewable energy—CO2 emissions, and environmental investments—CO2 emissions. Another author [20], using Chinese data as an example, showed that green investments can reduce CO2 emissions due to industrial optimization. The authors [21] believe the reduction of CO2 emissions is possible due to the improvement of transport infrastructure and logistics operations. In [22], the author analyzed the role of energy efficiency and environmental technologies, using the Norwegian maritime industry as an example.
In addition, researchers study the issues related to the connection between green economic development and tourism. Their focus is on how renewable energy, urbanization, green investments, carbon emissions, and household incomes affect the tourism industry [23,24]. The relationship between energy and human health is also under discussion. Researchers investigate the impact of energy consumption [25], energy efficiency [26,27], renewable energy [28], and energy from waste incineration [29] on public health.
It is crucial, when making decisions about the expansion of renewable energy production and consumption, to study public opinion regarding the implementation of such initiatives [30]. In general, the study of various determinants of renewable energy development is principally for its qualitative analysis and forecasting [31]. Using the example of European countries, a group of scientists [32,33,34] studied the critical determinants of renewable energy and clean energy technologies as prospects for transforming the region’s energy industry. The cumulative value of renewable energy for society as a whole is considered in work [35], and in work [36], a group of researchers focuses directly on the economic difficulties of Nigerians in solving energy supply issues. The authors [37] conducted a study on the efficiency of renewable energy production, taking into account investments from state financial institutions and the installed electricity capacity for renewable energy sources.
The issue of the relationship between green investments and green energy is quite relevant in the scientific community. Scientists use various economic and mathematical methods and models to investigate this connection, such as the Markov switching regression model [38], bibliometric analysis [39], and panel regression models [40,41]. Research shows that green bonds, as one of the instruments of green investments, are an effective method for promoting projects related to renewable energy sources and aimed at reducing CO2 emissions in the long term [42,43]. In addition to green bonds, scientists consider the long-term impact of taxation on carbon emissions [44,45] and direct foreign investments for the deployment of the renewable energy sector. Over time, this should lead to a reduction in the rate of greenhouse gas emissions [46,47,48].
The author [49] investigated the impact of green investments on CO2 emissions using empirical data and economic-mathematical modeling. This research showed that green investments, technological innovation, and corporate social responsibility contribute to ecological economic growth and provoke a reduction in CO2 emissions. At the same time, income per capita and GDP per capita significantly increase CO2 emissions.
Using regression analysis based on data from the BRICS countries, scientists [50] studied the impact of economic, demographic, and environmental factors on green investments. They found that renewable energy consumption, population, foreign direct investments, inflation, carbon dioxide emissions, technical corporation grants, research, and development play vital roles in terms of promoting environmental finance and mitigating the effects of climate change for the BRICS countries. This indicates that scientists do not simply investigate the impact of green investments on greenhouse gas emissions, but conversely, they also study the impact of renewable energy and emissions on green investments.
Another issue to analyze is the impact of COVID-19 on various sectors of the economy, in particular the energy sector [51] and the environment [52,53]. The corporate activity of economic stakeholders in forming and ensuring their green brand is also an integral part of developing an ecological society [54,55]. Thus, in work [56] on the example of energy management on railways, a model of market regulation and transition from the active use of traditional energy sources to the use of ecologically clean resources is considered. Scientists search for ways to support the economy, which suffered because of pandemic restrictions, through environmental, energy, and political leverages [57,58,59]. Equally important is the analysis of the consequences of the energy crisis caused by the war between Russia and Ukraine for EU climate policy.
Currently, there are discussions on how to mitigate the effects of climate change by identifying ways to decarbonize the economy and ensure environmental sustainability [60,61]. One of the possible solutions is public-private investments, which should be aimed at the development of renewable energy and technological innovations in the field of increasing energy efficiency [62,63].
In the search for ways to neutralize environmental pollution, scientists have investigated the role of environmental finance and energy innovation in this process. Using the CS-ARDL (Cross-Sectional-Autoregressive-Distributed Lag) approach, they found that environmental pollution increases are associated with economic growth, urbanization, and natural resource rent. At the same time, it appeared that green investments, consumption of renewable energy, and energy innovation neutralize environmental pollution [64]. A fairly new approach to achieving energy efficiency is using artificial intelligence and blockchain in energy management systems [65].
Thus, the analysis of the literature has shown that studies on the connections between green investments, renewable energy, and greenhouse gas emissions open up a broad field of research. To study various aspects of these relationships, scientists use different methods, from theoretical analysis to empirical research using economic and mathematical modeling tools. Given the importance of the issue of reducing greenhouse gas emissions, the purpose of this study is to analyze the impact of green investments and renewable energy on the amount of CO2, N2O, and CH4 emissions.

3. Materials and Methods

The study uses variables that characterize the state of renewable energy, the number of green investments, and the number of emissions of the main types of greenhouse gases. Quantitative values of variables at the global level were taken from the website Our World in Data [66,67], the International Renewable Energy Agency’s yearbooks [68], the Climate Policy Initiative’s reports [69], and the FTSE Russell Company [70] on the example of data from 223 countries in the world during 2011–2021. Table 1 shows the variables chosen for the study. The study covers the time from 2011 to 2021.
To define the connections between the selected variables, correlation analysis was used. This was necessary to determine the closeness of the relationship between the dependent variable and the independent variables, as well as the strength of the relationship between independent variables, to detect and eliminate such a phenomenon as multicollinearity. To identify the relationship and establish a quantitative relationship between dependent and independent variables, regression analysis was used based on the multivariate linear regression model. The general equation for multivariate linear regression is as follows (1):
Y = b 0 + b 1 x 1 + b 2 x 2 + + b n x n + e ,
where Y —dependent variable; x 1 ,   x 2 ,   ,   x n —independent variables; b 0 ,   b 1 ,   b 2 ,   ,   b n —coefficients of equatation; and e —a residual (error).
The purpose of this study is to identify and analyze the impact of renewable energy development and the amount of green investment on the main types of greenhouse gases at the global level. In accordance with this purpose, there are three assumptions that need to be tested:
How renewable energy and green investments affect carbon dioxide emissions.
How renewable energy and green investments affect nitrous oxide emissions.
How renewable energy and green investments affect methane emissions.
Thus, the dependent variables are carbon dioxide emissions (CO2), nitrous oxide emissions (N2O), and methane emissions (CH4); the remaining variables are independent ones. Variables that characterize renewable energy sources are re1–re6. Variables that characterize green investments are gf1–gf5 (Table 1).
According to the outlined assumptions, three models to estimate the impact of independent variables on the dependent variable were developed. The research was conducted using the statistical software Statistica 10.

4. Results

The examination of empirical data begins with determining the strength of the relationship between the studied variables based on correlation analysis. Table 2 presents the correlation matrix with pairwise correlation coefficients. According to the table, almost all independent variables have a very strong relationship with each other since the absolute value of the correlation coefficient is greater than 0.9. This testifies that there is a phenomenon of multicollinearity between independent variables. Therefore, in order to eliminate the correlation between independent variables, it was decided instead of working with the variables’ initial data to work with their first differences. The first differences in variables re1–re6 were taken.
Hereafter, to distinguish initial data and first differences, letters f and d (first differences) will be added before variable designations. Variables gf1 and gf2 were excluded from further calculations as they have a weak relationship with dependent variables CO2, N2O, and CH4 (correlation coefficient < 0.3).
Table 3 shows a correlation matrix that includes correlation coefficients calculated on the basis of the first difference values for variables re1–re6. This table will be used later in the study to check that independent variables with a correlation greater than 0.7 are not included in the regression equation.
The next step in the research is a regression analysis, which is aimed at determining the presence of a stochastic relationship between the dependent variable and several independent variables. In our case, there are three dependent variables—CO2, N2O, and CH4. Three regression models will be built, one for each dependent variable, respectively. The general form of the models is given in Equations (2)–(4).
Then, there will be testing of the assumptions about the impact of renewable energy and green investments on outcome variables. For this, a multivariate regression model will be built by stepwise including variables in the regression model. This method makes it possible to include in the model those independent variables that increase its quality. Table 4 presents the result of the model evaluation. On this basis, the assumption that renewable energy and green investment variables affect carbon dioxide emissions will be tested.
After analyzing the results of the modeling given in Table 4, there are the following conclusions:
The coefficient of determination R-squared is 0.85, and the adjusted coefficient of determination adjusted R-squared is 0.79; therefore, the obtained model explains 79% of the change in the outcome variable, which is quite a high value.
The calculated value of the F-test (Fisher’s test with degrees of freedom is a statistical test for assessing the significance of differences in the variances of two random samples). F(3,7) (df1 = 3, df2 = 11-3-1 = 7) is 13.67, and it is larger than the critical value, which is 4.3468. Therefore, the regression model is adequate with 95% confidence.
The Durbin–Watson statistic is 2.166173, which testifies that the built model is stable.
The intercept is statistically significant as its p-value is less than 0.05.
The significance level of the p-value for variables gf5 and fd_re3 is less than 0.05. Therefore, these variables are statistically significant. Another proof of this is the value of the Student’s coefficient, which is greater than the table value of 2.2.
A variable fd_re6 with a significance level higher than 0.05 is not statistically significant. The Student’s coefficient also proves the statistical insignificance of this variable.
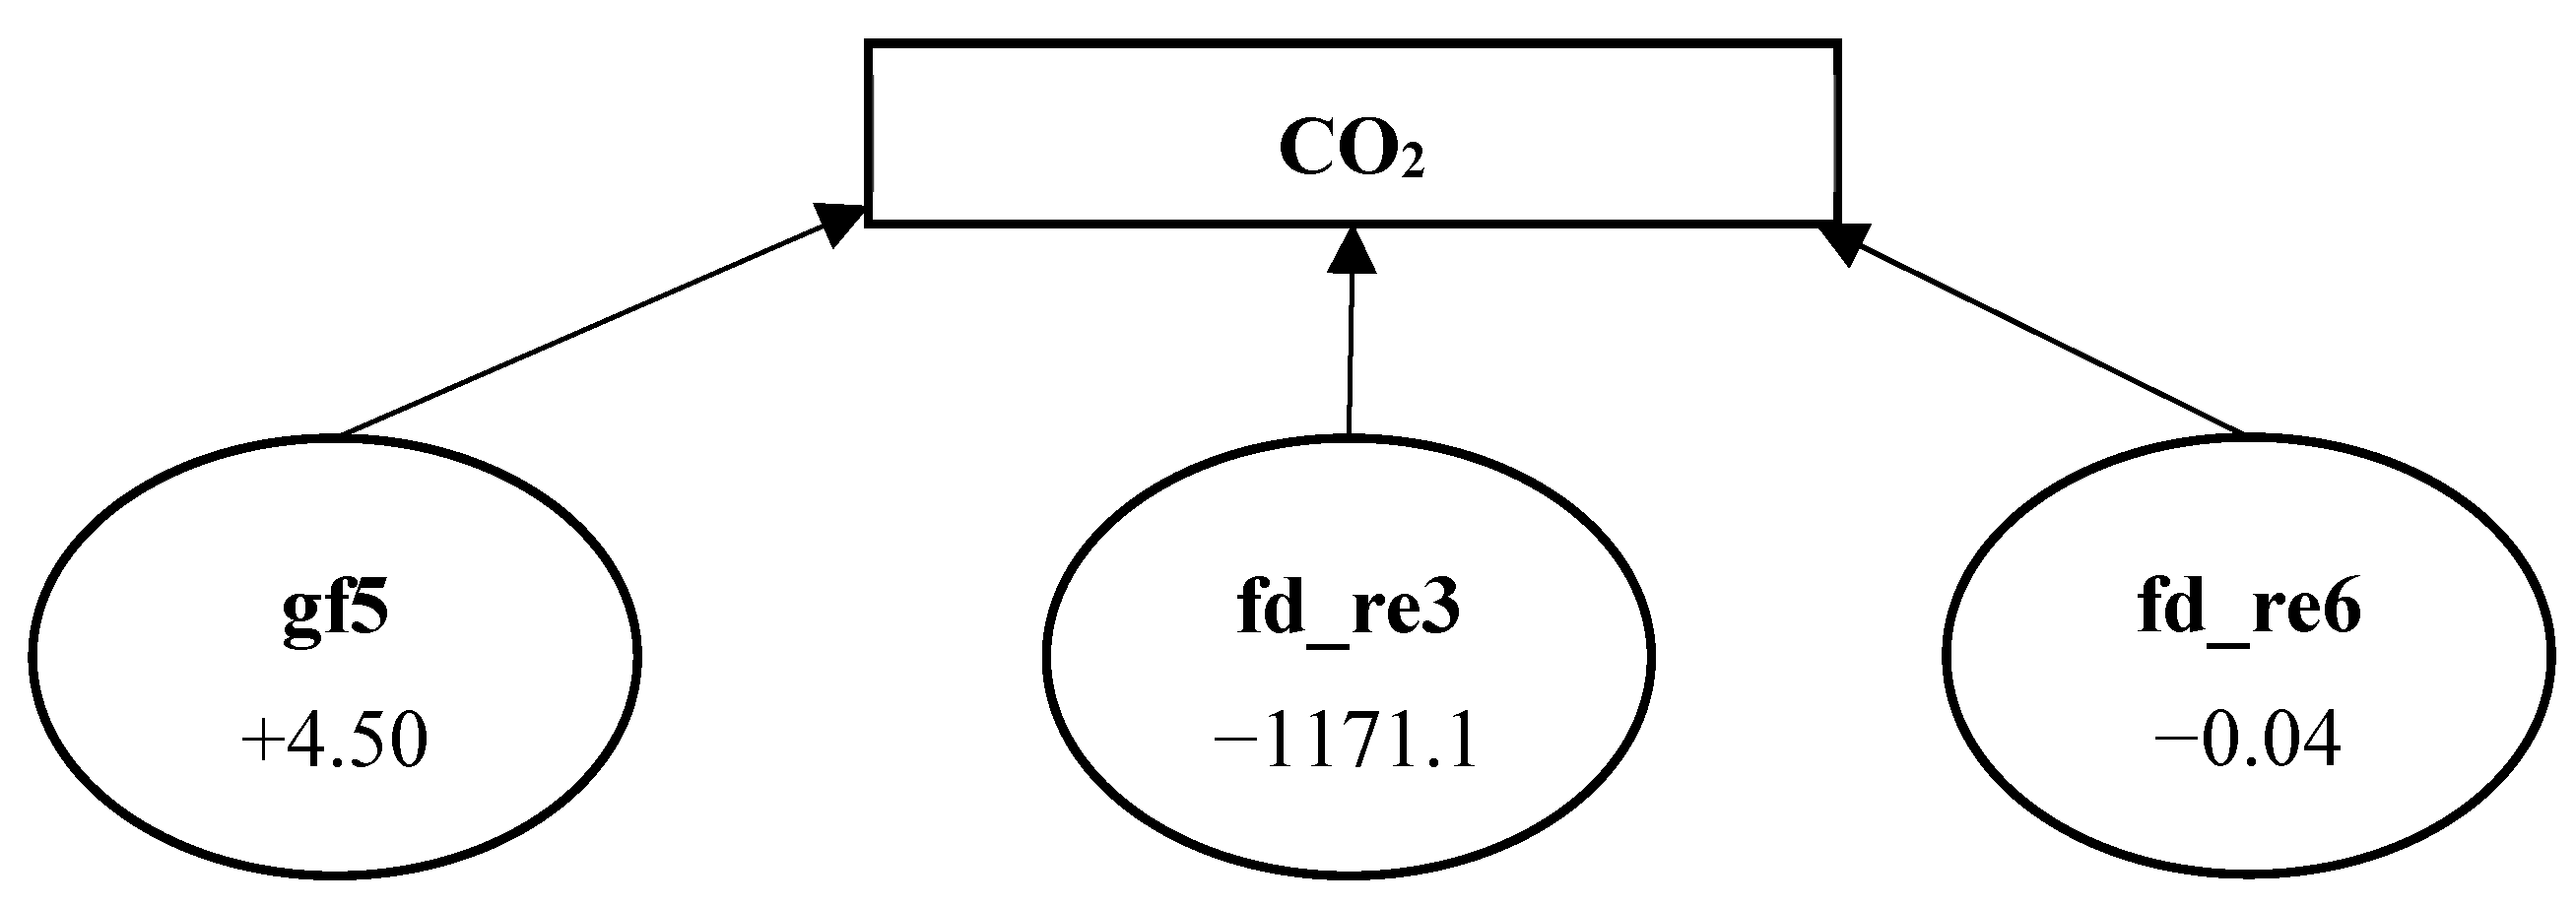
The regression equation for variable CO2 looks as follows (2):
CO 2 = 36054.86 + 4.50 gf 5 1171.17 fd _ re 3 0.04 fd _ re 6
where:
  • CO2—Carbon dioxide (CO2) emissions, kt;
  • gf5—Annual investment in off-grid renewable energy, USD million;
  • fd_re3—The first differences in off-grid capacity of renewable energy, MW;
  • fd_re6—The first differences in installed renewable energy-generating capacity in developing countries, watts per capita.
Figure 1 shows a graphical representation of Equation (2).
Thus, carbon dioxide emissions were found to be affected by off-grid renewable energy capacity and investment in off-grid renewable energy. Based on regression Equation (5), with an increase in off-grid renewable energy annual investments of USD 1 million, the growth of carbon dioxide emissions is 4.5 kt. With this, 1 MW growth of an absolute increase in off-grid renewable energy capacity gives us a 1171.17 kt reduction in carbon dioxide emissions. Therefore, according to the results of the regression analysis, there are conclusions that renewable energy and green investments affect carbon dioxide emissions.
As the next step, there is testing of the assumption that renewable energy and green investment variables affect nitrous oxide emissions. The results of the model evaluation, on the basis of the assumption testing, are presented in Table 5.
After analyzing the results of the model given in Table 5, there are the following conclusions:
The coefficient of determination R-squared is 0.939, and the adjusted coefficient of determination adjusted R-squared is 0.913. Therefore, the obtained model explains 91.3% of the change in the outcome variable, which is quite a high value.
The calculated value of the F-test (F(3,7) (df1 = 3, df2 = 11 − 3 − 1 = 7)) is 36.01, whereas the critical value is 4.3468. Therefore, the regression model is adequate with 95% confidence, as the calculated value is larger than the critical one.
The Durbin–Watson statistic is 1.725938, which testifies that the built model is stable.
The intercept is statistically significant as its p-value is less than 0.05.
A variable gf5 with a significance level (p-value) that is less than 0.05 is statistically significant. The Student’s coefficient also proves the statistical significance of this variable.
The significance level p-value for variables fd_re1 and fd_re3 is higher than 0.05, therefore these variables are statistically insignificant. This is also confirmed by the Student’s coefficient, which is less than the table value of 2.2.
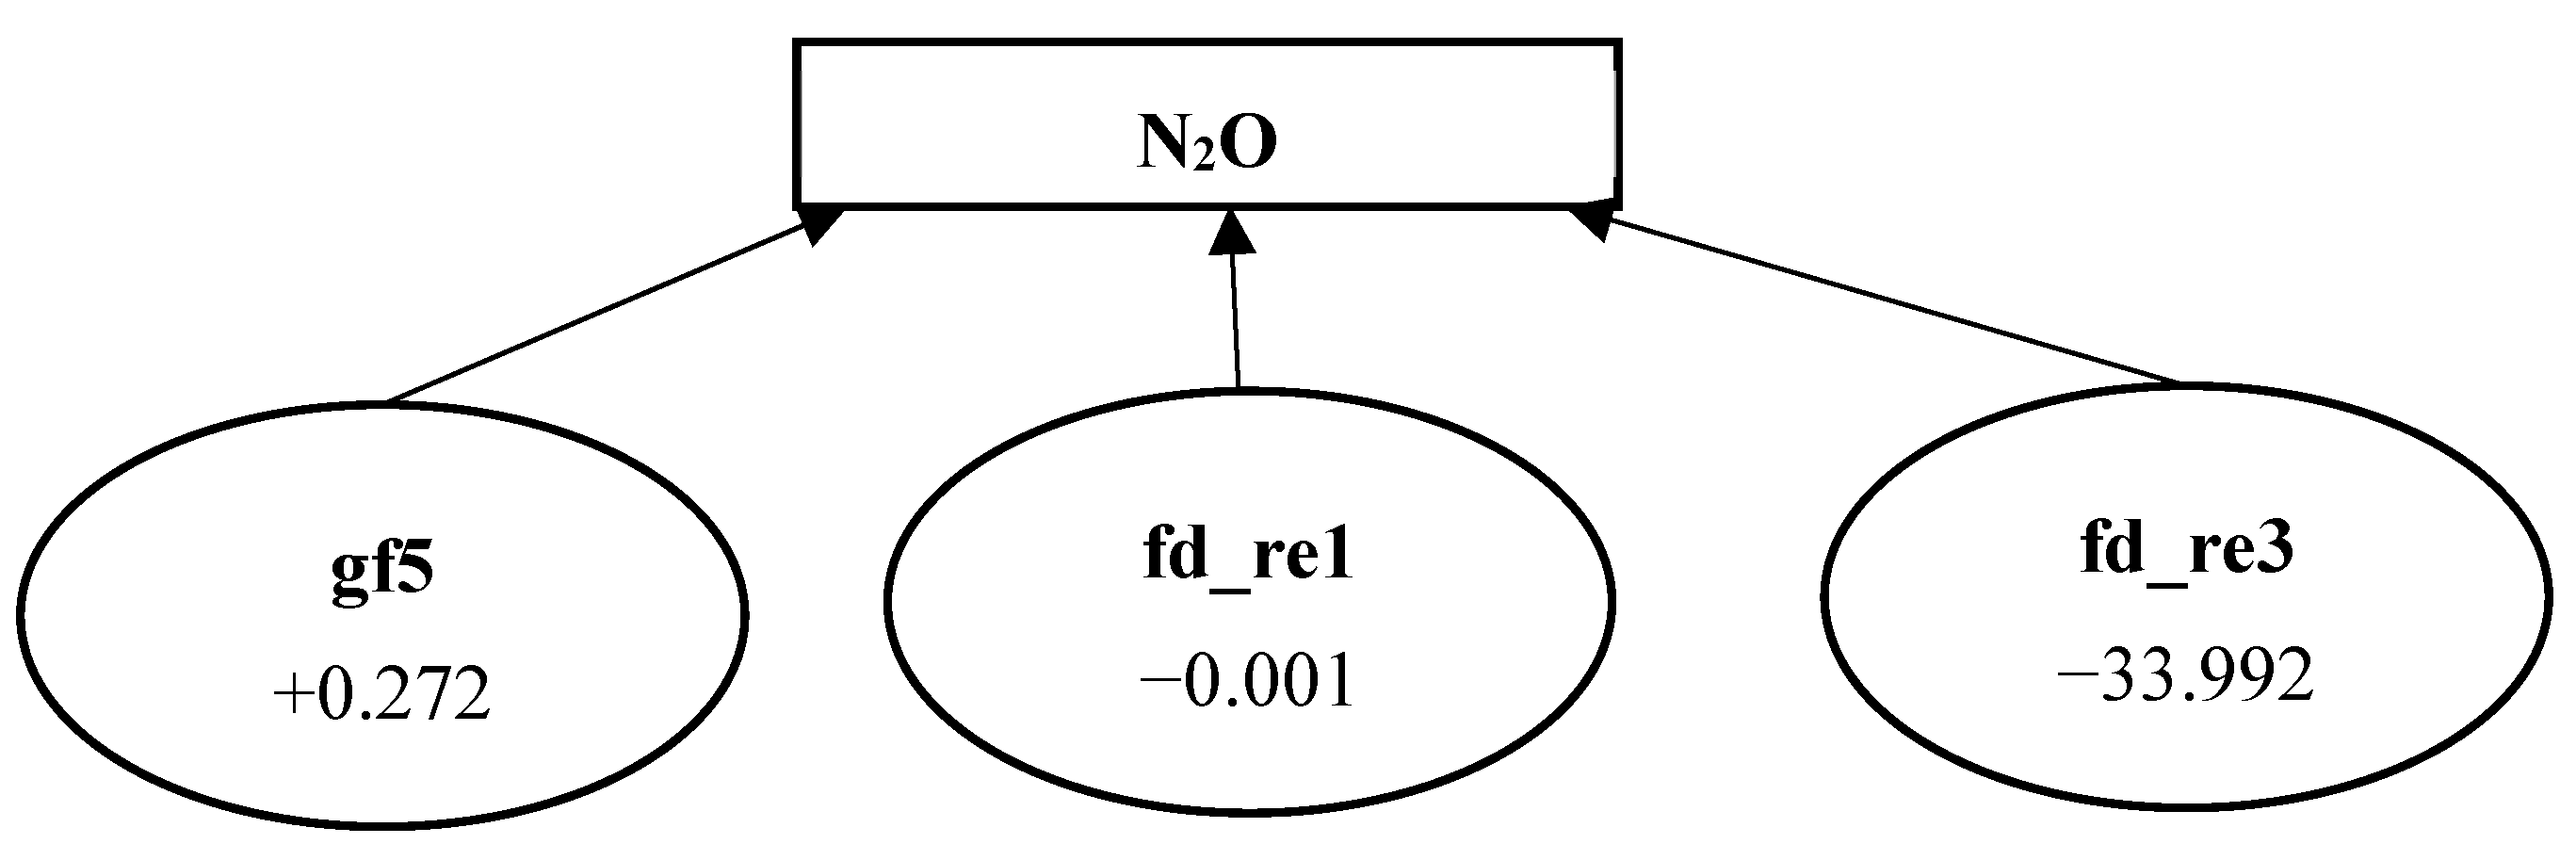
The regression equation for variable N2O is as follows (3):
N 2 O = 2674.182 + 0.272 gf 5 0.001 fd _ re 1 33.992 fd _ re 3
where:
  • N2O—Nitrous oxide (N2O) emissions, kt;
  • gf5—Annual investment in off-grid renewable energy, USD million;
  • fd_re1—The first differences in total capacity renewable energy, MW;
  • fd_re3—Off-grid capacity of renewable energy, MW.
Figure 2 demonstrates a graphical representation of Equation (3).
Thus, nitrous oxide emissions are found to be affected by investments in off-grid renewable energy. In particular, an increase in off-grid renewable energy annual investments of USD 1 million leads to an increase in nitrous oxide emissions of 0.272 kt. The impact of renewable energy variables appeared to be statistically insignificant. Therefore, the results of the regression analysis demonstrate that green investments negatively affect nitrous oxide emissions. The second assumption is partially confirmed.
Table 6 shows the results of the model evaluation, on the basis of which there is the assumption that renewable energy and green investment variables affect methane emissions.
After analyzing the data given in Table 6, there are conclusions:
The coefficient of determination R-squared is 0.905, and the adjusted coefficient of determination adjusted R-squared is 0.881. Therefore, the obtained model explains 88.1% of the change in the outcome variable, which is quite a high value.
The calculated value of the F-test (F(2,8) (df1 = 2, df2 = 11-2-1 = 8)) is 37.97, whereas the critical value is 4.46. As the calculated value is larger than the critical one, the regression model is adequate with 95% confidence.
The Durbin–Watson statistic is 0.9095813, which indicates that the built model is unstable. It has a positive autocorrelation with the residuals.
The intercept is statistically significant as its p-value is less than 0.05.
A variable gf3 has a significance level (p-value) that is less than 0.05 and is statistically significant. The Student’s coefficient also proves the statistical significance of this variable.
The significance level p-value for the fd_re6 variable is higher than 0.05. This makes the fd_re6 variable statistically insignificant. The Student’s coefficient, which is less than the table value of 2.2, also proves the statistical insignificance of this variable.
The regression equation for variable CH4 looks as follows (4):
CH 4 = 9646.657 + 129.530 gf 3 0.009 fd _ re 6
where:
  • CH4—Methane (CH4) emissions, kt;
  • gf3—Green economy market capitalization, USD million;
  • fd_re6—The first difference between installed renewable energy-generating capacity in developing countries, watts per capita.
Figure 3 shows a graphical representation of Equation (3).
Thus, the results of the regression analysis show that methane emissions are affected by green economy market capitalization. The increase in green economy market capitalization of USD 1 trillion leads to an increase in methane emissions of 129.53 kt. The impact of renewable energy variables appeared to be statistically insignificant. Hence, there is a conclusion that only green investments affect methane emissions. The third assumption is only partially confirmed.
In general, it appears that green investments do not lead to a decrease in greenhouse gas emissions, but on the contrary, in our case, they cause an emission rise. The reason for this may be the presence of a time lag.
To confirm or refute this hypothesis regarding the presence of a time lag between the volume of green investments and greenhouse gas emissions, it is necessary to build models with a distributed lag for the following pairs of variables: CH4 and gf3; N2O and gf5; CO2 and gf5. The simulation results are presented in Table 7, Table 8 and Table 9.
Given the obtained results, there is a lag of one year between all three pairs of variables (the p-value for all three models is less than 0.05 at the lag value of 1). Thus, the assumption about a time lag between the volume of green investments and greenhouse gas emissions is confirmed. This fact must be considered when forming an investment plan for green investments.
As a result of the identified lags, it is necessary to re-evaluate the parameters of the regression models of the dependence of CO2, N2O, and CH4 on the independent variables under study. Since the lag value for investment indicators is one year, it is necessary to build a new regression model with a new independent variable added, namely the values of the variables gf3 and gf5 shifted by one value (since the lag for these indicators corresponds to one year). As a result of such a procedure, the regression parameter near the lag variable is expected not to be statistically significant. Accordingly, the parameter near the initial variable should change its sign to the opposite and have a statistically significant value. The results of building regression models considering lag variables are presented in Table 10, Table 11 and Table 12.
As can be seen from the results in Table 10, Table 11 and Table 12, the new regression parameters near the variables gf3 and gf5, taking into account the lags, have changed their sign to the opposite, and now the influence of green investments contributes to the reduction of greenhouse gas emissions, namely:
With an increase in off-grid renewable energy annual investments of USD 1 million, the reduction of carbon dioxide emissions to 1.18 kt.
An increase in off-grid renewable energy annual investments of USD 1 million leads to a decrease in nitrous oxide emissions of 1.102 kt.
The increase in green economy market capitalization of USD 1 trillion leads to a decrease in methane emissions of 0.64 kt.

5. Discussion

The importance of the problem of greenhouse gas emissions is confirmed by the concern about this issue at the international level, as evidenced by the conclusion of various international documents, protocols, and agreements and the creation of international organizations dealing with climate change risk assessment. An important place among such organizations is the Intergovernmental Panel on Climate Change (IPCC) (an organ of the United Nations), which conducts regular assessments of the scientific basis of climate change and looks for options for adaptation and mitigation of the consequences of these changes. In addition, its goal is to provide governments at all levels with scientific information that they can use to develop climate policy. In 2023, the organization completed the sixth summary assessment report on climate change, which indicated that the planet could warm by 3.2 degrees Celsius by the end of the century. Even if all countries meet the conditions specified in the Paris Agreement, more than these efforts will be needed to limit the increase in temperature to 1.5 degrees Celsius. For such a limitation, it is necessary to reduce harmful emissions into the atmosphere by a factor of two by the mid-2030s [71].
The European Union (EU) is just a little behind in developing strategies and goals for climate action under the European Green Deal. In particular, the European Climate Law, which envisages the legal establishment of climate neutrality by 2050 in EU legislation, is currently under discussion. In 2020, the European Climate Pact aimed at involving society in climate action was adopted, and in 2021, the new EU strategy for adaptation to climate change was adopted. In addition, the EU plans to allocate 1.8 trillion euros to finance the European Green Deal, which aims to reduce net greenhouse gas emissions by 55% by 2030. Thus, the issue of climate change is highly relevant from the point of view of solving the problem of greenhouse gas emissions.
Researchers [42,43] have found that financing environmental projects is beneficial only in the long term. It is safe to say that countries nowadays are in a transition period from the use of traditional technologies, which lead to significant emissions of greenhouse gases, to implementing new processes and technologies designed to reduce such emissions. For example, in the process of such a transition, the increase in emissions may be associated with the construction of alternative power plants. In addition, such a transition period is characterized by a time gap between an investment and the final result of such an investment.
This research analyzes relationships at the global level, so the results may not coincide with the results of other works, as the latter were conducted based on the data from a separate country or several countries: for E7 economies [49], N-11 and BRICS countries [50], MINT economies [64], EU countries [72], and Asian countries [73]. Surely, the study of the issue at the microlevel gives more accurate results regarding the effectiveness of the influence of a certain phenomenon. Nevertheless, the given analysis, based on global trends, makes it possible to evaluate the overall benefits for the planet from the implementation (or non-implementation) of environmental innovations, taking into account the combined efforts of all countries.

6. Conclusions

The main purpose of this study was to identify general trends in the impact of renewable energy source development and green investments on CO2, N2O, and CH4 greenhouse gas emissions at the global level. The main sources of carbon dioxide emissions are power plants, the transport sector, and some types of industrial processes (production of steel, cement, etc.). Nitrous oxide emissions occur due to the use of fertilizers. Methane is released during the extraction and production of oil and gas, the use of coal, industrial processes and landfills, and agriculture (cattle breeding). For this research, there are 14 statistical variables that characterize greenhouse gases, renewable energy, and green investments for the period from 2011 to 2021. In accordance with the set purpose, using correlation-regression analysis, it was established that:
Green investments contribute to greenhouse gas emissions. In particular, an increase in off-grid renewable energy investments of USD 1 million leads to an increase in CO2 emissions of 4.5 kt and N2O emissions of 0.272 kt. At the same time, a USD 1 trillion increase in green economy market capitalization leads to an increase in methane emissions of 129,530 Mt.
The development of renewable energy leads to a reduction in carbon dioxide emissions, as 1 MW growth of an absolute increase in off-grid renewable energy capacity leads to a 1171.17 Mt decrease in CO2 emissions.
There is no statistically significant impact of renewable energy on N2O and CH4 emissions.
During the research, there was a time lag of one year between the level of green investments and the level of greenhouse gas emissions. The results of the regression models, taking into account the time lag, showed the following results: An increase in off-grid renewable energy annual investments of USD 1 million leads to a decrease in CO2 of 1.18 kt and N2O of 1.102 kt; an increase in green economy market capitalization of USD 1 trillion leads to a decrease in CH4 emissions of 0.64 kt.
Thus, the conscious choice of households and enterprises to abandon the use of traditional energy and independently switch to the use of energy from renewable sources should reduce the negative consequences of climate change caused by greenhouse gases. In general, research within a single country or several countries gives a narrowly focused evaluation of the impact of renewable energy and green investments. It may differ for each country and depend on a country’s contribution and its policy regarding the transition to energy-saving technologies, renewable energy development, and the number of green investments. On the contrary, the study of greenhouse gases at the global level makes it possible to assess the general trends of their emissions and the global influence of green energy and green investments.
This study has certain limitations that can be used to guide future research. Further research could examine the impact of renewable energy and green investments at the regional or country level. In addition, if the research period is increased, it is necessary to analyze the lag level between the impact of green investments and greenhouse gas emissions. Furthermore, the list of variables can be expanded by adding new factors of an economic, demographic, and energy nature. For now, the list of variables that would characterize green investments is very narrow, so in the future, when more data appears at the global and regional levels and the list of variables expands, further research in this direction will deserve development.

Author Contributions

Conceptualization, A.K., I.D., O.D. (Olena Dobrovolska) and A.A.; methodology, A.K., T.W., O.D. (Oleksandr Dluhopolskyi) and W.C.; software, A.K., I.D., W.C. and A.A.; validation, T.W. and W.C.; formal analysis, A.K., I.D., O.D. (Olena Dobrovolska) and A.A.; investigation, A.K., I.D., O.D. (Olena Dobrovolska) and A.A.; resources, T.W. and W.C.; data curation, W.C. and O.D. (Oleksandr Dluhopolskyi); writing—original draft preparation, A.K., I.D., O.D. (Olena Dobrovolska) and A.A.; writing—review and editing, A.K., O.D. (Oleksandr Dluhopolskyi), T.W., I.D., A.A., O.D. (Oleksandr Dluhopolskyi) and W.C.; visualization, A.K., I.D., T.W. and W.C.; supervision, A.K., I.D. and O.D. (Olena Dobrovolska); project administration, T.W. and W.C.; funding acquisition, T.W. and W.C. All authors have read and agreed to the published version of the manuscript.

Funding

This research received no external funding.

Data Availability Statement

Data are contained within the article.

Conflicts of Interest

The authors declare no conflicts of interest.

References

  1. United Nations. Resolution Adopted by the General Assembly on 25 September 2015, Transforming Our World: The 2030 Agenda for Sustainable Development, A/RES/70/1. 2015. Available online: https://sdgs.un.org/2030agenda (accessed on 16 January 2024).
  2. United Nations. United Nations Framework Convention on Climate Change, New York, 9 May 1992, FCC/INFORMAL/84/Rev.1. 1992. Available online: https://unfccc.int/sites/default/files/convention_text_with_annexes_english_for_posting.pdf (accessed on 16 January 2024).
  3. United Nations. Kyoto Protocol to the United Nations Framework Convention on Climate Change, Kyoto, 10 December 1997, FCCC/CP/1997/L.7/Add.1. 1997. Available online: https://unfccc.int/documents/2409 (accessed on 16 January 2024).
  4. United Nations. Paris Agreement to the United Nations Framework Convention on Climate Change, Paris, 12 December 2015. 2015. Available online: https://unfccc.int/files/essential_background/convention/application/pdf/english_paris_agreement.pdf (accessed on 16 January 2024).
  5. Antequera, P.D.; Pacheco, J.D.; Díez, A.L.; Herrera, C.B. Tourism, Transport and Climate Change: The Carbon Footprint of International Air Traffic on Islands. Sustainability 2021, 13, 1795. [Google Scholar] [CrossRef]
  6. IEA. Greenhouse Gas Emissions from Energy Data Explorer; International Energy Agency (IEA): Paris, France, 2021; Available online: https://www.iea.org/data-and-statistics/data-tools/greenhouse-gas-emissions-from-energy-data-explorer (accessed on 16 January 2024).
  7. Waheed, R.; Chang, D.; Sarwar, S.; Chen, W. Forest, agriculture, renewable energy, and CO2 emission. J. Clean. Prod. 2018, 172, 4231–4238. [Google Scholar] [CrossRef]
  8. ICMA. Sustainable Finance: High-Level Definitions; International Capital Market Association (ICMA): Zurich, Switzerland, 2020; Available online: https://www.icmagroup.org/assets/documents/Regulatory/Green-Bonds/Sustainable-Finance-High-Level-Definitions-May-2020-051020.pdf (accessed on 16 January 2024).
  9. Artyukhova, N.; Tiutiunyk, I.; Bogacki, S.; Wołowiec, T.; Dluhopolskyi, O.; Kovalenko, Y. Scenario modeling of energy policies for sustainable development. Energies 2022, 15, 7711. [Google Scholar] [CrossRef]
  10. Samusevych, Y.; Vysochyna, A.; Vasylieva, T.; Lyeonov, S.; Pokhylko, S. Environmental, energy and economic security: Assessment and interaction. E3S Web Conf. 2021, 234, 00012. [Google Scholar] [CrossRef]
  11. Sotnyk, I.; Kurbatova, T.; Kubatko, O.; Prokopenko, O.; Prause, G.; Kovalenko, Y.; Trypolska, G.; Pysmenna, U. Energy security assessment of emerging economies under global and local challenges. Energies 2021, 14, 5860. [Google Scholar] [CrossRef]
  12. Wołowiec, T.; Kolosok, S.; Vasylieva, T.; Artyukhov, A.; Skowron, Ł.; Dluhopolskyi, O.; Sergiienko, L. Sustainable governance, energy security, and energy losses of Europe in turbulent times. Energies 2022, 15, 8857. [Google Scholar] [CrossRef]
  13. Kryshtanovych, M.; Dragan, I.; Grytsyshen, D.; Sergiienko, L.; Baranovska, T. The public and environmental aspect of restoring sustainable regional development in the face of the negative impact of military actions on the territory of the country. Int. J. Sustain. Dev. Plan. 2022, 17, 1645–1651. [Google Scholar] [CrossRef]
  14. Lahouirich, M.W.; El Amri, A.; Oulfarsi, S.; Sahib Eddine, A.; El Bayed Sakalli, H.; Boutti, R. From financial performance to sustainable development: A great evolution and an endless debate. Financ. Mark. Inst. Risks 2022, 6, 68–79. [Google Scholar] [CrossRef]
  15. Polyakov, M.; Khanin, I.; Bilozubenko, V.; Korneyev, M.; Shevchenko, G. Factors of uneven progress of the European Union countries towards a circular economy. Probl. Perspect. Manag. 2021, 19, 332–344. [Google Scholar] [CrossRef]
  16. Ievdokymov, V.; Oliinyk, O.; Ksendzuk, V.; Sergiienko, L. Circular economy as an alternative environment oriented economic concept for ukraine. Ekonomista 2018, 347–362. Available online: https://ekonomista.pte.pl/Circular-Economy-as-an-Alternative-Environment-Oriented-Economic-Concept-for-Ukraine,155532,0,2.html (accessed on 16 January 2024).
  17. Alam, A.; Tri Ratnasari, R.T.; Latifathul Jannah, I.; El Ashfahany, A. Development and evaluation of Islamic green financing: A systematic review of green sukuk. Environ. Econ. 2023, 14, 61–72. [Google Scholar] [CrossRef]
  18. Sotnyk, I.; Kurbatova, T.; Trypolska, G.; Sokhan, I.; Koshel, V. Research trends on development of energy efficiency and renewable energy in households: A bibliometric analysis. Environ. Econ. 2023, 14, 13–27. [Google Scholar] [CrossRef]
  19. Tran, Q.H. The impact of green finance, economic growth and energy usage on CO2 emission in Vietnam—A multivariate time series analysis. China Financ. Rev. Int. 2022, 12, 280–296. [Google Scholar] [CrossRef]
  20. Wang, J.; Ma, Y. How Does Green Finance Affect CO2 Emissions? Heterogeneous and Mediation Effects Analysis. Front. Environ. Sci. 2022, 10, 931086. [Google Scholar] [CrossRef]
  21. Zhong, W.; Zong, L.; Yin, W.; Ali, S.A.; Mouneer, S.; Haider, J. Assessing the nexus between green economic recovery, green finance, and CO2 emission: Role of supply chain performance and economic growth. Front. Environ. Sci. 2022, 10, 914419. [Google Scholar] [CrossRef]
  22. Koilo, V. Energy efficiency and green solutions in sustainable development: Evidence from the Norwegian maritime industry. Probl. Perspect. Manag. 2020, 18, 289–302. [Google Scholar] [CrossRef]
  23. Ip, Y.; Iqbal, W.; Du, L.; Akhtar, N. Assessing the impact of green finance and urbanization on the tourism industry—An empirical study in China. Environ. Sci. Pollut. Res. 2023, 30, 3576–3592. [Google Scholar] [CrossRef]
  24. Roskladka, A.; Roskladka, N.; Dluhopolskyi, O.; Kharlamova, G.; Kiziloglu, M. Data analysis and forecasting of tourism development in Ukraine. Innov. Mark. 2018, 14, 19–33. [Google Scholar] [CrossRef]
  25. Letunovska, N.; Saher, L.; Vasylieva, T.; Lieonov, S. Dependence of public health on energy consumption: A cross-regional analysis. E3S Web Conf. 2021, 250, 04014. [Google Scholar] [CrossRef]
  26. Dluhopolskyi, O.; Brych, V.; Borysiak, O.; Fedirko, M.; Dziubanovska, N.; Halysh, N. Modeling the environmental and economic effect of value added created in the energy service market. Polityka Energetyczna Energy Policy J. 2021, 24, 153–164. [Google Scholar] [CrossRef]
  27. Matvieieva, Y.; Hamida, H.B. Modelling and Forecasting Energy Efficiency Impact on the Human Health. Health Econ. Manag. Rev. 2022, 3, 78–85. [Google Scholar] [CrossRef]
  28. Vakulenko, I.; Lieonov, H. Renewable Energy and Health: Bibliometric Review of Non-Medical Research. Health Econ. Manag. Rev. 2022, 3, 44–53. [Google Scholar] [CrossRef]
  29. Matvieieva, Y.; Sulym, V.; Rosokhata, A.; Jasnikowski, A. Influence of Waste Incineration and Obtaining Energy from it to the Public Health for Certain Territories: A Bibliometric and Substantive Study. Health Econ. Manag. Rev. 2023, 4, 71–80. [Google Scholar] [CrossRef]
  30. Kolosok, S.; Vasylieva, T.; Lyeonov, S. Machine analysis of the UK electrical energy initiatives based on the e-petitions to the UK government and parliament. CEUR Workshop Proc. 2021, 2870, 1562–1573. Available online: http://ceur-ws.org (accessed on 16 January 2024).
  31. Babenko, V.; Rayevnyeva, O.; Zherlitsyn, D.; Dovgal, O.; Natalia, G.; Tetyana, M. Dynamics of forecasting the development of renewable energy technologies in Ukraine and Chile. Int. J. Ind. Eng. Prod. Res. 2020, 31, 587–596. [Google Scholar] [CrossRef]
  32. Bilan, Y.; Samusevych, Y.; Lyeonov, S.; Strzelec, M.; Tenytska, I. The keys to clean energy technology: Impact of environmental taxes on biofuel production and consumption. Energies 2022, 15, 9470. [Google Scholar] [CrossRef]
  33. Tu, Y.-X.; Kubatko, O.; Piven, V.; Sotnyk, I.; Kurbatova, T. Determinants of renewable energy development: Evidence from the EU countries. Energies 2022, 15, 7093. [Google Scholar] [CrossRef]
  34. Samusevych, Y.; Lyeonov, S.; Artyukhov, A.; Martyniuk, V.; Tenytska, I.; Wyrwisz, J.; Wojciechowska, K. Optimal design of transport tax on the way to national security: Balancing environmental footprint, energy efficiency and economic growth. Sustainability 2023, 15, 831. [Google Scholar] [CrossRef]
  35. Dave, H. The Constitution of Value. Financ. Mark. Inst. Risks 2022, 6, 75–90. [Google Scholar] [CrossRef]
  36. Fasoranti, M.M.; Alimi, R.S.; Chris, C.; Ofonyelu, C.C. Effect of prepaid meters on the household expenditure on electricity consumption in Ondo state. Socioecon. Chall. 2022, 6, 86–96. [Google Scholar] [CrossRef]
  37. Čeryová, D.; Bullová, T.; Adamičková, I.; Turčeková, N.; Bielik, P. Potential of investments into renewable energy sources. Probl. Perspect. Manag. 2020, 18, 57–63. [Google Scholar] [CrossRef]
  38. Kolosok, S.; Saher, L.; Kovalenko, Y.; Delibasic, M. Renewable Energy and Energy Innovations: Examining Relationships Using Markov Switching Regression Model. Mark. Manag. Innov. 2022, 2, 151–160. [Google Scholar] [CrossRef]
  39. Chygryn, O.; Bektas, C.; Havrylenko, O. Innovation and Management of Smart Transformation Global Energy Sector: Systematic Literature Review. Bus. Ethics Leadersh. 2023, 7, 105–112. [Google Scholar] [CrossRef]
  40. Khalatur, S.; Dubovych, O. Financial Engineering of Green Finance as an Element of Environmental Innovation Management. Mark. Manag. Innov. 2022, 1, 232–246. [Google Scholar] [CrossRef]
  41. Sedmíková, E.; Vasylieva, T.; Tiutiunyk, I.; Navickas, M. Energy consumption in assessment of shadow economy. Eur. J. Interdiscip. Stud. 2021, 13, 47–64. [Google Scholar] [CrossRef]
  42. Ahmed, N.; Areche, F.O.; Sheikh, A.A.; Lahiani, A. Green finance and green energy nexus in ASEAN countries: A bootstrap panel causality test. Energies 2022, 15, 5068. [Google Scholar] [CrossRef]
  43. Rasoulinezhad, E.; Taghizadeh-Hesary, F. Role of green finance in improving energy efficiency and renewable energy development. Energy Effic. 2022, 15, 14. [Google Scholar] [CrossRef]
  44. Piluso, N. Why should the carbon tax be floating? A Tobin’s Q model applied to green investment. Environ. Econ. 2023, 14, 81–90. [Google Scholar] [CrossRef]
  45. Piluso, N.; Le Heron, E. The macroeconomic effects of climate policy: A Keynesian point of view. Environ. Econ. 2022, 13, 16–27. [Google Scholar] [CrossRef]
  46. Xu, N.; Kasimov, I.; Wang, Y. Unlocking private investment as a new determinant of green finance for renewable development in China. Renew. Energy 2022, 198, 1121–1130. [Google Scholar] [CrossRef]
  47. Wei, X.; Mohsin, M.; Zhang, Q. Role of foreign direct investment and economic growth in renewable energy development. Renew. Energy 2022, 192, 828–837. [Google Scholar] [CrossRef]
  48. Skowron, Ł.; Chygryn, O.; Gąsior, M.; Koibichuk, V.; Lyeonov, S.; Drozd, S.; Dluhopolskyi, O. Interconnection between the Dynamic of Growing Renewable Energy Production and the Level of CO2 Emissions: A Multistage Approach for Modeling. Sustainability 2023, 15, 9473. [Google Scholar] [CrossRef]
  49. Cao, L. How green finance reduces CO2 emissions for green economic recovery: Empirical evidence from E7 economies. Environ. Sci. Pollut. Res. 2023, 30, 3307–3320. [Google Scholar] [CrossRef]
  50. Nawaz, M.A.; Seshadri, U.; Kumar, P.; Aqdas, R.; Patwary, A.K.; Riaz, M. Nexus between green finance and climate change mitigation in N-11 and BRICS countries: Empirical estimation through difference in differences (DID) approach. Environ. Sci. Pollut. Res. 2021, 28, 6504–6519. [Google Scholar] [CrossRef]
  51. Wołowiec, T.; Myroshnychenko, I.; Vakulenko, I.; Bogacki, S.; Wiśniewska, A.M.; Kolosok, S.; Yunger, V. International impact of COVID-19 on energy economics and environmental pollution: A scoping review. Energies 2022, 15, 8407. [Google Scholar] [CrossRef]
  52. Fadel, S.; Rouaski, K.; Zakane, A.; Djerboua, A. Estimating Climate Influence of the Potential COVID-19 Pandemic Spreading in Algeria. Socioecon. Chall. 2022, 6, 24–40. [Google Scholar] [CrossRef]
  53. Vysochyna, A.; Vasylieva, T.; Dluhopolskyi, O.; Marczuk, M.; Grytsyshen, D.; Yunger, V.; Sulimierska, A. Impact of Coronavirus Disease COVID-19 on the Relationship between Healthcare Expenditures and Sustainable Economic Growth. Int. J. Environ. Res. Public Health 2023, 20, 3049. [Google Scholar] [CrossRef]
  54. Starchenko, L.; Lyeonov, S.; Vasylieva, T.; Pimonenko, T.; Lyulyov, O. Environmental management and green brand for sustainable entrepreneurship. E3S Web Conf. 2021, 234, 00015. [Google Scholar] [CrossRef]
  55. Habib, A.M. Does the efficiency of working capital management and environmental, social, and governance performance affect a firm’s value? Evidence from the United States. Financ. Mark. Inst. Risks 2022, 6, 18–25. [Google Scholar] [CrossRef]
  56. Kuzior, A.; Staszek, M. Energy management in the railway industry: A case study of rail freight carrier in Poland. Energies 2021, 14, 6875. [Google Scholar] [CrossRef]
  57. Oe, H.; Yamaoka, Y.; Duda, K. How to Sustain Businesses in the Post-COVID-19 Era: A Focus on Innovation, Sustainability and Leadership. Bus. Ethics Leadersh. 2022, 6, 1–9. [Google Scholar] [CrossRef]
  58. Bardy, R.; Rubens, A. Weighing Externalities of Economic Recovery Projects: An Alternative to Green Taxonomies that is Fairer and more Realistic. Bus. Ethics Leadersh. 2022, 6, 23–34. [Google Scholar] [CrossRef]
  59. Makarenko, I.; Bilan, Y.; Streimikiene, D.; Rybina, L. Investments support for Sustainable Development Goal 7: Research gaps in the context of post-COVID-19 recovery. Invest. Manag. Financ. Innov. 2023, 20, 151–173. [Google Scholar] [CrossRef]
  60. Oussama, M.H.Z.; Ibtissem, G. The role of economic diplomacy in the promotion of non-hydrocarbon exports in Algeria. Socioecon. Chall. 2022, 6, 97–105. [Google Scholar] [CrossRef]
  61. Aliyeva, A. Post-Oil Period in Azerbaijan: Economic Transformations, Anti-Inflation Policy and Innovations Management. Mark. Manag. Innov. 2022, 2, 268–283. [Google Scholar] [CrossRef]
  62. Khan, S.; Akbar, A.; Nasim, I.; Hedvičáková, M.; Bashir, F. Green finance development and environmental sustainability: A panel data analysis. Front. Environ. Sci. 2022, 10, 1039705. [Google Scholar] [CrossRef]
  63. Lu, Q.; Farooq, M.U.; Ma, X.; Iram, R. Assessing the combining role of public-private investment as a green finance and renewable energy in carbon neutrality target. Renew. Energy 2022, 196, 1357–1365. [Google Scholar] [CrossRef]
  64. Li, C.; Sampene, A.K.; Agyeman, F.O.; Brenya, R.; Wiredu, J. The role of green finance and energy innovation in neutralizing environmental pollution: Empirical evidence from the MINT economies. J. Environ. Manag. 2022, 317, 115500. [Google Scholar] [CrossRef]
  65. Kuzior, A.; Sira, M.; Brozek, P. Using blockchain and artificial intelligence in energy management as a tool to achieve energy efficiency. Virtual Econ. 2022, 5, 69–90. [Google Scholar] [CrossRef]
  66. Jones, M.W.; Peters, G.P.; Gasser, T.; Andrew, R.M.; Schwingshackl, C.; Gütschow, J.; Houghton, R.A.; Friedlingstein, P.; Pongratz, J.; Le Quéré, C. Our World in Data. National contributions to climate change due to historical emissions of carbon dioxide, methane, and nitrous oxide since 1850. Sci. Data 2023, 10, 1–23. [Google Scholar] [CrossRef]
  67. Friedlingstein, P.; O’Sullivan, M.; Jones, M.W.; Andrew, R.M.; Gregor, L.; Hauck, J.; Le Quéré, C.; Luijkx, I.T.; Olsen, A.; Peters, G.P.; et al. Global Carbon Budget 2022. Earth Syst. Sci. Data 2022, 14, 4811–4900. [Google Scholar] [CrossRef]
  68. IRENA. Statistical Yearbooks. International Renewable Energy Agency (IRENA). 2023. Available online: https://www.irena.org/Data/Statistical-publications/Yearbooks (accessed on 16 January 2024).
  69. Naran, B.; Connolly, J.; Rosane, P.; Wignarajah, D.; Wakaba, E.; Buchner, B. Climate Policy Initiative 2022. Global Landscape of Climate Finance: A Decade of Data 2011–2020. Available online: https://www.climatepolicyinitiative.org/wp-content/uploads/2022/10/Global-Landscape-of-Climate-Finance-A-Decade-of-Data.pdf (accessed on 16 January 2024).
  70. FTSE Russell. Investing in the Green Economy 2022. Available online: https://content.ftserussell.com/sites/default/files/investing_in_the_green_economy_2022_final_8.pdf (accessed on 16 January 2024).
  71. IPCC. Sections. In Climate Change 2023: Synthesis Report. Contribution of Working Groups I, II and III to the Sixth Assessment Report of the Intergovernmental Panel on Climate Change; Core Writing Team, Lee, H., Romero, J., Eds.; IPCC: Geneva, Switzerland, 2023; pp. 35–115. [Google Scholar] [CrossRef]
  72. Kuzior, A.; Vakulenko, I.; Kolosok, S.; Saher, L.; Lyeonov, S. Managing the EU energy crisis and greenhouse gas emissions: Seasonal ARIMA forecast. Probl. Perspect. Manag. 2023, 21, 383–399. [Google Scholar] [CrossRef]
  73. International Renewable Energy Agency (IRENA); Climate Policy Initiative (CPI). Global Landscape of Renewable Energy Finance; International Renewable Energy Agency: Abu Dhabi, United Arab Emirates, 2023; Available online: https://www.climatepolicyinitiative.org/wp-content/uploads/2023/02/Global-Landscape-of-Renewable-Energy-Finance-2023.pdf (accessed on 16 January 2024).
Figure 1. Graphical representation of the functional dependency of carbon dioxide on green investments and renewable energy development. CO2—Carbon dioxide (CO2) emissions, kt; gf5—Annual investment in off-grid renewable energy, USD million; fd_re3—The first differences in off-grid capacity of renewable energy, MW; fd_re6—The first differences in installed renewable energy-generating capacity in developing countries, watts per capita. Source: Authors’ results.
Energies 17 00804 g001
Figure 2. Graphical representation of the functional dependency of nitrous oxide on green investments and renewable energy development. N2O—Nitrous oxide (N2O) emissions, kt; gf5—Annual investment in off-grid renewable energy, USD million; fd_re1—The first differences in total capacity renewable energy, MW; fd_re3—Off-grid capacity of renewable energy, MW. Source: Authors’ results.
Energies 17 00804 g002
Figure 3. Graphical representation of the functional dependency of methane on green investments and renewable energy development. CH4—Methane (CH4) emissions, kt; gf3—Green economy market capitalization, USD million; fd_re6—The first differences in installed renewable energy-generating capacity in developing countries, watts per capita. Source: Authors’ results.
Energies 17 00804 g003
Table 1. Definitions of the selected variables.
Designation of the VariableType of the VariableVariableUnitsSource
CO2dependentCarbon dioxide (CO2) emissionsktOur World in Data, 2022
N2OdependentNitrous oxide (N2O) emissionsktOur World in Data, 2023
CH4dependentMethane (CH4) emissionsktOur World in Data, 2023
re1independentTotal capacity for renewable energy MWIRENA, 2023
re2independentTotal production of renewable energy GWhIRENA, 2023
re3independentOff-grid capacity for renewable energy MWIRENA, 2023
re4independentRenewable energy share of electricity capacity%MWIRENA, 2023
re5independentRenewable energy share of electricity production %GWhIRENA, 2023
re6independentInstalled renewable energy-generating capacity in developing countrieswatts per capitaIRENA, 2023
gf1independentPublic renewable energy finance flowUSD millionIRENA, 2023
gf2independentInternational financial flows to developing countries in support of clean energy research and development and renewable energy production, including in hybrid systemsUSD millionIRENA, 2023
gf3independentGreen economy market capitalizationUSD trillionFTSE Russell, 2023
gf4independentTotal global climate finance flowUSD billionCPI, 2022
gf5independentAnnual investment in off-grid renewable energyUSD millionIRENA and CPI, 2023
Source: Based on [61,62,63,64,65].
Table 2. Correlation matrix of initial data.
VarCO2N2OCH4re1re2re3re4re5re6gf1gf2gf3gf4gf5
CO21.0000.7600.7910.7490.7580.7840.7490.7190.750−0.0540.2620.6100.7380.806
N2O 1.0000.9880.9870.9850.9580.9860.9820.987−0.1800.1810.9430.9680.946
CH4 1.0000.9920.9930.9810.9910.9860.993−0.2670.1040.9310.9600.943
re1 1.0000.9990.9850.9990.9971.000−0.2890.1040.9480.9530.944
re2 1.0000.9870.9990.9970.999−0.2780.1160.9400.9480.943
re3 1.0000.9860.9790.986−0.2980.0990.8920.9260.952
re4 1.0000.9970.999−0.2670.1300.9390.9550.951
re5 1.0000.997−0.3070.0830.9570.9390.927
re6 1.000−0.2800.1120.9460.9540.945
gf1 1.000.87−0.41−0.13−0.07
gf2 1.000−0.060.2270.312
gf3 1.0000.8820.813
gf4 1.0000.959
gf5 1.000
Source: Authors’ results.
Table 3. Correlation matrix, including the first differences.
VarCO2N2OCH4fd_re1fd_re2fd_re3fd_re4fd_re5fd_re6gf3gf4gf5
CO21.0000.7600.7910.1380.3210.273−0.1750.406−0.5340.6100.7380.806
N2O 1.0000.9880.5890.0910.7740.3460.887−0.2710.9430.9680.946
CH4 1.0000.5670.1500.7700.3610.858−0.3970.9310.9600.943
fd_re1 1.0000.0260.5830.8200.6960.1260.6620.5250.453
fd_re2 1.000−0.219−0.1790.047−0.4960.009−0.0160.140
fd_re3 1.0000.6430.884−0.1510.8550.7610.681
fd_re4 1.0000.5570.1190.5040.3320.203
fd_re5 1.000−0.0940.8970.8480.783
fd_re6 1.000−0.224−0.281−0.327
gf3 1.0000.8820.813
gf4 1.0000.959
gf5 1.000
Source: Authors’ results.
Table 4. Multivariate linear regression for carbon dioxide (CO2).
Multiple R0.924206365
Multiple R-squared0.854157405
Adjusted R-squared0.791653436
F(3,7)13.66565061
P0.002596735
Std. Err. of Estimate397.7949549
Durbin–Watson d2.166173
Variableb *Std. Err.bStd. Err.t(7)p-value
Intercept 36,054.86501.497171.894450.000000
gf51.0464390.2072704.500.89235.048670.001482
fd_re3−0.4801100.198153−1171.17483.3709−2.422920.045895
fd_re6−0.2647460.153562−0.040.0233−1.724040.128360
F-test (df1, df2)—Fisher’s test with degrees of freedom (i.e., df1 and df2) is a statistical test for assessing the significance of differences in the variances of two random samples; df1 = m (m—number of independent variables); df2—n-m-1 (n—number of years); t-test (df)—Student’s t-test with degrees of freedom df of statistical hypothesis testing methods (statistical criteria) based on comparison with the Student’s distribution for checking the equality of mean values in two samples; df = m-N (N—number of samples). gf5—Annual investment in off-grid renewable energy, USD million; fd_re3—The first differences in off-grid capacity of renewable energy, MW; fd_re6—The first differences in installed renewable energy-generating capacity in developing countries, watts per capita. * means standardized regression coefficients. Source: Authors’ results.
Table 5. Multivariate linear regression for nitrous oxide (N2O).
Multiple R0.969094252
Multiple R-squared0.93914367
Adjusted R-squared0.913062385
F(3,7)36.00833666
p0.000126344
Std. Err. of Estimate21.19644855
Durbin–Watson d1.725938
Variableb *Std. Err.BStd. Err.t(7)p-value
Intercept 2674.18232.1221483.250420.000000
gf50.7659170.1278920.2720.045425.988790.000548
fd_re10.1428450.1153030.0010.000101.238860.255325
fd_re30.1689310.14033233.99228.237571.203800.267790
F-test (df1, df2)—Fisher’s test with degrees of freedom (i.e., df1 and df2) is a statistical test for assessing the significance of differences in the variances of two random samples; df1 = m (m—number of independent variables); df2—n-m-1 (n—number of years); t-test (df)—Student’s t-test with degrees of freedom df of statistical hypothesis testing methods (statistical criteria) based on comparison with the Student’s distribution for checking the equality of mean values in two samples, df = m-N (N—number of samples). Gf5—Annual investment in off-grid renewable energy, USD million; fd_re1—The first differences in total capacity renewable energy, MW; fd_re3—Off-grid capacity of renewable energy, MW. * means standardized regression coefficients. Source: Authors’ results.
Table 6. Multivariate linear regression for methane (CH4).
Multiple R0.951152316
Multiple R-squared0.904690728
Adjusted R-squared0.88086341
F(2,8)37.96863434
p8.25165 × 105
Std. Err. of Estimate91.93346321
Durbin–Watson d0.9095813
Variableb *Std. Err.bStd. Err.t(8)p-value
Intercept 9646.65759.66288161.68610.000000
gf30.8867640.111993129.53016.358777.91810.000047
fd_re6−0.1986500.111993−0.0090.00520−1.77380.114028
F-test (df1, df2)—Fisher’s test with degrees of freedom (i.e., df1 and df2) is a statistical test for assessing the significance of differences in the variances of two random samples; df1 = m (m—number of independent variables); df2—n-m-1 (n—number of years); t-test (df)—Student’s t-test with degrees of freedom df of statistical hypothesis testing methods (statistical criteria) based on comparison with the Student’s distribution for checking the equality of mean values in two samples; df = m-N (N—number of samples). gf3—Green economy market capitalization, USD million; fd_re6—The first differences in installed renewable energy-generating capacity in developing countries, watts per capita. * means standardized regression coefficients. Source: Authors’ results.
Table 7. Results of the distributed lag model for a pair of variables CH4 and gf3.
LagRegression Coeff.Standard Errort-Testp-Value
0802.331785.721.810.08
1−2296.021149.99−4.000.01
2−340.342205.68−0.150.89
31086.832269.130.480.68
43534.502045.821.730.23
Lag—Lag value; Regression Coeff.—Regression coefficient at the lag value; Standard Error—The standard error of the regression coefficient; t-test—Student’s t-test of statistical hypothesis testing methods (statistical criteria) based on comparison with the Student’s distribution for checking the equality of mean values in two samples; p-value—probability of error. Source: Authors’ results.
Table 8. Results of the distributed lag model for a pair of variables N2O and gf5.
LagRegression Coeff.Standard Errort-Testp-Value
07.992.323.440.07
1−12.634.89−2.980.04
2−2.949.67−0.300.78
3−4.4812.86−0.350.74
40.078.430.010.99
Lag—Lag value; Regression Coeff.—Regression coefficient at the lag value; Standard Error—The standard error of the regression coefficient; t-test—Student’s t-test of statistical hypothesis testing methods (statistical criteria) based on comparison with the Student’s distribution for checking the equality of mean values in two samples; p-value—Probability of error. Source: Authors’ results.
Table 9. Results of the distributed lag model for a pair of variables CO2 and gf5.
LagRegression Coeff.Standard Errort-Testp-Value
084.8117.941.740.06
1−104.8726.59−3.940.03
263.1051.961.210.35
3−131.3861.52−2.140.17
451.9163.260.820.50
Lag—Lag value; Regression Coeff.—Regression coefficient at the lag value; Standard Error—The standard error of the regression coefficient; t-test—Student’s t-test of statistical hypothesis testing methods (statistical criteria) based on comparison with the Student’s distribution for checking the equality of mean values in two samples; p-value—Probability of error. Source: Authors’ results.
Table 10. Multivariate linear regression for carbon dioxide (CO2) with lags.
Multiple R0.91093068
Multiple R-squared0.82979470
Adjusted R-squared0.69363046
F(4,5)6.0941
p0.03675
Std. Err. of Estimate439.77
Durbin–Watson d2.1246
Variableb *Std. Err.bStd. Err.t(5)p-value
Intercept 36146.38651.831255.453600.000000
gf5−1.1782940.629291−4.872.6019−5.872410.020041
gf5-1−0.1474830.674745−0.622.8207−0.218580.835622
fd_re3−0.5246870.254221−1183.83573.5900−2.063900.033966
fd_re6−0.2432610.195830−0.030.0280−1.242200.269246
F-test (df1, df2)—Fisher’s test with degrees of freedom (i.e., df1 and df2) is a statistical test for assessing the significance of differences in the variances of two random samples; df1 = m (m—number of independent variables); df2—n-m-1 (n—number of years); t-test (df)—Student’s t-test with degrees of freedom df of statistical hypothesis testing methods (statistical criteria) based on comparison with the Student’s distribution for checking the equality of mean values in two samples, df = m-N (N—number of samples). gf5—Annual investment in off-grid renewable energy, USD million; fd_re3—The first differences in off-grid capacity of renewable energy, MW; fd_re6—The first differences in installed renewable energy-generating capacity in developing countries, watts per capita. * means standardized regression coefficients. Source: Authors’ results.
Table 11. Multivariate linear regression for nitrous oxide (N2O) with lags.
Multiple R0.97234647
Multiple R-squared0.94545765
Adjusted R-squared0.90182377
F(4,5)21.668
p0.00234
Std. Err. of Estimate21.338
Durbin–Watson d1.688
Variableb *Std. Err.BStd. Err.t(5)p-value
Intercept 2641.41346.7453956.506390.000000
gf5−1.1021620.440947−0.391−0.15627−5.499530.044521
gf5−1−0.4838500.519316−0.1730.18608−0.931710.394254
fd_re10.3846550.2152900.0000.000161.786680.134036
fd_re30.0994730.15863519.23730.678220.627050.558140
F-test (df1, df2)—Fisher’s test with degrees of freedom (i.e., df1 and df2) is a statistical test for assessing the significance of differences in the variances of two random samples; df1 = m (m—number of independent variables); df2—n-m-1 (n—number of years); t-test (df)—Student’s t-test with degrees of freedom df of statistical hypothesis testing methods (statistical criteria) based on comparison with the Student’s distribution for checking the equality of mean values in two samples, df = m-N (N—number of samples). gf5—Annual investment in off-grid renewable energy, USD million; fd_re1—The first differences in total capacity renewable energy, MW; fd_re3—Off-grid capacity of renewable energy, MW. * means standardized regression coefficients. Source: Authors’ results.
Table 12. Multivariate linear regression for methane (CH4) with lags.
Multiple R0.94732032
Multiple R-squared0.89741578
Adjusted R-squared0.84612367
F(3,6)17.496
p0.00227
Std. Err. of Estimate97.731
Durbin–Watson d2.816
Variableb *Std. Err.bStd. Err.t(6)p-value
Intercept 9645.43780.91318119.20730.000000
gf3−0.6397800.514148−87.82070.57499−5.24430.025977
gf3-10.2852430.51990153.75797.979990.54860.603047
fd_re6−0.1421830.137881−0.0060.00618−1.03120.342207
F-test (df1, df2)—Fisher’s test with degrees of freedom (i.e., df1 and df2) is a statistical test for assessing the significance of differences in the variances of two random samples; df1 = m (m—number of independent variables); df2—n-m-1 (n—number of years); t-test (df)—Student’s t-test with degrees of freedom df of statistical hypothesis testing methods (statistical criteria) based on comparison with the Student’s distribution for checking the equality of mean values in two samples, df = m-N (N—number of samples). gf3—Green economy market capitalization, USD million; fd_re6—The first differences in installed renewable energy-generating capacity in developing countries, watts per capita. * means standardized regression coefficients. Source: Authors’ results.
Disclaimer/Publisher’s Note: The statements, opinions and data contained in all publications are solely those of the individual author(s) and contributor(s) and not of MDPI and/or the editor(s). MDPI and/or the editor(s) disclaim responsibility for any injury to people or property resulting from any ideas, methods, instructions or products referred to in the content.

