Article

Temperature Reduction as Operando Performance Recovery Procedure for Polymer Electrolyte Membrane Fuel Cells

by
Qian Zhang
1,2,
Mathias Schulze
1,
Pawel Gazdzicki
1,* and
Kaspar Andreas Friedrich
1,2
1
Electrochemical Energy Technology, Institute of Engineering Thermodynamics, German Aerospace Center (DLR), Pfaffenwaldring 38-40, 70569 Stuttgart, Germany
2
Institute of Building Energetics, Thermal Engineering and Energy Storage (IGTE), University of Stuttgart, Pfaffenwaldring 31, 70569 Stuttgart, Germany
*
Author to whom correspondence should be addressed.
Energies 2024, 17(4), 774; https://doi.org/10.3390/en17040774
Submission received: 15 December 2023 / Revised: 21 January 2024 / Accepted: 1 February 2024 / Published: 6 February 2024

Abstract

:
To efficiently mitigate the reversible performance degradation of polymer electrolyte membrane fuel cells, it is crucial to thoroughly understand recovery effects. In this work, the effect of operando performance recovery by temperature reduction is evaluated. The results reveal that operando reduction in cell temperature from 80 °C to 45 °C yields a performance recovery of 60–70% in the current density range below 1 A cm−2 in a shorter time (1.5 h versus 10.5 h), as opposed to a known and more complex non-operando recovery procedure. Notably, the absolute recovered voltage is directly proportional to the total amount of liquid water produced during the temperature reduction. Thus, the recovery effect is likely attributed to a reorganization/rearrangement of the ionomer due to water condensation. Reduction in the charge transfer and mass transfer resistance is observed after the temperature reduction by electrochemical impedance spectroscopy (EIS) measurement. During non-operando temperature reduction (i.e., open circuit voltage (OCV) hold during recovery instead of load cycling) an even higher recovery efficiency of >80% was achieved.

1. Introduction

To achieve carbon neutrality, the development and commercialization of electric vehicles with polymer electrolyte membrane fuel cells (PEMFCs) are gathering increased attention, especially for heavy-duty applications [1,2]. Despite significant technological progress within the last decades, high costs and limited longevity are still regarded as barriers to the widespread application of PEMFCs [3]. For heavy-duty vehicles, the European Commission has established targets for fuel cell stack durability, aiming for 30,000 h and a stack cost below €50/kW by 2030 [4]. For comparison, the current state-of-the-art of 2020 is defined by a durability of 15,000 h with a cost exceeding €100/kW, according to the Strategic Research and Innovation Agenda 2021–2027 of the Clean Hydrogen Joint Undertaking (Clean Hydrogen JU). Similarly, the Department of Energy (DOE) has set interim and ultimate targets for Class 8 Long-Haul Tractor-Trailers, with the fuel cell system expected to have a lifetime of 25,000 h by 2030 and 30,000 h by 2050, along with fuel cell system costs of $80/kW and $60/kW, respectively [5].
Throughout the lifespan of PEMFCs, diverse operational conditions can arise, presenting challenges to both performance and durability. These scenarios include frequent shut-down/start-up, freeze–thaw, idle running, dynamic loading, full power running, and overload running conditions. Each of these conditions imposes unique demands and stresses on the PEMFC system, potentially impacting its overall performance and longevity [6,7]. To achieve the targeted durability, it is essential to mitigate fuel cell performance degradation. Over the lifespan of PEMFCs, various types of performance losses occur—both reversible and irreversible—depending on the selected operation conditions and materials. A number of publications have proposed mitigation strategies for reversible performance losses, including (i) the elimination of absorbed contaminants of the catalyst [8], (ii) the reduction of catalyst oxides in the cathode [9,10], (iii) the prevention of flooding in the catalyst layer [11], (iv) the rehydration of the membrane [12], and more. An overview of the mechanisms causing reversible performance losses has been published recently [13]. However, accurately quantifying recovery effects is challenging due to several factors: (i) electrochemical characterizations, such as cyclic voltammetry (CV) analyses, can themselves influence the recovery [14], (ii) reversible and irreversible effects are interdependent [13], (iii) the effect of recovery depends on the given operation conditions (e.g., dry versus wet) [15] and the properties of membrane electrode assemblies (MEAs), and (iv) the change in ionomer structure, argued to play a relevant role in the recovery effect, is not fully understood and is challenging to access through operando or in situ characterization methods [16,17].
Empirical studies indicate that shut-down processes, encompassing long stops with a temperature decrease, have a positive impact on performance recovery [18,19]. In this context, water condensation due to temperature reduction is proposed to play a prominent role [20,21,22]. In the literature [11,23], the recovery of performance losses due to shut-down was observed and ascribed to the removal of water in the catalyst layer and water redistribution in the cell. Steinbach et al. [24] and Prass et al. [25] reported that a shut-down/start-up process, including cooling down the cell to room temperature, leads to the removal of sulfide ions in the anode (effective catalyst poisons) and subsequent performance recovery. Pivac et al. [26] compared the recovery effect of different shut-down procedures involving varying cooling rates. The results showed that an accelerated cell cooling was counterproductive in terms of performance recovery. Kabir et al. [27] proposed a recovery procedure where the cell was cooled down from 80 °C to 40 °C at 0.1 V with air oversaturated with water, leading to the removal of contaminants and catalyst oxides. Additionally, considering changes in oxygen transport resistance during the recovery procedure and drawing on previous relevant research, the authors highlighted the rearrangement of the catalyst atomic structure as an important contribution to the performance recovery. Zhang et al. [28] investigated irreversible chemical degradation of the membrane under open circuit voltage (OCV) conditions. The performance recovery by cooling down from 80 °C to 50 °C and purging with H2/N2 for 2 h was mainly attributed to the removal of sulfate anions (generated due to membrane degradation) from both anode and cathode through the analysis of fuel cell effluent water. Similarly, Robb et al. [29] and Shokhen et al. [30] presented a recovery procedure based on an increase in relative humidity (RH) to or above 100%, followed by the application of low cell voltage. This recovery procedure was supposed to release contaminants on the catalyst surface and purge them out of the cell.
A common feature among the aforementioned recovery procedures is that they are non-operando, therefore requiring the interruption of fuel cell operation. This characteristic can be particularly detrimental in cases where long-term continuous operation is essential, such as in the context of ships.
To the best of our knowledge, operando recovery procedures have not been published so far. This work aims to address this gap by investigating and quantifying the mechanism of performance recovery due to operando temperature reduction. Specific tests have been performed at the single-cell level for this purpose. Operando recovery procedures are simpler to implement in real fuel cell (FC) systems compared to complex non-operando procedures. Concerning the recovery, ionomer hydration plays a key role which is likely linked to ionomer rearrangement [16,17]. Additionally, recovery efficiency is assessed and compared to common non-operando recovery procedures. This work outlines conclusions on alternative operation conditions, materials, and scaling-up, while also providing an explanation of the limitations of the presented experiments. Hence, the outcomes contribute to the new body of knowledge by addressing the gap in operando recovery of reversible losses in PEMFCs, with the potential for implementation in future fuel cell systems.

2. Experimental

2.1. Test Hardware

The materials, including the test bench and control software for the durability tests, were developed at the German Aerospace Center (Deutsches Zentrum für Luft- und Raumfahrt e.V., DLR, Stuttgart, Germany), as described in previous publications [31,32]. A variety of operating parameters can be adjusted manually or by scripts, such as cell temperature, gas flow, relative humidity (using bubblers), and outlet pressure.
A single cell with a 5 × 5 cm2 active area was utilized, featuring one-channel serpentine flow fields arranged in a co-flow configuration. The gas channels were oriented parallel to the direction of gravity, with gas inlets at the top and outlets at the bottom of the cell. This configuration is reported in the literature to promote stable performance [33].
The 5-layer MEA utilized in this experiment was manufactured by IRD Fuel Cells A/S according to DLR’s specifications for the purpose of this investigation. It comprises a 27.5 µm thick NafionTM XL membrane sandwiched between the anode and cathode catalyst layers, each having a Pt/C ratio of 50 wt % and Pt loadings of 0.05 and 0.25 mg cm−2, respectively. The active area was 5 × 5 cm2. As gas diffusion layers (GDLs), Sigracet® 29BC sheets from SGL Carbon SE were employed. Ice Cube Sealings with a thickness of 350 µm from Freudenberg FST GmbH served as a gasket material.

2.2. Operation Conditions and Test Protocols

Prior to each experiment, a leak test was conducted on both the single cell and the test bench. Subsequently, the MEA underwent conditioning to achieve stable performance. A detailed description is provided in a recent work [34].
The load cycling protocol employed for the durability tests was the Fuel Cell Dynamic Load Cycle (FC-DLC), see illustrated in Figure 1a [35]. The maximum current density of the FC-DLC was defined as the current density yielding 0.65 V, corresponding to 1 A cm−2. Throughout FC-DLC operation, constant gas flows of H2 (0.263 L min−1) and air (0.83 L min−1) were maintained, corresponding to H2 and oxygen stoichiometry of 1.5 and 2.0 for the current density of 1 A cm−2. The cell operating temperature was set to 80 °C, with relative humidities at the anode and cathode inlets set to 100%. The absolute gas pressures at the anode and cathode outlets were controlled at 250 and 230 kPa, respectively.
Two types of durability tests were conducted to investigate the performance recovery effect of (i) operando temperature reduction and (ii) non-operando temperature reduction. The second test allows the implementation of additional electrochemical analyses, such as polarization curves and electrochemical impedance spectroscopy (EIS), which requires the interruption of continuous fuel cell operation. The approaches are shown in Figure 1b,c and described in the following:
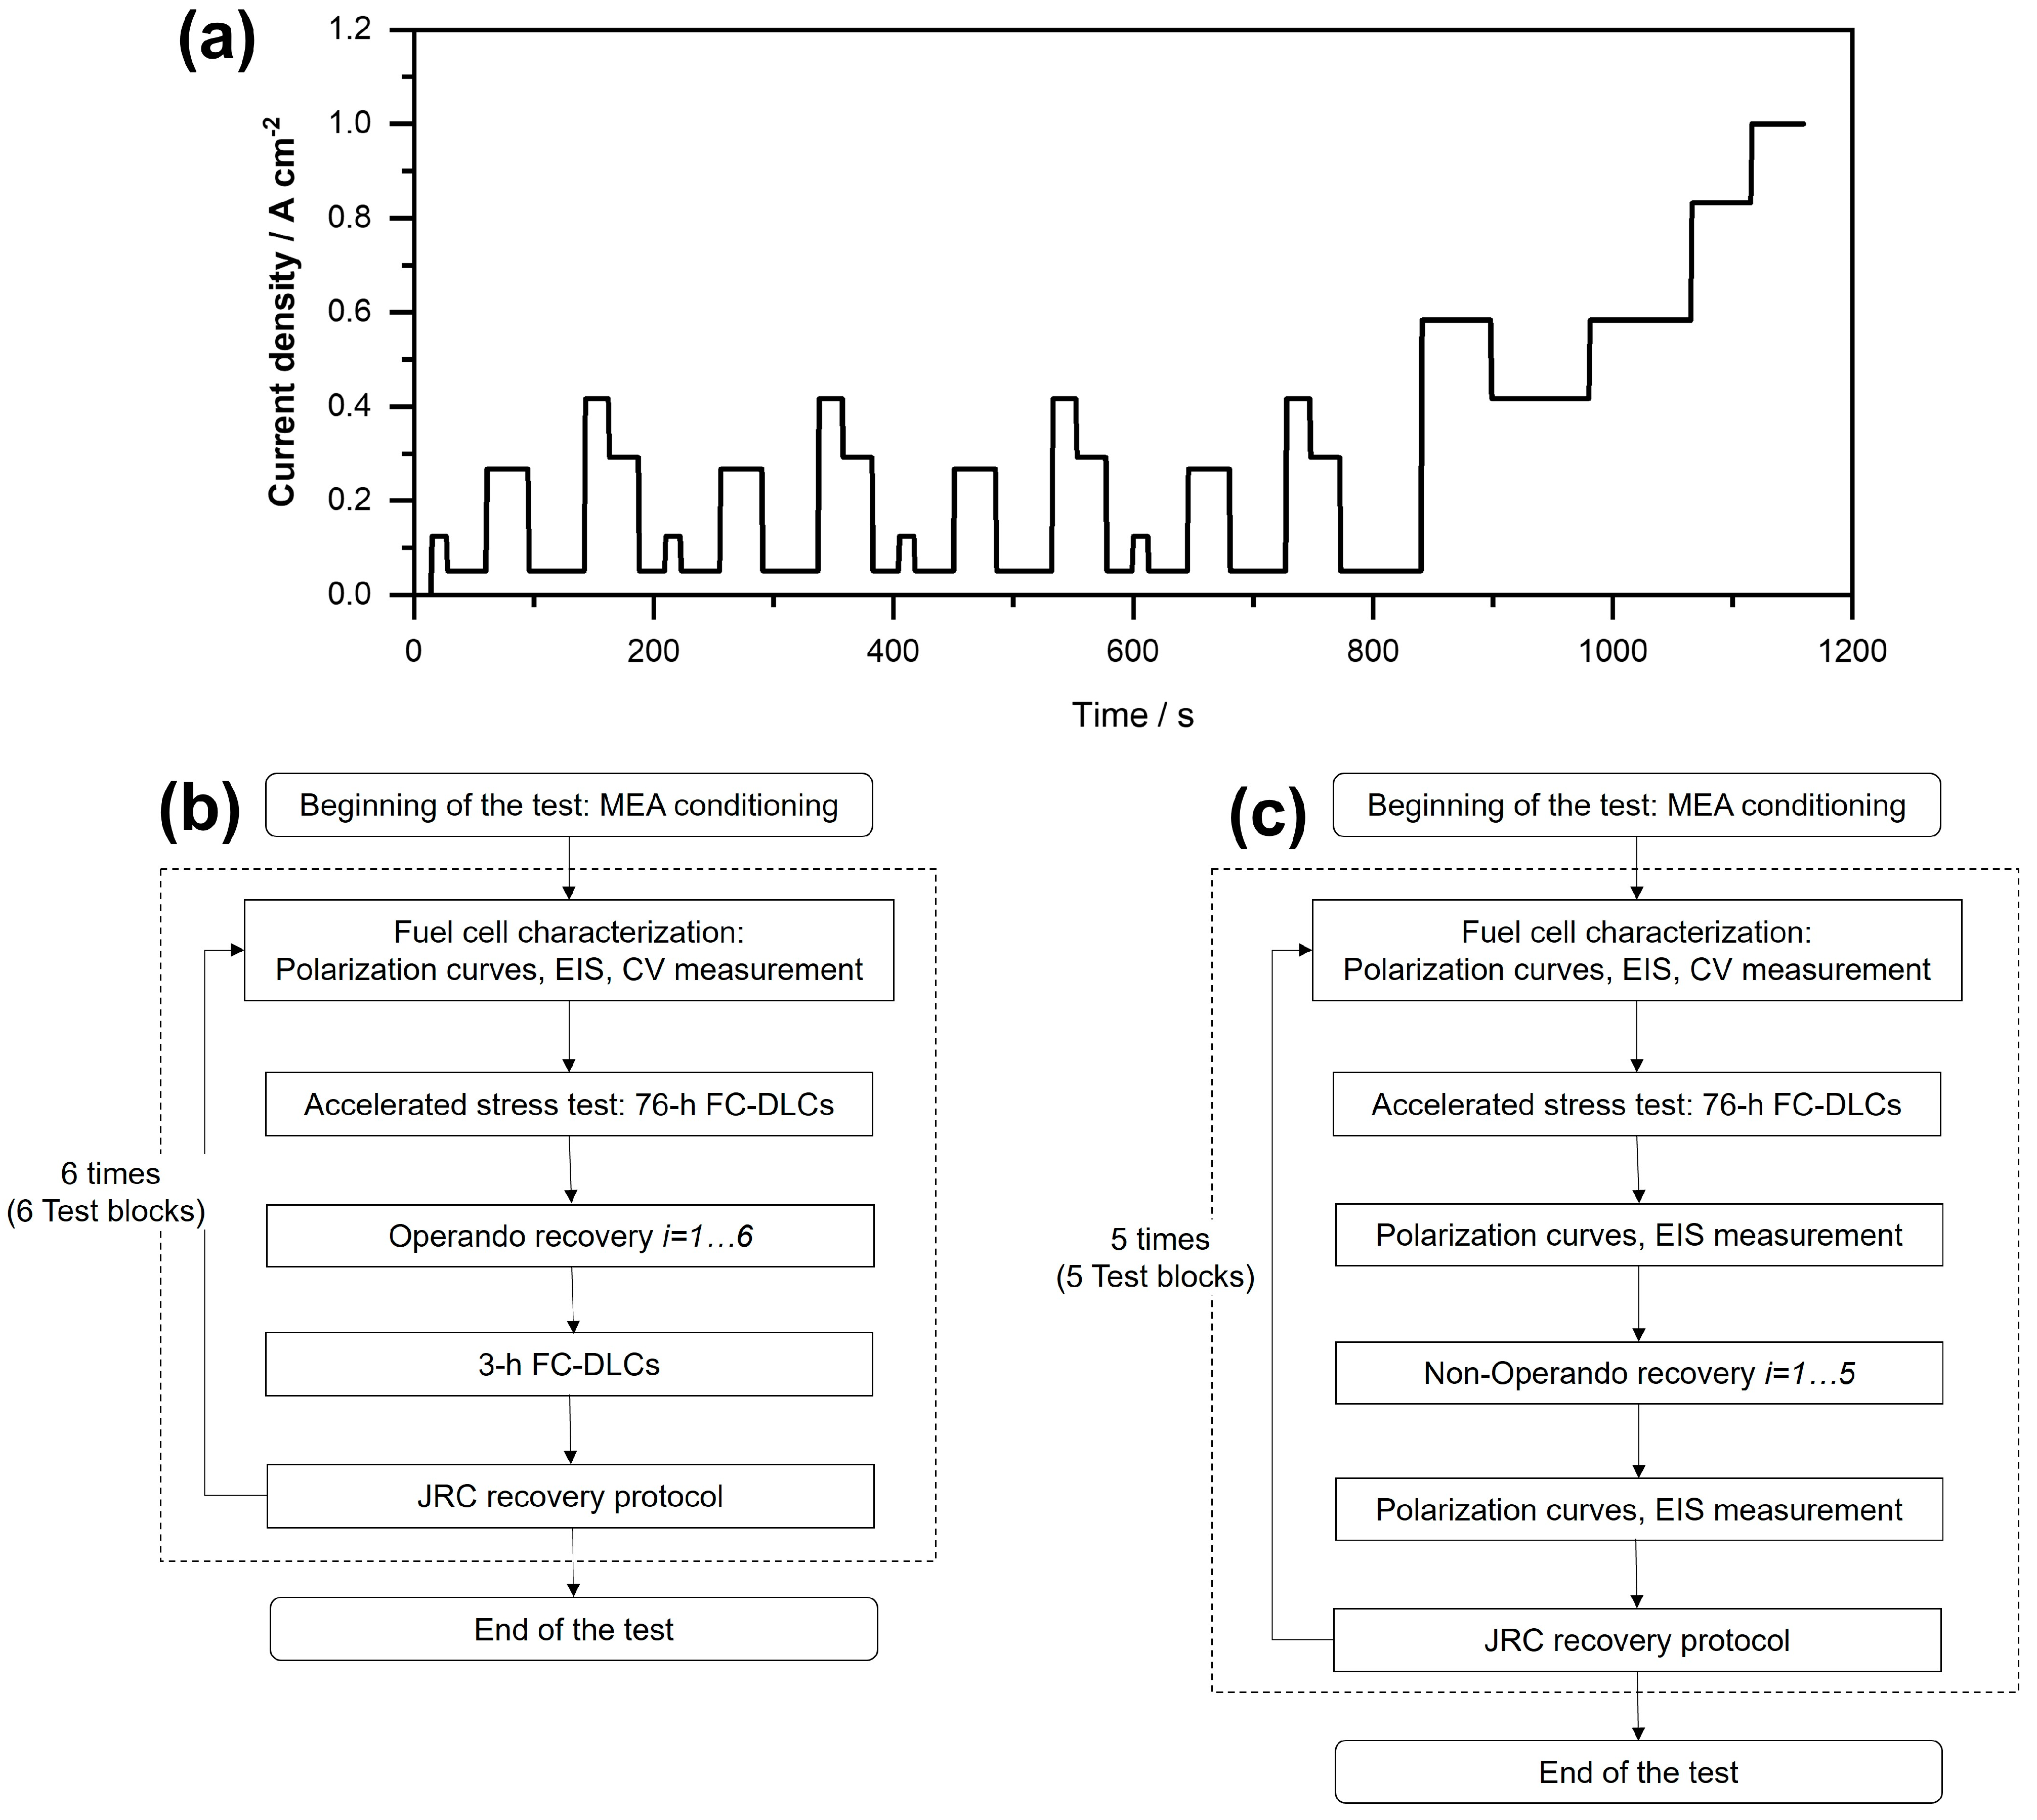
  • The first durability test comprises 6 test blocks, as indicated in Figure 1b. At the beginning of each test block, a performance characterization was conducted, followed by a 76 h period of load cycling. Subsequently, an operando recovery procedure was implemented; specifically, the cell temperature was reduced to a specific set point and then increased to the nominal operating temperature. After reaching the nominal operating temperature, FC-DLC operation was continued for an additional 3 h before applying the JRC recovery procedure [35] as a benchmark (see Supplementary Materials for more details). The JRC protocol, proposed by the Joint Research Center (JRC) of the European Commission [35], was chosen for this work based on our previous study [34], assuming 100% recovery. After each test block, it is imperative to implement the JRC protocol to prevent the accumulation of non-recovered reversible losses throughout the experiment [34]. This is crucial to avoid misinterpretation and misevaluation of the effectiveness of the operando recovery procedure.
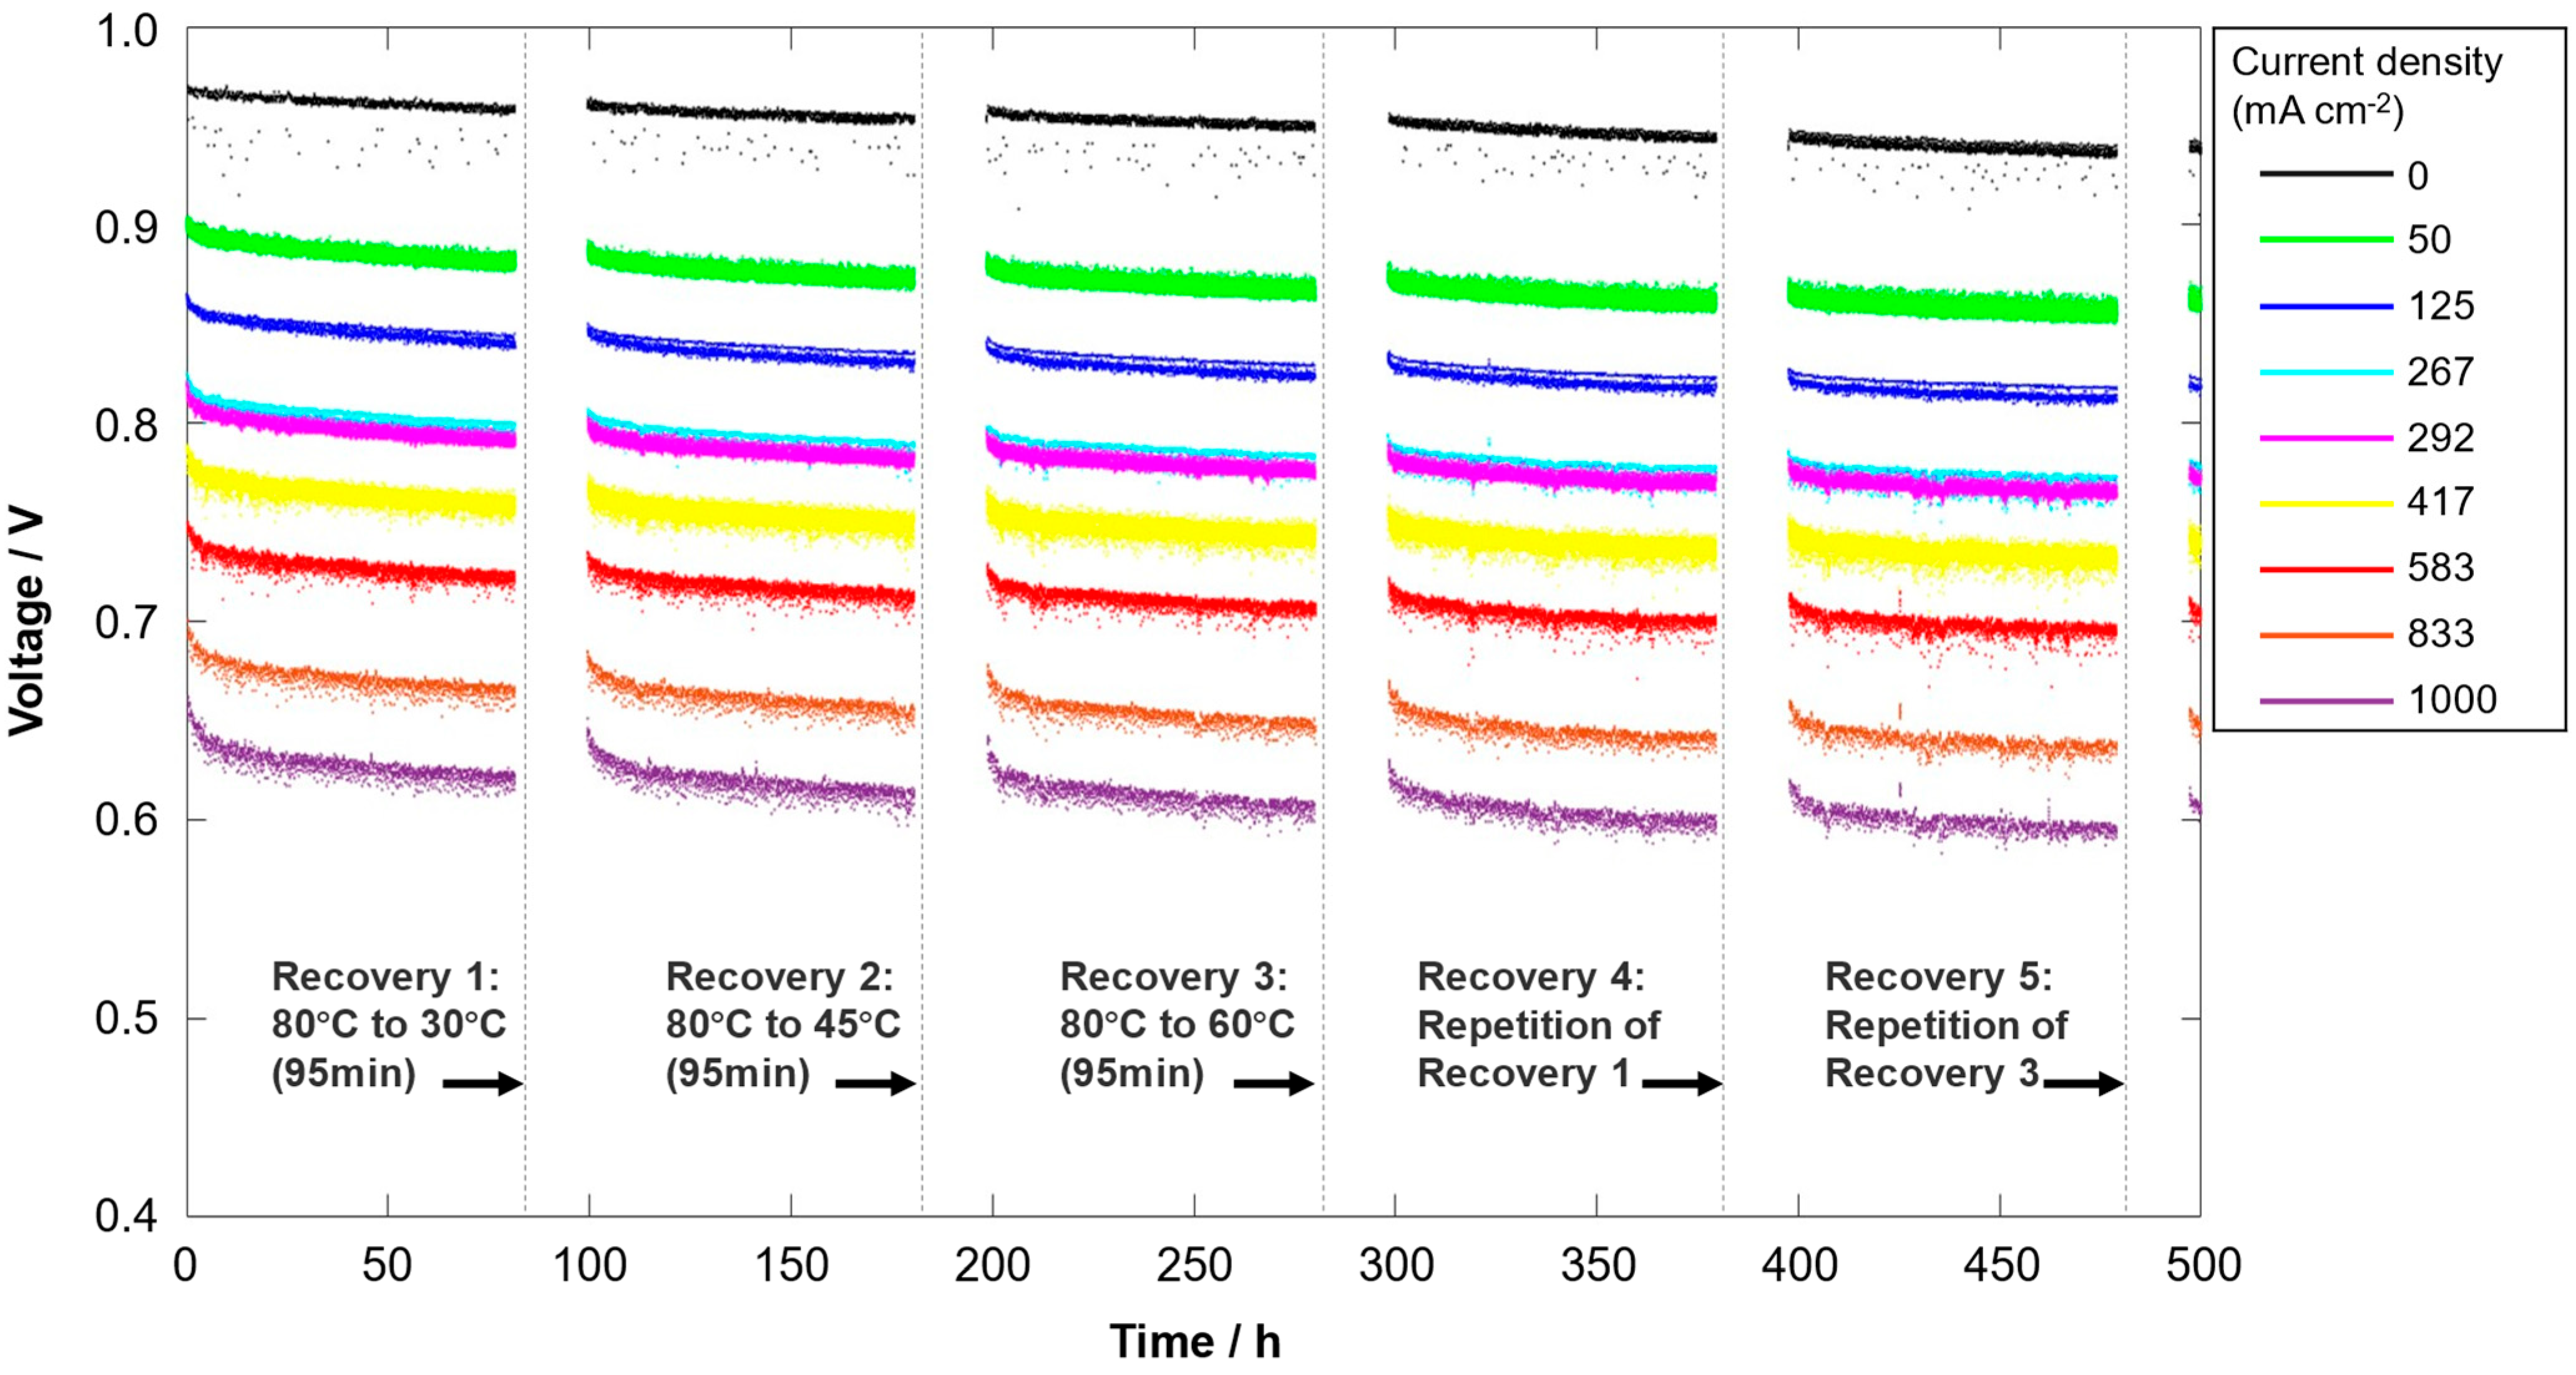
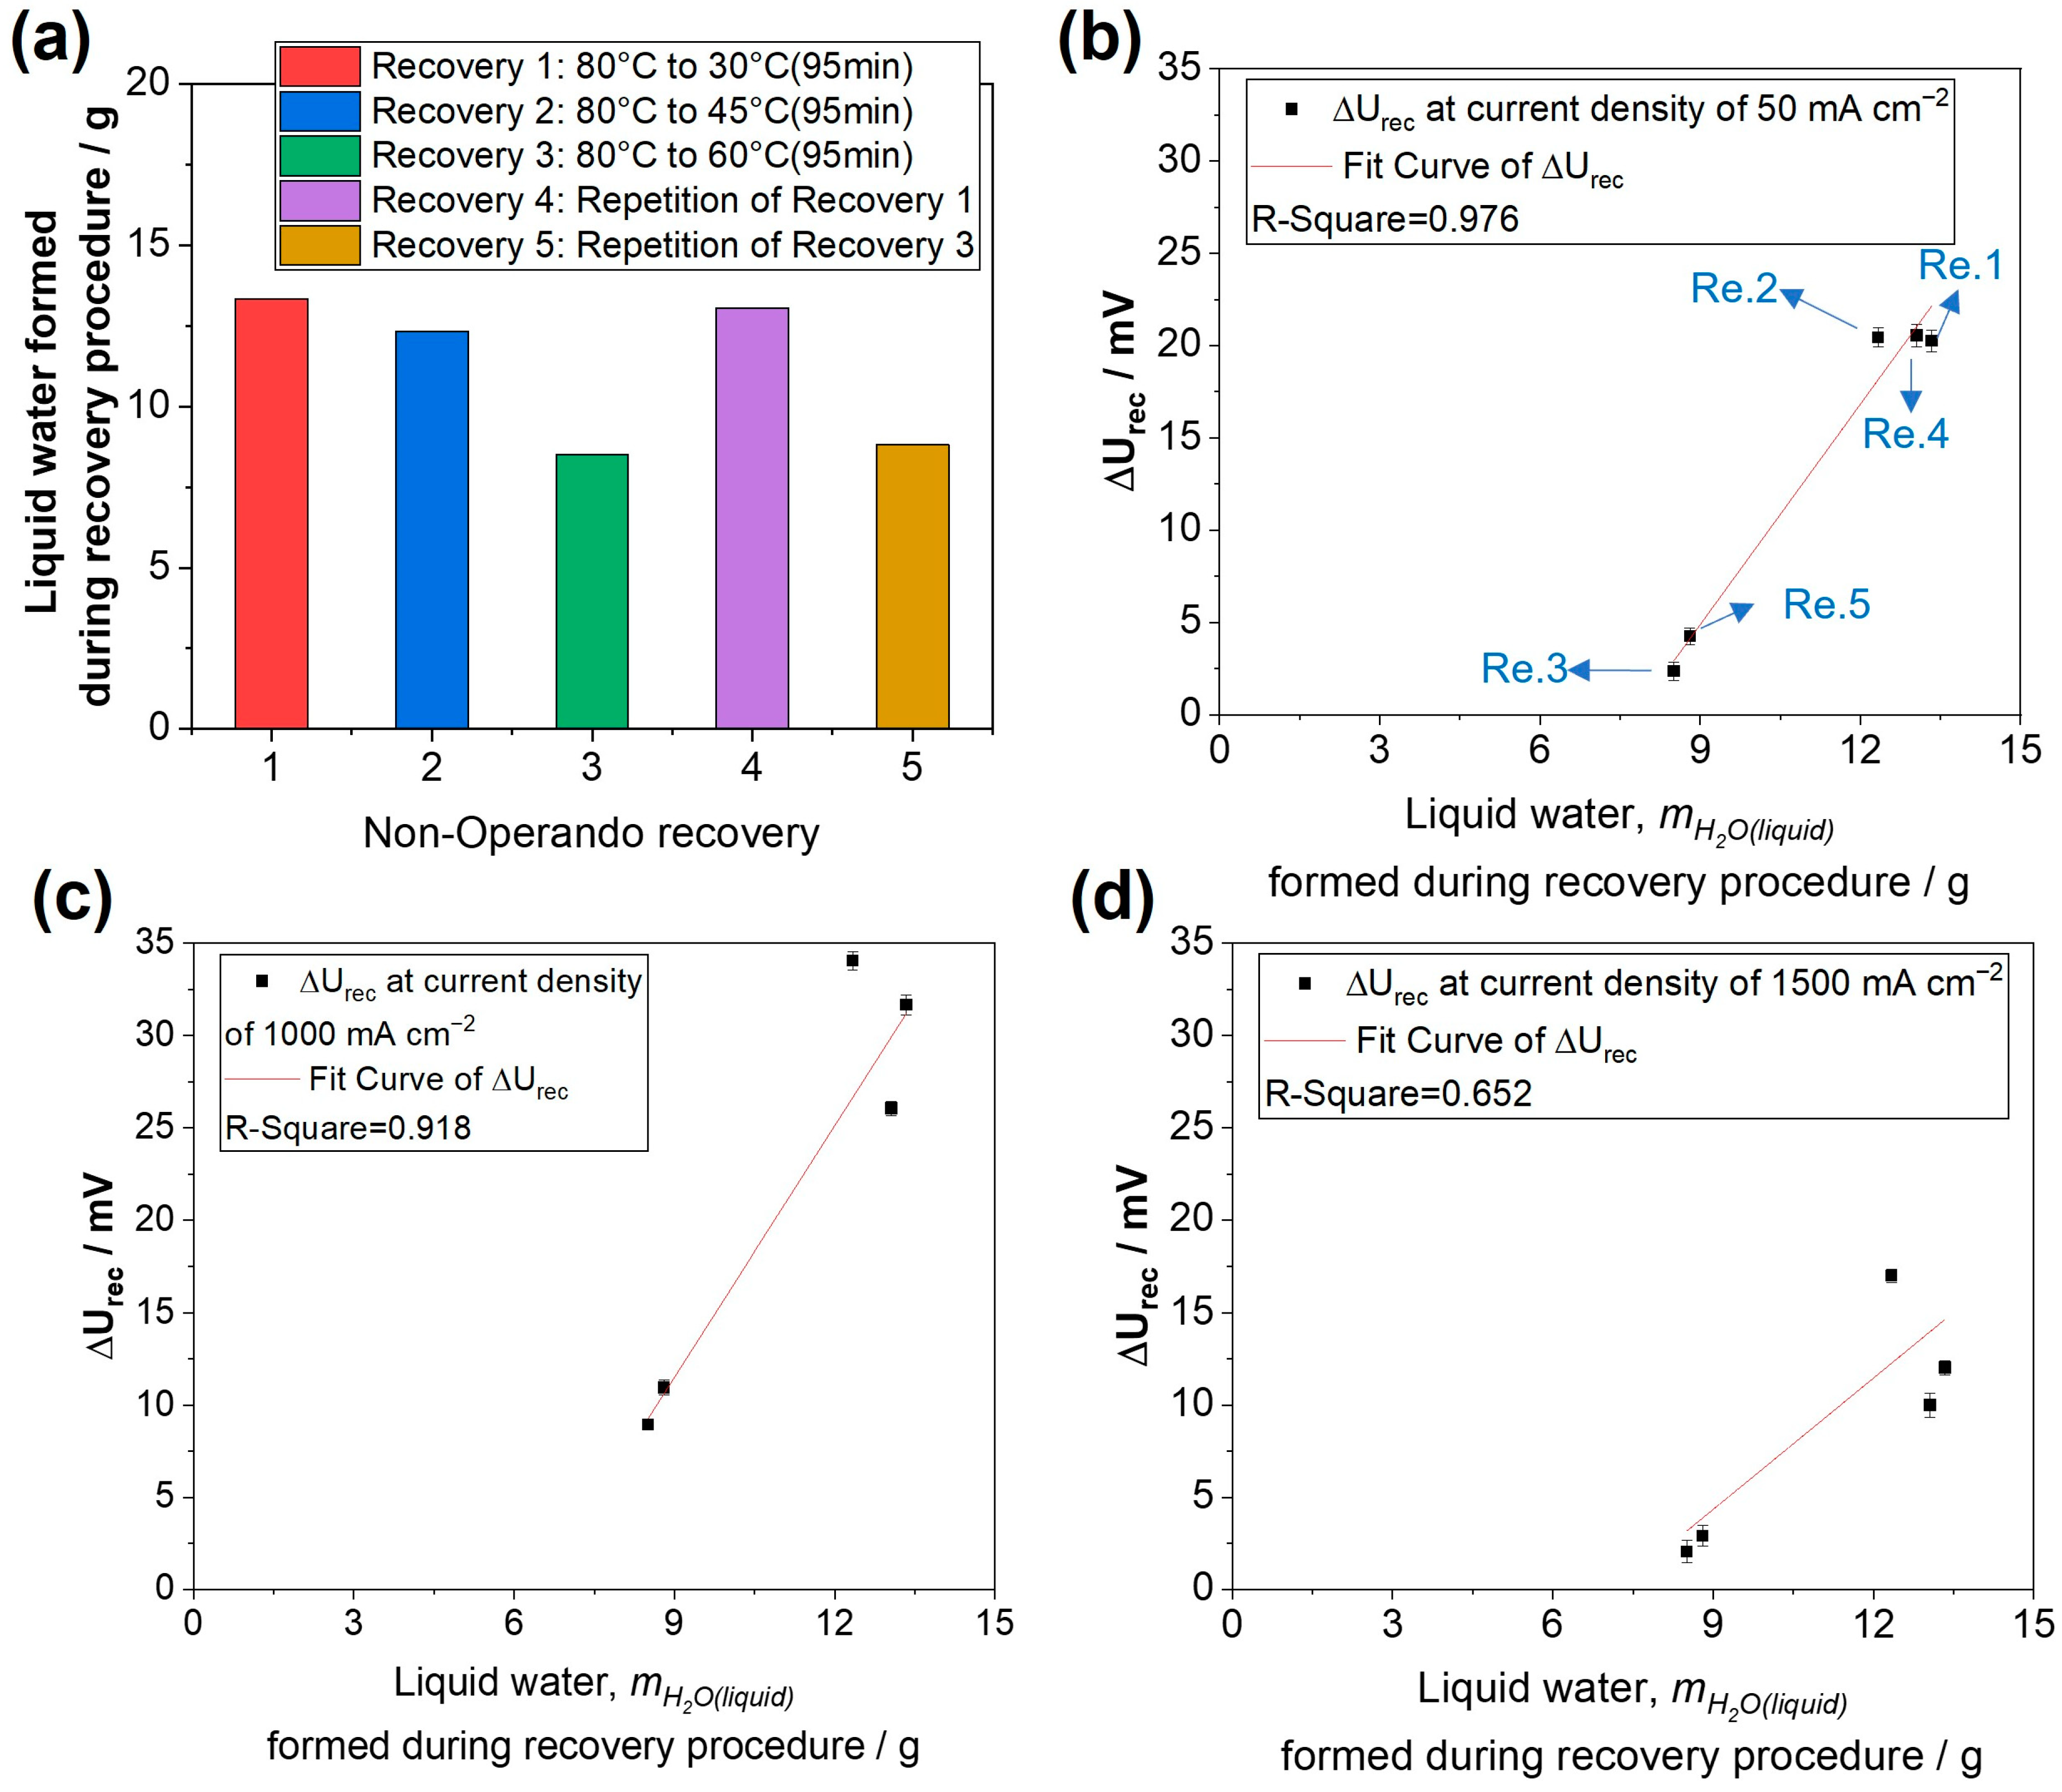
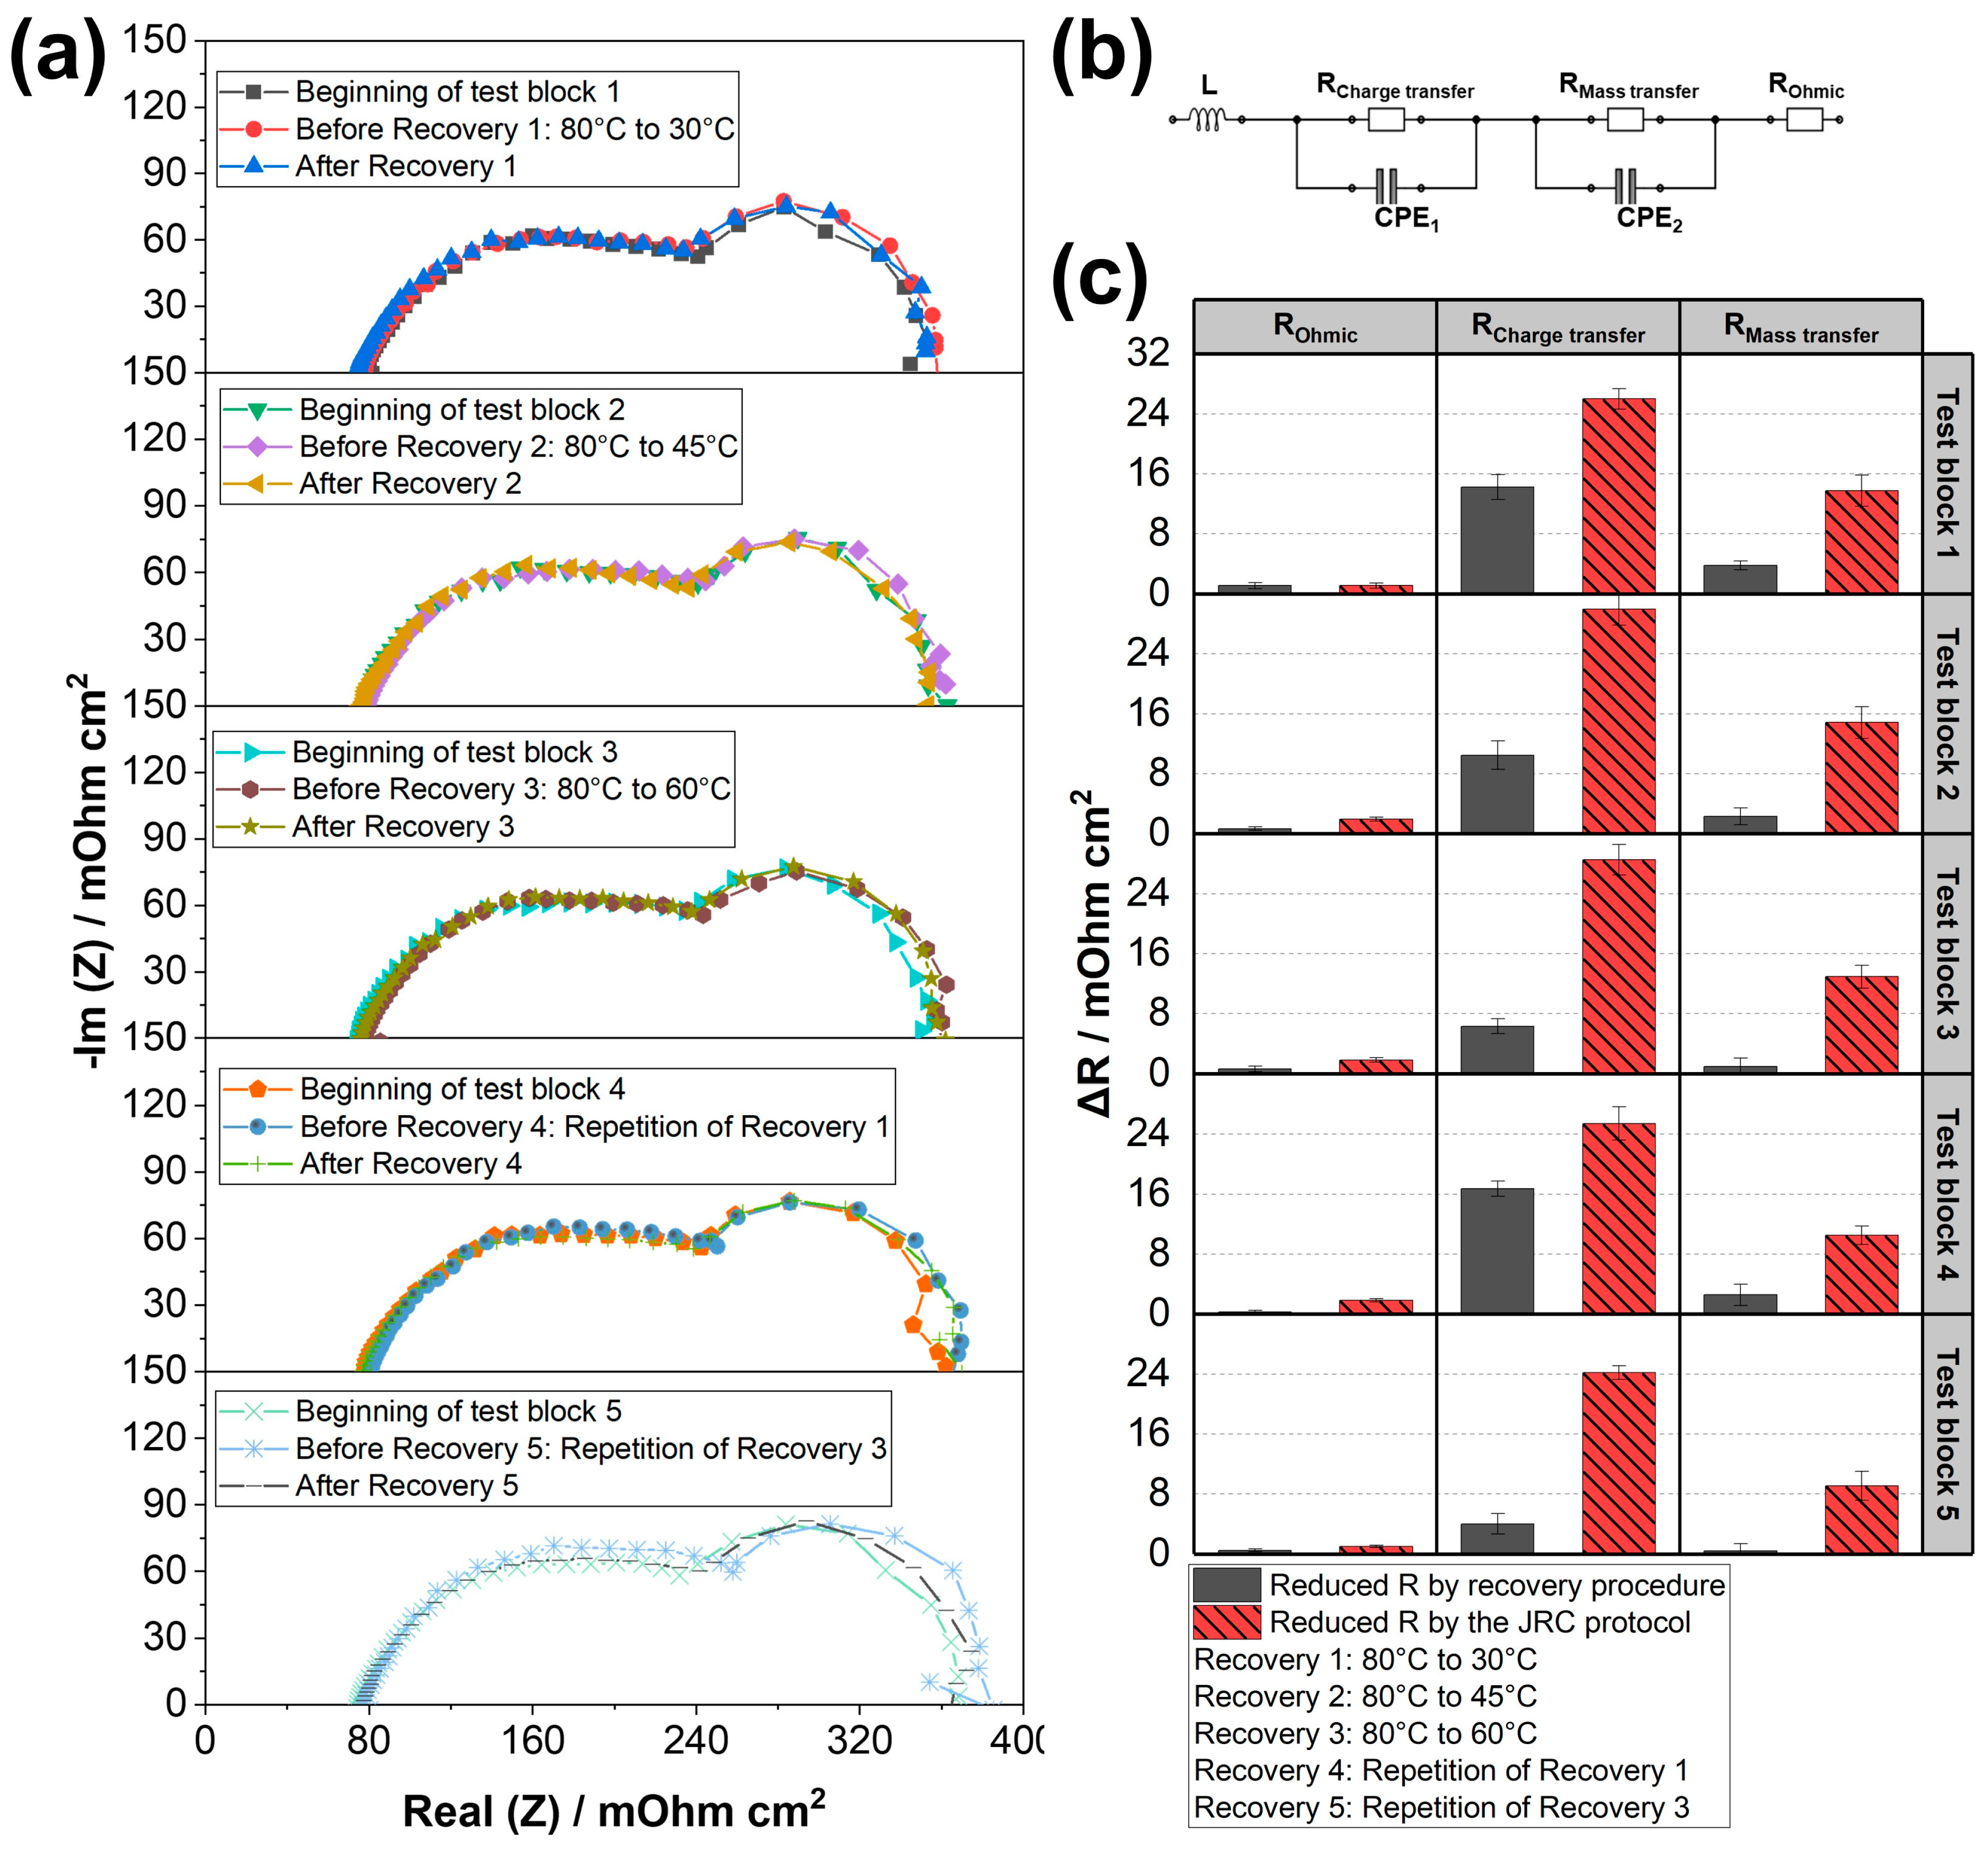
  • The second durability test (Figure 1c) consists of 5 test blocks. After each 76 h load cycling period, the cycling was paused, and performance characterization measurements were conducted before and after each non-operando temperature reduction procedure. Specifically, the cell temperature was reduced once the electrical load was switched off (leading to OCV), while the other operating parameters (gas flow and pressure) were kept constant. To compare the efficiency of the recovery due to temperature reduction with the efficiency of the JRC recovery protocol, at the end of each test block the JRC recovery protocol was performed, followed by an additional performance characterization.

2.3. Characterization Methods

Polarization curves were recorded following the EU Harmonized Test Protocols for MEA Testing [34]. The data were acquired every second and then averaged over the last 30 s of the dwell time at each setpoint of the tested current density. The error bars corresponded to the standard deviation from the average. The H2 and oxygen (in air feed) stoichiometry were set at 1.5 and 2.0, respectively, while cell temperature, humidity, and gas pressures remained consistent with FC-DLC operation, as described above. The minimum H2 and air flows were maintained at 0.105 and 0.332 L min−1, respectively.
Electrochemical impedance spectroscopy (EIS) testing under a constant current density of 0.8 A cm−2 was conducted using the modular electrochemical workstation Zennium X and electronic load PP241 from ZAHNER-Elektrik GmbH & CoKG (Kronach, Germany). The analysis covered a frequency range from 100 mHz to 10 kHz, with a perturbation amplitude of ±5% of the applied current. The EIS data were analyzed with the Thales XT software package (Version 5.3.3). The operation parameters were consistent with the polarization curve measurements.

2.4. Recovery Procedures

The recovery procedures evaluated in the two durability tests are summarized in Table 1 and are labeled as “operando” and “non-operando”.
In the case of operando recovery, the cell temperature was reduced from the nominal operating temperature of 80 °C to either 45 °C or 60 °C to observe measurable recovery of performance loss. Although an attempt was made to reduce the temperature to 30 °C, it proved unattainable due to the heat generated during fuel cell operation. After reaching the targeted temperature, the cell was reheated to 80 °C again. The respective durations until reaching the targeted temperature were 95 and 35 min, indicating the time it takes for the fuel cell to naturally reach the target temperature after the heating system is switched off. Subsequently, these two recovery procedures were repeated (labeled as recovery procedures 3 and 4) to test reproducibility. Given that the cell temperature reduction from 80 °C to 45 °C took 60 min longer than to 60 °C, the effect of cooling time was investigated separately (procedures 5 and 6). In the case of procedure 6, the cooling process was accelerated by using a cooling fan, reducing the time required to reach 45 °C from 95 min to 35 min. In the case of recovery procedure 5, the cell temperature reduction from 80 °C to 60 °C was prolonged to 95 min by maintaining the cell at 60 °C for an additional 60 min. The variable selection of recovery procedures 5 and 6 allows for a comparison and analysis of the impact of the cooling time on the recovery effect. The temperature profiles of the different procedures are provided in Figure S1 in the Supplementary Materials.
In the case of non-operando temperature reduction, the fuel cell temperature reduced faster than during operando temperature reduction, as no heat is generated during load shutdown. The cell temperature could also be reduced to 30 °C. For a direct comparison with operando temperature reduction results, Recovery procedures 1, 2, and 3 correspond to cell temperature reductions from 80 °C to 30 °C, 45 °C and 60 °C, respectively. In all cases, the setpoint temperatures were maintained for 95 min under OCV after achieving the target temperature. Recovery procedures 4 and 5 are repetitions of recovery procedures 1 and 3. OCV was applied since other cell voltages may influence several recovery parameters, and OCV represents the natural state without load.

3. Results

In Section 3.1 and Section 3.2, the performance recovery effects of operando and non-operando temperature reduction are evaluated. The results of the operando temperature reduction are displayed first. Subsequently, the results of non-operando temperature reduction procedures are discussed, including additional performance characterization measurements carried out before and after each recovery. Eventually, the recovery mechanisms are quantified and discussed.

3.1. Operando Performance Recovery Procedures Based on Temperature Reduction

Cell voltages corresponding to individual current density levels of the FC-DLC cycles performed during the durability test are presented in Figure 2. The vertical red dashed lines indicate the implementation of operando temperature reduction. It is noteworthy that the cell voltage decreased during the temperature reduction and subsequently increased (to a higher value) after returning to nominal operation conditions (refer to Figure S1 in the Supplementary Materials). To prevent the cell voltage from dropping below 500 mV, the lower temperature limit was set to 45 °C.
In the durability test illustrated in Figure 2, a decrease in cell voltage at each current density is anticipated during the FC-DLC. However, two unexpected voltage fluctuations are observed in the first two test blocks. We attribute these fluctuations to temporary water flooding in the fuel cell channels for the following reasons: (i) the fluctuation is more pronounced at higher current density ranges, where water is more likely to accumulate and block the fuel cell channels, and (ii) the voltage initially decreases and then increases during the FC-DLC, suggesting a temporary water flooding followed by water removal due to increased local gas pressure. Other possible causes of these two fluctuations could be uncertainties in the hardware, such as temporary fluctuations in the gas supply or the electronic load. Importantly, these fluctuations do not recur in subsequent test blocks or in the other durability test depicted in the next section. Despite these fluctuations, the cell voltage decreases after the FC-DLC operation and subsequently increases due to the recovery protocols, which constitute the primary focus of this study.
Figure 3a presents a scheme outlining various definitions used to quantify recovery effects. The solid lines display the cell voltage change during the FC-DLC operation, while the dashed line represents the cell voltage change during the recovery protocols. The voltage values U i = n B e g i n and U i = n E n d indicate the cell voltages at the beginning and end of the nth FC-DLC sequence, respectively. U i = n E n d corresponds to the voltage after the nth operando recovery procedure. After a subsequent 3 h of FC-DLC and before the next test block, a JRC recovery protocol and performance characterizations are conducted.
The voltage recovered due to operando temperature reduction is defined according to Equation (1),
Δ U i = n r e c = U i = n E n d U i = n E n d
while the total reversible, recoverable voltage loss is obtained using Equation (2) (i.e., it is assumed that the JRC recovery protocol leads to a full recovery of reversible performance losses),
Δ U i = n r e v = U i = n + 1 B e g i n U i = n E n d .
The recovered voltages Δ U r e c versus the current density are presented in Figure 3b. It is notable that the recovered reversible voltage losses during the operando procedures are in the range of several mV to 30 mV in each period. The irreversible degradation rates, in contrast, are in the range of 50 μ V   h 1 (see Figure S2 with explanations in the Supplementary Materials). Hence, the reversible performance degradation dominates the overall performance losses.
Apparently, the voltage recovered due to Recovery 1 and Recovery 3 (both 80 °C to 45 °C taking 95 min) as well as Recovery 2 and Recovery 4 (both 80 °C to 60 °C taking 35 min), are similar in the current density range from 0 to 1 A cm−2, indicating reasonable reproducibility. Additionally, in the current density range from 0 to 1 A cm−2, Recovery 1 and 3 (80 °C to 45 °C) lead to a higher recovery compared to Recovery 2 and 4 (80 °C to 60 °C). Moreover, Recovery 5 (80 °C to 60 °C taking 95 min) results in a slightly higher recovery compared to Recovery 2 and 4 (80 °C to 60 °C taking 35 min). Hence, a positive effect of extending the duration of the recovery procedure is concluded, which is consistent with the observation by Pivac et al. [26], who reported a negative effect of rapid cooling on recovery. Figure 3c shows the voltage recovery due to the operando temperature reduction relative to the recovery due to the JRC recovery protocol. The relative recovery efficiencies of the tested procedures are largely constant in the analyzed current density range. When comparing the effect of cooling down to 45 °C and 60 °C, it is evident that a higher recovery effect can be achieved at a lower cell temperature. Specifically, temperature reduction from 80 °C to 60 °C results in less than 30% recovery compared with the JRC protocol, while temperature reduction from 80 °C to 45 °C results in 60–70%. Although the recovery is always lower than for the JRC protocol, the clear advantage is the significantly shorter duration (<2 h vs. 10 h).
However, a longer holding time at the same (low) cell temperature also impacts the recovery and leads to higher recovery efficiencies. Hence, neither the targeted temperature alone nor the holding time is sufficient to describe the efficiency of operando recovery. Interestingly, the recovered voltage is strongly linked with water formation and condensation. This effect can be described by the amount of liquid water produced in the cell during recovery,   m H 2 O ( l i q u i d ) , which corresponds to the integration of the liquid water flow at the cathode outlet,   m ˙ H 2 O ( l i q u i d ) , o u t l e t , according to:
m H 2 O ( l i q u i d ) = r e c o v e r y m ˙ H 2 O ( l i q u i d ) , o u t l e t   d t
As an example, the calculated mass flow values for Recovery 1 (80 °C to 45 °C) along with the evolution of cell temperature are shown in Figure 4a. The fluctuations in the signals originate from the load cycling performed during the test, as shown in the FC-DLC protocol in Figure 1a. The liquid water mass flow at the cathode outlet (green data points) is provided by:
m ˙ H 2 O ( l i q u i d ) , o u t l e t = m ˙ H 2 O ( v a p o r ) , i n l e t + m ˙ H 2 O , p r o d m ˙ H 2 O ( v a p o r ) , o u t l e t
with:
  • m ˙ H 2 O ( v a p o r ) , i n l e t + m ˙ H 2 O , p r o d 
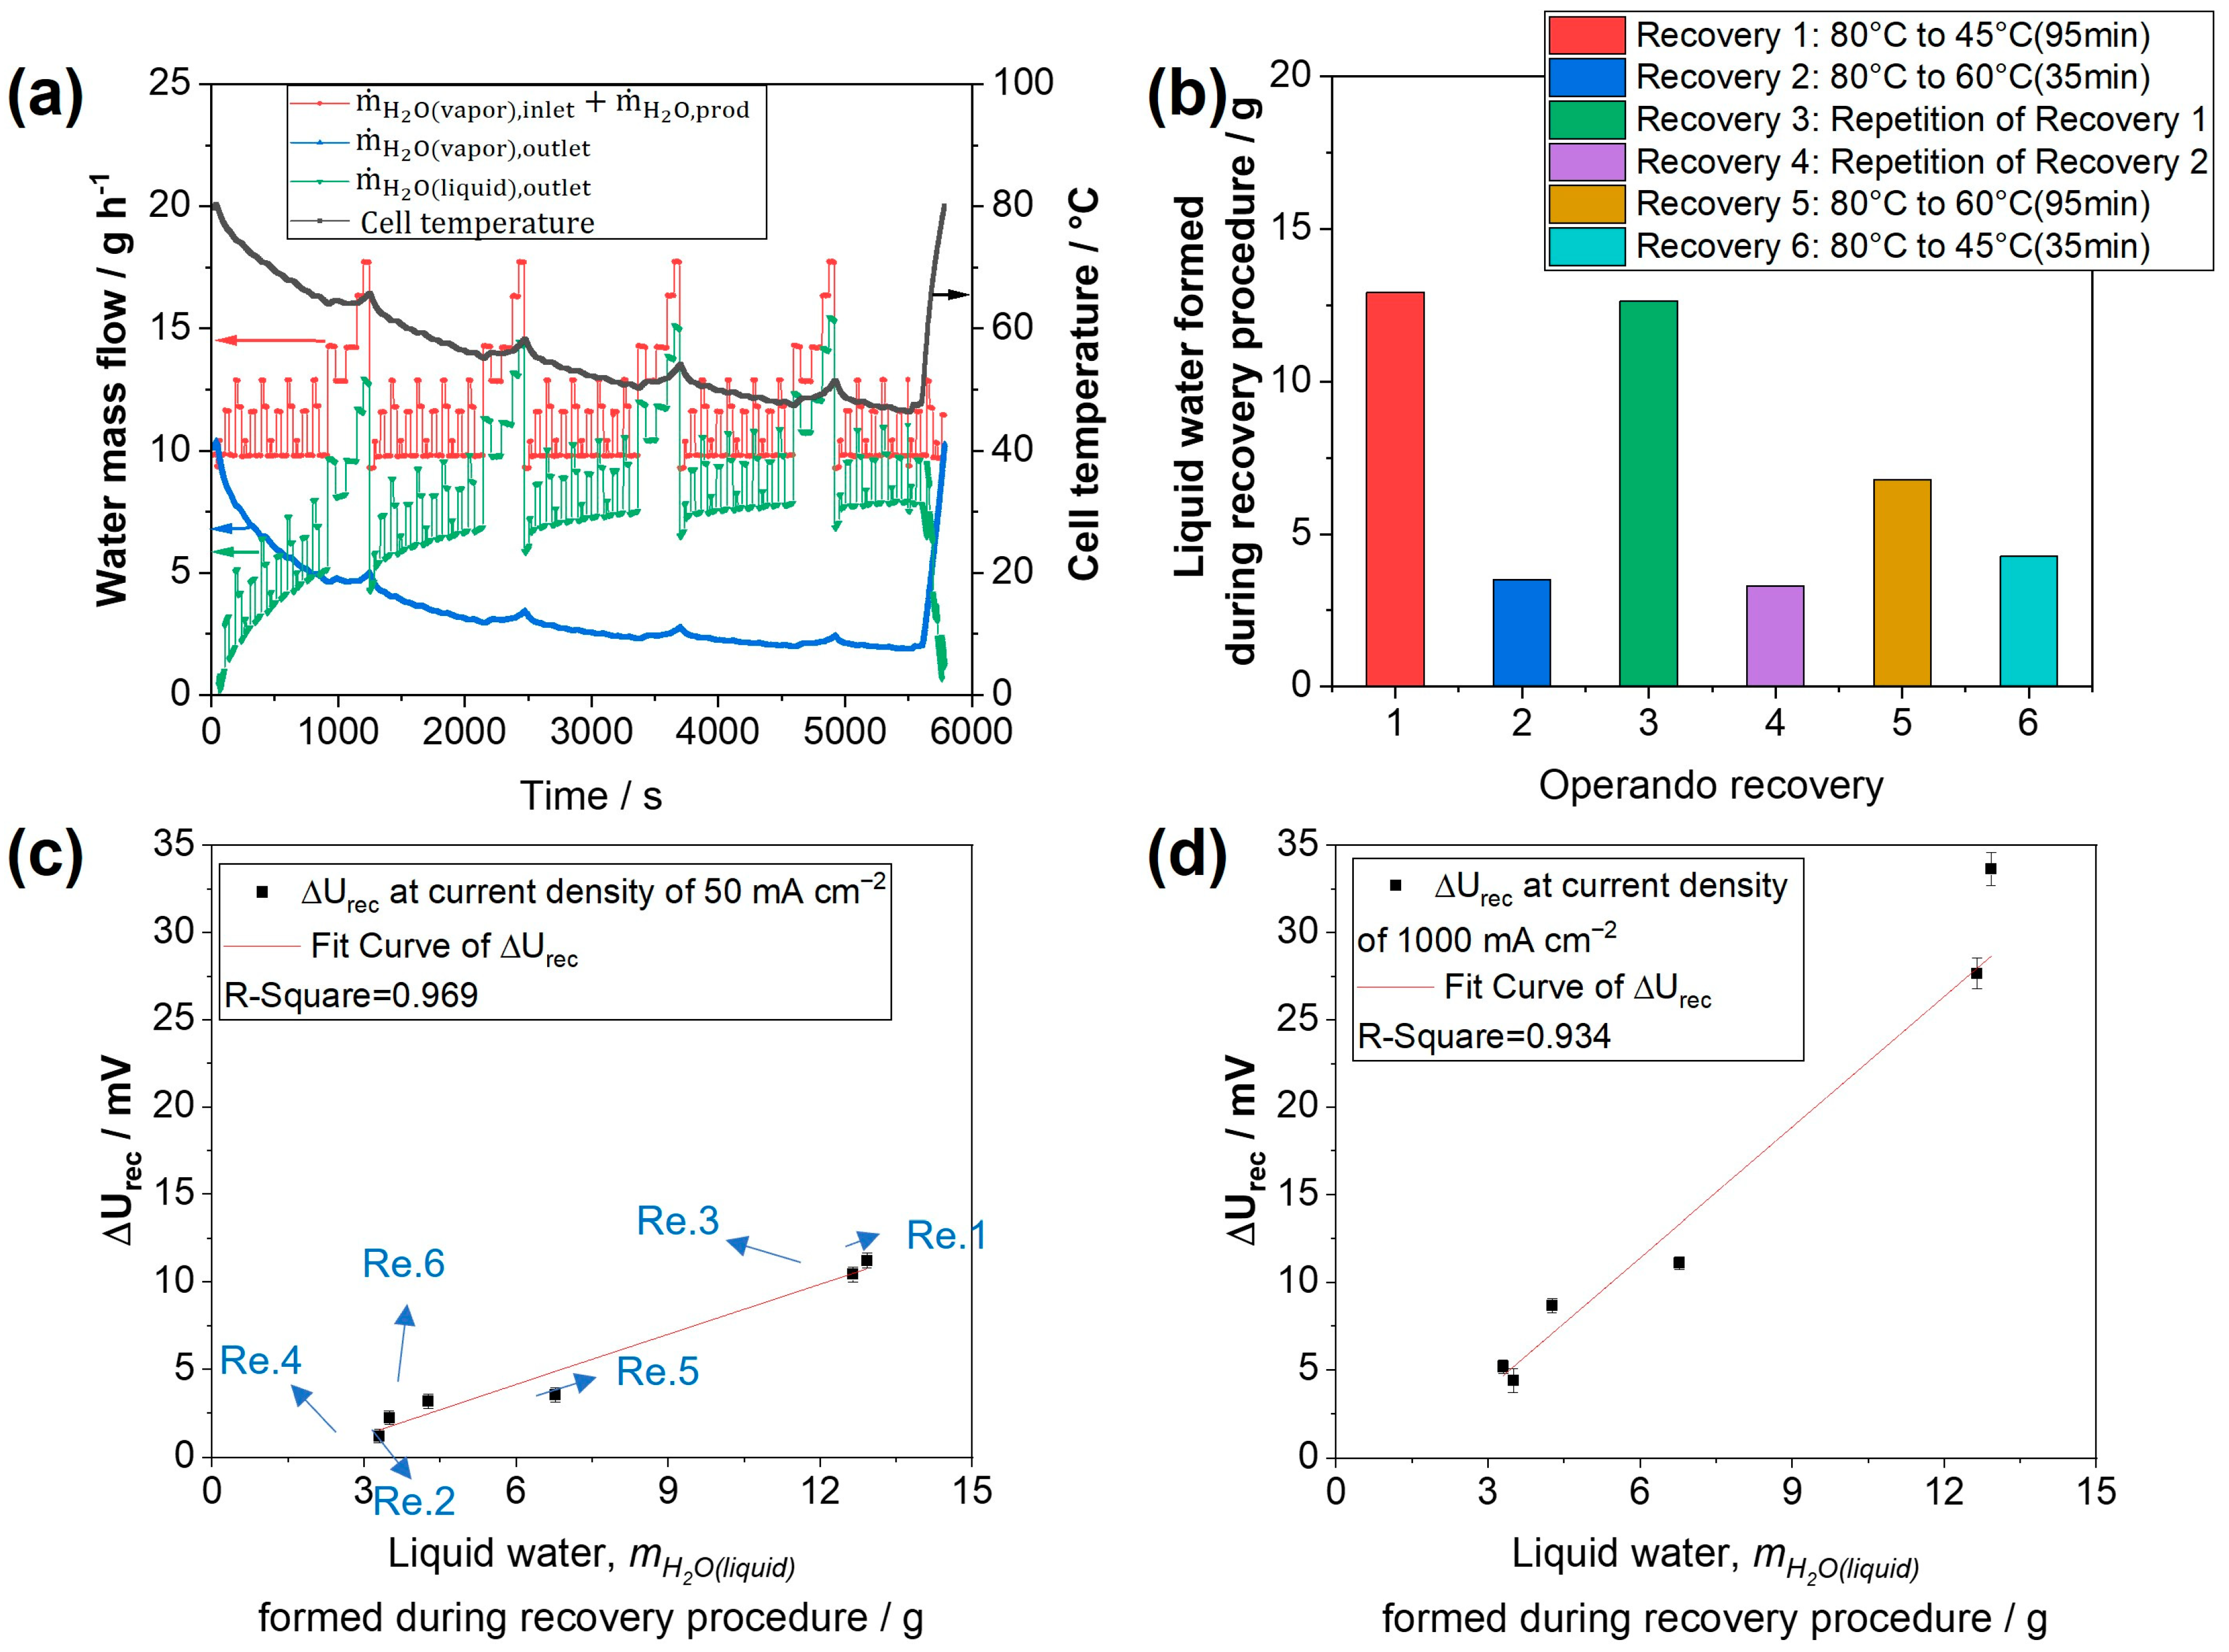
, the total water mass flow into the cell (red data points). It consists of the vaporous water mass flow in the inlet air ( m ˙ H 2 O ( v a p o r ) , i n l e t at 100% RH at 80 °C and a constant flow of 0.83 L min−1), plus product water ( m ˙ H 2 O , p r o d ) from the electrochemical reaction. It is calculated according to:
    m ˙ H 2 O ( v a p o r ) , i n l e t + m ˙ H 2 O , p r o d = m ˙ A i r · M H 2 O V 0 , m o l · ( P a i r , i n l e t P v a p o r ,   i n l e t 1 ) + I · M H 2 O 2 · F ,
    with m ˙ A i r being the air flow rate of 0.83 L min−1, P a i r , i n l e t and P v a p o r ,   i n l e t indicating the air pressure and vapor pressure in the cathode inlet, respectively. The constants include V 0 , m o l , the molar volume of an ideal gas of 22.414 L mol−1, the Faraday constant, F = 96,485 C⋅mol−1, and M H 2 O , the molar mass of water of 18.015 g mol−1. The current is denoted by I;
  • m ˙ H 2 O ( v a p o r ) , o u t l e t , the maximum output of vaporous water mass flow (blue data points) at the cathode outlet (depending on gas outlet pressure and cell temperature), is calculated using:
    m ˙ H 2 O ( v a p o r ) , o u t l e t = m ˙ A i r · M H 2 O V 0 , m o l · ( P a i r , o u t l e t P v a p o r ,   o u t l e t 1 )
    with P a i r , o u t l e t and P v a p o r ,   o u t l e t being the air pressure and vapor pressure in the cathode outlet, respectively.
The values of the total amount of liquid water due to the six recovery procedures are provided in Figure 4b. It is noted that the drag of liquid water due to gas flow is not considered, and the integrated data of liquid water do not correspond to the water being present inside the cell, but the amount of liquid water produced during recovery. Apparently, m H 2 O ( l i q u i d ) increases with the duration of the cooling-down period and lower cooling-down temperature.
For the temperature reduction from 80 °C to 45 °C with a duration of 95 min (Recovery 1 and 3) as well as for the temperature reduction from 80 °C to 60 °C with a duration of 35 min (Recovery 2 and Recovery 4), the values m H 2 O ( l i q u i d ) are similar. Specifically, Recovery 1 and 3 exhibit m H 2 O ( l i q u i d ) around 12.9 g, followed by Recovery 5 (80 °C to 60 °C taking 95 min) and Recovery 6 (80 °C to 45 °C taking 35 min), with m H 2 O ( l i q u i d ) equaling 6.8 g and 4.3 g, respectively. On the other hand, cell cooling down from 80 °C to 60 °C (Recovery 2 and 4) leads to m H 2 O ( l i q u i d ) of only 3.4 g.
When comparing the absolute recovered voltage, Δ U i = n r e c and m H 2 O ( l i q u i d ) , a strong linear correlation is evident, as shown in Figure 4c,d for current densities of 0.05 and 1 A cm−2 (data from Figure 3b). The slope of the fit curves in Figure 4d is higher than that in Figure 4c, indicating that, with the same amount of liquid water, a higher absolute recovered voltage is achieved at a higher current density (1 A cm−2). In the Supplementary Materials (Figure S3), linear correlations between Δ U i = n r e c and m H 2 O ( l i q u i d ) at each evaluated current density from 0 to 1 A cm−2 are shown; in Figure S4 the slopes and intercepts of the linear fits are provided. It is noticeable that the slope of the fit curves increases from 0.7 to 2.5 mV g−1 with increasing current density from 0.05 to 1 A cm−2. In a previous work [34], rehydration of the membrane and ionomer during temperature reduction was proposed as a major contributing factor to the recovery of performance losses. The trend in Figure 4c,d is particularly interesting, as a direct correlation between recovered voltage and the amount of liquid water has not been reported so far. However, a detailed explanation of specific mechanisms requires additional data.

3.2. Recovery Effect of the Non-Operando Performance Recovery Procedures with Temperature Reduction

Figure 5 shows the voltage recorded during the durability test, consisting of five test blocks using the FC-DLC protocol with non-operando recovery procedures of temperature reduction. The vertical dashed lines indicate the performed recovery procedures, before and after which the fuel cell was characterized with polarization curves and EIS measurements. Before each test block, a JRC recovery protocol and fuel cell performance characterization measurements were conducted, assuming all the reversible performance losses were recovered. The irreversible performance degradation rates (see Figure S5 in the Supplementary Materials) are in the range of 75–125 μ V   h 1 , which is significantly higher compared to the test including operando recovery procedures. The reason is that OCV periods occur during the non-operando recovery procedures. The irreversible effects are not discussed in this paper, but it can be stated that they cannot be justified by electrochemical active surface area (ECSA) loss alone. A similar strong ECSA loss was observed after both tests, with operando recovery (decrease from 478 to 227 cm2 mg−1) and with non-operando recovery (decrease from 417 to 200 cm2 mg−1).
In the scheme in Figure 6a, the voltage change between two test blocks is shown. Using Equations (1) and (2), the recovery procedures in this section are evaluated based on the data acquired from polarization curves (see Figure S6 in the Supplementary Materials). Figure 6b shows the absolute recovered voltage losses of the five non-operando temperature reduction procedures in the current density range from 0.0 to 1.5 A cm−2 (the current density range is broader than in Section 3.1, because here the polarization curves were measured while in 3.1 only FC-DLC data were available). Notably, temperature reductions from 80 °C to 45 °C and 80 °C to 60 °C were utilized for both operando and non-operando recovery procedures. The absolute recovered voltages due to the temperature reduction from 80 °C to 45 °C and 80 °C to 60 °C using operando (Figure 3b) and non-operando (Figure 6b) recovery procedures show similar trends in the current density range up to 1 A cm−2; in both cases, the recovered voltage increases significantly with increasing current density. The recovered voltages due to the temperature reduction from 80 °C to 30 °C and 45 °C are higher than those from 80 °C to 60 °C and overlap with each other, especially at current densities lower than 0.9 A cm−2. Interestingly, the recovered voltages due to the temperature reduction from 80 °C to 45 or 30 °C increase over the current density range up to 0.9 A cm−2 and then decrease. The relative recovery of non-operando temperature reduction relative to the JRC recovery protocol is shown in Figure 6c. It is clear that a non-operando temperature reduction from 80 °C to 30 °C and 45 °C results in higher than 80% recovery compared to the JRC recovery protocol in a broad current density range of 0.1–1.2 A cm−2. This means that (i) it is sufficient to cool down to 45 °C and further cooling does not lead to a significantly higher recovery, and (ii) the relative recovery of the non-operando temperature reduction is higher than that of operando temperature reduction (60–70%).
In Figure 7a, the values of the total amount of liquid water, m H 2 O ( l i q u i d ) , due to the five non-operando recovery procedures are provided (evaluated analogously as in Section 3.1). Recovery 1 and 4 (both 80 °C to 30 °C), as well as Recovery 3 and 5 (both 80 °C to 60 °C), have similar values. Cell cooling down from 80 °C to 30 °C, as in Recovery 1 and 4, results in slightly higher m H 2 O ( l i q u i d ) , around 13.2 g, than Recovery 2 (80 °C to 45 °C) with 12.34 g, whereas cell cooling down to 60 °C leads to m H 2 O ( l i q u i d ) of 8.51 g and 8.81 g in Recovery 3 and 5. A similar amount of liquid water formed during the non-operando temperature reduction from 80 °C to 30 °C and 45 °C resulted in the aforementioned similar recovery effect in Figure 6. The linear correlation between the absolute recovered voltage (data from Figure 6b) and the formed liquid water, Δ U i = n r e c and m H 2 O ( l i q u i d ) , during each non-operando recovery procedure is shown in Figure 7b–d at the current densities of 0.05, 1.0, and 1.5 A cm−2, respectively. In the Supplementary Materials, Figure S7 shows the absolute recovered voltage versus the total amount of liquid water formed during non-operando recovery at all the evaluated current densities from 0 to 1.5 A cm−2. Figure S8 shows the slope and intercept of the linear correlation between the Δ U i = n r e c and m H 2 O ( l i q u i d ) over the current density from 0 to 1.5 A cm−2. Unlike in Figure S4, the slope of the fit curves is much higher and changes between 4 and 6 mV⋅g−1 upon the current density from 0.05 to 1 A cm−2, indicating that during non-operando recovery procedures more performance loss is recovered per amount of liquid water formed. This may be because the electrochemical measurements before and after each recovery procedure also recover part of the performance loss. Similar to Figure 4, the linear correlation is strong at the current density from 0.05 to 1 A cm−2. At current densities above 1 A cm−2, the R-Square of the fitting reduces, indicating a weaker linear correlation. It can be concluded that the linear correlation between the amount of liquid water and recovered voltage is evidently in the low to middle current density range, such as 0.05 to 1 A cm−2. On the other hand, at a higher current density range, where mass transport effects play a dominant role, the recovered voltage is less directly influenced by the amount of liquid water.
To elucidate the recovery mechanisms, the original data of EIS measurements at 0.8 A cm−2 conducted at the beginning of each test block, before and after each recovery procedure, are presented in Figure 8a. Directly assessing the influence of the recovery procedure from the recorded spectra of EIS measurements is challenging due to the small changes. This aligns with the subtle alterations observed in the polarization curves in Figure S6. Analyzing the EIS measurement data with other methods, such as model fitting, becomes necessary. The equivalent circuit in Figure 8b is selected and utilized, due to the acceptable fitting error (lower than 3%) and comparability with previous works [32,36]. The model consists of four components in series: (i) a resistor R O h m i c describing the ohmic resistance of the MEA, including the contact resistances of the fuel cell components, (ii) the charge transfer circuit consisting of R C h a r g e   t r a n s f e r in parallel with CPE1 (constant phase element) describing the charge transfer resistance of the cathode catalyst layer, (iii) the mass transfer resistance circuit consisting of R M a s s s   t r a n s f e r in parallel with a constant phase element CPE2, and (iv) an inductance element L regarding possible interferences due to wires or other sources of disturbance. According to the fitting results, the black columns in Figure 8c present the reduced resistance due to each recovery procedure in each test block at 0.8 A cm−2. The red columns with a shadow represent the reduced resistance by the JRC recovery protocol, which is performed at the end of each test block. In general, both the non-operando temperature reduction recovery procedures and the JRC recovery protocols predominantly reduced the charge transfer and mass transfer resistance, while the effect on the ohmic resistance is less prominent. Recovery 1 and 4 (80 °C to 30 °C) led to the highest reduction in R C h a r g e   t r a n s f e r and R M a s s s   t r a n s f e r , while Recovery 3 and 5 (80 °C to 60 °C) caused the lowest reduction, which is consistent with the observations from Figure 6. The reduction in the R C h a r g e   t r a n s f e r due to Recovery 1 and 4 (80 °C to 30 °C) is about 55–66% of the one caused by the JRC recovery protocol, taking the error bar into consideration. The reduction in R M a s s s   t r a n s f e r corresponds to 49–56% of the value caused by the JRC protocol. Thus, it is concluded that the reduction in R C h a r g e   t r a n s f e r mainly contributes to the recovery effect by the non-operando temperature reduction from 80 °C to 30 °C and 45 °C at 0.8 A cm−2. In Figure 6c, the non-operando temperature reductions from 80 °C to 30 °C and 45 ° recover over 80% of the performance relative to the JRC protocol, which is supposed to be a combined result of the reduction in R C h a r g e   t r a n s f e r and R M a s s s   t r a n s f e r . There is a discrepancy in the relative recovery evaluated with the EIS data and the polarization curves, potentially arising from a deviation in the EIS measurements [37]. It has been reported that oxygen concentration oscillations along the cathode flow field exert a significant impact on the local and overall impedance response of the fuel cell in the frequency range lower than 10 Hz. This effect introduces a deviation from the stable fuel cell operation observed in polarization curves measurement [38].
For both operando and non-operando temperature reduction, the recovery effect increases with a longer cooling-down period and a lower cooling-down temperature from 60 °C to 45 or 30 °C. EIS results indicate that cell temperature reduction leads to a reduction in both R C h a r g e   t r a n s f e r and R M a s s s   t r a n s f e r . During the cell temperature reduction, liquid water condenses in the catalyst layers of the anode and cathode. As demonstrated earlier, there is a strong correlation between the amount of liquid water and the recovered voltage. According to Paul et al. [17], exposure to liquid water results in simultaneous reorganization/rearrangement of the ionomer film surface and bulk, which strongly influences the operando behavior of ionomer in the cathode catalyst layer of PEMFCs. Consequently, adjusting relative humidity or cooling down the cell can eliminate part of the performance loss caused by ionomer degradation, as it facilitates ionomer regeneration and redistribution in the catalyst layer [39,40].
It is widely acknowledged that the ion- and solvent-transport capabilities of PFSA ionomers are governed by their morphology, which, however, highly depend on the hydration of the hydrophilic ionic groups [41,42]. The ionic and mass transfer resistance reduces with increased humidity due to a varying ionomer morphology, which is minimized when the PFSA ionomer is immersed into water [43,44]. It has been observed that the fraction of conductive and hydrophilic area of PFSA ionomer increases due to a regeneration/redistribution effect along with increased humidity [45,46]. In particular, there is a change in water content and morphology depending on the phase of water (vapor or liquid), which further influences the ionic and water conductivity in the ionomer and between the membrane/electrode interface [47,48]. Therefore, it is observed in this work that the temperature reduction step (in both the operando/non-operando recovery procedures and JRC recovery protocol) results in reduced charge transfer resistance in the cathode catalyst layer and, accordingly, a recovery effect on the performance degradation. However, the time constant of the process strongly depends on factors such as water uptake, morphology, temperature, and relative humidity [49,50]. It can take a long time, from days to weeks, to complete the regeneration/redistribution of the ionomer and reach a quasi-equilibrium state [51,52]. Thus, as observed in this work, the duration of the temperature reduction, which refers to the time the ionomer is exposed to liquid water, has a significant impact on the recovery efficiency.
Furthermore, both the temperature reduction and JRC recovery protocols result in increased water uptake due to the enhanced hydrophilicity of the ionomer. The pathway for water molecules to move is created within the nanostructure of the ionomer, which needs to accommodate the nanoswelling and growth of water domains [53,54]. Consequently, the water transfer coefficient increases in the ionomer as the water content increases, until reaching an equilibrium state [55,56]. In this study, the JRC recovery protocol requires a longer duration compared to the temperature reduction recovery protocol, bringing it closer to the equilibrium state and resulting in a more significant reduction in water transfer resistance.
Figure 6b,c indicate a decrease in both the absolute recovered voltage and the recovery relative to the JRC recovery protocol at a high current density range (>1.0 A cm−2). This suggests that the JRC recovery protocol achieves a higher reduction in R M a s s s   t r a n s f e r compared to recovery procedures involving temperature reduction, leading to superior recovery of performance losses at high current density. The JRC recovery protocol in this work includes a shut-down step, which follows a similar recovery mechanism to non-operando temperature reduction recovery procedures but with a longer cooling-down time and lower temperature (80 °C to 25 °C for 8 h). Additionally, the JRC recovery protocol involves two steps with dry N2 purging in the anode and cathode lasting 1 h in total, aimed at removing excess water and preventing flooding on the catalyst surface. Moreover, the H2 soak step aids in removing Pt oxides on the cathode‘s catalyst surface. These additional steps contribute to the higher recovery effect of the JRC protocol, reducing R C h a r g e   t r a n s f e r and R M a s s s   t r a n s f e r , especially at high current density.

4. Conclusions

In this study, we assessed the effectiveness of time-efficient (operando) procedures for recovering reversible performance degradation in PEMFCs through temperature reduction. We compared these procedures with the more intricate JRC recovery protocol, which served as a reference. The following conclusions can be drawn:
  • Temperature reduction (associated with water condensation) is often attributed to the recovery of voltage losses resulting from the regeneration/redistribution of the ionomer structure, representing a primary effect. Therefore, its efficacy is anticipated to be influenced by specific operation conditions, particularly the level of relative humidity (RH). To avoid overinterpretation of our study, it is crucial to emphasize that the conclusions drawn from our study are applicable to MEAs operated at 100% RH; variations in RH levels are expected to result in quantitative differences in the observed outcomes;
  • The amount of liquid water generated in the cathode during the operando recovery procedure exhibits a positive linear correlation with the absolute recovered voltage, particularly within a current density range below 1 A cm−2. This finding confirms the pivotal role of liquid water in the recovery of performance losses, likely associated with ionomer hydration and the resultant structure changes. Consequently, the observed results are anticipated to be applicable irrespective of the catalyst type, whether Pt/C (as in this study) or an alloyed catalyst (e.g., Pt-Co/C) is utilized;
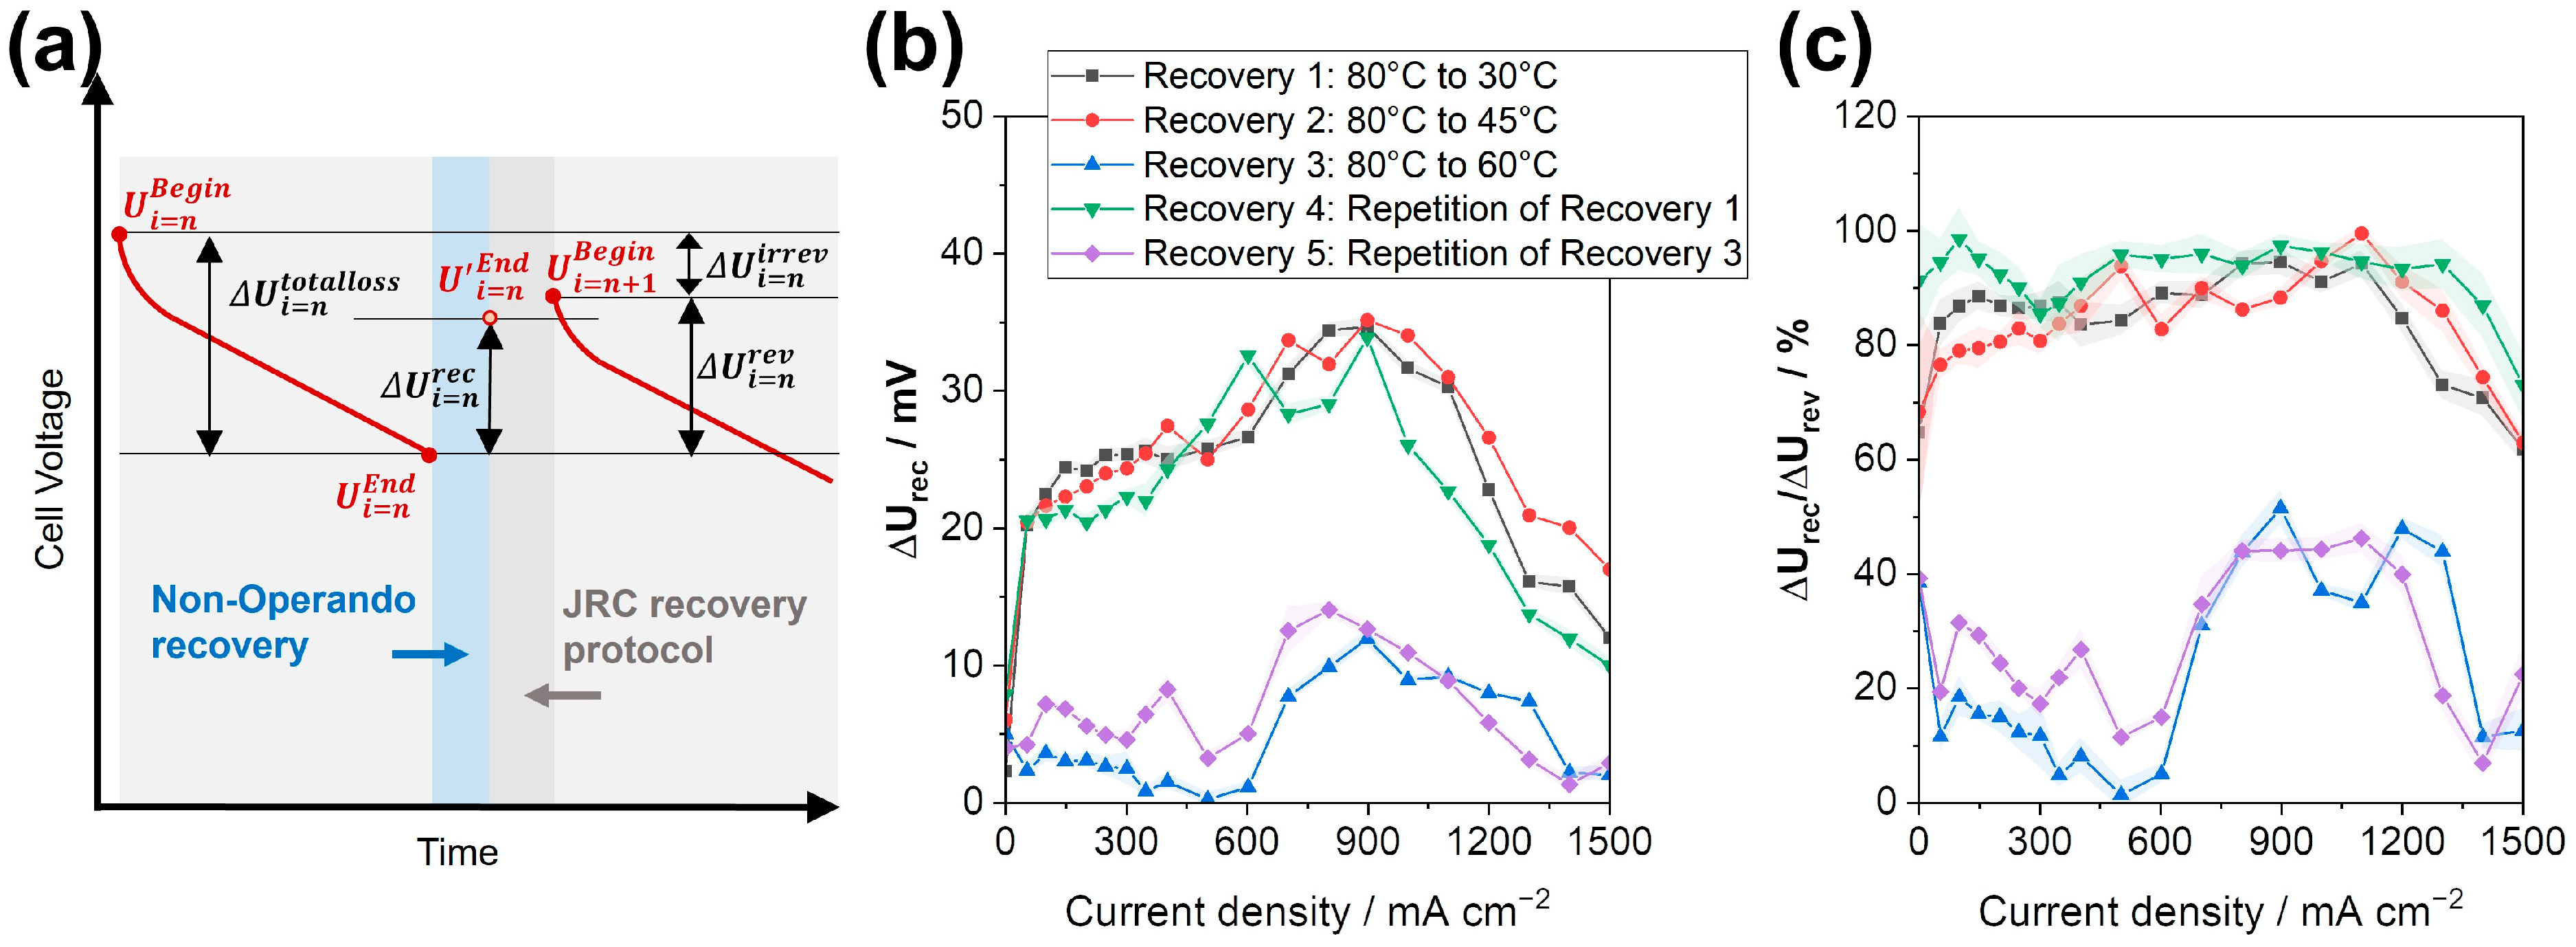
  • Operando temperature reduction during load cycling leads to 60–70% of the recovery of the JRC protocol at a much shorter duration (1.5 h versus 10.5 h). If the cell is kept at OCV during temperature reduction, the relative recovery is higher than 80%, likely due to avoiding flooding since no product water can be generated;
  • The reduction in temperature from 80 °C to 45 °C is sufficient, and a further reduction to 30 °C does not lead to further recovery (at a similar duration). Longer durations of the cooling-down process have a slightly positive effect on the recovery of performance losses;
  • Based on EIS data, the main contribution to recovery is the reduction in charge transfer resistance, followed by the reduction in mass transport resistance;
  • It could be argued that the recovery due to water management, which was investigated using a specific flow field design, cannot be generalized because it strongly depends on the flow field design. Water management and the corresponding performances of PEMFCs have been shown to vary based on factors such as the flow field design (e.g., straight parallel channels, single or multiple serpentine channels, interdigitated channel or pin-type structures), channel geometry, and surface properties [57,58]. However, many studies have comparatively investigated, both experimentally and theoretically, the differences between flow field geometries, allowing variances for other configurations to be assessed [59,60].
Generally, temperature reduction during operation results in a partial recovery of the reversible performance degradation. In contrast to common recovery procedures, such as the protocol from JRC, the temperature reduction recovery is less time-demanding and easier to implement, since no additional equipment, such as a nitrogen gas supply, is needed. Therefore, it is suitable for use during operation in transport applications. Moreover, it is expected that at the stack level the recovery procedure can be easily implemented, because the specific thermal mass is much lower (10–20 times) than in the lab-scale cell used in this study. On the other hand, it is noteworthy that a voltage drop occurs during the operando recovery procedure (up to 50 mV at 1 A cm−2). In real-world applications, to prevent a significant cell voltage drop and potential global gas starvation, it is necessary to avoid high current density during the operando recovery procedure. In scenarios where there is a sudden demand for power, such as dynamic operations with fuel cell vehicles, the fuel cell stack can be supported by the battery pack during the implementation of an operando recovery procedure.
In this work, a global temperature reduction was applied, and no significant local recovery effects are expected. Thus, in a full-scale cell area without significant inhomogeneity of the current density distribution along the flow channels, the effect of the operando recovery procedure should be similar to the results obtained using a small-scale cell area. However, the scaling-up effect (from a small single cell to a full stack system) on recovery depends on the specific operation parameters and system configuration [61]. Therefore, operando temperature reduction with a full-scale fuel cell system needs to be investigated using dedicated experiments to determine the appropriate setpoint temperatures and durations for a given stack.

Supplementary Materials

The following supporting information can be downloaded at: https://www.mdpi.com/article/10.3390/en17040774/s1. Figure S1: Voltage changes during the operando temperature reduction: (a,e) correspond to Recovery 1, 80 °C to 45 °C (95 min); (b,f) correspond to Recovery 2, 80 °C to 60 °C (35 min); (c,g) correspond to Recovery 5, 80 °C to 60 °C (95 min); (d,h) correspond to Recovery 6, 80 °C to 45 °C (35 min). Recovery 3 and 4 are repetitions of Recovery 1 and 2, which show similar results and are not presented here. Figure S2: (a) Cell voltage recorded during the durability test for the investigation of recovery procedures based on operando temperature reduction. The red points are the cell voltage at the beginning of each test block at 1 A cm−2. (b) Irreversible degradation rate at the current density range from 0 to 1 A cm−2. Figure S3: Absolute recovered voltage versus total amount of liquid water formed during operando recovery at all the evaluated current densities, from 0 to 1 A cm−2. Recovered voltage corresponds to data from Figure 3b. Figure S4: Slope and intercept of the linear fitting results between the absolute recovered voltage and the formed liquid water during each operando recovery procedure at different current densities. Figure S5: (a) Cell voltage recorded during the durability test for the investigation of recovery procedures based on non-operando temperature reduction. The red points are the cell voltage at the beginning of each test block at 1 A cm−2. (b) Irreversible degradation rate at the current density range from 0 to 1 A cm−2. Figure S6: Polarization curves measured during the durability test with non-operando temperature reduction. The error bars correspond to the standard deviation from the average of the last 30 s of the dwell time of each tested current density step. Figure S7: Absolute recovered voltage versus total amount of liquid water formed during non-operando recovery at all the evaluated current densities, from 0 to 1.5 A cm−2. Recovered voltage corresponds to data from Figure 6b. Figure S8: Slope and intercept of the linear fitting results between the absolute recovered voltage and the formed liquid water during each non-operando recovery procedure at different current densities.

Author Contributions

Conceptualization, Q.Z., M.S., P.G. and K.A.F.; methodology, Q.Z., M.S., P.G. and K.A.F.; software, Q.Z.; validation, Q.Z.; formal analysis, Q.Z.; investigation, Q.Z.; writing—original draft preparation, Q.Z.; writing—review and editing, Q.Z., M.S., P.G. and K.A.F.; supervision, M.S., P.G. and K.A.F.; funding acquisition, Q.Z. All authors have read and agreed to the published version of the manuscript.

Funding

This research received funding from the China Scholarship Council.

Data Availability Statement

The data presented in this study are available on request from the corresponding author. The data are not publicly available due to privacy reasons.

Conflicts of Interest

The authors declare no conflicts of interest.

References

  1. Jiang, S.; Wang, C.; Zhang, C.; Bai, H.; Xu, L. Adaptive estimation of road slope and vehicle mass of fuel cell vehicle. eTransportation 2019, 2, 100023. [Google Scholar] [CrossRef]
  2. Greene, D.L.; Ogden, J.M.; Lin, Z. Challenges in the designing, planning and deployment of hydrogen refueling infrastructure for fuel cell electric vehicles. eTransportation 2020, 6, 100086. [Google Scholar] [CrossRef]
  3. Tanaka, S.; Nagumo, K.; Yamamoto, M.; Chiba, H.; Yoshida, K.; Okano, R. Fuel cell system for Honda CLARITY fuel cell. eTransportation 2020, 3, 100046. [Google Scholar] [CrossRef]
  4. Strategic Research and Innovation Agenda Clean Hydrogen Joint Undertaking 2021–2027. Available online: https://www.clean-hydrogen.europa.eu/about-us/key-documents/strategic-research-and-innovation-agenda_en (accessed on 1 October 2023).
  5. Marcinkoski, J. Hydrogen Class 8 Long Haul Truck Targets 2019. Available online: https://www.hydrogen.energy.gov/docs/hydrogenprogramlibraries/pdfs/19006_hydrogen_class8_long_haul_truck_targets.pdf?Status=Master (accessed on 1 October 2023).
  6. Zhao, J.; Li, X. Fuel cell durability under automotive driving cycles—Fundamentals and experiments. In Fuel Cells for Transportation; Elsevier: Amsterdam, The Netherlands, 2023; pp. 419–462. [Google Scholar] [CrossRef]
  7. Lin, R.; Li, B.; Hou, Y.; Ma, J. Investigation of dynamic driving cycle effect on performance degradation and micro-structure change of PEM fuel cell. Int. J. Hydrogen Energy 2009, 34, 2369–2376. [Google Scholar] [CrossRef]
  8. Garzon, F.H.; Lopes, T.; Rockward, T.; Sansinena, J.M.; Kienitz, B.; Mukundan, R.; Springer, T. The Impact of Impurities On Long Term PEMFC Performance. ECS Trans. 2009, 25, 1575–1583. [Google Scholar] [CrossRef]
  9. Dhanushkodi, S.R.; Kundu, S.; Fowler, M.W.; Pritzker, M.D. Study of the effect of temperature on Pt dissolution in polymer electrolyte membrane fuel cells via accelerated stress tests. J. Power Sources 2014, 245, 1035–1045. [Google Scholar] [CrossRef]
  10. Zago, M.; Baricci, A.; Bisello, A.; Jahnke, T.; Yu, H.; Maric, R.; Zelenay, P.; Casalegno, A. Experimental analysis of recoverable performance loss induced by platinum oxide formation at the polymer electrolyte membrane fuel cell cathode. J. Power Sources 2020, 455, 227990. [Google Scholar] [CrossRef]
  11. Qi, Z.G.; Tang, H.; Guo, Q.H.; Du, B. Investigation on “saw-tooth” behavior of PEM fuel cell performance during shutdown and restart cycles. J. Power Sources 2006, 161, 864–871. [Google Scholar] [CrossRef]
  12. Stumper, E.; Lohr, M.; Hamada, S. Diagnostic tools for liquid water in PEM fuel cells. J. Power Sources 2005, 143, 150–157. [Google Scholar] [CrossRef]
  13. Mitzel, J.; Zhang, Q.; Gazdzicki, P.; Friedrich, K.A. Review on mechanisms and recovery procedures for reversible performance losses in polymer electrolyte membrane fuel cells. J. Power Sources 2021, 488, 229375. [Google Scholar] [CrossRef]
  14. Shi, W.Y.; Yi, B.L.; Hou, M.; Jing, F.N.; Ming, P.W. Hydrogen sulfide poisoning and recovery of PEMFC Pt-anodes. J. Power Sources 2007, 165, 814–818. [Google Scholar] [CrossRef]
  15. Du, F.M.; Dao, T.A.; Peitl, P.V.J.; Bauer, A.; Preuss, K.; Bonastre, A.M.; Sharman, J.; Spikes, G.; Perchthaler, M.; Schmidt, T.J.; et al. Effects of PEMFC Operational History under Dry/Wet Conditions on Additional Voltage Losses due to Ionomer Migration. J. Electrochem. Soc. 2020, 167, 144513–144527. [Google Scholar] [CrossRef]
  16. Inaba, M.; Yamada, H.; Tokunaga, J.; Tasaka, A. Effect of agglomeration of Pt/C catalyst on hydrogen peroxide formation. Electrochem. Solid. St. 2004, 7, A474. [Google Scholar] [CrossRef]
  17. Paul, D.K.; Karan, K. Conductivity and Wettability Changes of Ultrathin Nafion Films Subjected to Thermal Annealing and Liquid Water Exposure. J. Phys. Chem. C 2014, 118, 1828–1835. [Google Scholar] [CrossRef]
  18. Ott, S.; Bauer, A.; Du, F.M.; Dao, T.A.; Klingenhof, M.; Orfanidi, A.; Strasser, P. Impact of Carbon Support Meso-Porosity on Mass Transport and Performance of PEMFC Cathode Catalyst Layers. Chemcatchem 2021, 13, 4759–4769. [Google Scholar] [CrossRef]
  19. Langlois, D.A.; Lee, A.S.; Macauley, N.; Maurya, S.; Hawley, M.E.; Yim, S.D.; Kim, Y.S. A rejuvenation process to enhance the durability of low Pt loaded polymer electrolyte membrane fuel cells. J. Power Sources 2018, 396, 345–354. [Google Scholar] [CrossRef]
  20. Cetinbas, F.C.; Ahluwalia, R.K.; Kariuki, N.N.; De Andrade, V.; Myers, D.J. Effects of Porous Carbon Morphology, Agglomerate Structure and Relative Humidity on Local Oxygen Transport Resistance. J. Electrochem. Soc. 2019, 167, 013508. [Google Scholar] [CrossRef]
  21. Van Dine, L.L.; Steinbugler, M.M.; Reiser, C.A.; Scheffler, G.W. Procedure for Shutting Down A Fuel Cell System Having An Anode Exhaust Recycle Loop. U.S. Patent 6514635B2, 4 April 2004. Available online: https://patents.google.com/patent/US6514635B2/en (accessed on 1 October 2023).
  22. Colombo, E.; Baricci, A.; Bisello, A.; Guetaz, L.; Casalegno, A. PEMFC performance decay during real-world automotive operation: Evincing degradation mechanisms and heterogeneity of ageing. J. Power Sources 2023, 553, 232246. [Google Scholar] [CrossRef]
  23. Guétaz, L.; Escribano, S.; Sicardy, O. Study by electron microscopy of proton exchange membrane fuel cell membrane-electrode assembly degradation mechanisms: Influence of local conditions. J. Power Sources 2012, 212, 169–178. [Google Scholar] [CrossRef]
  24. Steinbach, A.J.; Hamilton, C.V.; Debe, M.K. Impact of micromolar concentrations of externally-provided chloride and sulfide contaminants on PEMFC reversible stability. ECS Trans. 2007, 11, 889. [Google Scholar] [CrossRef]
  25. Prass, S.; Friedrich, K.A.; Zamel, N. Tolerance and Recovery of Ultralow-Loaded Platinum Anode Electrodes upon Carbon Monoxide and Hydrogen Sulfide Exposure. Molecules 2019, 24, 3514. [Google Scholar] [CrossRef]
  26. Pivac, I.; Barbir, F. Impact of Shutdown Procedures on Recovery Phenomena of Proton Exchange Membrane Fuel Cells. Fuel Cells 2020, 20, 185–195. [Google Scholar] [CrossRef]
  27. Kabir, S.; Myers, D.J.; Kariuki, N.; Park, J.; Wang, G.X.; Baker, A.; Macauley, N.; Mukundan, R.; More, K.L.; Neyerlin, K.C. Elucidating the Dynamic Nature of Fuel Cell Electrodes as a Function of Conditioning: An ex Situ Material Characterization and in Situ Electrochemical Diagnostic Study. ACS Appl. Mater. Interfaces 2019, 11, 45016–45030. [Google Scholar] [CrossRef] [PubMed]
  28. Zhang, J.X.; Litteer, B.A.; Coms, F.D.; Makharia, R. Recoverable Performance Loss Due to Membrane Chemical Degradation in PEM Fuel Cells. J. Electrochem. Soc. 2012, 159, F287. [Google Scholar] [CrossRef]
  29. Robb, G.M.; Folmsbee, D.T. Procedure for Stack Voltage Recovery. U.S. Patent 9343760B2, 17 May 2014. Available online: https://patents.google.com/patent/US9343760B2/en (accessed on 1 October 2023).
  30. Shokhen, V.; Strandberg, L.; Skoglundh, M.; Wickman, B. Impact of Accelerated Stress Tests on the Cathodic Catalytic Layer in a Proton Exchange Membrane (PEM) Fuel Cell Studied by Identical Location Scanning Electron Microscopy. ACS Appl. Energy Mater. 2022, 5, 11200–11212. [Google Scholar] [CrossRef]
  31. Gazdzick, P.; Mitzel, J.; Sanchez, D.G.; Schulze, M.; Friedrich, K.A. Evaluation of reversible and irreversible degradation rates of polymer electrolyte membrane fuel cells tested in automotive conditions. J. Power Sources 2016, 327, 86–95. [Google Scholar] [CrossRef]
  32. Talukdar, K.; Gazdzicki, P.; Friedrich, K.A. Comparative investigation into the performance and durability of long and short side chain ionomers in Polymer Electrolyte Membrane Fuel Cells. J. Power Sources 2019, 439, 227078. [Google Scholar] [CrossRef]
  33. Sanchez, D.G.; Ortiz, A.; Friedrich, K.A. Oscillation of PEFC under low cathode humidification: Effect of gravitation and bipolar plate design. J. Electrochem. Soc. 2013, 160, F636. [Google Scholar] [CrossRef]
  34. Zhang, Q.; Schulze, M.; Gazdzicki, P.; Friedrich, K.A. Comparison of different performance recovery procedures for polymer electrolyte membrane fuel cells. Appl. Energy 2021, 302, 117490. [Google Scholar] [CrossRef]
  35. Tsotridis, G.; Pilenga, A.; De Marco, G.; Malkow, T. EU Harmonised Test Protocols for PEMFC MEA Testing in Single Cell Configuration for Automotive Applications; JRC Science for Policy report 2015; European Commission: Brussels, Belgium, 2015; Volume 27632. [CrossRef]
  36. Schulze, M.; Wagner, N.; Kaz, T.; Friedrich, K.A. Combined electrochemical and surface analysis investigation of degradation processes in polymer electrolyte membrane fuel cells. Electrochim. Acta 2007, 52, 2328–2336. [Google Scholar] [CrossRef]
  37. Tang, Z.P.; Huang, Q.A.; Wang, Y.J.; Zhang, F.Z.; Li, W.H.; Li, A.J.; Zhang, L.; Zhang, J.J. Recent progress in the use of electrochemical impedance spectroscopy for the measurement, monitoring, diagnosis and optimization of proton exchange membrane fuel cell performance. J. Power Sources 2020, 468, 228361. [Google Scholar] [CrossRef]
  38. Schneider, I.A.; Kramer, D.; Wokaun, A.; Scherer, G.G. Oscillations in gas channels—II. Unraveling the characteristics of the low frequency loop in air-fed PEFC impedance spectra. J. Electrochem. Soc. 2007, 154, B770. [Google Scholar] [CrossRef]
  39. Yin, Y.; Li, R.T.; Bai, F.Q.; Zhu, W.K.; Qin, Y.Z.; Chang, Y.F.; Zhang, J.F.; Guiver, M.D. Ionomer migration within PEMFC catalyst layers induced by humidity changes. Electrochem. Commun. 2019, 109, 106590. [Google Scholar] [CrossRef]
  40. Morawietz, T.; Handl, M.; Oldani, C.; Friedrich, K.A.; Hiesgen, R. Quantitative in Situ Analysis of Ionomer Structure in Fuel Cell Catalytic Layers. ACS Appl. Mater. Interfaces 2016, 8, 27044–27054. [Google Scholar] [CrossRef]
  41. Mauritz, K.A.; Moore, R.B. State of Understanding of Nafion. Chem. Rev. 2004, 104, 4535–4586. [Google Scholar] [CrossRef]
  42. Kusoglu, A.; Weber, A.Z. New Insights into Perfluorinated Sulfonic-Acid Ionomers. Chem. Rev. 2017, 117, 987–1104. [Google Scholar] [CrossRef]
  43. Ye, X.; LeVan, M.D. Water transport properties of Nafion membranes: Part I. Single-tube membrane module for air drying. J. Membr. Sci. 2003, 221, 147–161. [Google Scholar] [CrossRef]
  44. Monroe, C.W.; Romero, T.; Mérida, W.; Eikerling, M. A vaporization-exchange model for water sorption and flux in Nafion. J. Membr. Sci. 2008, 324, 1–6. [Google Scholar] [CrossRef]
  45. Aleksandrova, E.; Hiesgen, R.; Eberhard, D.; Friedrich, K.A.; Kaz, T.; Roduner, E. Proton Conductivity Study of a Fuel Cell Membrane with Nanoscale Resolution. ChemPhysChem 2007, 8, 519–522. [Google Scholar] [CrossRef] [PubMed]
  46. He, Q.; Kusoglu, A.; Lucas, I.T.; Clark, K.; Weber, A.Z.; Kostecki, R. Correlating humidity-dependent ionically conductive surface area with transport phenomena in proton-exchange membranes. J. Phys. Chem. B 2011, 115, 11650–11657. [Google Scholar] [CrossRef]
  47. Adachi, M.; Navessin, T.; Xie, Z.; Frisken, B.; Holdcroft, S. Correlation of in situ and ex situ measurements of water permeation through Nafion NRE211 proton exchange membranes. J. Electrochem. Soc. 2009, 156, B782. [Google Scholar] [CrossRef]
  48. Adachi, M.; Navessin, T.; Xie, Z.; Li, F.H.; Tanaka, S.; Holdcroft, S. Thickness dependence of water permeation through proton exchange membranes. J. Membr. Sci. 2010, 364, 183–193. [Google Scholar] [CrossRef]
  49. Alberti, G.; Narducci, R. Evolution of permanent deformations (or memory) in Nafion 117 membranes with changes in temperature, relative humidity and time, and its importance in the development of medium temperature PEMFCs. Fuel Cells 2009, 9, 410–420. [Google Scholar] [CrossRef]
  50. Casciola, M.; Alberti, G.; Sganappa, M.; Narducci, R. On the decay of Nafion proton conductivity at high temperature and relative humidity. J. Power Sources 2006, 162, 141–145. [Google Scholar] [CrossRef]
  51. Fumagalli, M.; Lyonnard, S.; Prajapati, G.; Berrod, Q.; Porcar, L.; Guillermo, A.; Gebel, G. Fast water diffusion and long-term polymer reorganization during Nafion membrane hydration evidenced by time-resolved small-angle neutron scattering. J. Phys. Chem. B 2015, 119, 7068–7076. [Google Scholar] [CrossRef] [PubMed]
  52. Gebel, G.; Lyonnard, S.; Mendil-Jakani, H.; Morin, A. The kinetics of water sorption in Nafion membranes: A small-angle neutron scattering study. J. Phys. Condens. Matter 2011, 23, 234107. [Google Scholar] [CrossRef] [PubMed]
  53. Gierke, T.D.; Munn, G.; Wilson, F. The morphology in nafion perfluorinated membrane products, as determined by wide-and small-angle x-ray studies. J. Polym. Sci. Polym. Phys. Ed. 1981, 19, 1687–1704. [Google Scholar] [CrossRef]
  54. Safiollah, M.; Melchy, P.-E.A.; Berg, P.; Eikerling, M. Model of water sorption and swelling in polymer electrolyte membranes: Diagnostic applications. J. Phys. Chem. B 2015, 119, 8165–8175. [Google Scholar] [CrossRef]
  55. Mittelsteadt, C.K.; Staser, J. Simultaneous water uptake, diffusivity and permeability measurement of perfluorinated sulfonic acid polymer electrolyte membranes. ECS Trans. 2011, 41, 101. [Google Scholar] [CrossRef]
  56. Takamatsu, T.; Hashiyama, M.; Eisenberg, A. Sorption phenomena in Nafion membranes. J. Appl. Polym. Sci. 1979, 24, 2199–2220. [Google Scholar] [CrossRef]
  57. Sauermoser, M.; Kizilova, N.; Pollet, B.G.; Kjelstrup, S. Flow Field Patterns for Proton Exchange Membrane Fuel Cells. Front. Energy Res. 2020, 8, 13. [Google Scholar] [CrossRef]
  58. Lim, B.H.; Majlan, E.H.; Daud, W.R.W.; Husaini, T.; Rosli, M.I. Effects of flow field design on water management and reactant distribution in PEMFC: A review. Ionics 2016, 22, 301–316. [Google Scholar] [CrossRef]
  59. Pan, W.T.; Wang, P.H.; Chen, X.L.; Wang, F.C.; Dai, G.C. Combined effects of flow channel configuration and operating conditions on PEM fuel cell performance. Energy Convers. Manag. 2020, 220, 113046. [Google Scholar] [CrossRef]
  60. Arif, M.; Cheung, S.C.; Andrews, J. Numerical investigation of effects of different flow channel configurations on the 100 cm2 PEM fuel cell performance under different operating conditions. Catal. Today 2022, 397, 449–462. [Google Scholar] [CrossRef]
  61. Bonnet, C.; Didierjean, S.; Guillet, N.; Besse, S.; Colinart, T.; Carré, P. Design of an 80 kWe PEM fuel cell system: Scale up effect investigation. J. Power Sources 2008, 182, 441–448. [Google Scholar] [CrossRef]
Figure 1. (a) Fuel cell dynamic load cycle (FC-DLC) used in this study. Flow charts of the two durability tests carried out to study recovery procedures with (b) operando and (c) non-operando temperature reduction. The sequence of the applied recovery procedures is provided in Table 1.
Energies 17 00774 g001
Figure 2. Cell voltage recorded during the durability test (FC-DLC protocol) for the investigation of recovery procedures based on operando temperature reduction. Vertical dashed lines label the starting point of the applied recovery procedures.
Energies 17 00774 g002
Figure 3. (a) Definitions for the evaluation of the relative recovery. (b) Recovered voltage versus current density calculated according to Equation (1). (c) Relative recovery calculated using Equations (1) and (2).
Energies 17 00774 g003
Figure 4. (a) Cell temperature (black data) during operando cooling down from 80 °C to 45 °C, along with the calculated value of the total water input in the inlet plus product water, m ˙ H 2 O ( v a p o r ) , i n l e t + m ˙ H 2 O , p r o d (red data), maximum amount of vaporous water, m ˙ H 2 O ( v a p o r ) , o u t l e t , in the cathode outlet considering the pressure drop of the cell (blue data), and the flow of liquid water, m ˙ H 2 O ( l i q u i d ) , o u t l e t , in the outlet (green data); (b) Total amounts of liquid water, m H 2 O ( l i q u i d ) (integrated signals of m ˙ H 2 O ( l i q u i d ) , o u t l e t ), during different operando temperature reduction procedures. (c,d) show the absolute recovered voltage versus the total amount of liquid water formed during the operando recovery (Re. #) at 0.05 A cm−2 and 1 A cm−2, respectively. Recovered voltage corresponds to data from Figure 3b.
Energies 17 00774 g004
Figure 5. Cell voltage recorded during the durability test (FC-DLC protocol, see Figure 1a) for the investigation of recovery procedures based on non-operando temperature reduction.
Energies 17 00774 g005
Figure 6. Evaluation of the relative recovery of the five recovery procedures. (a) The general scheme of cell voltage changes during a fuel cell durability test with a recovery procedure of non-operando temperature reduction. (b) The recovered voltage calculated according to Equation (1). (c) The relative recovery which relates to the reversible performance losses, according to Equations (1) and (2).
Energies 17 00774 g006
Figure 7. (a) Total amounts of liquid water m H 2 O ( l i q u i d ) (integrated signals of m ˙ H 2 O ( l i q u i d ) , o u t l e t ) during different non-operando temperature reduction procedures. Absolute recovered voltage versus total amount of liquid water formed during non-operando recovery at (b) 0.05 A cm−2, (c) 1 A cm−2, and (d) 1.5 A cm−2. The recovered voltage corresponds to the data from Figure 6b.
Energies 17 00774 g007
Figure 8. (a) EIS measurements at 0.8 A cm−2 conducted at the beginning of each test block, before and after each recovery procedure. Recorded frequency range was from 100 mHz to 10 kHz with a perturbation amplitude of ±5%. (b) Equivalent circuit model used for fitting EIS data recorded at the beginning and end of each test block, as well as after each recovery procedure. (c) Reduction in ohmic resistance, charge transfer resistance, and mass transfer resistance due to each performed recovery procedure (corresponding test block) and the following JRC recovery protocol.
Energies 17 00774 g008
Table 1. Performance recovery procedures included in durability tests.
#OperandoNon-Operando
Recovery 180 °C to 45 °C (95 min)80 °C to 30 °C (95 min)
Recovery 280 °C to 60 °C (35 min)80 °C to 45 °C (95 min)
Recovery 3Repetition of Recovery 180 °C to 60 °C (95 min)
Recovery 4Repetition of Recovery 2Repetition of Recovery 1
Recovery 580 °C to 60 °C (95 min)Repetition of Recovery 3
Recovery 680 °C to 45 °C (35 min)-
Disclaimer/Publisher’s Note: The statements, opinions and data contained in all publications are solely those of the individual author(s) and contributor(s) and not of MDPI and/or the editor(s). MDPI and/or the editor(s) disclaim responsibility for any injury to people or property resulting from any ideas, methods, instructions or products referred to in the content.

