1. Introduction
Economic growth and electrification have been driving the increase in global energy demand. To meet this demand, more fossil fuels—coal, oil, and natural gas—are consumed daily [
1]. The growing use of fossil fuels, which emit greenhouse gases (GHGs), such as carbon dioxide, methane, and nitrous oxide when combusted, has disrupted the ecological balance. This disruption, named climate change, refers to long-term shifts in the global climate system’s patterns (i.e., precipitation and temperature) [
2]. The increasing amount of GHGs in the atmosphere causes global warming and the severe consequences of climate change accordingly. The most dramatic and direct impacts of climate change are extreme weather events, such as storms, droughts, and floods, however, further effects, including reduced crop productivity and forced migration, are seen in some regions [
3].
Currently, climate change is recognized as a global emergency that needs to be addressed by international cooperation. In 2015, The Paris Agreement, which is the first legally binding global climate change agreement was adopted by 193 Parties (192 countries plus the European Union), including Turkey, at the UN Climate Change Conference (COP21). The agreement aims to limit the global average temperature rise in this century to 2 degrees Celsius, while pursuing efforts to limit it even further to 1.5 degrees Celsius by reducing GHG emissions. The agreement presents a framework to change the global energy system and shift to a carbon-free economy. Although the aim is common for all parties, since the path to be followed by parties differs, it was decided to prepare national documents called Intended Nationally Determined Contributions (INDC). Based on these facts, all nations have started implementing several strategies to mitigate the negative impacts of climate change. These strategies focus both on energy efficiency and the use of renewable energy sources to decarbonize the country’s economy and achieve significant GHG emissions reduction and sustainable development simultaneously [
4].
While all sectors adopt low-carbon solutions, electricity generation is experiencing a more rapid decarbonization than the other sectors, leading to scenarios where the most cost-effective way to reduce carbon intensity is increased electrification [
5]. In 2018, the electricity sector had the highest share of renewable energy use, 26%; however, only 17% of total final energy consumption (TFEC) was electrical end uses. The thermal/heat energy sector, including space and water heating, space cooling, and industrial process heat, accounted for 51% of TFEC, and 11% of the energy was supplied from renewables. The third end use, the transport sector, had the lowest share of renewable energy by only 3.3% and accounted for 32% of TFEC [
6]. However, one of the major issues related to renewable energy sources is their intermittent nature, meaning they have a relatively reduced capacity factor (~20–40%) and low reliability [
7]. Therefore, fossil fuel resources should be used wisely by integrating renewable energy sources and energy storage options for reducing fossil fuel dependency [
8].
Clearly, a change in an energy system is slow and complex and contains many challenges. The latest report of the Intergovernmental Panel on Climate Change (IPCC) states that during this century, it is likely that warming will exceed 1.5 degrees Celsius, taking into account the global GHG emissions in 2030 associated with the implementation of submitted INDCs. Also, limiting warming to below 2 degrees Celsius requires accelerated mitigation efforts after 2030 [
9]. The urgent need to tackle climate change drives the research on new technologies to help the transition of energy systems. Hydrogen is one of the latest technologies, which is under significant consideration by many countries as a means to reach zero-carbon goals, especially for low-carbon transport, industrial decarbonization, and heat provision [
10]. The combustion of hydrogen does not result in any harmful emissions, such as carbon dioxide (CO
2) and carbon monoxide (CO). Carbon-neutral hydrogen can be produced by using renewable energy sources or fossil fuels with carbon capture and storage technologies. The replacement of hydrocarbon-based fuels by hydrogen in the transportation and manufacturing sectors could result in a significant reduction in global carbon emissions.
Moreover, hydrogen can play a key role in solving the intermittency issue of renewable energy sources by being an energy carrier storing electricity that is converted back to electricity via fuel cell technology. For example, fuel cells with innovative membranes that show remarkable proton conductivity and mechanical stability are used to convert hydrogen into electricity for transport applications [
11,
12,
13]. In addition, proton exchange membrane fuel cells (PEMFCs) have emerged as very promising alternative fuel sources for vehicles and have attracted widespread attention for their remarkable strengths such as zero pollution, high energy density, and low noise [
14,
15]. In particular, PEMFCs require higher power and current density to meet the demands of commercial applications. However, problems such as liquid water accumulation in the gas diffusion layer cause flooding and impede gas diffusion at high operating current density, leading to rapid degradation of cell performance [
16]. Therefore, improving water management capabilities is essential to unlock the full potential of the PEMFC and improve cell output performance. The main factors causing performance degradation in PEMFCs include the degradation of electrode materials, catalyst loss, mechanical damage to the membrane electrode assembly, and fluctuations in operating conditions, which can be predicted using a Transformer model [
17]. Hydrogen is also considered a low-carbon natural gas substitute that can blend into natural gas to further ensure energy security while cutting emissions [
18].
Ratifying the Paris Agreement in October 2021, Turkey announced a net zero by 2053 target. Prior to the Paris Agreement, Turkey published the National Climate Change Strategy and the action plan for the period of 2010–2023 in line with the United Nations Framework Convention on Climate Change principle of “common but differentiated responsibilities” to increase the amount of renewables, reduce GHG emissions and increase energy efficiency. The INDC submitted by Turkey stated that the GHG emissions will be reduced by up to 21% from a business-as-usual level by 2030 [
19]. However, this target indicates still a significant expansion of Turkey’s current emissions level [
20]. Other strategies are needed to achieve the zero-carbon goal. With its limited fossil fuel resources and high potential for renewable energy sources, Turkey is a viable option for hydrogen projects [
21].
Gas decarbonization is important for developing countries like Turkey, where the energy policy has been influenced by fuel poverty and energy vulnerability for decades [
22]. The gradual integration of low-carbon gases such as biomethane and hydrogen to replace natural gas is a part of the EU Hydrogen Strategy. Accordingly, to rapidly scale up the production and use of hydrogen within the next ten years, much attention is being paid to establishing a market for hydrogen, mainly hydrogen produced by renewable energy sources [
23]. By adopting a similar approach, Turkey can benefit from hydrogen by reducing emissions and energy vulnerability.
This paper aims to identify hydrogen’s role in Turkey by modeling a part of the Turkish energy system until the year 2040 and to answer the following questions by scenario analysis: What are the effects of adding hydrogen to Turkey’s energy mix by blending it into natural gas? And to what extent can hydrogen help decarbonize the Turkish energy system? The study considers green hydrogen produced by electrolysis and used to store excess electricity and replace final natural gas demand. Scenarios are analyzed using a cost optimization tool called the Open Source Energy Modeling System (OSeMOSYS).
The role of hydrogen in energy systems at the national level has been researched through energy system modeling. Ref. [
24] present a framework by expanding the UK MARKAL Energy System model with a spatial hydrogen module to explore the potential of hydrogen at the sub-national level. The results indicate that hydrogen-related infrastructures and technologies are competitive, with notable potential contributions to the decarbonization pathway of the UK’s energy system. Similarly, ref. [
25] look at the role of hydrogen in Norway’s energy transition by using energy system modeling with TIMES. The study concludes that the decarbonization of transport and industrial sectors depends on access to renewable power and hydrogen. Putting more focus on hydrogen’s flexibility-providing aspect, ref. [
26] have used the OSeMOSYS Energy System Model to evaluate the potential of different hydrogen technologies to contribute to emissions reduction in Canada. The study has two important conclusions. Hydrogen contributes to meeting emission targets by providing significant flexibility to the Canadian electricity system, but this is limited to costs and existing flexibility of the hydrogen system.
Ref. [
27] have designed Turkey’s hydrogen supply chain focusing on the transport sector for the next 30 years. Total operating and capital costs are minimized to meet sector demand. The results show that the supply chain starts as a centralized chain with only a few facilities and becomes decentralized by the end of the planning horizon. SHURA Energy Transition Center has published two reports on future hydrogen in Turkey. In the first report, a list of priority areas was suggested for developing a National Hydrogen Strategy for Turkey. The development of a clear plan that encompasses the costs, an understanding of the business opportunities of hydrogen, and the contribution of hydrogen to Turkey’s energy transition strategy as a domestic resource were included in the list. The report shows that hydrogen can have an equally split role in the manufacturing industry, buildings (residential, commercial, and public), and transport sectors in Turkey [
28]. The second report is a techno-economic study about the green hydrogen potential of Turkey. The results indicate that green hydrogen production can help to reduce energy import dependency by substituting 10% of fossil fuel use in 2050 [
29]. In a recent study, ref. [
30] discussed the importance of hydrogen for Turkey in the 2030 energy projection. The results obtained by the EnergyPLAN code indicate that it is inevitable for Turkey to invest in hydrogen technologies until 2030 to achieve sustainable development goals.
This study aims to contribute to developing a hydrogen economy in Turkey by modeling Turkey’s hydrogen-integrated energy system, thus creating an understanding of hydrogen’s role in the energy transition toward becoming zero carbon. Although Turkey has announced its net-zero goal by 2053, this study investigates the 2020–2040 period, since hydrogen blending into the natural gas network is considered a midterm solution, meaning further measures should be applied afterward.
2. Hydrogen Production and Usage
Hydrogen is a gas produced by splitting water (electrolysis) or by reacting fossil fuels with steam or oxygen, and it functions as a versatile energy carrier and feedstock [
31]. Currently, hydrogen is mainly used in oil refining and ammonia production for fertilizers, and the demand for hydrogen in its pure form is around 70 million tons per year. 76% of this demand is supplied from natural gas and 23% from coal, implying that almost all hydrogen is produced by fossil fuels [
32].
Hydrogen technologies have been exceptionally resilient during the COVID-19 pandemic, maintaining its strong momentum in 2020. It is a record year for policy action and low-carbon hydrogen production. The installed electrolysis capacity has reached 70 MW, twice compared to the previous year. Another important update was the implementation of carbon capture and storage technologies in two facilities that produce hydrogen from fuels. However, this progress falls below the necessary actions for Net Zero Emissions by 2050.
Moreover, the demand for new applications of low-carbon hydrogen is limited to road transport. On that account, more efforts are needed to create demand [
33].
Hydrogen gas is a carbon-free fuel because it only emits water when it is burned, but in fact, carbon neutrality depends on how it is produced. Suppose hydrogen is produced from fossil fuels (i.e., gasification and steam methane reforming) but emissions are not captured using carbon capture and storage (CCS) technologies. In that case, the hydrogen is classified as gray (produced from natural gas or coal). If CCS technologies are used, then it is called blue hydrogen, which some parties consider a bridge that could facilitate the development of the hydrogen market until green hydrogen becomes more available. On the other hand, opponents of blue hydrogen claim that methane emissions should be taken into consideration in order not to cause a delay in decarbonization actions [
34]. Another alternative is turquoise hydrogen, which is produced with the pyrolysis of methane at high temperatures to co-production hydrogen and carbon black. Turquoise hydrogen stands out with its two advantages: it is significantly less energy intensive than electrolysis and steam methane reforming and benefits from the existing infrastructure of natural gas [
35]. The final alternative, green hydrogen produced from water electrolysis utilizing renewable electricity and other methods such as biomass gasification, will be explained in the sub-section [
36].
Figure 1 represents the hydrogen value chain; as mentioned above, hydrogen can be produced both by fossil fuels and renewable energy, and its types are color-coded according to the production method. Hydrogen can be stored in different forms, such as compressed gas, liquid, or chemical forms. Geological storage is considered the best option for large-scale and long-term hydrogen storage. Salt caverns, depleted natural gas or oil reservoirs, and water aquifers could be geological storage for hydrogen [
37]. Depending on the form of hydrogen (gas or liquefied) and the transportation distance, it can be transported via pipelines or other vehicles. For example, pipelines would be ideal for transporting hydrogen gas to longer distances, whereas tankers or railways can be used for shorter-distance transportation of liquefied hydrogen [
27]. The hydrogen potential extends to electricity, transport, and heating (e.g., blending hydrogen with natural gas). Additionally, it can be used as a feedstock in industrial sectors as it has been mainly utilized until today.
Power to gas (PtG), a sector-coupling technology that is defined as a process that uses electricity to produce gas (i.e., hydrogen) can play a crucial role in the energy transition by offering flexibility to the system and acting as a GHG-neutral energy carrier [
38]. Being an excellent energy carrier, the relation of hydrogen with electricity is double-sided. While electricity can be used to produce hydrogen; excess renewable power can be stored in the form of hydrogen and then transformed back to electricity by fuel cell technology. The power that is generated by fuel cells can be used for stationary and portable power and transportation. Vehicles operating on hydrogen as a fuel are called fuel cell vehicles (FCV) or fuel cell electric vehicles (FCEV) and are currently being produced by several automobile manufacturers. Compared to battery-electric vehicles, FCEVs are evaluated to have lower costs. The cost advantage stems from hydrogen storage becoming cheaper than batteries at a capacity of 55 kWh, equivalent to a range of about 300 km [
7]. For the heating sector, blending hydrogen into the natural gas network offers a midterm solution for decarbonization while maintaining similar combustion performance with pure natural gas.
Hydrogen offers benefits to end users, such as increased stability and security of energy supply, while not causing carbon emissions [
22]. Hence, hydrogen has been an attractive research subject for decades and has become more relevant in the past years with the rapid cost reductions in renewables and technical advancements (e.g., electrolyzers). A recently published bibliometric analysis of the research on the hydrogen economy indicates that the related literature has been increasing, particularly in the last decade. Pipeline transportation, risk assessment, and blending are included in the aspects that will be important in future hydrogen studies [
39].
2.1. Green Hydrogen
Green hydrogen is the type of hydrogen that is produced from renewable energy sources. It does not emit GHGs when used and can be used in its pure form or can be transformed into other chemicals such as ammonia. The end use of green hydrogen includes industry, transport, heating, and power generation. Among other types of hydrogen, it is considered the most suitable option for the decarbonization pathway. The best-known production method is water electrolysis powered by renewable electricity, which is consistent with the net-zero efforts, allowing synergies from sector coupling, hence reducing technology costs and making the power system more flexible. Other renewables-based production methods exist, but these are not mature technologies at commercial scale yet, except for biomass gasification [
36,
40]. According to a comparative analysis, green hydrogen production from biomass provides approximately similar results as electrolysis-based hydrogen production. In addition, biomass-based production has the advantage of lower operating costs and higher efficiency [
41]. Despite biomass having these advantages, electrolysis-based production is the selected method for this study. This is because it offers the ability to include different renewable energy sources.
Currently, green hydrogen production is limited to demonstration projects, and there is no significant production compared to brown and gray hydrogen [
42]. The reason why green hydrogen has acquired currency now is that it is becoming more available. The continuously decreasing costs of renewable power generation, scaling up electrolysis technologies, carbon-neutral government policies, benefits that hydrogen can supply to power systems, and presentation of broader end uses for hydrogen are factors affecting green hydrogen availability [
36].
Decreasing renewable energy and electrolyzer costs and increasing need for decarbonization of all economic sectors will drive the emergence of a global market for green hydrogen [
43]. Despite offering opportunities for economic growth, green hydrogen still needs a well-defined and stable policy framework to reduce uncertainty and risks for producers. Future international hydrogen trade will be able to fulfill its economic growth potential if only consistent rules and regulations for green hydrogen standards are agreed across regions or globally [
10]. Moreover, by examining the end product, it is impossible to determine embedded emissions, meaning emissions released during hydrogen production. Some buyers will even be willing to pay a higher price for green hydrogen; therefore, certification of embedded emissions will play a vital role in the future of green hydrogen [
44].
2.2. Hydrogen Blending into Natural Gas Network
Compared to other fossil fuels, natural gas emits less carbon dioxide into the air when combusted, making natural gas the bridge fuel of the energy transition toward a decarbonized energy system. As a result, the further expansion of natural gas infrastructure (e.g., long-distance pipelines) is observed in many regions worldwide. According to [
45], natural gas dominates the pipeline development mix, accounting for 82.7% of global pipelines in pre-construction and construction. This dominance demonstrates a current shift from oil to gas in the global energy system. While the share of the oil in global primary energy consumption has been falling since its peak in 1978, the share of the gas has been steadily increasing [
46]. However, in order to reach zero-carbon goals, natural gas should also be eliminated from the energy mix in the near future. Natural gas demand is expected to peak in this decade and decline after 2030 by being replaced by hydrogen and biomethane gases in the period of 2020–2050 to eventually become zero-carbon [
47].
Blending hydrogen into the natural gas network is expected to have an important role in energy transition by being a midterm solution for decarbonization while maintaining similar combustion performance with pure natural gas. Moreover, integrating both systems can decrease the supply-demand contradiction between electricity and natural gas. In recent years, the gas-electricity integrated energy system has received notable attention; hydrogen can solve the problem of energy storage shortage of the traditional integrated energy system [
48]. Current studies on hydrogen blending into the natural gas network include the production of hydrogen, transportation of the mixture, end use of the mixture (i.e., combustion of the hydrogen blend), and modes of blending.
For instance, ref. [
49] have investigated an integrated system, which consists of a geothermal-based power and hydrogen generation and blending of produced hydrogen into the natural gas pipeline to use for household applications with Aspen Plus software V10.2. The offered system was comprised of a geothermal plant, an electrolyzer, a blending unit, and a combustion reactor. In a more recent study, the same authors analyzed another integrated system where hydrogen is uniquely produced from waste heat obtained from cement slag and blended with natural gas for domestic use which is a new concept [
1]. The cement industry is one of the major emitters of GHGs in industrial sectors. The study aimed to reduce emissions in domestic appliances by blending hydrogen with natural gas.
Various literatures have demonstrated that when the hydrogen blending ratio is kept lower than a certain value, the existing natural gas pipelines can safely transport the mixture, which means they do not need to be readjusted [
8,
50,
51]. For example, in Germany, hydrogen-related research and development is focused on the natural gas pipeline blending hydrogen technology. If the demand for hydrogen increases in the future, natural gas pipelines are planned to be converted into hydrogen pipelines, or even some independent domestic hydrogen pipelines might be built [
52]. Ref. [
48] have focused on another aspect of hydrogen blending: the analysis of modes such as single-node, multi-node, and centralized hydrogen blending. All modes cause different energy losses; compared to single and multi-node hydrogen blending, centralized hydrogen blending has been found to be more advantageous and causes smaller energy loss.
The concept of hydrogen blending with natural gas networks has been investigated by many countries through the execution of several long-term projects with trials of hydrogen- blending in small communities [
53]. Different blend ratios ranging from 1% to 100% are implemented in projects for residential areas of various sizes between 100 and 40,000 residents. Europe and Australia have demonstrated many projects, while there have been fewer such projects in the United States and Canada thus far. In Europe, the UK has the majority of projects; the HyDeploy project which started in 2019 being the first and most significant project.
3. Turkish Energy System
Turkey is at the crossroads of Asia and Europe, with most of the country located in southwestern Asia and a small part in south-eastern Europe with a population of over 80 million. Its central geographic position gives the country strategic importance in international relations, including the energy sector. Following the economic crisis of 2001, Turkey has developed rapidly both economically and socially. In 2018, Turkey almost doubled its gross domestic product (GDP) per capita from 2011 and became the 19th largest economy in the world [
54]. However, the currency and debt crisis of 2018 has resulted in high inflation and decreased annual GDP growth rate [
33].
Energy consumption is imperative to maintain economic growth. The shift in its economy from agriculture to one based on industry and services is another reason for the country’s energy demand increase. Turkey relies on fossil fuels for about 83% of its energy supply. Even though Turkey has significant coal deposits, it remains dependent on imports of oil and gas. Turkey has deployed several measures including oil and natural gas exploration activities in the Black Sea and the Mediterranean and bilateral agreements between countries to secure its supply by diversification of sources.
Moreover, the government aims to increase the use of domestic energy sources, including renewables, nuclear, and coal. Renewables have already made significant progress in recent years, particularly unlicensed production and rooftop solar energy applications, and wind and geothermal energy investments have drawn attention. In addition, by incorporating energy efficiency in energy regulations, it aims to reduce energy intensity and energy import dependency [
30].
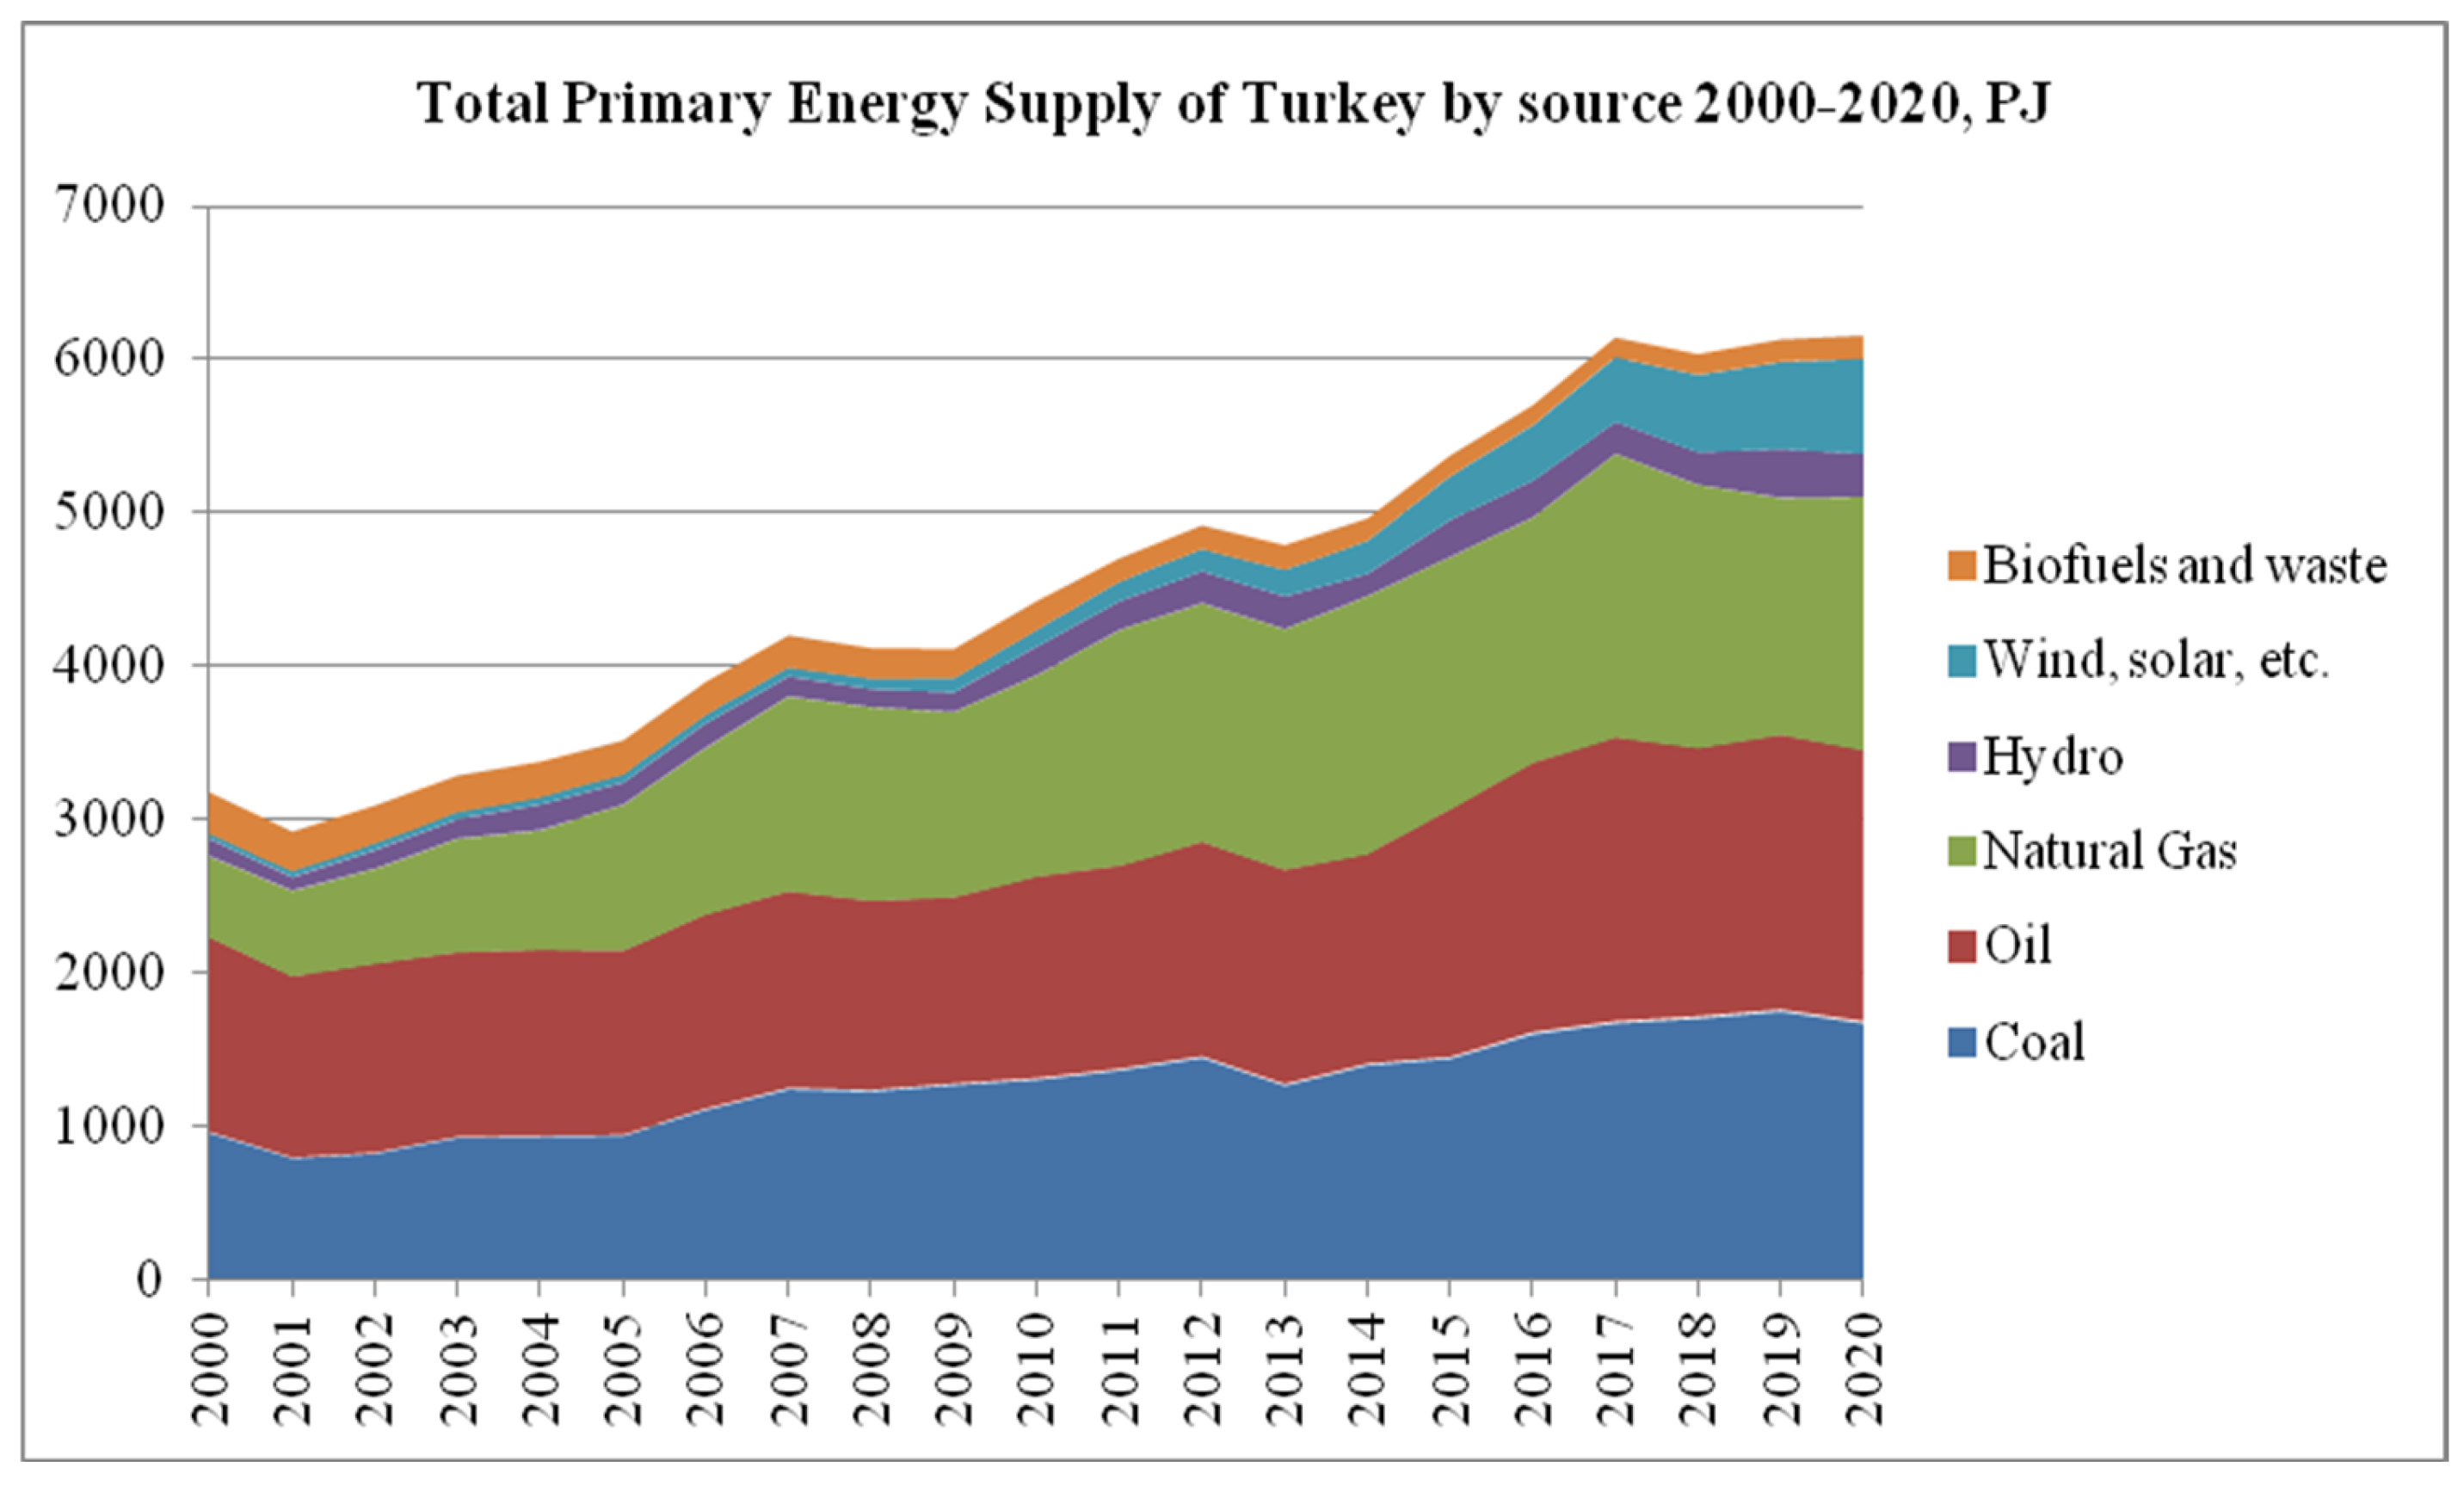
Turkey is a developing country with a fast-growing economy; as a result, its energy supply has steadily increased. As seen in
Figure 2, between 2000 and 2020, the Total Primary Energy Supply (TPES) has almost doubled, despite a recent decline in 2018 caused by the economic slowdown. TPES is dominated by fossil fuels and their share has been around 90% in the past two decades. But, in recent years, their share has started to decrease. In 2020, fossil fuels accounted for 82.8% of TPES [
33].
Only 30% of TPES is covered by domestic production in 2020, mainly by coal and all renewable sources [
55]. Due to its geographical characteristics, renewable sources are abundant in Turkey; thus, Turkey has adequate potential for solar, wind, hydro, and geothermal energy [
56,
57]. Ref. [
58] have estimated in their study that Turkey has a total of 495.4 TWh/year of potential energy, with 196.7 TWh/year of biomass, 124 TWh/year of hydropower, 102.3 TWh/year of solar, 50 TWh/year of wind, and 22.4 TWh/year of geothermal energy. Thanks to the technological developments in renewables and investment opportunities, the share of renewable energy (geothermal, hydro, wind, and solar) in TPES has more than doubled in the last decade. Although to this day, there is no operating nuclear power generation in Turkey; within the scope of the nuclear power program, the first unit of a nuclear power plant in Mersin province with a capacity of 4.8 GW is scheduled to be operational by the end of 2023.
Fossil fuel imports are an important element of Turkey’s foreign trade deficit. Almost all natural gas is imported, and domestic production covers only 7% of the total oil demand. Despite the larger domestic coal production, 58% of the coal demand is still supplied by imports. Refs. [
59,
60] have assessed Turkey’s oil and natural gas import vulnerability. Although both fossil fuel types have significant shares in the country’s energy mix, natural gas import vulnerability is of greater significance because, unlike oil and coal, the share of natural gas in Turkey’s energy mix is increasing and has become the dominant energy source. Therefore, substituting natural gas and other fossil fuels is important for Turkey.
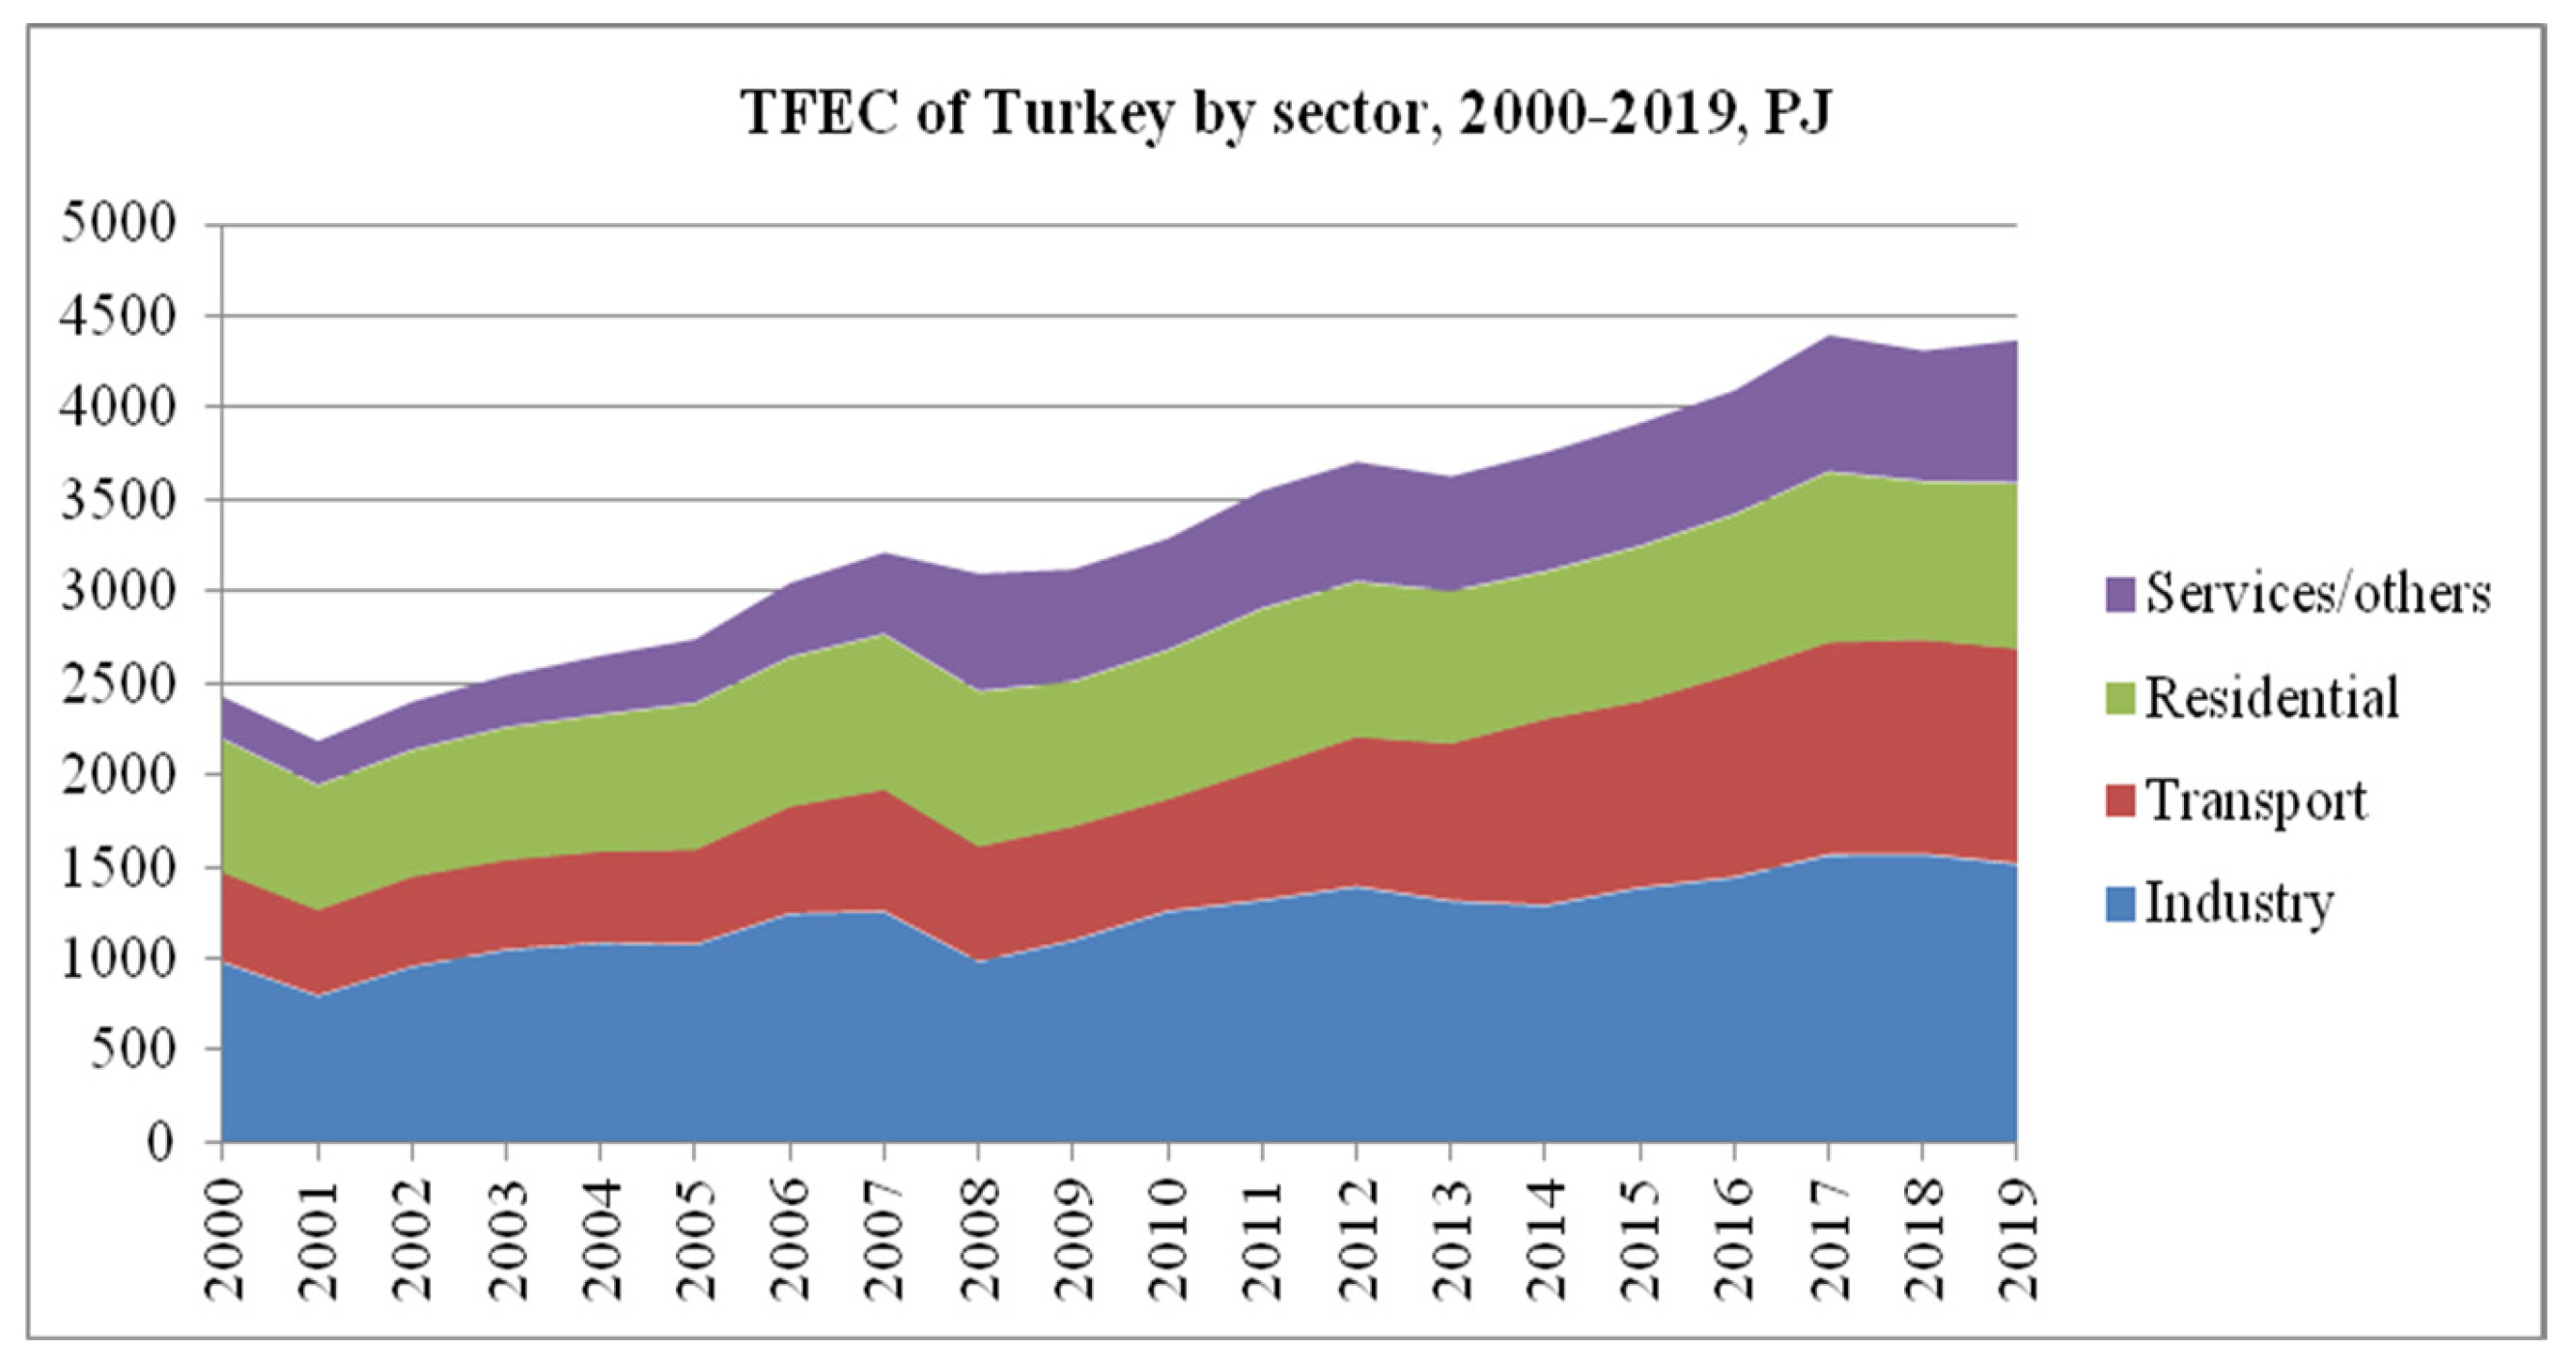
After the economic crisis in 2001, energy demand in Turkey increased across all sectors, except for 2018, due to the economic slowdown (
Figure 3). From 2009 to 2019, energy consumption in transport increased by 89%, in industries by 38%, and in services and the residential sector by 27% and 14%, respectively.
In 2019, Turkey’s Total Final Energy Consumption (TFEC) was 4365 PJ, accounting for 71% of TPES. The largest energy-consuming sector is industry, with a share of 35%, followed by transport (27%), residential (21%), and services including agriculture and fishing (17%).
Figure 4 gives a more detailed look at TFEC in 2018. The transport sector is dominated by oil, which accounted for 97% of TFEC in 2018. The industry sector uses a mix of all sources, mainly oil, natural gas, and electricity. Half of the total residential demand is covered by natural gas, followed by electricity, with more than a quarter of the TFEC. Electricity covers almost half of the demand in the services sector.
The combination of current high energy dependency and high renewable energy potential gives hydrogen a significant role in the future of energy in Turkey. In this context, the United Nations Industrial Development Organization (UNIDO) took the first initiative in November 2011 by building the Bozcaada Hydrogen Island project that produces hydrogen via electrolysis powered by solar and wind energy [
57].
To reduce energy imports as a national strategy, the Turkish government allocated its energy-related research, development, and demonstration budget mainly to renewables and energy efficiency. In 2018, 5% of this budget was spent on hydrogen and fuel cells [
20]. Although hydrogen is not yet a direct contributor to energy generation in Turkey, it is used as a raw material in the industrial sector. Currently, 1.6% of total energy consumption is supplied by hydrogen, which is used as feedstock to produce ammonia [
30]. The preparation of a law and a roadmap on hydrogen is of great importance for developing this technology in the country.
The preparations for a national hydrogen strategy are kick-started with the international conference organized by the Ministry of Energy and Natural Resources (MENR) on 15 January 2020 to discuss the future of hydrogen in Turkey. The priorities of the Turkish government related to hydrogen are as follows: to include more renewable energy in the system, make the heat sector carbon-free, produce hydrogen from domestic coal, and increase the use of boron in hydrogen storage [
61].
Hydrogen is seen as a key by MENR to decarbonize the heating sector through the blending of hydrogen into the distribution system. The Renewable Gas Project within the scope of the funds given by the Energy Market Regulatory Authority (EMRA) is conducted by the Turkish Natural Gas Distributors Association (GAZBIR). The project was initialized at the beginning of 2020 with the installation of the Clean Energy Technologies Center in Konya. Hydrogen mixed with natural gas at different rates (5–10–15–20%) for the tests was obtained in the laboratory environment via electrolysis of water using renewable electricity. As a result of the tests, it was stated that there is no obstacle to the use of a hydrogen (up to 20%)-natural gas mix in the current transmission lines and combustor devices. In addition, the produced hydrogen can be stored directly without the need for pressurized cylinders, liquefaction, or metal hydrides since the length of natural gas transmission lines is enough to store hydrogen [
62]. Based on the ongoing study on 20% hydrogen blending to the natural gas system, ref. [
63] have investigated a photovoltaic hydrogen system using real house consumption data in Turkey and found that by increasing the solar panel area with a rate of 14.28%, 20% of the natural gas need of the house can be replaced by green hydrogen. Thanks to the PV-hydrogen system, the house’s carbon footprint was 67.5% less than before the system’s implementation.
In recent years, several studies have been conducted on the production of hydrogen using different methods in Turkey. Concerning the hydrogen energy potential in Turkey, there are continuous efforts on the production of hydrogen from the chemically stored hydrogen in the Black Sea base in the form of hydrogen sulfide (H2S). However, utilizing the said potential depends on further technological developments [
57]. In a recent study, ref. [
64] investigated hydroelectric power’s utilization for green hydrogen production in Turkey and estimated that Turkey’s hydro-based green hydrogen production potential is 2.26 megatons.
Ref. [
21] have developed a hydrogen farm concept for Turkey, where renewable energy sources are deployed to produce green hydrogen using several processes, ranging from electrolysis to thermochemical cycles. According to study results, creating a hydrogen hub in Turkey has the potential to compensate for the country’s total energy consumption. In addition, extra hydrogen production can improve the country’s economy by becoming an export commodity. Furthermore, the EU could become an importer of Turkish hydrogen considering current pipelines and the availability of funds in the concept of the European Green Deal. Even though the 2030 Hydrogen Roadmap of the EU does not include Turkey as a potential exporter, growing hydrogen demand in Europe will create new opportunities later. Ref. [
65] has underlined the importance of establishing hydrogen as the key component of ongoing Euro-Mediterranean partnerships, including Turkey.
In February 2022, a cooperation protocol was signed by five energy companies (the South Marmara Development Agency, Enerjisa Üretim, Eti Maden, Turkey’s Scientific and Technological Research Council’s Marmara Research Center, and Aspilsan Energy) to establish Turkey’s first green hydrogen plant [
66].
5. Data and Assumptions
This chapter aims to explain the different sets and parameters, as well as their respective data, which are used to build the OSeMOSYS model. Key assumptions for the model are listed below:
The modeling period is 2020 to 2040, where 2020 is the base year.
Monitory units used are the United States Dollar (USD) for currency, Petajoule (PJ) for energy, and Giga Watt (GW) for capacity.
The following sections are classified according to the indications in the MoManI User Manual [
73]. All input data are accessible in the GitHub repository [
77].
Sets are used to define the model’s structure and are constant across scenarios. A summary of the sets used for this model is given in
Table 1.
Parameters can be defined as the functions of the elements within each set, which are used to define technical and cost data for the model. Unlike sets, parameters may change within and between scenarios.
Since this is a cost optimization model, the cost parameters (capital, variable, and fixed costs) are the main drivers of OSeMOSYS when considering different technologies. The model will always choose the least cost option to meet the system demand. That is why the correct representation of the cost of each technology is highly important. The data are gathered from several sources, which are given in more detail in
Table 2.
The transmission and distribution grid for electricity and heating fuels are included in the model, but no costs related to them are defined. The reason behind this assumption is that they already exist. Further, the model does not consider the potential expansion of these grids.
The performance parameters are used to create links between different types of fuels and technologies that use them as input/output so that the reference energy system can be built.
Input Activity Ratio and Output Activity Ratio parameters are used to link system components. The ratio of these two parameters gives the efficiency of the related technology. Output Activity Ratio is usually assigned as 1, so Input Activity Ratio can easily be assigned as 1 divided by efficiency (
Table 3). BIOPP, IGCC, NGCC, NUCPP, and ELCTRLZR in
Table 3 stand for biomass, coal, natural gas, nuclear power plants, and electrolyzers, respectively.
The exception to this assumption is transmission and distribution technologies since there is an energy loss during these activities. Electricity transmission and distribution technology have 0.9528 as the output activity ratio, and natural gas/hydrogen transmission and distribution technologies have 0.92 as the output activity ratio. Renewable power plants’ efficiency values are considered under the capacity factor parameter since they have no input resource.
The Capacity Factor of the power plant is the total energy produced by the plant in a certain period divided by the energy it can produce at full capacity. The capacity factor may vary depending on the fuel type used and the plant’s design. The capacity factor should not be confused with the availability factor or efficiency. Capacity factors are calculated for the base year except for the nuclear power plant, where necessary hourly generation data are gathered from [
82], and total capacity data are gathered from the [
83] electricity market report. The calculated results are compared to capacity factor intervals presented by [
84] and found to be within the given range. Since there are not any operating nuclear power plants in Turkey, the global average capacity factor value gathered from the [
85] is used.
For this model to be more accurate, three seasons are used (intermediate, summer, and winter—with intermediate combining the seasons of autumn and spring), one-day type (meaning all weekdays are the same), and two daily time brackets (day, night). The daily time bracket “day” is set to 16 h (2/3 of one day), while “night” is 8 h long (1/3). Since the current model has 6 time slices (ID, IN, WD, WN, SD, SN), each power plant type will have 6 capacity factor values (
Table 4).
GEOPP, HYDROPP, PVUTIL, and WIND in
Table 4 stand for geothermal, hydro, solar, and wind power plants, respectively. Capacity factors of biomass, coal, and natural gas have been kept constant between the time slices due to getting nearly equal results from calculations for each time slice. For renewable energy sources such as solar, wind, and hydro, the availability of the energy source is generally the main reason for getting reduced capacity. The plant may be capable of producing electricity during the given time slice, but its “fuel” may not be available (e.g., there is no sunlight during nighttime).
Another performance parameter is the Capacity to Activity Unit. It is used to recognize the amount of energy each specific technology can generate by one unit of installed capacity. Since we have the capacity in GW and generation (activity) in PJ, the Capacity to Activity Unit for all generation technologies, including the PEM electrolyzer and fuel cell is 31.536. It is calculated by multiplying the hours of the day by days in a year divided by 1000 and multiplying the result by 3.6 (to convert TWh to PJ).
The last performance parameter is Operational Lifetime. It represents the time that a technology is designed to remain operational. It is expressed in years and stays constant over the years for the model (
Table 5). The lifetime data are gathered from the same sources as related technologies’ cost data.
The first capacity parameter is Residual Capacity, which represents the available capacity from the period before the first modeling year. Starting with historical installed capacity values for the years 2020 and 2021 from [
86] and [
55], the residual capacity for each technology has been calculated. The starting residual capacity in the year 2021 is decreased through interpolation so that all residual capacity is zero at the end of the technology’s operational lifetime. This will drive the need for the substitution of old capacity by reinvestment. This assumption might cause the creation of an exceptionally fast-changing energy system; since in real life, many technologies can be used long after their calculated economic lifetime.
All other capacity parameters serve as constraints that can be used to limit installation or to force installation of certain power plants. For this model, Total Annual Max Capacity, Total Annual Max Capacity Investment, and Total Annual Min Capacity parameters have been used to simulate a realistic development of the Turkish energy system. For the nuclear power plant (NUC_PP), these parameters were used to model the Akkuyu Nuclear Power Plant, coming into effect in 2023 with a capacity of 4.8 GW. For other power plants, max capacity has served to include Turkey’s renewable power capacity potential limitations and max capacity investment has served to limit annual investment at a reasonable amount [
87].
As stated before in the cost section, the model aims to meet the system demand by the least cost option. Thus, the demand drives the cost optimization model and its specification has an important place in OSeMOSYS. With the selected boundaries, there are three demands in the system; electricity, natural gas, and hydrogen demand. The base year 2020 consumption data for electricity and natural gas, which will serve as a basis for the demand forecast, are gathered from the 2020 Energy Balance Table provided by [
55]. In recent years, various demand forecasts have been proposed to show the developments and changes in demand in the coming years. These forecasts could be obtained from statistical evaluations or projections of former consumption trends.
Electricity demand projection is conducted according to the Power Demand Projection Report of MENR [
88]. The report suggests three scenarios (low, reference, and high) and assigns different growth rates. The growth rates of the reference scenario are chosen to work with (
Table 6).
For the natural gas demand projection, the reference scenario of Turkey Energy Outlook (TEO) report by [
89] which applies a growth rate of %1.5/year is used (36% cumulative growth in 2040). The TEO reference scenario reflects a growing natural gas sector that is supported by Turkey’s developed infrastructure and growing economy, which facilitate the replacement of other fossil fuels with natural gas. Moreover, the report foresees natural gas to become concentrated in the residential, industrial, and commercial sectors as renewable energy sources are expected to increase their shares in power generation. As a result, different cumulative growth rates for each sector are given. By applying the compound annual growth rate formula, yearly growth rates for each sector are calculated (
Table 7).
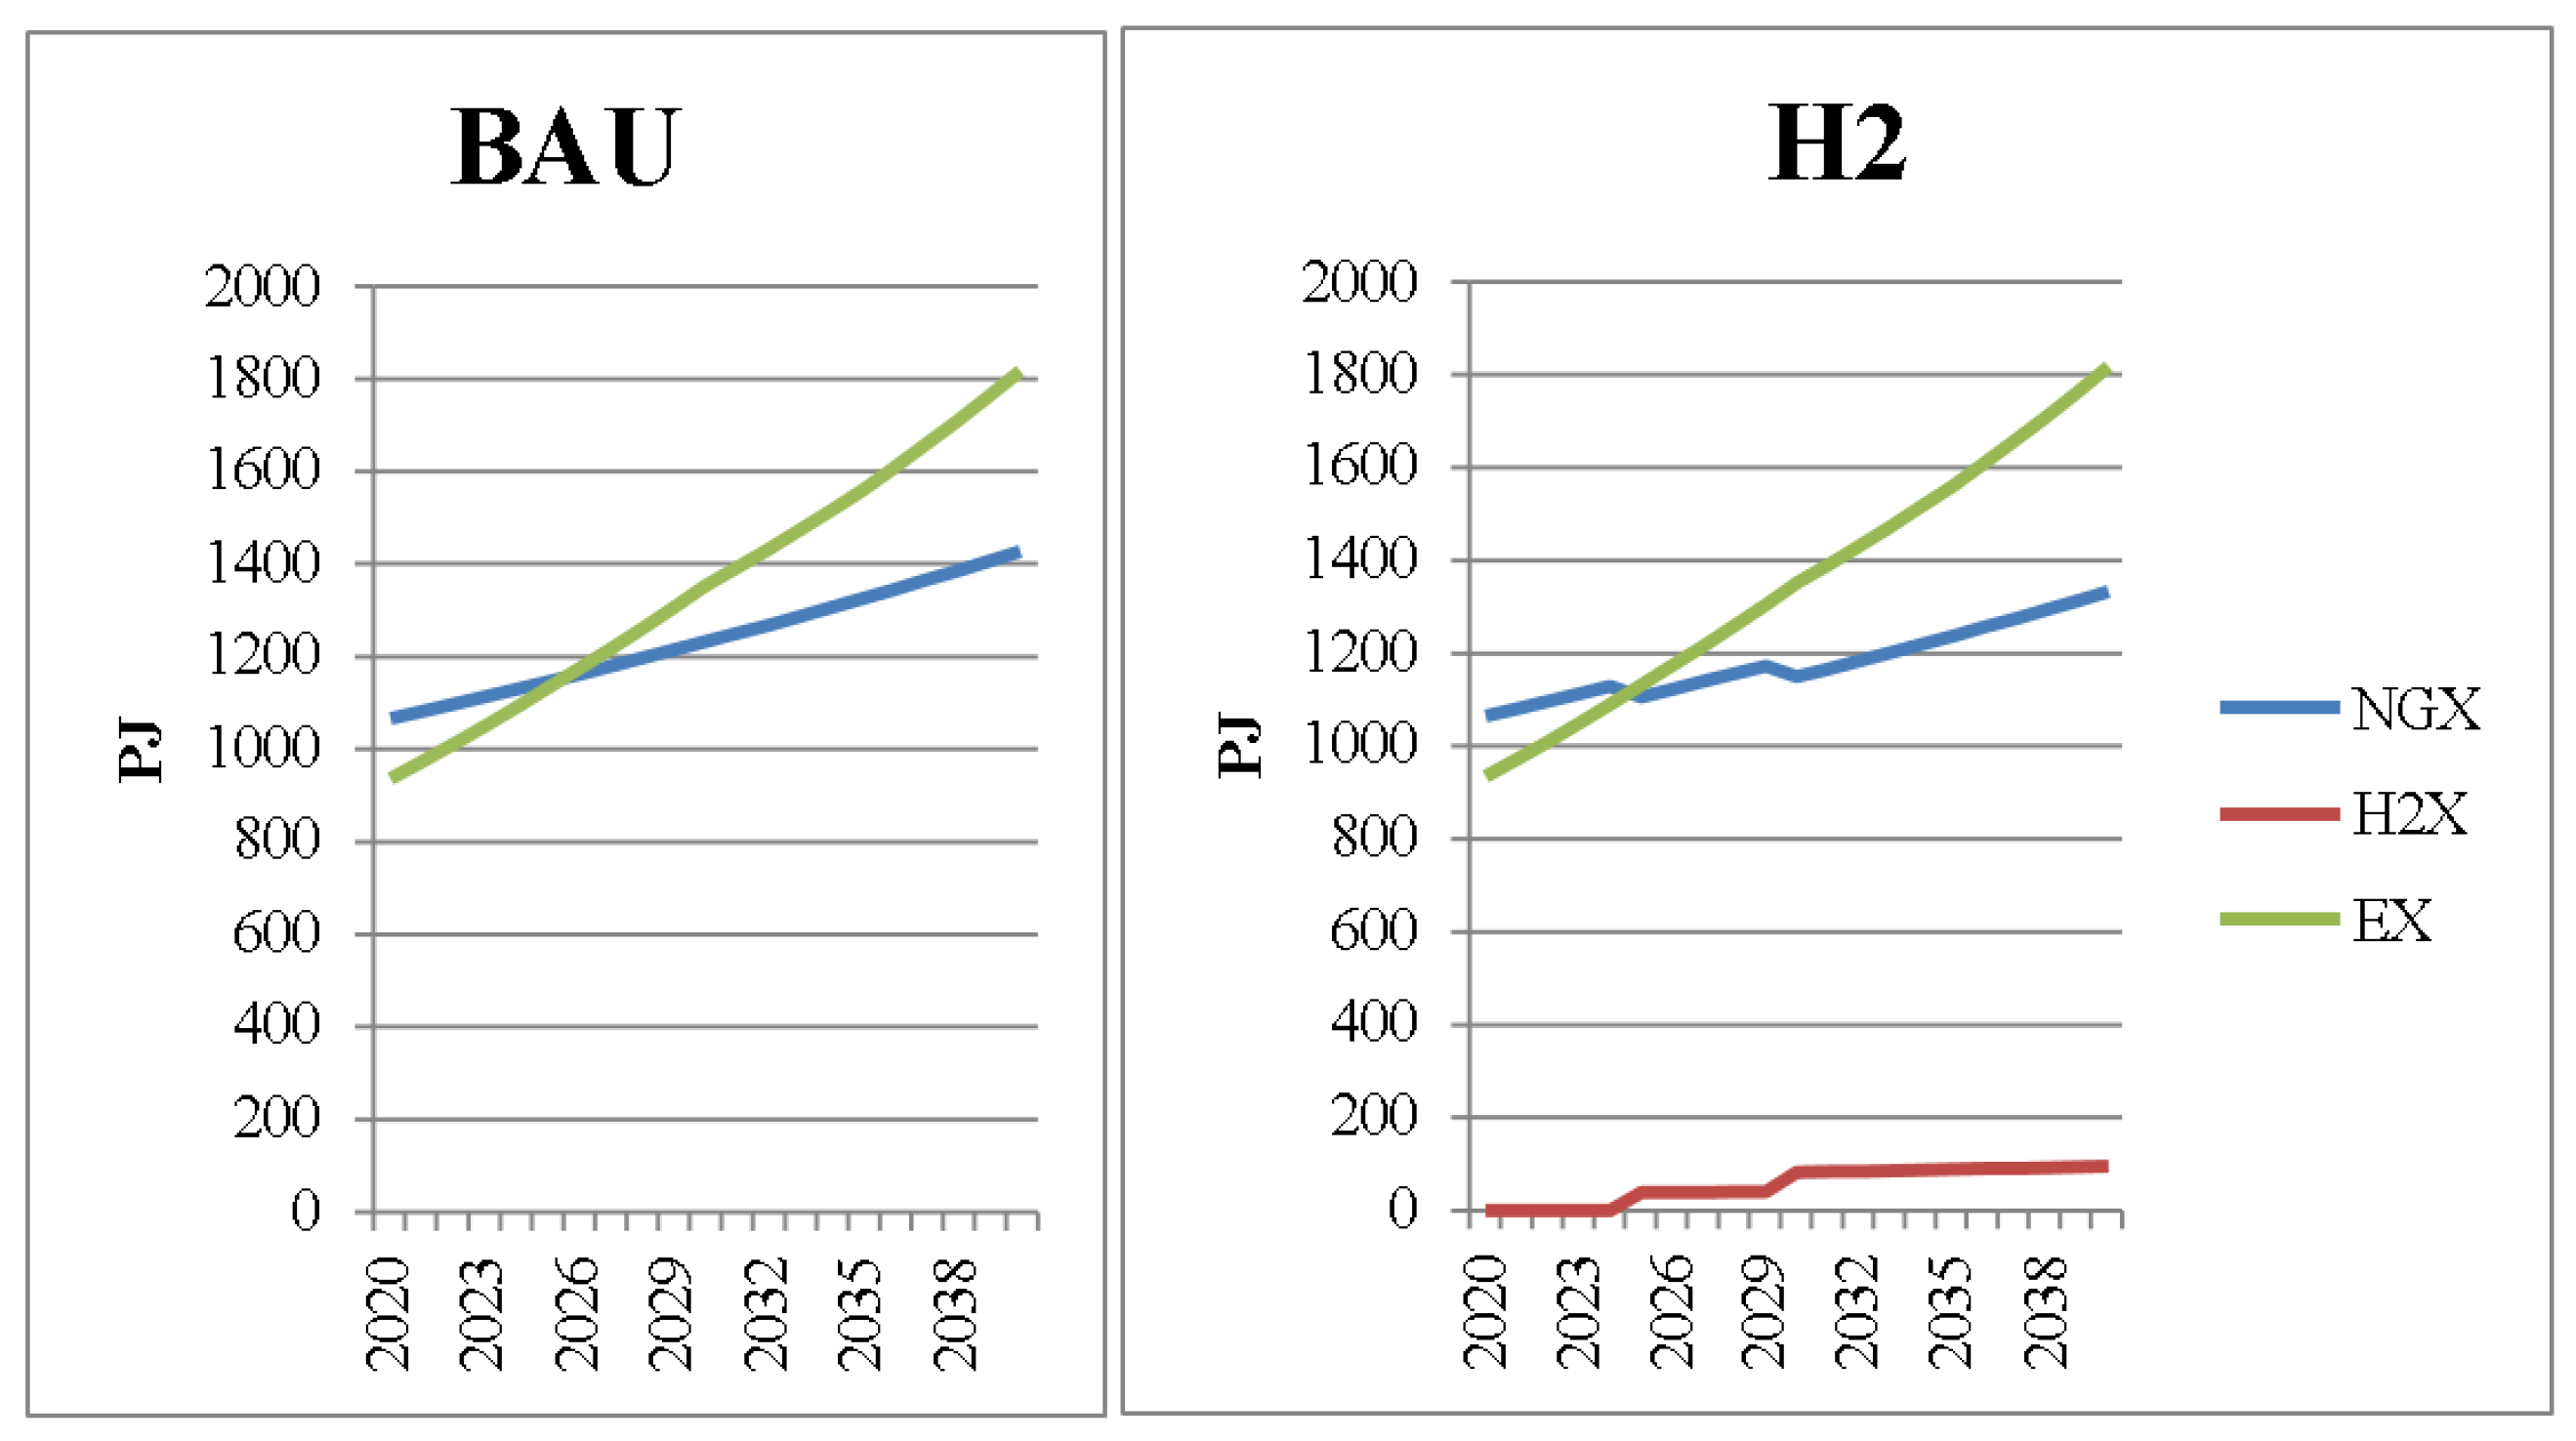
This study aims to find the effects of hydrogen blending into the natural gas network. This mixed gas is expected to be used as a fuel in the residential, industrial, and commercial sectors. In the model, natural gas demand corresponds to the total of these sectors demand. Hydrogen demand is calculated with reference to blend percentages. The 10% hydrogen blend by volume equals 3.35% by energy, meaning 3.35% of the natural gas demand is replaced by hydrogen. The same applies to the 20% by volume (6.7% by energy).
Figure 10 shows the final energy demands as inputted in OSeMOSYS. Where EX is the final electricity demand, NGX is the final natural gas demand (total final demand of residential, industrial, and commercial sectors), and HX is the hydrogen demand that matches the natural gas displaced by the blending process.
There are two different kinds of demands in OSeMOSYS. While entering demand data, a decision must be made so that demand can be entered either as Accumulated Annual Demand or as Specified Annual Demand. The difference is that accumulated annual demand can be met at any time during the year as long as the total is satisfied. Demand for energy carriers (e.g., electricity, hydrogen) should be modeled as a specified annual demand, since demand has to be supplied instantly when a demand occurs. It is linked to Specified Demand Profile to work with. For each time slice, the corresponding consumption amount is divided by total consumption over the year to find the profile of that time slice. The specified demand profile for electricity is calculated according to real-time hourly power consumption data of 2020 retrieved from [
90]. For natural gas demand, monthly natural gas sector reports of [
91] are used to attain the consumption amounts of industrial, residential, and commercial sectors in each month of 2020. While electricity has a more stable demand over the year, natural gas demand is considerably lower during summer than winter. Hydrogen’s profile is assumed to be the same as that of natural gas since it replaces natural gas.
Table 8 presents specified demand profile data as inputted to OSeMOSYS.
The first step is to decide which type of emissions will be included in the model. While other gases also contribute to the greenhouse effect, only carbon dioxide (CO
2) emissions are included in this study because of their significance. In the model, the emissions are linked with import technologies. Emission levels are defined by the Emission Activity Ratio parameter. It is calculated by dividing the produced CO
2 (million tons) by the total supplied energy (PJ) for each fossil fuel. However, the country-specific CO
2 emission factors are already given in the Turkish GHG Inventory report published by [
92]. Therefore, the emission activity ratio for natural gas and coal was calculated by making the necessary unit conversion (
Table 9).
In OSeMOSYS, demands are distributed over units of time called time slices. The parameter used to define the duration of each time slice is named Year Split. To build time slices, it is necessary to define several sets (season, day type, daily time bracket, and time slice) and parameters (Days in Day Type, Day Split, and Year Split) in the model.
The correct representation of storage in energy systems modeling has gained significant importance due to the expansion of renewable electricity portfolios. The storage modeling methodology in OSeMOSYS is simple, allowing the storing or discharging of energy in each time slice as long as the storage level constraints are met. After defining storage, the next step is to introduce the sequence of the time slices, which is done by assigning each time slice to a season, a day type, and a daily time bracket using the following parameters: Conversionls, Conversionld, and Conversionlh, respectively.
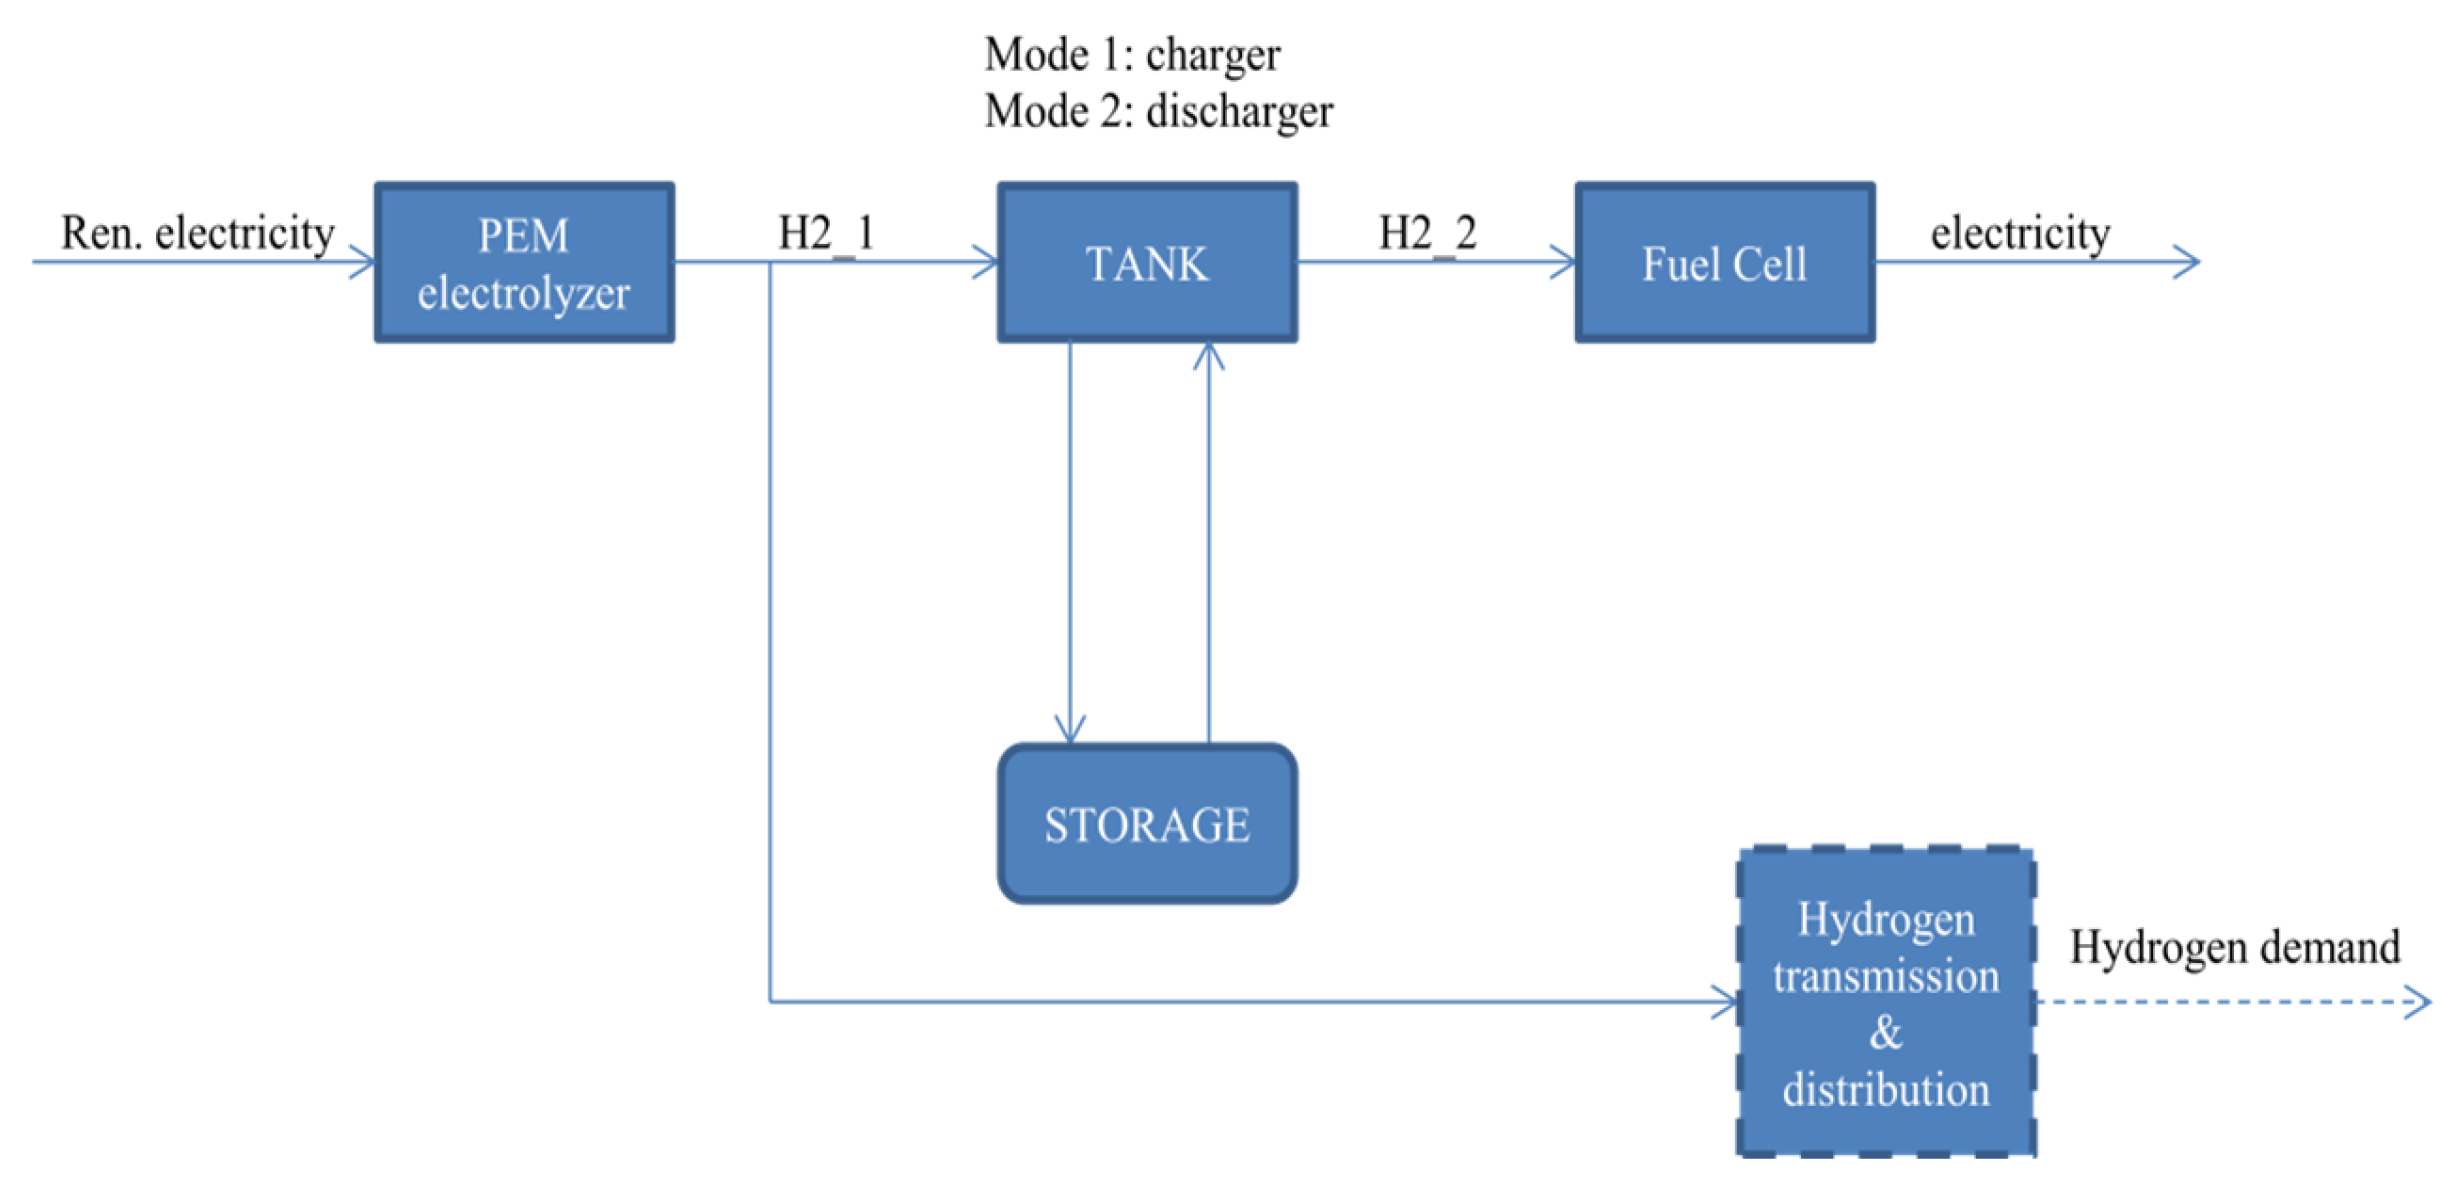
In OSeMOSYS, the storage is linked to one or more technologies for charging and discharging. To define charging technology, the Technology to Storage parameter, and to define discharging technology, the Technology from Storage parameter is used. In this case, both the charger and discharger technology is TANK (
Figure 11).
Other important parameters to have functioning storage are Storage Max Charge Rate and Discharge Rate, which should be set to a very high value (e.g., 999,999). Finally, the Operational Life Storage parameter should be set to a value higher than 0.
6. Results and Discussion
After completing the data entry into MoManI, the executable file is downloaded from the webpage and run on the computer with the GNU Linear Programming Kit (GLPK) solver. GLPK is an open-source linear solver. The results are automatically uploaded to the MoManI webpage for screening the results. This section summarizes some of the key results of both scenarios, beginning with model validation.
As it was mentioned before, the main difference between scenarios is that the H2 scenario also has hydrogen demand, in addition to electricity and natural gas demands. The total final demand rests the same between the two scenarios (
Figure 12). A detailed explanation of projections for 2040 is given in the Data and Assumptions section.
Before going into the scenario results and discussion, it is important to validate the model. Model validation is conducted to confirm that the outputs of the generated model are acceptable with respect to the existing real data. In order to provide the necessary validation, an analysis has been carried out between the model’s power generation results and national statistical accountings for the base year 2020.
Figure 13 shows shares of each power generation technology in total generation.
On the right are the model results and on the left, the real power generation; it can be seen that the generated results are very close to real data. However, since the model does not include end-use technologies, only energy loss occurs during transmission and distribution. This situation causes a decrease in the gap between generation and consumption. Moreover, the low capacity factor and high costs make natural gas power plants the least favorable option. As a result, hydro and coal power plants generate more electricity, and natural gas power plants generate less electricity than reality. In addition, other technologies used for power generation have been excluded from the real data. Although they have a small share that corresponds to less than 1% of total power generation, the distribution of their power generation amounts including power plants in the model affects the percentage shares.
In OSeMOSYS, all technologies have one or more outputs. As a result, all technologies, including transmission and distribution, have production results. However, in this part, electricity and hydrogen production are analyzed, respectively. The importation of fuels is also discussed in this part since the importation of fuels is also defined as technologies.
In the BAU scenario, power is only generated to supply electricity demand. On the other hand, there is a need for an extra generation in the H2 scenario to power the PEM electrolyzer. Renewable power plants generate this additional power to produce green hydrogen. The change driven by hydrogen blending can be seen in 2025 and 2029. In 2025, hydrogen technologies will be introduced and 10% blending will begin. The situation in 2029 differs; during that year, power generation will increase to prepare for a higher percentage of blending by storing hydrogen. Additionally, the storage option will increase the electricity supplied by renewable energy sources such as solar, wind, and hydro. In 2040, the power generation difference between the two scenarios would be about 200 PJ (
Figure 14).
To visualize the hydrogen production, the PEM electrolyzer’s annual production is given in
Figure 15. Hydrogen production will begin in 2025, and smaller amounts will be produced until 2029 since only 10% of hydrogen is blended into natural gas. In 2029, hydrogen production will increase to supply the next year’s augmented hydrogen demand. Between 2030 and 2040, the amount of produced hydrogen will grow by 18%, reaching 125 PJ in 2050. More efficient and cheaper PEM electrolyzer technologies would increase the hydrogen generation in the H2 scenario.
This study suggests that hydrogen for Turkey is both a mid-term solution for decarbonization and an option to reduce energy dependency. To analyze the effect of hydrogen blending into natural gas on energy dependency, a closer look at fuel import amounts is given in
Figure 16. While similar results are observed for biomass, coal, and uranium, between the two scenarios, natural gas shows a significant change. Over the course of the modeling period, a 2098 PJ decrease was observed in cumulative natural gas import between the two scenarios. This amount is almost twice Turkey’s total natural gas demand in 2020 [
55]. Based on this result, it can be concluded that hydrogen blending decreases the energy dependency of Turkey, replacing natural gas imports with domestically produced green hydrogen.
In the model, hydrogen storage is included after 2025 to solve the intermittency problem of renewable energy sources. Renewable energy power plants have different capacity factor values over the course of one year depending on the availability of related sources. In the current study, a year is split into 6 time slices by assigning 3 seasons (intermediate, summer, and winter) and 2 daily time brackets (day and night). Excess electricity that is produced during one-time slice can be stored and used when there is more need in the following time slices. The changes in the level of hydrogen storage can be seen in
Figure 17. Hydrogen storage begins to function in 2025 with lower results, as the capacity of renewable power plants is low. At the beginning of 2030, the highest level of storage is observed, which is to provide the necessary amount of electricity during that year. The increase in the blend rate of hydrogen causes an increase in power generation. During the next few years, the expansion of renewable power plant capacity will result in higher storage levels.
CO
2 emissions are the most important result of this study since they respond to the question of to what extent can hydrogen help decarbonize Turkey’s energy system. The model takes into account only a specific portion of Turkey’s energy system, which includes the electricity system to produce green hydrogen and the natural gas system for industrial, residential, and commercial end uses. That is why the results purely show the emission reduction generated by the displacement of natural gas by hydrogen as heating fuel (
Figure 18).
Both scenarios yield the same results until 2025, as hydrogen was not added to the energy mix until that year. In 2023, emissions decrease by 10 million tons as Turkey’s first nuclear power plant starts generating electricity. With the start of hydrogen blending in 2025, emissions will increase by 5 million tons since renewable power generation capacity is not enough to supply both the final electricity demand and hydrogen production. However, during the following years, till 2029, emission levels stay lower than the BAU scenario. Prior to increasing the blending rate in 2030, the model generates more electricity and stores it during 2029 to use during the next year. Afterward, emission levels keep getting lower results than the BAU scenario. In the final year of the modeling period, the BAU scenario has over 250 million tons of CO2 emission, while the H2 scenario has less than 240 million tons of CO2 emission. The cumulative emission reduction between the two scenarios is 112 million tons of CO2, corresponding to more than half of the emission in the first modeling year. Although it is not enough to prevent carbon emissions from expanding, a cumulative emission reduction of 112 million tons of CO2, corresponding to more than half of the emission in the first modeling year is obtained between the two scenarios.
It should be noted that hydrogen blending could only serve as a mid-term solution to reach the zero-carbon goal by 2053. Further emission reduction can be achieved with hydrogen after 2040 if the hydrogen-dedicated transmission and distribution grid is ready by 2040 and natural gas is fully replaced by hydrogen. Moreover, developments in hydrogen technologies (i.e., electrolyzer, storage, fuel cell) such as cost reduction or efficiency increase, carbon pricing, and government incentives on hydrogen investments could help cut emissions. Hydrogen can also be used as a fuel that can help with decarbonization in the transportation sector, which has not been included in this study.
The economic results of this study are analyzed by capital investments in each scenario (
Figure 19). The capital investment of the base year 2020 and the following year 2021 is low, since all of the system components already exist, which is established by the residual capacity parameter. The highest investment is needed in 2023 caused by the nuclear power plant implementation. In real life, these costs are not assigned to one year but rather take place over the years. Although the nuclear power plant’s effects on the Turkish energy system are not the subject of this study, based on the model results comparing emission reduction and total investment costs in 2023, a nuclear power plant can be evaluated as a high-cost solution for decarbonization efforts. Furthermore, it does not offer a solution to Turkey’s energy dependency as Turkey relies on Russia for the construction and operation of the power plant [
93], or energy security by making cyber security a significant concern, in addition to physical security [
94].
In the H2 scenario, following the year 2025, where hydrogen demand starts to occur, capital investment costs begin to differentiate from the BAU scenario. Green hydrogen production requires a PEM electrolyzer, storage capacity, and extra renewable power plant capacity. Still, expected cost reductions in these technologies prevent a big gap between the results of the two scenarios. Additionally, a cost reduction is obtained due to fewer natural gas imports in the H2 scenario.
Table 10 presents the total costs of each scenario, resulting in the need for nearly 17 million USD of more investment for the H2 scenario. With the current boundaries of the model, the sensibility of the given capital investment costs is hard to evaluate. Therefore, these numbers should be seen as a way of comparing the two scenarios and not an indication of the future energy system cost of Turkey.
In the case where natural gas is fully replaced by hydrogen, additional costs should be included since natural gas pipelines cannot be used for a blend of over 20% hydrogen. This can be added to the model by defining the capital cost of hydrogen transmission and distribution grid starting from the related year. Furthermore, other green hydrogen production methods such as alkaline electrolyzers and biomass gasification can be investigated if they offer the least cost option. It should be noted that if a carbon tax comes into effect in the future, the H2 scenario would gain a cost advantage by causing less emissions [
30].
7. Conclusions
This study aims to identify hydrogen’s role in the Turkish energy system by displaying the several effects of hydrogen blending into the natural gas network. This study highlights the importance of renewable hydrogen production and storage in enabling flexibility within energy supply systems, particularly as Turkey is transitioning toward a low-carbon energy system. The study also examines the potential for integrated energy systems interconnecting electricity and natural gas infrastructure by blending hydrogen with natural gas. To achieve these objectives, the OSeMOSYS tool was adapted to simulate the future energy system of Turkey.
A comprehensive review of hydrogen and the Turkish energy system is conducted to join the efforts of building a hydrogen economy in Turkey. Hydrogen is under significant consideration by many countries as one of the means to tackle climate change [
10]. It has a wide range of end uses, one being blending into natural gas. The review discussed the trends in the Turkish energy system, underlining its renewable energy potential and energy dependency. Gas decarbonization is of significant importance for countries like Turkey, where fuel poverty and energy vulnerability have influenced energy policy for decades [
22]. By adopting a similar approach as other countries that have already published their hydrogen roadmap, Turkey can benefit from hydrogen to reduce emissions and energy vulnerability, at the same time.
The BAU scenario is built to simulate a realistic development of the Turkish energy system based on existing data, planned investments, and projections toward 2040. In the H2 scenario, hydrogen technologies (i.e., electrolyzer, storage, and fuel cell) and the demand for hydrogen are added, by replacing a certain amount of natural gas demand. The model finds the least cost option to meet the input demands. The emission reduction was calculated from the output of OSeMOSYS after the cost optimization model was run successfully for both scenarios.
The study results show the potential of hydrogen, with an accumulated emission reduction of 112 million tons of CO2 in the H2 scenario between the years 2020 and 2040 compared to the BAU scenario. This reduction is almost equivalent to more than half the emission in the year first modeling year. While the H2 scenario causes less CO2 emissions during the modeling period, it also causes an increase of nearly 17 million USD in accumulated capital investments. This increase occurs due to the hydrogen production process, which needs extra investments for both hydrogen technologies and renewable power plants. However, it must be noted that the amount of imported natural gas decreases, resulting in a decrease in both capital investments spent and the energy import dependency of Turkey.
Among the various end uses of hydrogen, blending into the natural gas network is chosen, which is considered a mid-term energy transition solution. A similar approach is adopted by choosing a PEM electrolyzer for production. Other hydrogen production methods can be examined and compared in future work. The transportation sector could be seen as a possible extension to this study since hydrogen can be used as fuel in this sector by introducing fuel cell electric vehicles into the Turkish energy system.
In light of the results of this study and recent hydrogen-related developments that have taken place in Turkey and the world, hydrogen’s relevance to the future energy system of Turkey can be seen easily. Like other countries, an experimental project is already being conducted in Turkey where green hydrogen produced by electrolysis is blended into natural gas for heating. Turkey can benefit from the results of local and global projects to prepare a hydrogen deployment roadmap. Eventually, environmental benefits can be obtained with a decrease in related emissions. Furthermore, the potential of reducing energy import dependency offers a great advantage in favor of hydrogen-related research and development projects and, thus future investments.


