Article

Experimental Investigation of the Dynamic Deformation of Wind Turbine Blades Based on 3D-Digital Image Correlation

1
College of Energy and Power Engineering, Inner Mongolia University of Technology, Hohhot 010051, China
2
Key Laboratory of Wind and Solar Energy Uitilization Technology, Ministry of Education, Hohhot 010051, China
3
Huaneng Urad Middle Banner New Energy Generation Co., Ltd., Bayannur 015300, China
*
Author to whom correspondence should be addressed.
Energies 2024, 17(24), 6330; https://doi.org/10.3390/en17246330
Submission received: 5 December 2024 / Revised: 11 December 2024 / Accepted: 13 December 2024 / Published: 16 December 2024
(This article belongs to the Section A3: Wind, Wave and Tidal Energy)

Abstract

:
A wind turbine is a rigid–flexible coupling system, and its blades will be deformed under the action of aerodynamic force, inertia force, and elastic force. To monitor the deformation of the blades, this paper builds a dynamic deformation measurement system for wind turbine blades based on 3D-DIC and directly measures the three-dimensional displacement distribution of different blades under different operating conditions to obtain the dynamic deformation of the blades. The experimental results show that the dynamic waving deformation of the blade shows the trend of increasing and then decreasing with the increase in wind turbine rotational speed and incoming wind speed, and when the rotational speed reaches 500 r/min and the incoming wind speed reaches 9 m/s, the blade deformation reaches the maximum value; the dynamic waving deformation of wind turbine blade decreases with the increase in the elastic modulus of the blade and the degree of the decrease decreases gradually; the dynamic deformation of is predicted by the multiple displacement distribution of different blades under different operating conditions, and is obtained by the fitting of the experimental data. This paper develops a 3D-DIC-based dynamic testing system for wind turbine blades, conducts experimental studies to verify and prove the practicality of the system, and finally obtains the prediction polynomials for the dynamic deformation of wind turbine blades under different operating conditions.

1. Introduction

The wind turbine is a rigid–flexible coupling system, and its blades will be deformed under the action of aerodynamic force, inertia force, and elastic force, which affects the operation of the wind turbine. To monitor the deformation of the blades, this paper builds a dynamic deformation measurement system of wind turbine blades based on 3D-DIC technology and directly measures the three-dimensional displacement distribution of the blades made of different elastic modulus materials under different operating conditions to obtain the dynamic deformation of the blades. The experimental results show that the dynamic waving deformation of wind turbine blades shows a trend of increasing and then decreasing with the increase in wind turbine rotational speed and incoming wind speed, and the wind turbine blade, as one of the most critical components of the wind turbine, is deformed by aerodynamic, elastic, and inertial forces [
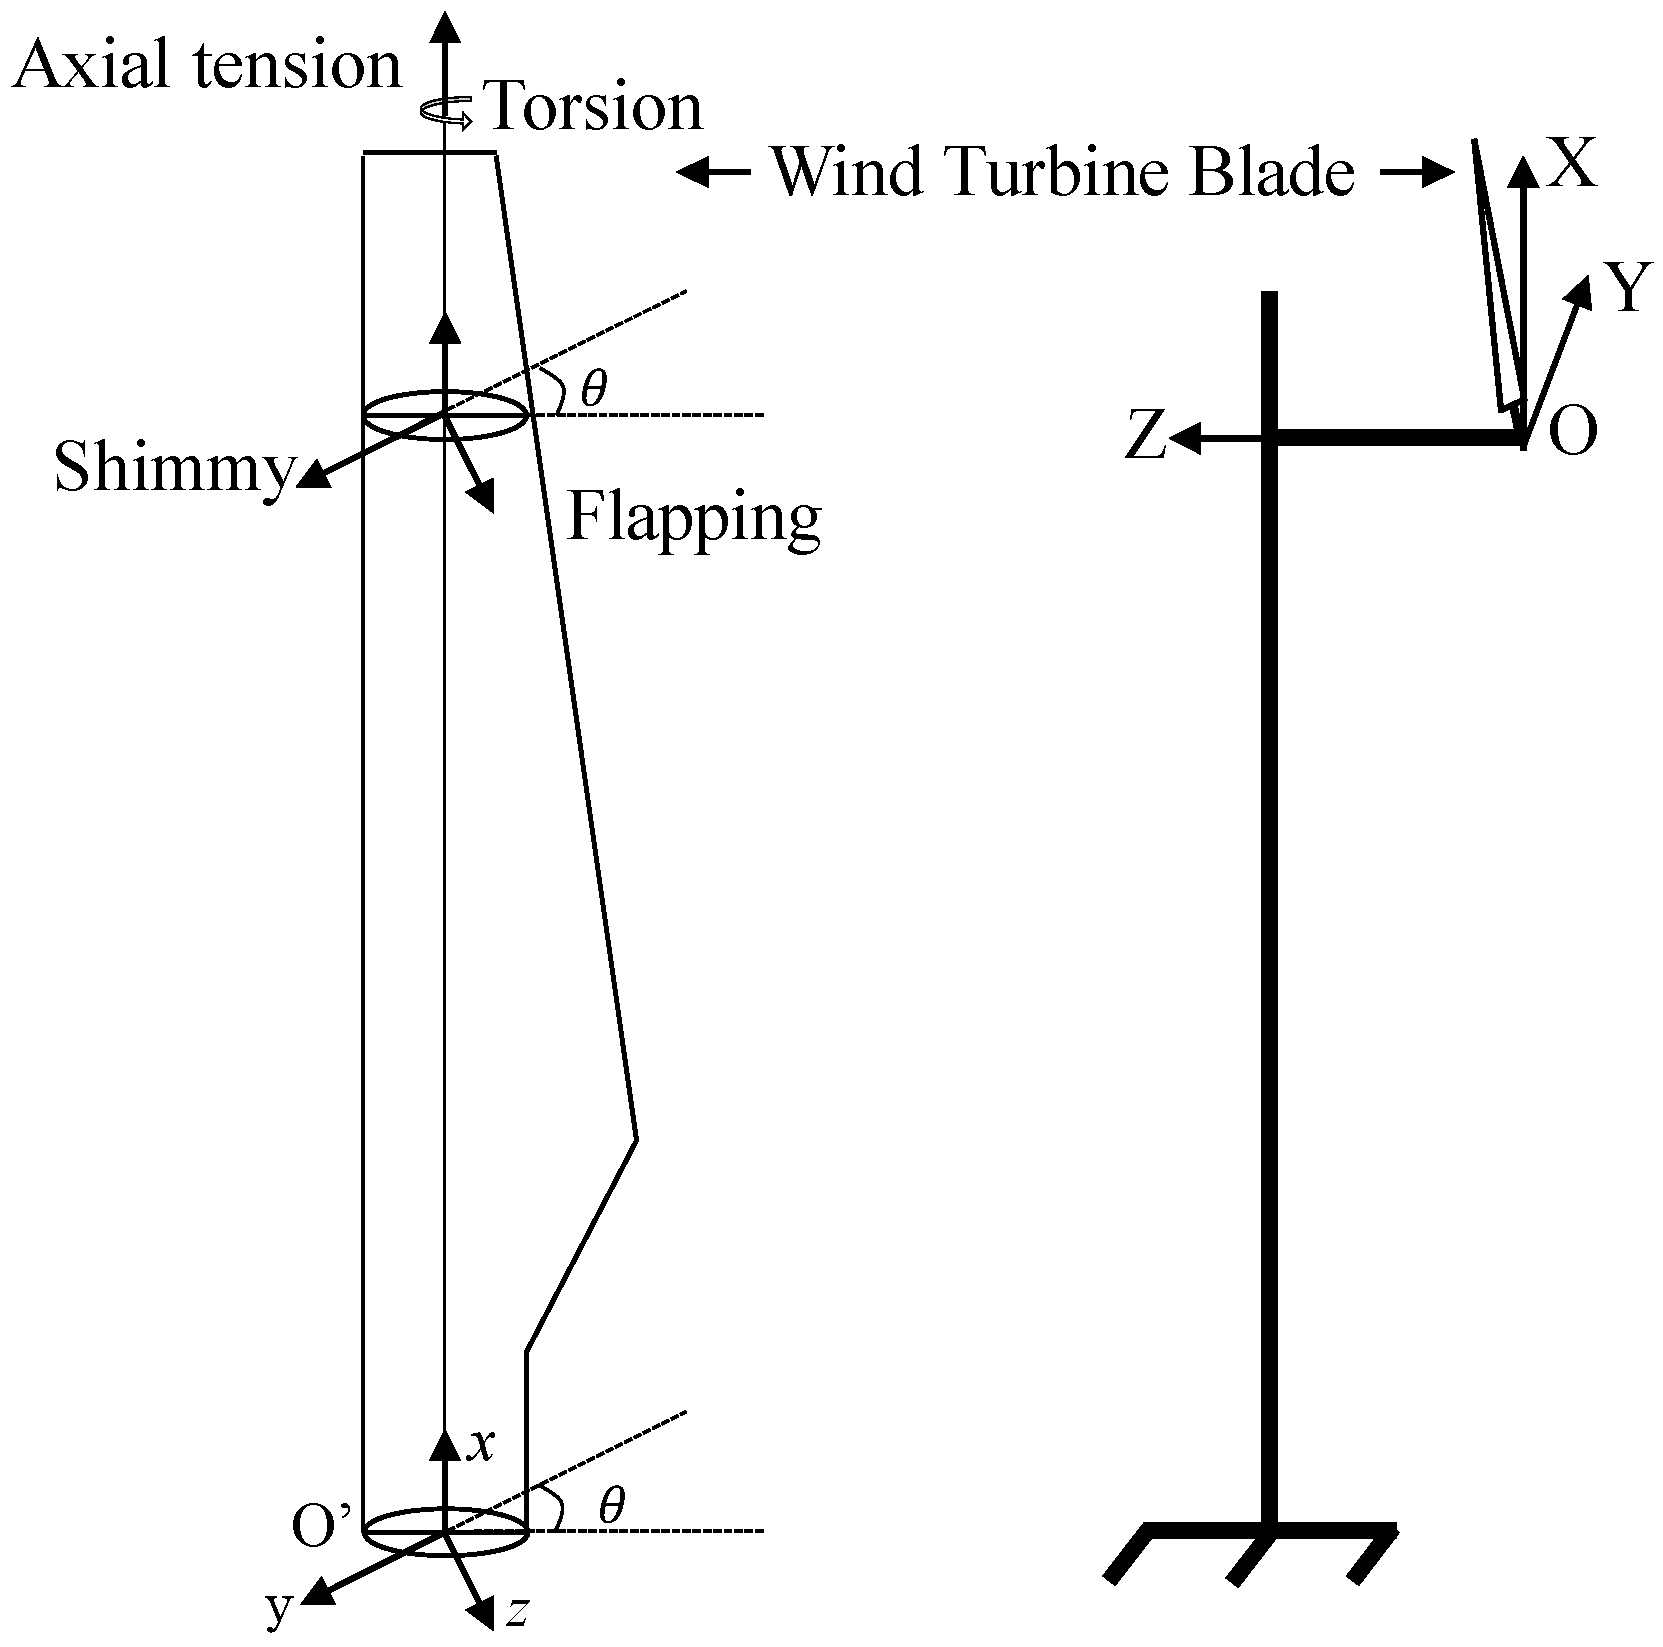
1]. Blade deformation is divided into waving deformation, torsion deformation, and oscillation deformation, of which the amount of oscillation deformation and torsion deformation is relatively small. Wind turbine operating conditions have a certain effect on blade deformation [2], and at the same time, it is related to the blade elastic modulus and the geometry of the airfoil section [3]. The deformation of the blade not only causes changes in the blade winding flow field but also affects its service life. Therefore, monitoring the deformation law of the blade under operating conditions can provide a theoretical basis for the safe and stable operation of the blade and structural optimization.
To simulate more accurately the real working conditions of wind turbines under different operating conditions and to comprehensively assess the impact of blades on the performance of wind turbines, rigid and flexible blades are considered, which are found to be significantly different through the comparative analysis of the flow form of the tip fluid [4]. It was found that considering the blade as a rigid body can no longer meet the wind turbine design requirements, driving the development of the blade from being assumed as a rigid body to a complex, real, flexible body [5]. Under this condition, the CFD simulation of wind turbine operation under various conditions found that wind turbine blade deformation has a significant effect on the aerodynamic performance, and the blade deformation leads to a change in the vortex trajectory at the tip of the blade [6], which mainly changes the vortex’s normal direction, thus changing the boundary conditions of the vortex model, leading to a slightly different distribution of the circulating currents along the span [7], and also delaying the location of the initiating vortex [8]. The aerodynamic performance of a wind turbine is closely linked to the loads, and understanding the changes in the aerodynamic performance of a wind turbine after blade deformation requires the application of loads to the blade to produce deformation, and the contribution of inertial loads to the blade deformation is higher relative to the contribution of aerodynamic loads [9].
Even though numerical simulation can study the working condition of wind turbines after blade deformation, which has the advantages of convenience and low cost of measurement, the numerical simulation is carried out in an ideal state, which is quite different from the actual working complex environment of a wind turbine, so the numerical simulation results have a big difference with the actual operation. Some scholars use experimental methods to study the deformation of the blade under different forces. If the blade is in the state of a cantilever beam with one end fixed and one end free, the blade is divided into seven nodes from the root of the blade and loaded with a determined load on six loading surfaces, and the difference between the displacement of each cross-section and the initial distance of the relevant cross-section is obtained, that is, the deformation of the blade under the load [10]. To understand the stress–strain situation suffered by different parts of the blade, strain sensors were arranged on the surface of the wooden blade, and hammering experiments were carried out at 26 locations on the blade, which in turn yielded the relationship between blade strain and deformation [11]. Applying external loads to the blade, also fixing one end of the blade, applying four different strengths of backward tension in the direction of blade waving to simulate the wind turbine blade under different flexure conditions, and using LiDAR technology to capture the blade displacement to obtain the blade deformation [12]. However, the blade is usually subjected to complex loads in practice, such as dynamic loads, non-uniform loads, and other common effects, and the load in the laboratory is relatively single, so it is difficult to accurately describe the dynamic deformation produced by real complex load blades, resulting in the inability to comprehensively consider the deformation of the blade.
Consequently, it is necessary to monitor the dynamic deformation of wind turbine blades under actual working conditions. Through reviewing the literature, it is found that there are more experimental means to monitor the blade; for example, Zhang et al. [13] developed a new technique of fine search based on affine transformation, which can directly calculate the rigid and elastic displacements caused by deformation, but it has not been applied in dynamic deformation experiments of wind turbine blades. Different experimental means are compared to find a suitable method. It is found that digital image correlation (DIC), as an optical video measurement method, realizes accurate measurement of blade deformation by high-speed continuous image acquisition of the blade surface and image matching and displacement field reconstruction using relevant algorithms. Carr et al. [14], based on the theoretical method of the cantilever beam, built an experimental platform with one end of the blade fixed and one end movable, captured the static strain distribution of the blade using the DIC technique, and used the method for full-field surface dynamic measurement [15]. These studies confirmed the effectiveness of the DIC method in monitoring wind turbine blade deformation, and the results provide a strong reference for subsequent blade optimization, wind turbine performance prediction, and wind farm layout.
However, the DIC fails when the measured object is rotating [16,17], making it difficult to apply the method to deformation measurements of some rotating research objects. To solve this problem, a DIC considering a rotational algorithm is proposed [18], which can accurately obtain full-field deformation measurements of an object under the occurrence of an arbitrary rotational angle, overcoming the limitations of deformation measurements at large rotational angles, making the application of the DIC to wind turbine blade measurements a reality, and verifying its usability in wind turbine blade deformation experiments [19]. Technology has the advantages of non-contact, comprehensiveness, and high accuracy, which can provide detailed blade deformation information and can be used to conduct three-dimensional dynamic experiments on turbine blades [20], which proves that the technology can monitor the dynamic deformation of the blades. Winstroth et al. [21] used the DIC measurement method to obtain the deformation amount of the wind turbine blade and compared the results of the study with the results of numerical simulation, which showed that DIC has great potential in blade condition monitoring. However, in the experiment, the blades were subdivided, and some of the areas were selected for monitoring, and the wind turbine blades were not globally monitored.
In this paper, a 3D digital image correlation (3D-DIC) algorithm is used to build a horizontal-axis wind turbine blade dynamic deformation measurement system in the wind tunnel opening section of the Key Laboratory of the Ministry of Education for Wind Energy and Solar Energy Utilization Technology (Inner Mongolia University of Technology) to monitor the distribution of three-dimensional displacements of blades with different elastic modulus to obtain the dynamic deformation of blades, and to explore the dynamic deformation law of wind turbines under different operating conditions. The dynamic deformation of the blade is obtained to explore the dynamic deformation law of the blade under different operating conditions of the wind turbine. The results of the study can provide valuable experimental data support for the structural design and improvement of wind turbine blades.

2. Research Methodology

2.1. Blade Deformation Theory

During the working process of a wind turbine, various complex loads will deform the blade. In this paper, we mainly consider the blade waving deformation, i.e., the rotating blade makes a bending motion in the direction perpendicular to the rotating surface, and its detailed blade deformation principle is shown in Figure 1 [22]. A coordinate system is established for the wind turbine blade with O as the origin; the origin is on the blade root section; the x -axis points to the tip of the blade through the shear center of each section; the y -axis is along the direction of pendulum oscillation; the z -axis is along the direction of waving; and the angle between the y -axis and the chord is the cross-section torsion angle θ .
The blade is simplified as a rotating Euler–Bernoulli cantilever beam with centrifugal force inducing axial force. From Hamiltom’s principle, the vibration equation of blade waving deformation is obtained as follows:
E I c o s 2 θ ω , x x , x x x L m y Ω 2 e + y c o s β p d y ω , x , x + m ω , t t = 0   0 < x < L
The boundary conditions are as follows:
ω | x = 0 ,   ω x | x = 0 ,   E J ω , x x x | x = L = 0
where ω is the waving displacement, L is the length of the blade, β p is the angle between the blade and the vertical plane, m is the mass of the section, Ω is the rotational speed of the wind turbine, e is the offset from the root of the blade to the hub, J is the moment of inertia, and E is the modulus of elasticity, which expresses the ability of the material to resist elastic deformation in tension and compression and represents an important index of the ability of the material to resist elastic deformation. The wind turbine blade used in this experiment is a fixed airfoil [23], and the amount of change in the shape of the airfoil cross-section in the actual situation is very small, so this study ignores the effect of the change in the geometry of the airfoil cross-section and only considers its modulus of elasticity as an influencing factor. In addition, other external influences are also analyzed in this paper, which include the following: blade phase angle, wind turbine rotational speed, and incoming wind speed.

2.2. 3D-DIC Measurement Principle

Digital image correlation (DIC) is a non-contact 3D full-field displacement measurement system for deformation comparison algorithms through image correlation grid information, by which the displacement field and strain field distribution on the surface of the object can be calculated. In the whole measurement process, only one (2D), two (3D), or more (array) image collectors are needed to obtain the deformation process images of the experimental objects with prefabricated scattering coatings, and the full-field displacement data distribution information can be obtained intuitively after the comparison operation. The 3D-DIC utilizes the images taken by the two cameras from different angles to perform the correlation matching and establishes the three-dimensional coordinates of the objects under the world coordinate system by combining the internal and external parameters of the two cameras. The 3D coordinates of the object in the world coordinate system are established by combining the internal and external parameters of the two cameras, and the measurement principle is shown in Figure 2. The two cameras take images of the same object surface from different viewpoints at the same time, and to obtain an accurate measurement, each camera needs to determine its internal and external parameters, which mainly include the equivalent focal length of the camera, the coordinates of the main point, the skewness coefficient, and the distortion coefficient. Where the outer parameter is used to determine the relative position of the two cameras, which is represented by a rotation matrix and a translation vector.
Using the Zhang Zhengyou calibration method [24], the precision calibration plate is arbitrarily placed in front of the two cameras, and it is ensured that the calibration plate is clearly imaged, and then multiple pairs of dual-camera images are collected to extract the coordinates of the characteristic corner points in each image, and then finally the internal and external parameters of the two cameras are calculated by the corresponding algorithm. Finally, the 3D world coordinates P (xw, yw, zw) of a certain point are then derived from the image coordinates Pi (ui, vi, i = 1, 2), which is calculated as follows:
a 11 i u i a 13 i a 12 i u i a 32 i a 13 i u i a 33 i a 21 i v i a 31 i a 22 i v i a 32 i a 23 i v i a 33 i x w y w z w = u i a 34 i a 14 i v i a 34 i a 24 i ( i = 1 , 2 , 3 )
where (u1, v1) and (u2, v2) are the two-dimensional pixel coordinates of cameras 1 and 2, denoting the projection matrix, which is determined by the internal and external references of the camera. In Equation (2), the world coordinates (xw, yw, zw) can be solved exactly by these four equations using the least squares method.

3. Experimental Research

In this paper, firstly, different composite molding processes are used to make specimens according to the standard and test their elastic modulus, and three pairs of wind turbines with different elastic modulus blades are made as experimental prototypes by the same process as that of the specimens; then, a dynamic deformation measurement system of the wind turbine blade is built based on 3D-DIC, and the full-field measurement of three pairs of wind turbine blades of different elastic modulus is carried out with three-dimensional displacement distribution at different rotational speeds and wind speeds to obtain the amount of dynamic deformation. The dynamic deformation of wind turbine blades is obtained by measuring three pairs of wind turbine blades with different elastic moduli at different rotational speeds and wind speeds.

3.1. Wind Turbine Blade Fabrication

3.1.1. Specimen Fabrication

To improve the standardization and accuracy of the blade elastic modulus test, the standard specimen is used to replace the wind turbine blade, which is complex in shape, expensive in cost, and difficult to test. In the production process of wind turbine blades, different fiber cloths are used for layup, referring to the national standard, adopting unidirectional layup, ±45° layup and 0~90° layup, etc., to adjust its layup ratio, to change the modulus of elasticity of the specimen, and the standard specimen is produced in the same process as the blade, of which the materials used are shown in Table 1.
The molded specimen is 80 mm in length, 10 mm in width, and 4 mm in height, and the proportion of layered fibers and adhesive dosage is generally 50% each. According to the standard blade material specimen sampling, the sampling method is shown in Table 2, where L indicates the direction of the specimen length, and W indicates the direction of the specimen width, as shown in Figure 3.
In the process of wind turbine blade fabrication, the fiber fabric is laid flatly from the root to the tip direction. In the test experiment of the elastic modulus of the specimen, the pressure experiment is carried out on the specimen placed horizontally on the support by the indenter of the testing machine, the force–displacement data of the test indenter is recorded, and the modulus of elasticity of the material is obtained by calculation. The details are shown in Figure 4a, where the specimen is schematically shown in Figure 4b.
We obtain the force–displacement scatter data of the specimen and calculating the modulus of elasticity of the specimen by Equation (3), written as follows:
E = L 3 F 1 F 2 4 b h 3 S 1 S 2
where E is the modulus of elasticity of the specimen, MPa; L is the three-point bending test bench span (mm), three-point bending extensometer test bench support span of 64 mm, the experimental indenter descending speed of 10 mm/min, the data acquisition sample speed of 1500 times/s, and continuous sampling to the specimen rupture; F1, F2 is the force exerted, N; b is the width of the specimen (mm); h is the height of the specimen (mm); S1, S2 is the deflection (mm).
A three-point bending test was conducted for each process specimen, and the slope of the curve fit, which represents the modulus of elasticity of the material of the specimen, was obtained by plotting the force–displacement curves of the experiments before the breaking point of the specimen. Tests were carried out for the sampled specimens in the direction of the specimen LN, and to reduce the effect of random errors, five repetitions of the experiment were carried out for each specimen with different layup processes, and the average value was taken. The curve points before the test fracture point of the specimen were fitted by Equation (3), and the mean value was taken to finally obtain its parameter representation as shown in Table 3, where 1 GPa = 103 MPa.

3.1.2. Fabrication of Wind Turbine Blades with Different Modules of Elasticity

As can be seen from Table 3, the modulus of elasticity of the material obtained by different processes varies. In this experiment, to simplify the experimental process, we select the highest value of the material modulus of elasticity and the lowest and intermediate values for the study, respectively, by selecting the specimens “d”, “90”, and “45”. Three pairs of wind turbine blades are fabricated using the same fabrication process as the specimens, and the blade airfoils are selected from the S-wing high-performance wind turbine blades designed by the group, with a blade length of 0.7 m, a rated wind speed of 10 m/s, a rated rotational speed of 750 r/min, and a rated output of 300 W. The rated output is 300 W, and the rated output is 300 W. The rated wind speed is 10 m/s, and the rated rotational speed is 750 r/min.

3.2. Experimental Design of Blade Dynamic Deformation Measurement

3.2.1. System Construction

Based on the 3D-DIC method considering rotation, a wind turbine blade dynamic deformation measurement system, as shown in Figure 5, was built in the open experimental section of the low-speed wind tunnel of the Ministry of Education Key Laboratory of Wind and Solar Energy Utilization Technology (Inner Mongolia University of Technology) to monitor the dynamic deformation of wind turbine blades. The laboratory wind tunnel can provide different incoming wind speeds, with the highest stable wind speed of 15 m/s. The power section provides wind energy through axial flow ventilators, and in the rectification section, the wind is rectified to a stable incoming wind with a turbulence degree of less than 5%, which is accurately controlled by controlling the axial flow ventilator speed control system in the power section of the wind tunnel and accurately calibrated by an anemometer. The rotational speed of the wind turbine was regulated and monitored by a DC load box and a fluke power analyzer.

3.2.2. Experimental Program

To study the dynamic deformation and dynamic waving deformation of wind turbine blades, the following experimental program was designed and implemented. Based on the considerations of experimental equipment and camera shooting angle, the experimental data acquisition interval is from blade rotation θ1 = 56.5° to θ2 = 115°, as shown in Figure 6. A high-speed camera with a frame rate of 10,000 fps was used to measure three pairs of wind turbine blades with different elastic moduli under different wind speeds and rotational speeds, with the incoming wind speeds of 8 m/s, 9 m/s, 10 m/s, and 11 m/s, respectively, and the rotational speeds of 400 r/min, 450 r/min, 500 r/min, 550 r/min, and 600 r/min, and the wind turbine rotated at θ1 = 56° to θ2 = 115°. After the wind turbine is running stably under the established working conditions, the three pairs of wind turbine blades with different elastic moduli are subjected to multiple image acquisitions. Three sets of images were acquired for each working condition of each pair of blades, and the acquisition time of each set of images was 0.8 s. Subsequently, the acquired blade images were screened and analyzed to obtain an image album that can truly reflect the dynamic deformation of wind turbine blades.
To have a clear understanding of the detailed 3D coordinate changes in different regions of the blade, typical monitoring points are used for the study. The monitoring points are arranged on the suction surface of the wind turbine blade, and the detailed distribution of the monitoring points is shown in Figure 7, which is 20% (15 cm) away from the tip of the wind turbine blade and at the midpoint of the airfoil chord line and the two sides (25% of the chord length away from the midpoint of the chord line). The monitoring points are arranged along the spreading direction of the blade, and the spacing is 0.2R (R is the length of the wind turbine blade). In this experimental study, the center of rotation of the wind turbine is specified as the origin O, the suction plane along the main axis is the positive direction of the Z-axis, and the XOY plane is the plane of rotation of the wind turbine.

3.3. Error Analysis and Reliability Verification

3.3.1. Error Analysis

Usually, there are errors in experiments, mainly including non-experimental systematic errors caused by human factors, systematic errors caused by each experimental instrument, and so on.
Non-systematic errors caused by human operation can be eliminated, such as the camera’s shooting measurement area and target plate position error in the spatial calibration and the sharpest focal length error of the CCD camera in experimental calibration. The calibration is carried out several times in the experiment to ensure that the calibration area is consistent with the shooting position and the calibration image is the clearest.
The systematic errors caused by each experimental instrument are divided into the following parts: (1) The CCD camera is mainly vibrated by the pneumatic load of the incoming wind, or the original position is shifted. Although the camera bracket with good rigidity is used, it is not possible to ensure that there will not be a particularly small error; therefore, the actual experiment is carried out several times in the data collection, and the average value is used to eliminate this part of the systematic error. (2) The wind tunnel will be affected by the external wind and thus affect the incoming wind speed. The wind tunnel can be selected to carry out outside windless sunny weather conditions. When the outside wind speed is less than 2 m/s, the effect is negligible, and real-time monitoring of wind speed and wind wheel speed and timely fine-tuning, when the wind speed and rotational speed, respectively, are in the design value of the error of 2% and 5% of the conditions of the measurement. (3) The blade surface scattering grayscale is affected by the light. Before the experiment, the surface of the wind turbine blade is treated with matte spray paint so that the surface will not reflect under the condition of conforming to the measurement of the gray level, and a multi-azimuth halogen lamp is used to make up the light treatment. To improve the accuracy of the measurement, in addition to the above error reduction measures, multiple sets of measurement data were averaged to minimize the error.
The effective error analysis and improvement plan described above helped to identify and correct biases in the results, optimize the experimental measurement methods and processes, and improve the accuracy and credibility of the experimental results.

3.3.2. Reliability Verification

The correlation function is an important indicator for evaluating the measurement and calibration accuracy of the DIC system. In general, the correlation function is less than 0.15 to consider that the measurement and calibration are effective, and the closer the correlation function is to 0, the higher the correlation is. In this experiment, the left and right camera systems were calibrated, and their correlation functions were obtained, both of which were less than 0.15, and the calibration was good, as shown in Figure 8.
In this experiment, the principal point coordinates and lens aberrations of the two cameras were obtained by systematic calibration. During the calibration process, 19 sets of images were taken by the left and right cameras for different rotation angles and positions of the calibration plate, and the Harris algorithm [25] was used to extract the coordinates of the feature points in these images, which contained 108 feature-recognized corner points in each image, and a total of 216 feature-recognized corner coordinates of the left and right cameras were obtained in each set of images. To obtain the scale factor of the translation vector, 40 pairs of feature recognition corner point coordinates were randomly selected from the obtained feature recognition corner point coordinates, three-dimensional spatial coordinates were reconstructed, and the average of the reconstructed distances was compared with the real distance values to calculate the scale factor of the translation vector. In the calibration algorithm, the left camera (main camera) optical center coordinate system is used as the world coordinate system. Through calibration, the results of the internal and external parameters of the system are obtained, which are shown in Table 4. A total of 20 pairs of randomly selected feature recognition corner points obtained from the measurements in the previous paper are used to obtain the world coordinates of the feature points by utilizing the two-camera calibration parameters in Table 4, and 3D reconstruction is carried out. The calibration accuracy was evaluated by calculating the distance between two feature points in each image. Among them, the average value of the distance between feature points is 44.98 mm, and the average relative error is 0.03%, which determines the correctness of the experimental results.
The wind turbine blade dynamic deformation measurement system obtains the three-dimensional spatial coordinates and displacements of the blade monitoring points after actual measurement and adds the time series into it to obtain the full-field displacement over time distribution map of the blade surface. The displacement interval between two adjacent pictures is the dynamic instantaneous deformation of the blade. A point in the measured area of the blade is randomly selected as the research object, and any working condition is chosen to verify the accuracy of the dynamic deformation amount. The results are shown in Table 5, and in this experiment, the time interval between each of the two diagrams is 7.3 × 10⁻⁵ s. From Table 5, the average difference of dynamic deformation at different random points is 0.016 mm, 0.010 mm, and 0.014 mm, respectively, and the resolution of transient difference of its change amount accounts for 0.002% compared with the blade length. Therefore, its dynamic changes in the amount of precision to meet the wind turbine blade dynamic deformation experimental measurement requirements to ensure the applicability and reliability of the wind turbine blade dynamic deformation measurement system built based on 3D-DIC.

4. Results

4.1. Analysis of Dynamic Deformation of Wind Turbine Blades

After obtaining the full-field 3D coordinates of each monitoring point, the blade rotation to azimuth angle θ1 = 56.5° is taken as the initial state, and the 3D coordinates of the subsequent state are made to differ from the initial position, and the time series are added to obtain the dynamic deformation of the wind turbine blade. To obtain accurate data, three groups of experiments are carried out for each pair of blades, and at least 250 images are selected for comparison and calculation for each group of experimental data, so that the full-field deformation cloud map, the dynamic changes of the 3D coordinates of the monitoring points, and the dynamic deformation of the blades can be obtained finally.

4.1.1. Full-Field 3D Displacement Distribution

In this experiment, the blade rotation angle of θ1 = 56.5° is selected as the reference state to measure the full-field dynamic 3D displacement distribution of the wind turbine blade when the suction surface of the blade rotates counterclockwise under different working conditions. Due to the huge amount of displacement data for the whole field of the wind turbine blade and change with time, the ‘90’ displacement cloud of the blade is shown in Figure 9, from which it can be seen that the dynamic three-dimensional displacements of the measured blade can be accurately measured by the test system under different working conditions, and the overall quality of the displacement cloud is higher, which indicates that the dynamic deformation measurement system of the wind turbine blade can measure the displacement distribution of the majority of the measurement area on the blade surface well. distribution of the blade surface. In addition, from the comparison in the figure, under the same wind speed and rotational speed, when the elastic modulus changes, the displacement cloud of the measured blade shows obvious differences. With the increase in elastic modulus, the displacements of different regions of the blade show a decreasing trend. The amount of change is different for different positions on the blade, but they all follow a gradual decrease in displacement from the tip to the root of the blade. This implies that the wind turbine blade dynamic deformation measurement system based on 3D-DIC is effective and applicable for the dynamic deformation measurement of the blade.

4.1.2. Dynamic 3D Coordinate Changes of Wind Turbine Blades

Although the full-field displacement cloud can show the three-dimensional displacement of the wind turbine blade in the dynamic process, because the cloud is the displacement distribution at a certain moment, it cannot reflect the displacement changes of the monitoring points in the blade operation process well, so the blade “90” is the object of this study to analyze the three-dimensional coordinates of the monitoring points of the surface with the change in time, as shown in Figure 10. Among them, Figure 10(1) is the change rule of monitoring points 17, 18, and 19 on the X-, Y-, and Z-axes; the same, Figure 10(2) is the change rule of monitoring points 20, 21, and 22; Figure 10(3) is the change rule of monitoring points 23, 24, and 25; Figure 10(4) is the change rule of monitoring points 26, 27, and 28 on the X-, Y-, and Z-axes.
As can be seen in Figure 10, with the increase in time, the monitoring point in the running interval first moves along the negative direction of the X-axis and then moves along the positive direction of the X-axis, and the X-axis coordinates of each monitoring point first decrease and then increase; the monitoring point is always moving along the negative direction of the Y-axis, and the Y-axis coordinate decreases; the direction of waving deformation is the positive direction of the Z-axis within the running interval, which is the same as the direction of incoming flow, and the Z-axis coordinates increase. The change rule of coordinates for the different monitoring points in the X-, Y-, and Z-axes is the same. Comparison of the coordinate diagrams of different monitoring points shows that as the monitoring point moves from the blade tip to the blade root, the maximum value of the three coordinates becomes smaller and the magnitude of the coordinate change decreases. The closer the monitoring point is to the blade tip, as shown in Figure 10(1,2), the coordinates of the three monitoring points do not change much; the closer the monitoring point is to the blade root, as shown in Figure 10(3,4), the coordinates of the three monitoring points increase, and the phase of each monitoring point produces changes. Therefore, compared with the tip of the blade, the shape of the blade at the root has a more obvious effect on the three-dimensional coordinates, which in turn affects the amount of blade deformation.

4.1.3. Analysis of Dynamic Waving Deformations of Wind Turbine Blades

The dynamic waving deformation of the wind turbine blade refers to the dynamic bending motion of the blade in the direction of the vertical rotating surface under the steady-state working condition of the wind turbine, which is one of the main deformation forms of the wind turbine blade. The experimental research blade is small, and the amount of torsional deformation and swing deformation is very small, so this study concentrates on the dynamic swing deformation of the blade. As the dynamic waving deformation of the wind turbine blade is larger in the tip region, combined with the experimental conditions, the dynamic waving deformation of the wind turbine blade tip is finally studied. From the previous section, the basic consistency of the change rule of monitoring points 17–22 in the three-dimensional displacement coordinate distribution, the dynamic waving deformation experimental monitoring point in this experiment is set to point 18, and the data collection interval is from blade rotation θ1 = 56.5° to θ2 = 115°. According to the three-dimensional coordinate measurement in the previous paper, the dynamic waving deformation of the blade was calculated in the whole measurement interval. The dynamic waving deformation of three wind turbine blades with different elastic moduli is finally obtained as shown in Table 6, Table 7 and Table 8. The dynamic waving deformation of the wind turbine blade shows an increasing and then decreasing trend with the increase in rotational speed and wind speed and gradually decreases with the increase in elastic modulus. The maximum dynamic waving deformation of the wind turbine blade is concentrated in the vicinity of the rotational speed of 500 r/min and wind speed of 9 m/s. The dynamic waving deformation of the wind turbine blade is also concentrated in the vicinity of the rotational speed of 500 r/min and wind speed of 9 m/s.

4.2. Analysis of Factors Affecting Dynamic Deformation of Wind Turbine Blades

Since the wind turbine is a complex energy conversion mechanism, its operating conditions are more complicated, thus leading to more influencing factors on the dynamic deformation amount of the blade and the dynamic waving deformation amount; this includes from the viewpoint of material properties, including material elastic modulus (modulus of elasticity), density, Poisson’s ratio, etc. [3], and from the viewpoint of the operating environment, including the incoming wind speed, blade rotational speed, Reynolds coefficient, centrifugal force load, aerodynamic axial thrust load, etc. Among them, the density, Poisson’s ratio, and Reynolds’ coefficient have a very small effect on the deformation of wind turbine blades, which can be neglected; the centrifugal force load is proportional to the square of the rotational speed, and there is no difference between the three blade models in the experiments, except for the material molding process; the aerodynamic axial thrust load is proportional to the square of the incoming wind speed, and the size of it is correlated to the square of the incoming wind speed under the unchanged conditions of the present experiments. Therefore, to facilitate the study of the dynamic deformation amount of wind turbine blades, the blade phase angle, wind turbine rotational speed, incoming wind speed, and elastic modulus are selected as independent variables to analyze the dynamic deformation law of the blade.

4.2.1. Analysis of Phase Angle Variation

To study the effect of phase angle on the dynamic deformation of wind turbine blades, the instantaneous deformation of the monitoring point 18 of the blade “90” is selected to be analyzed with an incoming wind speed of 10 m/s and a rotational speed of 550 r/min, as shown in Figure 11. As the phase angle increases, the dynamic deformation fluctuations of the wind turbine blade gradually become smaller and converge within the maximum difference of 0.018 mm. Among them, the fluctuation of dynamic deformation is larger when the phase angle is about 77° to 87°, and it tends to stabilize after the phase angle of 87°. Therefore, the phase angle has little effect on the dynamic deformation of the blade in the range of 87° to 102°, and the main influence range is between 77 and 87°.
At certain phase angles, the blade structure may be subjected to external perturbations or loading, which can cause large dynamic deformations. These phase angles are more sensitive to the excitation of blade natural frequencies or resonance phenomena. Between 77 and 87°, the blade may be more susceptible to excitation in specific vibration modes, resulting in increased dynamic deformation. The interaction between the blade and the airflow may vary for different phase angles, thus affecting the amount of dynamic deformation to varying degrees. Wind turbines are usually equipped with control systems to monitor and regulate parameters such as blade rotational speed and angle. At certain phase angles, the control system may automatically adjust the blade angle or incorporate other control strategies to reduce the amount of dynamic deformation of the blades. This reduces the effect on the amount of dynamic deformation over a range of phase angles.

4.2.2. Analysis of Wind Turbine Rotational Speed Variation

When the incoming wind speed is 10 m/s, the dynamic deformation of the blade “90” monitoring point 21 at different rotational speeds is shown in Figure 12. As can be seen from the figure, with the change in measurement time, the fluctuation of the dynamic deformation of the blades shows a decreasing trend and gradually converges to a stable value, which tends to stabilize after about 7.5 ms. Comparing the dynamic deformation of the blade at three different rotational speeds, it is obvious from the figure that the dynamic deformation of the wind turbine blade gradually decreases with the increase in rotational speed at the same moment.
As the rotational speed increases, the centrifugal force on the blade increases, which results in greater centrifugal loads acting on the blade surface. However, as the rotational speed continues to increase, the blade reduces the amount of dynamic deformation through the elastic recovery of its structure. At lower rotational speeds, the blades may not be in full dynamic equilibrium. This means that the blades are unbalanced during rotation, which results in greater dynamic vibration and deformation. As the rotational speed increases, the blades will gradually come into equilibrium, reducing the amount of dynamic deformation. Wind turbines are usually equipped with control systems to monitor and adjust parameters such as blade rotational speed and angle. In some cases, the control system may automatically adjust the blade angle or adopt other control strategies to reduce the dynamic deformation of the blade. As the rotational speed increases, the control system can make more accurate adjustments based on real-time measurements, thereby reducing the amount of dynamic deformation of the blades.
To investigate the changes of the specific dynamic deformation of the wind turbine blade on the rotational speed in the same moment, the blade is selected under the working conditions of wind speed of 10 m/s and rotational speeds of 400 r/min, 450 r/min, 500 r/min, 550 r/min, and 600 r/min, respectively, and the dynamic deformation of the blade is selected to be relatively stable in the interval of about 10 ms, and the mean value is obtained. The comparative analysis is shown in Figure 13. From the figure, it can be seen that the dynamic change amount, with the increase in rotational speed, its dynamic deformation amount shows a trend of gradual decrease.

4.2.3. Analysis of Wind Speed Variation

When the rotational speed is controlled at 500 r/min, the dynamic deformation of the blade “90” monitoring point 21 at different wind speeds is shown in Figure 14. It can be seen from the figure that, with the change in measurement time, the fluctuation of the dynamic deformation of the blades shows a decreasing trend and gradually converges to a stable value, and all of them converge to a stable state after about 8 ms. Comparing the dynamic deformation of the blade at three different rotational speeds, it is obvious that the dynamic deformation of the wind turbine blade decreases with the increase in wind speed at the same time.
To explore the same moment, the wind turbine blade-specific dynamic deformation about the change in rotational speed, we chose the blade with the rotational speed of 500 r/min; the incoming wind speed of 8 m/s, 9 m/s, 10 m/s, and 11 m/s working conditions, respectively, were selected for dynamic deformation of a relatively stable 10 ms interval, and we sought its average value for comparative analysis as shown in Figure 15. From the figure, its dynamic change quantity, with the increase in rotational speed, its dynamic deformation quantity shows a gradually increasing trend.

4.2.4. Analysis of Different Blades

When the incoming wind speed is 10 m/s and the rotational speed is 500 r/min, the instantaneous deformation of monitoring point 21 under different material elastic moduli is shown in Figure 16. With time, the dynamic deformation of blade “d” changes drastically from 0 to 10 ms, and after 10 ms, the dynamic deformation is gradually stable; the maximum dynamic deformation difference reaches 0.127 mm, and after 10 ms, the maximum dynamic deformation difference is basically within the range of 0.013 mm; from 0 to 7.5 ms, the maximum dynamic deformation difference is within the range of 0.013 mm. In the interval from 0 to 7.5 ms, the dynamic deformation of blade “90” fluctuates a lot, and the maximum dynamic difference reaches 0.076 mm; after 7.5 ms, its dynamic deformation is basically in a stable state, and the difference between the interval changes is basically in the range of 0.0251 mm; blade “45” is in a stable state in the interval of 0.0251 mm, and its dynamic deformation is basically in a stable state in the interval of 0.0251 mm. “45” in the whole measurement interval, the dynamic deformation fluctuation is basically larger, but after 3 ms, compared with the dynamic deformation in the range of 0 to 3 ms, there is a significant reduction in the dynamic deformation, and the dynamic deformation is basically within the range of 0.0271 mm. Pair analysis of the dynamic deformation of blades with different elastic moduli can be obtained; after 10 ms, the dynamic deformation of the three blades is basically in the convergence state, but with the increase in the elastic modulus, its convergence value gradually decreases, but before 10 ms, with the increase in the elastic modulus, its fluctuation difference range gradually increases. In the experiment, the measurement time of 10 ms corresponds to the blade rotation azimuth angle of 90° near.

4.3. Analysis of Factors Influencing the Amount of Wind Turbine Blade Waving Deformation

4.3.1. Analysis of Wind Speed Variations

When the modulus of elasticity and rotational speed of the wind turbine blade are unchanged, it can be seen from Figure 17 that different wind speeds affect the dynamic waving deformation of the wind turbine blade, and the incoming wind speed has a large impact on the dynamic waving deformation of the blade. First, with the increase in wind speed, the dynamic waving deformation of the blade shows a trend of increasing, then decreasing, and then increasing, and the dynamic waving deformation peaks near the wind speed of 9 m/s. This phenomenon is caused by the fact that the dynamic waving deformation acting on the wind turbine blade has a significant effect on the wind speed. This phenomenon is due to the role of the axial thrust on the wind turbine wind wheel (the same blade and air surface density conditions; the axial thrust is only proportional to the square of the incoming wind speed). On the wind turbine blade, dynamic flailing deformation also has a greater impact, and in the vicinity of the wind speed of 9 m/s, when the impact is particularly intense, the performance of the dynamic flailing deformation is aggravated by thedynamic flailing deformation of the blades.
The wind speed has an important influence on the amount of dynamic waving deformation of wind turbine blades, and the change in wind speed also affects the deformation of the blades. As the wind speed increases, the pressure of the wind force acting on the blade also increases, which causes the bending deformation of the blade to increase. Higher wind speeds cause a rapid response in the amount of blade waving deformation. The blades need to adapt to the changes in wind speed and produce corresponding flailing deformations, which have an impact on the stability and efficiency of the blades. Therefore, when designing and operating wind turbines, appropriate control strategies and structural designs need to be considered to reduce the amount of blade waving deformation and improve the performance and safety of the wind turbine.

4.3.2. Analysis of Blade Modulus of Elasticity Change

When the incoming wind speed and the rotational speed of the wind turbine blade are certain, it can be obtained from Figure 18 that the effect of different elastic moduli on the deformation of the wind turbine blade can be obtained. With the increase in the elastic modulus of the wind turbine blade, the dynamic waving deformation of the wind turbine blade shows a trend of gradual reduction, and the degree of reduction is reduced. Among them, when the incoming wind speed is in the vicinity of 9 m/s and the rotational speed is between 450 r/min and 550 r/min, the maximum value of the dynamic waving deformation of the monitoring point of the wind turbine blade tip will appear. In the experiments, it was found that the maximum dynamic waving deformation of blade “45” was 33.45 mm. However, with an increase in the modulus of elasticity of the material, the maximum dynamic waving deformation of blade “90” and blade “d” was found to be 33.45 mm. However, with the increase in the modulus of elasticity of the material, the maximum dynamic waving deformation of blade “90” and blade “d” decreases by 4.75% and 11.93%, respectively. The maximum dynamic waving deformation of the blade “90” decreases to 31.86 mm after increasing the modulus of elasticity of the material, while the maximum dynamic waving deformation of blade “d” is 29.46 mm after increasing the modulus of elasticity of the material by 18.16%. In addition, the maximum dynamic flailing deformation of blade “d” decreases by 7.53% after the modulus of elasticity is increased by 67.3%.
Wind turbine blades have an intrinsic frequency, and when the external excitation frequency is close to or equal to the blade’s natural frequency, resonance occurs, making the blade flailing deformation increase. A higher modulus of elasticity allows the natural frequency of the blade to increase, reducing the likelihood of resonance and thus reducing the amount of blade flailing deformation. A higher modulus of elasticity provides greater resistance, resulting in less bending and torsional deformation of the blade under the same load. If the modulus of elasticity of the blade is insufficient, the wind action will lead to larger bending and torsional deformation of the blade, thus affecting the performance and stability of the blade. Combined with the dynamic deformation analysis, a higher modulus of elasticity can shorten the response time of the blade, enabling it to adapt to changes in the external wind more quickly. A higher modulus of elasticity reduces the degree of stress concentration in the blade under cyclic loading, thereby reducing the risk of fatigue damage. Conversely, if the modulus of elasticity is low, the blade is more susceptible to stress concentrations and fatigue failure under cyclic loading. This maintains the shape stability of the blade and increases the efficiency of the wind turbine.

4.4. Prediction of Dynamic Waving Deformation of Wind Turbine Blades

Based on the above experimental data, this paper used the second-order polynomial regression model to study the change rule of dynamic waving deformation, working conditions, and blade parameters on the dynamic waving deformation effect as shown in the following equation:
D = f x 1 , x 2 , , x n = α 0 + i = 0 n α i x i + i = 0 , j = 0 n α i j x i x j + i = 0 n α i i x i 2
where D is the dynamic waving deformation model, xi is the ith independent variable parameter, and αi is the model polynomial coefficient.
The polynomials of [26] were solved based on the measured and separated data of the dynamic waving deformation amount and the least squares method was used to solve the polynomials. Finally, the polynomial regression fitting expressions for the effect of each parameter on the dynamic waving deformation amount at the wind turbine blade monitoring points were obtained as follows:
D = f E , W , R = 230.39 1.22 E + 34.61 W + 0.39 R + 0.051 E W + 7.0 × 10 4 E R 5 × 10 3 W R + 8.9 × 10 3 E 2 1.78 W 2 4.0 × 10 4 R 2
where E is the modulus of elasticity of the wind turbine blade, GPa; W is the incoming wind speed, m/s; and R is the rotational speed of the wind turbine, r/min.
For this model, the fitting degree of the wind turbine blade dynamic waving deformation volume model reached 97.40%. The fitted polynomial regression equation meets the test principle and can be used for the prediction of dynamic waving deformation amount of wind turbine blades.

5. Conclusions

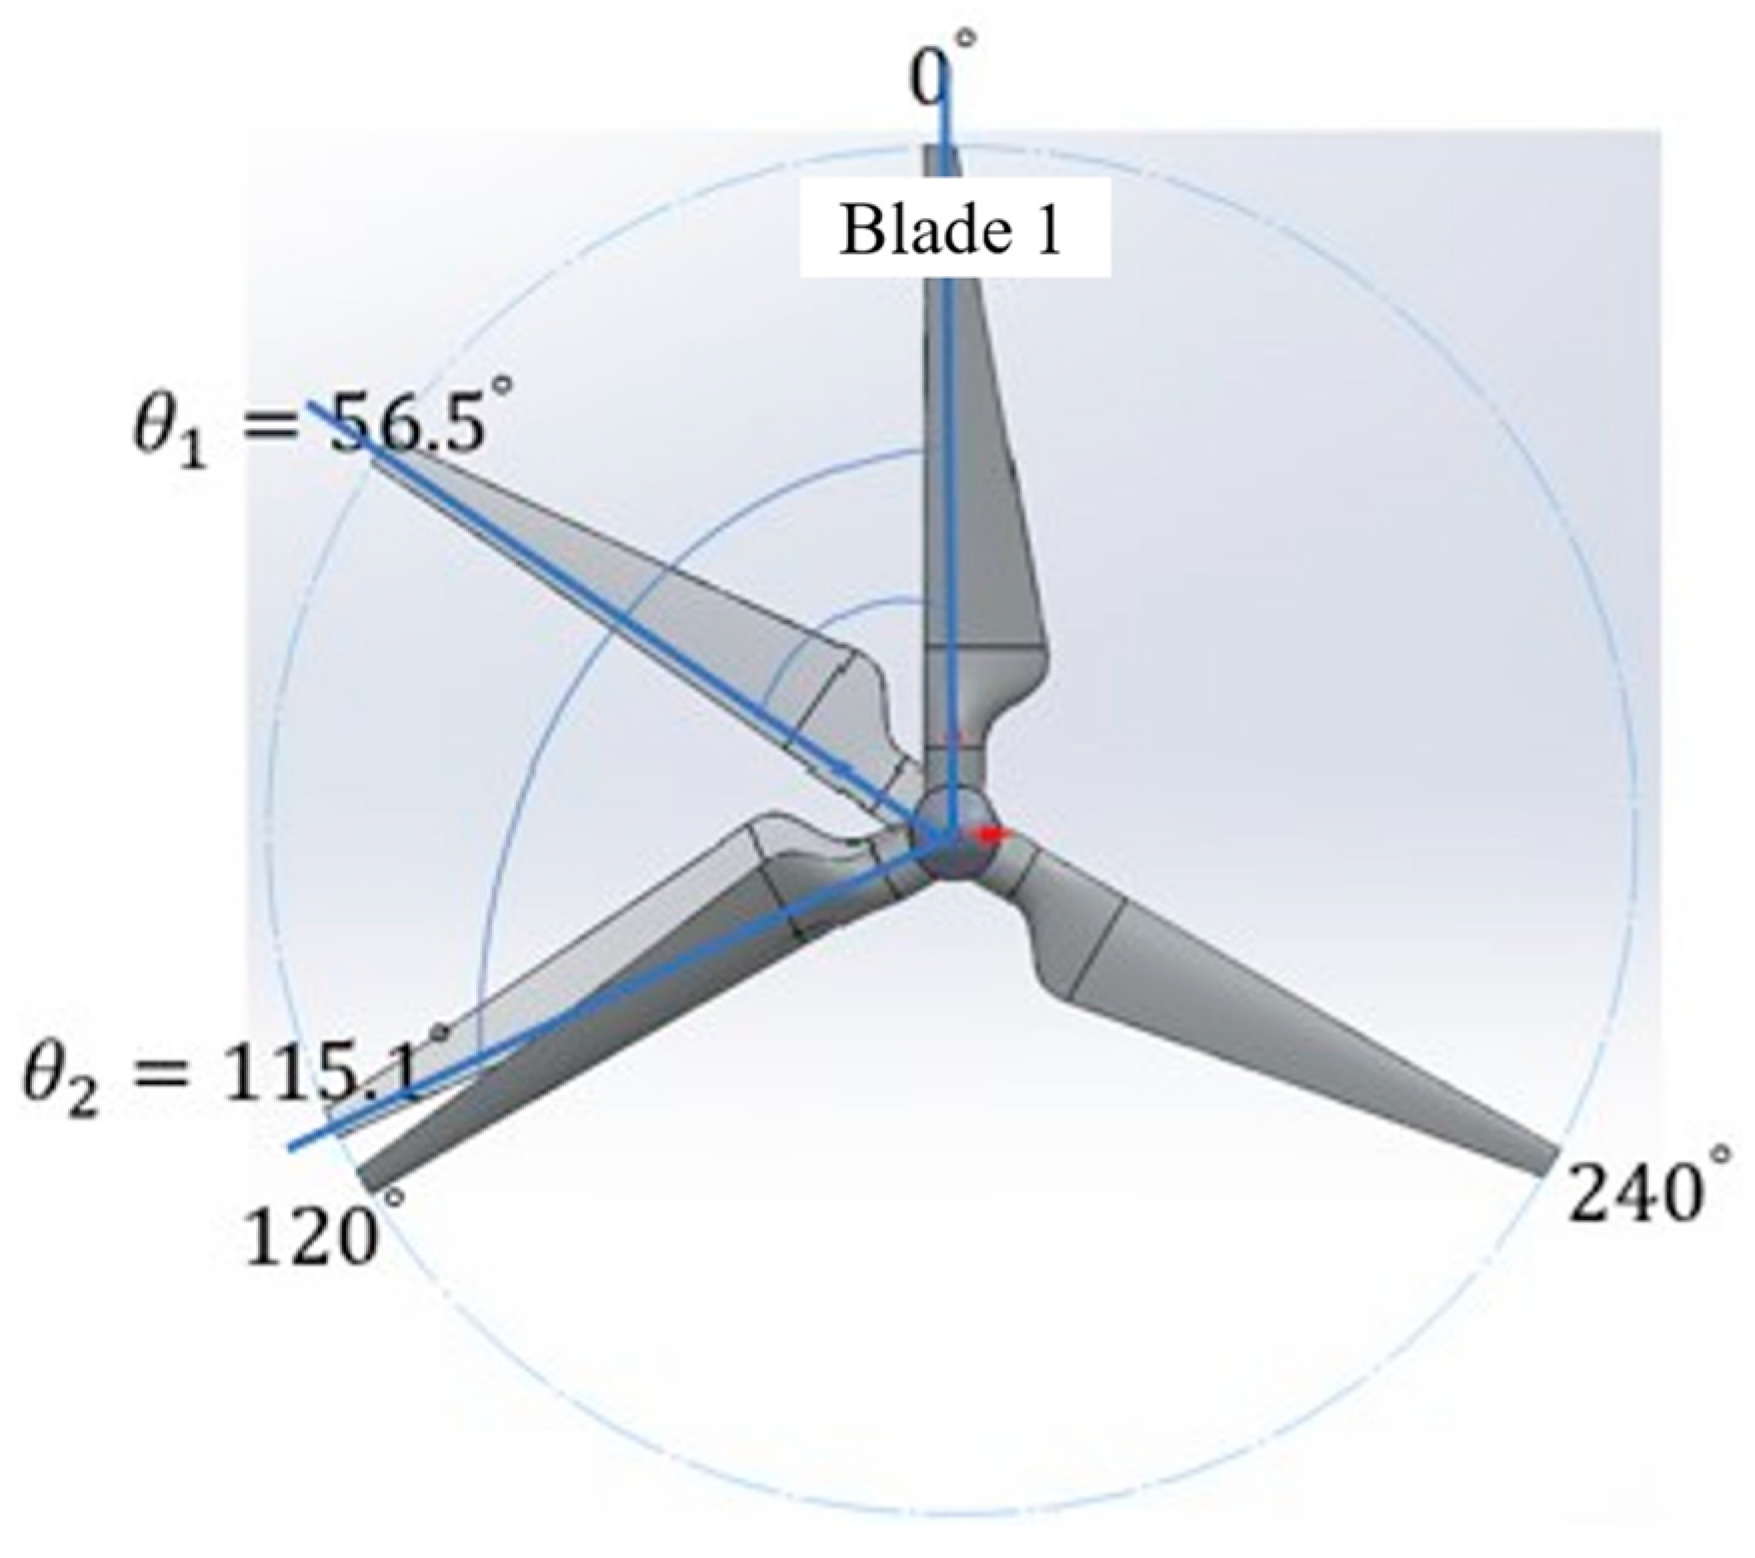
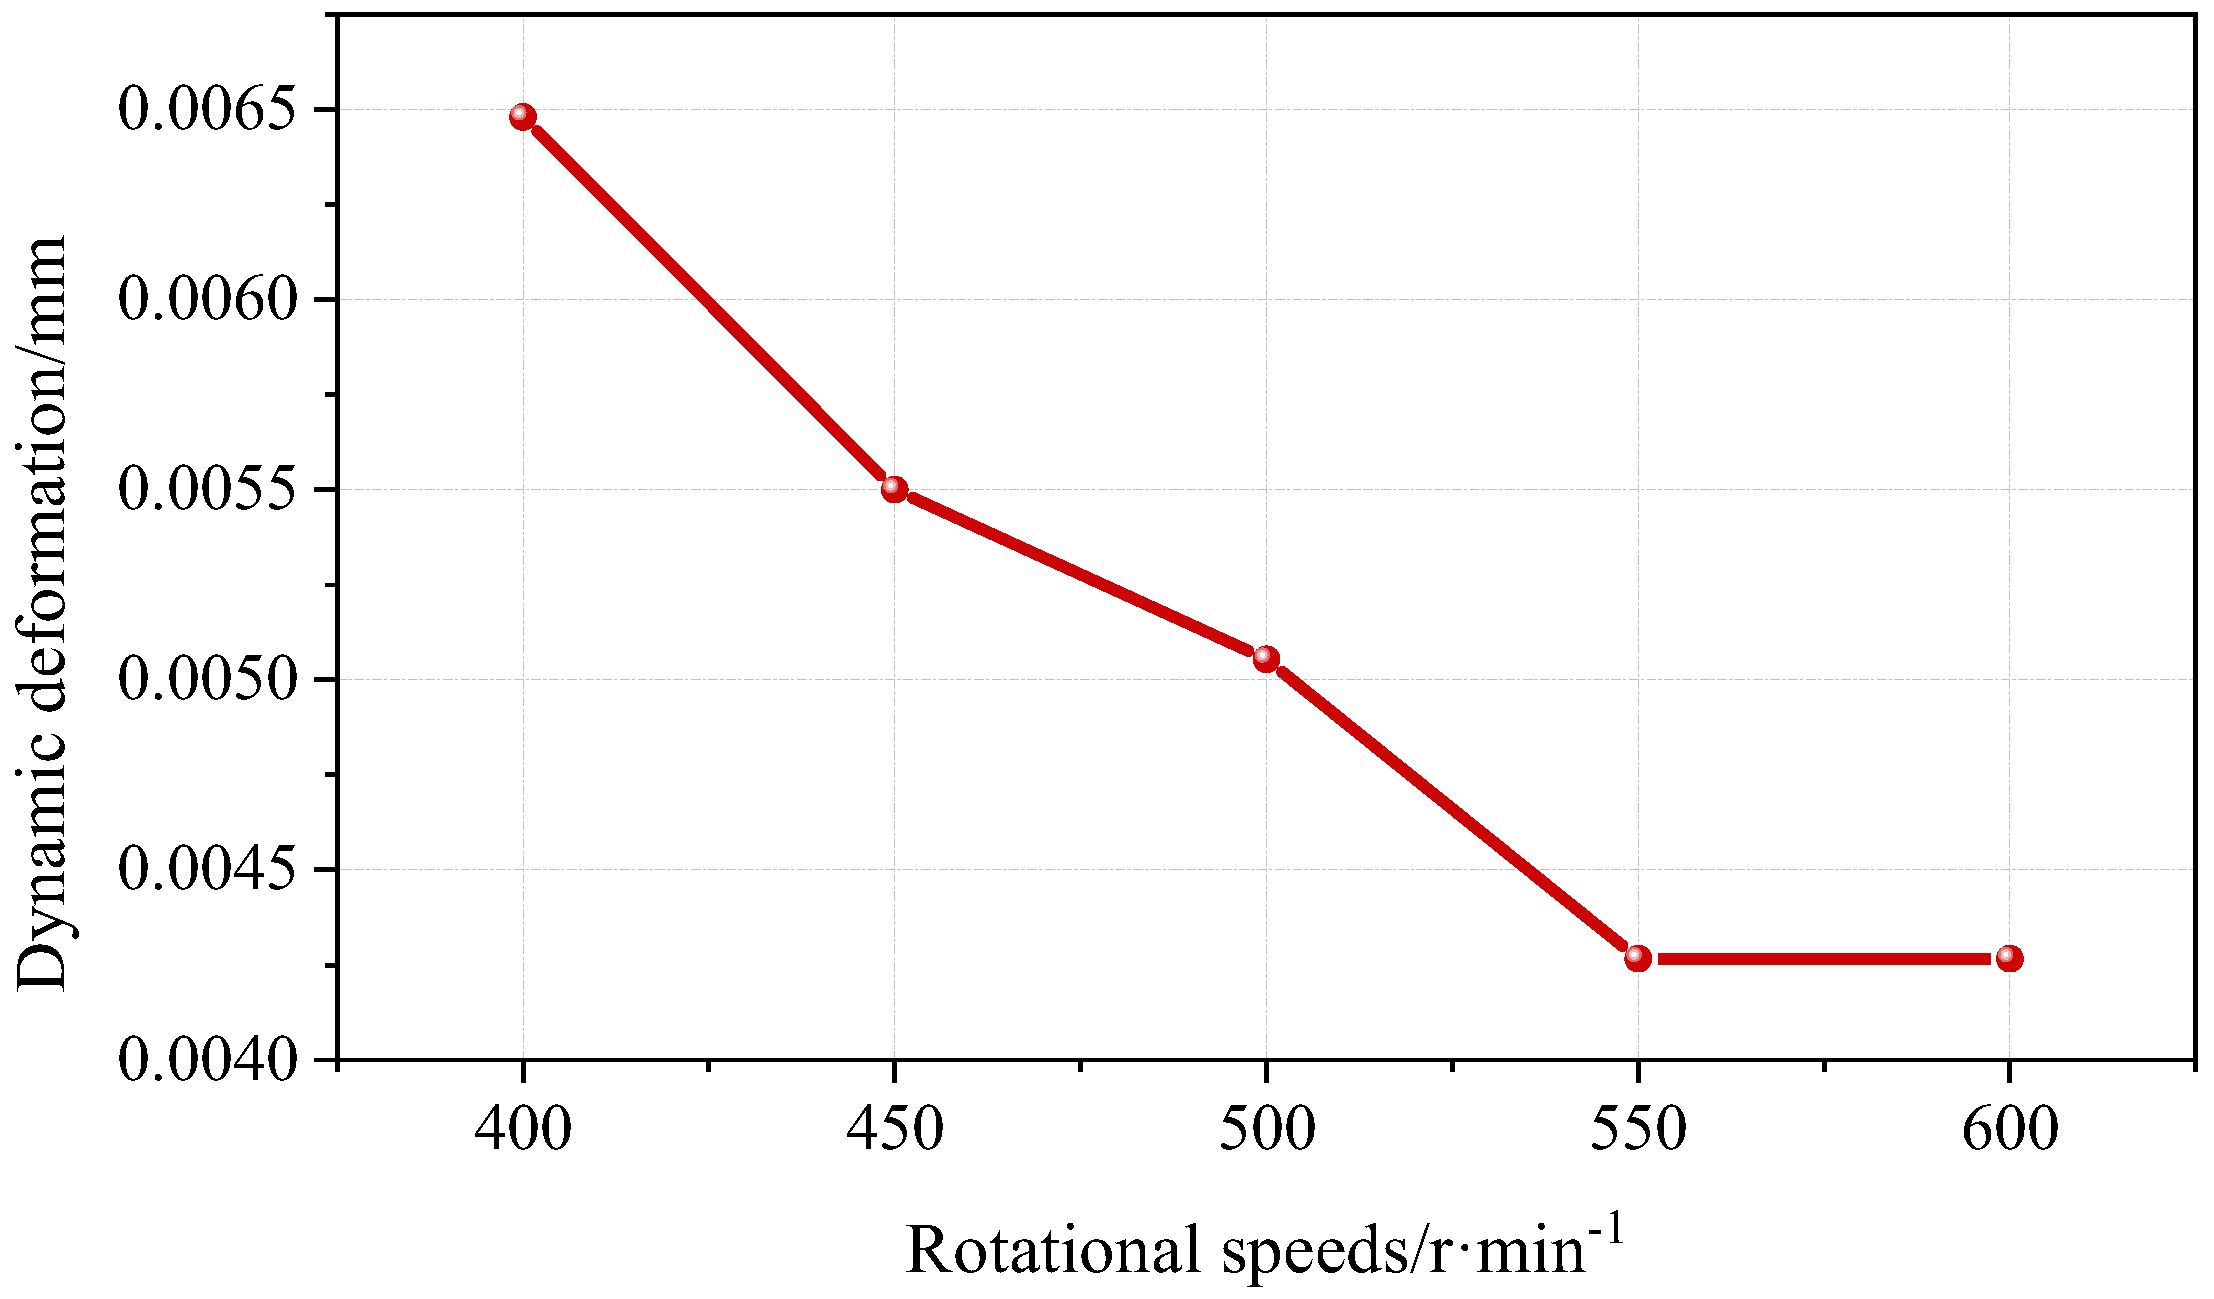
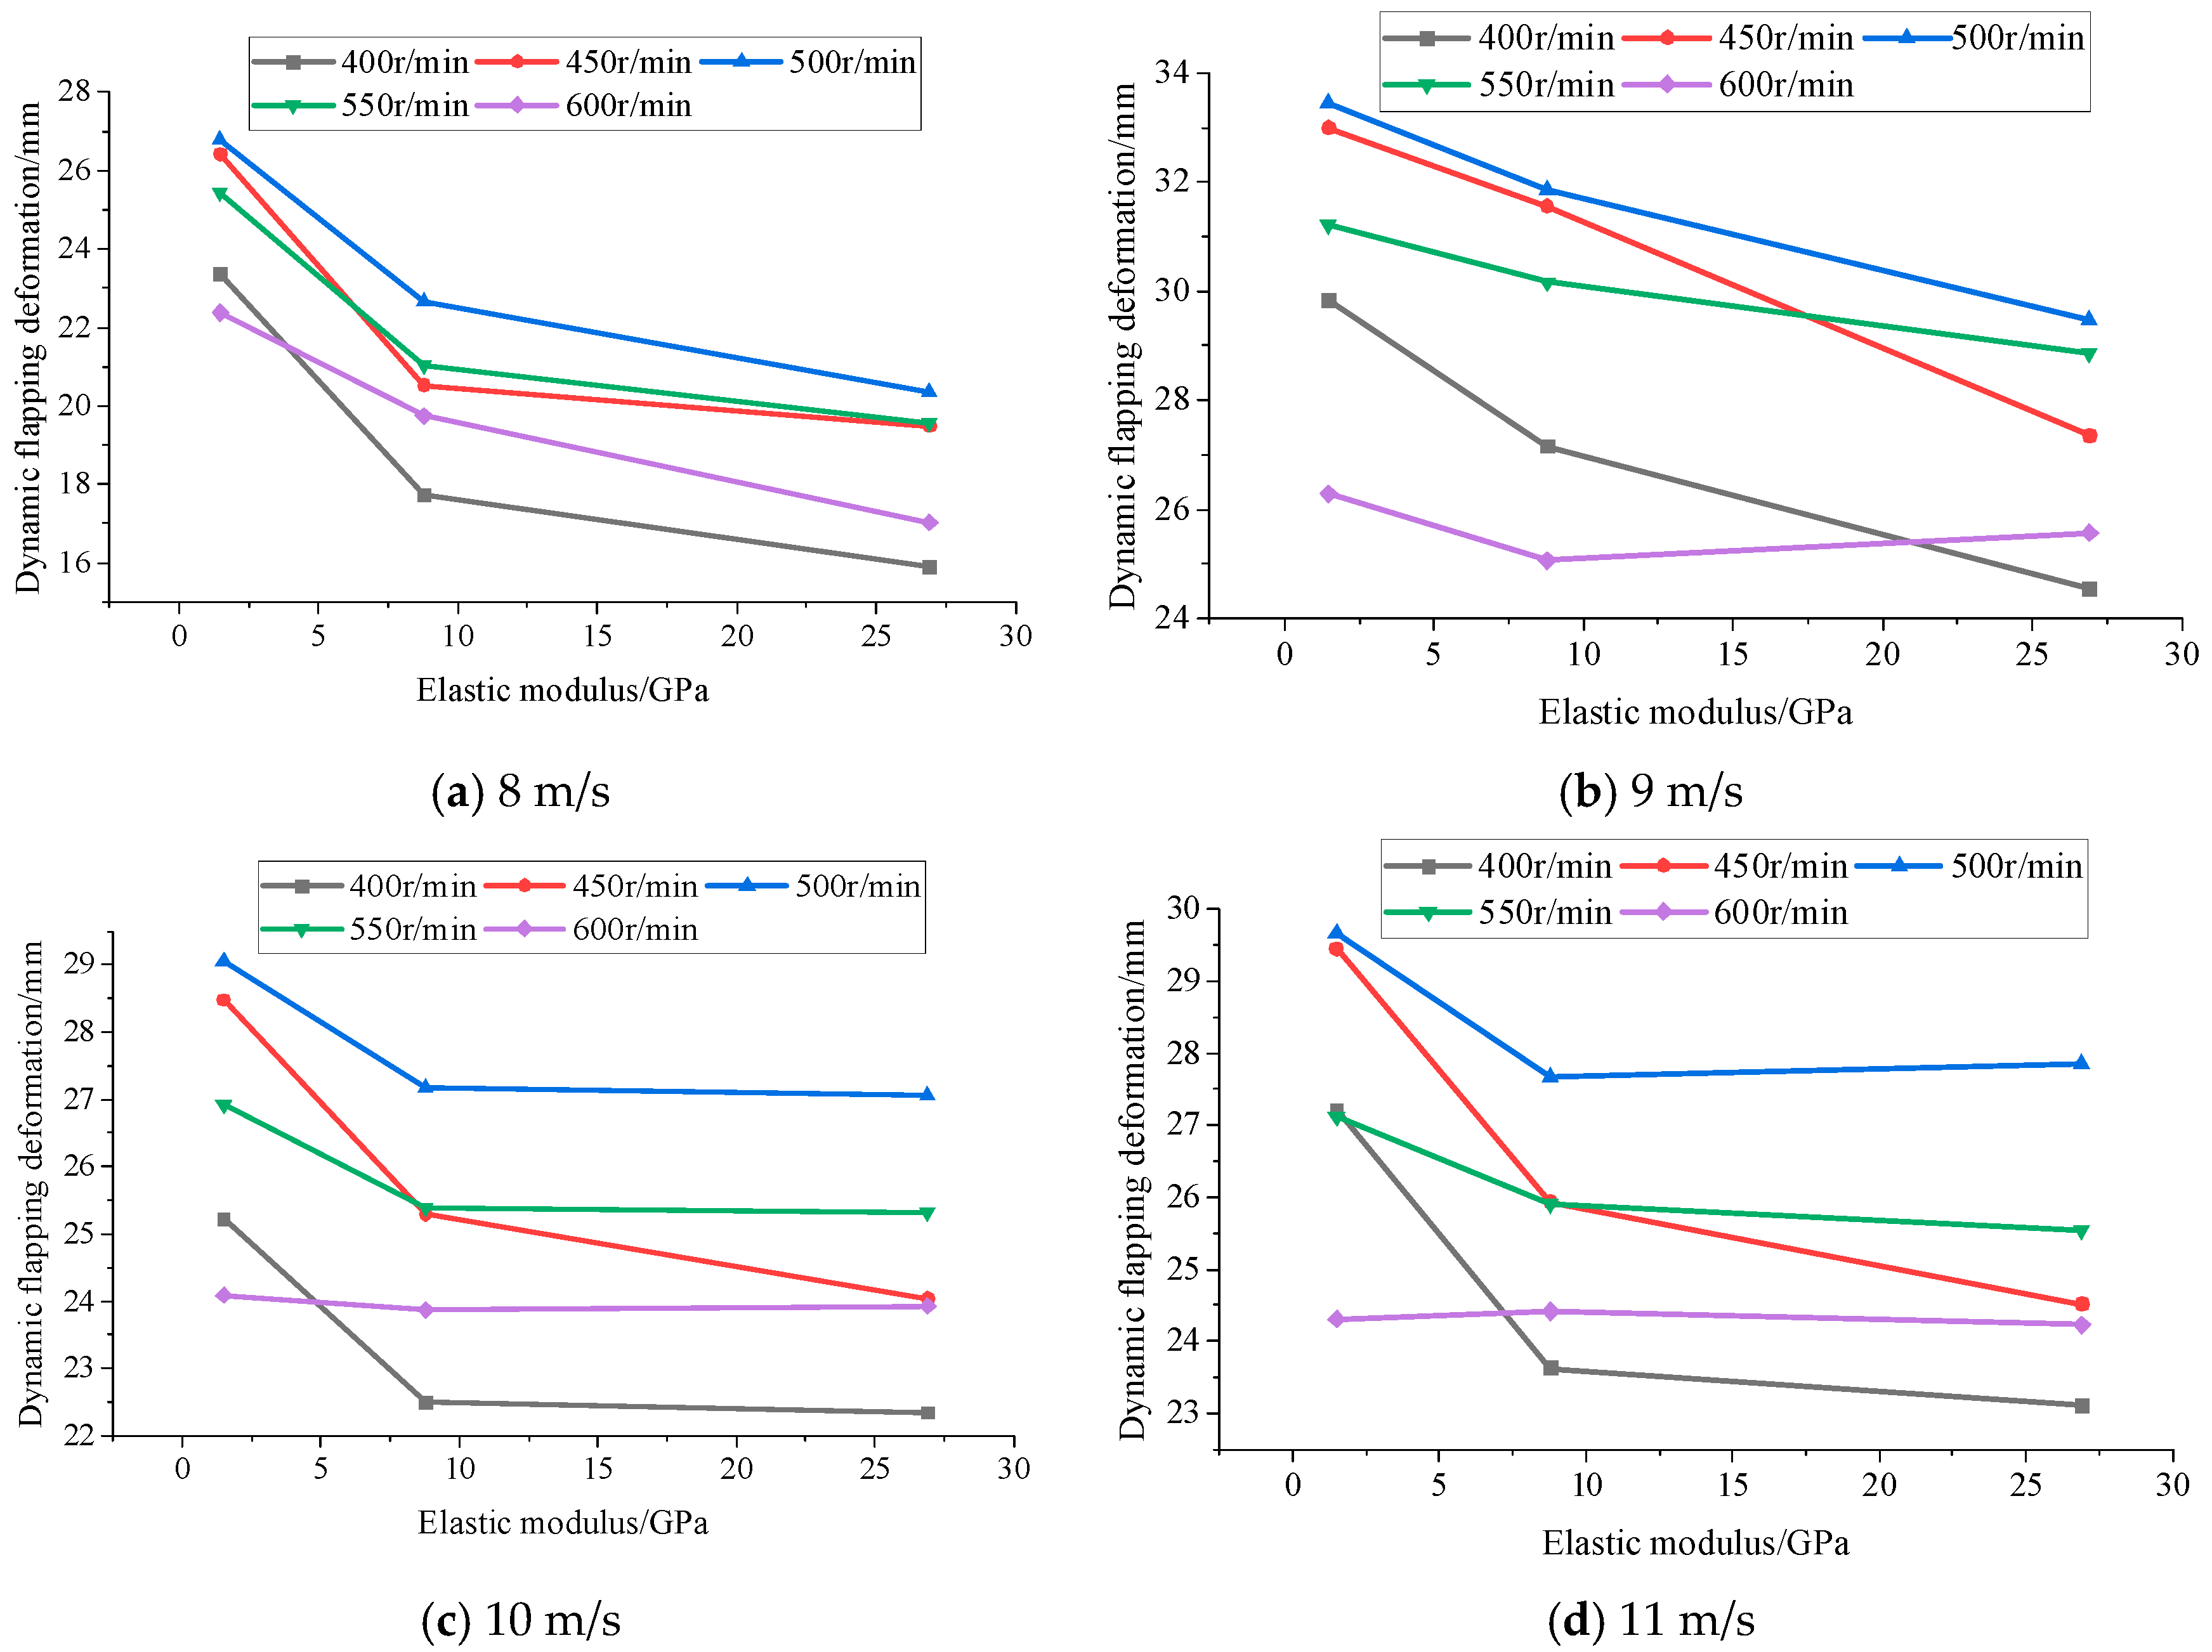
In this paper, an advanced three-dimensional digital image correlation (3D-DIC) algorithm is used to construct a dynamic deformation measurement system for horizontal-axis wind turbine blades in the opening section of the wind tunnel at the Key Laboratory of the Ministry of Education for Wind and Solar Energy Utilization Technology (Inner Mongolia University of Technology), and the applicability of the method for wind turbine blade deformation measurements is explored. Considering the calibration accuracy of the camera system on the blade during the blade measurement process and the possible failure of the relevant algorithm under large rotation conditions, the reliability of the method was verified through experiments, and a 3D-DIC-based dynamic measurement system for wind turbine blades was developed. Measurement of the full-field displacement distribution of wind turbine blades during the working process from the rotation angle θ1 = 56.5° to θ2 = 115° was realized, and the dynamic waving deformation of the wind turbine blades was obtained. The influence of different independent variable factors on the dynamic deformation amount and dynamic waving deformation amount of wind turbine blades with different elastic moduli was found. With the increase in rotational speed, the dynamic waving deformation of the wind turbine blades shows a tendency to increase and then decrease, and the maximum deformation occurs in the range of 450 r/min to 550 r/min. With the increase in wind speed, the dynamic waving deformation of the wind turbine blades shows a tendency to increase and then decrease, and the maximum deformation occurs in the wind speed range of 9 m/s and a rotational speed of 550 r/min. With the increase in elastic modulus of the wind turbine blade, the dynamic swinging deformation of the wind turbine blade shows a tendency to decrease gradually, and the degree of decrease is reduced. The mathematical formula for calculating the blade deformation was also obtained, which can predict the volume of the blade under different operating conditions.
Although the influence of the blade’s structural elastic modulus on the blade dynamic deformation volume obtained from the analysis before designing the experiment in this paper is small, its influence is large in the experiment; subsequent research needs to investigate the structural elastic modulus. In this experiment, the dynamic swing deformation of the wind turbine blade was measured and analyzed; however, the deformation of the wind turbine blade has torsion and oscillation deformation in addition to dynamic swing deformation. Although small and neglected in this experimental study, the deformation is still large in the actual deformation of large wind turbine blades, so it is also necessary to study larger wind turbine blades.

Author Contributions

Methodology, W.G.; Validation, S.S.; Investigation, D.N.; Writing—original draft, J.J.; Writing—review & editing, L.Z. All authors have read and agreed to the published version of the manuscript.

Funding

This research was funded by the National Natural Science Foundation of China (52066013), the Inner Mongolia Autonomous Region Colleges and Universities directly under the direct subsidiary of the Basic Research Operating Expenses Project (JY20230096), and the Basic Research Operating Expenses Program for Colleges and Universities directly under the Autonomous Region (ZTY2024014).

Data Availability Statement

The original contributions presented in the study are included in the article, further inquiries can be directed to the corresponding author.

Conflicts of Interest

Author Wei Gao was employed by the company Huaneng Urad Middle Banner New Energy Generation Co., Ltd. The remaining authors declare that the research was conducted in the absence of any commercial or financial relationships that could be construed as a potential conflict of interest.

References

  1. He, D. Wind Engineering and Industrial Aerodynamics; National Defense Industry Press: Beijing, China, 2006. [Google Scholar]
  2. Akhter, M.Z.; Ali, A.R.; Jawahar, H.K.; Omar, F.K.; Elnajjar, E. Performance enhancement of small-scale wind turbine featuring morphing blades. Energy 2023, 278, 127772. [Google Scholar] [CrossRef]
  3. Yu, H.; Ma, J.; Lv, W.; Su, H.; Zhang, P. Calculation of wind turbine blade stiffness based on the optimization of equivalent stiffness method. China Meas. Test 2024, 50, 47–52. [Google Scholar]
  4. Leng, J.; Gao, Z.; Wu, M.C.; Guo, T.; Li, Y. A fluid-structure interaction model for large wind turbines based on flexible multibody dynamics and actuator line method. J. Fluids Struct. 2023, 118, 103857. [Google Scholar] [CrossRef]
  5. Macphee, D.W.; Beyene, A. Experimental and fluid structure interaction analysis of a morphing wind turbine rotor. Energy 2015, 90, 1055–1065. [Google Scholar] [CrossRef]
  6. Dose, B.; Rahimi, H.; Herráez, I.; Stoevesandt, B.; Peinke, J. Fluid-structure coupled computations of the NREL 5 MW wind turbine by means of CFD. Renew. Energy 2018, 129, 591–605. [Google Scholar] [CrossRef]
  7. Zhu, X.; Chen, J.; Shen, X.; Du, Z. Impact of blade flexibility on wind turbine loads and pitch settings. J. Sol. Energy Eng. 2018, 141, 041002. [Google Scholar] [CrossRef]
  8. Deng, Z.; Xiao, Q.; Huang, Y.; Yang, L.; Liu, Y. A general FSI framework for an effective stress analysis on composite wind turbine blades. Ocean Eng. 2024, 291, 116412. [Google Scholar] [CrossRef]
  9. Castelli, M.R.; Monte, A.D.; Quaresimin, M.; Benini, E. Numerical evaluation of aerodynamic and inertial contributions to Darrieus wind turbine blade deformation. Renew. Energy 2013, 51, 101–112. [Google Scholar] [CrossRef]
  10. Zhang, Z.M.; Wu, S.Q.; Zhao, D.P.; Wei, W.W. Analysis of blade deformation of 1.5 MW wind turbine. Energy Environ. 2012, 55–57. [Google Scholar] [CrossRef]
  11. Lee, K.; Aihara, A.; Puntsagdash, G.; Kawaguchi, T.; Sakamoto, H.; Okuma, M. Feasibility study on a strain-based deflection monitoring system for wind turbine blades. Mech. Syst. Signal Process. 2017, 82, 117–129. [Google Scholar] [CrossRef]
  12. Luo, W.; Li, J.; Ma, X.; Wei, W. A novel static deformation measurement and visualization method for wind turbine blades using home-made LiDAR and processing program. Opt. Lasers Eng. 2020, 134, 106206. [Google Scholar] [CrossRef]
  13. Zhang, Z.; Kang, Y.; Wang, H.; Qin, Q.-H.; Qiu, Y.; Li, X.-Q. A novel coarse-fine search scheme for digital image correlation method. Measurement 2006, 39, 710–718. [Google Scholar] [CrossRef]
  14. Carr, J.; Baqersad, J.; Niezrecki, C.; Avitabile, P.; Slattery, M. Dynamic Stress–Strain on Turbine Blade Using Digital Image Correlation Techniques Part 1: Static Load and Calibration; Springer: New York, NY, USA, 2012. [Google Scholar]
  15. Carr, J.; Baqersad, J.; Niezrecki, C.; Avitabile, P.; Slattery, M. Full-field dynamic strain on wind turbine blade using digital image correlation techniques and limited sets of measured data from photogrammetric targets. Exp. Tech. 2016, 40, 819–831. [Google Scholar] [CrossRef]
  16. Chen, Z.X.; Peng, X.L.; Huang, S.F.; Wang, W.X. Application of Digital Image Correlation Method in the Study of Deformation of Notched Carbon Steel Plates and Finite Element Simulation. Strength Mater. 2023, 55, 416–425. [Google Scholar] [CrossRef]
  17. Yu, L.; Pan, B. In-plane displacement and strain measurements using a camera phone and digital image correlation. Opt. Eng. 2014, 53, 054107. [Google Scholar] [CrossRef]
  18. Wu, R.; Chen, Y.; Pan, Y.; Wang, Q.; Zhang, D. Determination of three-dimensional movement for rotary blades using digital image correlation. Opt. Lasers Eng. 2015, 65, 38–45. [Google Scholar] [CrossRef]
  19. Baqersad, J.; Poozesh, P.; Niezrecki, C.; Avitabile, P. Extracting Full-Field Dynamic Strain Response of a Rotating Wind Turbine Using Photogrammetry; Univ. of Massachusetts Lowell (United States): Lowell, MA, USA; The Pennsylvania State Univ. (United States): University Park, PA, USA, 2015; Volume 9437, pp. 440–449. [Google Scholar]
  20. Xie, R.L.; Xu, W.; Chen, X.; Pan, B. Full-field vibration measurement of turbine blade based on single high-speed camera 3D-DIC. J. Vib. Meas. Diagn. 2024, 44, 18–23+194. [Google Scholar] [CrossRef]
  21. Wu, R.; Zhang, D.; Yu, Q.; Jiang, Y.; Arola, D. Health monitoring of wind turbine blades in operation using three-dimensional digital image correlation. Mech. Syst. Signal Process. 2019, 130, 470–483. [Google Scholar] [CrossRef]
  22. Vibration and Acoustics. Researchers at Virginia Tech Target Vibration and Acoustics (Nonlinear aeroelastic characterization of wind turbine blades). Energy Weekly News, 2016.
  23. Niu, J.J.; Zhang, L.R.; Jiao, X.W.; Wang, J.W. Study of wind turbine blade winding flow field based on blade deformation yaw. Acta Energiae Solaris Sin. 2022, 43, 301–305. [Google Scholar] [CrossRef]
  24. San, B.H.; Huo, X.Y.; Liu, Y. Application of Zhang Zhengyou calibration method in DIC displacement measurement. Res. Explor. Lab. 2016, 35, 8–12+21. [Google Scholar]
  25. Tang, G.; Liu, Z.; Xiong, J. Distinctive image features from illumination and scale invariant keypoints. Multimed. Tools Appl. 2019, 78, 23415–23442. [Google Scholar] [CrossRef]
  26. Hu, J.; Su, J.H.; Du, Y.; Wan, H.N.; Shi, Y. Parameter identification of PEMFC stack model based on the least squares method. Acta Energiae Solaris Sin. 2021, 42, 4. [Google Scholar]
Figure 1. Schematic diagram of blade coordinate system and blade deformation.
Energies 17 06330 g001
Figure 2. 3D-DIC measurement principles.
Energies 17 06330 g002
Figure 3. Schematic diagram of sample.
Energies 17 06330 g003
Figure 4. Sample elastic modulus experiment.
Energies 17 06330 g004
Figure 5. Construction of wind turbine blade dynamic deformation measurement and calibration system.
Energies 17 06330 g005
Figure 6. Wind turbine blade deformation detection position.
Energies 17 06330 g006
Figure 7. Distribution map of monitoring points.
Energies 17 06330 g007
Figure 8. Left and right camera correlation function values.
Energies 17 06330 g008
Figure 9. Full field displacement of blade “90” under the condition of wind speed of 9 m/s and rotational speed of 450 r/min.
Energies 17 06330 g009
Figure 10. Temporal map of three-dimensional coordinates of monitoring points.
Energies 17 06330 g010
Figure 11. Dynamic deformation of blades under different rotation angles.
Energies 17 06330 g011
Figure 12. Dynamic deformation of blades at different rotational speeds.
Energies 17 06330 g012
Figure 13. Dynamic deformation of blades at 10 ms under different rotational speeds.
Energies 17 06330 g013
Figure 14. Dynamic deformation of blades under different wind speeds.
Energies 17 06330 g014
Figure 15. Dynamic deformation of blades at 10 ms under different wind speeds.
Energies 17 06330 g015
Figure 16. Dynamic deformation of blades under different elastic modulus.
Energies 17 06330 g016
Figure 17. The effect of different wind speeds on the dynamic flapping deformation of wind turbine blades.
Energies 17 06330 g017
Figure 18. Effect of different elastic modules on dynamic flapping deformation of wind turbine blades.
Energies 17 06330 g018
Table 1. Material and specifications of blades.
MaterialsSpecifications
Fiber clothEWP100 Fiberglass
ViscoseGeneral Purpose 196 Unsaturated Resin
Table 2. Sample preparation and sampling standards.
Specimen PositionSample Product DirectionDirection of Force (Physics)
LNLengthsVertical laminated surface
WNWidths
LPLengthsParallel laminated surface
WPWidths
Table 3. Average value of material bending elastic modulus.
Specimen Numberdfg906045
Material modulus of elasticity value/GPa26.9123.817.328.793.931.49
Table 4. Calibration results of internal and external parameters of dual camera system.
ParametersNotationLeft-Hand Side (of a Camera)Right-Hand Side (of a Camera)
Internal parameterEquivalent focal length of the camera F 1434.451432.02
Coordinates of the main point c x 554.99556.31
c y 372.66377.12
Distortion k −0.05−0.12
External parameterThe Euler angle form represents the rotation matrix of the right-hand side (of a camera) with respect to the left-hand side (of a camera)/rad α 0−7.75
β 017.35
λ 0−2.37
Translation vector of the right-hand side (of a camera) with respect to the left-hand side (of a camera)/mm t x 0−540.05
t y 09.61
t z 011.03
Table 5. Experimental error verification.
Random Point 1Random Point 2Random Point 3
Dynamic deformation/mm0.0160.0180.010
0.0280.0010.019
0.0130.0070.015
Average error/mm0.0160.0100.014
Table 6. Blade “d” flapping deformation.
Rotational Speeds (r/min)
Wind Speed (m/s)400450500550600
815.8919.4820.3619.5517.03
924.5527.3529.4628.8725.57
1022.3524.0427.0725.3323.93
1123.1224.5227.8625.5524.23
Table 7. Blade “90” flapping deformation.
Rotational Speeds (r/min)
Wind Speed (m/s)400450500550600
817.7320.5322.6421.0419.74
927.1631.5631.8630.1629.76
1022.525.2927.1825.3823.87
1123.6325.9427.6625.9224.42
Table 8. Blade “45” flapping deformation.
Rotational Speeds (r/min)
Wind Speed (m/s)400450500550600
823.3726.4226.7825.4322.38
929.8332.9933.4531.2226.28
1025.2228.4829.0526.9222.09
1127.2129.4529.6727.1224.31
Disclaimer/Publisher’s Note: The statements, opinions and data contained in all publications are solely those of the individual author(s) and contributor(s) and not of MDPI and/or the editor(s). MDPI and/or the editor(s) disclaim responsibility for any injury to people or property resulting from any ideas, methods, instructions or products referred to in the content.

