Robustness-Based Evaluation of GHG Emissions and Energy Use at Neighborhood Level †
Abstract
1. Introduction
1.1. Background
1.2. Main Contribution and Novelty
- How can we gain a comprehensive understanding of energy use and GHG emissions across various life cycle stages to guide neighborhood performance assessment and design choices?
- What are the advantages and challenges of integrating robustness assessments and MCDM in evaluating neighborhood performance?
- Flexible methodological approach. The methodology adopted in this study allows the evaluation of variable performance indicators under uncertainty scenarios, providing insights into how factors like material production, energy generation, and consumption impact neighborhood performance, including aspects like energy use and GHG emissions. By emphasizing these uncertainties, the proposed approach highlights the importance of selecting neighborhood designs that perform effectively not only under current conditions but also in future scenarios.
- Adaptive neighborhood LCA model. This research expands the assessment of GHG emissions and energy use beyond the operational stage to encompass multiple life-cycle stages, including building materials’ production and replacement. While aspects like mobility are beyond the article’s scope, this study addresses key components within the neighborhood, such as buildings and on-site energy generation systems, offering customizable results for policy alignment and specific LCA needs.
- Detailed neighborhood energy model. The developed model allows a detailed analysis of the overall energy use on an hourly basis, providing insights into daily energy dynamics. The model also evaluates the contribution of renewable energy sources and supports detailed energy simulations at the neighborhood level, accounting for factors like occupant behavior and future climate.
- Practical demonstration of robustness assessment integration into MCDM. Through a comprehensive case-study approach, the research demonstrates the importance of integrating robustness into the decision-making process, discussing the path toward selecting the most high-performing and robust design in the assessed neighborhood. Furthermore, this approach sets an example for other neighborhoods with zero-emission goals in the early planning stage, where multiple performance criteria need to be assessed under different scenarios.
2. Materials and Methods
2.1. Overall Approach
2.2. Case Study: Flytårnet Neighborhood
2.3. Analyzed Designs
2.4. Analyzed Scenarios
2.5. Analyzed Performance Indicators and Targets
2.6. Energy Modeling of Flytårnet Neighborhood
2.7. LCA of Flytårnet Neighborhood
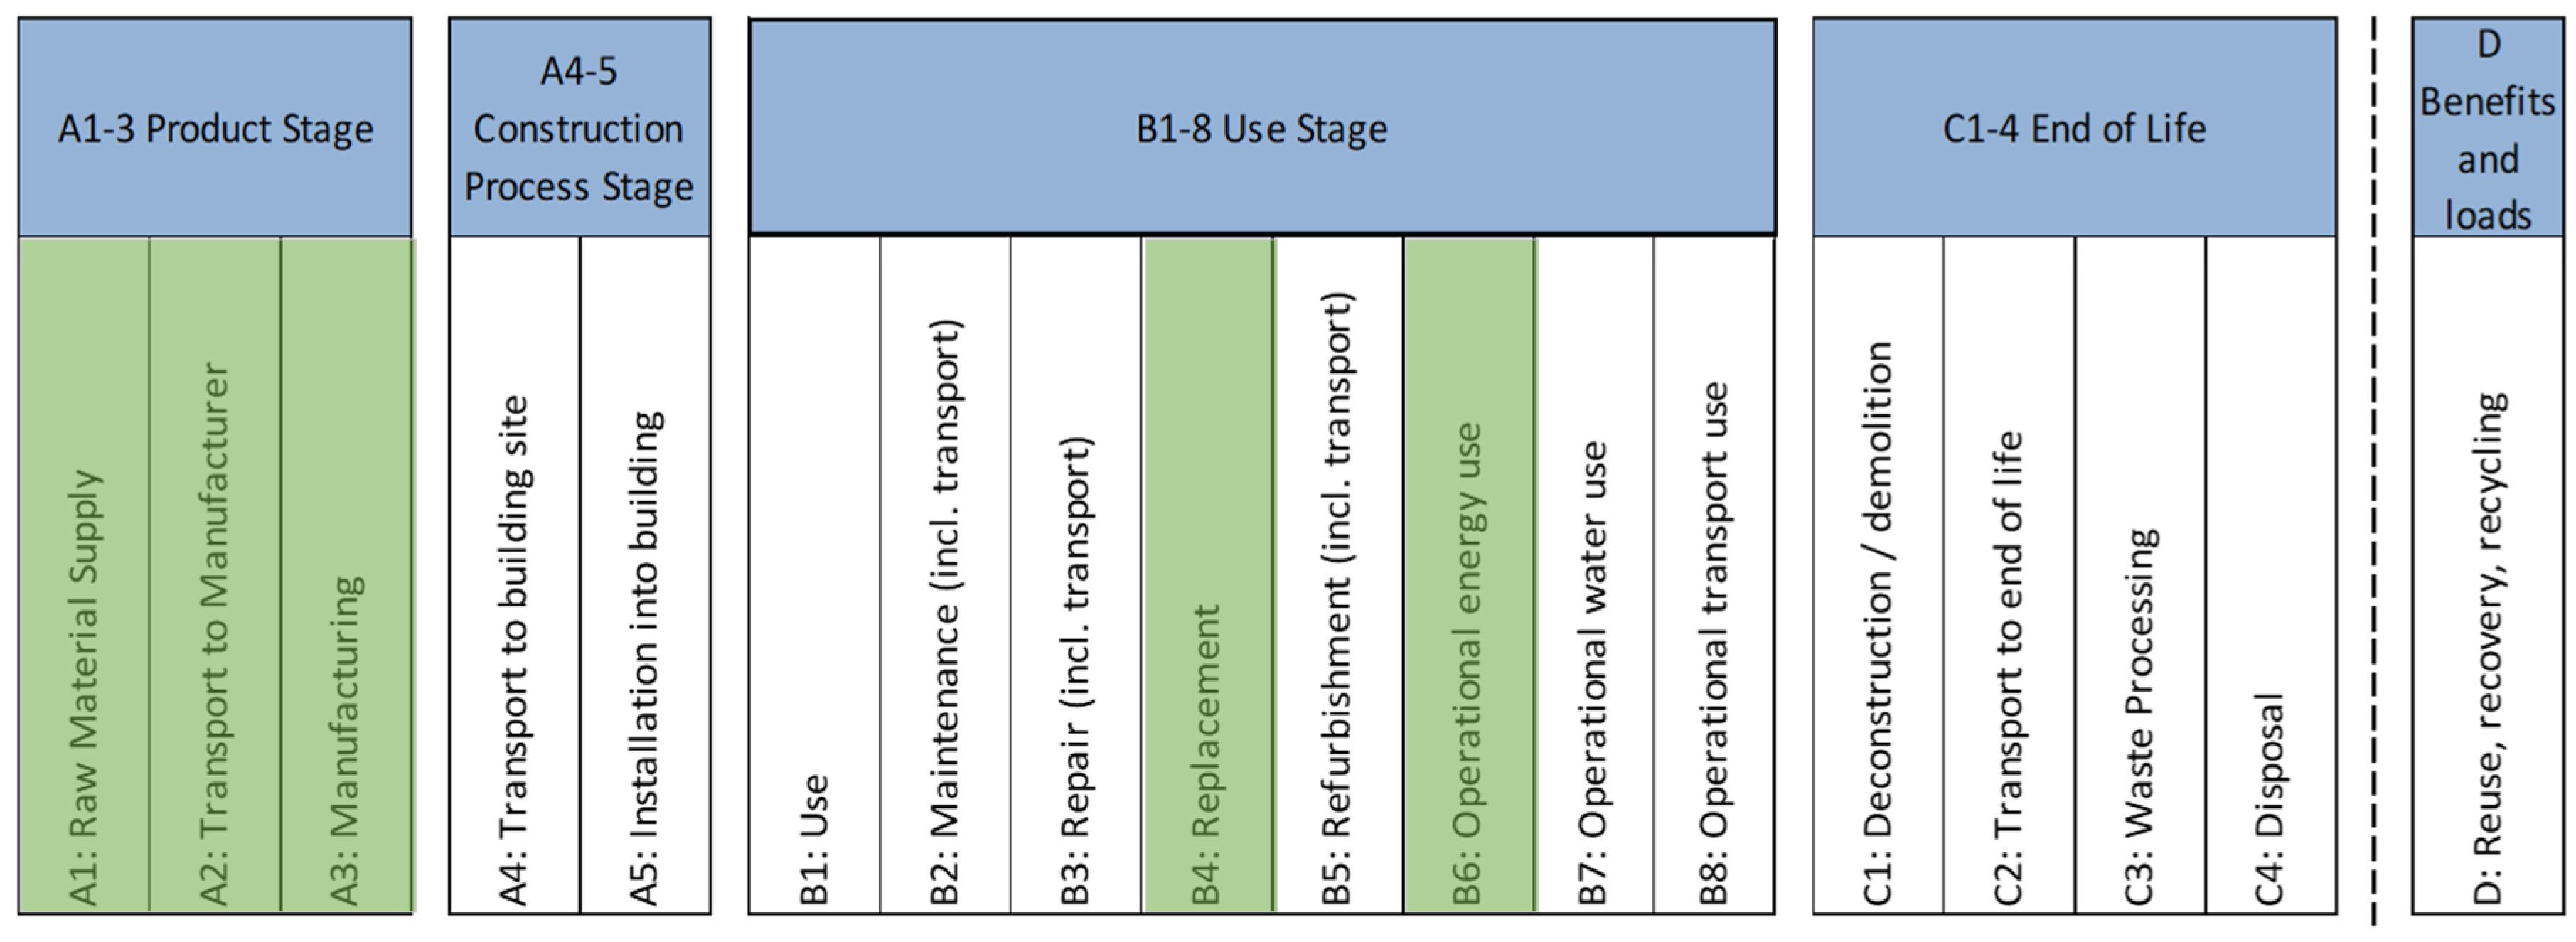
- ZEN O: Addresses emissions solely related to operational energy (“O”), specifically module B6.
- ZEN OM: Encompasses both operational energy (“O”) emissions and embodied emissions from materials (“M”) and their replacement, covering modules A1–A3 and B4, B6.
- ZEN COM: Similar to ZEN OM, this level includes also emissions from the construction (“C”) stage, incorporating modules A4–A5.
- ZEN COME: Expands upon ZEN COM by also considering emissions from the end-of-life (“E”) stage, covering modules C1 to C4.
2.7.1. Product and Replacement Stages (A1–A3, B4)
2.7.2. Operational Energy Use (B6)
3. Results
3.1. Performance Assessment of Designs and Scenarios Using KPIs
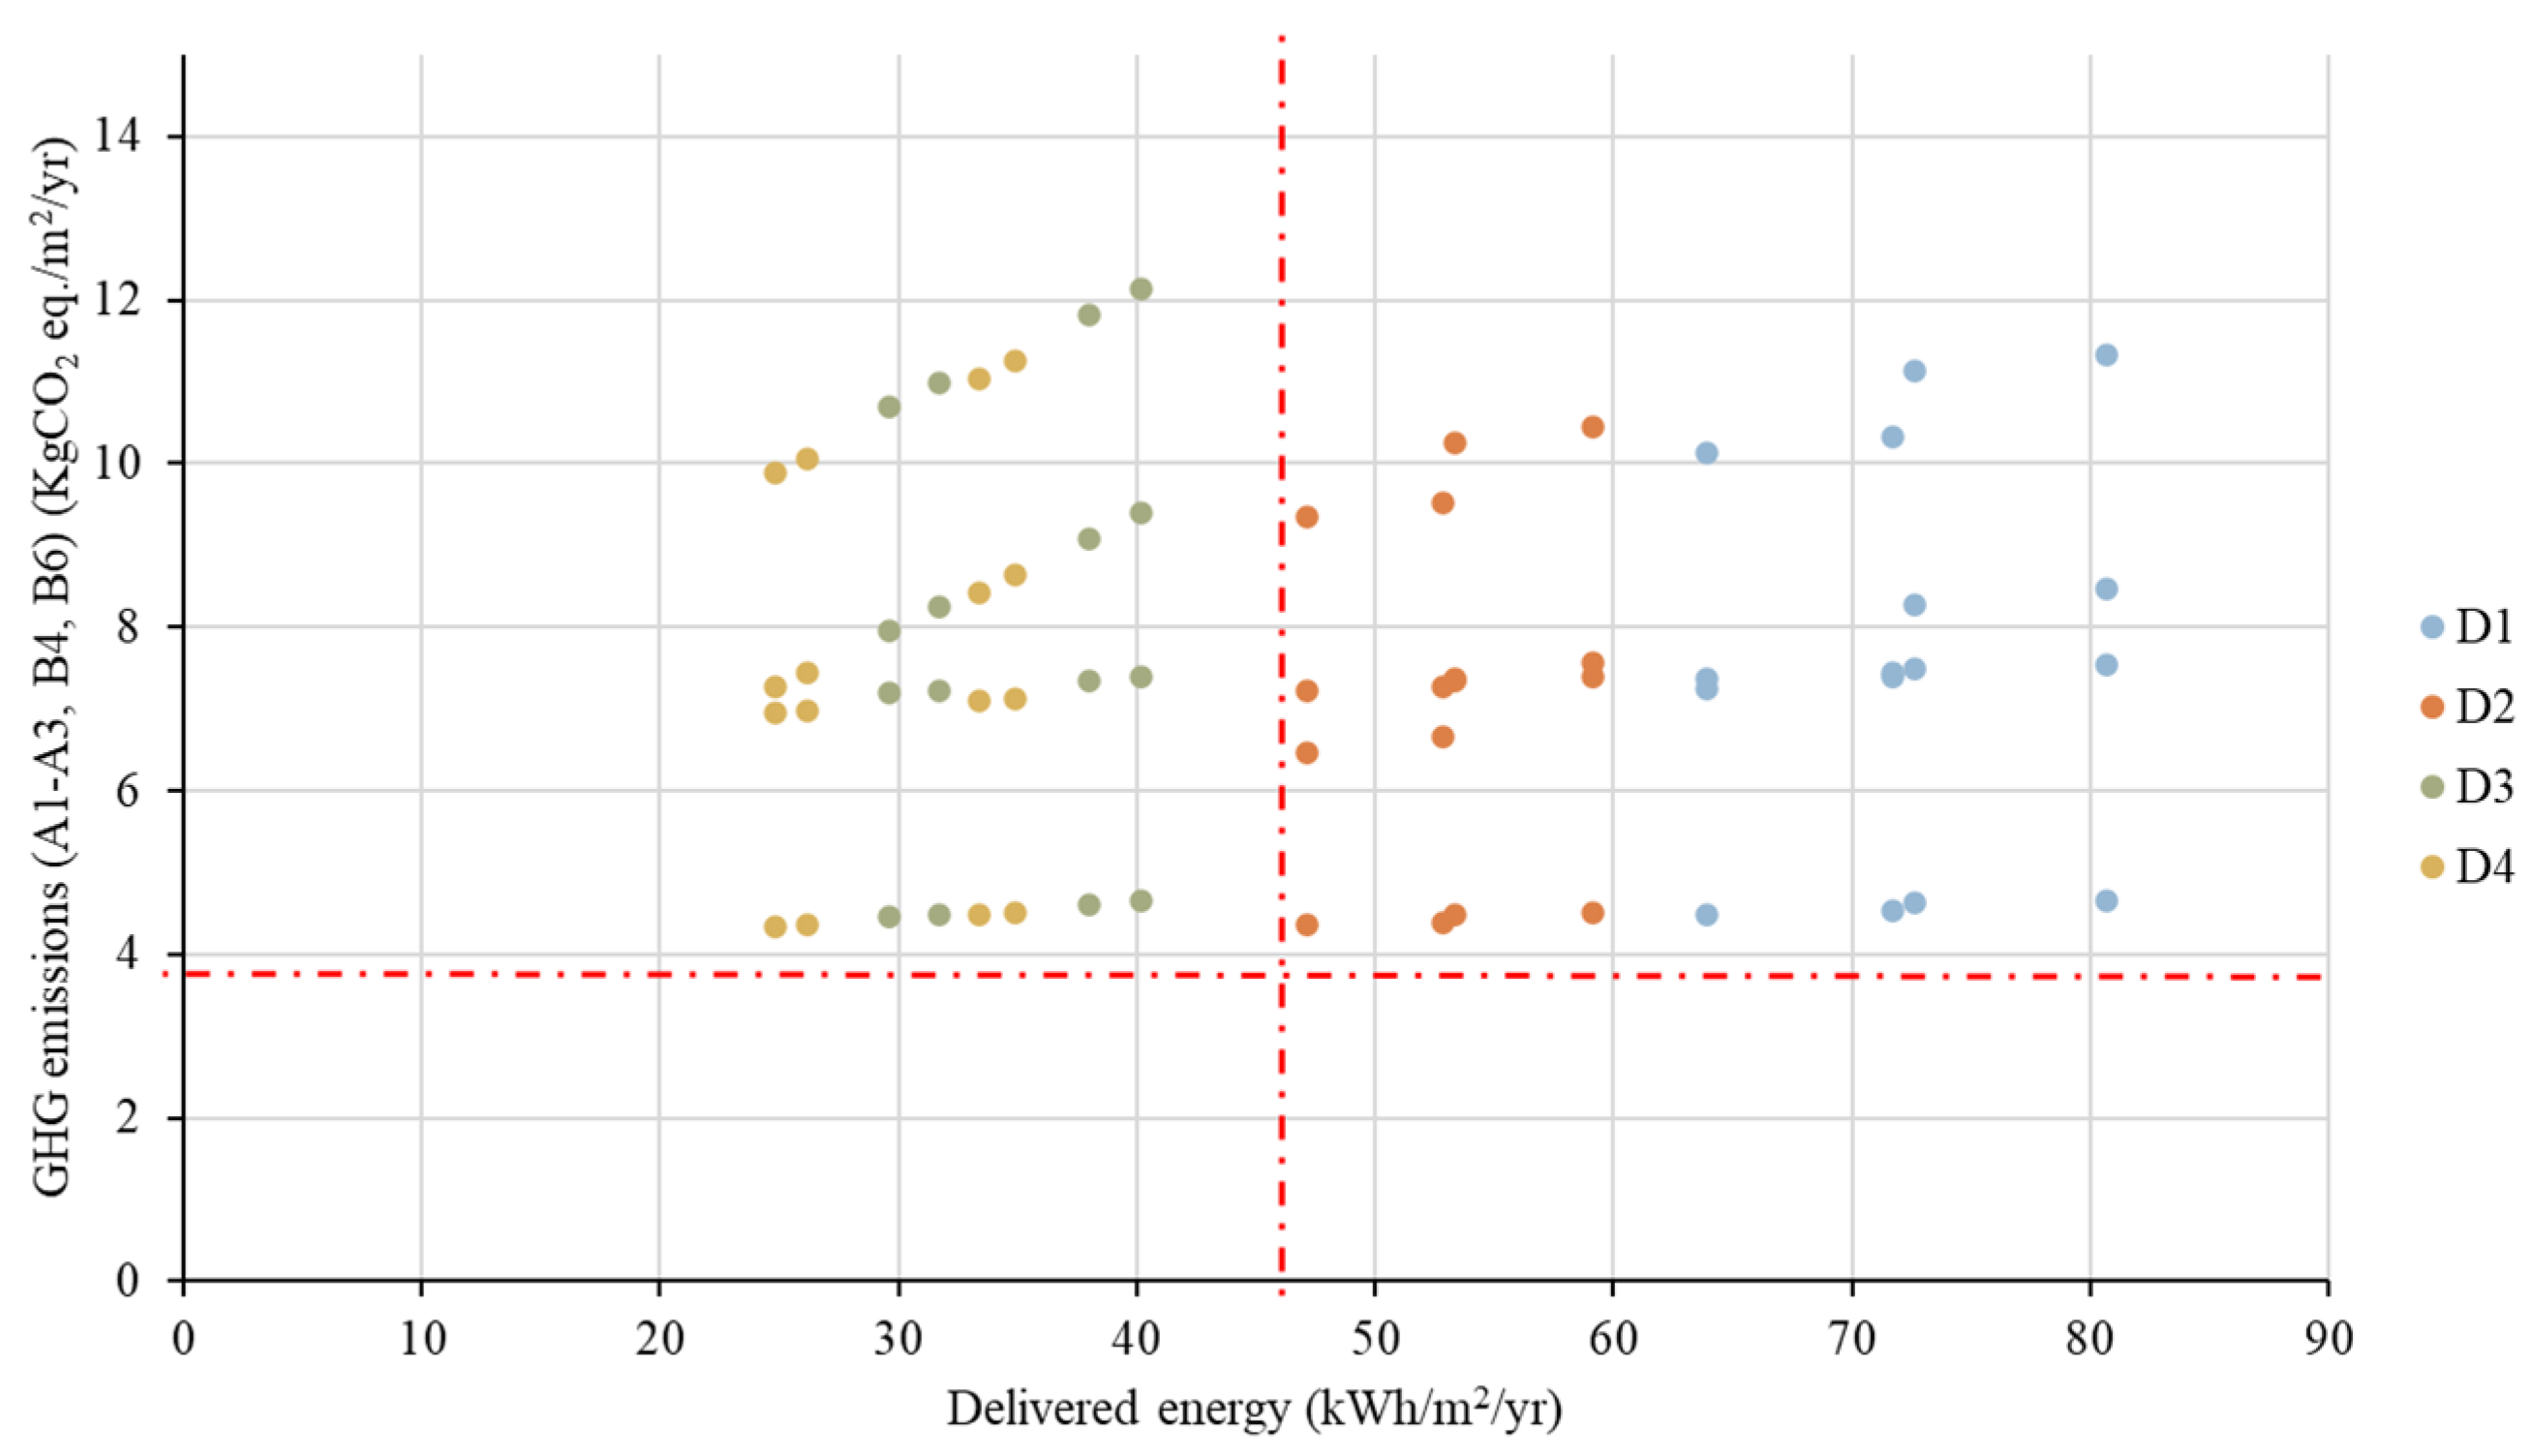
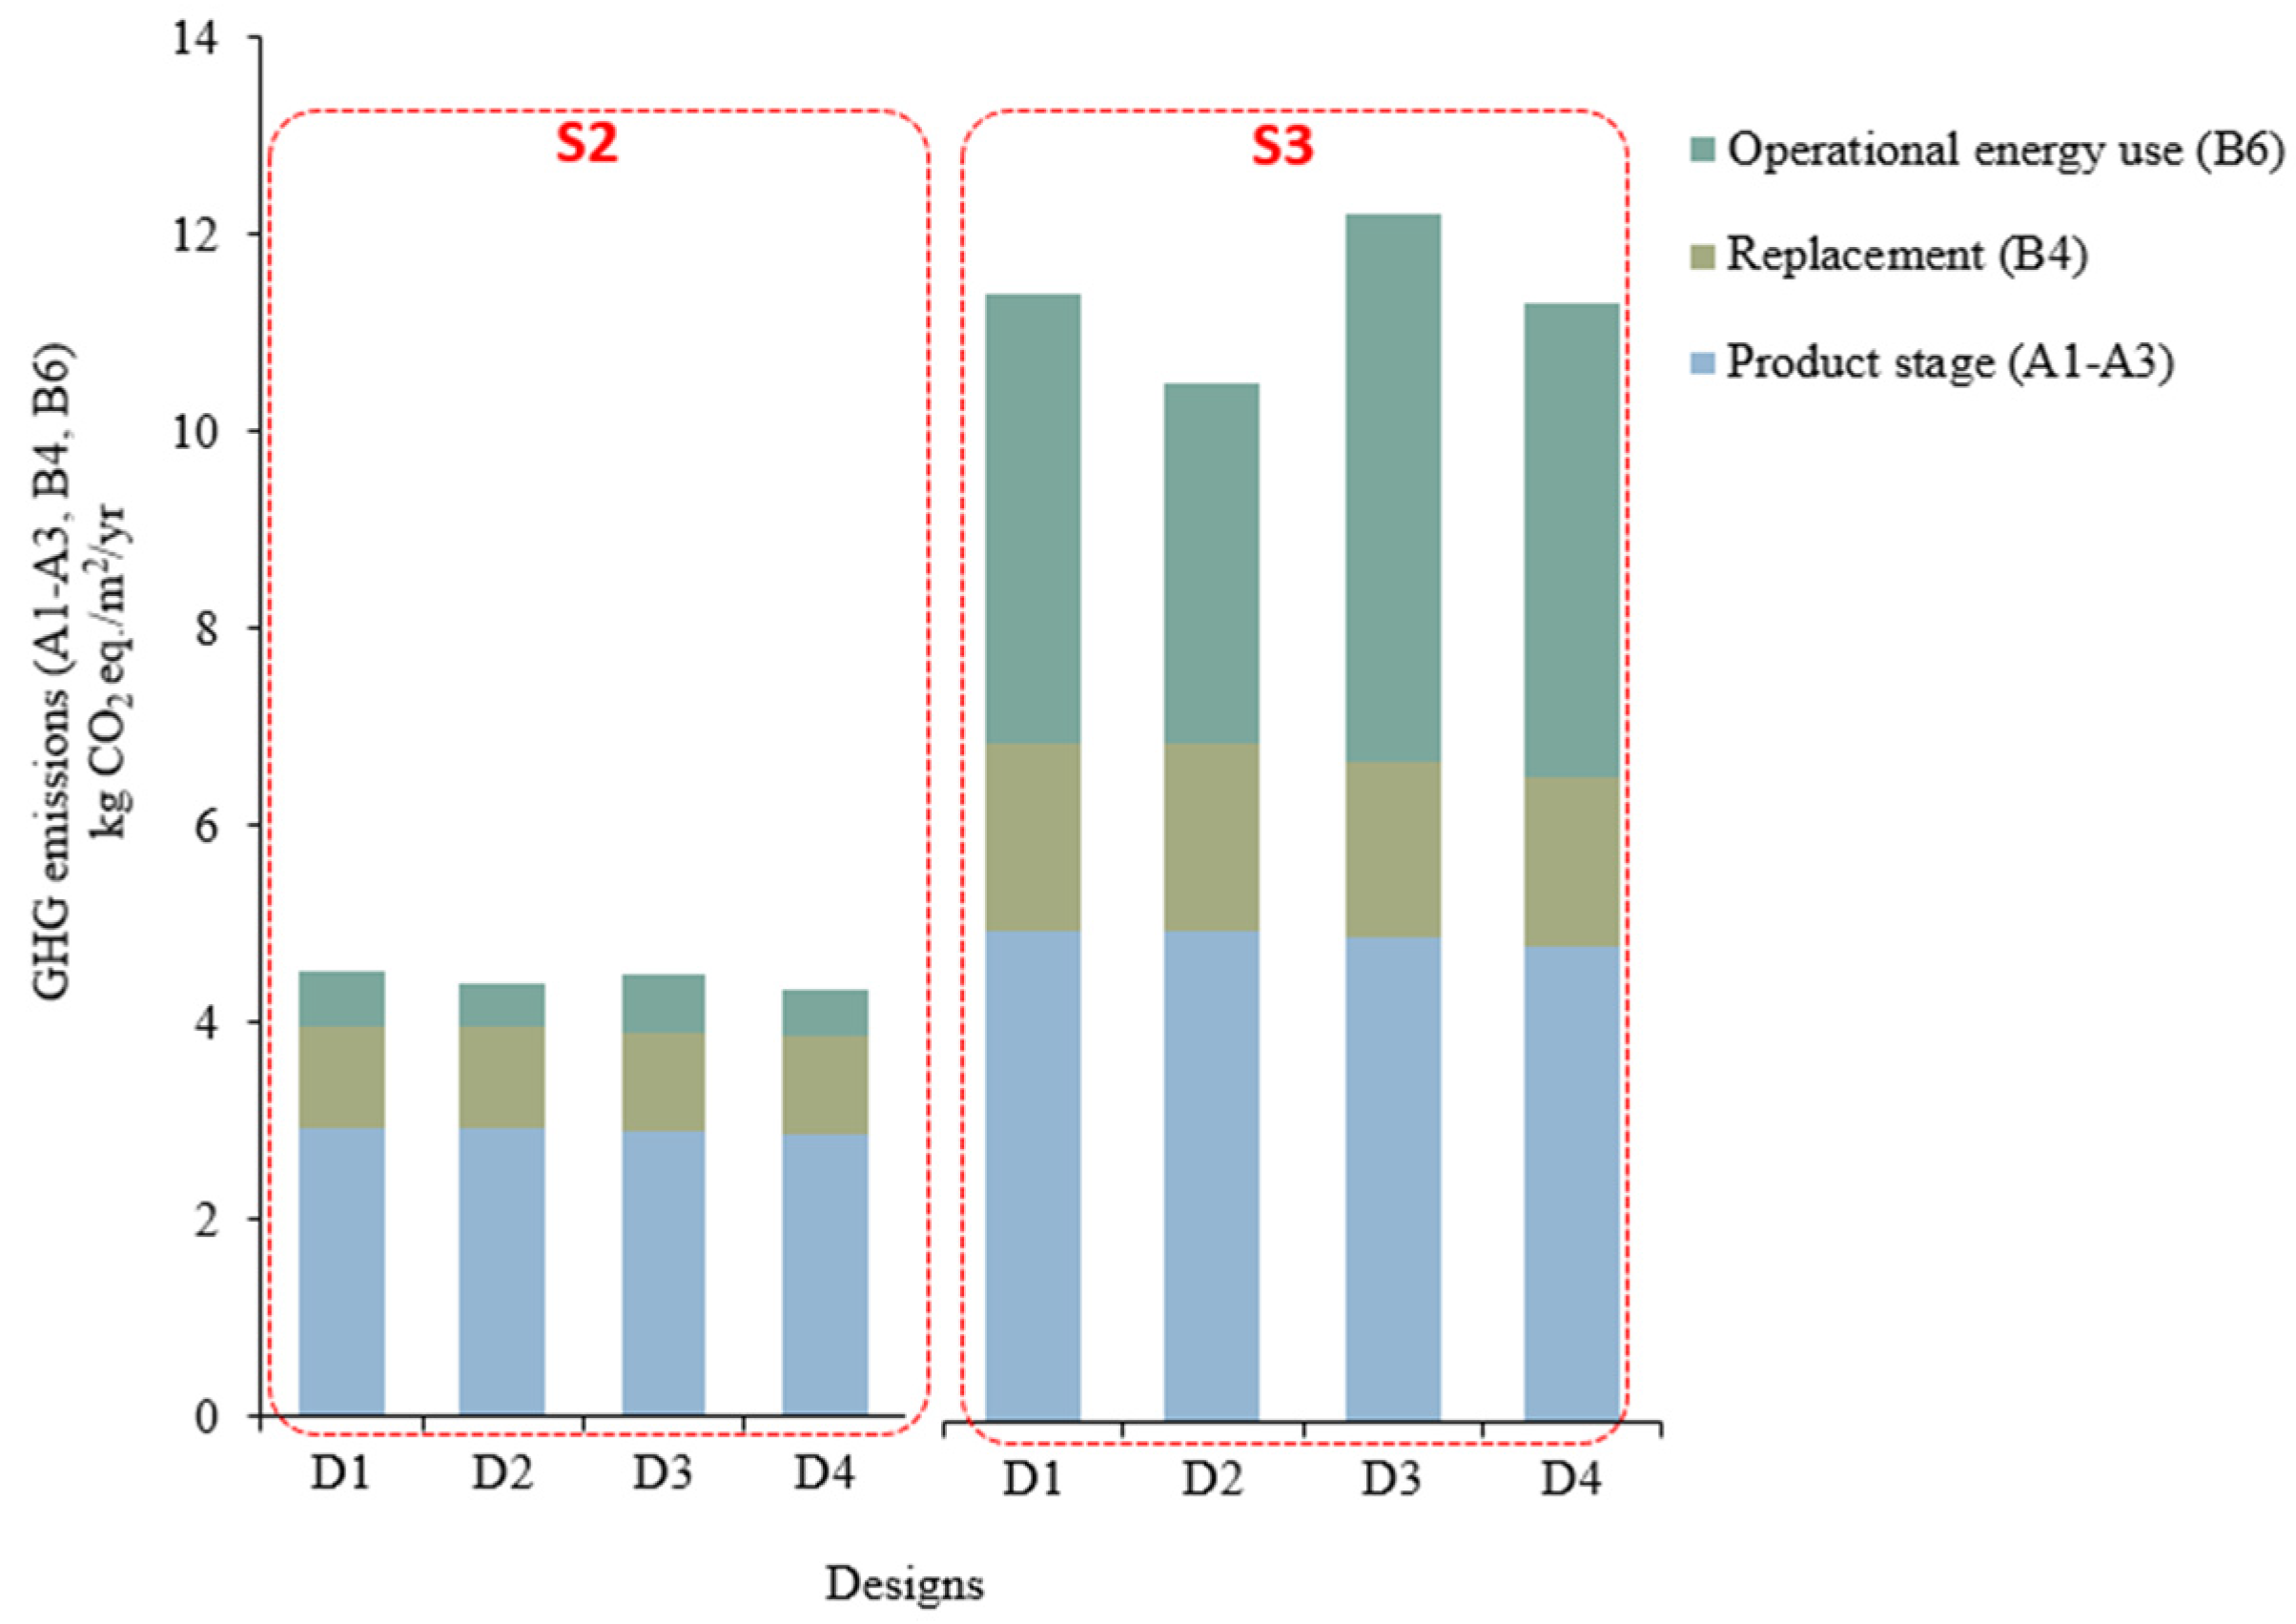
- Regarding the robustness margin of GHG emissions, all designs will experience GHG emission values higher than 3.9 kg CO2/m2/yr under all scenarios. It can be observed from Figure 9 that in low-emission scenarios, all designs perform within a similar range, but in high-emission scenarios, the performance of designs is more distributed.
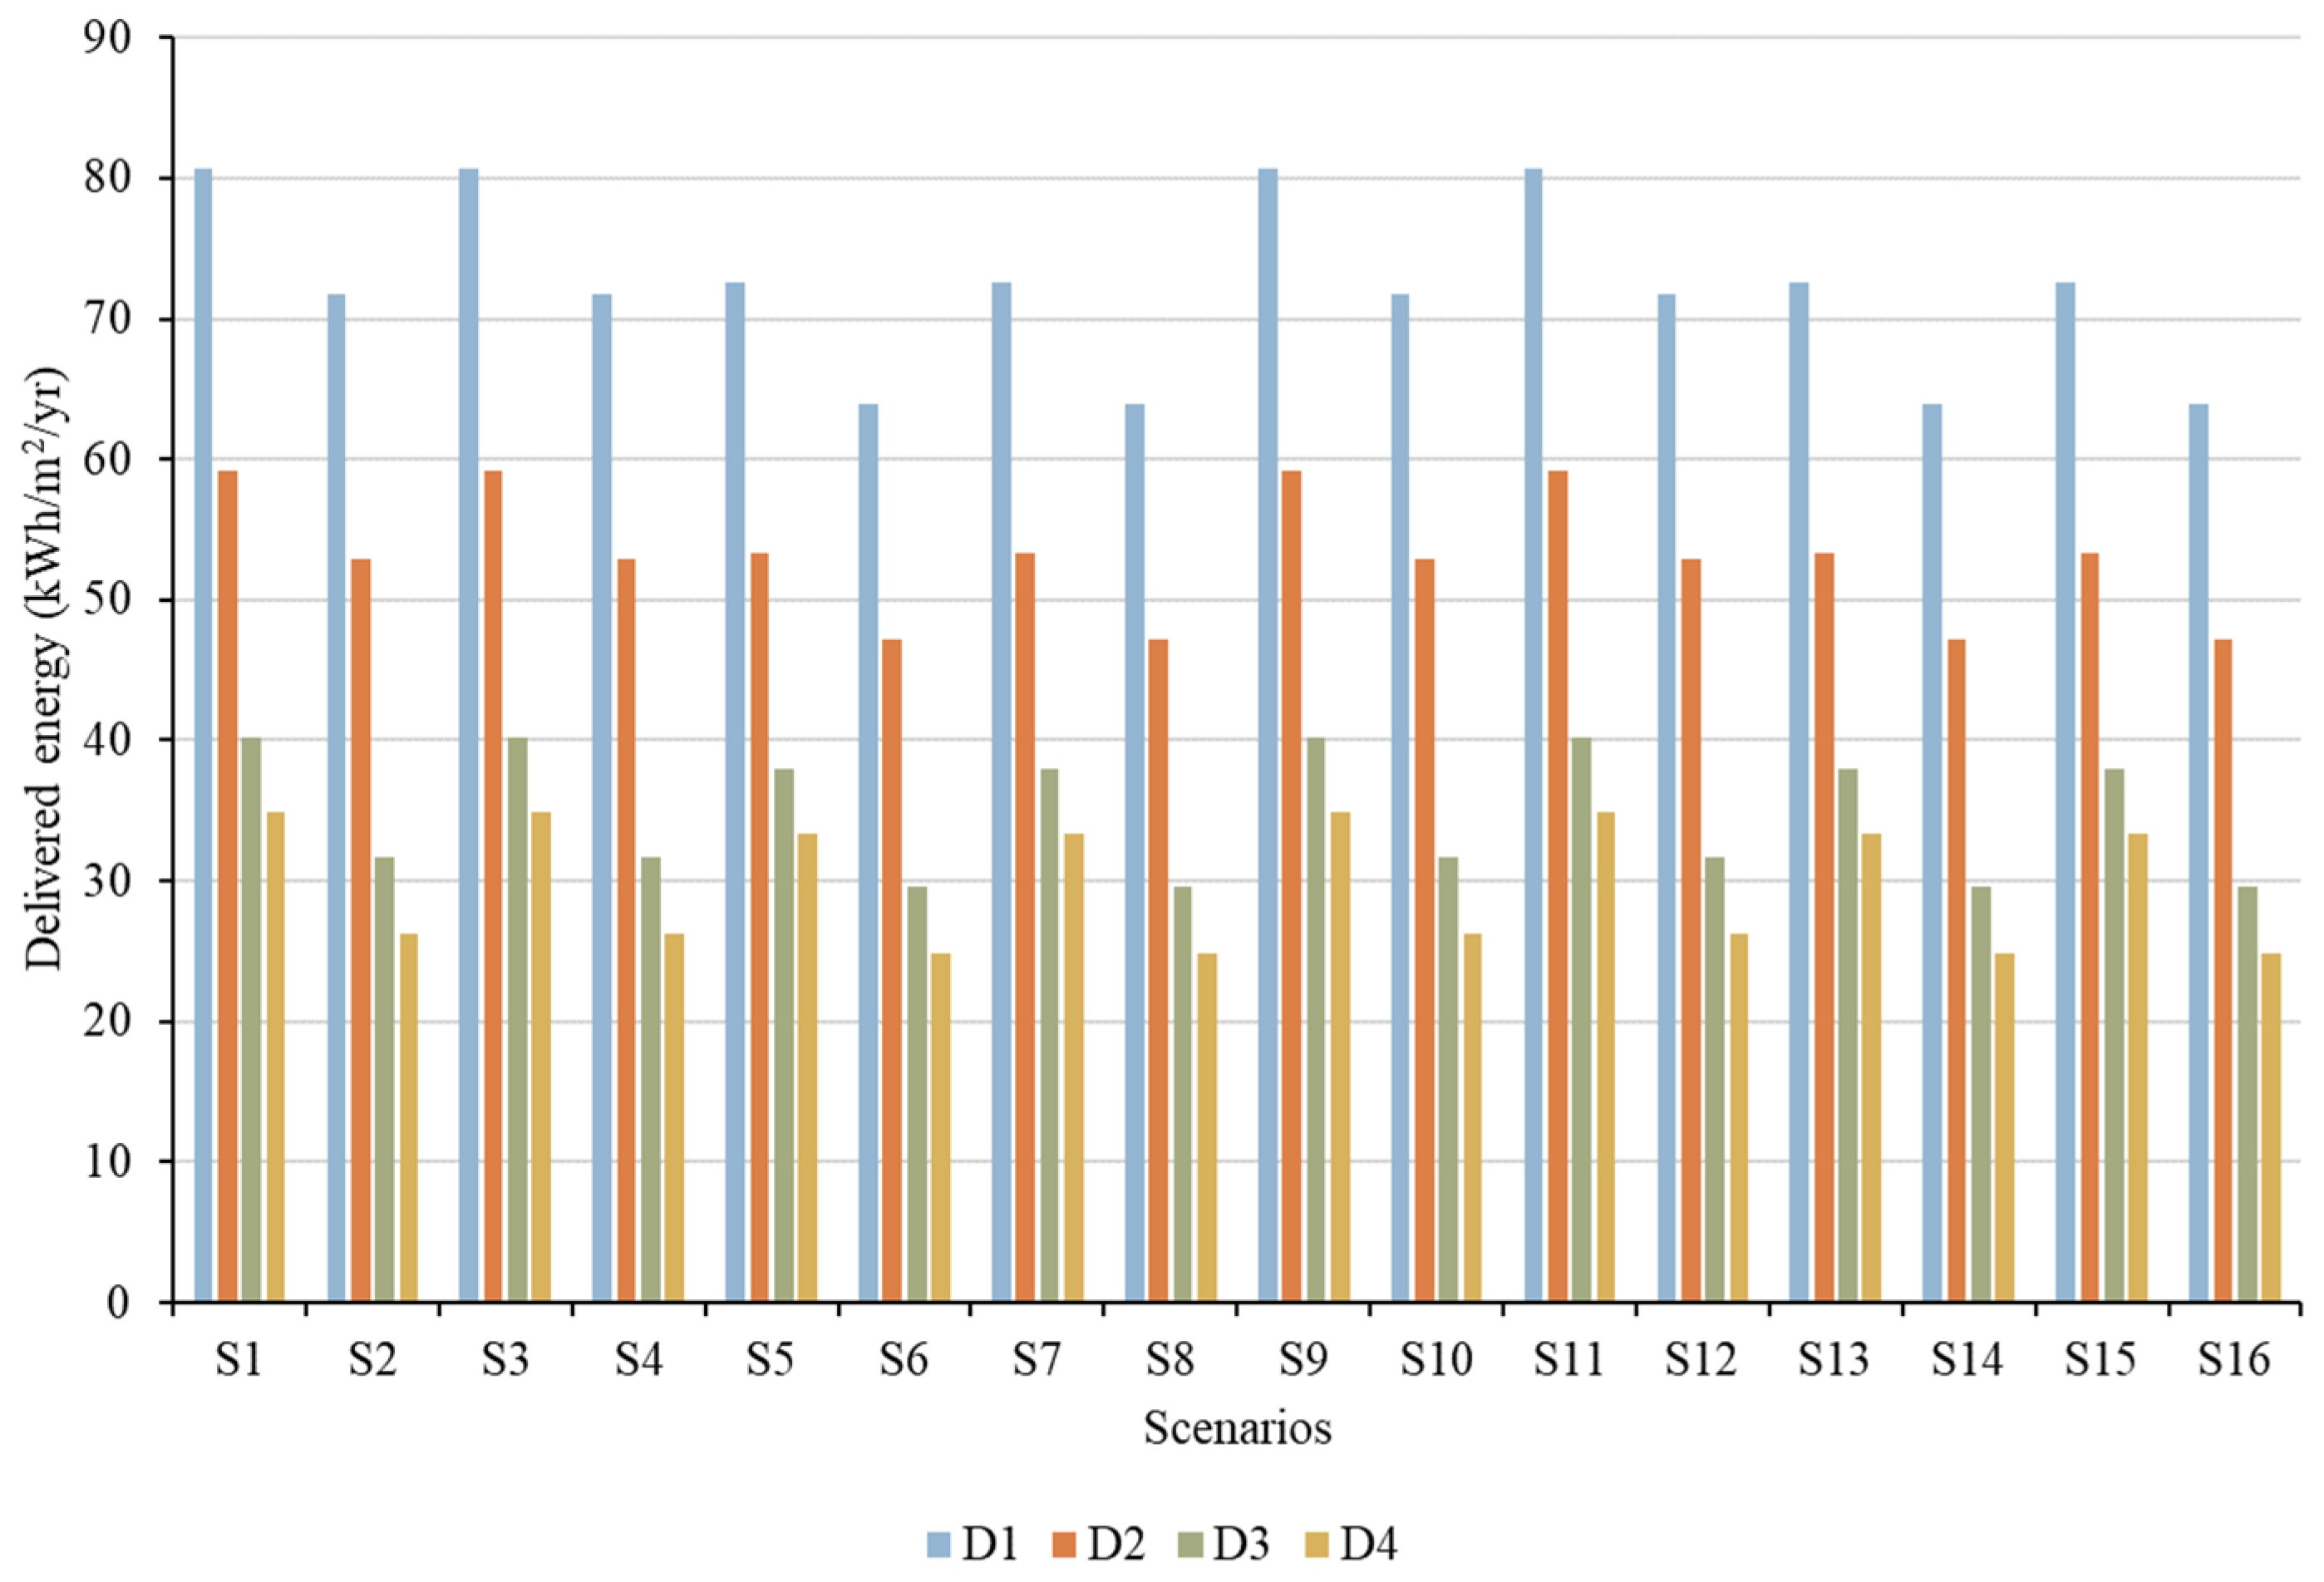
- When it comes to KPI 1, about operational energy use, D3 and D4 meet the robustness margin in all scenarios, while D1 and D2 consistently perform worse than the robustness margin. This indicates that D1 and D2 are less robust in terms of KPI 1.
3.2. Robustness-Based MCDM Assessment
3.3. Test Conditions for KPI 2
4. Discussion
- The building envelope significantly influences the comparison of different neighborhood designs and the choice of the most robust design. The chosen energy standard, whether it is stringent like PH or less strict like TEK17, leads to varying energy demand, impacting both energy consumption and GHG emissions during the neighborhood’s life cycle.
- The selection of high- or low-emission materials affects emissions related to material production and replacement stages, which can have a greater impact than energy-use-related emissions, particularly in low-carbon grid contexts like in Norway. In such settings, achieving full compensation for the life cycle GHG emissions from materials remains challenging, even with extensive use of PV panels. D2 is, for instance, the design with the highest allocated area for PVs among those assessed, and this contributes to its selection as the most robust design when only the neighborhood’s use stage is considered. However, when other life cycle stages are also considered, D2 loses its position as the most robust design.
- Emission factors for energy sources also have a critical role in determining the final design choice. When focusing solely on the operational energy stage, some designs may show low delivered energy but emit high levels of GHG during the use stage. The discrepancy in CO2 emission factors between district heating and electricity stems from the energy carriers used in heat production. Norwegian standards, such as the Norwegian NS 3720, often consider recovered heat in district heating as environmentally friendly since it avoids the consumption of primary energy sources. As a result, emissions from district heating are allocated solely to the original activity generating the waste heat rather than to the district heating process itself. In contrast, electricity production typically involves higher emission factors, although still lower than the average European level. Thus, careful consideration of these emission factors is crucial when designing environmentally sustainable systems, particularly when choosing specific energy sources.
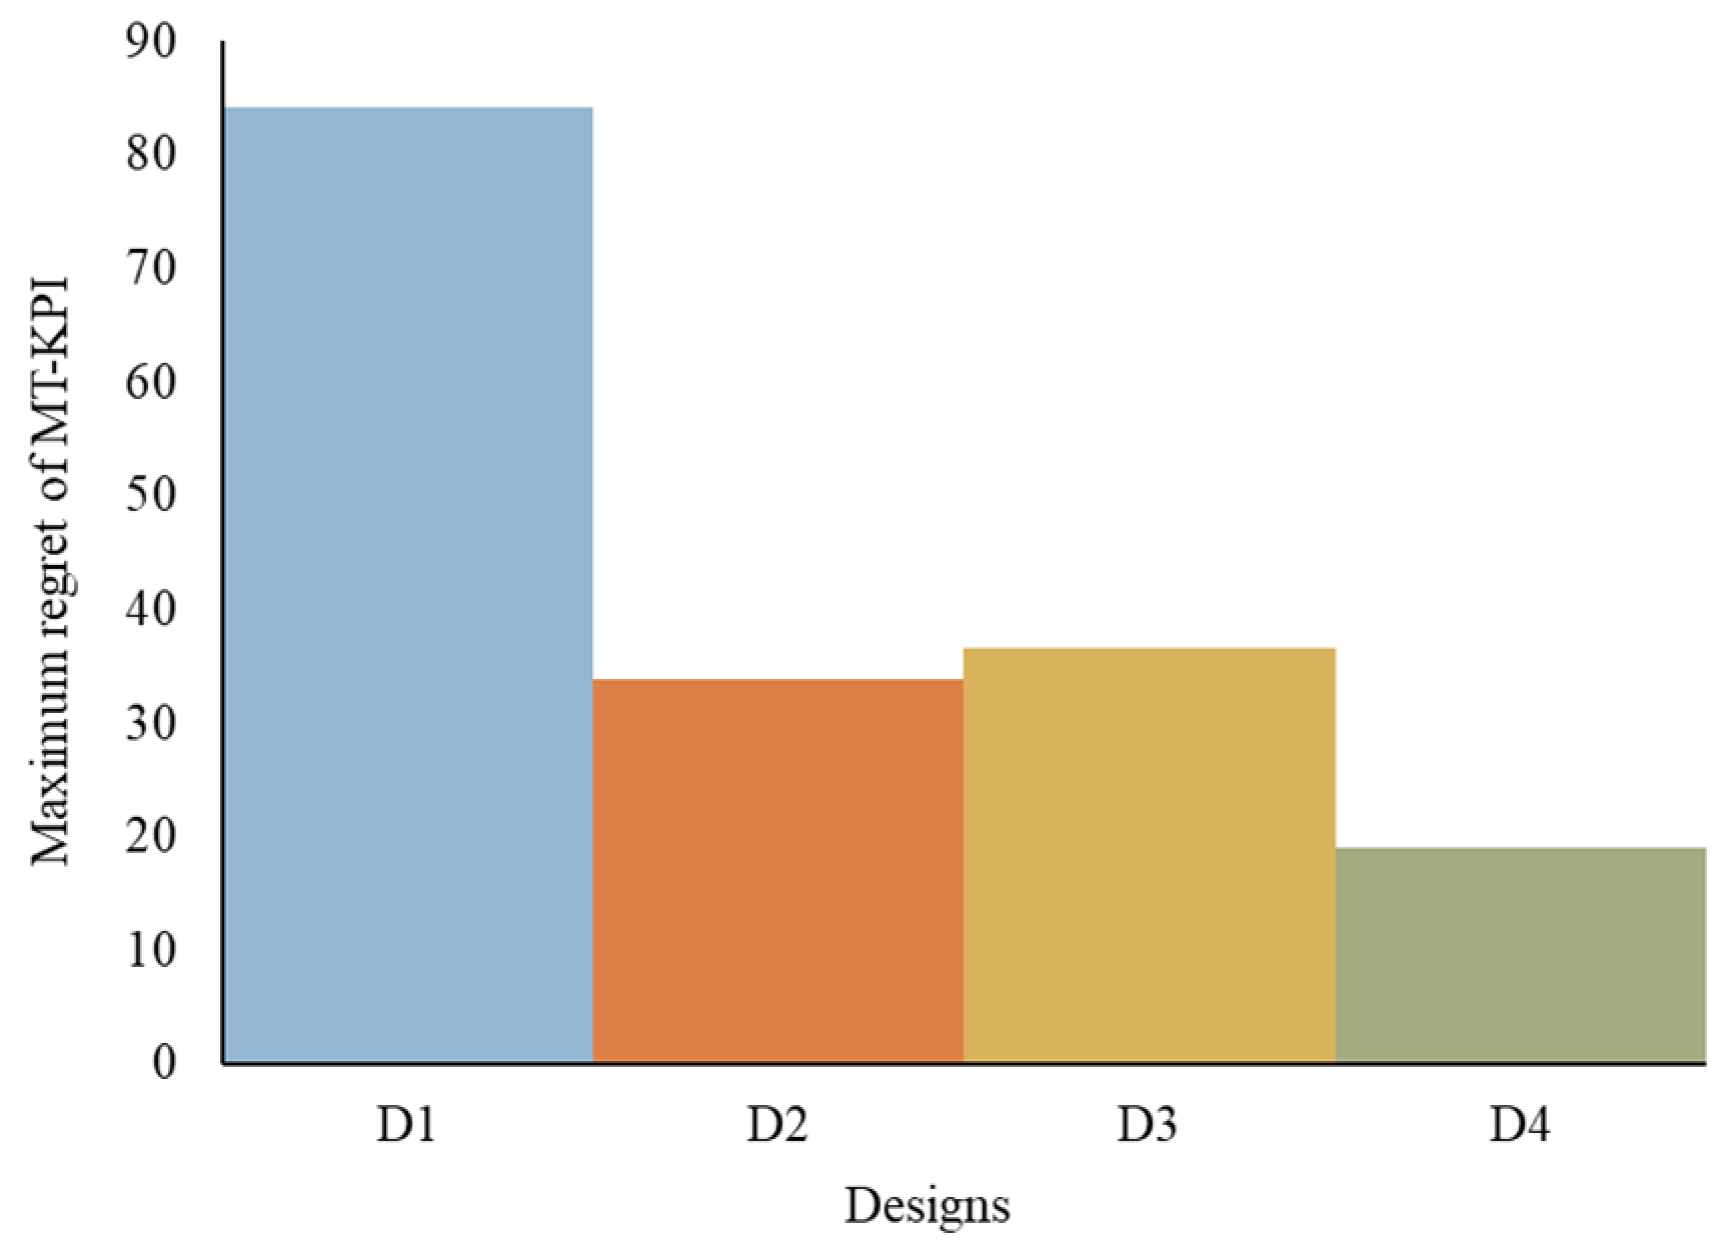
- The selection of life cycle modules for GHG emission calculation is crucial in determining the most robust design using the T-robust method. This approach helps decision-makers choose GHG emission indicators more effectively under future uncertainties. In this study, when the indicator focuses solely on operational energy emissions, D2 proves to be the most robust design due to its use of a low-emission energy source and the largest allocated PV area. However, when GHG emissions also account for materials, replacement, and operational energy, D4 emerges as the most robust option due to its lower overall energy consumption and reduced deviation from the emission target. Although D4 has higher operational phase emissions, its overall performance in terms of both material and energy emissions is superior. This demonstrates how the choice of life cycle elements in indicator assessments can significantly influence decision-making, potentially leading to suboptimal design choices. The T-robust method effectively captures these nuances, aiding decision-makers in selecting robust designs without the complexity of comparing multiple indicators. Incorporating LCA from the early planning stages ensures more informed decision-making by accounting for both embodied and operational emissions, leading to a more comprehensive assessment of a building’s environmental impact.
5. Conclusions
Author Contributions
Funding
Data Availability Statement
Conflicts of Interest
Appendix A
| CO2 Emissions Related to Life Cycle Stages A1–A3, B4 (kg CO2 eq./m2/yr) | ||||
|---|---|---|---|---|
| Type of Building | Typical Materials | Low-Carbon Materials | ||
| A1–A3 | B4 | A1–A3 | B4 | |
| Office buildings | 4.4 | 1.7 | 2.6 | 1.0 |
| Apartment blocks | 5.4 | 1.6 | 3.2 | 1.0 |
| Schools | 4.4 | 1.3 | 3.0 | 0.9 |
| Commercial building | 3.8 | 1.5 | 2.4 | 1.0 |
| Cultural buildings | 4.4 | 1.3 | 3.0 | 0.9 |
| Sport buildings | 4.4 | 1.3 | 3.0 | 0.9 |
| Existing buildings | 0.5 * | 1.2 ** | 0.3 * | 0.9 ** |
| Occupant Behavior | ||
|---|---|---|
| Active | Passive | |
| Heating system_setpoint and schedule | Two different temperatures based on occupancy. For apartments: 22 °C during day and 19 °C during night. For sport buildings: 19 °C when occupied and 16 °C when not occupied. For all other buildings: 21 °C when occupied and 18 °C when not occupied. | Constant temperature during day, i.e., 22 °C for apartments, 19 °C for sport building, 21 °C for other building categories. |
| Building occupancy schedules | Same as occupancy for ‘’passive behavior’’ but considering 2 days home office per week. | Occupancy for apartment blocks based on prEN16798-1 (employed). Occupancy for other building categories based on NS 3031:2020. |
| Additional building occupancy schedule_only apartment blocks | Different occupancy schedules based on age groups. Non-uniform age group mix: 35% under 30 years 47% 30–64 year 17% over 64. | Same occupancy schedules for all apartment blocks (based on prEN16798-1) with uniform age group mix. |
| Electric equipment efficiency | 10% higher efficiency than in the “passive behavior”. | Different for building categories, based on NS 3031:2020 |
| Lighting efficiency | LED lights with luminous efficacy of 60 lm/W. | Standard lights with luminous efficacy of 12 lm/W. |
| Design | Scenarios | Max and Min Performance Across Scenarios | |||||
|---|---|---|---|---|---|---|---|
| S1 | S2 | … | Si | Sn | Maximum Performance (A) | Minimum Performance (B) | |
| D1 | KPI11 | KPI21 | … | KPIi1 | KPIn1 | A1 = max (KPI11,…, KPIn1) | B1 = min (KPI11,…, KPIn1) |
| D2 | KPI12 | KPI22 | … | KPIi2 | KPIn2 | A2 | B2 |
| … | … | ||||||
| Di | KPI1i | KPI2i | … | KPIii | KPIni | Ai | Bi |
| Dm | KPI1m | KPI2m | … | KPIim | KPInm | Am | Bm |
| Minimum performance for each scenario (C) | C1 = min (KPI11,…, KPI1m) | C2 | … | Ci | Cn | ||
| Best performance of all designs across all scenarios | D = min(B) = min(C) | ||||||
| Performance Regret (R) | ||||
|---|---|---|---|---|
| Designs | Scenarios | |||
| S1 | S2 | … | Sn | |
| D1 | R11 = KPI11 − C1 | R21 = KPI21 − C2 | … | Rn1 = KPIn1 − Cn |
| D2 | R12 = KPI12 − C1 | R22 = KPI22 − C2 | … | Rn2 = KPIn2 − Cn |
| … | … | |||
| Di | R1i = KPI1i − C1 | R2i= KPI2i − C2 | … | Rni = KPIni − Cn |
| Dm | R1m = KPI1m − C1 | R2m = KPI2m − C2 | … | Rnm = KPInm − Cn |
References
- Salter, J.; Lu, Y.; Kim, J.C.; Kellett, R.; Girling, C.; Inomata, F.; Krahn, A. Iterative ‘What-If’ Neighborhood Simulation: Energy and Emissions Impacts. Build. Cities 2020, 1, 293–307. [Google Scholar] [CrossRef]
- Charani Shandiz, S.; Rismanchi, B.; Foliente, G. Energy Master Planning for Net-Zero Emission Communities: State of the Art and Research Challenges. Renew. Sustain. Energy Rev. 2021, 137, 110600. [Google Scholar] [CrossRef]
- Homaei, S.; Hamdy, M. A Robustness-Based Decision Making Approach for Multi-Target High Performance Buildings under Uncertain Scenarios. Appl. Energy 2020, 267, 114868. [Google Scholar] [CrossRef]
- Moschetti, R.; Homaei, S.; Taveres-Cachat, E.; Grynning, S. Assessing Responsive Building Envelope Designs through Robustness-Based Multi-Criteria Decision Making in Zero-Emission Buildings. Energies 2022, 15, 1314. [Google Scholar] [CrossRef]
- Homaei, S.; Moschetti, R.; Clauss, J. Selection of the Most High-Performance and Robust Design for a Zero-Emission Neighbourhood: Case Study of Flytårnet Area in Norway. In Proceedings of the Building Simulation 2023: 18th Conference of IBPSA, Shanghai, China, 4–6 September 2023; pp. 2415–2422. [Google Scholar] [CrossRef]
- Weiler, V.; Eicker, U. Automatic Energy Demand and System Simulation at District Level. Nachhalt. Manag. Forum 2021, 29, 133–141. [Google Scholar] [CrossRef]
- Li, W.; Zhou, Y.; Cetin, K.; Eom, J.; Wang, Y.; Chen, G.; Zhang, X. Modeling Urban Building Energy Use: A Review of Modeling Approaches and Procedures. Energy 2017, 141, 2445–2457. [Google Scholar] [CrossRef]
- Swan, L.G.; Ugursal, V.I. Modeling of End-Use Energy Consumption in the Residential Sector: A Review of Modeling Techniques. Renew. Sustain. Energy Rev. 2009, 13, 1819–1835. [Google Scholar] [CrossRef]
- Kavgic, M.; Mavrogianni, A.; Mumovic, D.; Summerfield, A.; Stevanovic, Z.; Djurovic-Petrovic, M. A Review of Bottom-up Building Stock Models for Energy Consumption in the Residential Sector. Build. Environ. 2010, 45, 1683–1697. [Google Scholar] [CrossRef]
- Nageler, P.; Koch, A.; Mauthner, F.; Leusbrock, I.; Mach, T.; Hochenauer, C.; Heimrath, R. Comparison of Dynamic Urban Building Energy Models (UBEM): Sigmoid Energy Signature and Physical Modelling Approach. Energy Build. 2018, 179, 333–343. [Google Scholar] [CrossRef]
- Kong, D.; Cheshmehzangi, A.; Zhang, Z.; Ardakani, S.P.; Gu, T. Urban Building Energy Modeling (UBEM): A Systematic Review of Challenges and Opportunities. Energy Effic. 2023, 16, 69. [Google Scholar] [CrossRef]
- Lausselet, C. The Use of LCA Methods for Evaluating and Planning Netzero-Emission Neighbourhoods. Ph.D. Thesis, NTNU, Trondheim, Norway, 2021. [Google Scholar]
- Hachem, C. Impact of Neighborhood Design on Energy Performance and GHG Emissions. Appl. Energy 2016, 177, 422–434. [Google Scholar] [CrossRef]
- Moschetti, R.; Brattebø, H.; Sparrevik, M. Exploring the Pathway from Zero-Energy to Zero-Emission Building Solutions: A Case Study of a Norwegian Office Building. Energy Build. 2019, 188–189, 84–97. [Google Scholar] [CrossRef]
- Kristjansdottir, T.F.; Heeren, N.; Andresen, I.; Brattebø, H. Comparative Emission Analysis of Low-Energy and Zero-Emission Buildings. Build. Res. Inf. 2018, 46, 367–382. [Google Scholar] [CrossRef]
- Verellen, E.; Allacker, K. Life Cycle Assessment of Clustered Buildings with a Similar Renovation Potential. Int. J. Life Cycle Assess 2022, 27, 1127–1144. [Google Scholar] [CrossRef]
- Stephan, A.; Crawford, R.H.; De Myttenaere, K. Multi-Scale Life Cycle Energy Analysis of a Low-Density Suburban Neighbourhood in Melbourne, Australia. Build. Environ. 2013, 68, 35–49. [Google Scholar] [CrossRef]
- Lotteau, M.; Loubet, P.; Pousse, M.; Dufrasnes, E.; Sonnemann, G. Critical Review of Life Cycle Assessment (LCA) for the Built Environment at the Neighborhood Scale. Build. Environ. 2015, 93, 165–178. [Google Scholar] [CrossRef]
- Lotteau, M.; Yepez-Salmon, G.; Salmon, N. Environmental Assessment of Sustainable Neighborhood Projects through NEST, a Decision Support Tool for Early Stage Urban Planning. Procedia Eng. 2015, 115, 69–76. [Google Scholar] [CrossRef]
- Kotireddy, R.; Hoes, P.-J.; Hensen, J.L.M. A Methodology for Performance Robustness Assessment of Low-Energy Buildings Using Scenario Analysis. Appl. Energy 2018, 212, 428–442. [Google Scholar] [CrossRef]
- The Norwegian Building Authority. Building Technical Regulation, TEK17; The Norwegian Building Authority: Trondheim, Norway, 2017. (In Norwegian) [Google Scholar]
- NS 3700; Criteria for Passive Houses and Low Energy Buildings—Residential Buildings. Standards Norway: Lysaker, Norway, 2013. (In Norwegian)
- NS 3701; Criteria for Passive Houses and Low Energy Buildings—Non-Residential Buildings. Standards Norway: Lysaker, Norway, 2012. (In Norwegian)
- Sustainable Energy Research Group, University of Southampton. Climate Change World Weather File Generator for World-Wide Weather Data—CCWorldWeatherGen. Available online: https://energy.soton.ac.uk/climate-change-world-weather-file-generator-for-world-wide-weather-data-ccworldweathergen/ (accessed on 9 October 2022).
- NS 3720; Method for Greenhouse Gas Calculations for Buildings. Standards Norway: Lysaker, Norway, 2018. (In Norwegian)
- Norsk Energi. Climate Accounting for District Heating 2020. Common Emission Factors for the Norwegian District Heating Industry—Update 2020; Norsk Energi: Oslo, Norway, 2020. (In Norwegian) [Google Scholar]
- Oslofjord Varme. Key Figures for Environmental Accounting and BREEAM Certification; Environmental Report 2020; Oslofjord Varme: Sandvika, Norway, 2020. (In Norwegian) [Google Scholar]
- Fuglseth, M.; Haanes, H.; Andvik, O.D.; Nordby, A.S.; Brekke-Rotwitt, P.; Våtevik, S. Climate-Friendly Building Materials: Potential for Emission Reduction and Barriers to Adoption; Asplan Viak: Sandvika, Norway, 2020. (In Norwegian) [Google Scholar]
- Wiik, M.; Selvig, E.; Fuglseth, M.; Lausselet, C.; Resch, E.; Andresen, I.; Brattebø, H.; Hahn, U. GHG Emission Requirements and Benchmark Values for Norwegian Buildings. IOP Conf. Ser. Earth Environ. Sci. 2020, 588, 022005. [Google Scholar] [CrossRef]
- EPD-Norway. Environmental Product Declaration: Glava Glass Wool 2019; EPD: Stockholm, Sweden, 2019. (In Norwegian) [Google Scholar]
- EPD-Norway. Environmental Product Declaration: EPS Insulation Boards 2021; EPD: Stockholm, Sweden, 2021. [Google Scholar]
- EPD-Norway. Environmental Product Declaration: EPS Insulation Boards from Recycled Expanded Polystyrene 2021; EPD: Stockholm, Sweden, 2021. [Google Scholar]
- EPD-Norway. Environmental Product Declaration: H-Window+ Fixed Frame, 90 mm Profile 2024; EPD: Stockholm, Sweden, 2024. [Google Scholar]
- EPD-Norway. Environmental Product Declaration: Top-Hung Pine Windows with and without Aluminum Cladding 2022; EPD: Stockholm, Sweden, 2022. (In Norwegian) [Google Scholar]
- EPD-Norway. Environmental Product Declaration: Stone Wool Insulation 2019; EPD: Stockholm, Sweden, 2019. [Google Scholar]
- EPD-Norway. Environmental Product Declaration: Alpha Pure-R 2023; EPD: Stockholm, Sweden, 2023. [Google Scholar]
- EPD-Norway. Environmental Product Declaration: First Solar Series 7 Photovoltaic Module 2023; EPD: Stockholm, Sweden, 2023. [Google Scholar]
- D’Agostino, D.; Tzeiranaki, S.T.; Zangheri, P.; Bertoldi, P. Assessing Nearly Zero Energy Buildings (NZEBs) Development in Europe. Energy Strategy Rev. 2021, 36, 100680. [Google Scholar] [CrossRef]
- SN/NSPEK 3031:2020; Energy Performance of Buildings—Calculation of Energy Needs and Energy Supply. Standards Norway: Lysaker, Norway, 2020. (In Norwegian)
- EN 16798-1; Energy Performance of Buildings—Ventilation for Buildings. Part 1: Indoor Environmental Input Parameters for Design and Assessment of Energy Performance of Buildings Addressing Indoor Air Quality, Thermal Environment, Lighting and Acoustics. European Committee for Standardization (CEN): Brussels, Belgium, 2019.
- Mitra, D.; Steinmetz, N.; Chu, Y.; Cetin, K.S. Typical Occupancy Profiles and Behaviors in Residential Buildings in the United States. Energy Build. 2020, 210, 109713. [Google Scholar] [CrossRef]
- Statistics Norway Age Distribution of the Residents in Bærum Municipality. Available online: https://www.ssb.no/kommunefakta/baerum (accessed on 20 December 2023). (In Norwegian).
- Enova SF Norwegian Energy Labelling System. Available online: https://www.enova.no/energimerking/om-energimerkeordningen/om-energiattesten/karakterskalaen/ (accessed on 3 June 2024).
- Andresen, I.; Resch, E.; Wiik, M.R.K.; Selvig, E.; Stoknes, S. FutureBuilt ZERO—Criteria, Calculation Rules and Documentation Requirements. FutureBuilt: Oslo, Norway, 2021. [Google Scholar]
- Moosberger, S. Validation and Certification of Dynamic Building Simulation Tools—Overview and Experience with IDA ICE; IBPSA-CH: Horw, Switzerland, 2009. [Google Scholar]
- Kropf, S.; Zweifel, G. Validation of the Building Simulation Program IDA-ICE According to CEN 13791 “Thermal Performance of Buildings—Calculation of Internal Temperatures of a Room in Summer Without Mechanical Cooling—General Criteria and Validation Procedures”; University of Applied Sciences and Arts of Lucerne, School of Engineering and Architecture: Horw, Switzerland, 2001. [Google Scholar]
- Lausselet, C.; Borgnes, V.; Brattebø, H. LCA Modelling for Zero Emission Neighbourhoods in Early Stage Planning. Build. Environ. 2019, 149, 379–389. [Google Scholar] [CrossRef]
- Fufa, S.M.; Dahl Schlandbusch, R.; Sørnes, K.; Inman, M.; Andresen, I. A Norwegian ZEB Definition Guideline; The Research Centre on Zero Emission Buildings: Trondheim, Norway, 2016. [Google Scholar]
- Wiik, M.R.K.; Homaei, S.; Lien, S.K.; Sartori, I.; Meland, S.; Karlsson, H.; Ekambaram, A. The ZEN Definition. A Guideline for the ZEN Pilot Areas, Version 4.0; SINTEF Academic Press: Oslo, Norway, 2024. [Google Scholar]
- MATLAB, Version 23.2 (R2023b); The MathWorks Inc.: Natick, MA, USA, 2023.



| Num. | Performance Zone | Feasibility | MT-KPI |
|---|---|---|---|
| 1 | KPI1,rel > 100 and KPI2,rel > 100 | Completely infeasible | (KPI1,rel − 100) + (KPI2,rel − 100) |
| 2 | 2 KPI1,rel > 100 and KPI2,rel ≤ 100 | Feasible for KPI2 | (KPI1,rel − 100) + (1/(100 − KPI2,rel)) |
| 3 | 3 KPI1,rel ≤ 100 and KPI2,rel ≤ 100 | Completely feasible | (1/(100 − KPI1,rel)) + (1/(100 − KPI2,rel)) |
| 4 | 4 KPI1,rel ≤ 100 and KPI2,rel > 100 | Feasible for KPI1 | (1/(100 − KPI1,rel)) + (KPI2,rel − 100) |
| Type of Building | Total Area (m2) | Share (%) | Area in Figure 3 |
|---|---|---|---|
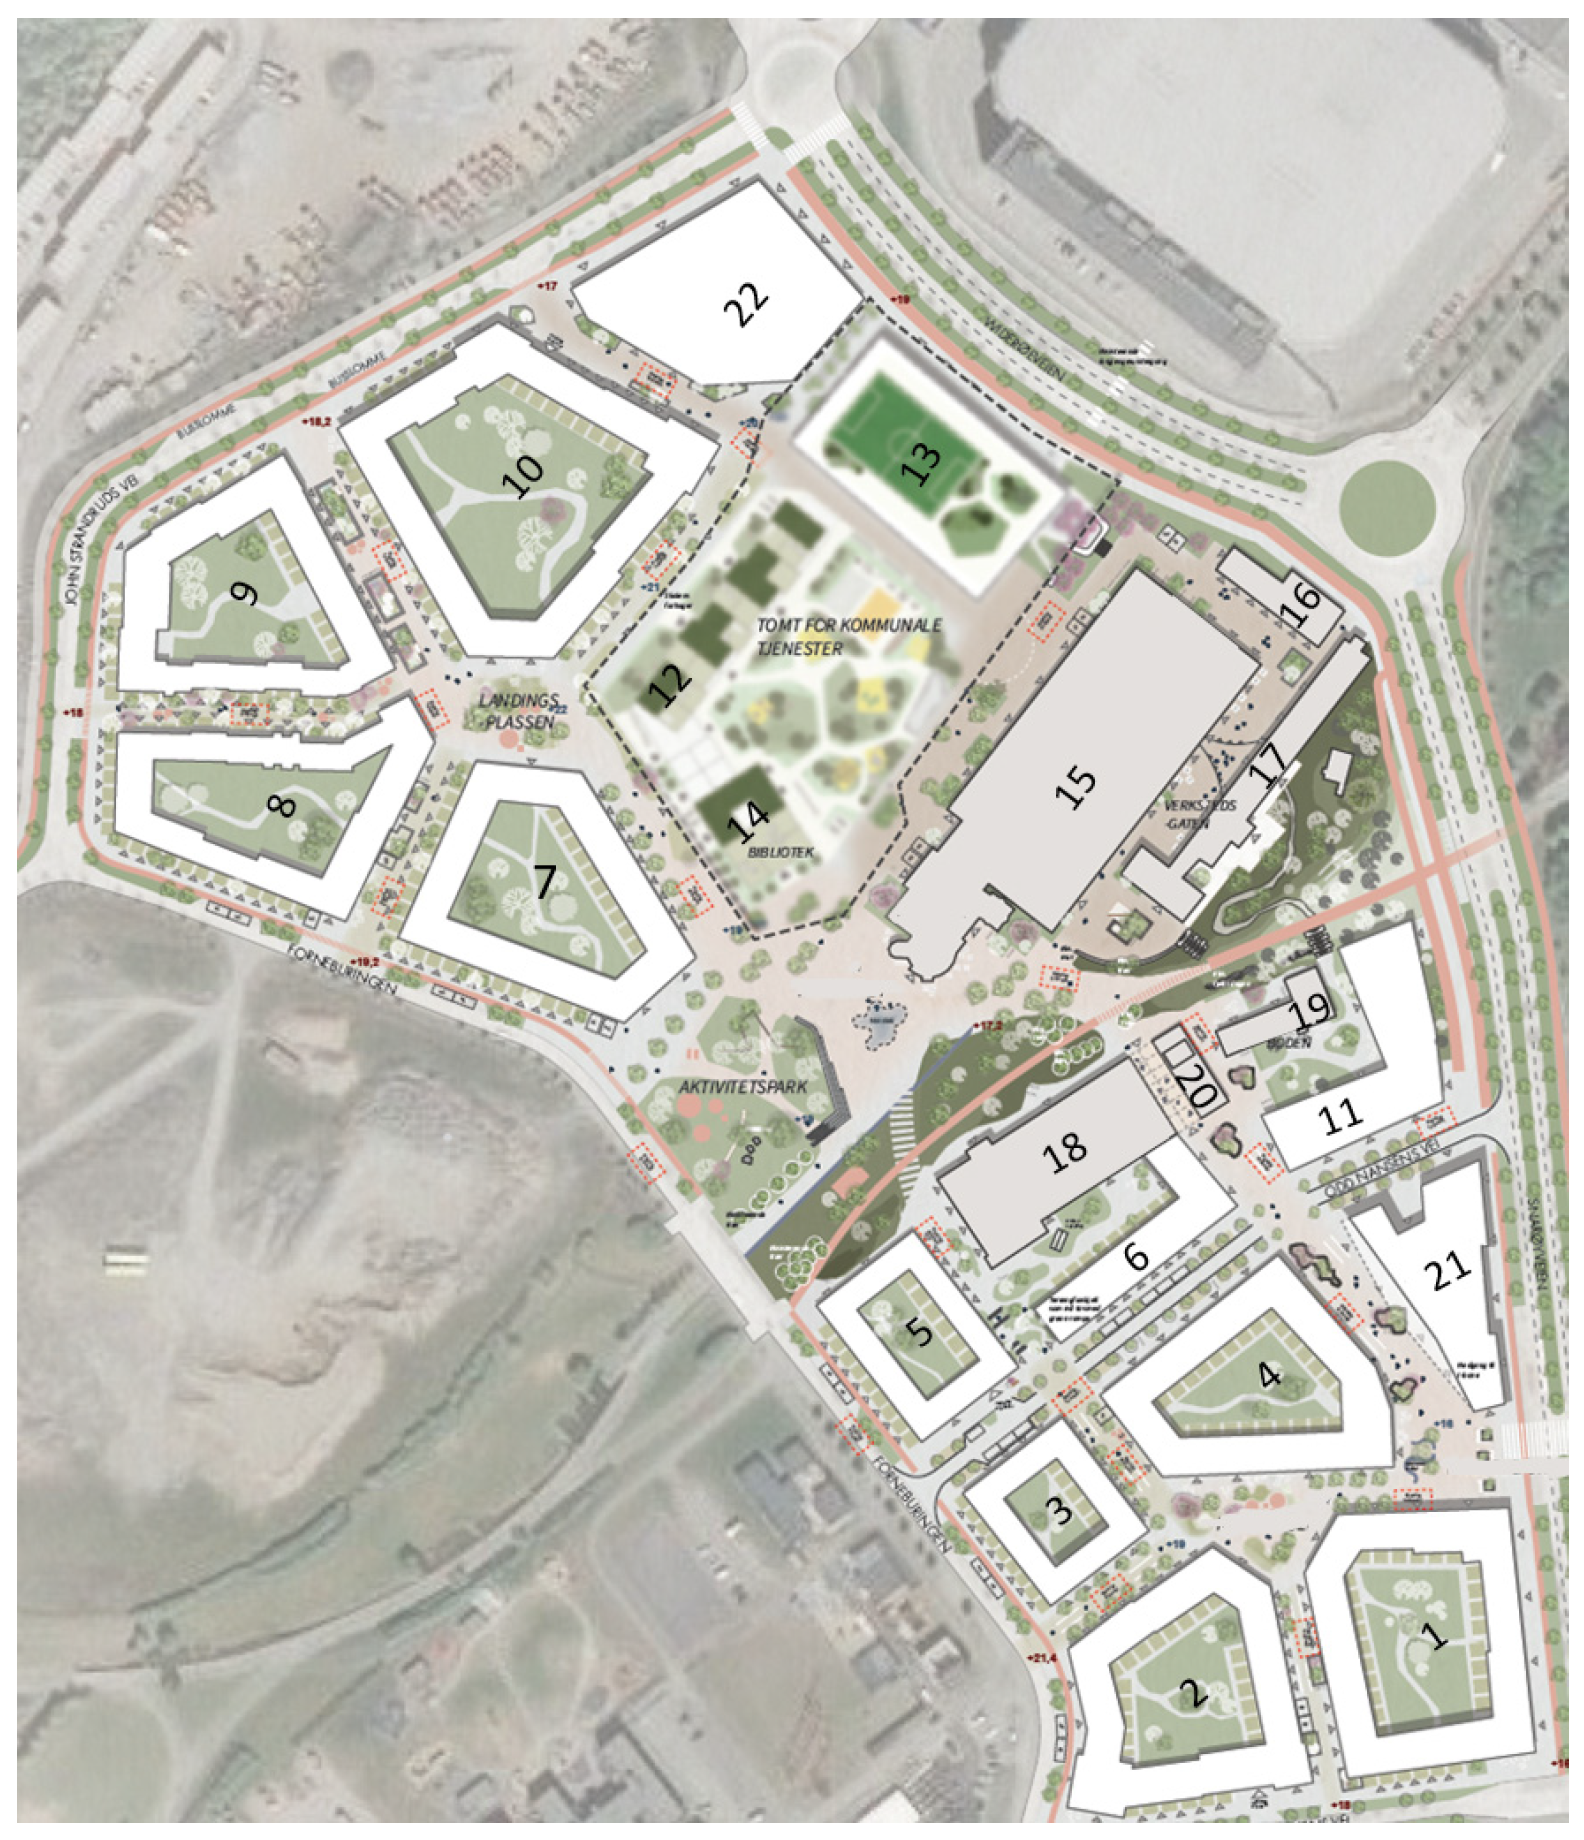
| Apartment blocks | 139,659 | 58 | 1 to 10 |
| Schools | 27,590 | 11 | 11 and 12 |
| Sport buildings | 3900 | 2 | 13 |
| Cultural buildings | 19,175 | 8 | 14 to 17 |
| Workshop buildings | 4505 | 2 | 18 to 20 |
| Commercial buildings | 30,203 | 12 | 21 |
| Office buildings | 16,002 | 7 | 22 |
| Total | 241,034 | 100 | - |
| Design | Building Envelope | Building Envelope | Heating Source | Heating Source | PV Area |
|---|---|---|---|---|---|
| (EB) | (NB) | (EB) | (NB) | ||
| D1 | TEK17 | TEK17 | EH | DH | All available roof area on all buildings (25,000 m2) |
| D2 | TEK17 | PH | EH | DH | All available roof area on all buildings (25,000 m2) |
| D3 | TEK17 | TEK17 | EH | HP | All available roof area only on new buildings (18,000 m2) |
| D4 | TEK17 | PH | EH | HP | All available roof area only on apartment blocks (12,000 m2) |
| Scenarios | |||||||||||||||||
|---|---|---|---|---|---|---|---|---|---|---|---|---|---|---|---|---|---|
| Parameter | Option | 1 | 2 | 3 | 4 | 5 | 6 | 7 | 8 | 9 | 10 | 11 | 12 | 13 | 14 | 15 | 16 |
| Weather | Current | x | x | x | x | x | x | x | x | ||||||||
| 2050 | x | x | x | x | x | x | x | x | |||||||||
| CO2 emission factors for energy sources | High | x | x | x | x | x | x | x | x | ||||||||
| Low | x | x | x | x | x | x | x | x | |||||||||
| CO2 emission factors for materials | High | x | x | x | x | x | x | x | x | ||||||||
| Low | x | x | x | x | x | x | x | x | |||||||||
| Occupant behavior | Passive | x | x | x | x | x | x | x | x | ||||||||
| Active | x | x | x | x | x | x | x | x | |||||||||
| Energy Source | Scenario Options | |
|---|---|---|
| Low | High | |
| Electricity | 0.018 kg CO2 eq./kWh | 0.136 kg CO2 eq./kWh |
| District heating | 0.005 kg CO2 eq./kWh | 0.023 kg CO2 eq./kWh |
| Target Value | Robustness Margin | |
|---|---|---|
| KPI 1: Delivered energy (B6) (kWh/m2/yr) | 44 | 46 |
| KPI 2: GHG emissions (A1–A3, B4, B6) (kg CO2 eq./m2/yr) | 3.7 | 3.9 |
| Design Parameters | TEK17 | PH Standard |
|---|---|---|
| U-value external walls (W/m2/K) | 0.22 | 0.12 * |
| U-value roof (W/m2/K) | 0.18 | 0.09 * |
| U-value ground floor (W/m2/K) | 0.18 | 0.08 * |
| U-value windows/doors (W/m2/K) | 1.2 | 0.8 |
| Air leakage at 50 Pa (1/h) | 1.5 | 0.6 |
| Thermal bridge coefficient (W/m2/K) | 0.1 | 0.03 |
| Ventilation, fan power (kW/m3/s) | 1.5 ** | 1.5 |
| Ventilation, heat recovery (%) | 80 ** | 80 |
| Test Condition | KPI 2, Included Life Cycle Stages | Selected Robust Design |
|---|---|---|
| T1 | Operational energy use (B6) | D2 |
| T2 | Building material production and replacement emissions (A1–A3, B4) | D4 |
Disclaimer/Publisher’s Note: The statements, opinions and data contained in all publications are solely those of the individual author(s) and contributor(s) and not of MDPI and/or the editor(s). MDPI and/or the editor(s) disclaim responsibility for any injury to people or property resulting from any ideas, methods, instructions or products referred to in the content. |
© 2024 by the authors. Licensee MDPI, Basel, Switzerland. This article is an open access article distributed under the terms and conditions of the Creative Commons Attribution (CC BY) license (https://creativecommons.org/licenses/by/4.0/).
Share and Cite
Moschetti, R.; Homaei, S. Robustness-Based Evaluation of GHG Emissions and Energy Use at Neighborhood Level. Energies 2024, 17, 6210. https://doi.org/10.3390/en17236210
Moschetti R, Homaei S. Robustness-Based Evaluation of GHG Emissions and Energy Use at Neighborhood Level. Energies. 2024; 17(23):6210. https://doi.org/10.3390/en17236210
Chicago/Turabian StyleMoschetti, Roberta, and Shabnam Homaei. 2024. "Robustness-Based Evaluation of GHG Emissions and Energy Use at Neighborhood Level" Energies 17, no. 23: 6210. https://doi.org/10.3390/en17236210
APA StyleMoschetti, R., & Homaei, S. (2024). Robustness-Based Evaluation of GHG Emissions and Energy Use at Neighborhood Level. Energies, 17(23), 6210. https://doi.org/10.3390/en17236210


