1. Introduction
A household is energy-poor if it has difficulties meeting its energy needs due to low income or if the condition of the apartment or house does not allow for essential comfort and warmth [
1]. Energy needs include all activities using heat and electricity necessary to maintain a decent standard of living, including heating the apartment, heating water, lighting, preparing meals, and using basic electronics and household appliances [
2]. If the cost of meeting energy needs is so high that household members face a dilemma of whether to reduce these needs or save at the expense of other goods, e.g., food, medicines, or education, energy poverty occurs [
3].
The article aimed to create an original multidimensional index of the energy poverty of households in Poland. The specific aim was to check whether this indicator correlates with other variables describing households in Poland.
Energy poverty is a multidimensional concept that is not easy to define using a single indicator. The problem of the cross-sectional nature of this phenomenon translates into several challenges in measuring it and developing indicators and assessment methods. For this study, the authors propose building their indicator for a single household as a national (not local) indicator to capture the dimension of this phenomenon on a national scale because the surveyed population is a sample based on Statistics Poland data. The effective measurement of energy poverty is one of the keys to fully understanding the scope of the problem, enabling the design of more effective local policies based on reliable data. The selection of indicators is crucial for correctly identifying the energy poor for appropriate contact with them, for understanding their needs, and for providing various forms of support.
The issues discussed in this article are essential for several reasons. The problem of energy poverty is significant in economics, energy security, social security, and even health issues for people affected by energy poverty [
4]. A novelty in the research conducted by the authors is a synthetic energy poverty index for households in Poland, which may be an alternative to previously used measures. Another critical element is to propose new variables that have not been previously discussed in the literature on the subject, i.e., the use of renewable energy sources by households, economical energy management, concerns about energy security, building characteristics, thermal modernization, or replacement of the heat source.
Widespread energy poverty worldwide significantly challenges the global energy system [
5]. It is a problem related to the income situation, inadequate quality of houses, and energy prices. Energy poverty is defined in Regulation (EU) 2023/955 of the European Parliament and of the Council of 10 May 2023 establishing a Social Climate Fund and amending Regulation (EU) 2021/1060 as “a household’s lack of access to essential energy services that underpin a decent standard of living and health, including adequate warmth, cooling, lighting, and energy to power appliances, in the relevant national context, existing social policy and other relevant policies” [
6]. Bouzarovski [
7] stated that energy poverty is considered to be the inability to provide an adequate level of energy services in a household. According to Boardman [
8], it is the difficulties that households encounter in maintaining the appropriate temperature at home and using other essential energy services in their homes. It is the lack of sufficient choice in accessing adequate, affordable, reliable, high-quality, safe, and environmentally friendly energy services [
9,
10]. Insufficient access to energy contributes to the limitation of basic activities carried out in households, such as cooking or heating. In addition, it contributes to the deprivation of access to appropriate information, healthcare, or the level of education. Well-functioning technologies must be used for power supply, alleviating energy poverty and increasing the efficiency of energy systems [
11]. These technologies should also not negatively affect the environment, and their use should not be associated with excessive exploitation of available resources. Such an approach, in the context of the occurring climate change, is fundamental [
12].
Depending on the level of development of a country, the causes of energy poverty may vary. Developed countries are characterized by high energy costs [
13,
14,
15], while developing countries face a lack of access to modern energy [
16,
17]. Three causes cause energy poverty [
18], namely technical and economic issues, as well as those related to attitudes toward effective and proper energy use. Energy poverty, which is expressed, among others, by the underheating of rooms and, as a result, the development of harmful microorganisms, results in a greater likelihood of respiratory diseases, allergies (in the case of too humid and moldy apartments), hormonal disorders, disorders of the circulatory system, and the deterioration of mental well-being [
19,
20,
21,
22]. Reducing or completely solving the problem of energy poverty can significantly contribute to improving the quality of life of citizens, increasing economic activity, and reducing healthcare expenditure. Over 41 million people in the European Union are estimated to experience energy poverty [
23]. Energy poverty also affects life satisfaction and the environment [
24]. Residential energy consumption improves households’ quality of life through lighting, cooking, heating, and cooling [
25]. However, increasing energy consumption may conflict with the need to reduce carbon dioxide levels, so using renewable energy sources may be an excellent solution to this problem.
Studies that measured the level of energy poverty concerned individual countries [
26] and the entire EU [
27]. In 1991, the definition of energy poverty was presented by Boardman [
8], who stated that “energy poverty occurs when a household does not receive adequate energy services for 10% of its income”. The definition adopted for national use by Great Britain—a precursor in research on energy poverty—was based on this definition. The 10% measure in research on energy poverty was used by, among others, Heindl and Schüssler [
28], Phimister et al. [
29], Okushima [
30], and Pachauri et al. [
31]. In Poland, the first nationwide research on energy poverty based on the British absolute definition of “10% of income” was conducted by Kurowski [
32].
Hills, in his report [
33] commissioned by the British Department of Energy and Cli-mate Change (DECC), defined energy poverty as follows: “Households are considered energy poor if their energy costs are above the median cost for all households, and if they incurred this amount, the remaining disposable income would be below the official poverty line”. This report contributed significantly to the change in the measurement of energy poverty in the UK.
One measure of energy poverty comprises subjective indicators based on respondents’ opinions, interpretations, points of view, and judgments. They are most often constructed based on the answers provided by household members to questions included in a survey conducted by researchers (e.g., is the apartment warm enough in winter?). Subjective variables were used by, among others, Gordon et al. [
34], Healy [
35], Petrova et al. [
36], and Thomson and Snell [
27].
The latest research on energy poverty indicates a great interest of researchers in this phenomenon worldwide. In recent years, analyses and measurements using various types of multidimensional energy poverty indexes have been performed, among others, in Latin American countries [
37], India [
38], Colombia [
39], Turkey [
40], and, in particular, in China [
41,
42,
43,
44]. Energy poverty can be measured in many ways [
45,
46]. This article presents various measures of energy poverty. Some are based on measuring temperature, expenses, or the consensual approach (a continuation of the method initiated by the leading researcher of poverty and material deprivation, Peter Townsend). The second group includes objective and subjective measures of energy poverty. Subjective variables are increasingly used in research on the degree to which needs are met, including the need to stay in a warm home. Objective variables include, for example, the lack of central heating. As Thomson et al. [
47] argue, using alternative data and creating more valuable indexes to measure energy poverty are essential, especially in the context of the diversity of household needs in different countries.
According to the European Committee of the Regions [
48], the leading indicators of energy poverty are low absolute energy consumption, arrears in paying utility bills, spending a large part of income on energy, and the inability to maintain the appropriate temperature in the home.
Researchers also present more complex measures of energy poverty, designed as a compromise between the simplicity of one-dimensional indicators and the need to consider the multidimensional nature of the problem of energy poverty. They attempt to overcome the shortcomings of one-dimensional indicators and provide a result that condenses information into single values that are easy to interpret [
49].
Energy poverty is also measured using the Bossert, Chakravarty, and D’Ambrosio poverty measures [
50]. Based on this methodology, many studies measuring energy poverty according to a multidimensional framework have been developed. Nussbaumer et al. [
51] developed the Multidimensional Energy Poverty Index (MEPI), which considers the prevalence and intensity of energy poverty and provides a new tool to support policymaking.
Alkire and Foster [
52] propose creating deprivation matrices at one household level. The energy poverty indicator proposed by Alkire and Foster takes into account five dimensions of energy deprivation—two objective indicators of “high costs, low income” and “high share of energy expenditure in income”, as well as three subjective indicators of “inability to maintain adequate home temperatures”, “leaking roofs or damp”, and “difficulty paying utility bills”. Households that experience at least two forms of deprivation are considered poor. Using the methodology proposed by Alkire and Foster, based on the Household Budget Survey, a multidimensional energy poverty index was developed for Poland [
53]. Szamrej-Baran [
54] also used a multifaceted approach to study energy poverty in Poland.
Another approach was presented by Wang et al. [
55], who in their research examined energy poverty in households in China using a multidimensional energy poverty index, taking into account, among others, electricity consumption, the year of construction of the building, the ability to pay utility bills, or having a computer. The Synthetic Multidimensional Energy Poverty Index was presented by Kryk and Guzowska [
56], who used five diagnostic criteria to measure energy poverty, divided into two groups—objective variables (electricity prices for households, gas prices for households, final energy consumption in households per capita) and subjective variables (the percentage of people who are unable to provide adequate home heating due to poverty and the rate of people living in apartments with a leaking roof or damp walls, floors, or foundations).
2. Materials and Methods
The research used the CAWI (computer-assisted web interview) method. The study was conducted on a nationwide representative (in terms of gender, age, size of place of residence, and education) sample of Poles. The sample consisted of 1112 adult people who took part in the study. Non-random quota sampling was used. The characteristics of the group of surveyed households are presented in
Table 1.
In response to the research questions, the non-parametric Spearman’s rank correlation coefficient and the non-parametric Kruskal–Wallis H and Mann–Whitney U tests of differences were selected. These methods were chosen due to the lack of normality in the distribution of the dependent variable of the energy poverty index and the lack of equality of the compared groups. The Kruskal–Wallis and Mann–Whitney difference tests were additionally supported by the effect size index, epsilon-squared (ε2), and the glass index (rg). An agglomeration analysis and Yule’s phi (φ) coefficients created the energy poverty index. The analyses were performed in Statistica 13.3. and an alpha level = 0.05 was used for all results.
The step-by-step construction of the energy poverty indicator for a single household is presented as follows:
Step 1—selection of variables for building the index;
Step 2—conducting a survey;
Step 3—analysis of agglomeration using the single-link method and summary of the agglomeration assessment;
Step 4—energy poverty index items inter-correlation analysis;
Step 5—construction of the index by summing the responses to the survey questions.
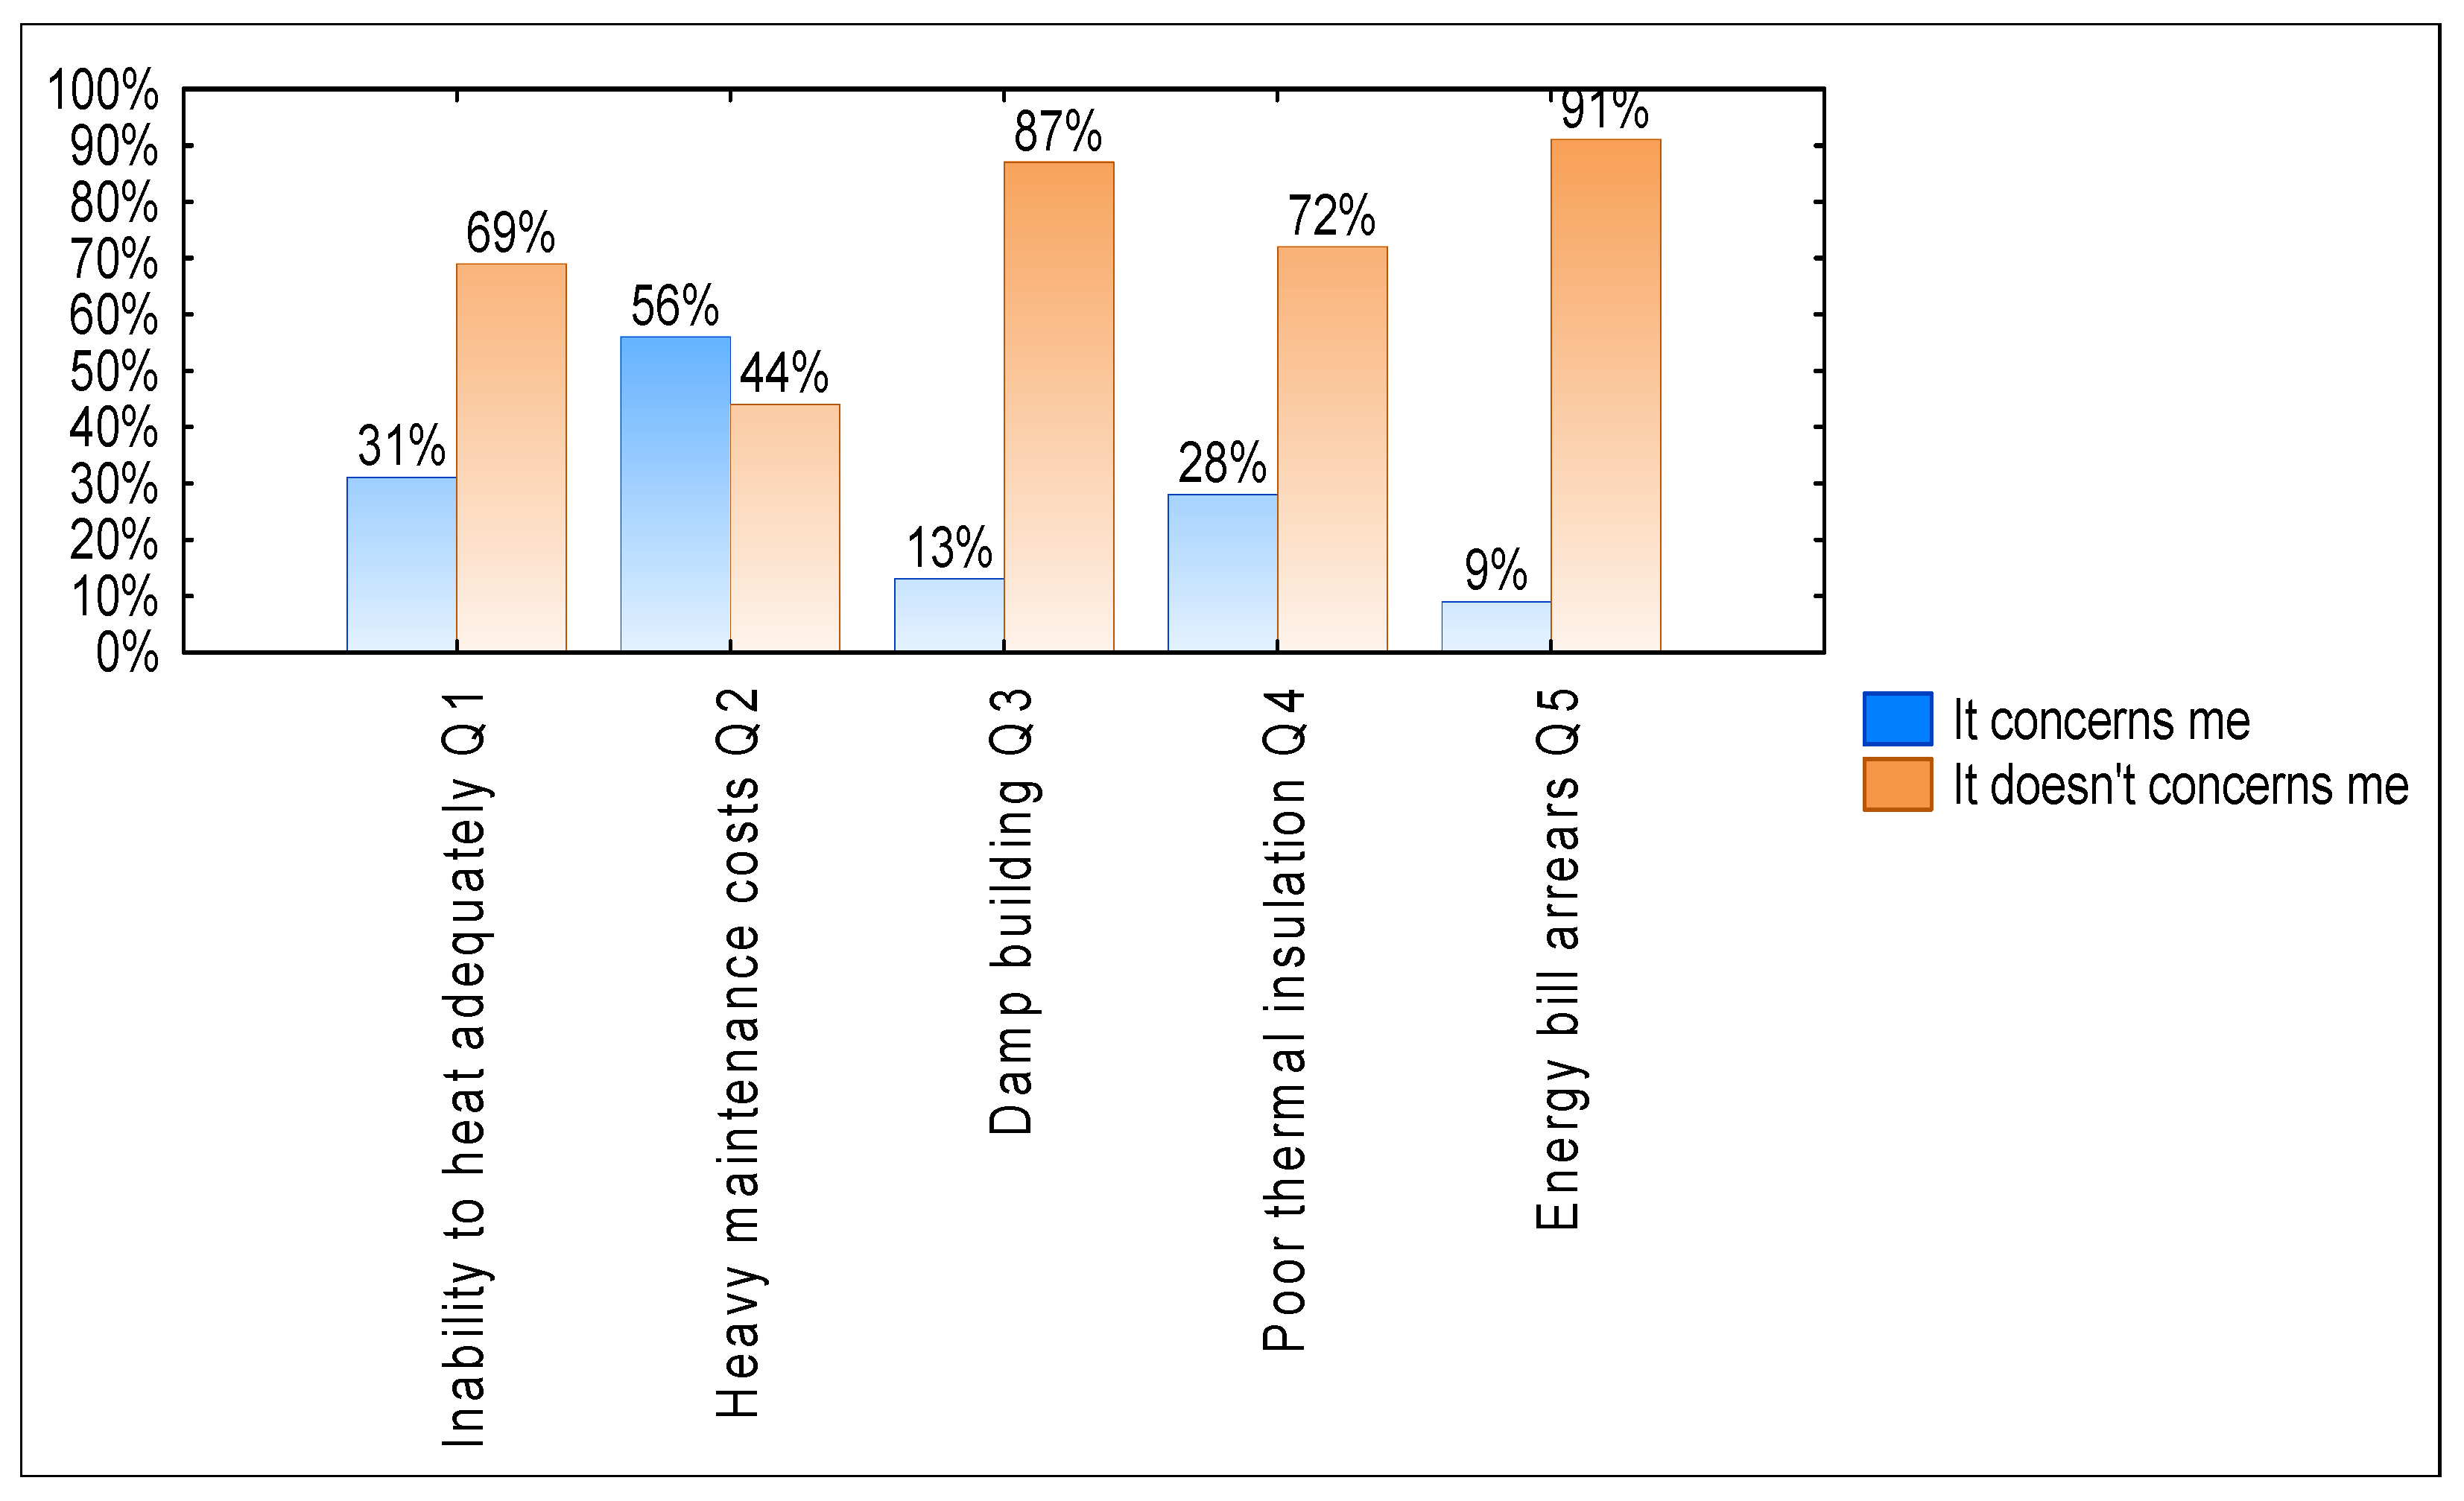
The energy poverty index was created using the following five questions about household deprivations:
Q1—inability to heat adequately (insufficient thermal comfort);
Q2—a heavy burden on the household budget with the costs of maintaining the apartment;
Q3—a building with a leaking roof or damp walls, floors, foundations, rotting windows or floors;
Q4—poor quality of thermal insulation;
Q5—energy bills arrears.
The distribution of respondents’ answers to the indicated questions is presented in
Figure 1.
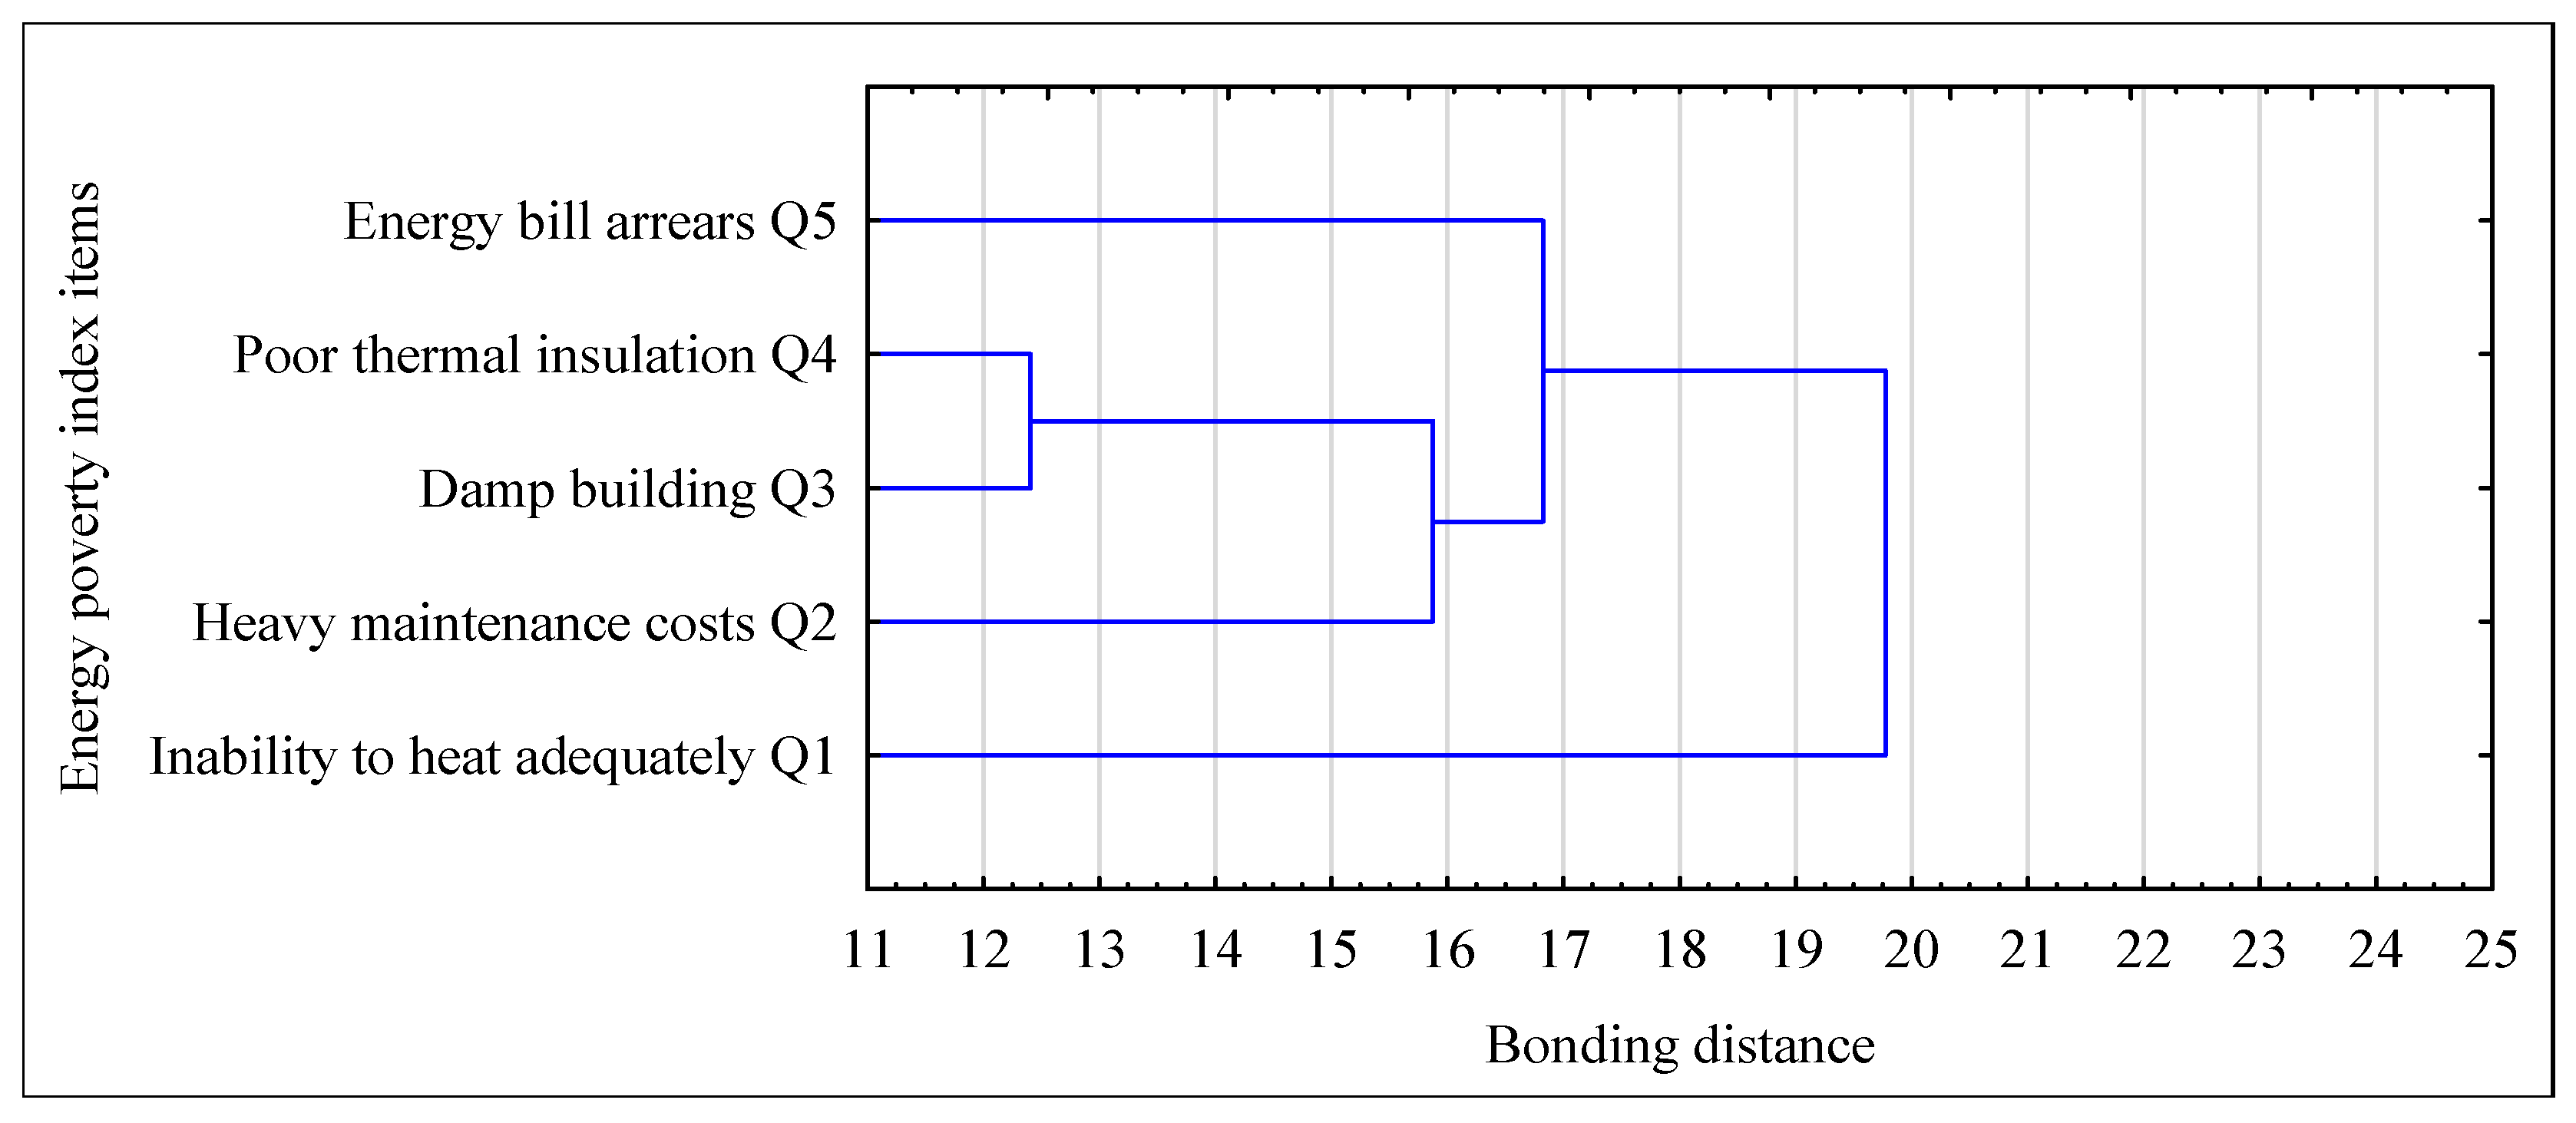
The analysis of agglomeration using the single-link method confirmed the possibility of creating a general index using five survey questions. A summary of the agglomeration assessment is presented in
Figure 2.
The items forming the energy poverty index were also assessed for intercorrelation.
Table 2 shows that these questions were significantly and positively correlated, confirming their combination’s correctness.
The index construction method was based on the methodology of Alkire and Foster [
52] and Sokołowski et al. [
53]. Each questionnaire question was assigned a value of one if the household was poor in a given dimension and zero otherwise. The energy poverty index was created by summing the responses of the five survey questions described above. The scores ranged from 0 to 5 points, with low scores suggesting low energy poverty and high values indicating high energy poverty.
Figure 3 shows the results of the energy poverty index in a histogram.
Figure 3 shows a skewed distribution of results. The range of values suggests a right-skewed data distribution, suggesting a preponderance of low minimum scores over high maximum values.
3. Results
The created energy poverty index was assessed for relationships with selected variables describing the socio-economic characteristics of households.
Table 3 presents the results of Spearman’s correlation of the energy poverty index with variables describing the place of residence, level of education, income, quality of life, financial situation, number of people, and children in the household.
The results showed that the number of children under 14 and the number of people in the household did not significantly correlate with the energy poverty index. Significant, negative, and weak correlations can be observed between the energy poverty index and the place of residence and income. As income increases and the size of the place of residence increases, the energy poverty index decreases. In this group of variables, education did not correlate significantly with the energy poverty index. Similarly significant, negative, and moderate relationships were noted between the energy poverty index and the quality of life and financial situation. The higher the results of the quality of life and financial situation, the lower the values of the energy poverty index. Variables related to the household, such as loan burden, building type, building status, and the use of renewable energy sources for heating, were also analyzed. The Kruskal–Wallis H and Mann–Whitney U difference tests were used in this assessment.
The distribution of respondents’ answers to questions about the building they live in is presented in
Table 4.
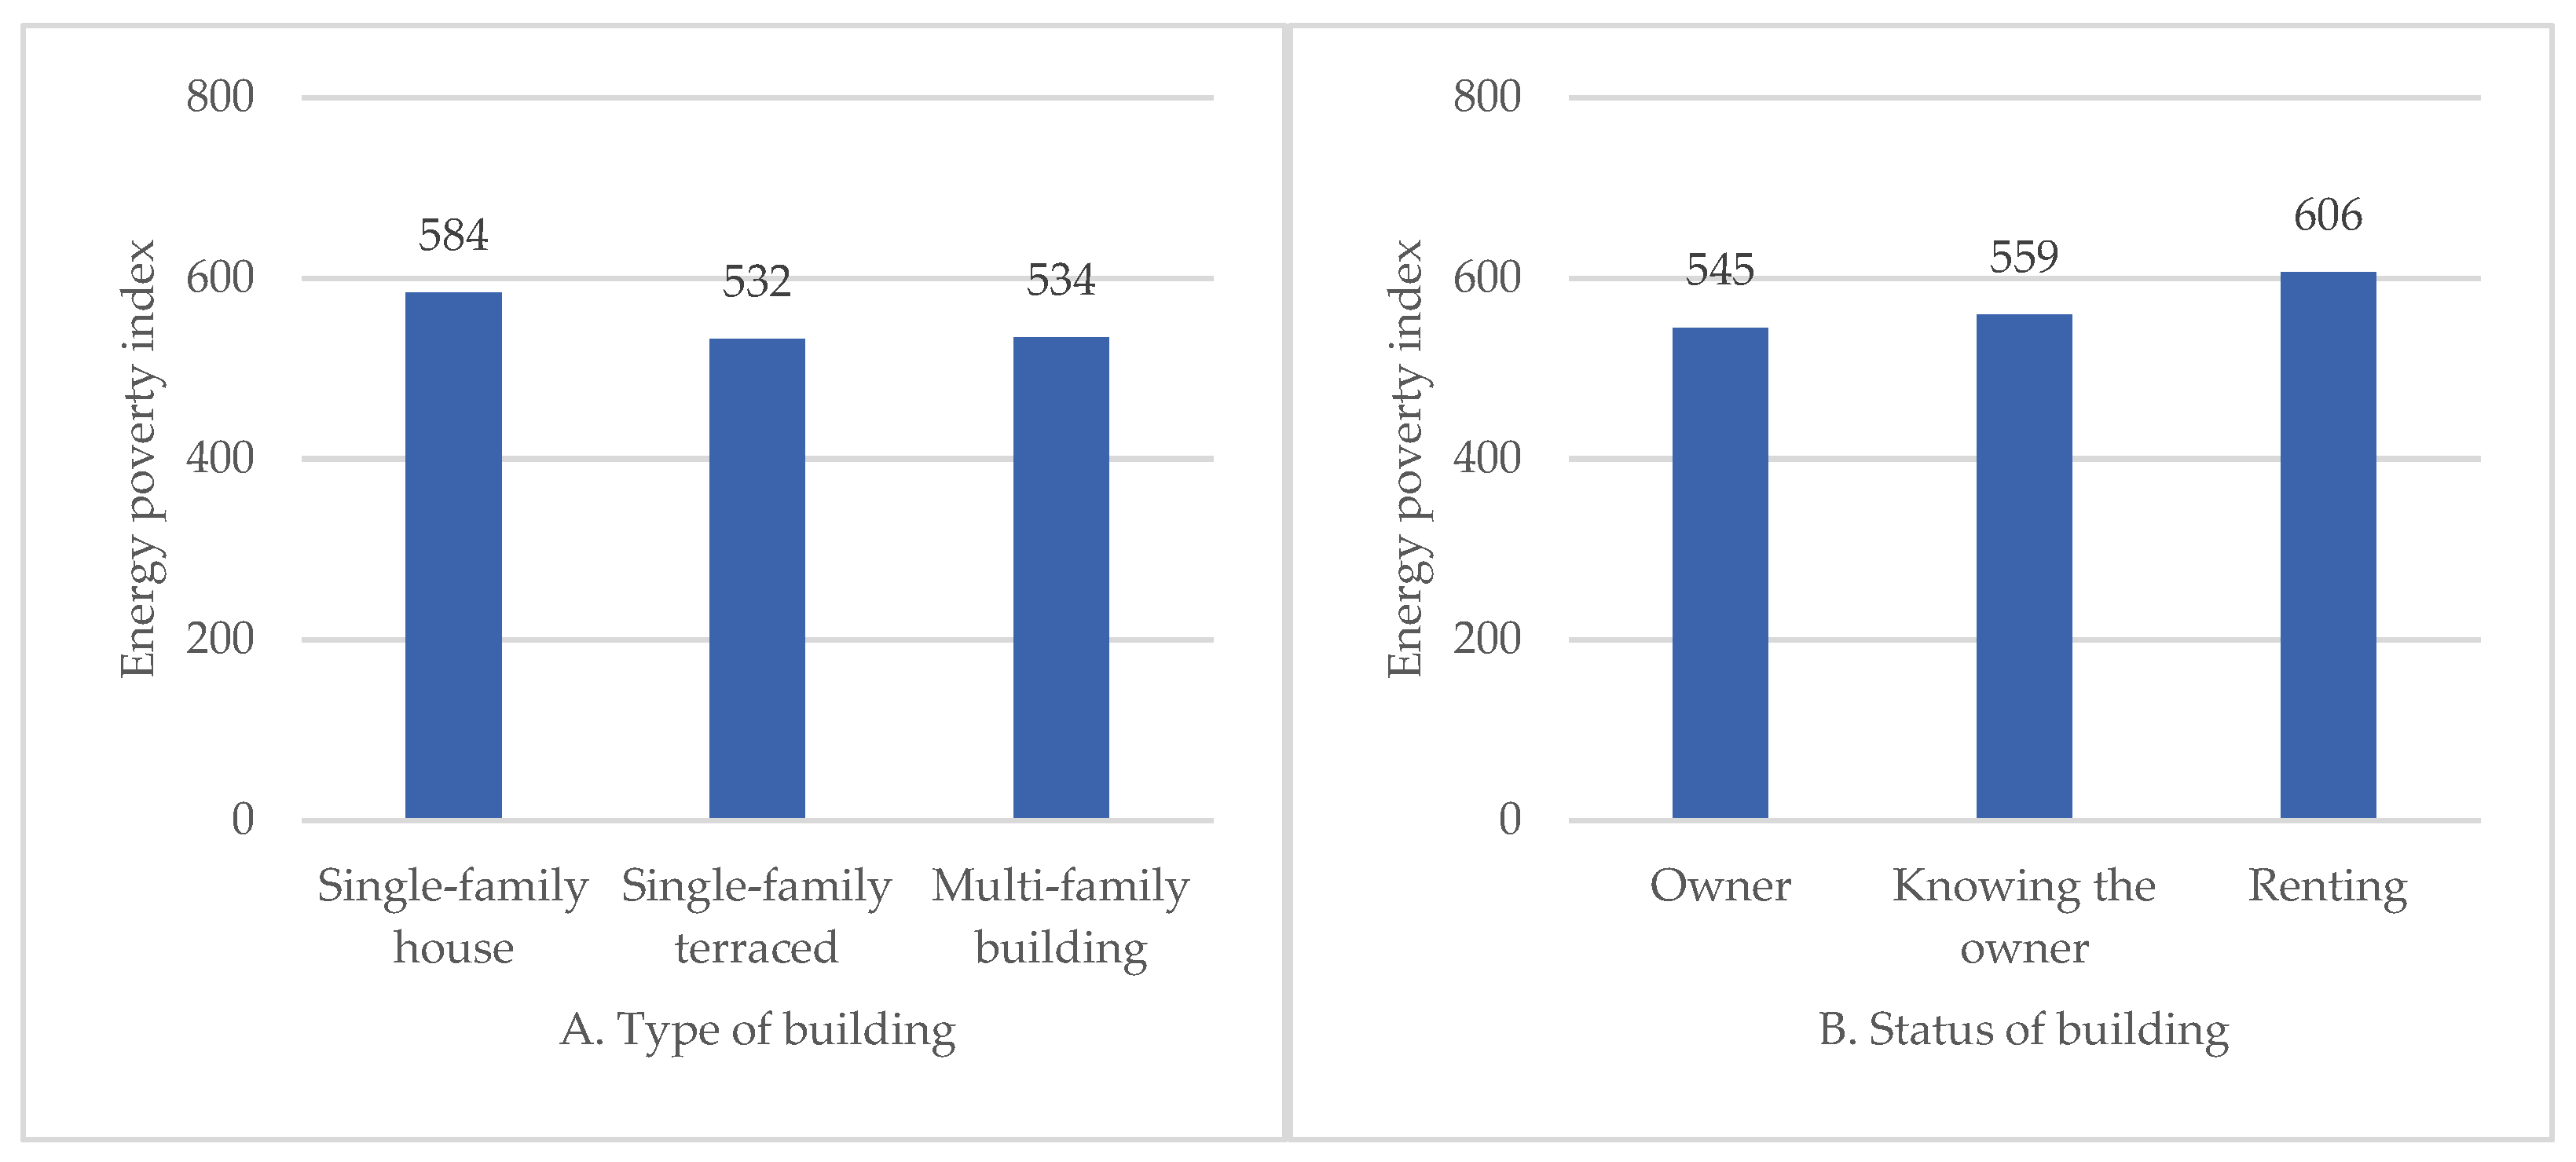
The analysis showed that people living in different types of buildings had significantly different energy poverty indexes,
χ2H(2) = 7.10;
p = 0.029,
ε2 = 0.01. The effect was weak. Post hoc evaluation showed that those living in single-family detached houses (
Mrank = 584.04;
Me = 1.00) achieved significantly higher poverty index results than people living in multi-family buildings (
Mrank = 534.42;
Me = 1.00). People living in terraced houses (
Mrank = 532.36;
Me = 1.00) did not differ significantly from the other groups. The results also showed that the inhabited building status did not significantly differentiate the energy poverty index,
χ2H(2) = 4.65;
p = 0.098,
ε2 = 0.00. The effect was very weak. People who were owners (
Mrank = 545.17;
Me = 1.00), had an owner in their family (
Mrank = 559.39;
Me = 1.00), or rented (
Mrank = 606.43;
Me = 1.00) achieved similar values of the energy poverty index.
Figure 4 shows the values collected in these analyses.
The burden of construction and housing loans on household budgets in Poland in the period of 2015–2021 was very high, significantly affecting consumers’ financial capabilities. Because Polish households increasingly incur bank liabilities, respondents were asked about the burden on their household budget with the repayment of loans or credits and about having a mortgage loan. The distribution of respondents’ answers to questions about credit charges is presented in
Table 5.
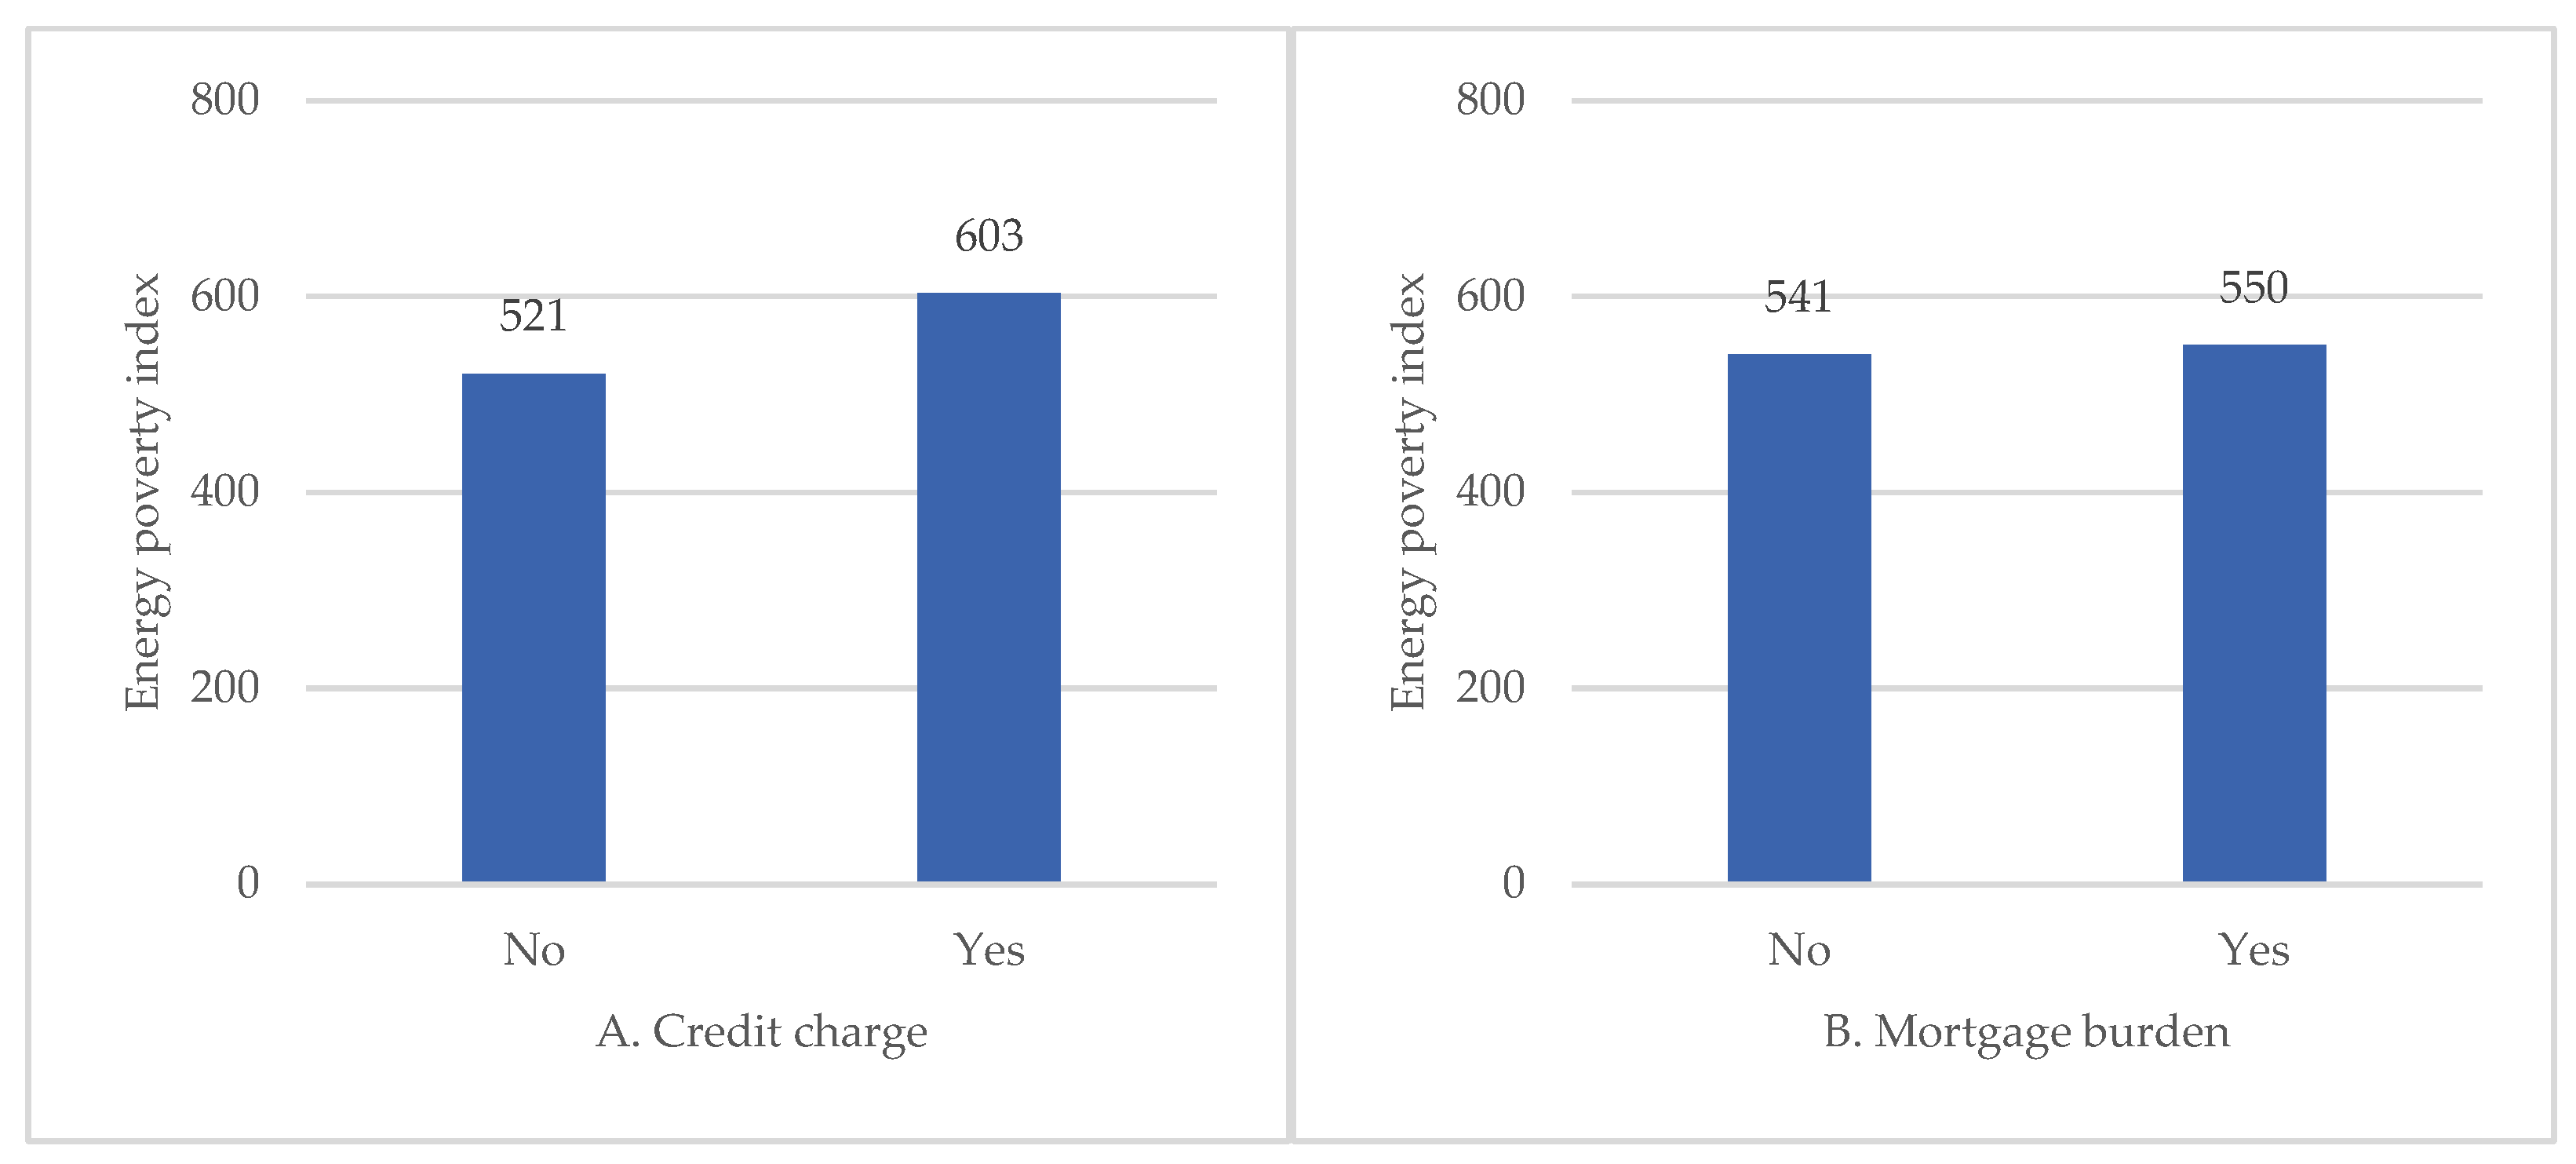
The analysis of differences showed that people declaring a credit charge (
Mrank = 603.46;
Me = 1.00) compared to people without such a charge (
Mrank = 521.20;
Me = 1.00) were characterized by significantly higher energy poverty index results,
z = −3.73,
p < 0.001,
rg = 0.15. This effect was weak. Interestingly, people indicating they had a mortgage loan (
Mrank = 550.38;
Me = 1.00) compared to people without such a loan (
Mrank = 540.86;
Me = 1.00) did not show significant differences in the level of the energy poverty index,
z = −0.33;
p = 0.745,
rg = 0.02. This effect was very weak.
Figure 5 shows the values obtained in this analysis.
Due to subsidies, more and more households are choosing home micro-energy power plants, mainly installations using solar radiation. Being an energy prosumer and saving energy are examples of pro-ecological consumer behavior. The distribution of respondents’ answers to questions about energy use in households is presented in
Table 6.
Those indicating the use of renewable energy sources for heating rooms and water (
Mrank = 546.63;
Me = 1.00) compared to respondents who did not use such sources (
Mrank = 558.27;
Me = 1.00) did not differ significantly in terms of the energy poverty index,
z = 0.43;
p = 0.665,
rg = 0.02. This effect was very weak. People declaring the efficient use of energy in their households (
Mrank = 562.78;
Me = 1.00) compared to people without such a declaration (
Mrank = 470.90;
Me = 1.00) turned out to achieve significantly higher energy poverty results,
z = −2.41;
p = 0.016,
rg = 0.17. This effect was weak but stronger than using renewable energy sources. The values obtained in this analysis are presented in
Figure 6.
The pandemic [
57], inflation, political turmoil, and the war in Ukraine [
58,
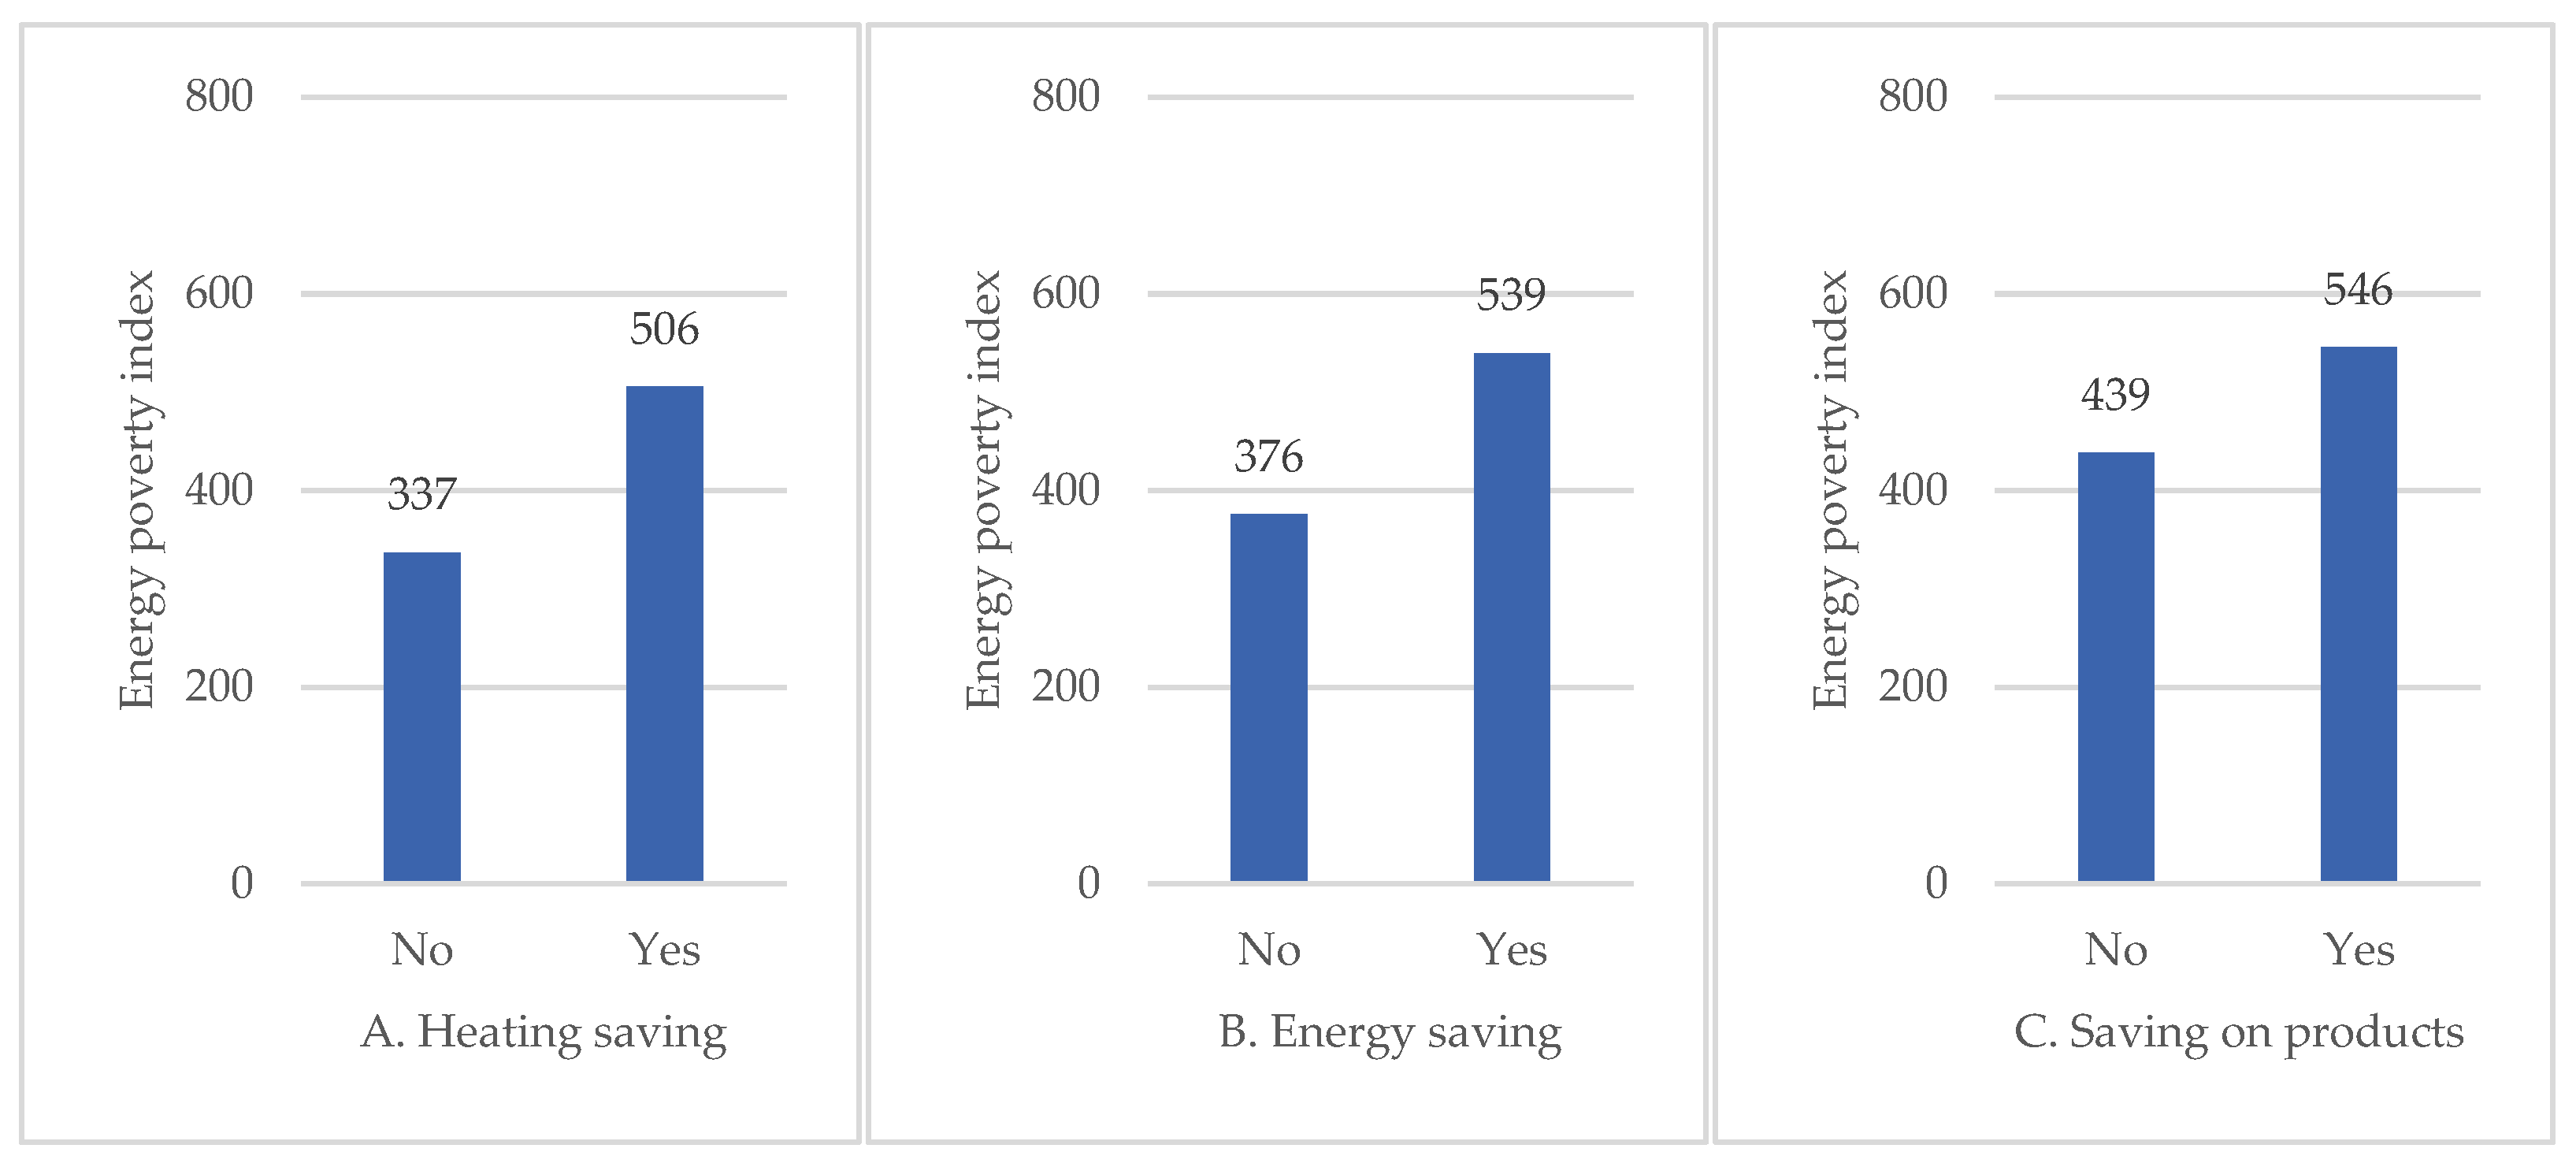
59] led to an energy crisis, as electricity prices increased significantly and there were some problems with the availability of specific fuels. Respondents were asked about their opinion on energy saving in connection with the increase in energy prices in the market. The distribution of respondents’ answers to questions about energy savings is presented in
Table 7.
An additional analysis area included the risk of poverty and declarations related to energy management related to price increases. Respondents who declared saving money on heating their apartment (
Mrank = 505.69;
Me = 1.00) compared to people without such a declaration (
Mrank = 337.14;
Me = 0.00) were characterized by significantly higher energy poverty index scores,
z = −8.62;
p < 0.001,
rg = 0.37. Similarly, people indicating energy saving in connection with prices (
Mrank = 539.47;
Me = 1.00) achieved significantly higher poverty risk values than respondents who did not indicate the need to save energy (
Mrank = 376.24;
Me = 0.00),
z = −4.96;
p < 0.001,
rg = 0.31. Finally, people who indicated their intention to save and supply their households with energy-saving light bulbs and appliances (
Mrank = 545.76;
Me = 1.00) compared to respondents without such a declaration (
Mrank = 438.67;
Me = 0.00) achieved significantly higher energy poverty index scores,
z = −2.32;
p = 0.020,
rg = 0.20. The effects were moderate for declarations of saving energy and heating, while for declarations of saving on light bulbs and appliances, the effect was weak.
Figure 7 shows the results obtained in this analysis.
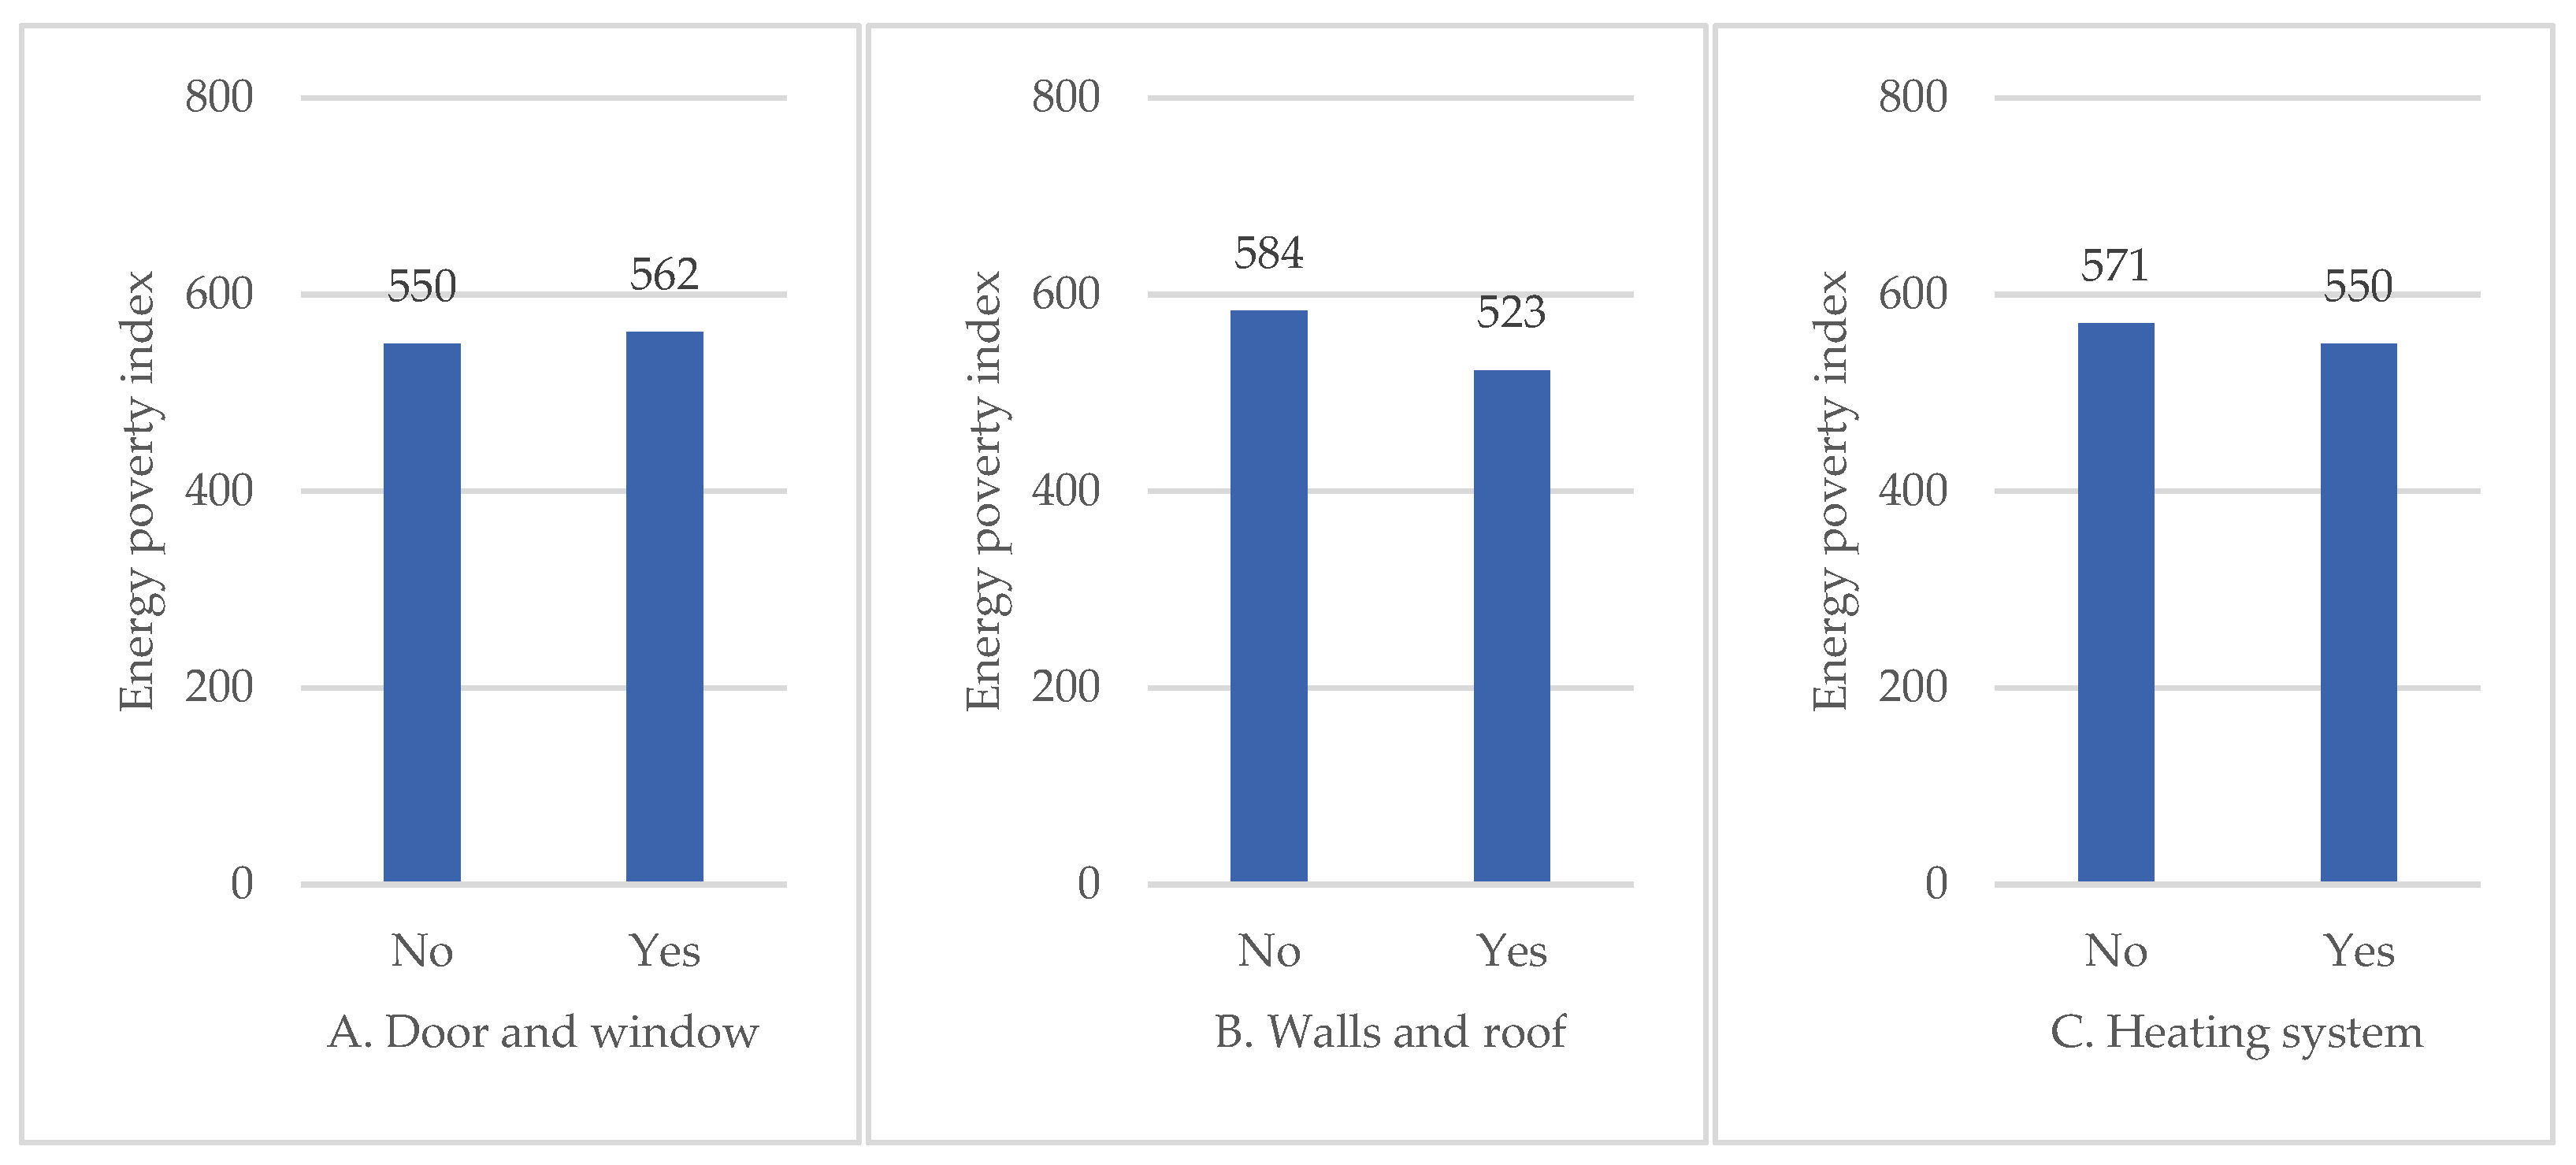
The thermal modernization of residential buildings is a response to energy poverty resulting from the poor technical condition of the building. It protects the building against heat loss and reduces energy demand and consumption [
1]. The distribution of respondents’ answers to questions regarding the thermal modernization of the building is presented in
Table 8.
The survey asked several questions related to the thermal modernization of buildings over the last ten years. People indicating that they had recently replaced doors or windows (
Mrank = 561.81;
Me = 1.00) and the group of respondents not indicating any replacement (
Mrank = 550.16;
Me = 1.00) did not differ significantly in the energy poverty index,
z = −0.60;
p = 0.547,
rg = 0.02. Similarly, people who replaced (
Mrank = 550.27;
Me = 1.00) and those who did not replace (
Mrank = 571.00;
Me = 1.00) heating systems did not differ in the energy poverty index,
z = 0.99;
p = 0.324,
rg = 0.04. These effects were weak. Significantly higher energy poverty results were achieved by people who indicated that their walls or roof were not insulated (
Mrank = 583.67;
Me = 1.00) compared to people who had such modernization (
Mrank = 523.13;
Me = 1.00),
z = 3.13;
p = 0.002,
rg = 0.11. This effect remained weak, although it was the strongest for the thermal modernization area.
Figure 8 presents the values shown in these comparisons.
4. Discussion
Energy poverty is a problem that affects all European Union member states to varying degrees, including Poland, where depending on the indicator used, from 3% to even 40% of Poles are affected by energy poverty [
60].
Energy poverty affects various social groups and households with different demographic, social, and economic characteristics. The conducted study characterized groups of energy-poor households. Several variables describing the socio-economic characteristics of households were taken into account. The first variable was gender. The research did not show a significant correlation between the energy poverty index and gender. Only single-person households of women and single-person households of men were considered, and no statistically significant differences were found. According to data from Statistics Poland from 2021, approximately 3 million households are run by a woman living alone or a mother caring for someone. Among these households, 350,000, or 12%, experience energy poverty. A total of 80% of women experiencing energy poverty are older women who live alone. For 84% of women in energy poverty, their primary source of income is a pension or other social benefits. The remaining 16% of women earn their living from paid work.
The risk of energy poverty occurs among low-income people who earn their living from unearned sources. The risk of energy poverty is more significant when the energy requirements and needs are greater, e.g., when someone in the household is sick or small children are at home. In the analyzed group of households, the results showed that the number of children under 14 years of age and the number of people in the household did not significantly correlate with the energy poverty index [
61].
Many households do not heat their apartments for financial reasons. Energy poverty often coincides with income poverty, but not always—some families cannot meet their energy needs, even though their income is higher than the poverty threshold. Income, the place of residence, assessment of the quality of life, and assessment of the financial situation are variables that significantly correlate with the energy poverty index. Education did not correlate significantly with the poverty rate. According to the report of the Polish Economic Institute [
60], households that used support for the purchase of photovoltaic panels, a heat pump, thermal modernization of the building, or replacement of the furnace declared that they paid lower energy bills despite the crisis twice as often as others. Therefore, respondents were asked about replacing doors and windows, insulating walls and roofs, and replacing the heating system. Without funds for thermal modernization or the replacement of heat sources, households may pay increasingly higher bills, further deepening the energy poverty crisis.
5. Conclusions
The methodology for measuring energy poverty used in the article allows for determining the number of people affected by this phenomenon and identifying socio-economic groups of households most at risk of energy poverty. The article creates a multidimensional energy poverty index that effectively determines the scale of energy poverty in a single measure. Using this type of indicator increases the chances of including the most excluded social groups in the energy transformation process. The indicator identifies the number of deprivations in one household, enabling the adoption of public policy to respond to different types of deprivation, e.g., housing conditions and high energy costs. The issue of household energy poverty is fundamental not only from the microeconomic point of view, i.e., a single household that may struggle with this problem but also from the macroeconomic perspective—the entire national economy, especially during the Russian military aggression against Ukraine. The conclusions obtained can be a valuable source of knowledge about energy poverty for various groups of decision-makers planning public policy. Solutions related to reducing energy poverty should be implemented systematically, taking into account local conditions and the needs of individual social groups. It is also essential to monitor the effectiveness of the implemented solutions and adapt them to changing conditions. Support should be targeted at high-risk groups, i.e., primarily single older women and people living on social benefits. It should also be taken into account that the problem of energy poverty does not only concern households below the poverty threshold. Support programs should be flexible and adapted to the financial situation of beneficiaries, and the support itself should not be limited only to financing but also include assistance in the technical modernization of buildings.
Plans will include taking into account the heating source used by the household in the construction of the energy poverty index. Furthermore, the index could be expanded to include variables related to the health of people at risk of energy poverty.
In general, it can be assessed that the quantitative methods used can successfully identify the mechanisms of energy poverty, contributing to its complete recognition and providing the basis for taking appropriate actions and decisions to combat this phenomenon. The research carried out is mainly original, both in terms of posing the problem, the research methods used, and the results obtained, and it can be treated as an added value of the work.


 ,
, 


