Abstract
This study investigates the complex interconnections between renewable energy adoption, carbon dioxide (CO2) emissions, and economic factors in 50 countries marked by high rates of coronary heart disease (CHD) between 2000 and 2020. Utilizing a sophisticated two-step system generalized method of moments (GMM) estimator and panel data method, our analysis reveals a significant negative impact of renewable energy on greenhouse gas emissions, emphasizing the role of sustainable energy sources in mitigating environmental and quality of life degradation. Additionally, our findings support the existence of the environmental Kuznets curve (EKC), demonstrating an inverted U-shaped relationship between gross domestic product (GDP) per capita and CO2 emissions. In line with nascent studies, the EKC for CO2 emissions suggests that as a country’s GDP per capita increases, the CO2 emissions initially rise but eventually decline after reaching a certain level of economic development, forming an inverted U-shaped relationship. Specifically, nations facing high cardiovascular heart disease mortality rates display an important link between renewable energy integration and improved environmental quality. These insights underscore the urgency for countries to transition rapidly to green energy, advocating for policies that promote renewable technologies through partnerships between the public, private sector, and government entities. Furthermore, the study emphasizes the necessity of innovative structural reforms in developing countries to stimulate economic growth beyond the EKC turning point, ensuring sustainable development while curbing their carbon footprint resulting from economic activities. Future research should explore the broader global contexts, considering variables like social capital and globalization to inform targeted policies aimed at safeguarding public health and the environment.
1. Introduction
The global CO2 emissions level has increased by more than 50% kilotons since 1990. Cross-country research shows that an increase in CO2 emissions has an adverse effect on a wide range of socio-economic and life quality outcomes [1], longevity [2], and infant mortality [3]. Numerous health impacts may arise from exposure to high CO2 emissions, including symptoms such as headaches, dizziness, restlessness, sensations of tingling (or pins and needles), respiratory difficulties, perspiration, fatigue, heightened heart rate, elevated blood pressure, and prevalence of ischemic heart disease. The yearly increase in mortality due to ambient air pollution in Europe stands at 790,000, with the largest health effects observed through cardiovascular diseases (CVDs). While air pollution as a trigger for respiratory diseases like asthma, chronic obstructive pulmonary disease (COPD), and lung cancer is intuitive, its significant role in cardiovascular disease is now also well established. Some of the most relevant pathways linking air pollution to cardiovascular morbidity and mortality due to both long- and short-term exposure (even day-to-day fluctuations) are the induction of oxidative stress, systemic inflammation, endothelial dysfunction, atherothrombosis, and arrhythmogenesis [4]. The yearly increase in mortality due to ambient air pollution consequently also results in a reduction in the average life expectancy on the European continent by approximately 2.2 years annually [5]. For example, a recent study by Liu et al. [6] (p. 12) documents that “for a 1 mg/m3 increase in average carbon monoxide concentrations on the present day and previous day … observed significant increments in mortality of 1.12% from cardiovascular disease, 1.75% from coronary heart disease, and 0.88% from stroke”.
Hence, it is imperative to ascertain the efficacy of CO2 emission-reduction variables in mitigating the impact of CO2 emissions as it relates to heart disease mortality rates. One variable that has been explored in the context of the growth-emissions nexus is renewable energy consumption. While ample studies show that renewable energy improves economic growth and decreases CO2 emissions across different geographical regions and income groups [7,8], renewable energy’s effect on CO2 emissions in countries with high death rates from heart disease has specifically not been explored.
As a key facet of sustainable energy development strategies [9], ensuring universal and equitable access to energy resources can play an important role in elevating living, health, and education standards. Energy accessibility stands as a crucial determinant of overall well-being, often resulting in improved access to essential resources like food and clean water, job creation, diminished health-related burdens, and enhanced livelihoods. Consequently, a transition toward a green economy based on renewable energy sources is an imperative step in both enhancing the quality of life for all beings and safeguarding the planet for future generations. Renewable energy bolsters energy security by harnessing domestic energy resources, aids in combatting global warming by reducing pollution, and safeguards human health from the detrimental effects of air pollution. Considerable attention has been devoted to renewable energy’s influence on overall economic activity; however, the relationship to CO2 emissions in the context of human development calls for more in-depth understanding. In this context, renewable energy holds the potential to advance the achievement of sustainable development objectives, particularly goal 3, which focuses on good health and well-being. This potential is underpinned by three key factors: Firstly, renewable energy stands out for its minimal CO2 emissions, making it a formidable ally in the fight against climate change, which has adverse effects on human health [10]. Secondly, unlike certain traditional energy sources like coal and traditional biomass, renewable energy has a minimal local environmental footprint. This aspect aligns with the objective of promoting a healthy life by mitigating local air pollution and offering alternatives to indoor air pollution sources. Lastly, energy, when harnessed from renewable sources, has the capacity to enhance human health capital by fostering gender equality and advancing educational opportunities [11,12].
The aim of this study is to contribute to existing research on energy emissions research by focusing on a specific sample that has been selected based on human health outcomes. We do so as emissions are shown to have a direct negative impact on human health capital. Indeed, we extend this research by using data from 50 countries with the highest death rates from coronary heart disease or ischemic heart disease. By focusing on countries with high CHD rates, we sought to examine the potential role of renewable energy adoption in reducing CO2 emissions as it relates to improving environmental quality—a factor closely tied to public health outcomes. In addition, this analysis allows us to test the environmental Kuznets curve (EKC) hypothesis in a setting where environmental degradation may be closely tied to health outcomes, thus adding a novel dimension to the current understanding of the EKC hypothesis.
Globally, approximately 1 in 12 individuals is affected by a heart or circulatory disease. The number of people living with these conditions has risen significantly over the decades, from an estimated 305 million in 1990 to 640 million by 2024. CHD is a major global health concern, accounting for nearly one in three deaths worldwide. Thus, an improved understanding of the relationship between renewable energy and CO2 emissions in countries with the highest mortality rates from CVDs may offer novel policy implications. Using a two-step generalized method of moments (GMM) estimator, we find that renewable energy significantly negatively impacts CO2 emissions levels. The rest of the research is structured as follows: Section 2 reviews related empirical studies, Section 3 presents data and empirical strategy, and Section 4 presents the main results. In Section 5, the results of this study are summarized.
2. Literature Review
2.1. Cardiovascular Disease Mortality and CO2 Emissions
The body of empirical research exploring the potential effects of CO2 exposure on human health is growing [13,14,15]. Since cardiovascular diseases (CDVs) are estimated to be the leading cause of death globally [16], particular attention has been directed toward modeling the dynamic nexus of fossil fuel dependence and cardiovascular mortality [17,18,19,20]. The existing literature on this topic has employed multiple approaches to capture the effects of greenhouse gas emissions on cardiovascular health.
Over the last two decades, a group of epidemiological studies examining the link between greenhouse gas emissions and heart attack death rates across different country groups collectively confirmed the positive association between the two. In broad terms, these studies can be classified into those that have tested the effects of short-term [21,22,23] and long-term [24,25,26] pollution exposure on cardiovascular health. Numerous studies investigating the impact of acute air pollution exposure on heart failure employ population-based time-series analysis (temporal variations), while chronic exposure has been studied through the use of data taken from multiple geographic regions (e.g., fixed-site monitors). Both types of studies primarily rely on studying the composition and size of gaseous pollutants and their spatial variations [27,28]. Clearly, fossil fuels are the greatest source of air pollution in urban areas and, thus, tend to represent more severe problems associated with cardiovascular health in these regions. In contrast, the consumption of energy from renewable sources significantly reduces CO2 emissions, improving air quality and mitigating the adverse health impacts associated with pollution. Although epidemiological studies yield robust findings, their limitations are extensive. One major limitation is that evidence from epidemiological studies is not always representative of individual exposure levels; in other words, each subject’s exposure to air pollution has been averaged based on citywide pollution measurements.
In their review of the literature, Lee et al. (2014) [29] focused on exploring the association between greenhouse gas concentrations and CVD mortality. They state that these two variables are generally strongly correlated, and the effects tend to be more pronounced among certain groups of the population, for example, people with preexisting heart conditions, children, and older adults. Nevertheless, the lack of research on different types of pollution contributing to cardiovascular mortality, as pointed out by the authors, prevents scholars from establishing clear causal linkages between the two. In the same vein, the adverse cardiovascular effects of air pollution exposure are confirmed by the systematic review by Shah et al. [30] (2013) of almost 200 studies. Since much of the existing literature encompasses developed countries (major US and European cities), the authors conclude that the magnitude of the impact of greenhouse gas emissions on CVD occurrence in developing countries remains understudied.
Potential serious health consequences of CO2 emissions exposure have resulted in the emergence of studies assessing the health risks, particularly cardiopulmonary, of different sources of air pollution. For example, a number of panel studies suggest that motorized or vehicular emissions are significant triggers of heart attack mortality [31,32,33,34]. Similarly, another strand of literature attempts to assess how industrial emissions affect cardiovascular health outcomes [35,36]. These studies and numerous evidence from global assessments report that the rise in heart attack death rates in recent years can also be explained by extreme weather events caused by increased fossil fuel combustion.
2.2. Renewable Energy and CO2 Emissions
In recent years, the role of renewable energy in reducing greenhouse gas emissions has been of particular interest among the scientific community. Previous studies on this topic generally reveal that the deployment of renewable energy tends to reduce carbon dioxide emissions. For example, an empirical study using sample data from 128 countries for the period from 1990 to 2014 and employing a common correlated effects mean group (CCEMG) estimator suggests that a high penetration of renewable energy can curb carbon emissions [37]. Although they vary across regions due to different energy consumption patterns, the results of the study apply to all countries studied, regardless of their economic standing. These findings are in line with studies employing the GMM estimator [38,39,40], FMOLS panel technique [41], and PMG-ARDL [42].
In the same way, the existing literature examining the energy emissions nexus across different country groups has pointed out the prevalence of a statically negative link between the two variables. Using FMOLS and DOLS estimators covering the annual data for G20 nations over the period 1990–2019, Jamil et al. [43] (2022) report that while economic growth, financial development, and remittances are significantly positively correlated with CO2 emissions, renewable energy and emissions were negatively linked. Similarly, investment in renewable and nuclear energy has been found to reduce CO2 emissions in the case of 13 out of 15 OECD economies [44]. In a sample of 25 African economies, Zoundi (2017) [45] finds that renewable energy adoption tends to reduce CO2 emissions with an increasing effect over time. Mirziyoyeva and Salahodjaev [39] (2023), using a two-step system GMM estimator for the top 50 highly globalized economies, documented a negative nexus between carbon emissions and renewables. Further, the study tested the EKC hypothesis, confirming its existence.
Employing the ARDL cointegration technique and VECM model for a sample of BRICS countries over the period from 1970 to 2010, Sebri and Ben-Salha [46] (2014) suggest that an increase in greenhouse gases encourages policymakers to move away from fossil fuels toward renewable energy sources. The study also reveals the presence of two-way causality between economic growth and renewable energy consumption. Moreover, the positive effect of GDP and CO2 per capita was confirmed for the G7 countries in a study by Sadorsky (2009) [47]. This study employing FMOLS estimation for annual data from 1980 to 2005 indicates that the rise in oil prices is negatively related to per capita renewable energy use.
Another strand of literature focused on examining the energy emissions nexus in the context of single countries. For example, the negative link between renewables and gaseous pollutants was verified for China [48], Pakistan [49], Thailand [50], and Ecuador [51].
The review of studies discussed above suggests that renewable energy is instrumental in mitigating CO2 emissions across various samples of countries and regions. At the same time, CO2 emissions are a significant predictor of quality of life and health outcomes (including CVDs). The major gap that exists in nascent research is whether renewable energy can be used as an important policy tool to reduce CO2 emissions in countries with the highest levels of CHD rates.
3. Data
3.1. Sample
We used data from 50 countries with the highest levels of coronary disease death rates for the year 2020. The data on all variables in this study were obtained from the World Bank Development Indicators. The dependent variable is CO2 emissions (CE), which is measured in metric tons per person. The main independent variable is renewable energy consumption (REC). REC is measured in % of the total final energy consumption. The role of renewable energy in CO2 emissions is examined in the context of the EKC framework. Therefore, we include GDP per capita and its squared term to account for a non-linear relationship between economic growth and environmental degradation [52]. GDP per capita (GDP) is measured in constant 2017 international dollars. In addition, several studies include trade openness, urbanization, and government size to model the CO2 emissions across regions [53,54]. Trade openness (TO) is measured as bilateral trade flows as a share of GDP. Urbanization is measured by the growth rate in urban population (%), while government size is measured in the final government consumption expenditure as a share of the GDP. Table 1 reports the descriptive statistics for the main variables used in this study. Regarding CO2 emissions, the data range from 0.03 Central African Republic to 46.42 metric tons per capita in Qatar (see Table 1). Renewable energy consumption is, on average, 24% of the total energy use in our sample, with the Central African Republic reaching 95.08%, followed by Haiti and Zimbabwe.

Table 1.
Summary statistics.
3.2. Econometric Model and Estimation Strategy
We assess the impact of REC on CE in a sample of 50 countries according to the following empirical model (CE is a function of REC and other control variables) (See Figure 1):
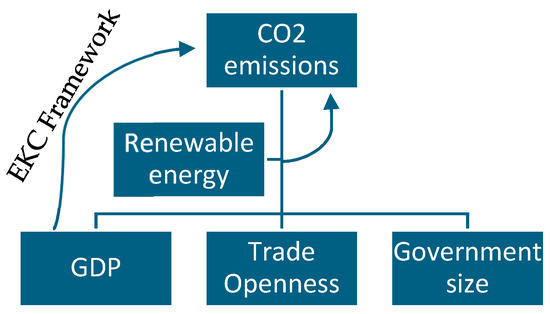
Figure 1.
Visual representation of Equation (1).
In Equation (1), CE, REC, GDP, TO, URB, and GS denote, respectively, CO2 emissions, renewable energy consumption, GDP per capita, trade openness, urbanization, and government size, while i represents countries and t stands for period. We use data covering the years 2000–2020. See Table A1 for the list of countries. We estimate Equation (1) using several empirical methods. Our baseline results are obtained with the aid of an ordinary least squares (OLS) estimator to assess the association between renewable energy consumption and environmental degradation. Next, we used fixed effects and random effects methods. Employing fixed and random effects methods in our empirical analysis offers several distinct advantages over the traditional OLS estimator. Firstly, these panel data techniques account for unobserved heterogeneity among countries, capturing factors that remain constant over time and vary between countries, such as differences in policy regimes, cultural attributes, or geographical characteristics. Fixed effects models are particularly valuable in this regard, as they control for time-invariant variables specific to each country, effectively reducing omitted variable bias. Finally, we use a two-step system GMM estimator, which presents a notable advancement beyond fixed effects regression in our analysis. One key advantage lies in its ability to address endogeneity and omitted variable bias more effectively. While fixed effects models control for time-invariant unobserved heterogeneity, GMM goes a step further by allowing for the inclusion of lagged dependent variables and other instruments to deal with potential endogeneity issues. This is especially relevant in our study, where the relationship between renewable energy consumption and CO2 emissions may be subject to reverse causality or omitted variables that evolve over time. In this vein, numerous studies have used a two-step GMM estimator to model the relationship between renewable energy and CO2 emissions across countries. Moreover, the two-step GMM estimator is particularly efficient in studies where the number of countries (panels) exceeds the number of years. Additionally, the two-step GMM estimator is robust in the face of weak instruments, making it suitable for addressing potential instrument relevance concerns that may arise in panel data settings.
4. Empirical Findings and Discussion
Table 2 presents the data trends for renewable energy consumption and CO2 emissions in 50 countries marked by the highest rates of coronary heart disease and the rest of the world (ROW). Evidently, CO2 emissions rates are considerably higher in CHD countries compared to ROW. At the same time, the renewable energy consumption levels in CHD countries are lagging behind those in ROW, suggesting that renewable energy consumption may be an important variable in mitigating CO2 emissions.
Table 2.
CO2 emissions and renewable energy consumption.
Next, Table 3 reports the preliminary results using OLS regression fixed and random effects estimators. Column 1 displays the bivariate association between RE and CE in our sample. The coefficient is negative and significant, suggesting that carbon emissions are lower in countries with higher rates of renewable energy consumption. For example, a 10 percentage points increase in RE is associated with a 4% decrease in CE. A number of studies document that renewable energy is instrumental in reducing CO2 emissions and improving health [55] as “carbon dioxide can cause cardiovascular disease and other diseases caused by the greenhouse effect” [56] (p. 9). Moreover, this effect is stronger than that documented globally [45] and similar to those reported for OIC member states [57].
Table 3.
Baseline results.
Column II now includes lagged CO2 emissions and GDP per capita to account for the presence of the EKC framework. The results suggest that GDP per capita has an inverted U-shaped relationship with CO2 emissions, while renewable energy retains its negative link with CO2 emissions. The turning point is approximately 67,000 international dollars. The turning point falls within the range reported by existing studies: USD 35,480 for the global sample [58] and USD 115,000 for Europe and Central Asia [59]. We introduce the remaining control variables in column III. Of these variables, only trade openness is positively related to CO2 emissions. Trade openness can lead to higher CO2 emissions by increasing industrial production and transportation activities as countries engage in the exchange of goods, often relying on energy-intensive processes and fossil-fuel-powered logistics. Additionally, trade can drive the relocation of polluting industries to countries with less stringent environmental regulations, amplifying emissions in those regions. These results are in line with other studies for developing countries [60,61]. The results for random and fixed effects estimators are reported in columns IV and V, respectively. Again, the findings suggest that renewable energy consumption mitigates CO2 emissions in countries with high levels of coronary disease death rates. We tested for the presence of multicollinearity in our data using variance inflation factors (VIFs) for the independent variables specified in a linear regression model. At 6, the VIF results are well below the threshold level of 10, suggesting that multicollinearity is not a concern in our study.
To estimate the causal effect of renewable energy on CO2 emissions, we used a two-step system GMM estimator (Table 4). Column I reports the results from estimating Equation (1). We find that lagged CO2 emissions are positively related to the current levels, suggesting inertia in environmental degradation across countries. However, we fail to confirm the presence of the EKC framework. It is evident from our findings that increased adoption of renewable energy is linked to a decrease in the levels of CO2 emissions, and a 1 percentage point increase in renewable energy consumption leads to a 0.2% decrease in CO2 emissions. The AR(2) coefficient in a two-step GMM estimator is a diagnostic tool used to assess whether the errors in the model exhibit second-order autocorrelation. The AR(2) z-statistics suggest that there is no second-order autocorrelation in our model. In addition, Hansen’s p-value shows that our two-step GMM estimators are reliable and efficient. In column II, following nascent studies, we tested the non-linear effects of renewable energy deployment on CO2 emissions [62]. To achieve this goal, we used a quadratic transformation of renewable energy variables. However, the results suggest that renewable energy does not exert a non-linear impact on environmental degradation, proxied by CO2 emissions.
Table 4.
Two-step system GMM results.
5. Conclusions
In this study, we explored the interplay between renewable energy adoption, CO2 emissions, and economic factors in countries with high rates of coronary heart disease (CHD), emphasizing the broader implications for public health and environmental sustainability. Our findings highlight the significant role of renewable energy in reducing greenhouse gas emissions and improving environmental quality, factors closely linked to CHD prevalence. By demonstrating the presence of the environmental Kuznets curve, we further underline how economic development can influence environmental outcomes. These insights not only contribute to understanding the environmental and economic drivers of emissions but also underscore the potential co-benefits of renewable energy policies in alleviating CHD risks, thereby aligning sustainable energy transitions with public health objectives.
These discoveries bear substantial policy implications. Primarily, there is an urgent need for countries to reassess their energy portfolios, prioritizing a swift transition to green energy solutions. Practical tools such as grants, low-interest loans, and tax incentives can incentivize both private entities and households to embrace renewable technologies. Fostering a tripartite partnership involving the public, private sector, and government entities is pivotal. This collaboration ensures widespread awareness of the benefits associated with clean energy and empowers individuals to transition from non-renewable to renewable energy sources.
Furthermore, developing nations must undertake structural transformation reforms to stimulate innovation and increase the GDP per capita beyond the EKC turning point, ensuring sustainable development. Fostering investments in research and development, coupled with the establishment of educational institutions, can increase the number of skilled researchers, fostering innovation and economic growth. Additionally, healthcare policies aimed at improving public health must be coupled with carefully designed strategies to reduce the carbon footprint resulting from economic activities.
Looking forward, prospective studies should broaden the scope to encompass diverse countries where health indicators are affected by air pollution. Furthermore, exploring the influence of variables such as social capital and globalization on the relationship between renewable energy adoption and CO2 emissions can deepen our understanding of this complex interplay. In addition, endogeneity remains a crucial challenge in estimating the relationship between renewable energy and CO2 emissions across countries due to the potential for reverse causality or omitted variable bias. To mitigate this issue, our study employed a two-step system GMM estimator, which is well-suited for panel data with potential endogeneity concerns [63]. This method leverages lagged variables as instruments to account for unobserved heterogeneity and dynamic relationships. While these techniques help address endogeneity, we acknowledge the inherent limitations and suggest that future research explore alternative identification strategies, such as natural experiments or policy interventions, to further validate the causal inference. If continuing this line of inquiry, then it will be possible to inform decisions about more targeted, effective policies to safeguard both public health and the environment on a global scale.
Author Contributions
Conceptualization, A.S.; methodology, R.S.; software, R.S.; validation, A.S. and R.S.; formal analysis, R.S.; investigation, writing—original draft preparation, A.S. and R.S.; writing—review and editing, R.S.; supervision, A.S. All authors have read and agreed to the published version of the manuscript.
Funding
No research funding was received for this work.
Institutional Review Board Statement
Not applicable.
Informed Consent Statement
Not applicable.
Data Availability Statement
Data are available from the sources cited in this manuscript.
Acknowledgments
Raufhon Salahodjaev would like to offer thanks for the feedback obtained during the training «International approaches and best practices of using data in scientific research» supported by the World Bank MUNIS project.
Conflicts of Interest
The authors declare no conflicts of interest.
Appendix A
Table A1.
Renewable energy consumption and CO2 emissions in the top 50 CHD countries for the year 2020.
Table A1.
Renewable energy consumption and CO2 emissions in the top 50 CHD countries for the year 2020.
| Country | CO2 Emission | Renewable Energy Consumption | Country | CO2 Emission | Renewable Energy Consumption |
|---|---|---|---|---|---|
| Afghanistan | 0.22 | 17.58 | Latvia | 3.65 | 43.75 |
| Albania | 1.54 | 44.58 | Morocco | 1.82 | 10.92 |
| Armenia | 2.40 | 8.38 | Moldova | 3.27 | 23.66 |
| Azerbaijan | 3.40 | 1.23 | Montenegro | 4.07 | 39.56 |
| Bulgaria | 4.92 | 21.08 | Mongolia | 6.43 | 3.98 |
| Bahrain | 21.98 | 0 | Oman | 15.64 | 0.05 |
| Belarus | 5.84 | 8.39 | Pakistan | 0.81 | 46.6 |
| Central African Republic | 0.04 | 90.88 | Philippines | 1.19 | 29.06 |
| Dominican Republic | 2.08 | 16.69 | Papua New Guinea | 0.56 | 54.28 |
| Algeria | 3.72 | 0.15 | Qatar | 31.73 | 0.06 |
| Egypt, Arab Rep. | 1.96 | 6.51 | Romania | 3.56 | 24.06 |
| Fiji | 1.12 | 31.79 | Russian Federation | 11.23 | 3.72 |
| Micronesia, Fed. Sts. | 0.96 | 2.03 | Saudi Arabia | 14.27 | 0.06 |
| Georgia | 2.75 | 23.45 | Sudan | 0.47 | 62.13 |
| Guyana | 3.47 | 12.04 | Solomon Islands | 0.32 | 49.01 |
| Haiti | 0.28 | 76.31 | Syrian Arab Republic | 1.21 | 1.08 |
| Hungary | 4.59 | 14.76 | Tajikistan | 0.98 | 38.75 |
| Iraq | 3.84 | 1.08 | Turkmenistan | 10.18 | 0.06 |
| Kazakhstan | 11.30 | 1.78 | Tunisia | 2.41 | 12.88 |
| Kyrgyz Republic | 1.38 | 30.04 | Ukraine | 3.75 | 8.72 |
| Kiribati | 0.45 | 42.75 | Uzbekistan | 3.38 | 1.03 |
| Lebanon | 3.79 | 6.71 | Vanuatu | 0.39 | 26.03 |
| Libya | 6.68 | 3.12 | Samoa | 0.96 | 37.54 |
| Lesotho | 1.03 | 41.42 | Yemen, Rep. | 0.31 | 3.53 |
| Lithuania | 4.18 | 31.7 | Zimbabwe | 0.53 | 84.36 |
References
- Omri, A.; Omri, H.; Slimani, S.; Belaid, F. Environmental degradation and life satisfaction: Do governance and renewable energy matter? Technol. Forecast. Social. Chang. 2022, 175, 121375. [Google Scholar] [CrossRef]
- Mahalik, M.K.; Le, T.H.; Le, H.C.; Mallick, H. How do sources of carbon dioxide emissions affect life expectancy? Insights from 68 developing and emerging economies. World Dev. Sustain. 2022, 1, 100003. [Google Scholar] [CrossRef]
- Adeleye, B.N.; Azam, M.; Bekun, F.V. Infant mortality rate and nonrenewable energy consumption in Asia and the Pacific: The mediating role of carbon emissions. Air Qual. Atmos. Health 2023, 16, 1333–1344. [Google Scholar] [CrossRef]
- Newby, D.E.; Mannucci, P.M.; Tell, G.S.; Baccarelli, A.; Brook, R.D.; Donaldson, K.; Forastiere, F.; Franchini, M.; Franco, O.; Graham, I.; et al. Expert position paper on air pollution and cardiovascular disease. Eur. Heart J. 2015, 36, 83–93. [Google Scholar] [CrossRef]
- Lelieveld, J.; Klingmüller, K.; Pozzer, A.; Pöschl, U.; Fnais, M.; Daiber, A.; Münzel, T. Cardiovascular disease burden from ambient air pollution in Europe reassessed using novel hazard ratio functions. Eur. Heart J. 2019, 40, 1590–1596. [Google Scholar] [CrossRef] [PubMed]
- Liu, C.; Yin, P.; Chen, R.; Meng, X.; Wang, L.; Niu, Y.; Lin, Z.; Liu, Y.; Liu, J.; Qi, J.; et al. Ambient carbon monoxide and cardiovascular mortality: A nationwide time-series analysis in 272 cities in China. Lancet Planet. Health 2018, 2, e12–e18. [Google Scholar] [CrossRef]
- Chen, Y.; Wang, Z.; Zhong, Z. CO2 emissions, economic growth, renewable and non-renewable energy production and foreign trade in China. Renew. Energy 2019, 131, 208–216. [Google Scholar] [CrossRef]
- Saidi, K.; Omri, A. The impact of renewable energy on carbon emissions and economic growth in 15 major renewable energy-consuming countries. Environ. Res. 2020, 186, 109567. [Google Scholar] [CrossRef]
- Güney, T. Renewable energy, non-renewable energy and sustainable development. Int. J. Sustain. Dev. World Ecol. 2019, 26, 389–397. [Google Scholar] [CrossRef]
- Huang, Y.; Partha, D.B.; Harper, K.; Heyes, C. Impacts of global solid biofuel stove emissions on ambient air quality and human health. GeoHealth 2021, 5, e2020GH000362. [Google Scholar] [CrossRef]
- Bera, R.; Mishra, P.; Patnaik, P. Renewable energy for women empowerment: Experiences from rural West Bengal. Renew. Sustain. Energy Rev. 2024, 198, 114446. [Google Scholar] [CrossRef]
- Halkos, G.E.; Gkampoura, E.C. Reviewing usage, potentials, and limitations of renewable energy sources. Energies 2020, 13, 2906. [Google Scholar] [CrossRef]
- Dong, H.; Xue, M.; Xiao, Y.; Liu, Y. Do carbon emissions impact the health of residents? Considering China’s industrialization and urbanization. Sci. Total Environ. 2021, 758, 143688. [Google Scholar] [CrossRef] [PubMed]
- Gavurova, B.; Rigelsky, M.; Ivankova, V. Greenhouse gas emissions and health in the countries of the European Union. Front. Public Health 2021, 9, 756652. [Google Scholar] [CrossRef] [PubMed]
- De Schryver, A.M.; Brakkee, K.W.; Goedkoop, M.J.; Huijbregts, M.A. Characterization factors for global warming in life cycle assessment based on damages to humans and ecosystems. Environ. Sci. Technol. 2009, 43, 1689–1695. [Google Scholar] [CrossRef]
- Finegold, J.A.; Asaria, P.; Francis, D.P. Mortality from ischaemic heart disease by country, region, and age: Statistics from World Health Organisation and United Nations. Int. J. Cardiol. 2013, 168, 934–945. [Google Scholar] [CrossRef]
- Smith, K.R.; Jerrett, M.; Anderson, H.R.; Burnett, R.T.; Stone, V.; Derwent, R.; Atkinson, R.W.; Cohen, A.; Shonkoff, S.B.; Krewski, D.; et al. Public health benefits of strategies to reduce greenhouse-gas emissions: Health implications of short-lived greenhouse pollutants. Lancet 2009, 374, 2091–2103. [Google Scholar] [CrossRef]
- Lim, Y.H.; Hong, Y.C.; Kim, H. Effects of diurnal temperature range on cardiovascular and respiratory hospital admissions in Korea. Sci. Total Environ. 2012, 417, 55–60. [Google Scholar] [CrossRef] [PubMed]
- Perez, C.M.; Ledbetter, A.D.; Hazari, M.S.; Haykal-Coates, N.; Carll, A.P.; Winsett, D.W.; Costa, D.L.; Farraj, A.K. Hypoxia stress test reveals exaggerated cardiovascular effects in hypertensive rats after exposure to the air pollutant acrolein. Toxicol. Sci. 2013, 132, 467–477. [Google Scholar] [CrossRef]
- Rasoulinezhad, E.; Taghizadeh-Hesary, F.; Taghizadeh-Hesary, F. How is mortality affected by fossil fuel consumption, CO2 emissions and economic factors in CIS region? Energies 2020, 13, 2255. [Google Scholar] [CrossRef]
- Fajersztajn, L.; Saldiva, P.; Pereira, L.A.A.; Leite, V.F.; Buehler, A.M. Short-term effects of fine particulate matter pollution on daily health events in Latin America: A systematic review and meta-analysis. Int. J. Public Health 2017, 62, 729–738. [Google Scholar] [CrossRef]
- Zanobetti, A.; Schwartz, J.; Samoli, E.; Gryparis, A.; Touloumi, G.; Peacock, J.; Anderson, R.H.; Le Tertre, A.; Bobros, J.; Celko, M.; et al. The temporal pattern of respiratory and heart disease mortality in response to air pollution. Environ. Health Perspect. 2003, 111, 1188–1193. [Google Scholar] [CrossRef] [PubMed]
- Franchini, M.; Mannucci, P.M. Short-term effects of air pollution on cardiovascular diseases: Outcomes and mechanisms. J. Thromb. Haemost. 2007, 5, 2169–2174. [Google Scholar] [CrossRef] [PubMed]
- Beelen, R.; Stafoggia, M.; Raaschou-Nielsen, O.; Andersen, Z.J.; Xun, W.W.; Katsouyanni, K.; Dimakopoulou, K.; Brunekreef, B.; Weinmayr, G.; Hoffmann, B.; et al. Long-term exposure to air pollution and cardiovascular mortality: An analysis of 22 European cohorts. Epidemiology 2014, 25, 368–378. [Google Scholar] [CrossRef] [PubMed]
- Wolf, K.; Hoffmann, B.; Andersen, Z.J.; Atkinson, R.W.; Bauwelinck, M.; Bellander, T.; Brandt, J.; Brunekreef, B.; Cesaroni, G.; Chen, J.; et al. Long-term exposure to low-level ambient air pollution and incidence of stroke and coronary heart disease: A pooled analysis of six European cohorts within the ELAPSE project. Lancet Planet. Health 2021, 5, e620–e632. [Google Scholar] [CrossRef]
- Mordukhovich, I.; Coull, B.; Kloog, I.; Koutrakis, P.; Vokonas, P.; Schwartz, J. Exposure to sub-chronic and long-term particulate air pollution and heart rate variability in an elderly cohort: The Normative Aging Study. Environ. Health 2015, 14, 87. [Google Scholar] [CrossRef]
- Yang, B.Y.; Qian, Z.; Howard, S.W.; Vaughn, M.G.; Fan, S.J.; Liu, K.K.; Dong, G.H. Global association between ambient air pollution and blood pressure: A systematic review and meta-analysis. Environ. Pollut. 2018, 235, 576–588. [Google Scholar] [CrossRef]
- Brook, R.D.; Franklin, B.; Cascio, W.; Hong, Y.; Howard, G.; Lipsett, M.; Luepker, R.; Mittleman, M.; Samet, J.; Smith, S.C., Jr.; et al. Air pollution and cardiovascular disease: A statement for healthcare professionals from the Expert Panel on Population and Prevention Science of the American Heart Association. Circulation 2004, 109, 2655–2671. [Google Scholar] [CrossRef] [PubMed]
- Lee, B.J.; Kim, B.; Lee, K. Air pollution exposure and cardiovascular disease. Toxicol. Res. 2014, 30, 71–75. [Google Scholar] [CrossRef]
- Shah, A.S.V.; Langrish, J.P.; Nair, H.; McAllister, D.A.; Hunter, A.L.; Donaldson, K.; Newby, D.E.; Mills, N.L. Global association of air pollution and heart failure: A systematic review and meta-analysis. Lancet 2013, 382, 1039–1048. [Google Scholar] [CrossRef]
- Grahame, T.J.; Schlesinger, R.B. Cardiovascular health and particulate vehicular emissions: A critical evaluation of the evidence. Air Qual. Atmos. Health 2010, 3, 3–27. [Google Scholar] [CrossRef] [PubMed]
- Shearston, J.A.; Rowland, S.T.; Butt, T.; Chillrud, S.N.; Casey, J.A.; Edmondson, D.; Hilpert, M.; Kioumourtzoglou, M.-A. Can traffic-related air pollution trigger myocardial infarction within a few hours of exposure? Identifying hourly hazard periods. Environ. Int. 2023, 178, 108086. [Google Scholar] [CrossRef] [PubMed]
- Meo, S.A.; Suraya, F. Effect of environmental air pollution on cardiovascular diseases. Eur. Rev. Med. Pharmacol. Sci. 2015, 19, 4890–4897. [Google Scholar] [PubMed]
- Gan, W.Q.; Allen, R.W.; Brauer, M.; Davies, H.W.; Mancini, G.J.; Lear, S.A. Long-term exposure to traffic-related air pollution and progression of carotid artery atherosclerosis: A prospective cohort study. BMJ Open 2014, 4, e004743. [Google Scholar] [CrossRef] [PubMed]
- Liang, F.; Liu, F.; Huang, K.; Yang, X.; Li, J.; Xiao, Q.; Chen, J.; Liu, X.; Cao, J.; Shen, C.; et al. Long-term exposure to fine particulate matter and cardiovascular disease in China. J. Am. Coll. Cardiol. 2020, 75, 707–717. [Google Scholar] [CrossRef] [PubMed]
- Mahmood SA, I. Air pollution kills 15,000 Bangladeshis each year: The role of public administration and government’s integrity. J. Public Adm. Policy Res. 2011, 3, 129. [Google Scholar]
- Dong, K.; Hochman, G.; Zhang, Y.; Sun, R.; Li, H.; Liao, H. CO2 emissions, economic and population growth, and renewable energy: Empirical evidence across regions. Energy Econ. 2018, 75, 180–192. [Google Scholar] [CrossRef]
- Salahodjaev, R.; Sharipov, K.; Rakhmanov, N.; Khabirov, D. Tourism, renewable energy and CO2 emissions: Evidence from Europe and Central Asia. Environ. Dev. Sustain. 2022, 24, 13282–13293. [Google Scholar] [CrossRef]
- Mirziyoyeva, Z.; Salahodjaev, R. Renewable energy, GDP and CO2 emissions in high-globalized countries. Front. Energy Res. 2023, 11, 1123269. [Google Scholar] [CrossRef]
- Parmova, D.S.; Teshabaev, T.; Kasimova, N.; Salahodjaev, R. Mitigating CO2 emissions: The synergy of foreign direct investment and renewable energy in Europe and Central Asia. Int. J. Energy Econ. Policy 2024, 14, 620–627. [Google Scholar] [CrossRef]
- Sharif, A.; Raza, S.A.; Ozturk, I.; Afshan, S. The dynamic relationship of renewable and nonrenewable energy consumption with carbon emission: A global study with the application of heterogeneous panel estimations. Renew. Energy 2019, 133, 685–691. [Google Scholar] [CrossRef]
- Bhattacharya, M.; Churchill, S.A.; Paramati, S.R. The dynamic impact of renewable energy and institutions on economic output and CO2 emissions across regions. Renew. Energy 2017, 111, 157–167. [Google Scholar] [CrossRef]
- Jamil, K.; Liu, D.; Gul, R.F.; Hussain, Z.; Mohsin, M.; Qin, G.; Khan, F.U. Do remittance and renewable energy affect CO2 emissions? An empirical evidence from selected G-20 countries. Energy Environ. 2022, 33, 916–932. [Google Scholar] [CrossRef]
- Saidi, K.; Omri, A. Reducing CO2 emissions in OECD countries: Do renewable and nuclear energy matter? Prog. Nucl. Energy 2020, 126, 103425. [Google Scholar] [CrossRef]
- Zoundi, Z. CO2 emissions, renewable energy and the Environmental Kuznets Curve, a panel cointegration approach. Renew. Sustain. Energy Rev. 2017, 72, 1067–1075. [Google Scholar] [CrossRef]
- Sebri, M.; Ben-Salha, O. On the causal dynamics between economic growth, renewable energy consumption, CO2 emissions and trade openness: Fresh evidence from BRICS countries. Renew. Sustain. Energy Rev. 2014, 39, 14–23. [Google Scholar] [CrossRef]
- Sadorsky, P. Renewable energy consumption, CO2 emissions and oil prices in the G7 countries. Energy Econ. 2009, 31, 456–462. [Google Scholar] [CrossRef]
- Qi, T.; Zhang, X.; Karplus, V.J. The energy and CO2 emissions impact of renewable energy development in China. Energy Policy 2014, 68, 60–69. [Google Scholar] [CrossRef]
- Waheed, R.; Chang, D.; Sarwar, S.; Chen, W. Forest, agriculture, renewable energy, and CO2 emission. J. Clean. Prod. 2018, 172, 4231–4238. [Google Scholar] [CrossRef]
- Abbasi, K.R.; Adedoyin, F.F.; Abbas, J.; Hussain, K. The impact of energy depletion and renewable energy on CO2 emissions in Thailand: Fresh evidence from the novel dynamic ARDL simulation. Renew. Energy 2021, 180, 1439–1450. [Google Scholar] [CrossRef]
- Robalino-López, A.; Mena-Nieto, A.; García-Ramos, J.E. System dynamics modeling for renewable energy and CO2 emissions: A case study of Ecuador. Energy Sustain. Dev. 2014, 20, 11–20. [Google Scholar] [CrossRef]
- Leitão, N.C.; Balsalobre-Lorente, D.; Cantos-Cantos, J.M. The impact of renewable energy and economic complexity on carbon emissions in BRICS countries under the EKC scheme. Energies 2021, 14, 4908. [Google Scholar] [CrossRef]
- Sadorsky, P. The effect of urbanization on CO2 emissions in emerging economies. Energy Econ. 2014, 41, 147–153. [Google Scholar] [CrossRef]
- Chen, L. How CO2 emissions respond to changes in government size and level of digitalization? Evidence from the BRICS countries. Environ. Sci. Pollut. Res. 2022, 29, 457–467. [Google Scholar] [CrossRef]
- Wang, Q.; Wang, L.; Li, R. Does renewable energy help increase life expectancy? Insight from the linking renewable energy, economic growth, and life expectancy in 121 countries. Energy Strategy Rev. 2023, 50, 101185. [Google Scholar] [CrossRef]
- Zhang, Z.; Nuță, F.M.; Dimen, L.; Ullah, I.; Xuanye, S.; Junchen, Y.; Yihan, Z.; Yi, C. Relationship between FDI inflow, CO2 emissions, renewable energy consumption, and population health quality in China. Front. Environ. Sci. 2023, 11, 1120970. [Google Scholar] [CrossRef]
- Salahodjaev, R.; Djalilov, B.; Kobiljonov, I.; Otajonov, S.; Kasimova, N. Industrialization and CO2 emissions: Accounting for the role of renewable energy in OIC member states. Int. J. Energy Econ. Policy 2023, 13, 37–43. [Google Scholar] [CrossRef]
- Holtz-Eakin, D.; Selden, T.M. Stoking the fires? CO2 emissions and economic growth. J. Public Econ. 1995, 57, 85–101. [Google Scholar] [CrossRef]
- Mentel, G.; Tarczyński, W.; Dylewski, M.; Salahodjaev, R. Does renewable energy sector affect industrialization-CO2 emissions nexus in Europe and Central Asia? Energies 2022, 15, 5877. [Google Scholar] [CrossRef]
- Mahmood, H.; Maalel, N.; Zarrad, O. Trade openness and CO2 emissions: Evidence from Tunisia. Sustainability 2019, 11, 3295. [Google Scholar] [CrossRef]
- Ertugrul, H.M.; Cetin, M.; Seker, F.; Dogan, E. The impact of trade openness on global carbon dioxide emissions: Evidence from the top ten emitters among developing countries. Ecol. Indic. 2016, 67, 543–555. [Google Scholar] [CrossRef]
- Salem, S.; Arshed, N.; Anwar, A.; Iqbal, M.; Sattar, N. Renewable energy consumption and carbon emissions—Testing nonlinearity for highly carbon emitting countries. Sustainability 2021, 13, 11930. [Google Scholar] [CrossRef]
- Mirziyoyeva, Z.; Salahodjaev, R. Does representation of women in parliament promote economic growth? Considering evidence from Europe and Central Asia. Front. Political Sci. 2023, 5, 1120287. [Google Scholar] [CrossRef]
Disclaimer/Publisher’s Note: The statements, opinions and data contained in all publications are solely those of the individual author(s) and contributor(s) and not of MDPI and/or the editor(s). MDPI and/or the editor(s) disclaim responsibility for any injury to people or property resulting from any ideas, methods, instructions or products referred to in the content. |
© 2024 by the authors. Licensee MDPI, Basel, Switzerland. This article is an open access article distributed under the terms and conditions of the Creative Commons Attribution (CC BY) license (https://creativecommons.org/licenses/by/4.0/).