Article

The Impact of Condensate Oil Content on Reservoir Performance in Retrograde Condensation: A Numerical Simulation Study

State Key Laboratory of Oil and Gas Reservoir Geology and Exploitation, Southwest Petroleum University, Chengdu 610500, China
*
Author to whom correspondence should be addressed.
Energies 2024, 17(22), 5750; https://doi.org/10.3390/en17225750
Submission received: 20 September 2024 / Revised: 27 October 2024 / Accepted: 7 November 2024 / Published: 18 November 2024
(This article belongs to the Section H: Geo-Energy)

Abstract

:
This study investigates the complex dynamics of retrograde condensation in condensate gas reservoirs, with a particular focus on the challenges posed by retrograde condensate pollution, which varies in condensate oil content and impacts on reservoir productivity. Numerical simulations quantify the distribution of condensate oil and the reduction in gas-phase relative permeability in reservoirs with 100.95 g/m3, 227.27 g/m3, and 893.33 g/m3 of condensate oil. Unlike previous studies, this research introduces an orthogonal experiment to establish a methodology for studying the dynamic sensitivity factors across different types of gas reservoirs and various development stages, systematically evaluating their contributions to condensate oil. The analysis reveals that reservoirs with low to moderate condensate oil content gradually experience expanding polluted regions, affecting long-term production. The maximum condensate saturation near the wellbore can reach 0.19, reducing gas-phase relative permeability by about 25.44%. In contrast, high-condensate oil reservoirs show severe early-stage retrograde condensation, with saturations up to 0.35 and a permeability damage rate reaching 73%. The orthogonal experiments identify reservoir permeability and condensate oil content as critical factors influencing production indicators. The findings provide key insights and practical recommendations for optimizing production strategies, emphasizing tailored approaches to mitigate retrograde condensation and enhance recovery, especially in high-condensate oil reservoirs, offering theoretical and practical guidance for improving reservoir management and economic returns.

1. Introduction

Condensate gas reservoirs, a specialized type of natural gas reservoir, are becoming increasingly significant in the oil and gas industry due to rising global energy demand. Unlike conventional reservoirs, condensate gas reservoirs can produce both natural gas and condensate oil, thereby providing substantial economic value. However, these reservoirs encounter challenges such as retrograde condensation. When the reservoir pressure falls below the dew point, a phase transition occurs, resulting in the formation of both gas and liquid phases. The liquid condensate adsorbs onto the rock surface, becomes trapped within the reservoir, obstructs pore channels, and significantly reduces the available flow pathways for fluids [1]. This transition from single-phase flow to two-phase oil–gas flow near the wellbore can significantly affect fluid permeability, potentially leading to zones with condensate oil saturation as high as 70% [2,3].
The presence of condensate oil near gas wells can significantly impact gas well productivity. During the production of natural gas in the Risha gas field (Jordan), black solid hydrocarbons were generated, which negatively impacted gas production [4]. In the Arun condensate gas field in Indonesia, the initial gas–oil ratio was recorded at 2741 m3/m3 with a dew point pressure of 30.3 MPa. Production data indicate that even with a retrograde condensation liquid volume of less than 2%, the accumulation of condensate oil near the wellbore can lead to a reduction in gas well productivity by approximately 50% [5,6,7]. Similarly, in the Khami condensate gas reservoir, the MN-222 well experienced a noticeable decline in production over three years due to condensate oil pollution, resulting in a decrease in wellhead pressure from 43.44 MPa to 28.96 MPa [8]. Furthermore, the Cal Canal gas reservoir in California, known for its high condensate oil content and water saturation levels of up to 59%, faced challenges such as a low natural gas recovery rate of only 10% under depletion development conditions. This result was mainly attributed to severe condensate oil pollution and high water saturation [9]. These findings emphasize the necessity for further research into flow patterns and the characteristics of retrograde condensation pollution to address these challenges effectively.
Gringarten et al. [10] proposed a three-region composite model for analyzing well tests in condensate gas reservoirs. This model, illustrated in Figure 1, delineates fluid flow characteristics following the precipitation of condensate oil and is divided into three distinct regions. Region III represents the gas phase zone, where only gas flows. Region II is identified as the gas–oil two-phase zone, where retrograde condensate oil exists below the critical flow saturation. Region I, the area closest to the wellbore, is characterized by the accumulation of retrograde condensate, resulting in condensate oil saturation that exceeds the critical flow saturation; thus, both the oil and gas phases contribute to the flow. In Regions I and II, the presence of retrograde condensate reduces the gas flow channels, causing retrograde condensation damage. The extent of the reduction in gas phase flow capacity can be determined through oil–gas relative permeability. Additionally, the precipitation of heavier hydrocarbons decreases the condensate content in the produced gas phase.
Numerous scholars have further explored the characteristics of retrograde condensation pollution in condensate gas reservoirs, using various methods to assess the degree of pollution. The primary indicator for evaluating retrograde condensation pollution is the change in natural gas relative permeability, which is determined through core depletion experiments [12]. Feng et al. [13] conducted experiments with different fluids and full-diameter cores (with an average permeability of 0.663 mD) and found that at a condensate oil content of 223 g/m3, the gas-phase effective permeability decreased by 45.17% and 44.14% in the near- and far-well zones, respectively. For condensate contents of 162 g/m3 and 85 g/m3, the observed decreases were 42.23% and 32.66% and 27.94% and 16.41%, respectively. Wang et al. [1] conducted depletion experiments with high-condensate-content gas (gas–oil ratio = 1407.8 m3/m3) and long cores (average permeability = 1.24 mD) and noted a gas-phase permeability reduction of 78%. Xiao [14] conducted long core depletion experiments with a high-condensate-oil-content fluid (347.65 g/m3) and found that when the pressure dropped to the maximum retrograde condensation pressure, the gas-phase permeability decreased by nearly 50%. RF Green et al. [15] conducted long core experiments on the low-permeability Fengshen 1 condensate gas reservoir. They observed that under a maximum retrograde condensation pressure of 19 MPa, the effective gas-phase permeability in the long core decreased by more than 90%. These findings further confirm the severe impact of high condensate oil content on fluid flow capacity. In the analysis of logging data, some researchers have utilized the unstable well test double logarithmic curve to identify the multi-zone distribution characteristics of condensate gas reservoirs [16]. Su and Wang [17] quantified retrograde condensation pollution by analyzing changes in production differential pressure from well test results. Zhao [18] and Zou et al. [19] developed a multiphase flow and retrograde condensation pollution calculation model based on the dynamics of condensate reservoirs, using numerical methods to solve for skin coefficients that characterize retrograde condensation pollution. Guo [20] and Lu et al. [21] constructed a single-well radial model using numerical simulation software. At the same time, Asgari et al. [22] employed the CPA equation of state to calculate condensate saturation and assess changes in core permeability or gas-phase relative permeability, thereby visually representing retrograde condensation pollution.
In summary, retrograde condensation pollution is typically characterized by indoor core experiments, logging data analysis, and numerical simulation methods. However, these approaches also have certain disadvantages. For instance, the limitations of core experimental conditions prevent them from fully simulating complex formation characteristics and developmental processes. Additionally, the small size of core samples fails to capture the heterogeneity of the gas reservoir, thus presenting certain limitations. During test well analysis, substantial pressure fluctuations lead to poor-fitting results. Moreover, existing numerical simulation methods involve a certain degree of simplification. Most single-well models are homogeneous, with simplified reservoir properties and dimensions to achieve shorter simulation times. Consequently, these models do not adequately represent the heterogeneity, geological characteristics, and complex production regimes of actual reservoirs, making it challenging to directly apply the research conclusions to real gas reservoirs.
It is also crucial to explore the sensitivity factors affecting retrograde condensation pollution and gas well production indicators. Tu et al. [3] conducted PVT experiments and long core depletion experiments combined with a non-equilibrium theoretical model and found that a higher depletion rate can reduce condensate oil saturation to a certain extent. Specifically, using a depletion rate of 5 MPa/h compared to 1.25 MPa/h resulted in a 41.78% increase in the condensate recovery rate [23]. Yang Liu et al. [24] also conducted similar research, and the non-equilibrium effect has a certain mitigating impact on condensate oil pollution. The properties of the porous medium also have a certain impact on the fluid [25]. The permeability of the reservoir also has a significant impact on the productivity of condensate reservoirs. The lower the reservoir permeability, the richer the gas content, and the greater the pressure drop during production, which indicates a higher likelihood of condensate blockage [26]. Qiao et al. [27] discovered through numerical simulations that in low-permeability gas layers, an increase in condensate oil content significantly reduces the depletion recovery rate of condensate oil. Additionally, the critical flow saturation of condensate oil, which can be measured experimentally, also has an impact [28,29]. Zhao et al. [18] used various oil–gas relative permeability curves to characterize different critical flow saturations of condensate oil. They found that the skin factor for high critical flow saturation is 23.24 times greater than the skin factor for low critical flow saturation. Notably, when the pressure difference between formation pressure and dew point pressure (ΔPfd) increased from 1.32 MPa to 5.28 MPa, the skin factor decreased from 8.3 to 0.69. Additionally, as gas well production rose from 10 × 10⁴ m3/d to 20 × 10⁴ m3/d, the skin factor due to retrograde condensate increased from 5.15 to 12.09. While reservoir properties, fluid properties, and development policies all impact condensate pollution and gas well production indicators, these studies primarily focus on single-factor mechanism analysis. For condensate gas reservoirs with different condensate oil contents, the main controlling factors affecting gas-phase permeability and production indicators remain unclear.
This paper investigates the characteristics of condensate pollution in gas reservoirs with varying condensate contents while integrating these findings with the actual properties of gas reservoirs. Focusing on the X condensate gas reservoir, numerical simulations were conducted to analyze the distribution characteristics of condensate saturation and the impairment of gas-phase relative permeability. This methodology quantifies the degree of condensate pollution in gas fluids with condensate contents of 100.95 g/m3, 227.27 g/m3, and 893.33 g/m3. Furthermore, the production indicators for the three condensate gas reservoirs are described and compared. Finally, orthogonal tests are utilized to perform a comprehensive dynamic multi-sensitivity factor analysis, assessing the impact of each factor on production indicators. This paper also provides production guidelines for various types of condensate gas reservoirs at different stages of their development.

2. Model Establishment

This paper employs the advanced tNavigator numerical reservoir simulation system, which effectively handles fluid behavior in complex geological formations. Initially, this research investigates the characteristics of retrograde condensate pollution and the extent of reservoir damage caused by condensate gas fluids with varying condensate oil contents. Furthermore, a numerical simulation model is utilized to analyze the primary factors controlling condensate gas production at different production stages through orthogonal experimental analysis.

2.1. Geological Model

The burial depth of the reservoir under investigation ranges from 4130 m to 4230 m, accompanied by a formation pressure of 42.4 MPa and a formation temperature of 144.7 °C. This reservoir exhibits significant horizontal and vertical heterogeneity. Permeability within the reservoir varies from 1.44 mD to 78.88 mD, with an average permeability of 22.45 mD. Porosity ranges from 0.099 to 0.143, with an average of 0.125. The initial gas saturation is 0.65, while the irreducible water saturation stands at 0.35.
Based on core experiments, single-well logging, and well test interpretation, a heterogeneous geological model for a typical gas well was constructed in geological modeling software through geostatistical methods. The model has a horizontal length of 1342 m in the X direction and is composed of 23 grids, with an average unit length of 57 m. In the Y direction, the horizontal length is 1774 m, comprising 27 grids with an average grid length of 5 m. The vertical length in the Z direction is 19 m, comprising 15 grids and an average grid length of 1.3 m. To analyze the characteristics of retrograde condensation pollution in the near-well region, logarithmic grid refinement was implemented within a 500 m radius around the well. Following this refinement, the grid numbers in the X, Y, and Z directions increased to 186, 186, and 15, respectively, resulting in a total of 528,255 grids in the model. The grid refinement has no impact on the production calculation results of the actual reservoir; it primarily yields a smoother calculation outcome for the grid near the wellbore [30]. The geological model of the block before and after refinement is presented in Figure 2a, and the saturation distribution in the grid near the wellbore is shown in Figure 2b.

2.2. Fluid Parameters

The original reservoir fluid is a condensate gas with a condensate oil content of 227.27 g/m3 and a dew point pressure of 41.20 MPa. It has a maximum retrograde condensation liquid volume of 6.38% and a maximum retrograde condensation pressure of 24 MPa, with a gas–oil ratio of 3522 m3/m3.
To explore the characteristics of retrograde condensate pollution, condensate gas fluids with low (100.95 g/m3) and high (893.33 g/m3) condensate oil contents were selected for comparative analysis. The dew point pressures for the low- and high-condensate-oil-content gases are 41.10 MPa and 37.63 MPa, respectively. The maximum retrograde condensate saturation and maximum retrograde condensate pressures for the low- and high-condensate-oil-content gases are 3.74%, 28.05%, 27.11 MPa, and 30.03 MPa, respectively, with corresponding gas–oil ratios of 7241 m3/m3 and 1050 m3/m3. The compositions and key parameters of the three gas condensate fluids are detailed in Table 1.
The three types of condensate gas fluids presented in Table 1 are divided into five pseudo-components, as indicated in Table 2. In the PVT Designer module of the tNavigator 21.1 numerical simulation software, the Peng–Robinson equation of state (EOS) and equilibrium phase behavior theory are employed to fine-tune the critical temperature (Tc), critical pressure (Pc), and acentric factor (ω) of each pseudo-component through a trial-and-error approach. Incorporating these thermodynamic parameters allows the calculated results to closely match experimental data. The average relative error between the calculated dew point, gas–oil ratio, and experimental values is maintained below 1%. Furthermore, the average relative error between the retrograde condensate saturation calculated via constant volume depletion (CVD) and the experimental results is less than 5%, as demonstrated in Figure 3. The adjusted thermodynamic parameters fulfill the accuracy requirements of the subsequent numerical simulations.

2.3. Simulation Method

The parameters of three different condensate gas fluids, each with varying condensate oil contents, were incorporated into the refined geological model shown in Figure 2. These fluid parameters form the foundation for reservoir initialization. Based on the model’s grid pore volume, initial saturation distribution, and PVT fluid parameters, the calculated gas reserves for the blocks with differing condensate contents were found to be comparable, with an average volume of approximately 372.26 × 10⁶ m3. In contrast, the reserves of condensate oil demonstrated an increase that correlated with the condensate oil content. Specifically, the condensate oil reserves in the gas reservoir with high condensate oil content were roughly seven times greater than those in the low-condensate-oil-content reservoir. Detailed results of the reserve calculation can be found in Table 3. Subsequently, a depletion development technology was formulated for the condensate gas. During the simulation, the operational strategy for the gas production well begins with an initial production rate of 7%. If this rate cannot be maintained, the production strategy shifts to sustaining a fixed bottom-hole pressure of 10 MPa. Should this pressure threshold also prove unattainable, production is limited to a final economic cap of 5000 m3/d.

3. Impact of Condensate Oil Content on Reservoir Performance

3.1. Characteristics of Retrograde Condensation Pollution

The condensate oil content has a significant impact on the production of condensate gas reservoirs. A precise comprehension of the characteristics of condensate oil pollution is of paramount importance for the mitigation of retrograde condensation damage and the enhancement of the development efficiency of condensate gas reservoirs.
(1)
Distribution of condensate oil saturation
In this study, the critical condensate flow saturation is identified as 0.15. The dew point pressure of the fluids in condensate gas reservoirs is subject to variation in accordance with the condensate oil content. For the reservoirs of Fluids 1 and 2, retrograde condensation initiates at the bottom of the well approximately one month after production begins. In contrast, for the reservoir of Fluid 3, retrograde condensation begins at the bottom of the well about two months after production starts, attributed to a larger ΔPfd.
As illustrated in Figure 4, the radial distribution characteristics of retrograde condensate oil saturation in condensate gas wells with varying condensate oil contents over time are depicted. The boundaries of the three reservoir regions of flow in a condensate field are not stationary. In the third region, the boundary moves outward as the well produces hydrocarbons, and the formation pressure drops, eventually disappearing when the outer boundary pressure falls below the dew point. The condensate saturation in the second region remains low enough to prevent any flow. The boundary of this region typically aligns closely with the critical flow saturation of the condensate. Within the first production region, a portion of the condensate originates from production in that region due to pressure drop, while another portion originates from mist condensate carried by the gas from the second region. The size of this zone is proportional to the condensate content of the condensate gas reservoir fluid.
As illustrated in Figure 4a, within the reservoir of Fluid 1, a rapid increase in condensate oil saturation near the wellbore occurs once the formation pressure falls to the dew point pressure. Initially, heavier gas-phase hydrocarbons condense, resulting in the formation of a high-saturation condensate oil phase. One month following retrograde condensation, the condensate oil saturation can reach 0.165 at a distance of 0.7 m from the wellbore. After six months, the saturation distribution in Region I expands to approximately 10 m. With continued production, the maximum condensate oil saturation near the wellbore increases to 0.17. Although the ranges of saturation distribution in Regions I and II gradually expand, the rate of this expansion decreases over time. By ten years after retrograde condensation, the range of Region I, which has a significant impact on reservoir permeability, expands to approximately 20 m.
Similar to the saturation distribution pattern observed in the reservoir of Fluid 1, in the reservoir of Fluid 2, the condensate oil saturation near the wellbore rapidly increases during the early stages of retrograde condensation, reaching a maximum of approximately 0.19. After six months of retrograde condensation, the range of Region I in the reservoir of Fluid 2 expands to about 14 m, which is an increase of approximately 4 m compared to the reservoir of Fluid 1. As production continues into the middle and later stages, the evaporation of condensate oil and the increase in light hydrocarbons become more pronounced, with light hydrocarbons being more easily carried by natural gas. After ten years of retrograde condensation, the condensate oil saturation at 0.7 m from the wellbore decreases to 0.17.
As illustrated in Figure 4c, the condensate oil saturation near the wellbore for the reservoir of Fluid 3 reaches approximately 0.35 during the early stages of retrograde condensation. Throughout this retrograde condensation period, an increase in heavy hydrocarbon content in the gas leads to a greater precipitation of heavy hydrocarbons from the gas phase as pressure decreases. Consequently, Region I of Fluid 3 expands, and condensate oil saturation changes are more significant over time. After six months of retrograde condensation, Region I expands to approximately 100 m. Even in the middle and later stages of production, while condensate oil saturation generally decreases, Region I can still extend up to about 300 m.
The maximum condensate oil saturation of different fluids is shown in Table 4. These findings suggest that fluids with high condensate oil content are more sensitive to retrograde condensation, leading to substantial spatial and temporal variations in saturation. Such findings emphasize the importance of considering condensate oil content when evaluating reservoir performance and developing production strategies. Fluids with higher condensate oil content require more careful management to optimize recovery and ensure reservoir stability.
(2)
Distribution of gas-phase relative permeability damage rate
Figure 5 illustrates the radial variation characteristics of the gas-phase relative permeability damage rate at different retrograde condensation times for condensate gas fluids. Following the retrograde condensation phenomenon, condensate oil either adsorbs onto the rock surface or remains trapped within the pores of the reservoir. Before the reservoir reaches critical flow saturation, this condensate oil blocks the flow channels, significantly reducing the effective permeability of natural gas. As the reservoir approaches and ultimately reaches critical flow saturation, the presence of two-phase oil–gas flow further complicates the permeability conditions, resulting in a decline in gas production. The impact of this phenomenon is severe; the substantial damage to gas-phase permeability can greatly hinder reservoir development efforts, posing significant challenges to maintaining optimal production levels.
Currently, there is no standardized method for quantifying condensate oil pollution based on the damage to gas-phase relative permeability. However, drawing on the approach established by Su et al. [17], which categorizes condensate oil pollution according to the production differential pressure ratio, this study proposes a classification system for the gas-phase relative permeability damage rate. In this system, severe pollution is defined as damage exceeding 20%, moderate pollution falls between 10% and 20%, and minor pollution is characterized by damage below 10%. By adopting this classification, it becomes possible to systematically assess the impact of condensate oil on gas-phase permeability.
Degree   of   gas   relative   permeability   impairment = 1 k r g k r g , i n i t i a l × 100 %
k r g , i n i t i a l : Initial gas relative permeability.
k r g : The permeability of gas relative to other fluids in a multiphase flow scenario. This is a dimensionless ratio.
In Fluid 1, the relative permeability damage rate in the gas phase gradually decreases with increasing distance from the wellbore. Within 5 m, the extent of damage exceeds 16%, indicating moderate pollution. However, beyond 10 m from the wellbore, the damage extent significantly decreases and stabilizes, staying below 10%, which indicates slight reservoir pollution.
In contrast, the permeability damage rate in Fluid 2 increases significantly. Within the first 5 m, the extent of damage exceeds 20%, indicating severe pollution. Beyond 15 m, the damage stabilizes at around 10%.
In Fluid 3, the gas-phase relative permeability damage rate is the most pronounced. Within 20 m, the damage exceeds 50%, and within just 5 m, it reaches as high as 70%. The severely polluted area extends up to approximately 200 m. Under conditions of high condensate oil content, the impact on gas-phase permeability is more significant and requires special attention in development strategies.
The gas-phase relative permeability damage rate around the wellbore gradually alleviates as production progresses. In Fluids 1 and 2, the damage within 5 m of the wellbore decreases by approximately 3% and 8%, respectively. For Fluid 3, although the damage around the wellbore decreases by about 21% in the later stages of production, it remains above 10%, with its impact extending beyond 150 m. The maximum gas-phase relative permeability damage rate and mitigation of gas-phase relative permeability damage rate of different fluids are shown in Table 5.
The impact of condensate oil content and flow saturation on gas well permeability is a complex and significant phenomenon. When the condensate oil content is low, only a small amount of condensate oil precipitates, primarily affecting the flow channels near the wellbore and causing localized damage to gas-phase permeability. In this case, the reduction in permeability is relatively limited, and the affected area remains small. However, as the condensate oil content increases to a medium level, the extent of damage widens and becomes more severe. This results in more flow channels becoming blocked, subsequently impacting gas flow. In conditions where the condensate oil content is high, the situation becomes even more severe. A substantial amount of condensate oil precipitates, blocking the flow channels near and far from the wellbore. The increase in condensate oil saturation leads to the formation of a continuous phase, greatly reducing gas-phase permeability. Gas wells with high condensate oil content are prone to retrograde condensation pollution issues from the beginning of production. Addressing this challenge necessitates not only comprehensive theoretical research but also practical optimization based on actual production conditions to maximize productivity.

3.2. Characteristics of Production Indicator Changes

The production curves for condensate gas reservoirs with different condensate oil contents are shown in Figure 6. Figure 6a depicts the daily production rates under different fluid conditions. During the initial production stages, a higher production pressure differential drives more fluid into the wellbore, enabling all gas wells to start production at a gas production rate of 7% (79,000 m3/d). Gas wells associated with Fluid 1 maintain stable production for 93 months, while those linked to Fluid 2 stabilize for 89 months, which is four months shorter than that for Fluid 1. In contrast, Fluid 3 gas wells experience severe retrograde condensation pollution initially, with the gas-phase relative permeability damage rate reaching 70%. Consequently, production declines after 23 months. The wellbore pressure limit is set at 10 MPa. As gas production declines, surface oil production further decreases. This decline in condensate oil accumulation within the reservoir increases flow resistance, ultimately leading to reduced gas productivity. Retrograde condensation pollution is identified as the primary factor influencing gas well productivity.
Figure 6b illustrates that lower condensate oil content correlates with a reduced presence of heavy hydrocarbons in the condensate gas fluid, thereby amplifying the changes in the gas–oil ratio (GOR). In the case of Fluid 1 gas wells, the initial GOR is recorded at 7241 m3/m3, which subsequently rises to 92,718 m3/m3. Conversely, for Fluid 3 gas wells, the significant accumulation of liquid hydrocarbon precipitation leads to increased fluid viscosity, which hinders gas flow and results in a more gradual increase in GOR from 1050 m3/m3 to 5815 m3/m3. Figure 6c further demonstrates that in the reservoir associated with Fluid 3, both formation pressure and wellbore pressure experience a rapid decline prior to the precipitation of condensate oil. After two months of production, the wellbore pressure decreases to 26.4 MPa, while the formation pressure declines from 42.4 MPa to 40 MPa. This phenomenon is attributed to the higher gas compressibility during the early stages of production, which accelerates the decrease in reservoir pressure. As liquid condensate accumulates within the reservoir pores, the rate of pressure decline diminishes, with the condensate serving to compensate for the reservoir pressure.
During the pressure depletion development process of gas reservoirs, higher condensate oil content in the condensate gas reservoir correlates with more severe retrograde condensation and a significant decline in gas productivity, ultimately resulting in a lower natural gas recovery rate over the same period. As illustrated in Figure 7, the natural gas recovery rates for the three fluids are 73.47%, 70.82%, and 52.48%, respectively. Furthermore, as the condensate oil content increases, the loss of condensate oil also rises, leading to lower condensate oil recovery rates of 31.69%, 30.56%, and 23.30%, respectively. For high-condensate oil gas reservoirs, it is essential to implement strategies to mitigate the impact of retrograde condensation losses and pollution.

4. Dynamic Analysis of Main Controlling Factors

To investigate the primary factors influencing production under varying conditions of retrograde condensation pollution, the depletion production process of condensate gas reservoirs is categorized into three stages: (1) The first stage occurs when the formation pressure is above the dew point pressure, resulting in the absence of retrograde condensation. (2) The second stage is characterized by formation pressure that lies between the maximum retrograde condensation pressure and the dew point pressure, during which condensate oil precipitates until it reaches its maximum value. (3) The third stage occurs when the formation pressure falls below the maximum retrograde condensation pressure, leading to the evaporation of condensate oil. This study takes an integrated approach by considering geological, fluid, engineering, and other relevant factors across different stages. Utilizing the orthogonal experimental design, a mathematical and statistical method, representative combinations of factors and levels were selected to analyze the effects of multivariable interactions on production dynamics at each stage [31].

4.1. Stage 1—Pressure Above Dew Point

In the first stage, when the formation pressure exceeds the dew point pressure, the reservoir experiences single-phase gas flow. For condensate gas reservoirs with comparable natural gas reserves, production during this stage is predominantly influenced by factors such as reservoir permeability, condensate oil content, and gas production rate. To investigate the impact of these factors, a three-factor, three-level orthogonal experiment L9(33) was designed to analyze the recovery rates of both condensate oil and natural gas. The experimental results and range analysis are presented in Table 6.
At this stage, the condensate oil produced from the gas well is completely separated from the surface condensate gas in the separator. The effects of critical factors on the recovery rates of oil and gas remain consistent. The results from the range analysis indicate that the primary factors influencing oil and gas recovery rates during this stage, in order of importance, are reservoir permeability, condensate oil content, and gas production rate. By calculating the sum of squares for each factor, the significance ratio of each factor was further established. As illustrated in Figure 8, the contribution of reservoir permeability to the oil and gas recovery rates in the first stage is 48%, which is consistent with the significance ranking derived from the range analysis.
Percentage   of   impact = Sum   of   squares   for   the   factor   ( S S ) Total   sum   of   squares   ( T S S ) × 100 %
Reservoir permeability directly influences the flow of gas within the reservoir. In high-permeability reservoirs, gas flows more easily, resulting in a gradual pressure decline that extends the duration of single-phase gas flow and enhances the oil and gas recovery rates during the first stage. Furthermore, due to variations in fluid properties, Fluid 3 exhibits a larger ΔPfd, allowing it to maintain a single-phase gas state for an extended period. This greater differential allows the gas well to continue producing natural gas efficiently, thereby increasing recovery rates. However, an excessively rapid gas production rate may cause the pressure to approach the dew point pressure quickly, raising the likelihood of retrograde condensation. Unlike permeability and condensate oil content, the gas production rate is a variable that can be adjusted through operational practices. Therefore, while significance may be comparatively lower in the hierarchy, it nonetheless exerts a considerable influence on recovery rates.

4.2. Stage 2—Pressure Between Max Retrograde Condensation and Dew Point

A two-phase flow of oil and gas occurs in the reservoir when the reservoir pressure is between the maximum retrograde condensation pressure and the dew point pressure. During this phase, production is further affected by the critical condensate oil saturation for flow. To thoroughly investigate the effects of these factors, an L9(34) orthogonal experiment was designed to study the effects on condensate oil recovery and gas-phase relative permeability. Table 7 shows the experimental results and range analysis.
The range R reveals the impact of primary and secondary factors on condensate recovery rate and gas permeability, with the ranking as follows: condensate content > reservoir permeability > gas production rate > critical flow saturation of condensate. As shown in Figure 9, at this stage, condensate content emerges as the primary factor influencing production capacity, with impacts on the condensate recovery rate and gas-phase relative permeability of 49% and 64%, respectively. Reservoir permeability ranks second, with impacts on the test indicators of 42% and 29%. In contrast, the gas production rate and critical flow saturation of condensate have negligible effects on the test indicators at this stage.
The content of condensate oil plays a significant role in the enrichment of heavy hydrocarbons within liquids, as it restricts gas flow by occupying pore spaces with retrograde condensate. Elevated levels of condensate oil exacerbate the pollution caused by retrograde condensation in the reservoir, which adversely affects both condensate oil recovery and gas-phase permeability during this phase. The detrimental effects of liquid lock damage are influenced not only by fluid properties but also by the porosity characteristics of the reservoir. In reservoirs with low permeability, condensate oil is prone to accumulation, leading to the formation of a “retrograde liquid lock” that further hinders gas flow. Conversely, higher reservoir permeability mitigates the effects of this liquid lock, thereby reducing the severity of retrograde condensation phenomena. The critical flow saturation of condensate oil is a key parameter that reflects its flow capacity and has significant implications for condensate oil recovery, gas well productivity, and stable production periods. A lower critical flow saturation facilitates greater condensate oil recovery during the depletion of the reservoir. Additionally, the speed of gas extraction during this phase is primarily affected by the potential for excessive extraction rates to cause rapid declines in formation pressure, which can intensify retrograde condensation, increase oil resistance, and ultimately decrease productivity.
The condensate oil content is the most significant influencing factor, as it directly determines the amount of condensate oil generated during this stage, thereby affecting the recovery rate and the damage to gas-phase permeability. Following this, reservoir permeability plays a crucial role in the production process by influencing fluid flow dynamics. The gas production rate indirectly affects the condensate oil recovery rate and gas-phase permeability by controlling the rate of pressure decline. In contrast, the critical flow saturation of condensate oil has a measurable effect on its mobility. However, this effect is relatively small and typically becomes significant only in cases of substantial liquid phase accumulation. Consequently, its importance is ranked lower.

4.3. Stage 3—Pressure Below Max Retrograde Condensation

The Stage 3 experimental results and range analysis are shown in Table 8. At this stage, as the reservoir pressure falls below the maximum retrograde condensation pressure, the condensate oil in the reservoir gradually evaporates, which leads to a reduction in the extent of damage to the gas-phase relative permeability. The changes in two-phase flow characteristics have varying effects on condensate oil recovery and the degree of the gas-phase relative permeability damage rate.
Compared to the second stage, the ranking of primary factors affecting the condensate recovery rate and mitigation of the gas-phase permeability damage rate changed in the third stage. The results from Table 8 and Figure 10 indicate that reservoir permeability has become the most significant influencing factor, with impacts on the test indicators of 52% and 54%. The influence of condensate content ranks second in this stage, with impacts of 36% and 37%. The ranking of the gas production rate and critical flow saturation of the condensate remains unchanged and has no significant effect on the test indicators at this stage.
During the condensate oil evaporation stage, reservoir permeability emerges as the primary factor influencing production indicators. High-permeability reservoirs facilitate the effective displacement of liquid oil towards the wellbore by the gas phase. This process not only alleviates condensate oil blockage to some extent but also enhances oil recovery rates while mitigating damage to gas-phase relative permeability. In contrast to the second stage, the content of condensate oil does not significantly affect the flow capacity of both the condensate oil and gas phases during this stage. The results from constant volume depletion experiments reveal notable differences among fluids with varying condensate oil content during the retrograde condensation and evaporation processes. In the retrograde condensation process, condensate oil precipitates rapidly, swiftly reaching the maximum retrograde liquid volume, while the evaporation process occurs at a comparatively slower pace. Consequently, the influence of condensate oil content is more pronounced in the second stage than in the third stage. The gas production rate plays a crucial role during this stage by regulating the rate of decline in formation pressure, exerting a more indirect influence that can be controlled operationally. As the liquid phase begins to evaporate, the significance of critical flow saturation on liquid phase mobility diminishes, leading to a reduced likelihood of liquid phase retention, and thus, its impact remains relatively small.
In summary, throughout the condensate oil production phase, reservoir permeability and condensate oil content serve as the primary controlling factors influencing gas reservoir production indicators. The importance of influencing factors at different production stages is shown in Figure 11. Permeability directly determines fluid flow within the reservoir; higher permeability reduces liquid phase retention, increases gas-phase permeability, and improves the oil and gas recovery rates. Additionally, condensate oil content significantly affects the formation and re-evaporation of the liquid phase at each stage of production. Therefore, the effective management and optimization of reservoir permeability are crucial during the development of condensate gas reservoirs, necessitating a thorough assessment and analysis of condensate gas fluid characteristics in the early stages. Although the impact of the gas production rate on production indicators is relatively small, it remains easily adjustable during production. The proper regulation of the gas production rate can delay pressure decline, reduce liquid phase retention, and optimize recovery rates. During development, gas production rates should be adjusted based on reservoir characteristics and production stages. While the influence of the critical flow saturation of condensate oil is relatively limited, it can become a key factor affecting gas-phase permeability and recovery rates under specific conditions. Consequently, it should also be considered in the design and production strategy. At different stages, it is essential to manage these factors effectively and adopt appropriate production measures to optimize gas field production efficiency.

5. Practical Application in Production

5.1. Production Case Study

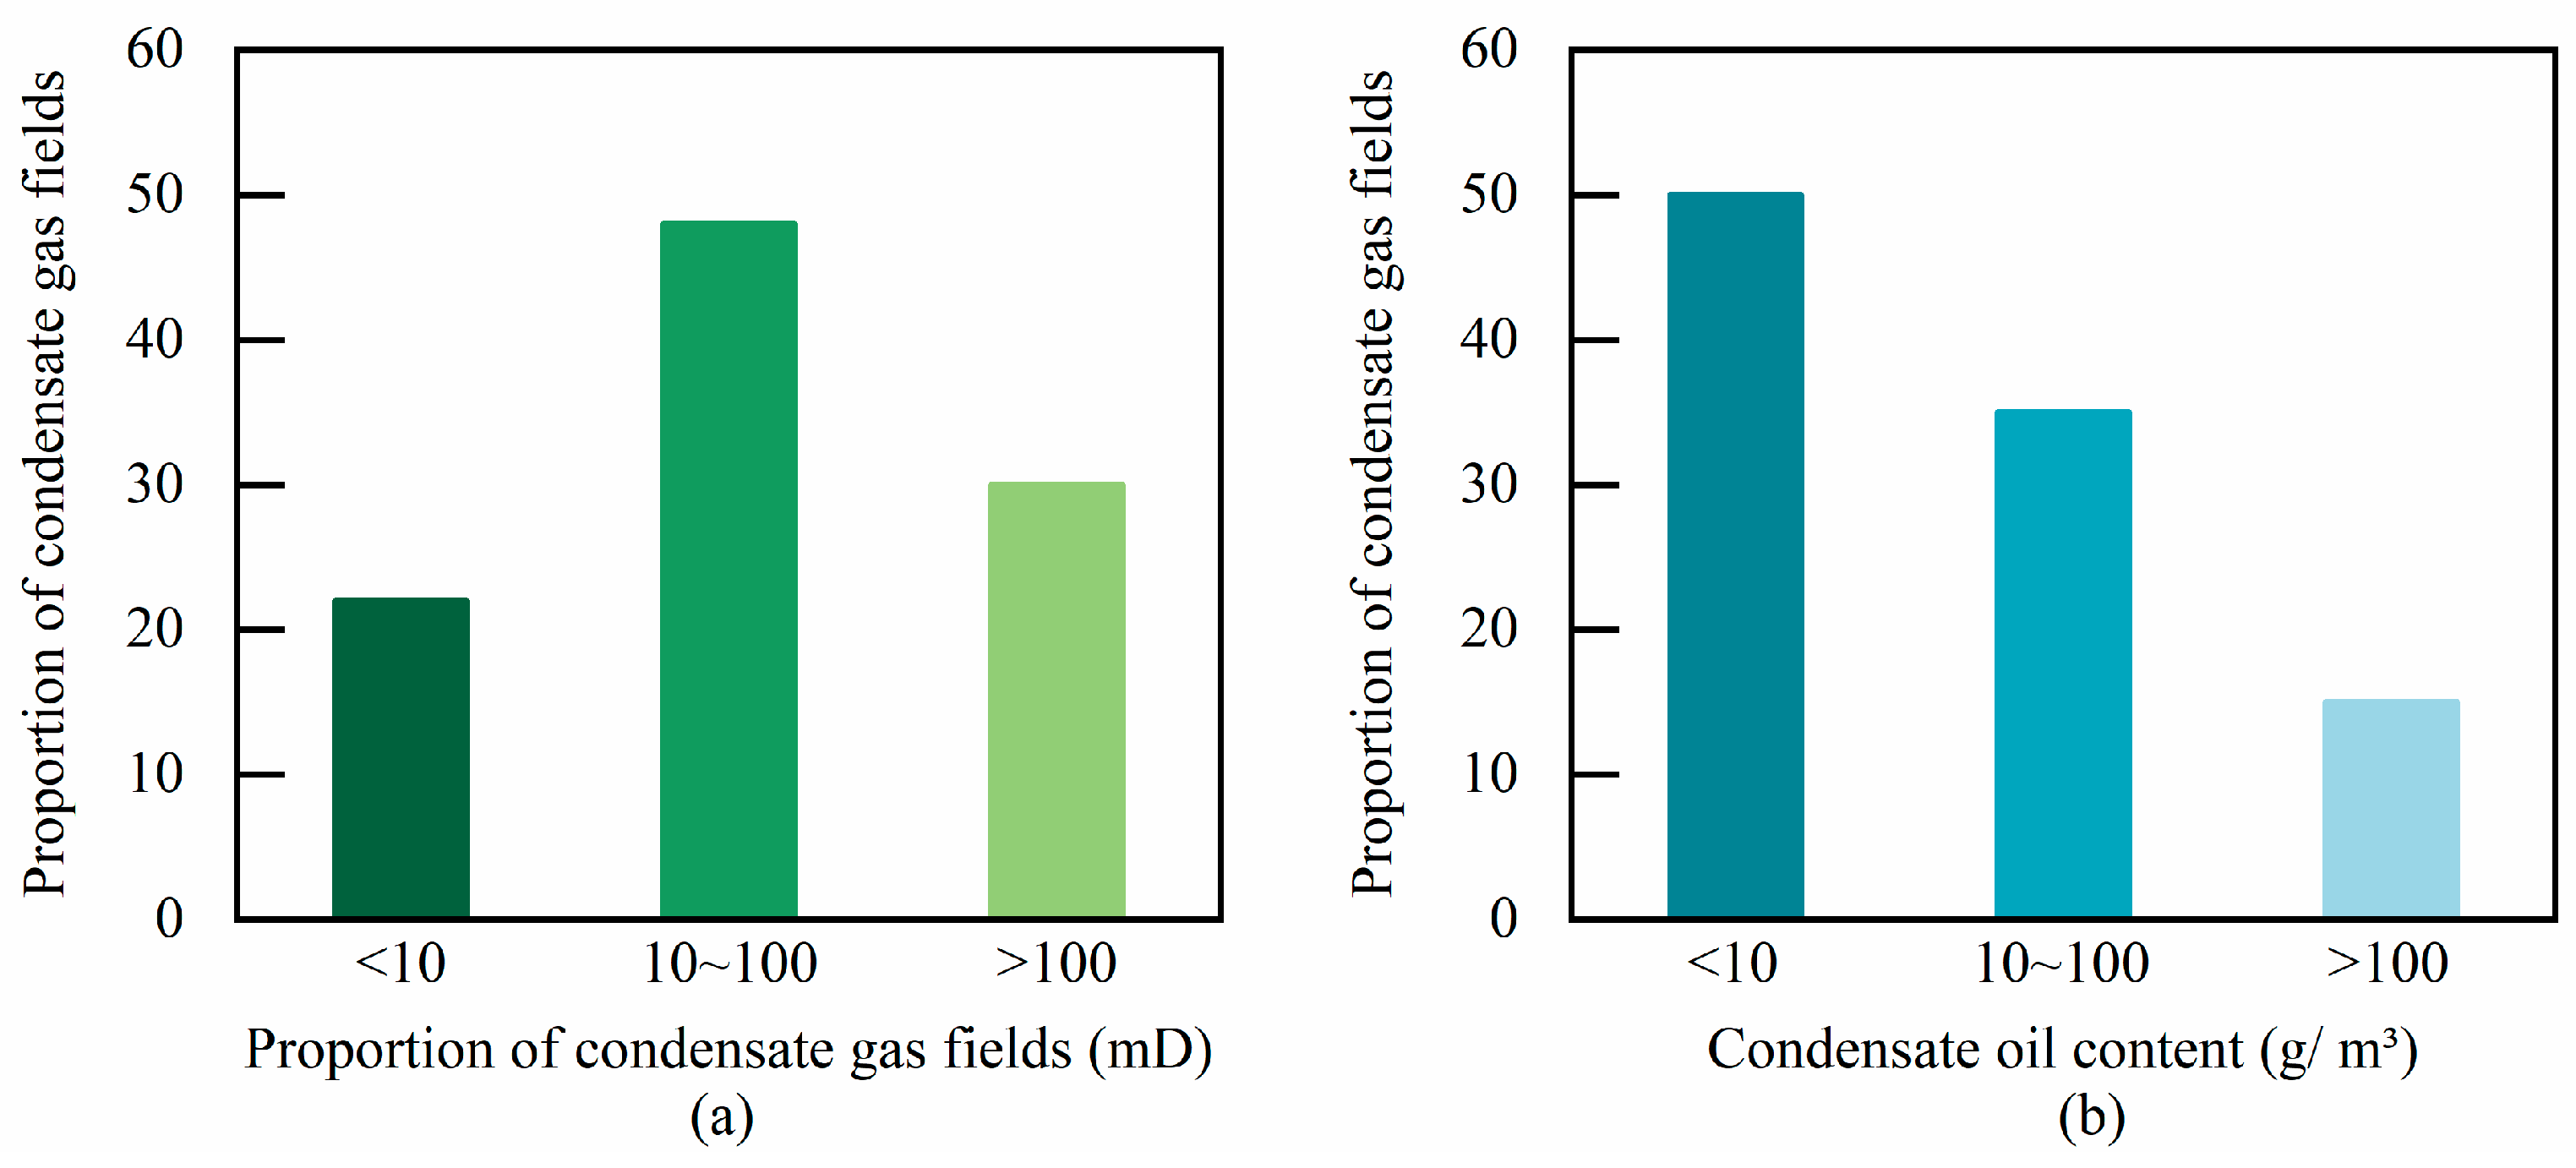
Currently, a substantial portion of both domestic and international natural gas reservoirs consists of condensate gas reservoirs, which are crucial for the development of gas fields. Incomplete statistics indicate that the depth of these condensate gas reservoirs typically lies below 4500 m, with formation temperatures ranging from 40 to 187 °C and original formation pressures between 20 and 40 MPa. Most reservoirs are categorized as porous or porous–fractured types, exhibiting medium-to-low porosity and permeability. The ΔPfd of fluids in condensate gas fields is relatively small, varying from 0.7 to 10.4 MPa, with an average of 2.9 MPa. Additionally, these fields generally exhibit a low relative density of natural gas, characterized by a high total hydrocarbon content and a low non-hydrocarbon content. Condensate oil is typically characterized by low density, a high content of light components, and a low content of heavy components, with condensate oil concentrations ranging from 22 g/m3 to 1297 g/m3. 
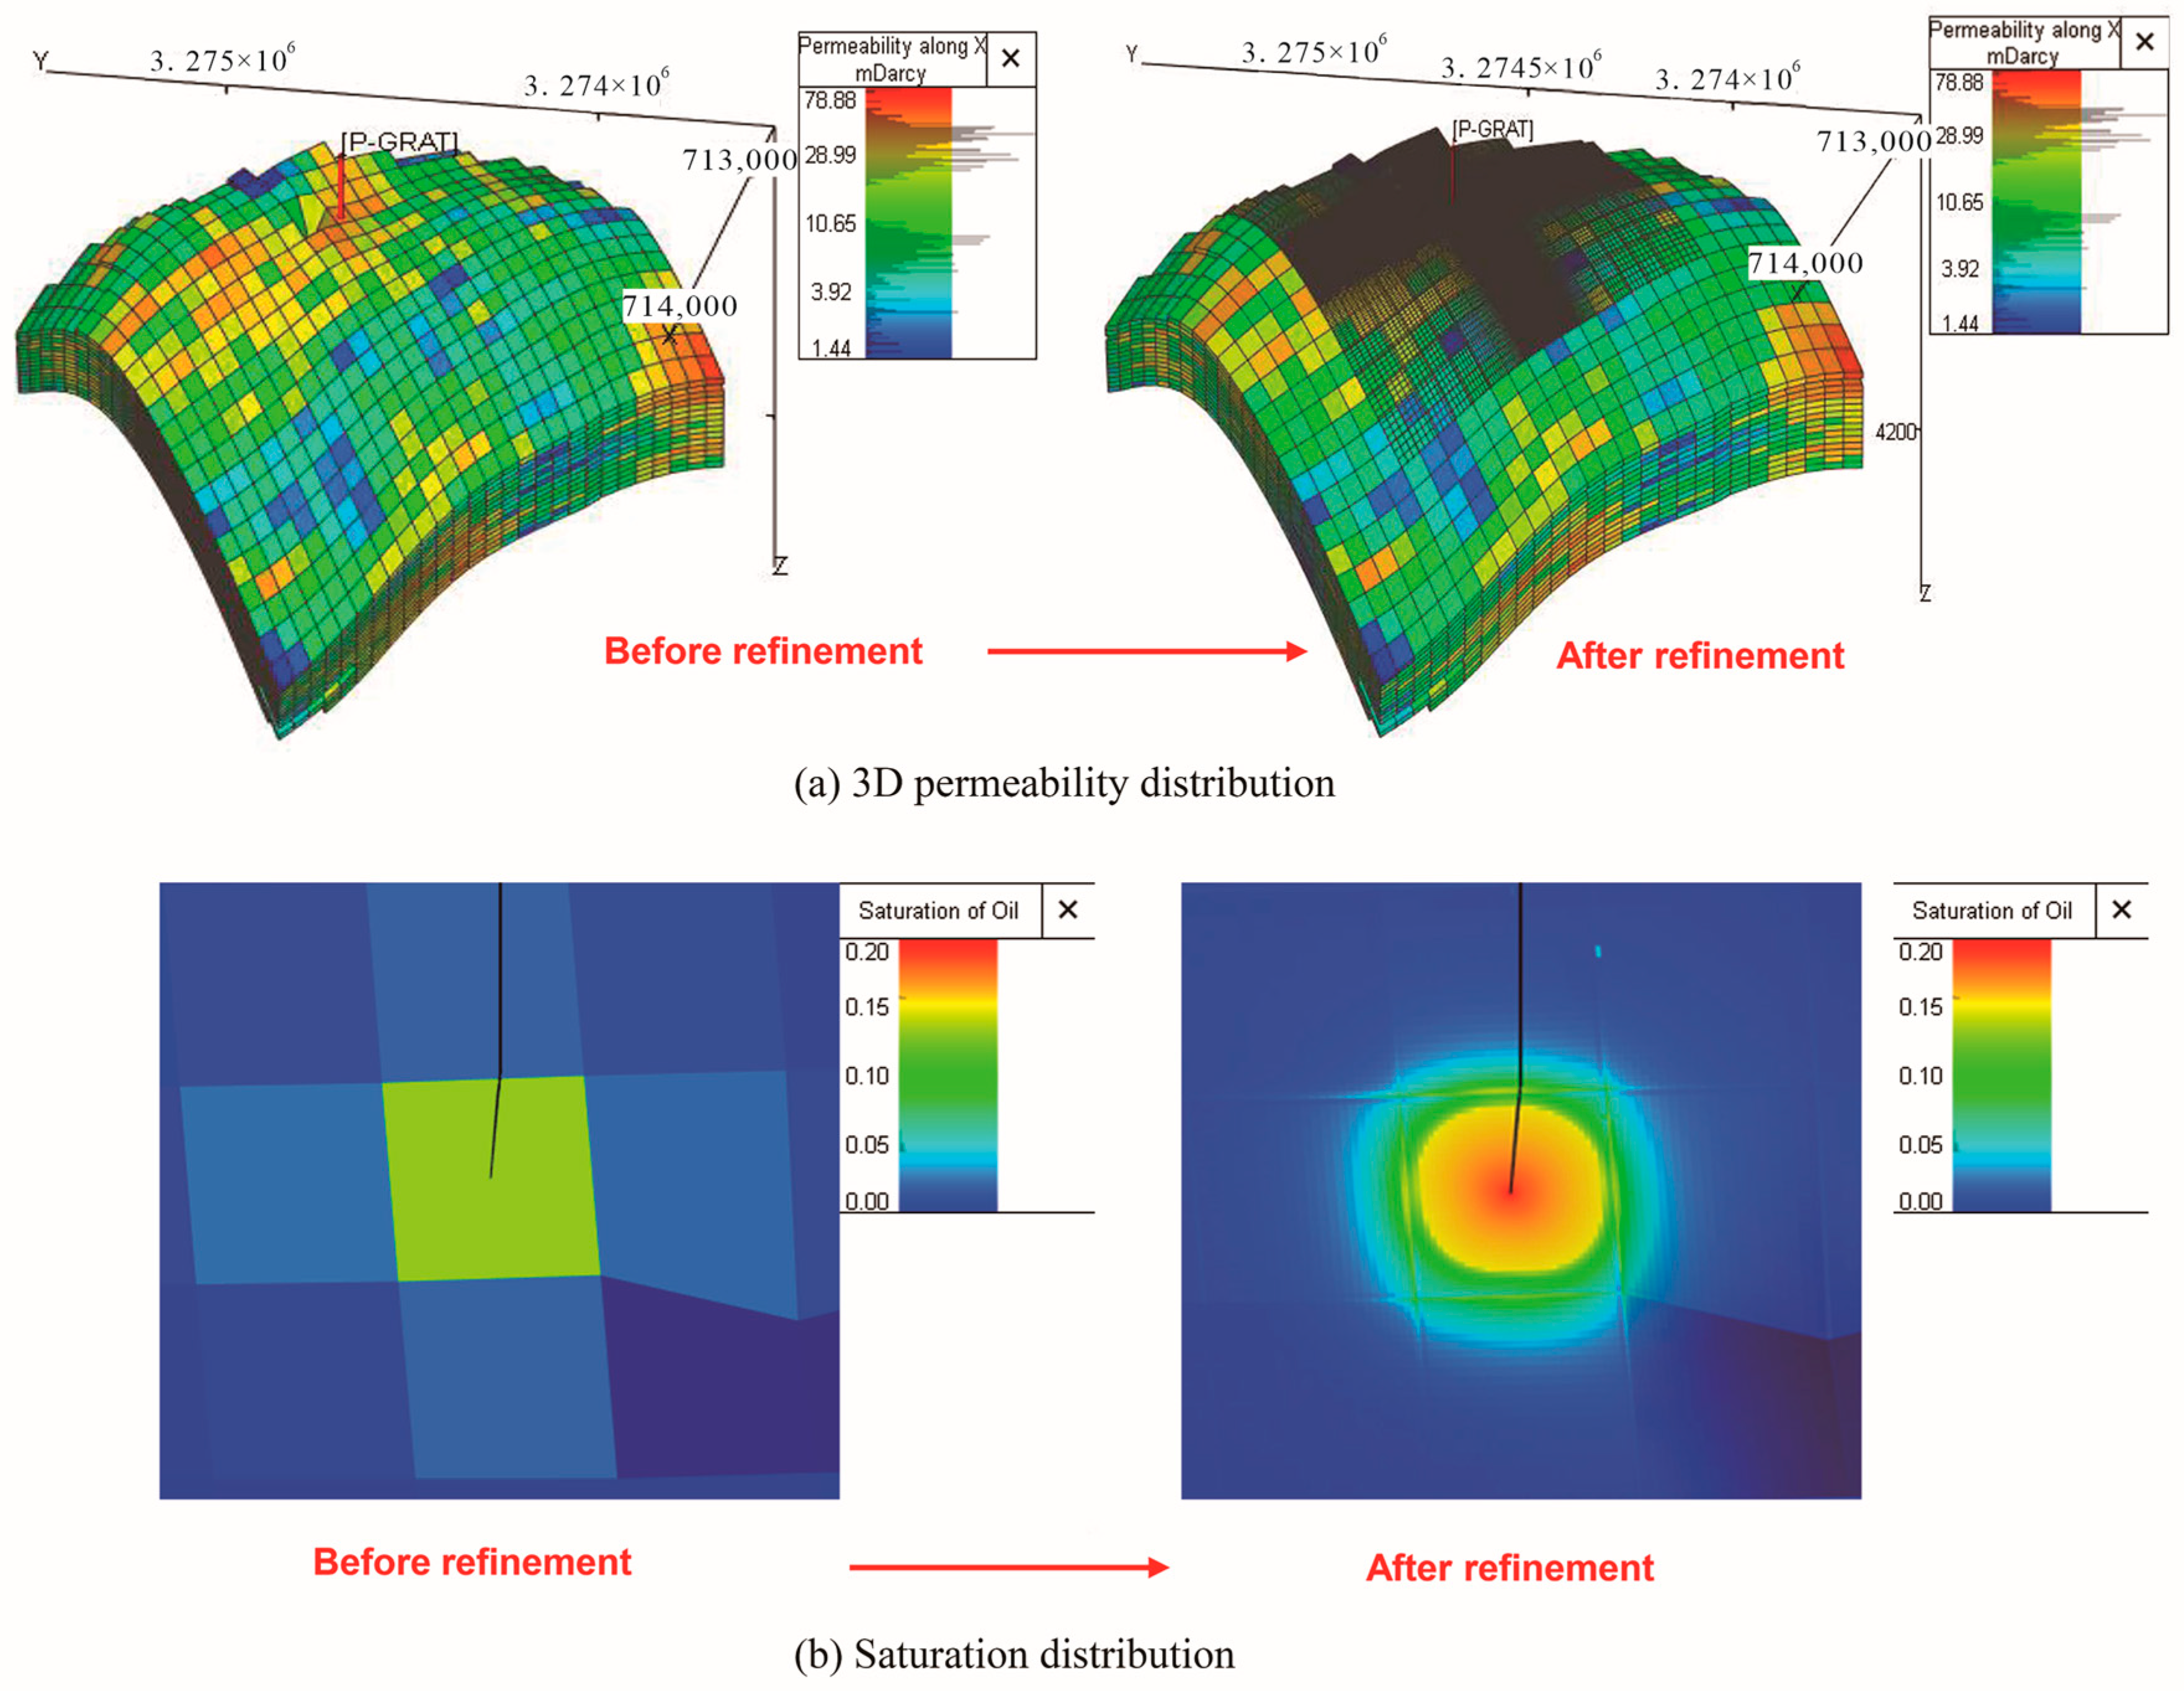
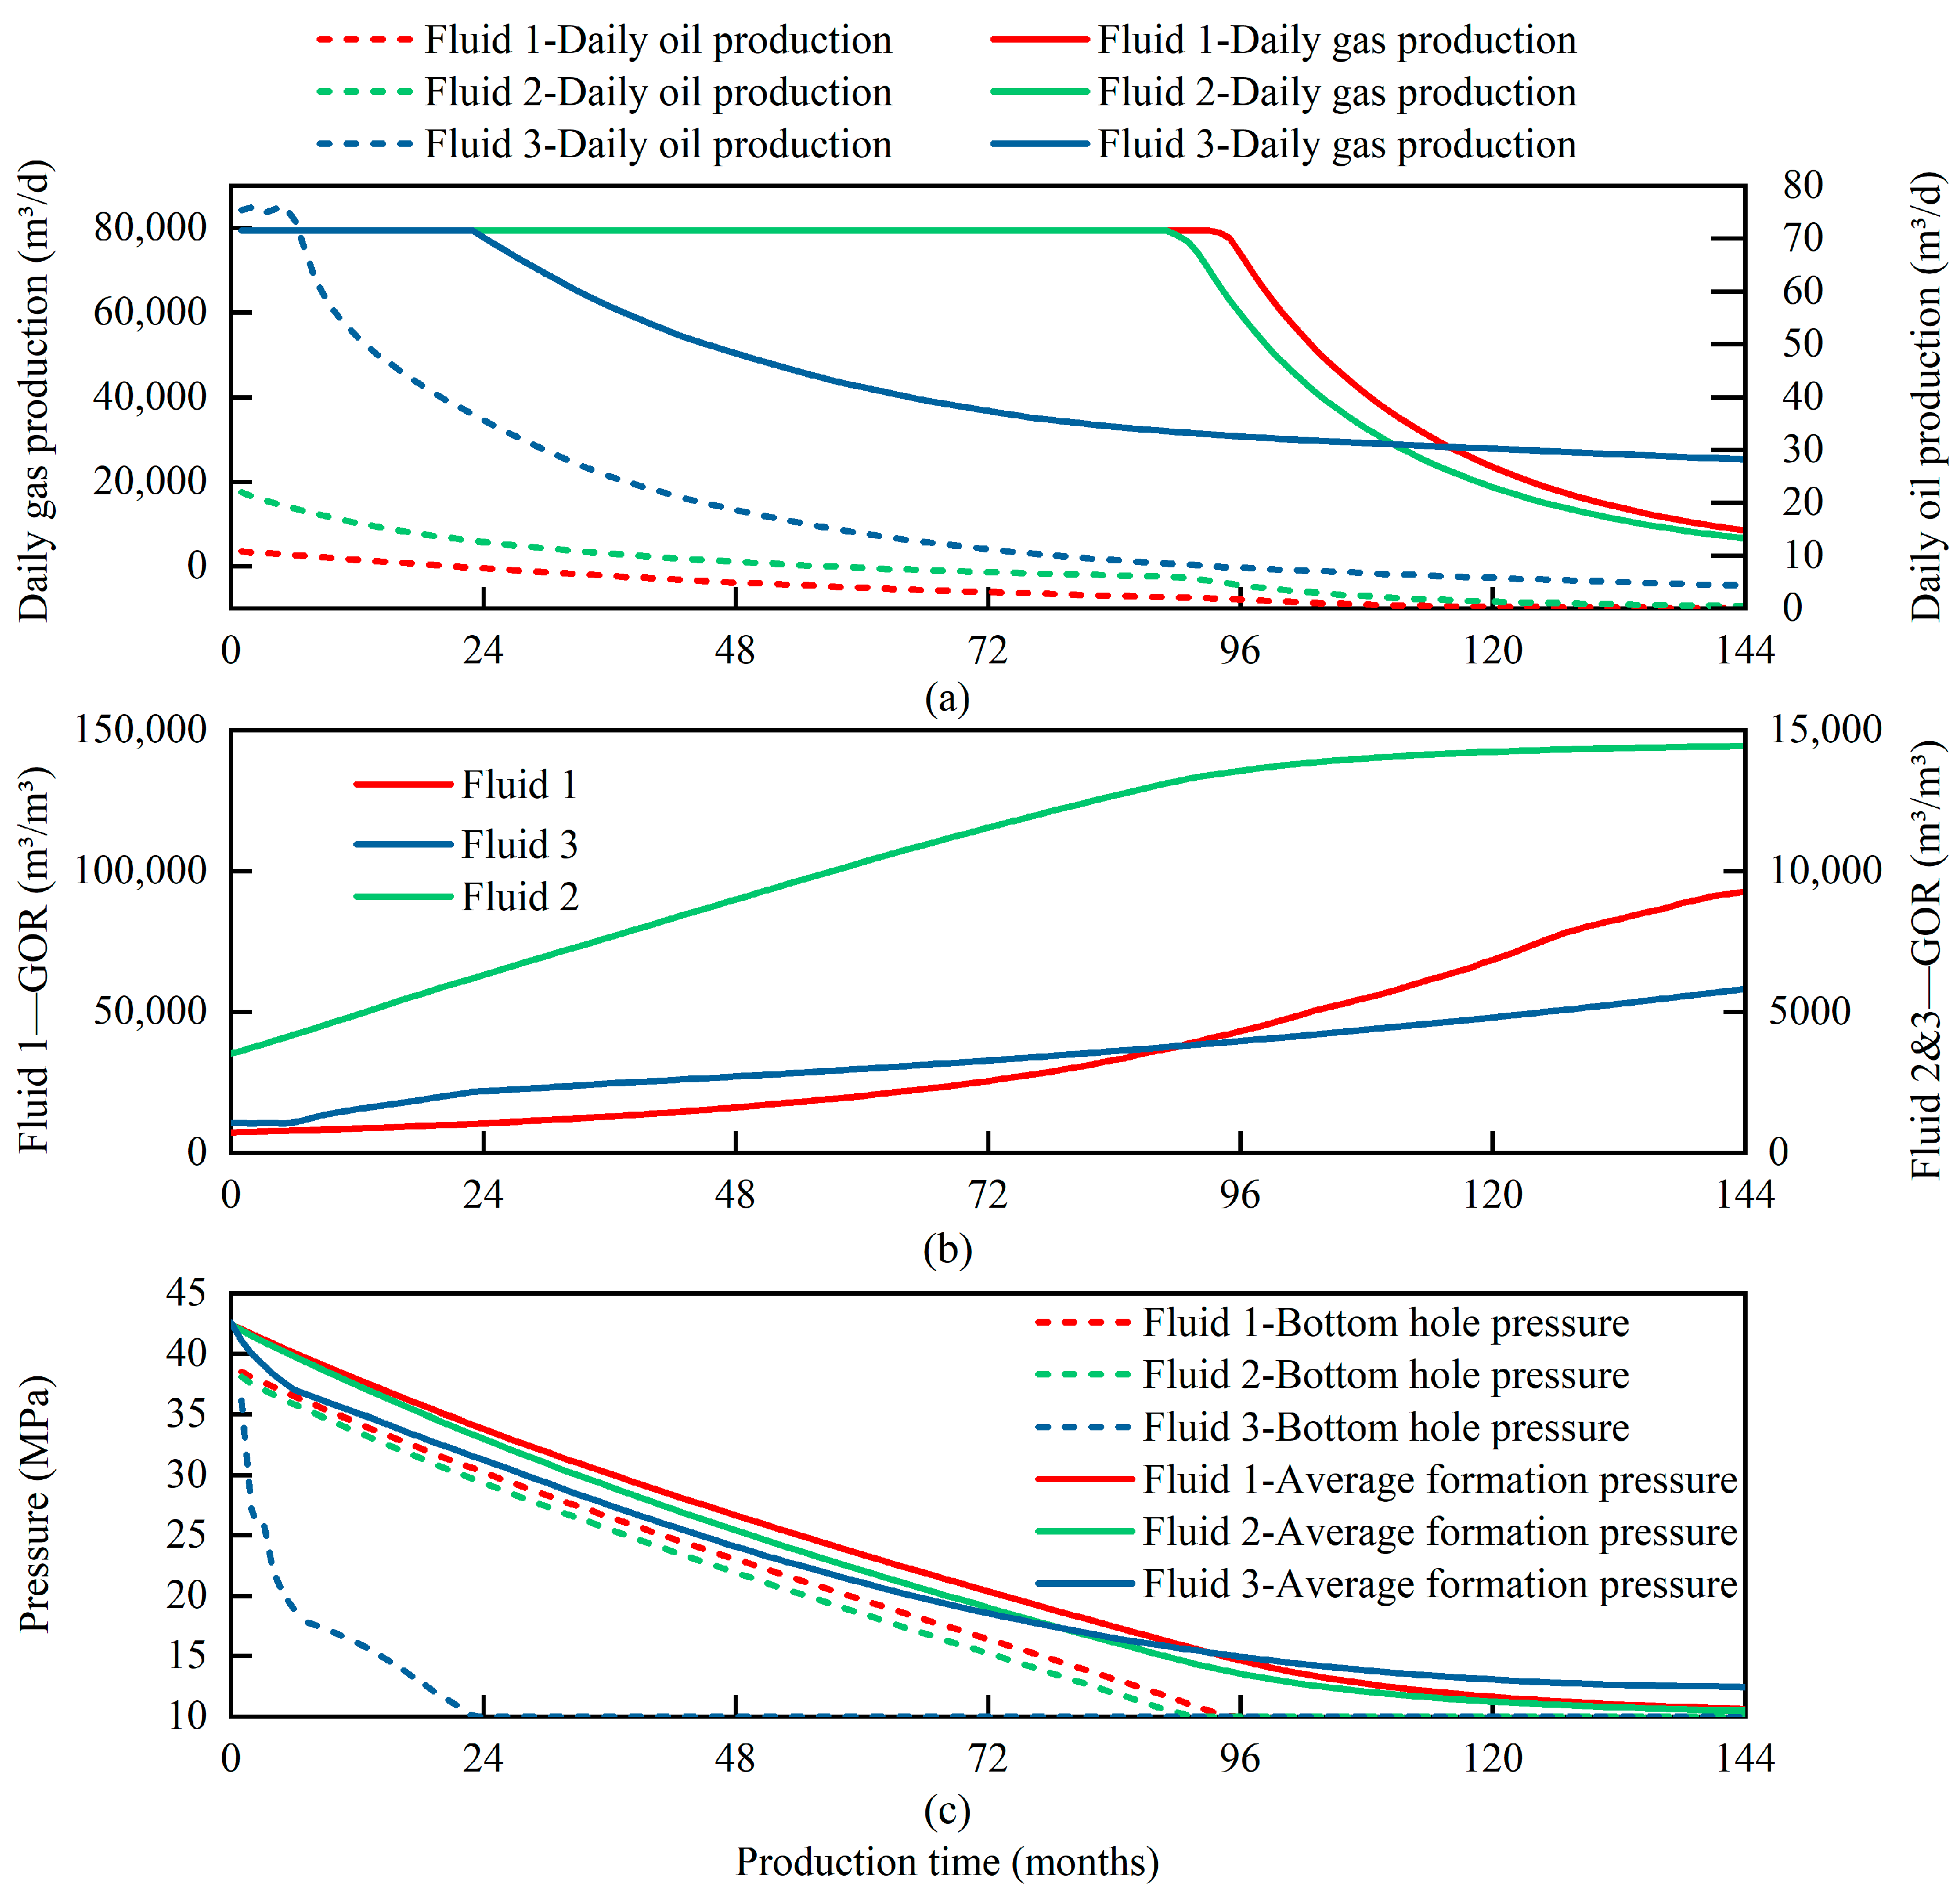
Figure 12 shows the permeability of the condensate reservoir and the distribution of condensate oil content.
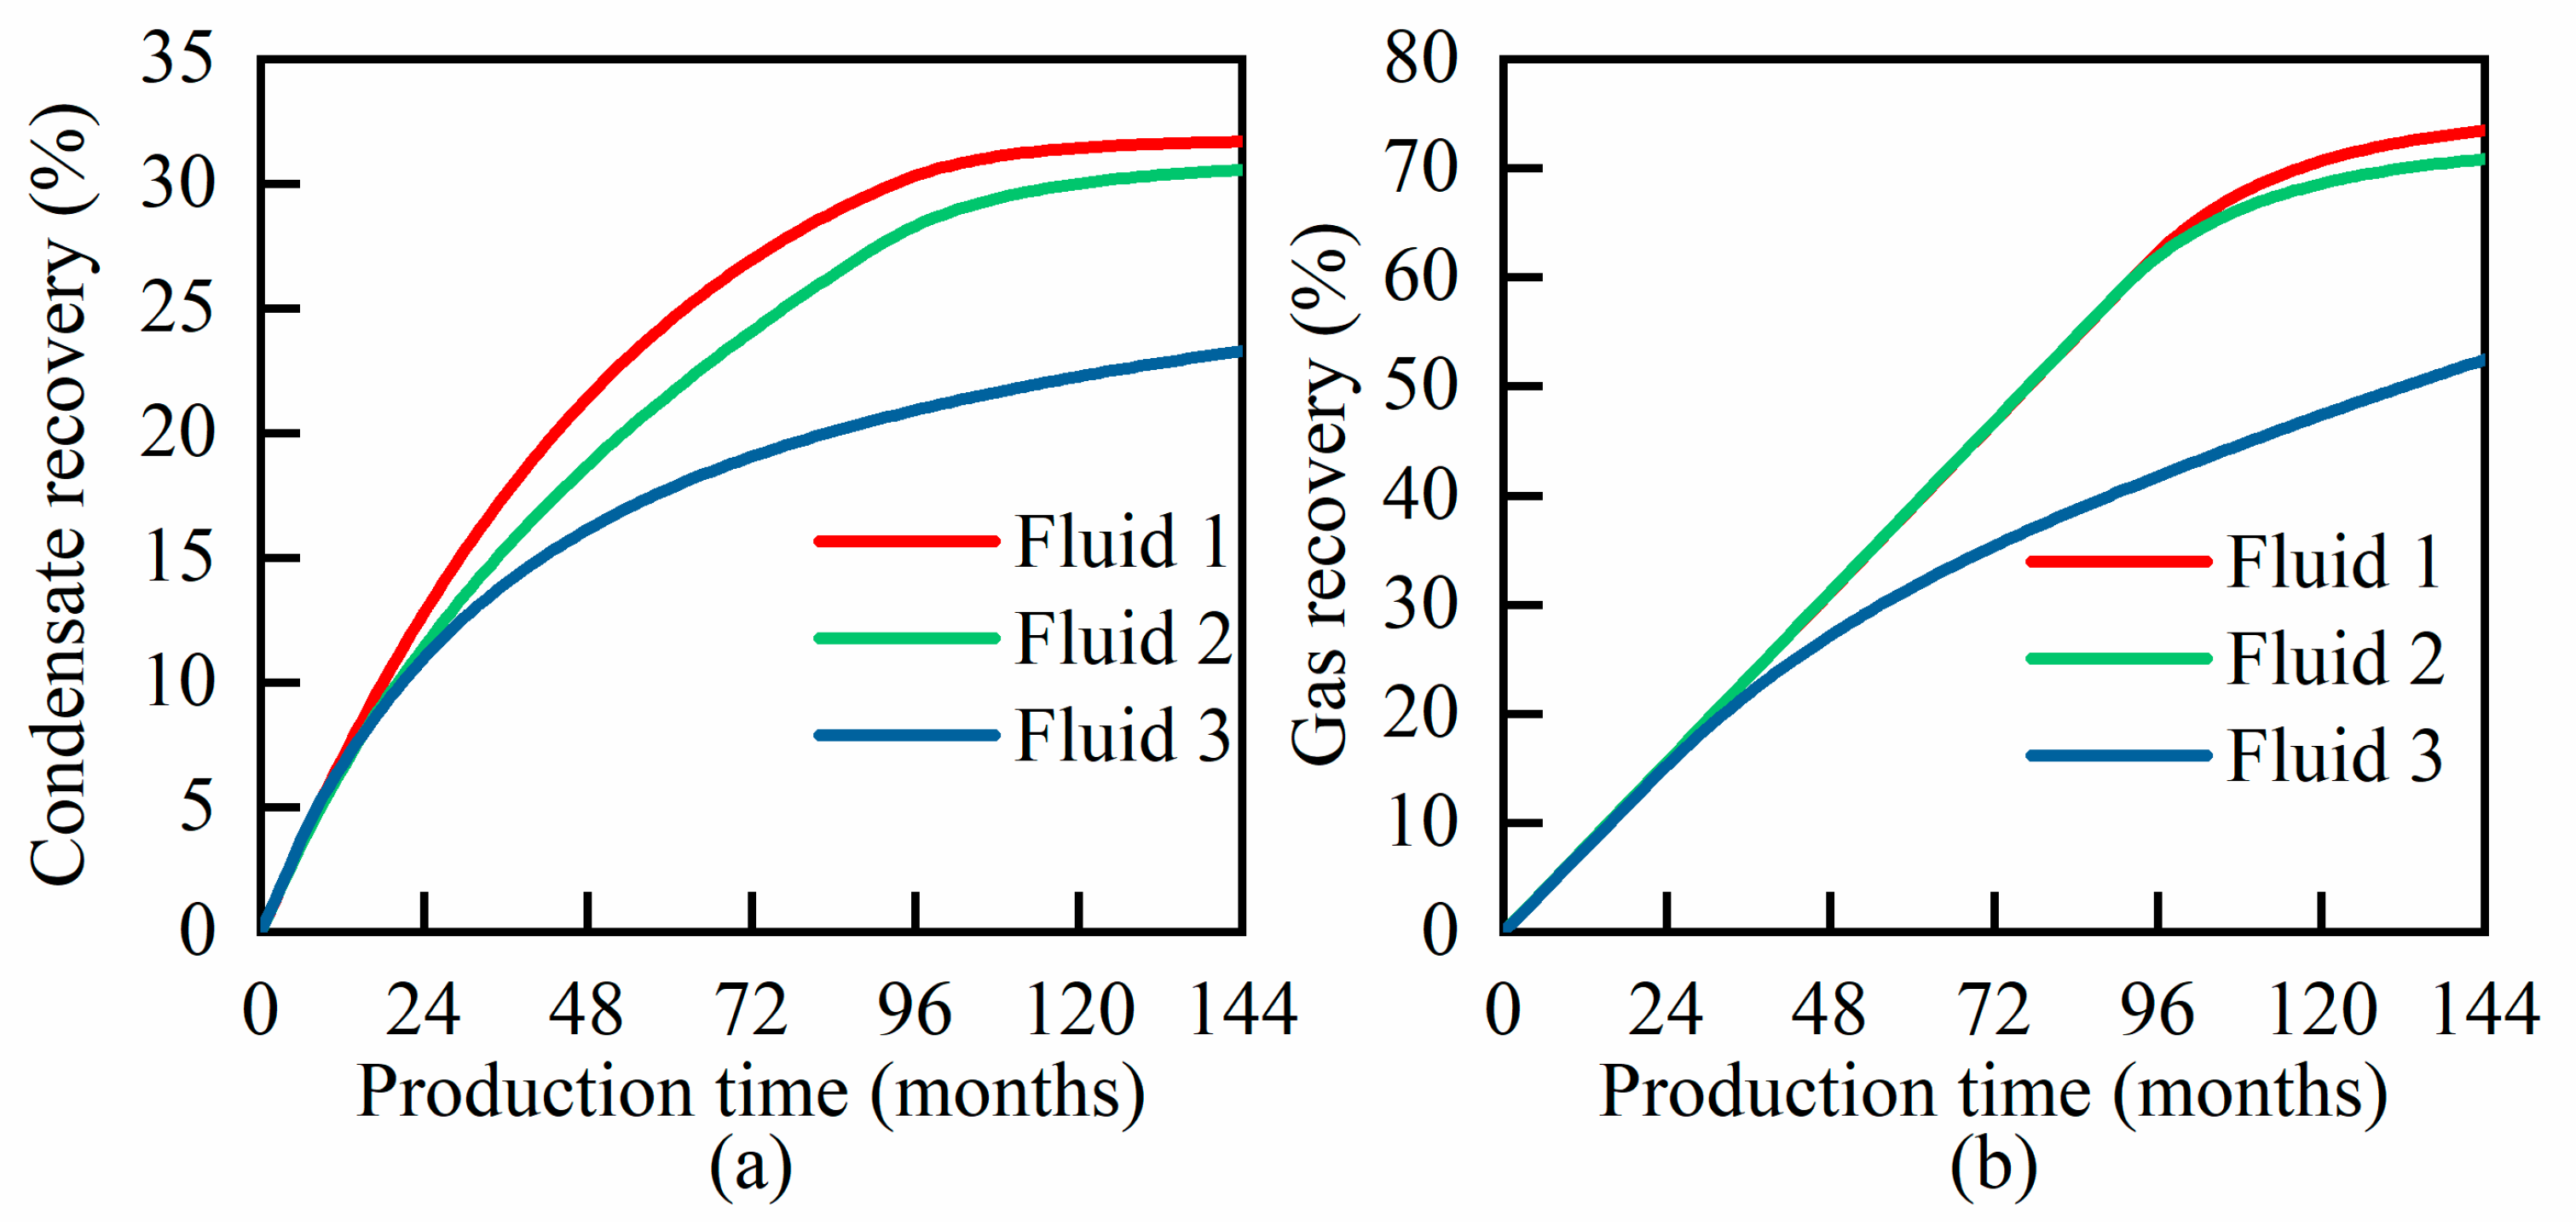
Currently, condensate gas fields predominantly use depletion and gas cycling recovery methods. The range of condensate recovery rates is quite extensive, as shown in Figure 13, with recovery rates as low as 2% in the absence of production measures and as high as 88.5% when such measures are implemented. As indicated in Table 9, gas reservoirs with high condensate oil content primarily utilize gas injection recovery, achieving condensate recovery rates exceeding 40%. In contrast, medium- and low-condensate-oil-content gas reservoirs mainly rely on depletion recovery, with recovery rates approximately between 20% and 30%. The predominant drive types are gas drive and water drive, with gas production rates varying from a minimum of 0.19% to a maximum of 8% [32,33,34,35,36,37,38].
(1)
QD Gas Field:
The QD Gas Field is a complete anticline structure comprising four gas–water systems with analogous fluid properties and reservoir characteristics, arranged from bottom to top. The predominant reservoir rocks include lithic sandstones and feldspathic lithic sandstones, characterized primarily by intergranular dissolution pores.
The interlayers separating the gas reservoirs are well developed and stable, ensuring effective sealing properties. The primary producing formation is the Middle Jurassic Xishanyao Formation (J2x), situated at a depth of 3246.5 m in the central region of the field. This formation is classified as a low-permeability sandstone reservoir, consisting of sheet sand deposits located at the front of a fan delta, with an orientation approximately north–south. The lithology is predominantly silt-bearing fine sandstone and medium–fine sandstone, exhibiting relatively dense rock characteristics. Porosity within the reservoir ranges from 3.7% to 13.0%, with an average of 10.5%. Reservoir permeability varies from 1.1 mD to 12.0 mD, averaging 4.1 mD. The gas reservoir temperature fluctuates between 93.4 °C and 100.6 °C, while the formation pressure ranges from 31.3 MPa to 34.6 MPa, with an average of 32.24 MPa and a temperature gradient of 2.56 °C/100 m. The condensate oil content within the gas reservoir ranges from 190.5 g/m3 to 260.4 g/m3, indicating a medium condensate gas reservoir with an average condensate oil content of 226.3 g/m3. The differential pressure between the formation and the surface is relatively small, ranging from 0.12 MPa to 2.53 MPa, with an average of 1.47 MPa. Notably, the gas reservoir is characterized by an absence of sulfur, a low non-hydrocarbon content (less than 1.56%), and inactive edge and bottom water energy, with no significant water production observed in the gas wells.
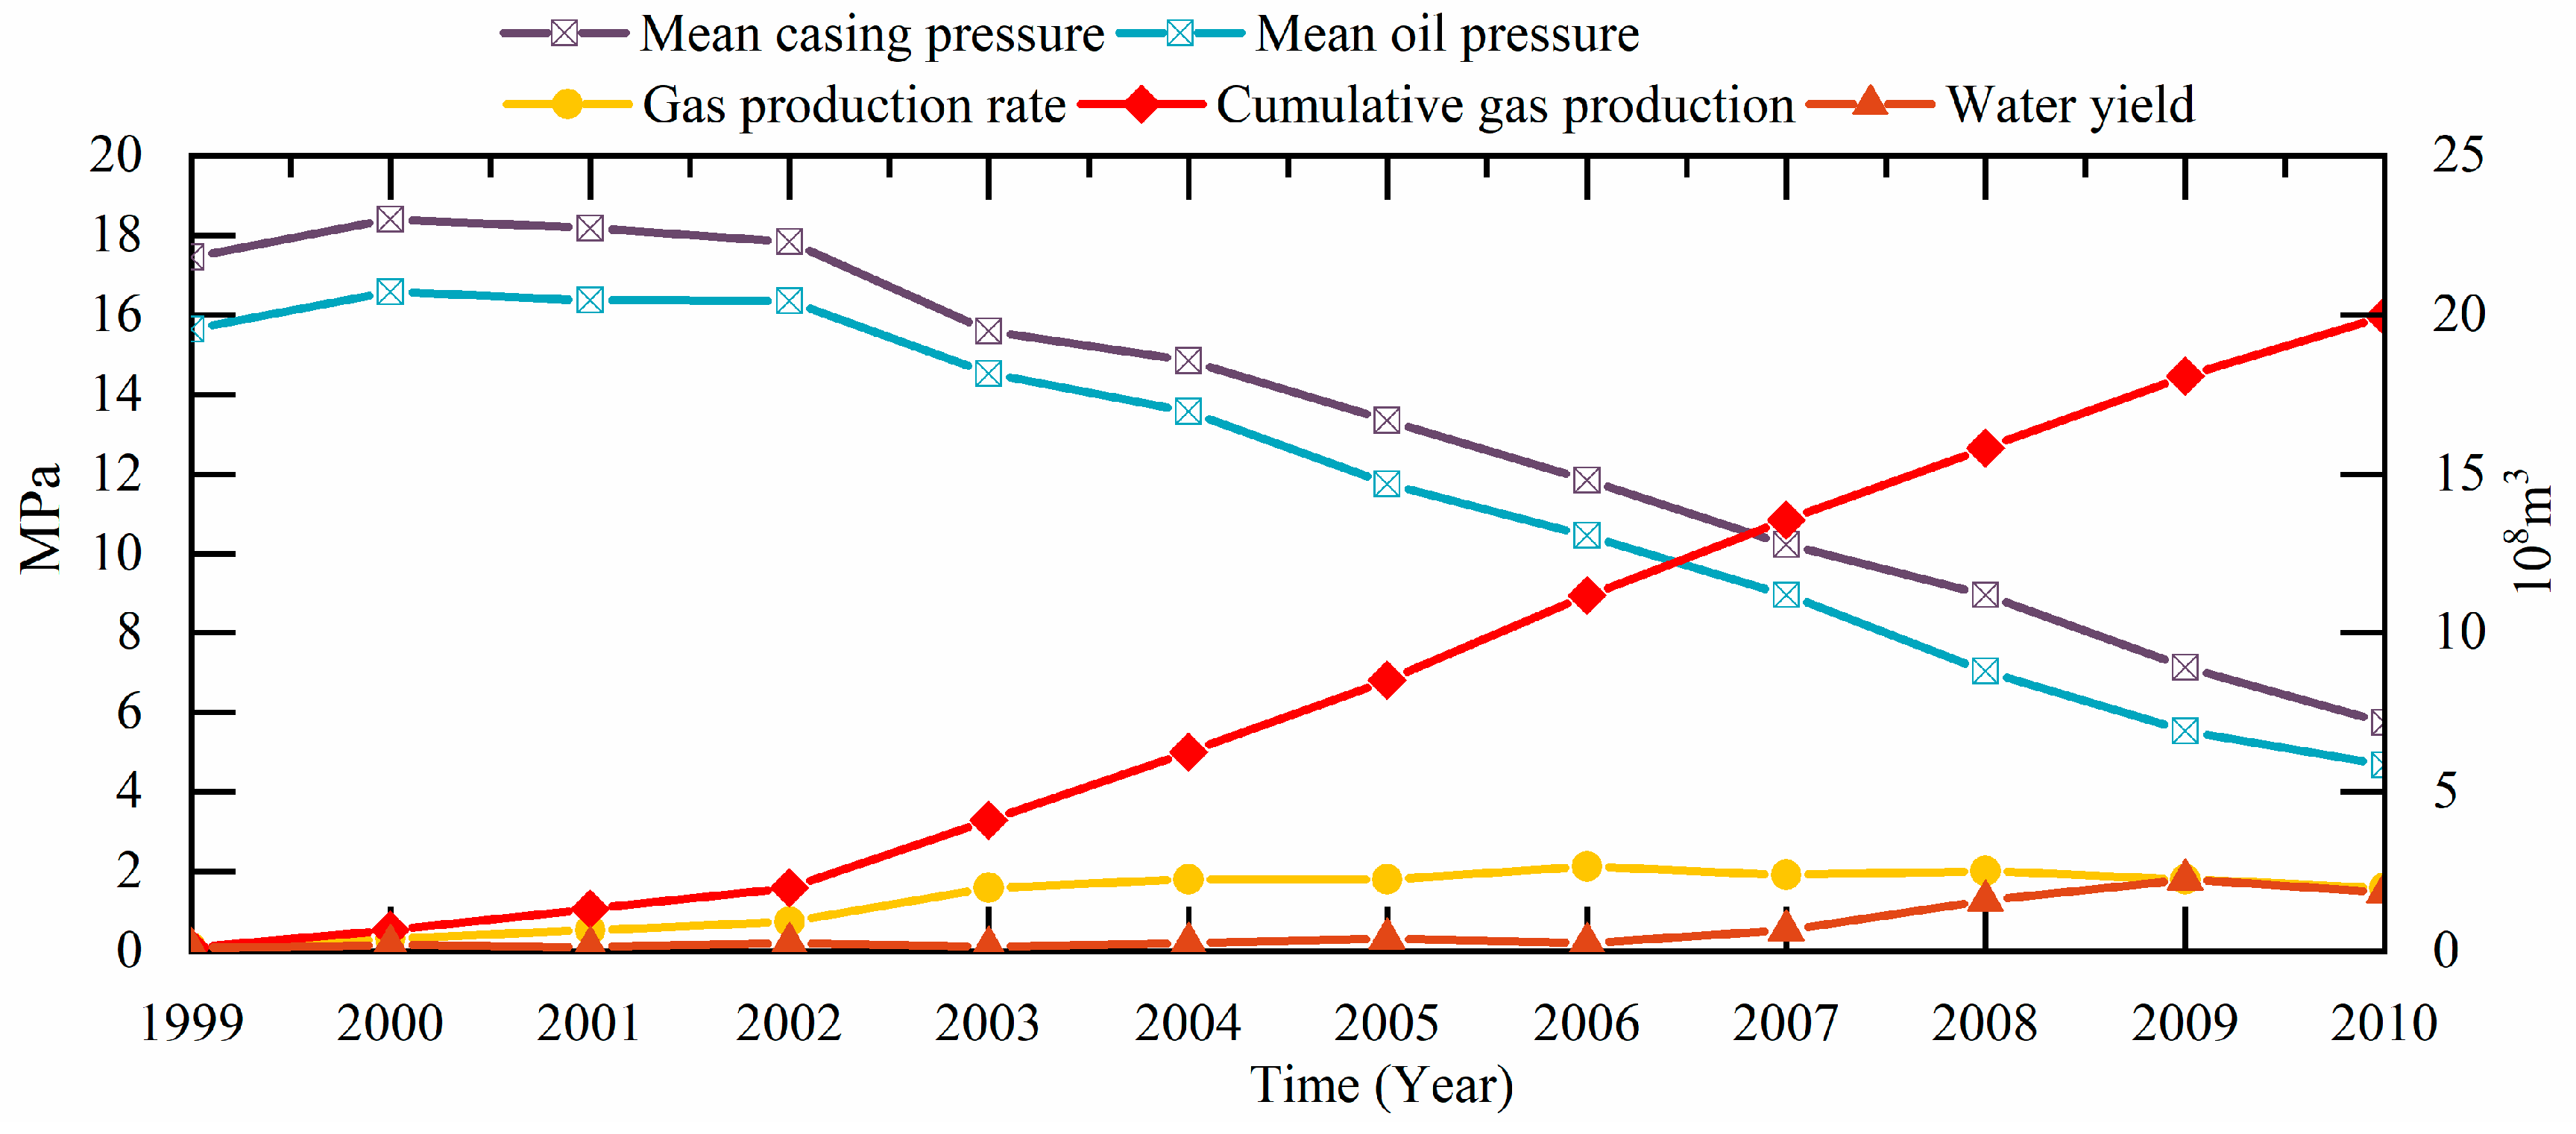
The natural gas production curve of the QD Gas Field is shown in Figure 14. The field adopted a depletion development strategy in October 1998. By the end of 2009, the field had 15 gas production wells, with a current gas production rate of 2.93%, a natural gas recovery rate of 26%, and a condensate recovery rate of 19.26%. The maximum retrograde condensation pressure within the field ranges from approximately 10 to 15 MPa. Following a decade of depletion development, the formation pressure has decreased to 13.68 MPa, marking the onset of the maximum retrograde condensation pollution stage [39]. An analysis of well test data reveals that all 14 wells currently in production are experiencing varying degrees of retrograde condensation pollution. Notably, three of these wells have exhibited a reduction in gas-phase permeability near the wellbore, ranging from 37.5% to 44%, alongside a decrease in the gas supply radius of 66.17% to 88.61%. Consequently, the entire gas field is significantly affected by retrograde condensation pollution.
Condensate oil pollution leads to a reduction in gas-phase permeability. To address this issue, the QD Gas Field employs hydraulic fracturing production technology, which aims to enhance reservoir permeability, improve fluid flow capacity, and increase the permeability of the near-wellbore area. This technique is instrumental in mitigating retrograde condensation pollution within the QD Gas Field, ultimately contributing to increased production levels. Hydraulic fracturing was conducted on wells QD22, QD25, and QD26, and the results are summarized in Table 10. Notably, after the fracturing process, the gas–oil ratio of well QD25 decreased from 6731 m3/m3 to 3939 m3/m3, while natural gas productivity surged by a factor of three, and condensate oil production rose by 2.54 times. These findings indicate that hydraulic fracturing has effectively alleviated retrograde condensation pollution.
(2)
KK Gas Field:
The KK Gas Field is characterized by a short-axis anticline structure that extends nearly east–west, with lithology predominantly consisting of fine sandstone. The reservoir depth ranges from 2960 to 4000 m, with temperatures varying between 82 °C and 142 °C and an initial formation pressure of 39.4 MPa. The gas-bearing area of the reservoir measures 27.5 km2, and the cumulative proven natural gas geological reserve is estimated at 38.99 billion m3 alongside a condensate oil geological reserve of 1.4425 million tons. The porosity ranges from 9% to 18%, with an average of 12%. Permeability ranges from 5.5 to 126 mD, yielding an average permeability of 40 mD. Additionally, the fluid in this gas reservoir has a condensate oil content between 300 and 700 g/m3, categorizing it as a gas reservoir with medium-to-high condensate oil content [42].
The gas field was put into development in 1988 using depletion development. The formation pressure declined rapidly, and many wells experienced reduced production or shutdown due to retrograde condensation pollution in the formation around the wellbore or liquid accumulation at the well bottom. Among them, gas wells K416, K354, and K233 lost production due to retrograde condensation pollution. The surface condensate oil production of the entire gas field decreased, and the gas–oil ratio increased rapidly.
A comprehensive dynamic monitoring system was established for this condensate gas reservoir. Different development methods were adjusted for different layers and blocks to optimize gas field recovery rates and increase economic benefits.
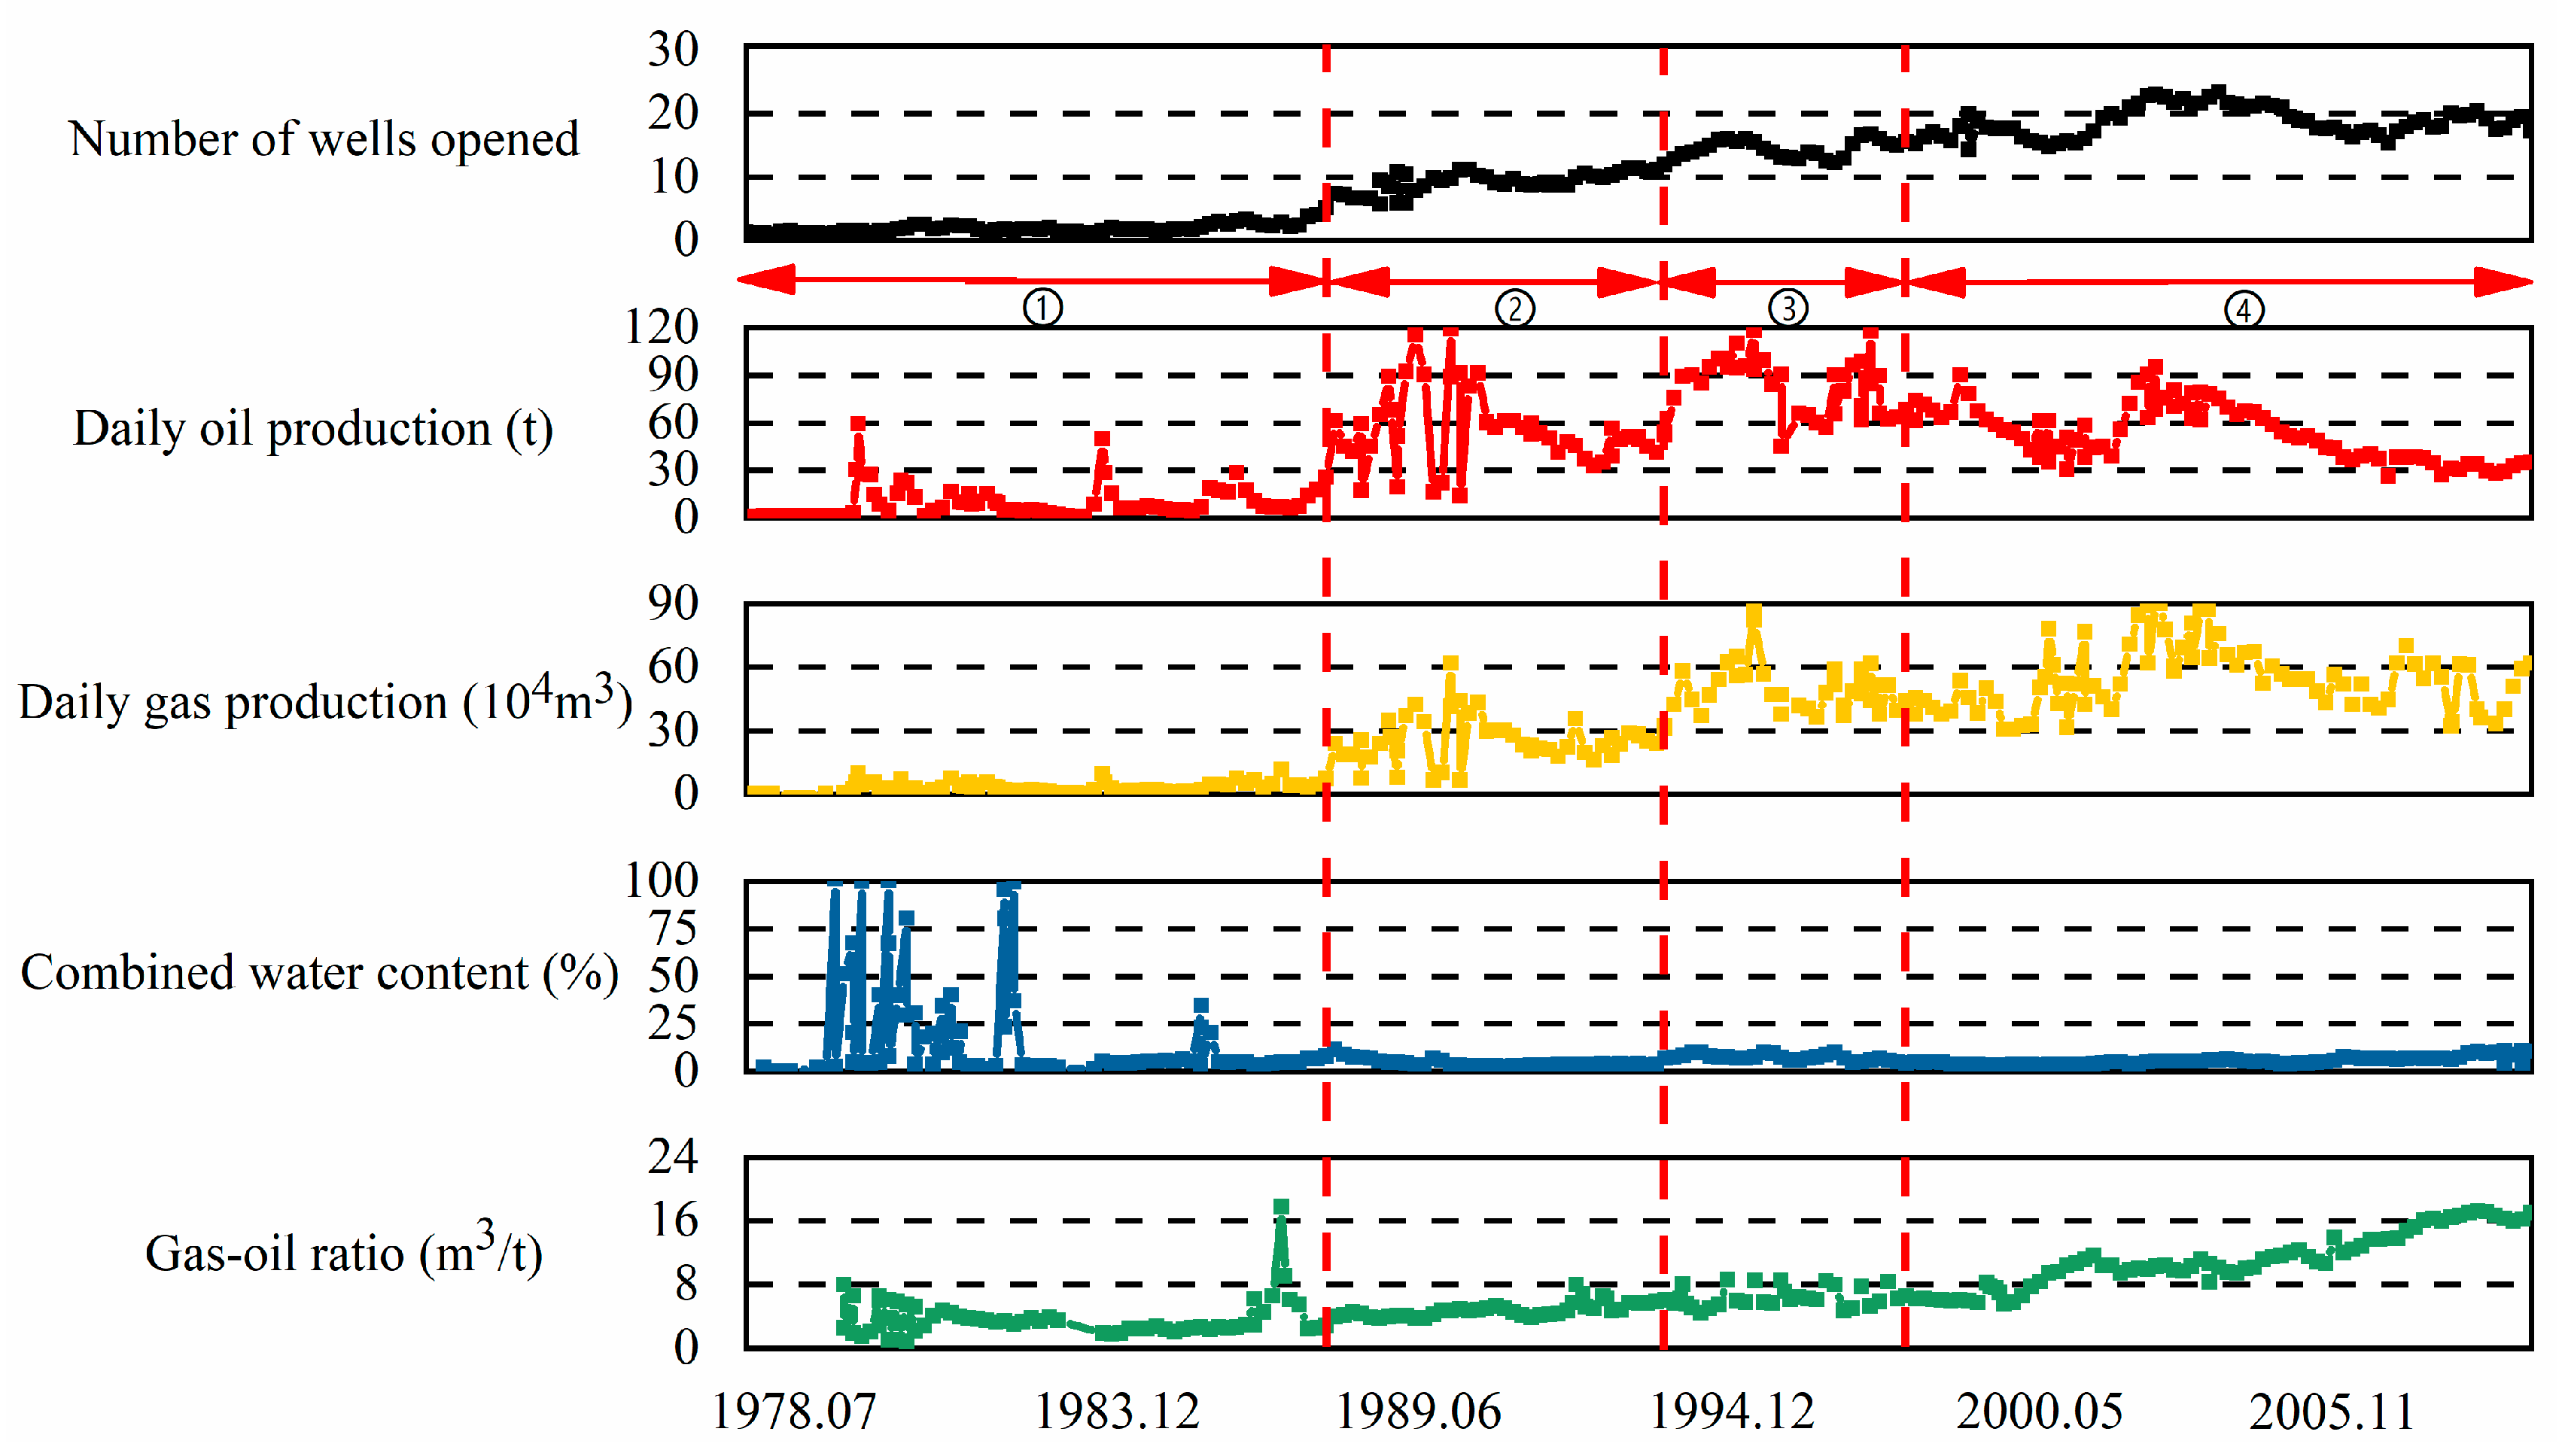
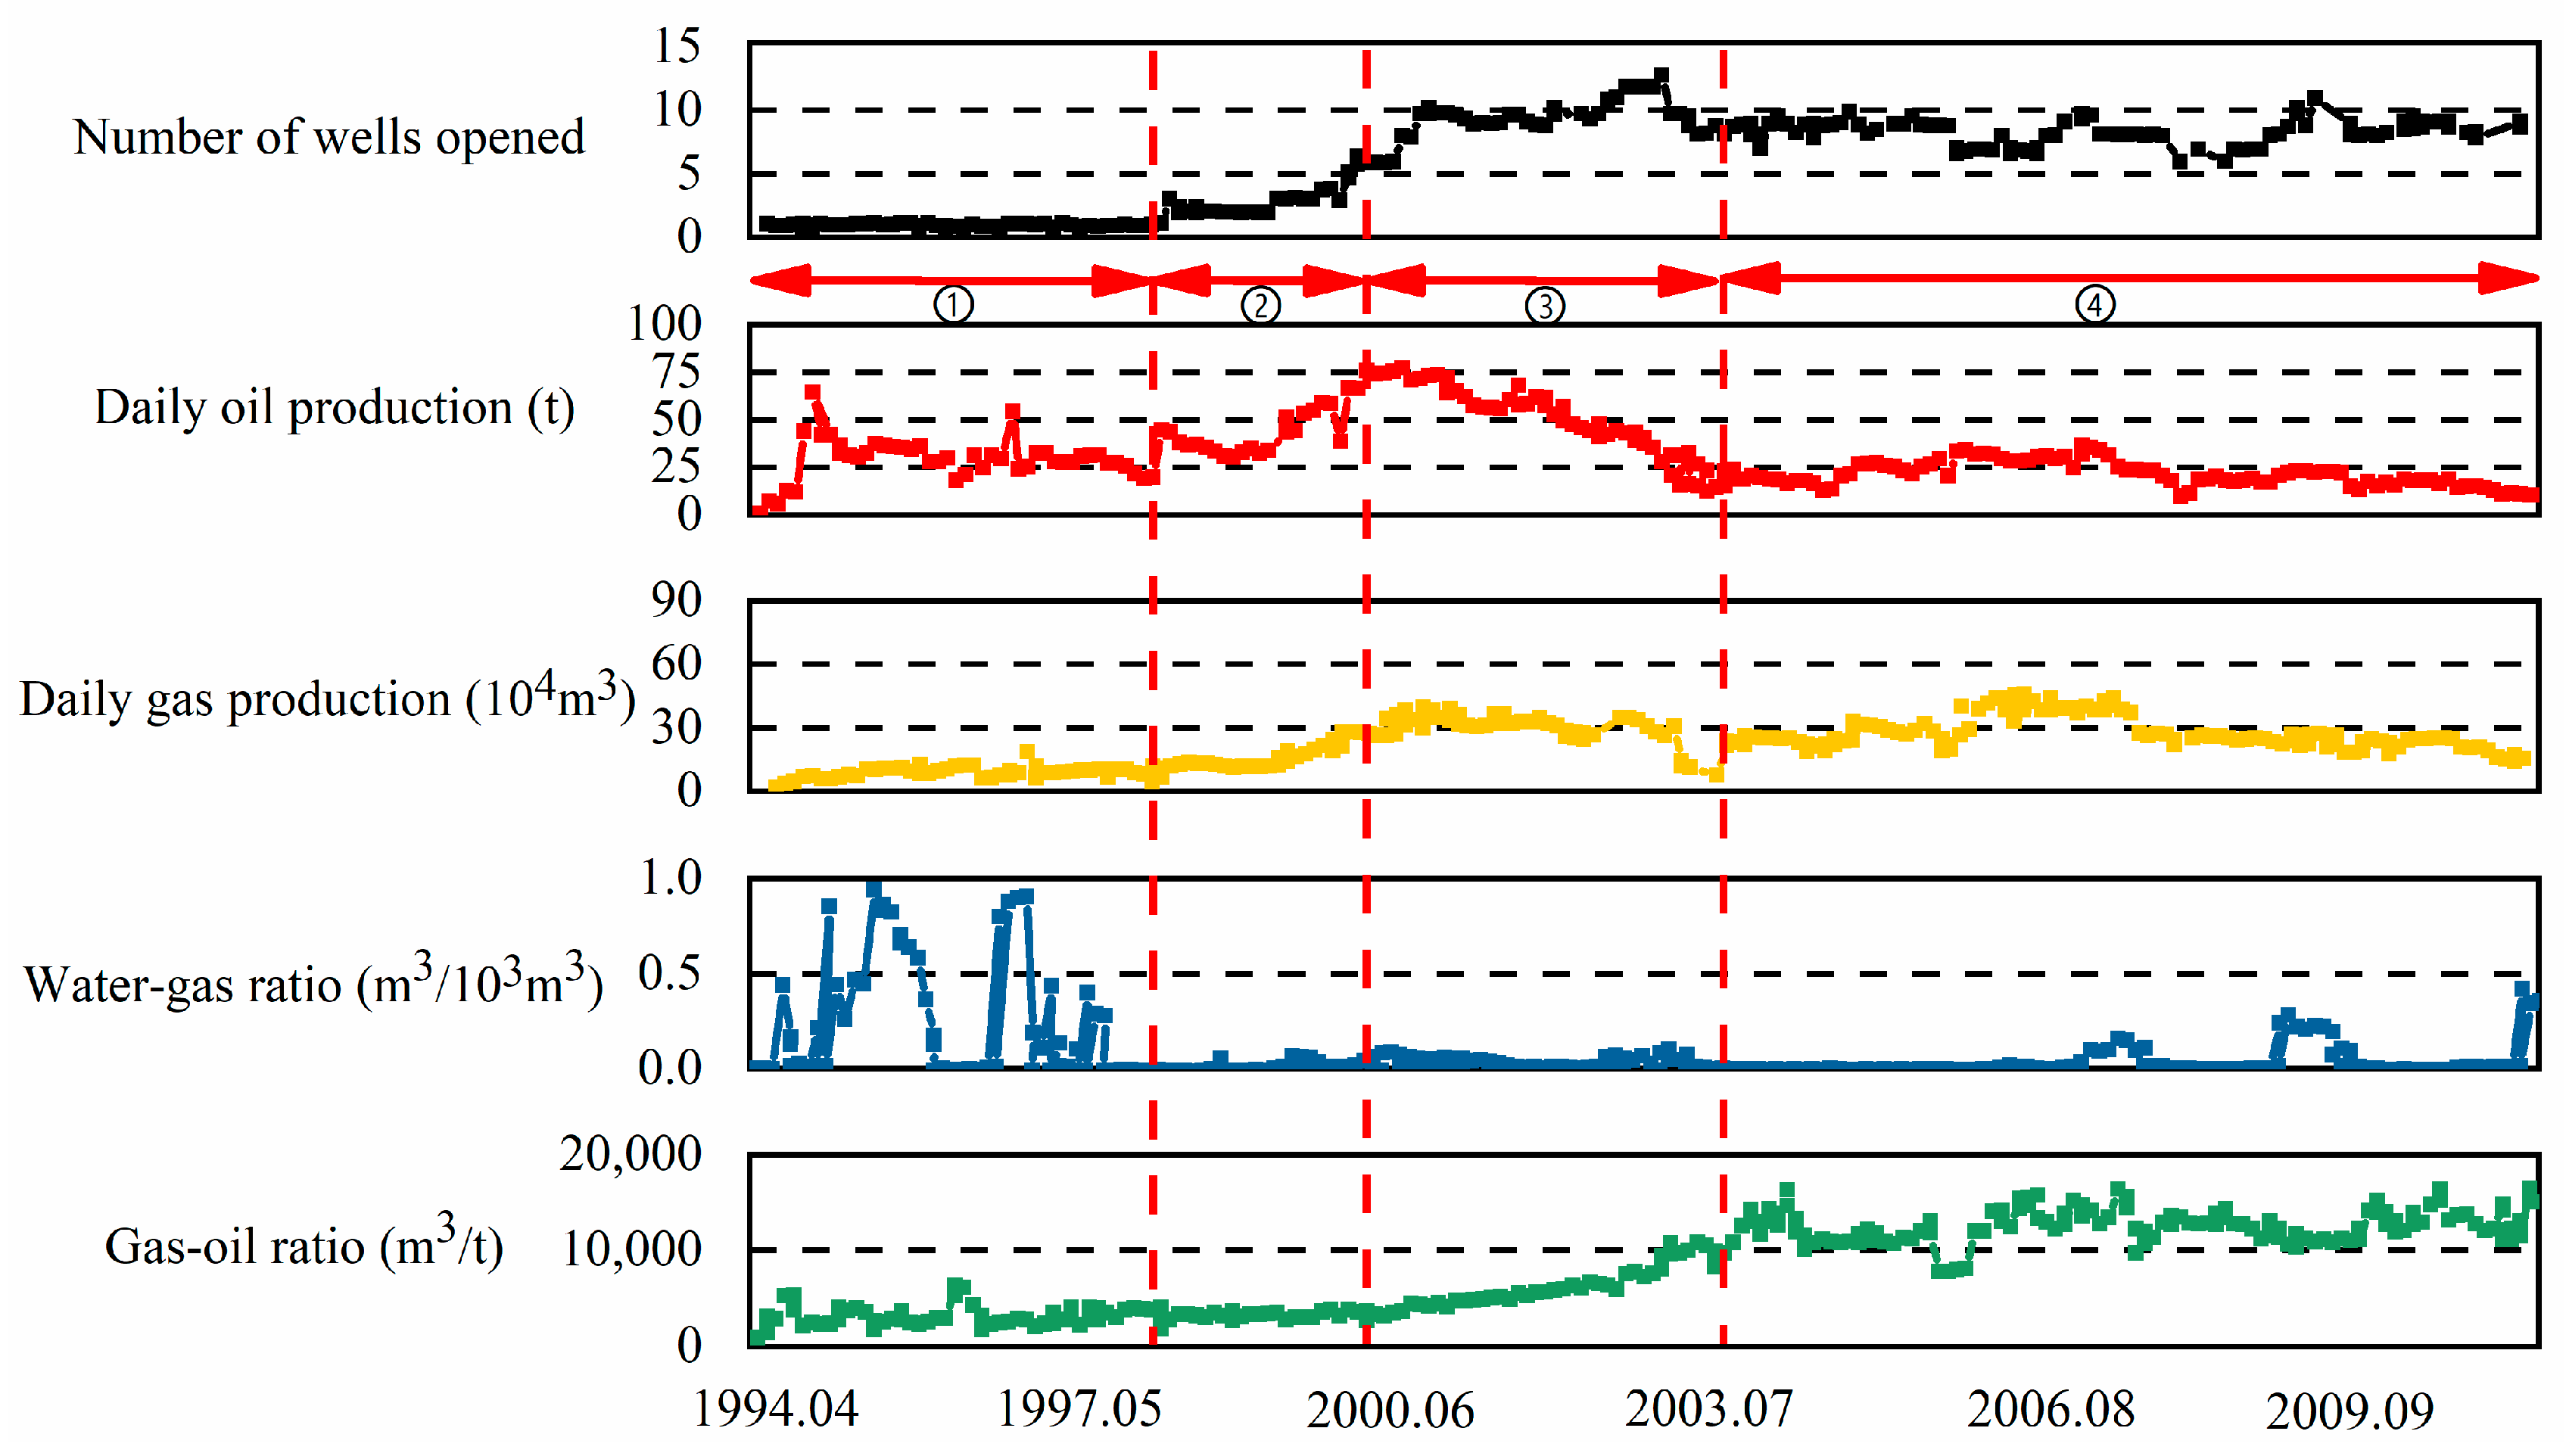
The comprehensive production curves for the X42 to X51 gas production layers are shown in Figure 15. This gas layer began trial production from 1984 to 1988 (phase ① in the figure). From 1989 to 1994 (phase ② in the figure), both the gas cap and oil ring were produced simultaneously. However, the newly drilled oil ring wells did not perform well, making it impossible to implement the strategy of producing the oil ring first. Later, new wells were drilled at the edge of the oil ring. After years of development, retrograde condensation pollution became severe, with condensate oil saturation near the well bottom reaching about 17%. Therefore, from 1994 to 1997 (phase ③ in the figure), a gas cycling test was conducted. During the gas injection period, the X51 block significantly suppressed the retrograde condensation of heavy components underground. The condensate recovery rate increased by 18.2% compared to depletion development, rising from 21% to 39.2%. Since 1998 (phase ④ in the figure), the development has entered a comprehensive adjustment phase. On the one hand, new wells were drilled to extract the remaining oil and gas in enriched areas; on the other hand, layer adjustment was implemented to improve recovery rates further.
Figure 16 shows the comprehensive production curve for the X41 gas production layers. This gas layer began trial production in 1994 (phase ①), with an average daily gas production of 100,000 m3 and a daily oil production of 30 tons. The reservoir static pressure was 30 MPa, and the fluid dew point pressure was 37.2 MPa, indicating the onset of retrograde condensation pollution in the formation. In 1997 (phase ②), gas cycling development was implemented, with the reservoir static pressure at 27 MPa at that time. When the number of producing wells reached around 10 (phase ③), both the daily gas production and daily oil production began to decline, and the gas–oil ratio increased year by year. Despite the gas cycling, the reservoir pressure continued to decline. Due to severe reservoir heterogeneity and poor connectivity between injection and production wells, the gas cycling development method was not effective. Consequently, in 2003 (phase ④), gas injection was stopped, and depletion development was adopted, at which point the increase in the gas–oil ratio slowed down.
The remaining gas layers are similar to the ones described above, with development strategies being continuously adjusted through real-time monitoring. For the X52 layer, depletion development was adopted in 1983. The condensate oil production was relatively low, and the gas–oil ratio continued to increase. The X72 gas production layers began using depletion development in 1995. Gas cycling was implemented in 2003, but the results were not satisfactory, so depletion development continued after 2010.
The original formation pressure of the condensate gas reservoir in the KK Gas Field was 39.4 MPa. During production, as the pressure in each production layer dropped below the dew point pressure, the formation pressure decreased by 50% to 60% by 2012. Retrograde condensation pollution appeared at the well bottom, causing a significant increase in the gas–oil ratio in each layer and a decline in condensate oil production. The natural gas recovery rate for the field is 37%, and the expected condensate recovery rate ranges from 35% to 50%. Therefore, during the development process, it is necessary to gradually regulate the pressure and development methods for the entire gas field to achieve the maximum economic benefits.

5.2. Recommendations

Through the analysis of the main controlling factors during the three different stages of depletion production in condensate gas reservoirs, it was found that, during the single-phase gas flow stage, reservoir properties are the main factors affecting oil and gas recovery rates. When the formation pressure drops below the dew point pressure due to retrograde condensation and evaporation phenomena, reservoir permeability and condensate oil content become the main factors influencing condensate recovery and gas-phase permeability. However, the primary and secondary relationships between these factors are inconsistent. Based on the analysis of the above production case studies, the following recommendations are made for the development of different types of condensate gas reservoirs:
(1)
For low-permeability reservoirs, techniques such as horizontal drilling, multi-stage fracturing, and acidizing can be employed to improve reservoir permeability and enhance fluid flow capacity, thereby mitigating retrograde condensation. In high-permeability reservoirs, it is essential to maintain the formation pressure above the dew point pressure to prevent retrograde condensation phenomena. Gas injection or other pressure maintenance measures can be employed to ensure that fluids flow as a single-phase gas, thereby enhancing recovery rates. While high permeability favors fluid flow, an excessively high gas production rate can cause a rapid decline in formation pressure, which may worsen retrograde condensation. Therefore, it is crucial to control the gas production rate to ensure a gradual pressure decline and prolong the single-phase gas production stage.
(2)
Condensate gas reservoirs with high condensate oil content are prone to retrograde condensation when the formation pressure falls below the dew point pressure. In such a case, a staged development strategy can be adopted. For reservoirs with low condensate oil content, a depletion development approach is appropriate. Conversely, for reservoirs with moderate condensate oil content, a combination of depletion and gas injection can be employed. To mitigate the effects of retrograde condensation in high-condensate-oil-content reservoirs, gas injection or alternative methods, such as water injection, can be utilized to maintain pressure and postpone the onset of retrograde condensation as much as possible.
(3)
Establishing a comprehensive dynamic monitoring system to monitor real-time changes in reservoir pressure and temperature allows for timely adjustments to production parameters, such as the gas production rate, to prevent rapid pressure decline and avoid the occurrence of retrograde condensation.
(4)
The selection of appropriate surfactants should be guided by the wettability of the reservoir, particularly when the critical condensate saturation is high. This approach facilitates the modification of fluid flow characteristics, reduces the interfacial tension between oil and gas, decreases condensate retention within the reservoir, and ultimately enhances the productivity of condensate gas wells.
The implementation of suitable development strategies and technical measures that align with the unique characteristics of each reservoir can significantly improve oil and gas recovery rates. This approach not only reduce damage to gas-phase permeability but also enhances overall production efficiency and economic returns from the gas field.

6. Conclusions

This study focuses on the X condensate gas reservoir, using numerical simulation within an actual heterogeneous geological model to investigate the impact of varying condensate oil content on contamination characteristics and production indicators during depletion. A dynamic analytical method was established to identify key factors influencing oil and gas production at different stages, accompanied by a mechanism analysis. Building on these findings, a comprehensive survey and statistical analysis of the current development status of condensate gas reservoirs domestically and internationally were conducted. Tailored production guidance was provided for different types and stages of condensate gas reservoir development to ensure optimized management and enhanced recovery rates.
(1)
Condensate oil is critical in determining the severity of retrograde condensation damage in gas reservoirs. High condensate oil content leads to rapid condensate precipitation as the reservoir pressure falls below the dew point, resulting in an early and significant reduction in gas-phase relative permeability. In high-condensate content reservoirs, the reduction in gas-phase permeability can exceed 70%, significantly impairing overall production efficiency.
(2)
The retrograde condensation regions expand dynamically over time, with the extent and severity of this expansion influenced by the condensate oil content and the characteristics of the reservoir. In reservoirs with moderate condensate oil content, the polluted region can extend up to 15 m from the wellbore, leading to a gas-phase relative permeability impairment of about 10% to 25%. In high-condensate reservoirs, the contamination region may extend beyond 300 m, with the relative permeability damage rate exceeding 50% within 40 m of the wellbore.
(3)
This research delineates the various stages of the production process and identifies the primary controlling factors at each stage. During the initial single-phase gas flow stage, reservoir permeability is the dominant factor. As production progresses and reservoir pressure declines, the influence of condensate oil content becomes increasingly significant during the retrograde condensation stage. Due to the differences between the retrograde condensation process and the condensate oil evaporation process, reservoir permeability once again emerges as the primary controlling factor in the condensate oil evaporation stage. The effective management and optimization of reservoir permeability are crucial during the development of condensate gas reservoirs, necessitating a thorough assessment and analysis of condensate gas fluid characteristics in the early stages.
(4)
The findings underscore the necessity of dynamic monitoring in gas reservoirs and the implementation of targeted reservoir production strategies. For gas reservoirs with gradually increasing condensate oil content, the early implementation of pressure maintenance techniques is essential to sustain production, reduce permeability damage, and ensure optimal recovery rates.

Author Contributions

Conceptualization, H.T. and R.Z.; Methodology, H.T., R.Z. and P.G.; Software, H.T., R.Z. and P.G.; Validation, H.T., R.Z., P.G. and S.H.; Formal analysis, H.T., R.Z., P.G. and S.H.; Investigation, H.T., Q.J. and Y.L.; Resources, H.T., P.G. and Y.P.; Data curation, H.T., R.Z. and Y.P.; Writing—original draft, H.T. and R.Z.; Writing—review & editing, H.T. and R.Z.; Supervision, S.H.; Project administration, P.G.; Funding acquisition, P.G. All authors have read and agreed to the published version of the manuscript.

Funding

The authors gratefully acknowledge the financial support from the PetroChina Scientific Research and Technology Development Project, “Research on New Mechanisms and Methods for Enhancing Recovery in Condensate Gas Reservoirs” (2023ZZ0406), and the Sichuan Province Postdoctoral Research Project, “Study on the Non-Equilibrium Multiphase Multicomponent Multi-Interface Flow Theory Model for Condensate Gas Injection”.

Data Availability Statement

The original contributions presented in the study are included in the article, further inquiries can be directed to the corresponding author.

Conflicts of Interest

The authors declare no conflicts of interest.

References

  1. Wang, Z.; Zhu, S.; Zhou, W.; Liu, H.; Hu, Y.; Guo, P.; Du, J.; Ren, J. Experimental research of condensate blockage and mitigating effect of gas injection. Petroleum 2018, 4, 292–299. [Google Scholar] [CrossRef]
  2. Marokane, D.; Logmo-Ngog, A.B.; Sarkar, R. Applicability of timely gas injection in gas condensate fields to improve well productivity. In Proceedings of the SPE Improved Oil Recovery Conference, Tulsa, Oklahoma, 13–17 April 2002; SPE: Tulsa, Oklahoma, 2002; p. SPE-75147-MS. [Google Scholar]
  3. Tu, H.; Guo, P.; Jia, N.; Wang, Z. Numerical evaluation of phase behavior properties for gas condensate under non-equilibrium conditions. Fuel 2018, 226, 675–685. [Google Scholar] [CrossRef]
  4. Qteishat, A.; Lofty, N.M.; Farouk, S.; Ahmad, F.; Shehata, A.M.; Radwan, A.E.; Wood, D.A.; El-Kahtany, K. Organic geochemical studies and origin of black hydrocarbon material (heavy oil) produced from Risha gas field (Jordon): Insights into produced contaminated organic-inorganic materials during production. Pet. Sci. Technol. 2024, 42, 2771–2799. [Google Scholar] [CrossRef]
  5. Afidick, D.; Kaczorowski, N.J.; Bette, S. Production performance of a retrograde gas reservoir: A case study of the Arun field. In Proceedings of the SPE Asia Pacific Oil and Gas Conference, Melbourne, Australia, 7–10 November 1994. [Google Scholar]
  6. Narayanaswamy, G.; Pope, G.A.; Sharma, M.M.; Hwang, M.K.; Vaidya, R.N. Predicting gas condensate well productivity using capillary number and non-Darcy effects. In Proceedings of the SPE Reservoir Simulation Symposium, Houston, TX, USA, 14–17 February 1999; p. SPE-51910-MS. [Google Scholar]
  7. Pope, G.A.; Wu, W.; Narayanaswamy, G.; Delshad, M.; Sharma, M.M.; Wang, P. Modeling relative permeability effects in gas-condensate reservoirs with a new trapping model. SPE Reserv. Eval. Eng. 2000, 3, 171–178. [Google Scholar] [CrossRef]
  8. Mirzaei-Paiaman, A. The Severe Loss of Well Productivity in an Iranian Gas Condensate Carbonate Reservoir: Problem Identification and Remedy. Energy Sources Part A Recovery Util. Environ. Eff. 2013, 35, 1863–1872. [Google Scholar] [CrossRef]
  9. Engineer, R. Cal canal field, California: Case history of a tight and abnormally pressured gas condensate reservoir. In Proceedings of the SPE Western Regional Meeting, Bakersfield, CA, USA, 27–29 March 1985; SPE: Bakersfield, CA, USA, 1985; p. SPE-13650-MS. [Google Scholar]
  10. Gringarten, A.C.; Al-Lamki, A.; Daungkaew, S.; Mott, R.; Whittle, T.M. Well test analysis in gas-condensate reservoirs. In Proceedings of the SPE Annual Technical Conference and Exhibition, Dallas, TX, USA, 1–4 October 2000; SPE: Dallas, TX, USA, 2000; p. SPE-62920-MS. [Google Scholar]
  11. Fevang, Ø.; Whitson, C.H. Modeling gas-condensate well deliverability. SPE Reserv. Eng. 1996, 11, 221–230. [Google Scholar] [CrossRef]
  12. Liu, J.; Guo, P.; Li, S. Experimental Evaluation of Condensate Blockage on Condensate Gas Well. Nat. Gas Ind. 2001, 20, 67–69. [Google Scholar]
  13. Feng, Q.; Deng, B.; Yang, Y. Evaluations and removing methods of the retrograde condensate damage for the gas condensate reservoirs in the tight sandstone. Pet. Geol. Oilfield Dev. Daqing 2020, 39, 139–146. [Google Scholar]
  14. Xiao, L. Pollution caused by retrograde condensate in condensate gas reservoir. Fault-Block Oil Gas Field 2009, 16, 102–104. [Google Scholar]
  15. Shi, J.; Li, X.; Zhou, J.; Li, Q. Determining method of both permeabilities and radii of the multiple blocks in condensate gas reservoir. Pet. Geol. Oilfield Dev. Daqing 2012, 31, 80–84. [Google Scholar]
  16. Green, R.F.; Steadman, M.E. Experiments about retrograde condensate pollution characteristics and relief measures in Fengshen 1 condensate gas reservoir with low permeability. Pet. Geol. Recovery Effic. 2023, 30, 160–166. [Google Scholar]
  17. Su, Y.; Wang, J. Identification of condensate damage degree of a well in constant volume gas condensate reservoirs. China Offshore Oil Gas 2015, 27, 58–62. [Google Scholar]
  18. Zhao, H.; Zhang, X.; Gao, X.; Chen, P.; Guo, K. A Novel Method for the Quantitative Evaluation of Retrograde Condensate Pollution in Condensate Gas Reservoirs. Processes 2024, 12, 522. [Google Scholar] [CrossRef]
  19. Zou, C.; Tang, Y.; Yan, J.; Sun, J.; Li, Y.; Cui, T. The evaluation methods and application of retrograde condensation damage in condensate gas reservoir. Reserv. Eval. Dev. 2019, 9, 30–34. [Google Scholar]
  20. Guo, P.; Liu, Y.; Du, J.; Wang, S.; Zhang, Y. Sampling representative and condensate oil pollution in Sulige gas field. Sci. Technol. Eng. 2018, 18, 103–107. [Google Scholar]
  21. Lu, Y.; Wu, R. Research on the retrograde condensate pollution characteristics and developement strategies of offshore gas condensate reservoir. J. Yangtze Univ. (Nat. Sci. Ed.) 2024, 21, 62–68. [Google Scholar]
  22. Asgari, A.; Dianatirad, M.; Ranjbaran, M.; Sadeghi, A.R.; Rahimpour, M.R. Methanol treatment in gas condensate reservoirs: A modeling and experimental study. Chem. Eng. Res. Des. 2014, 92, 876–890. [Google Scholar] [CrossRef]
  23. Xie, J.; Li, Q.; Tu, H.; Zhao, Z. Special phase behavior of high water-containing tight condensate gas reservoir. Acta Pet. Sin. 2020, 41, 1109. [Google Scholar]
  24. Liu, Y.; Pan, Y.; Sun, Y.; Liang, B. Experimental Study on the Control Mechanism of Non-Equilibrium Retrograde Condensation in Buried Hill Fractured Condensate Gas Reservoirs. Processes 2023, 11, 3242. [Google Scholar] [CrossRef]
  25. Alzamili, H.S.; Mahdi, R.A.; Hussain, H.H. The Hydraulic Performance of Nanofluids and Porous Media for the PV/T System. Egypt. J. Pet. 2024, 33, 16. [Google Scholar] [CrossRef]
  26. Bilotu Onoabhagbe, B.; Russell, P.; Ugwu, J.; Rezaei Gomari, S. Application of Phase Change Tracking Approach in Predicting Condensate Blockage in Tight, Low, and High Permeability Reservoirs. Energies 2020, 13, 6551. [Google Scholar] [CrossRef]
  27. Qiao, L.; Hou, G.; Fu, L.; Li, H.; Lu, Z. Numerical simulation of the recovery degree of condensate oil depletion. Oil-Gasfield Surf. Eng. 2014, 33, 26–27. [Google Scholar]
  28. Gravier, J.F. Determination of Gas-Condensate Relative Permeability on Whole Cores Under Reservoir Conditions. SPE Form. Eval. 1986, 1, 9–15. [Google Scholar] [CrossRef]
  29. Morel, D.C. Experimental Determination of The Mobility of Hydrocarbon Liquids during Gas Condensate Reservoir Depletion: Three Actual Cases. In Proceedings of the SPE Annual Technical Conference and Exhibition, San Antonio, TX, USA, 5–8 October 1997. [Google Scholar]
  30. Reeves, P.C.; Celia, M.A. A Functional Relationship Between Capillary Pressure, Saturation, and Interfacial Area as Revealed by a Pore-Scale Network Model. Water Resour. Res. 1996, 32, 2345–2358. [Google Scholar] [CrossRef]
  31. Wang, L.; Xiang, Y.; Tao, H.; Kuang, J. An Analytical Model Coupled with Orthogonal Experimental Design Is Used to Analyze the Main Controlling Factors of Multi-Layer Commingled Gas Reservoirs. Water 2023, 15, 3052. [Google Scholar] [CrossRef]
  32. Cheng, S.; Luo, G. Overall development project and development performance characteristics of Ya-13-1 gas field. Nat. Gas Ind. 1998, 18, 35–39. [Google Scholar]
  33. Dong, S. Reservoir protection method in middle stage production gas technology of Yakela condensate gas field. Inn. Mong. Petrochem. Ind. 2017, C1, 144–146. [Google Scholar]
  34. Kang, B.; Zhang, L.; Wang, J.; Deng, X.; Guo, P.; Liu, Z. A Feasibility Studyon EnhancingCondensate Oil Recovery of FracturedVuggy Condensate Gas Reservoir in Tazhong1 Gas Field, Tarim Basin. Xinjiang Pet. Geol. 2015, 36, 1. [Google Scholar]
  35. Li, G. World Atlas of Oil and Gas Basins; John Wiley & Sons: Hoboken, NJ, USA, 2011. [Google Scholar]
  36. Ma, S. Gas Cycling Development of Dazhangtuo Gas Condensate Reservior. Acta Pet. Sin. 1998, 19, 47. [Google Scholar]
  37. Song, W.; Jiang, T.; Feng, J.; Tang, M.; Xiao, X. Geological features and exploitation mechanism of the yaha condensate gas field in the tarim basin. Chin. J. Geol. 2005, 40, 274–283. [Google Scholar]
  38. Yang, S.; Wang, S.; Wang, L.; He, C.; Dong, P. Evaluation and development of fractured buried hill condensate gas reservoir: Taking Qianmiqiao buried hill condensate gas reservoir as an example. Nat. Gas Geosci. 2006, 17, 857–861. [Google Scholar]
  39. Ma, G.; Zhou, J.; Shuai, Y.; Fan, X.; Song, J. A study on the development regularity of Qiudong condensate gas field. J. Northwest Univ. (Nat. Sci. Ed.) 2007, 37, 789–792. [Google Scholar]
  40. Ji, J. Research of Remaining Gas Distribution in Qiudong Reservoir. Master’s Thesis, Xi’an Shiyou University, Xi’an, China, 2013. [Google Scholar]
  41. Gao, J.; Han, J.; He, W.; Cang, H.; Xu, J. Study on evaluation and removal of retrograde condensate damage in Qiudong gas filed. Spec. Oil Gas Reserv. 2010, 17, 85–87, 125. [Google Scholar]
  42. Wei, Y.; Liu, T.; Wang, X.; Mou, W.; Cui, T. Application of the technology of the dry gas injection huff and puff on single well in Kekeya gas condensate field. J. Southwest Pet. Univ. 2007, 29, 92–94. [Google Scholar]
  43. Wang, X. The Development Characteristics and Comprehensive Adjustment Plan Research of Kekeya Gas Condensate Reservoir. Ph.D. Thesis, SouthWest Petroleum University, Chengdu, China, 2013. [Google Scholar]
Figure 1. Three-region composite model schematic [10,11].
Energies 17 05750 g001
Figure 2. Comparison of model before and after grid refinement: (a) shows the 3D permeability distribution before and after refinement, and (b) shows the saturation distribution around the wellbore before and after refinement.
Energies 17 05750 g002
Figure 3. Condensate liquid percentage: comparison of model predictions and experimental data.
Energies 17 05750 g003
Figure 4. Radial distribution of condensate saturation over time: 1. One month after the onset of retrograde condensation; 2. Six months after the onset of retrograde condensation; 3. One year after the onset of retrograde condensation; 4. One and a half years after the onset of retrograde condensation; 5. Two years after the onset of retrograde condensation; 6. Five years after the onset of retrograde condensation; 7. Ten years after the onset of retrograde condensation. In the figure, Region I represents the interval six months after the onset of retrograde condensation.
Energies 17 05750 g004
Figure 5. Radial distribution of gas-phase permeability damage rate over time: The meaning of the 1–7 curve is the same as that in Figure 4.
Energies 17 05750 g005
Figure 6. Production curves for condensate gas wells: (a) shows the daily oil and gas production rates for different fluids; (b) illustrates the gas-oil ratio for different fluids; (c) presents the average reservoir pressure and bottom-hole pressure for different fluids.
Energies 17 05750 g006
Figure 7. Recovery factor curves for condensate gas reservoirs: (a) shows the condensate oil recovery factor for different fluids, while (b) shows the natural gas recovery factor for different fluids.
Energies 17 05750 g007
Figure 8. Stage 1—proportion of salience.
Energies 17 05750 g008
Figure 9. Stage 2—proportion of salience.
Energies 17 05750 g009
Figure 10. Stage 3—proportion of salience.
Energies 17 05750 g010
Figure 11. Importance of influencing factors at different production stages.
Energies 17 05750 g011
Figure 12. Permeability and condensate oil content distribution in condensate gas reservoirs: (a) shows the permeability distribution of the condensate gas reservoir, and (b) shows the condensate oil content distribution of the condensate gas reservoir.
Energies 17 05750 g012
Figure 13. Statistics of condensate recovery rates in various condensate gas fields.
Energies 17 05750 g013
Figure 14. Gas production curve of QD Gas Field [40].
Energies 17 05750 g014
Figure 15. Comprehensive production curves for the X42 to X51 gas production layers [43].
Energies 17 05750 g015
Figure 16. Comprehensive production curve for the X41 gas production layers.
Energies 17 05750 g016
Table 1. Composition and key parameters of different fluid well streams.
Fluid TypeLow-Condensate-Oil-Content Fluid
(Fluid 1)
Medium-Condensate-Oil-Content Fluid
(Fluid 2)
High-Condensate-Oil-Content Fluid
(Fluid 3)
ComponentsCondensate gas composition (mol%)
CO23.335.331.14
N2/0.320.25
C181.9280.1667.77
C26.736.937.48
C33.522.734.16
IC40.840.741.60
NC40.720.551.42
IC50.270.280.94
NC50.150.140.59
C60.310.172.08
C70.280.102.96
C80.310.421.55
C90.30.311.83
C100.190.351.63
C11+1.131.504.60
dew point (MPa)41.1041.2037.63
GOR (m3/m3)724135221050
condensate content (g/m3)100.95227.27893.33
Table 2. Pseudo-components for fluid well streams (mol%).
Fluid TypeN2-C1CO2-C2-C3C4+C7+C11+
Fluid 181.9213.582.291.081.13
Fluid 280.4814.991.861.171.50
Fluid 368.0212.786.637.974.60
Table 3. Reserve calculation results for condensate gas reservoirs.
Fluid Type Gas Reservoirs (108 m3)Condensate Reserves (104 m3)
Fluid 13.7205.125
Fluid 23.71610.542
Fluid 33.73135.457
Table 4. Maximum retrograde condensate oil saturation for fluids.
Fluid Type Maximum Condensate Saturation
Fluid 10.17
Fluid 20.19
Fluid 30.35
Table 5. Gas-phase relative permeability damage rate.
Fluid TypeMaximum Gas-Phase Relative Permeability Damage Rate (%)Mitigation of Gas-Phase Relative Permeability Damage Rate (%)
Fluid 116.822.61
Fluid 225.448.05
Fluid 373.3121.39
The alleviation degree of gas-phase relative permeability is equal to the maximum damage degree of gas-phase relative permeability minus the damage degree of gas-phase relative permeability in the middle and late stages of production.
Table 6. Stage 1—orthogonal experimental design table for multifactor analysis.
NO.FactorCondensate Recovery (%)Gas Recovery (%)
Condensate Oil Content LevelPermeability RatioGas Extraction Speed (%)
1100.950.150.020.03
2100.951.070.270.27
3100.955.090.760.76
4227.270.190.020.03
5227.271.050.250.25
6227.275.070.800.80
7893.330.170.050.05
8893.331.091.011.00
9893.335.054.424.42
Condensate recovery (%)
Rk1.481.971.19
Ranking of impact degree213
Gas recovery (%)
Rk1.471.961.19
Ranking of impact degree213
Table 7. Stage 2—orthogonal experimental design table for multifactor analysis.
NO.FactorCondensate Recovery (%)Degree of Gas Relative Permeability Impairment (%)
Condensate Oil Content LevelPermeability RatioOil Critical Flow SaturationGas Extraction Speed (%)
1100.950.10.1057.8730.89
2100.951.00.15722.264.29
3100.955.00.20923.111.36
4227.270.10.1594.7438.75
5227.271.00.20521.8211.81
6227.275.00.10723.033.36
7893.330.10.2070.0783.00
8893.331.00.1091.7078.96
9893.335.00.1558.4432.25
Condensate Recovery (%)
Rk14.3413.974.135.27
Ranking of impact degree1243
Degree of Gas Relative Permeability Impairment (%)
Rk52.5638.5612.6414.71
Ranking of impact degree1243
Table 8. Stage 3—orthogonal experimental design table for multifactor analysis.
NO.FactorCondensate Recovery (%)Degree of Gas-Phase Relative Permeability Alleviation (%)
Condensate Oil Content LevelPermeability RatioOil Critical Flow SaturationGas Extraction Speed (%)
1100.950.10.10516.1827.78
2100.951.00.1575.602.95
3100.955.00.2095.810.96
4227.270.10.15917.6330.34
5227.271.00.2053.845.02
6227.275.00.1073.521.81
7893.330.10.20720.9645.46
8893.331.00.10919.8039.88
9893.335.00.15510.9912.65
Condensate recovery (%)
Rk8.92 11.48 2.96 4.39
Ranking of impact degree2143
Degree of gas-phase relative permeability alleviation (%)
Rk22.1029.387.848.58
Ranking of impact degree2143
Table 9. Statistical table of key indicators for various condensate gas fields.
RegionGas FieldCondensate Oil Content (g/m3)Development MethodCondensate Recovery Rate (%)Gas Production Rate (%)
TarimY573.0Gas cycling60.68/
YK234.5Natural depletion56.63.5
KK476Natural depletion and gas injection35~50 (forecast)1
T210~902Natural depletion and water injection25 (natural depletion)/
TuhaQD226.3Natural depletion and hydraulic fracturing40.31.85
South China SeaY-1343Natural depletion/3.55 (peak)
DagangB353.0Natural depletion41.45.75
D630.0Gas cycling60.2/
QM350~375Natural depletion2.3 (2013)0.19
North AmericaH250Gas injection88.50.3
LD/Gas injection38.64
HH478Gas injection71.8 (forecast)5.29~6.93
W330Gas injection73.24.2
P/Natural depletion18.16 (1977)3.67
RussiaH200Natural depletion and gas injection63.2/
LN54~66Natural depletion13.8 (1977)3.61
KL167Natural depletion43/
W360Natural depletion12.3 (1976)3.8
East China Sea100~600Natural depletion20~304~8
Table 10. Statistics of fracturing effects [41].
WellQD22QD25QD26
Before hydraulic fracturingOil pressure/casing pressure (MPa)7.7/10.16.8/8.57.4/9.1
Gas production (104 m3/d)2.843.52.9
Oil production (m3/d)3.45.26.5
GOR (m3/m3) 835367314400
After hydraulic fracturingOil pressure/casing pressure (MPa)8.9/11.811.0/11.99.8/11.9
Gas production (10⁴m3/d)5.65.25.27
Oil production (m3/d)6.813.214.3
GOR (m3/m3) 653539393685
qAOF (104 m3/d)Before hydraulic fracturing/7.66.39
After hydraulic fracturing/22.917
Multiple increases in production1.932.7
Disclaimer/Publisher’s Note: The statements, opinions and data contained in all publications are solely those of the individual author(s) and contributor(s) and not of MDPI and/or the editor(s). MDPI and/or the editor(s) disclaim responsibility for any injury to people or property resulting from any ideas, methods, instructions or products referred to in the content.

