1. Introduction
Lithium-ion batteries (LIBs) are prevalent energy providers thanks to their high energy density, low associated costs, high-temperature stability, and long cycle life [
1,
2,
3]. However, like any other regular system, LIBs degrade with time and usage. Their capacity to store energy and supply power decreases over charging and discharging cycles [
4]. Studies show that LIBs’ performance strictly depends on the operating conditions [
5,
6]. Cycling outside the permitted range of temperature, voltage, and current can accelerate the ageing process, leading to self-ignition or even explosion in critical cases [
7]. Therefore, it is crucial to establish an intelligent health management system (HMS) to monitor the battery’s working conditions and improve the powered system’s safety level.
Lithium nickel manganese cobalt oxide (NMC) batteries, widely used in electric vehicles and energy storage systems, present additional challenges for health management. These challenges include their susceptibility to thermal runaway under high loads, especially in fast-charging scenarios and the complexities of accurately estimating their state of health (SOH) due to non-linear degradation patterns. Effective HMS design for NMC batteries requires advanced approaches that can adapt to these unique characteristics to ensure safety, longevity, and performance. Traditional methods for battery management may not be sufficient for NMC batteries, as they do not account for the specific degradation and thermal management needs of this chemistry. This highlights the need for more sophisticated solutions that can provide real-time adaptation to changing operational conditions.
The battery HMS is a smart system that combines hardware and software to oversee a battery pack, which is an assembly of battery cells linked in series/parallel to fulfil the system’s capacity and power requirement. The main goal of the HMS is to keep the battery pack within its safe operation area (SOA) in terms of voltage, current, and temperature during the charge and discharge cycle [
8]. In addition to internal state estimation, which includes the assessment of the battery state of charge (SOC) and SOH, the HMS has to ensure even charge distribution between the pack cells. In the case where the voltage difference between the cells exceeds the permitted limit, it will bring down the voltage of that cell so that all cells have the same voltage [
9,
10]. This function is known in the literature as cell balancing. When manageing NMC batteries, maintaining this safe operation area is particularly important due to their sensitivity to temperature fluctuations and high current loads. Effective cell balancing and accurate SOH tracking can help mitigate risks associated with thermal runaway and extend the battery’s operational life. There are two types of cell balancing: passive cell balancing and active cell balancing. This classification is based on how the excess charge is removed from the battery. For passive cell balancing, the energy of the cell with the highest voltage is dissipated through a resistor in the form of heat [
11]. This equalising approach is widely implemented because it is simple and cost-effective. On the other hand, active cell balancing equalises the charge between the cells by transferring the energy from the cell with high voltage to the cell with low voltage [
12]. Therefore, the energy is not wasted; however, it requires more components than the passive approach, which means higher cost and more occupied surface.
SOC estimation is a vital function of the HMS that helps improve the system’s overall performance and reliability. It represents the ratio of the battery’s remaining capacity to its nominal capacity. To the best of the authors’ knowledge, there is no physical sensor that can directly assess the SOC. Various indirect methods with ranging accuracy and complexity levels have been proposed in the literature to assess the battery SOC. The most straightforward method is known as coulomb counting (CC). It identifies the battery SOC by integrating the current drawn from and supplied to the battery over time. However, The CC method is susceptible to sensor noise and the initial SOC settings [
13]. The open circuit voltage (OCV) method is commonly combined with the CC method to improve the accuracy of SOC estimation. The SOC-OCV look-up table is experimentally established first to scale the initial SOC for the CC method. In recent years, model-based estimation methods have gained attention. This category of methods begins by setting the battery state-space model equations and then developing the state observer to assess SOC using control theory and observer design methods. Among these, Kalman filters, especially the extended Kalman filter (EKF) [
14,
15,
16] and unscented Kalman filter (UKF) [
17,
18], have been widely applied for SOC estimation due to their ability to handle non-linear systems and measurement noise. These methods continuously adjust the SOC estimation by comparing the predicted and measured battery voltages, allowing for more accurate SOC tracking, especially under varying load conditions [
19].
Battery internal state estimation requires establishing a model that describes the battery behaviour and internal states based on external parameters. The accuracy of the developed model reflects the battery’s performance and safety. The literature presents numerous battery models with varying accuracy and complexity levels. These models can be grouped into electrochemical battery models (EMs) [
20,
21,
22], equivalent circuit models (ECMs) [
23,
24,
25] and data-driven battery models [
26,
27,
28]. Among these three battery model categories, ECM offers a good compromise between model accuracy and complexity. The model has been widely used in various applications to simulate real-time battery behaviour. The ECM is made of circuit components such as resistors, capacitors and voltage sources to reflect the static and dynamic characteristics of the battery. The number of RC networks
n depends on the application. However, considering model accuracy and complexity, studies have shown that 2RC-ECM can provide reliable results at a reduced cost [
29,
30,
31]. One primary concern about ECM is that the model parameters depend on the batteries’ working conditions, such as SOC, SOH and temperature [
32]. An offline identification of the model parameters requires running extensive experiments to capture the battery response over the entire range of operating conditions. Besides, cyclic ageing will impact the battery’s performance. Thus, an online parameter identification approach is preferred to conquer these limitations. The online recursive estimation of the ECM parameters has been the focus of recent studies. In [
33], Chen et al. conducted an evaluation study of the offline mechanism-based and least square methods and online recursive least-squares with forget factor (FFRLS) and EKF under three different conditions. Under noisy conditions, the online approaches showed better results, for which the recorded SOC errors were −1.1% for FFRLS and 0.51% for the EKF-based method. Trung et al. [
34] used FFRLS to identify the parameters of the 1-RC ECM model. The developed model has good accuracy with an error margin of less than 1%. Joint estimation of the battery model parameters and SOC was investigated in [
35]. The authors applied FFRLS and an adaptive nonlinear sliding mode observer (AN-SMO) to jointly estimate the ECM parameters and SOC. The dual filter method is used in [
36] to simulate the battery’s dynamic behaviour and estimate its SOC.
The battery SOH is used to evaluate the ageing level of the LIBs. It represents the ratio of the current maximum available capacity to the initial maximum capacity. Since no physical sensor can gauge the battery capacity, researchers have developed indirect methods that use the battery’s measured quantities, such as voltage, current, and temperature to estimate the LIB’s SOH. In [
37], Li et al. proposed a battery capacity and SOC co-estimation scheme. The parameters of the first-order ECM and the battery SOC were identified simultaneously using the RLS method and adaptive extended Kalman filter, and the battery’s actual capacity was leveraged using the Elman neural network. Taichun Qin et al. [
38] used particle swarm optimisation (PSO) and support vector regression (SVR) to estimate the battery SOH. In [
39] an online capacity estimation of the Li-ion battery was achieved using the long short-term memory (LSTM) method. The study shows that the proposed method performs well despite sensor noise and incomplete data with reduced computation times. Additionally, a new SOH estimation method based on model-data fusion [
40] was introduced, providing a hybrid approach that combines model-based and data-driven techniques to improve accuracy and robustness in varying conditions.
When designing an HMS, accuracy, complexity, and cost are essential factors. The HMS has to ensure that each cell of the battery pack operates within its SOA, estimate the battery SOC, track its ageing process, and balance the charge distribution between cells. In the literature, several HMS designs and testing platforms have been proposed. In [
41], Chen et al. developed a 6s1p Li-ion battery pack testing platform based on the STM32 controller. The BQ76930 communicates each cell’s voltage, current, and temperature measurements to the STM32 and ensures that each cell operates within its safe operating area (SOA). The STM32 receives the collected data through IIC and estimates the battery SOC using a combination of the CC method and the OCV method. Angela et al. [
42] designed a modular BMS with point-to-point SOC estimation using machine learning. A modular battery cell monitoring system was developed in [
43]. The system can accurately assess the battery voltage, temperature, charge current and discharge, which are transmitted to a mixed signal processor for protection, monitoring and balancing. Although the proposed detection platforms proposed in the literature were successfully tested, they miss some essential functions, such as cell balancing and health management, that significantly affect the battery performance and life cycle.
Hence, this paper proposes an intelligent HMS with SOC estimation and balancing for a 4s2p NMC battery pack. This paper’s novelty evolves from using an improved online battery model (IOBM) representing battery behaviour, which continuously adjusts model parameters to reflect changes caused by battery ageing and varying load conditions. This adaptive approach improves the accuracy and performance of the HMS. Additionally, using a seventh-order polynomial to model the nonlinear OCV–SOC relationship contributes to more accurate SOC predictions and minimises system modelling errors. Furthermore, an LSTM network continuously estimates battery capacity, providing real-time capacity updates into the SOC algorithm. The AN-SMO uses the provided battery capacity and estimates the SOC based on the proposed IOBM, reducing the errors caused by capacity degradation under the influence of ageing.
The proposed system has a master–slave topology, which improves the system’s reliability and scalability. The STM32 communicates with the master unit to provide battery data, including the voltage of individual cells, the current that flows in and out of the battery pack, and the temperature at the hot spot within the battery pack. The master control unit module, the Raspberry pi3, uses this information to estimate the battery states, ensure that the battery operates within its SOA, and balance the charge between the cells.
The rest of the paper is organised as follows.
Section 2 details the experimental setup and algorithm development of the HMS.
Section 3 describes the circuit design of the proposed system.
Section 4 discusses the results and validates the HMS, while
Section 5 concludes the work.
2. Algorithm Development
2.1. Experimental Setup
Experimental data for the commercial 3 Ah LG-HG2 18650 (LG Chem, Seoul, South Korea) cylindrical cell with a graphite anode and a Li[NiMnCo]O
2 cathode were collected under various operating conditions, providing a robust foundation for battery modelling. The battery was characterised using the Enhanced Hybrid Power Pulse Characterisation (EHPPC) test, covering a wide temperature range and SOC intervals. The specifications of the cell are given in
Table 1.
The tests for the characterisation and modelling of this battery were performed by Dr. Phillip Kollmeyer at McMaster University in Hamilton, Ontario, Canada [
44]. It includes the EHPPC test along with cycle tests conducted at six different ambient temperatures (40 °C, 25 °C, 10 °C, 0 °C, −10 °C, and −20 °C) organised by temperature, test type, and drive cycle.
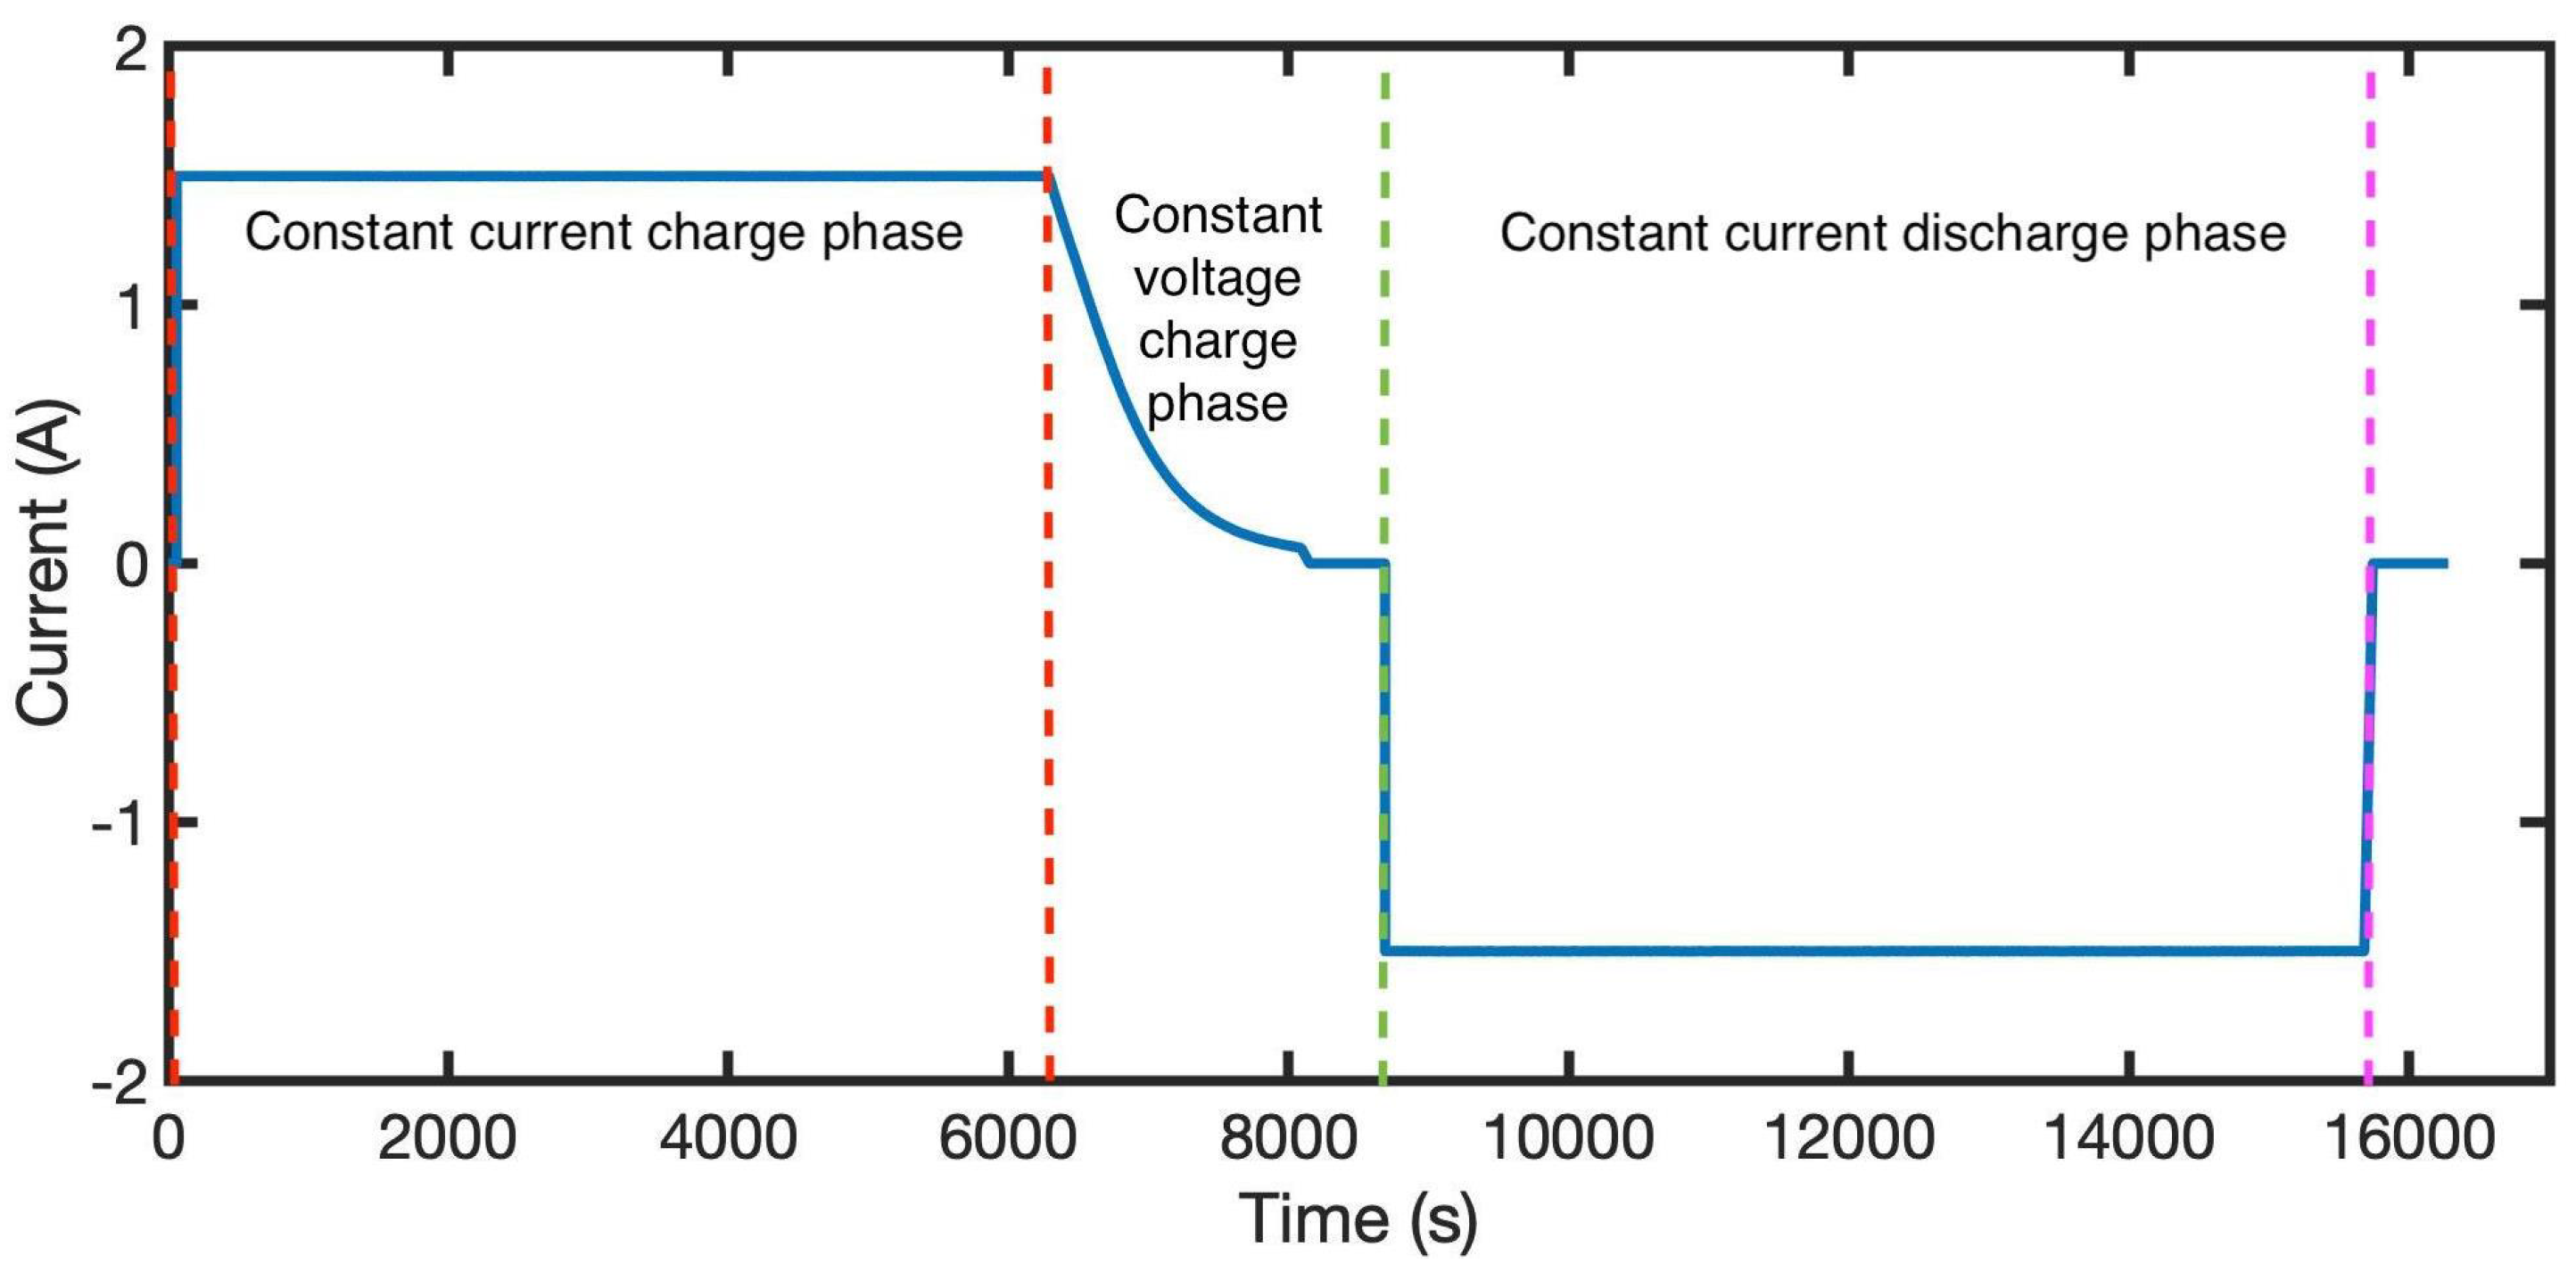
The EHPPC test is a combination of four sets of HPPC tests. The sequence of each combination includes a discharging pulse, a resting period, and a charging pulse. The current amplitudes are 1 C, 2 C, 4 C and 6 C for discharge and 0.5 C, 1 C, 1.5 C and 2 C for charge. The C unit is the battery current rate (C-rate), which represents the rate at which a battery is discharged relative to its maximum capacity. The EHPPC is performed at different SOC intervals until the battery is fully discharged (100%, 95%, 90%, 80%, 70–20%, 15%, 10%, 5%, 2.5%, 0% ).
Figure 1 illustrates the EHPPC current load and the voltage response.
To understand the degradation process of LIBs, Y. Perger et al. released a multi-year cycling study of three chemistries of 18,650 form cells, including the NMC from LG Chem [
45]. The data are available on the Battery Archive website and are shared under a double attribution license [
46]. Hereinto, the cycling ageing test was performed at different ambient temperatures (5 °C, 15 °C, 25 °C, 35 °C, 45 °C), discharge currents and depths of discharge (1 C, 5 A 10 A and 20 A).
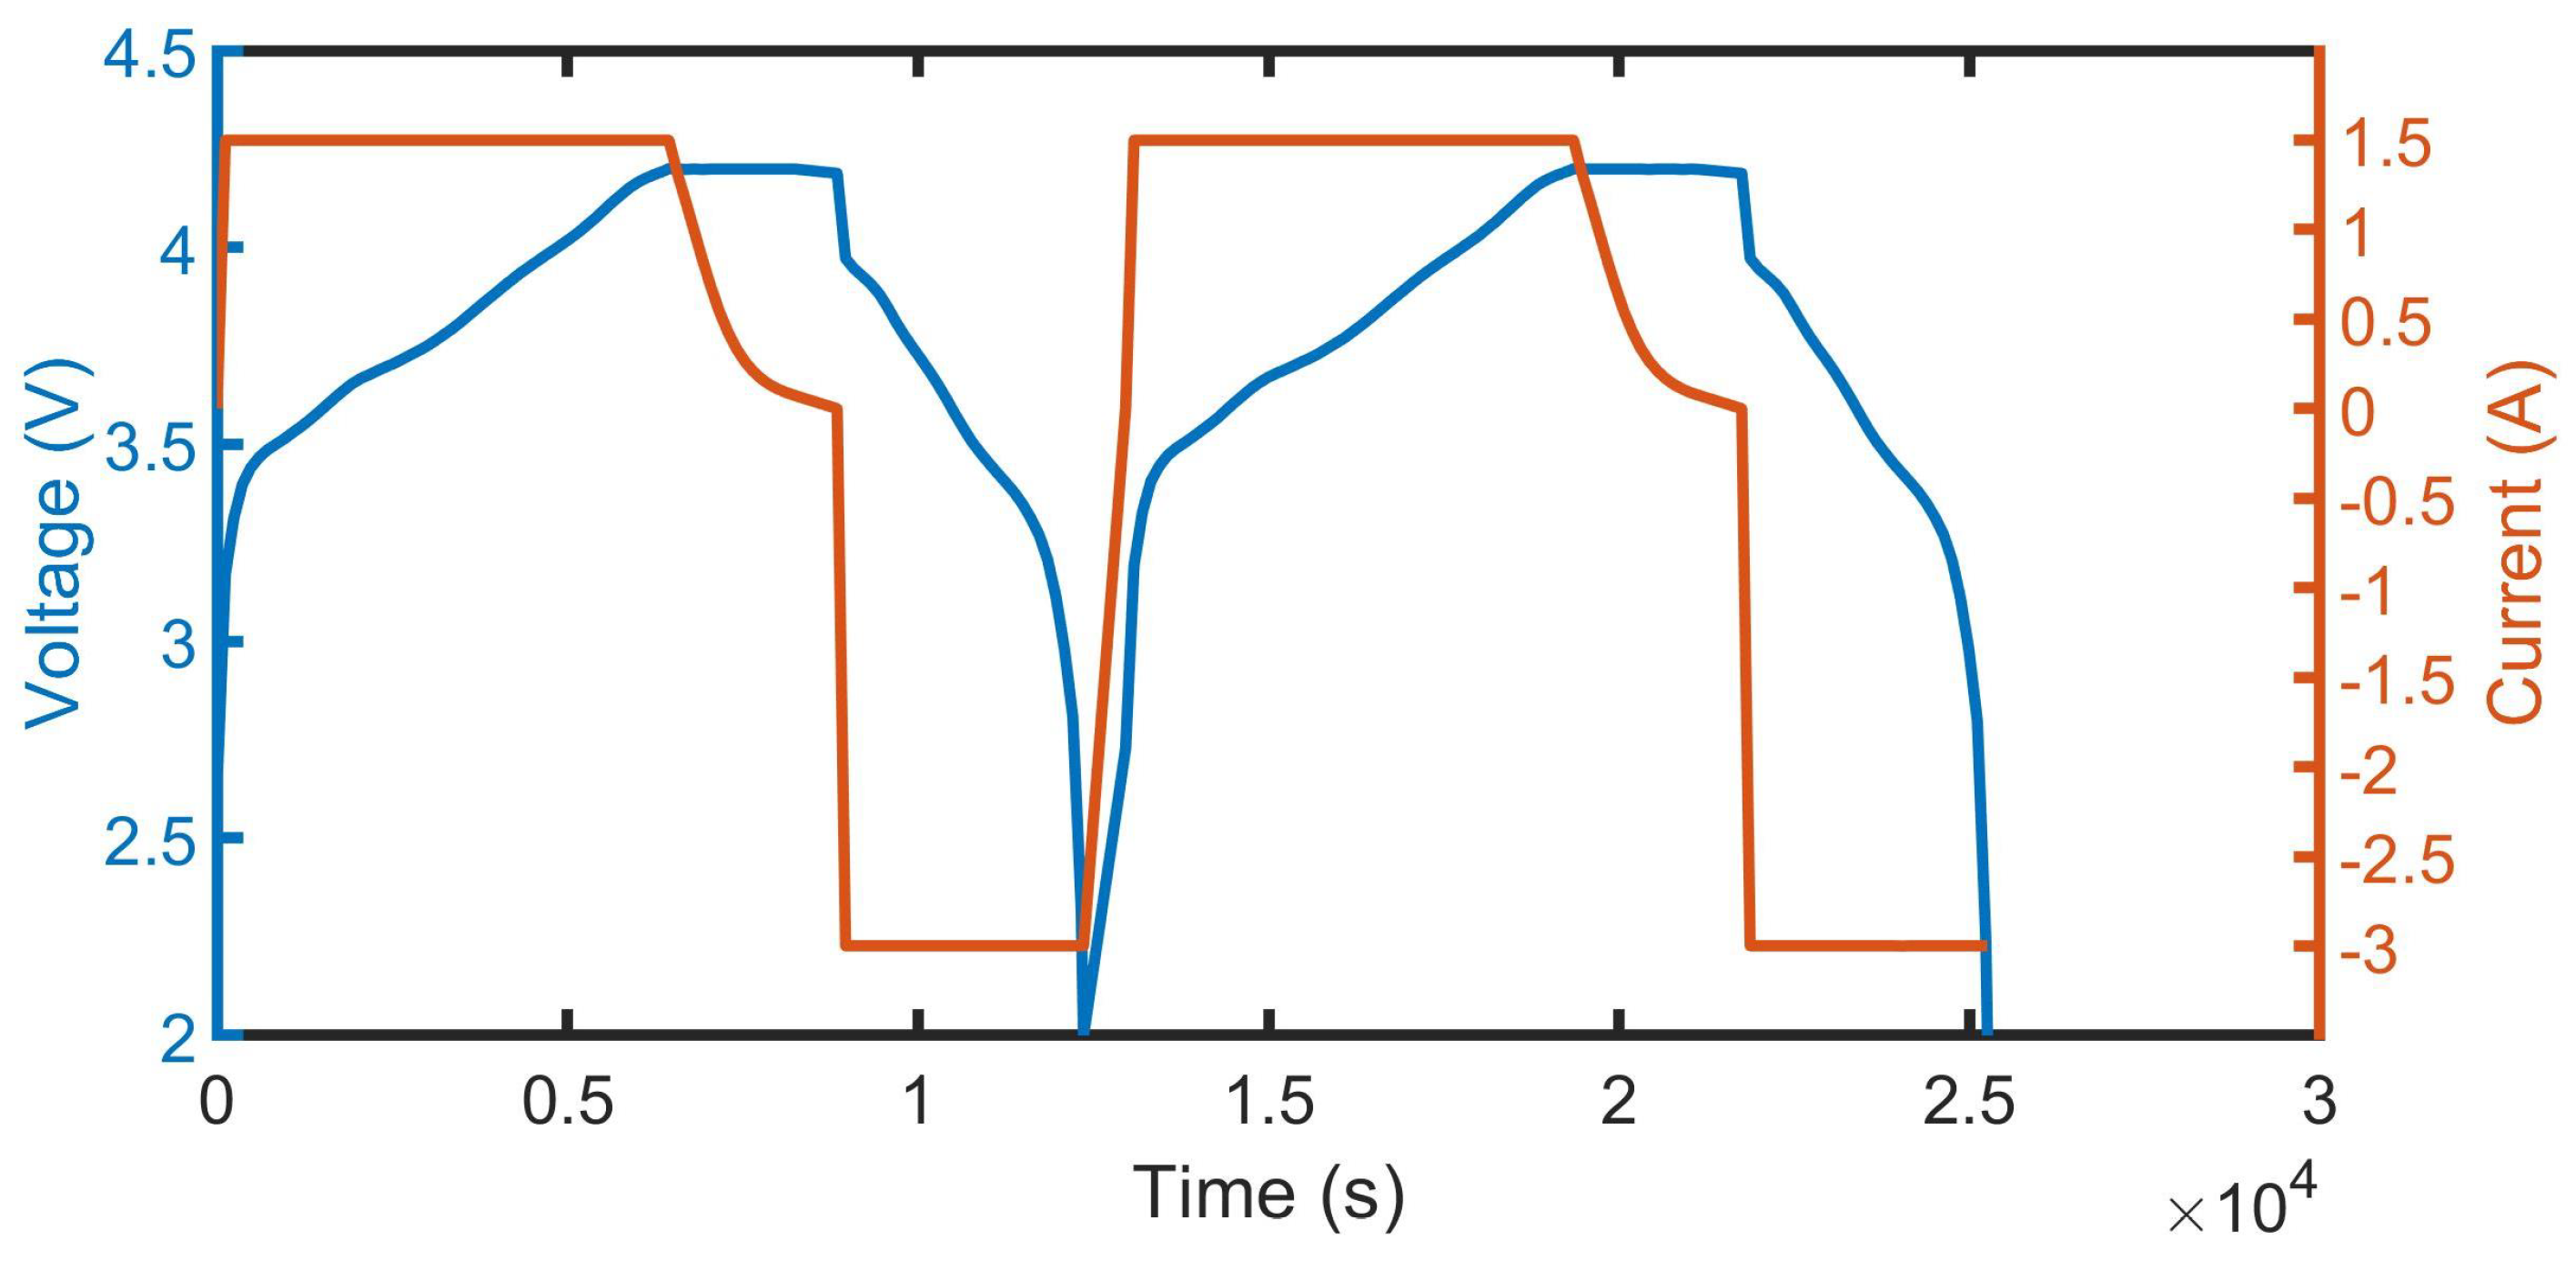
The ageing test procedure is shown in
Figure 2 and the degradation results at different temperatures are illustrated in
Figure 3.
The test was repeated until the battery reached its end-of-life (EOL), equivalent to a loss of 20% of its initial capacity. The dataset includes per-cycle and in-cycle measurements of the battery voltage, current, temperature, capacity, and energy.
2.2. Online Battery Parameter Identification
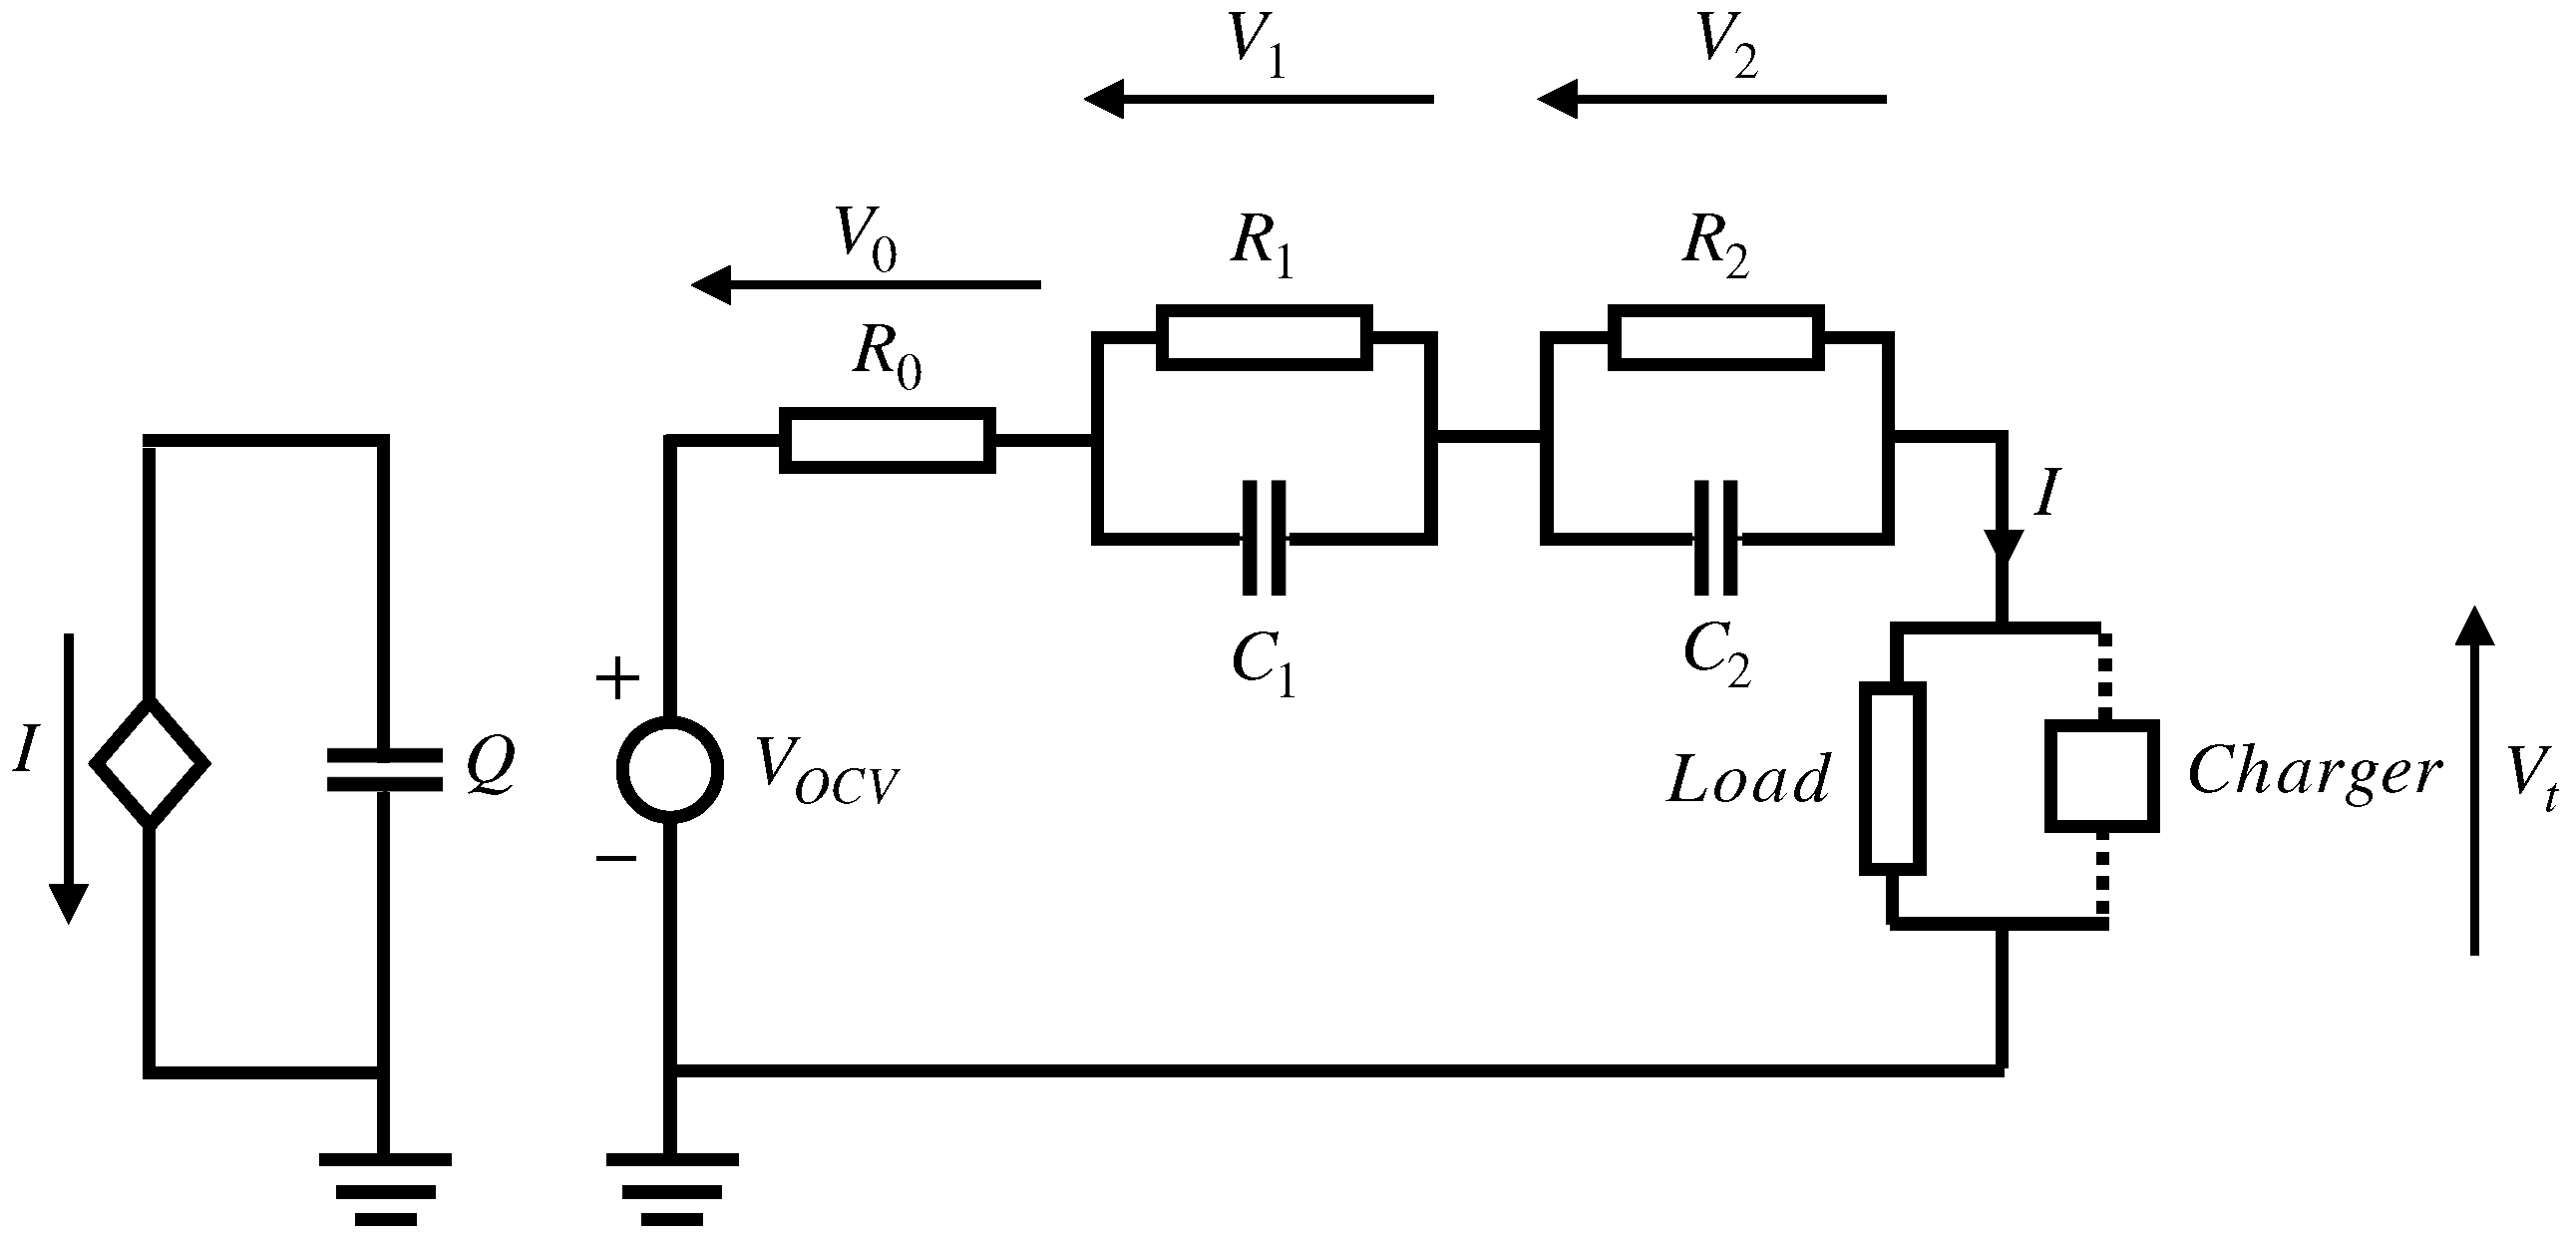
The 2RC-ECM model is adopted in this study to represent the battery dynamics. The model includes an ideal voltage source representing the battery OCV, a series resistor used to capture the internal resistance, and two capacitor–resistor networks reflecting the battery’s fast dynamic response (FDR) (i.e., the
branch) and slow dynamic response (SDR) (i.e., the
branch). The circuit topology is illustrated in
Figure 4, where
,
,
,
,
, and
are the battery parameters to be identified.
According to the Kirchoff’s Voltage Law (KVL), the state-space equation of the 2RC-ECM model is given as
Let
and
be the time constant of the two RC networks; by taking the Laplace transform of Equation (
1) we obtain
where
s represents the Laplace transform operator.
Let
y be the sum of the potentials across the ohmic resistor and the RC network; one has
.
By taking
as the system output and
I as the system input, the transfer function of Equation (
3) can be described as
Let a =
,
,
,
and
; Equation (
4) then becomes
Using the bi-linear transformation
, Equation (
5) is discretised regarding the sampling time
T into
By discretising the transfer function (Equation (
6)) using bilinear transformation, the system is modelled in a way that enables real-time parameter adaptation. The coefficients
, identified using FFRLS, represent the battery’s internal dynamics and are continuously updated to reflect changes in operating conditions.
The coefficients
are as follows
The discrete recurrence formula of Equation (
3) can be expressed as
where
,
,
define the difference between the battery terminal and open circuit voltage at the
,
,
sampling instances, respectively.
Similarly, , , define the battery current at the , , sampling instances, respectively.
Let
and
, the discrete-time transfer function model can be further rewritten into the ARX form as
where
is the information vector,
is the parameter vector to be identified and
represents the measurement noises.
The coefficients
in Equation (
5) are identified using forgetting factor recursive least squares (FF-RLS).
In contrast to traditional static parameter estimation techniques, the Forgetting Factor Recursive Least Squares (FFRLS) was employed to dynamically track time-varying parameters of the 2RC-ECM model. This method continuously updates the model to reflect changes in internal resistance and capacitance as the battery ages, ensuring accurate and real-time parameter estimation. As a result, the model adapts to varying conditions, significantly improving prediction accuracy over static models. The detailed definition steps of the FFRLS are summarised in Algorithm 1.
| Algorithm 1: Steps of the FFRLS algorithm. |
Definition Initialisation Algorithm gain and covariance matrix Prediction error and update model parameter Measurement update
|
Once the parameter vector is identified, we can deduce the calculation expression of the battery parameter
and
by applying the inverse bilinear transform rule
and comparing the corresponding coefficient in Equations (
5) and (
10)
The FFRLS continuously calculates the parameters
based on the measurable inputs and outputs by minimising the cost function as
where
is the forgetting factor,
is the estimate of
, and
is the noisy output.
Finally, we obtain the 2RC-ECM parameters as follows
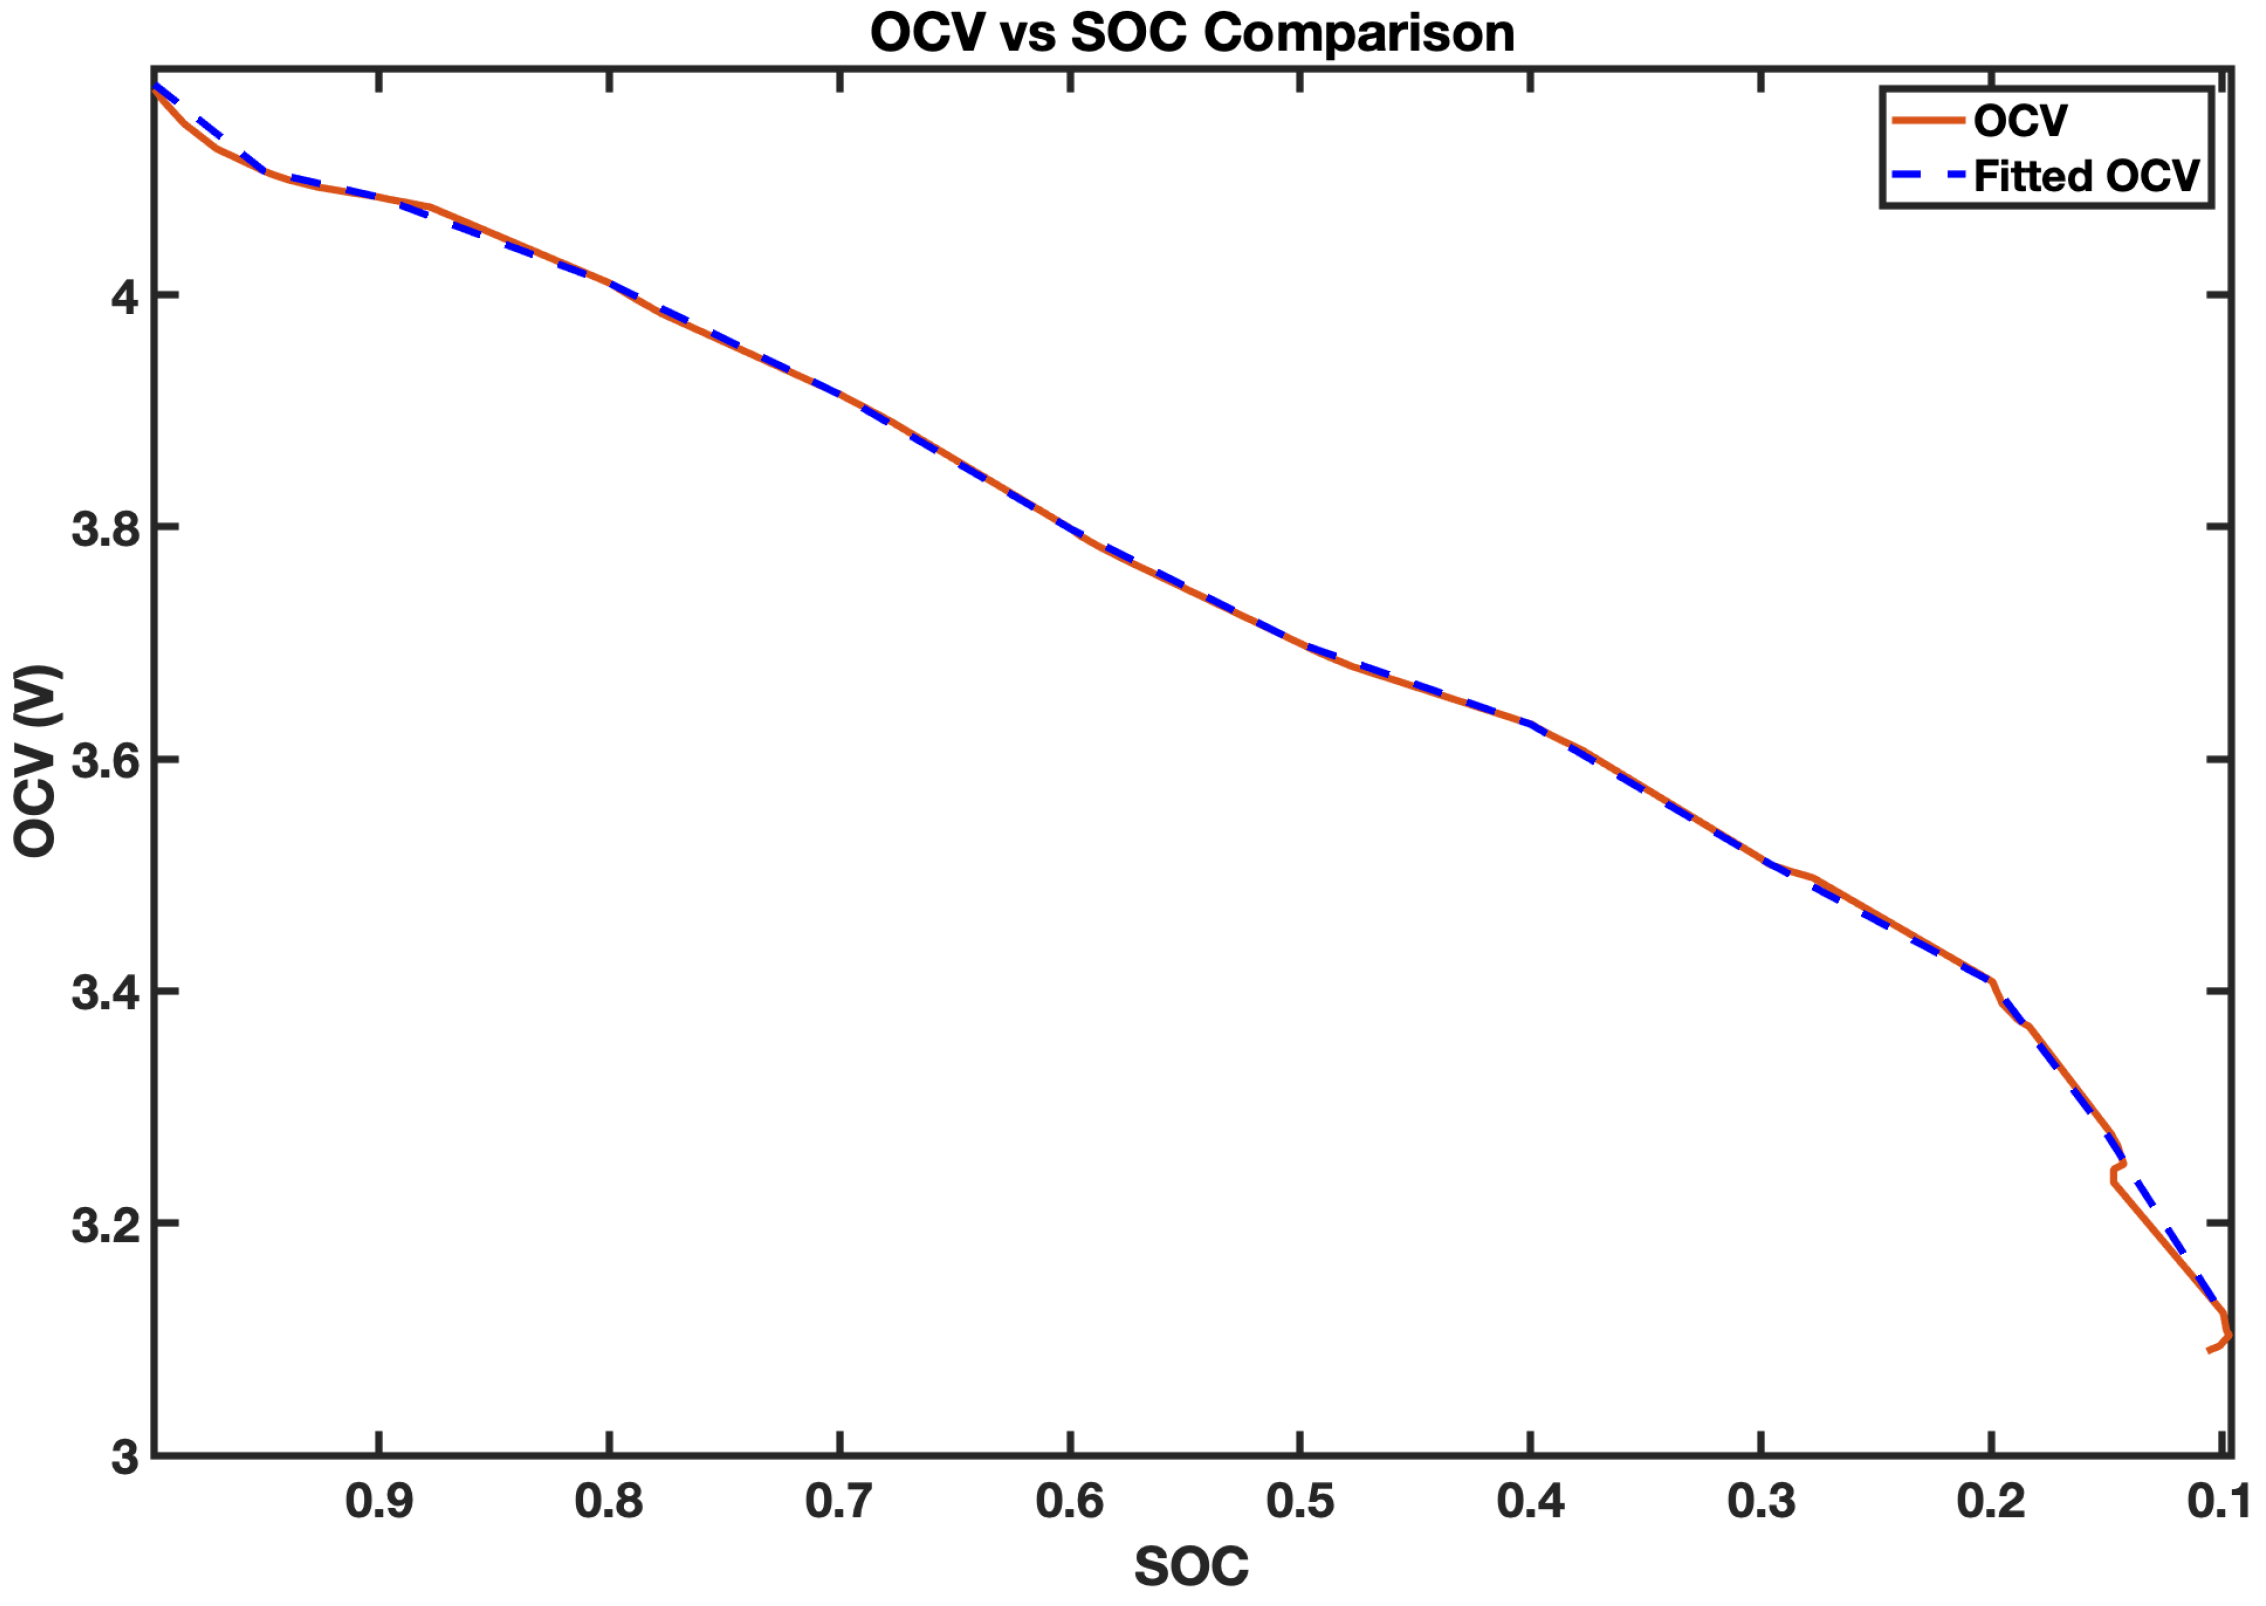
The battery OCV is extracted for each discharge pulse equivalent to the SOC point at the corresponding sampling points (1, 0.95, 0.9, 0.8, 0.7, 0.6, 0.5, 0.4, 0.3, 0.2, 0.15, 0.1, 0.05, 0.025, 0) and the corresponding voltage points in the EHPPC data (
Figure 5). The SOC is initially calculated under the laboratory test using the CC method. The intermediate points between the pre-determined OCV values are calculated using linear interpolation.
2.3. SOC Estimation
The SOC is a crucial state that assesses the system’s reliability by providing critical information like remaining energy and the remaining time before it is entirely discharged. It indicates the remaining electrical capacity relative to its nominal capacity
as follows
where
,
are the SOC value at time instants
and
, respectively;
I is the load current; and
denotes the Coulomb efficiency, expressed as:
Traditional methods like Coulomb counting (CC) are prone to errors due to noise, inaccurate initial conditions, and battery ageing. To address these limitations, we propose an Adaptive Nonlinear Sliding Mode Observer (AN-SMO), designed to improve accuracy and robustness in SOC estimation under dynamic conditions.
The 2RC-ECM is employed to describe the discrete state-space model of the SOC estimation system, expressed as follows:
where
is the sampling time,
represents the process noise, and
Q is the battery capacity. The output voltage is calculated by
where
is the open-circuit voltage,
and
are the voltages across the RC networks, and
is the internal resistance.
An accurate SOC estimation will guide the cell-balancing unit, energy, and power calculations. Hence, an adaptive nonlinear sliding mode observer (AN-SMO) is developed in this study to estimate the average SOC of the 4s2p battery pack.
This paper designed a novel (AN-SMO) that aims to improve the accuracy and robustness of the battery’s SOC. It provides an adaptive, nonlinear control strategy combined with a dynamic sliding surface.
The AN-SMO compensates for estimation errors in SOC and voltage by employing an adaptive sliding mode surface that dynamically adjusts to real-time battery conditions. These errors,
(
18) and
(
19), defined as the difference between the true value
,
and the estimated value
,
, are minimised through an adaptive control law that ensures robustness against model uncertainties, noise, and capacity degradation.
To ensure system stability and guarantee observer convergence to the true SOC and voltage values, a Lyapunov-based approach is used. For the observer stability analysis, a scalar positive definite function
, representing the system’s energy, is chosen as the Lyapunov candidate function:
where
and
denote the errors in SOC and voltage, respectively. The sliding mode control law further enhances stability by dynamically adapting to error dynamics and mitigating the effects of perturbations, avoiding discontinuities and ensuring robust system performance.
Since for and if and only if , is a positive definite function.
According to the Lyapunov theory, for the system to be stable, the time derivative of the defined Lyapunov function,
must be negative semi-definite.
Using a hyperbolic tangent function, dynamic sliding surfaces are defined to enhance the system stability by avoiding sharp discontinuities and smoothing transitions.
where
,
,
and
are adaptive observer gains that vary based on the error dynamics.
The sliding mode control law is chosen to ensure that the system reaches the switching surface and stays on this surface when perturbations occur, as follows:
Using these control laws, the derivative Lyapunov function can be expressed as
Since , the system is Lyapunov-stable. As and approach zero, the developed observer converges to the true SOC and voltage values, ensuring accurate and robust SOC estimation.
2.4. Ageing Estimation
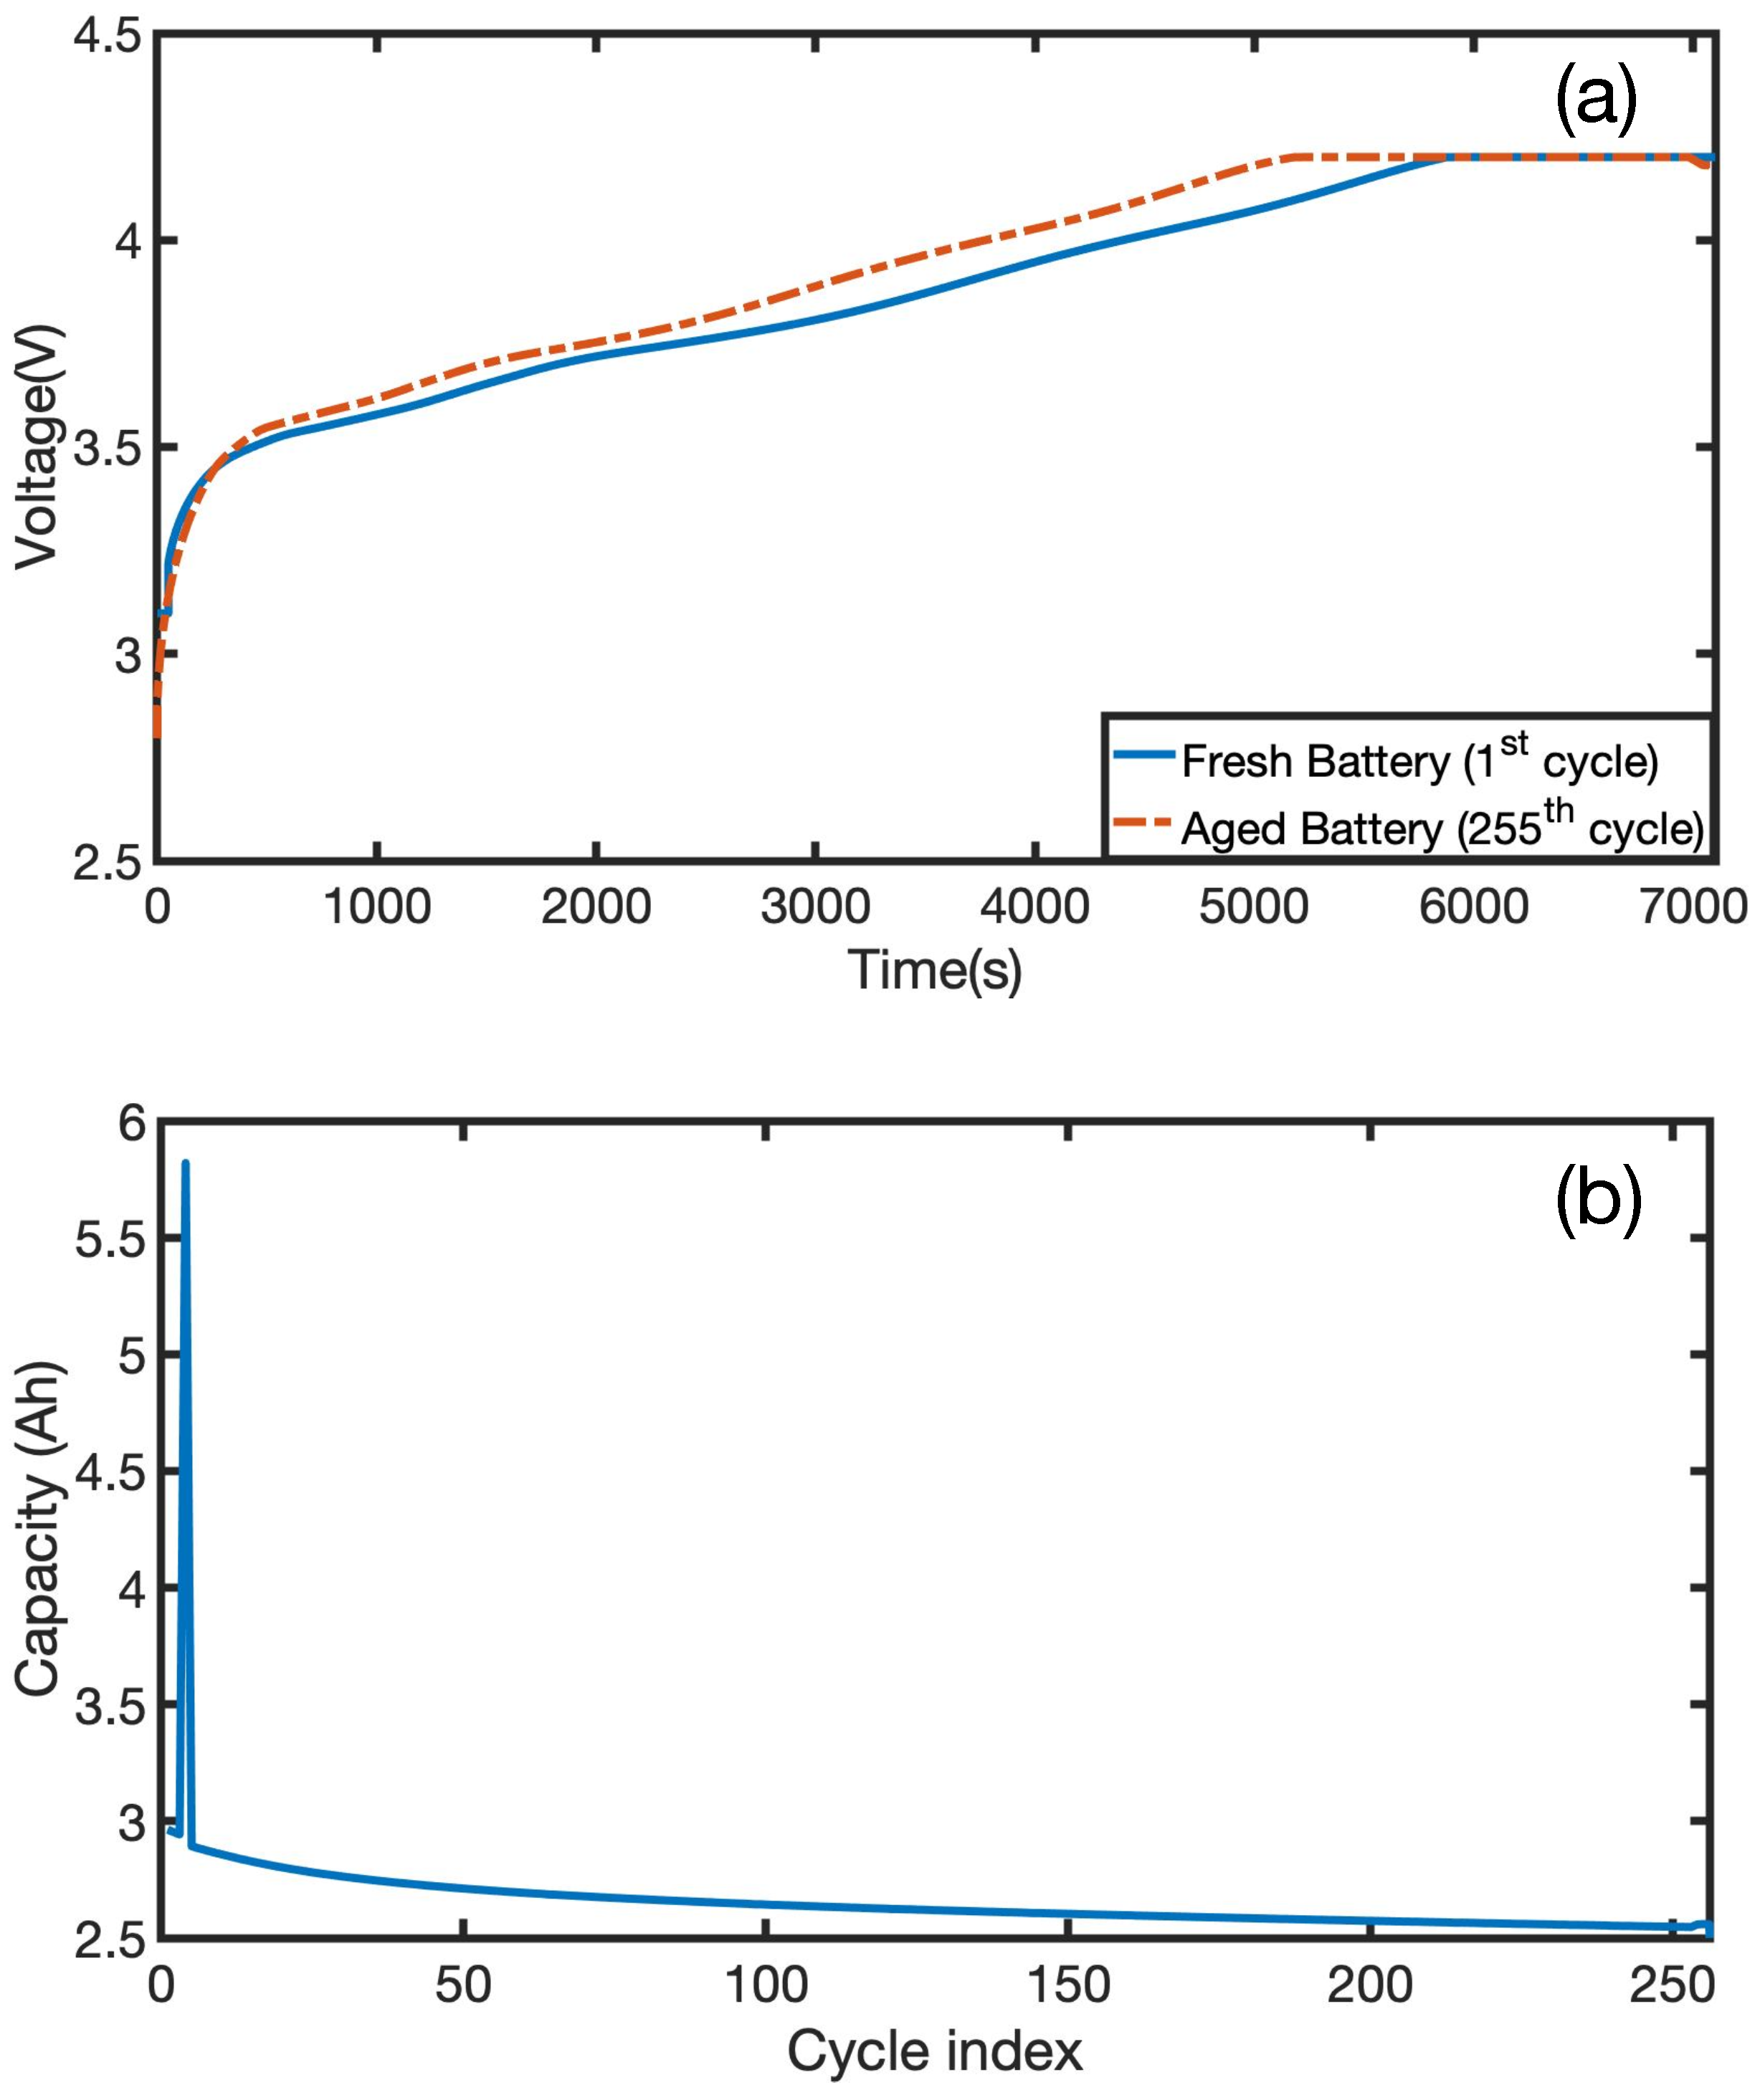
LIBs are subject to ongoing performance decay throughout their lifetime due to side reactions and unfavourable working conditions. As the number of charge–discharge cycles increases, the battery performance declines, reflecting a decrease in the battery capacity.
Figure 6 shows a notable difference between the voltage response of a fresh battery during its first charging profile compared to the same battery response after 255 cycles. The aged battery reaches the upper voltage limit of 4.2 V before the fresh cell. Moreover, the battery capacity gradually decays with increased charge–discharge cycles. Hence, the precise metering of the battery’s actual capacity can be used to reflect the current health and thus the remaining cycles before the EOL event. Real-time updates of the present capacity will enhance the system’s overall performance and the SOC algorithm’s accuracy.
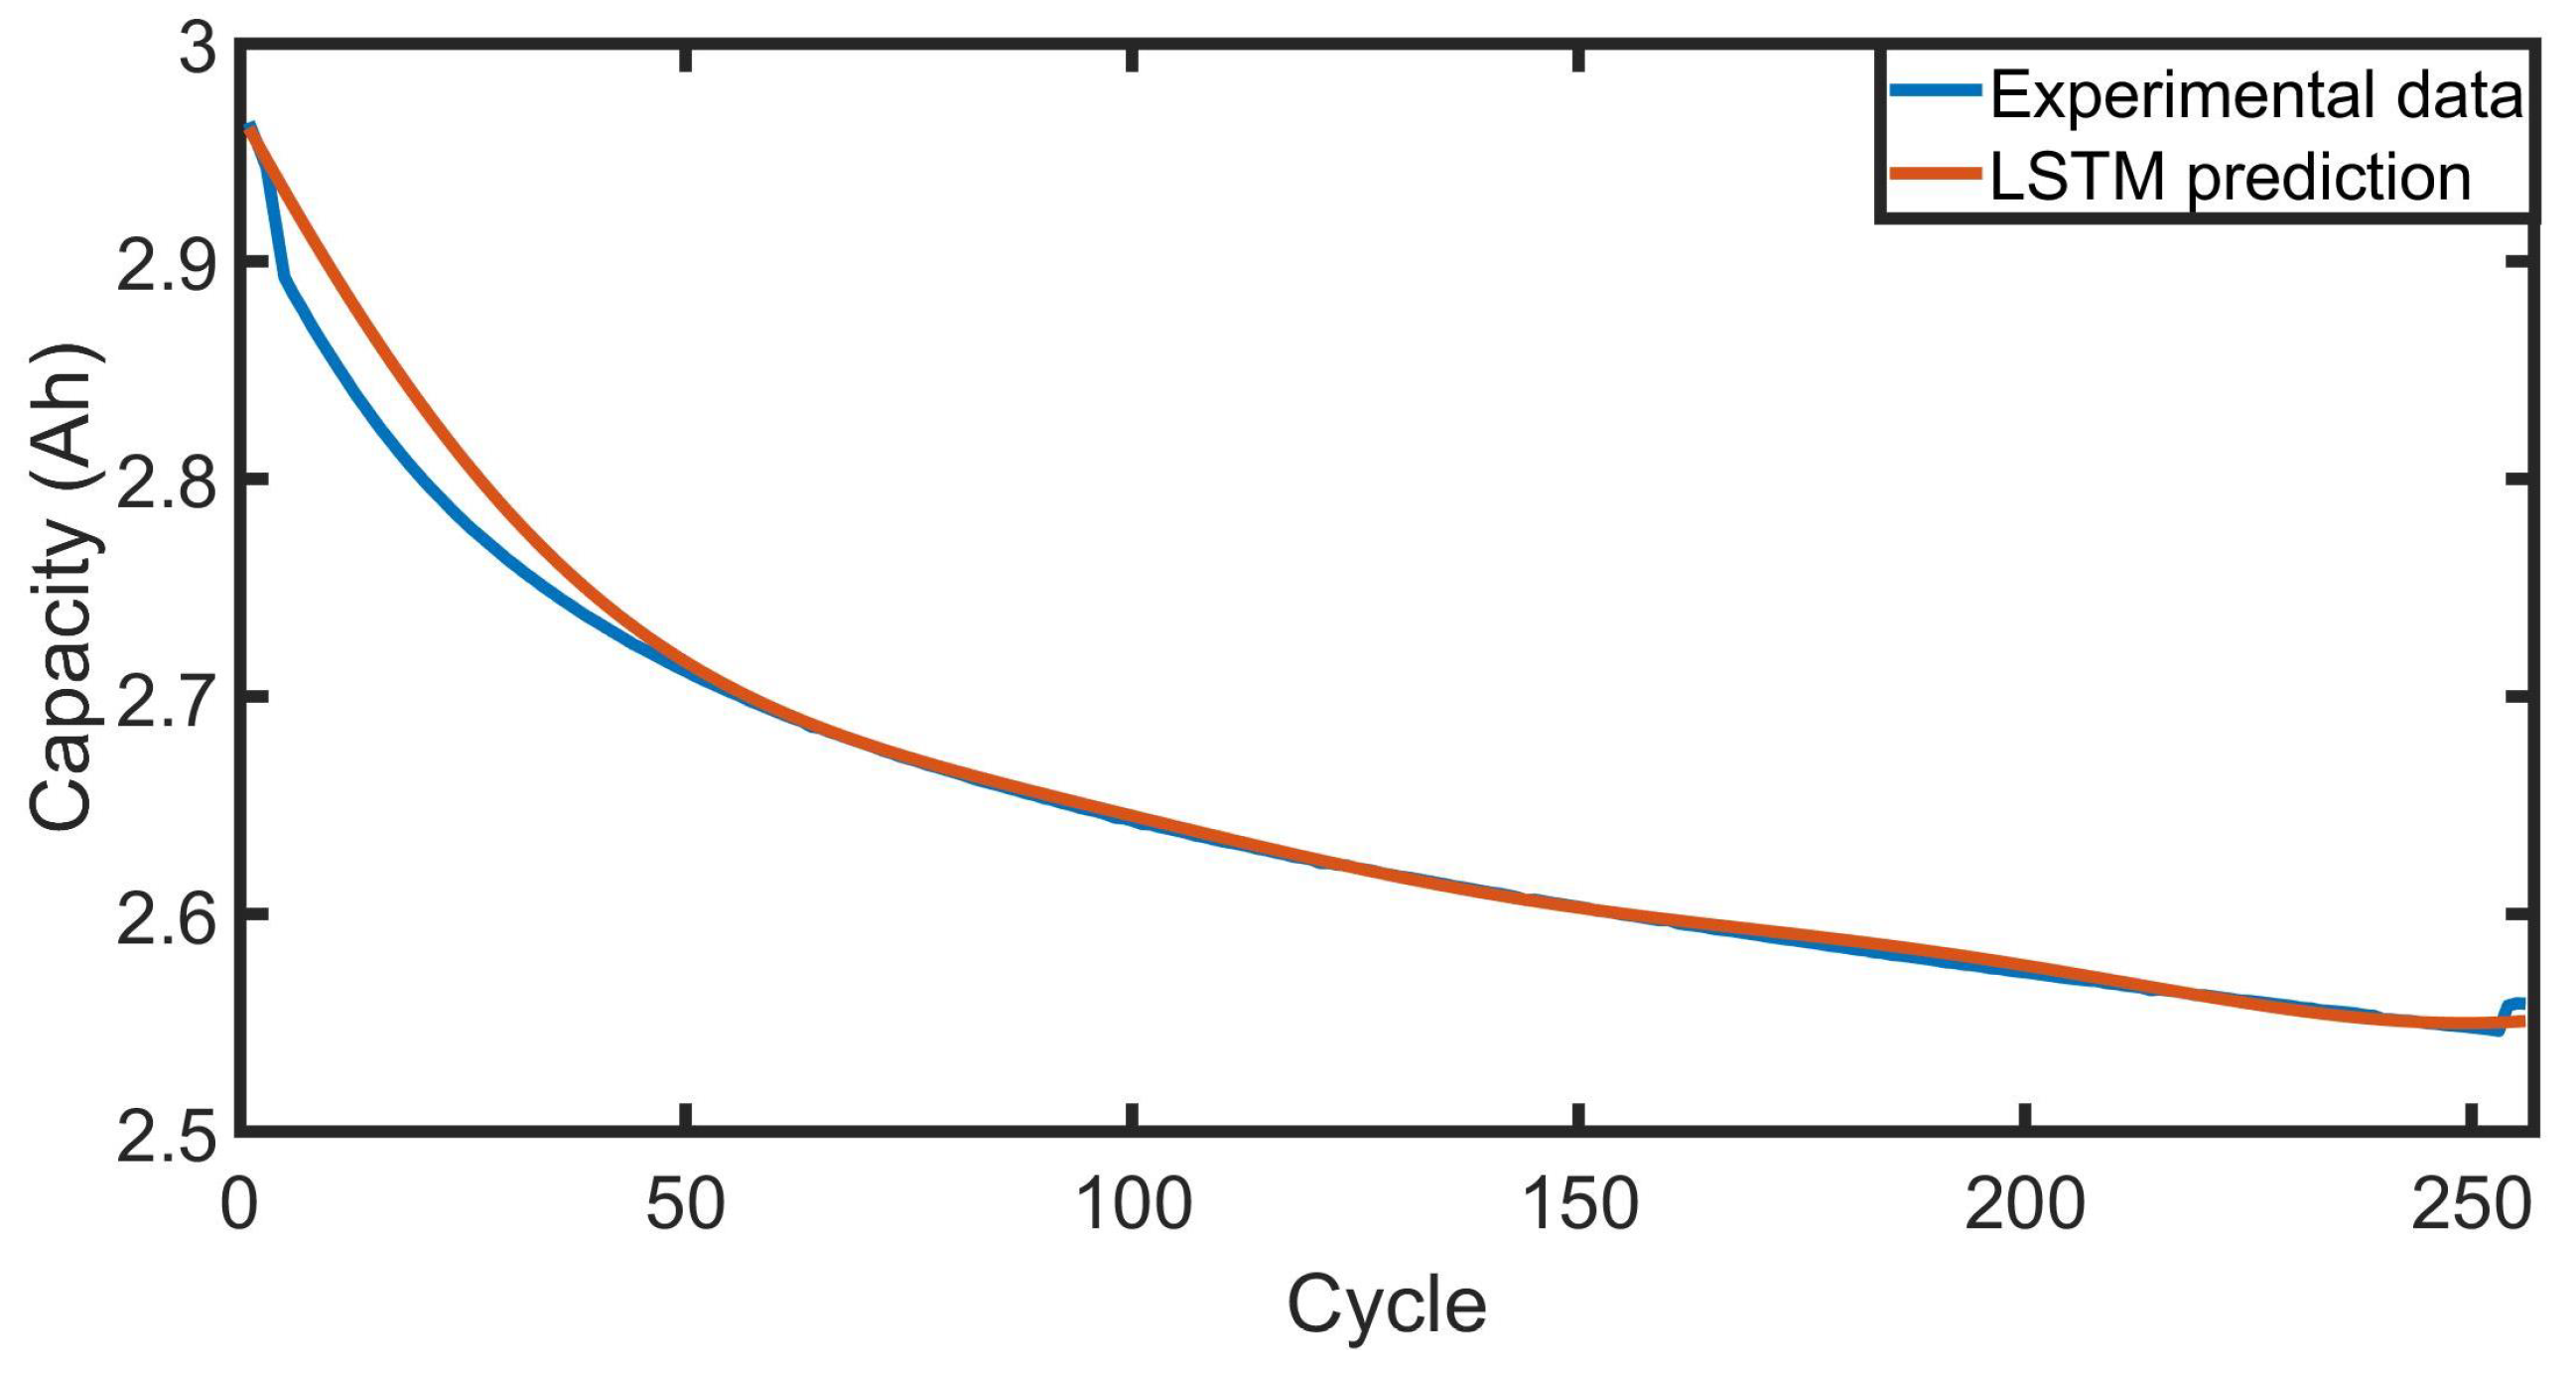
Herein, the LSTM-RNN approach is leveraged to estimate the remaining battery capacity using the data gathered from ageing experiments. The proposed framework follows three consecutive steps: data preprocessing, training, and prediction, each detailed below.
2.4.1. Step 1:Data Preprocessing
Effective data preprocessing is crucial step of the LSTM-based methods. It enssures clean, structured, and normalised data, essential for accurate estimation of the battery capacity. The primary preprocessing steps include:
2.4.2. Step 2: Model Architecture and Training
The LSTM model includes three main layers, each playing a unique role in estimating the battery capacity. At its core, the model has an LSTM layer with 50 units, chosen to model the long-term dependencies within sequential battery ageing data. Next, a dropout layer with a rate of 0.2 is included to prevent overfitting, which randomly deactivates 20% of the neurons during each training cycle. This regularisation ensures better performance by minimising dependence on individual neurons. Finally, a dense layer with a single neuron and a linear activation function generates a continuous estimate of capacity.
2.4.3. Step 3: Prediction Process
LSTMs are designed to mitigate the long-term dependency problem. As shown in
Figure 7, the general structure of the LSTM includes an input gate, a cell, a forget gate, and an output gate. The network unrolls the inputs (
) over arbitrary time intervals learning new information from each time step. The three gates regulate data flow into and out of the memory blocks. First, the forget gate optimises the performance of the LSTM by filtering the information acquired from the previous time step to keep the information relevant for the system and discard the less critical ones. The forget gate takes as input the hidden state of the prior cell (
), the current input (
), the weight associated with the input (
) and the weight associated with the hidden state (
). Then, the sigmoid function
is applied to adjust the forget gate to output a number between 0 and 1 for each data point in the cell state
. The equation for the forget gate as
The input gate evaluates the importance of the input to decide which information to update using the following equation:
Next, the Rectified Linear Unit (ReLu) activation function is applied to create the new candidate values that could be used to update the cell state. The new information will have a value between −1 and 1 to remove the new data from the cell state if its value is negative or add the new data to the cell state if it is negative.
The old cell state is updated as follows
This data manipulation is achieved using a sigmoid neural net layer and a pointwise multiplication operation. The sigmoid function outputs a vector of numbers between 0 and 1, representing the weight of each component in the cell state.
The output gate equation is expressed as
Finally, using the
and
of the updated cell state
, the current hidden state is calculated as follows:
3. Hardware Description
This section encompasses the hardware design of the HMS for SOC estimation, fault detection, and health management of a Li-ion battery pack. The battery pack is constructed by connecting the LG-HG2 18650 lithium nickel cobalt manganese (NMC) battery in four parallel strings and two units in series (4S2P). The specification of the battery cell is listed in
Table 1.
The schematic diagram of the proposed HMS is illustrated in
Figure 8. The protection and measurement unit reads the current that flows in and out of the battery pack, the voltage across each cell, and the temperature variation within the battery pack at six different spots. The STM32F429 (STMicroelectronics, Geneva, Switzerland) sends the collected data to the Raspberry Pi3 (Raspberry Pi Foundation, Cambridge, United Kingdom) and waits for its orders. The Raspberry Pi3 evaluates the data report of each cell, checks if the operating conditions are respected, marks the cells with a critical state and carries out the HMS functionalities.
For the Li-ion battery to perform safely for a long period, the proposed HMS has a master–slave topology in which the slave unit (STM32F4) communicates with the battery and collects the data readings from the sensors’ platform with a 12-bit resolution. The master (Raspberry Pi3) receives the measured voltage, current, and temperature and handles computation and communication (see
Figure 9).
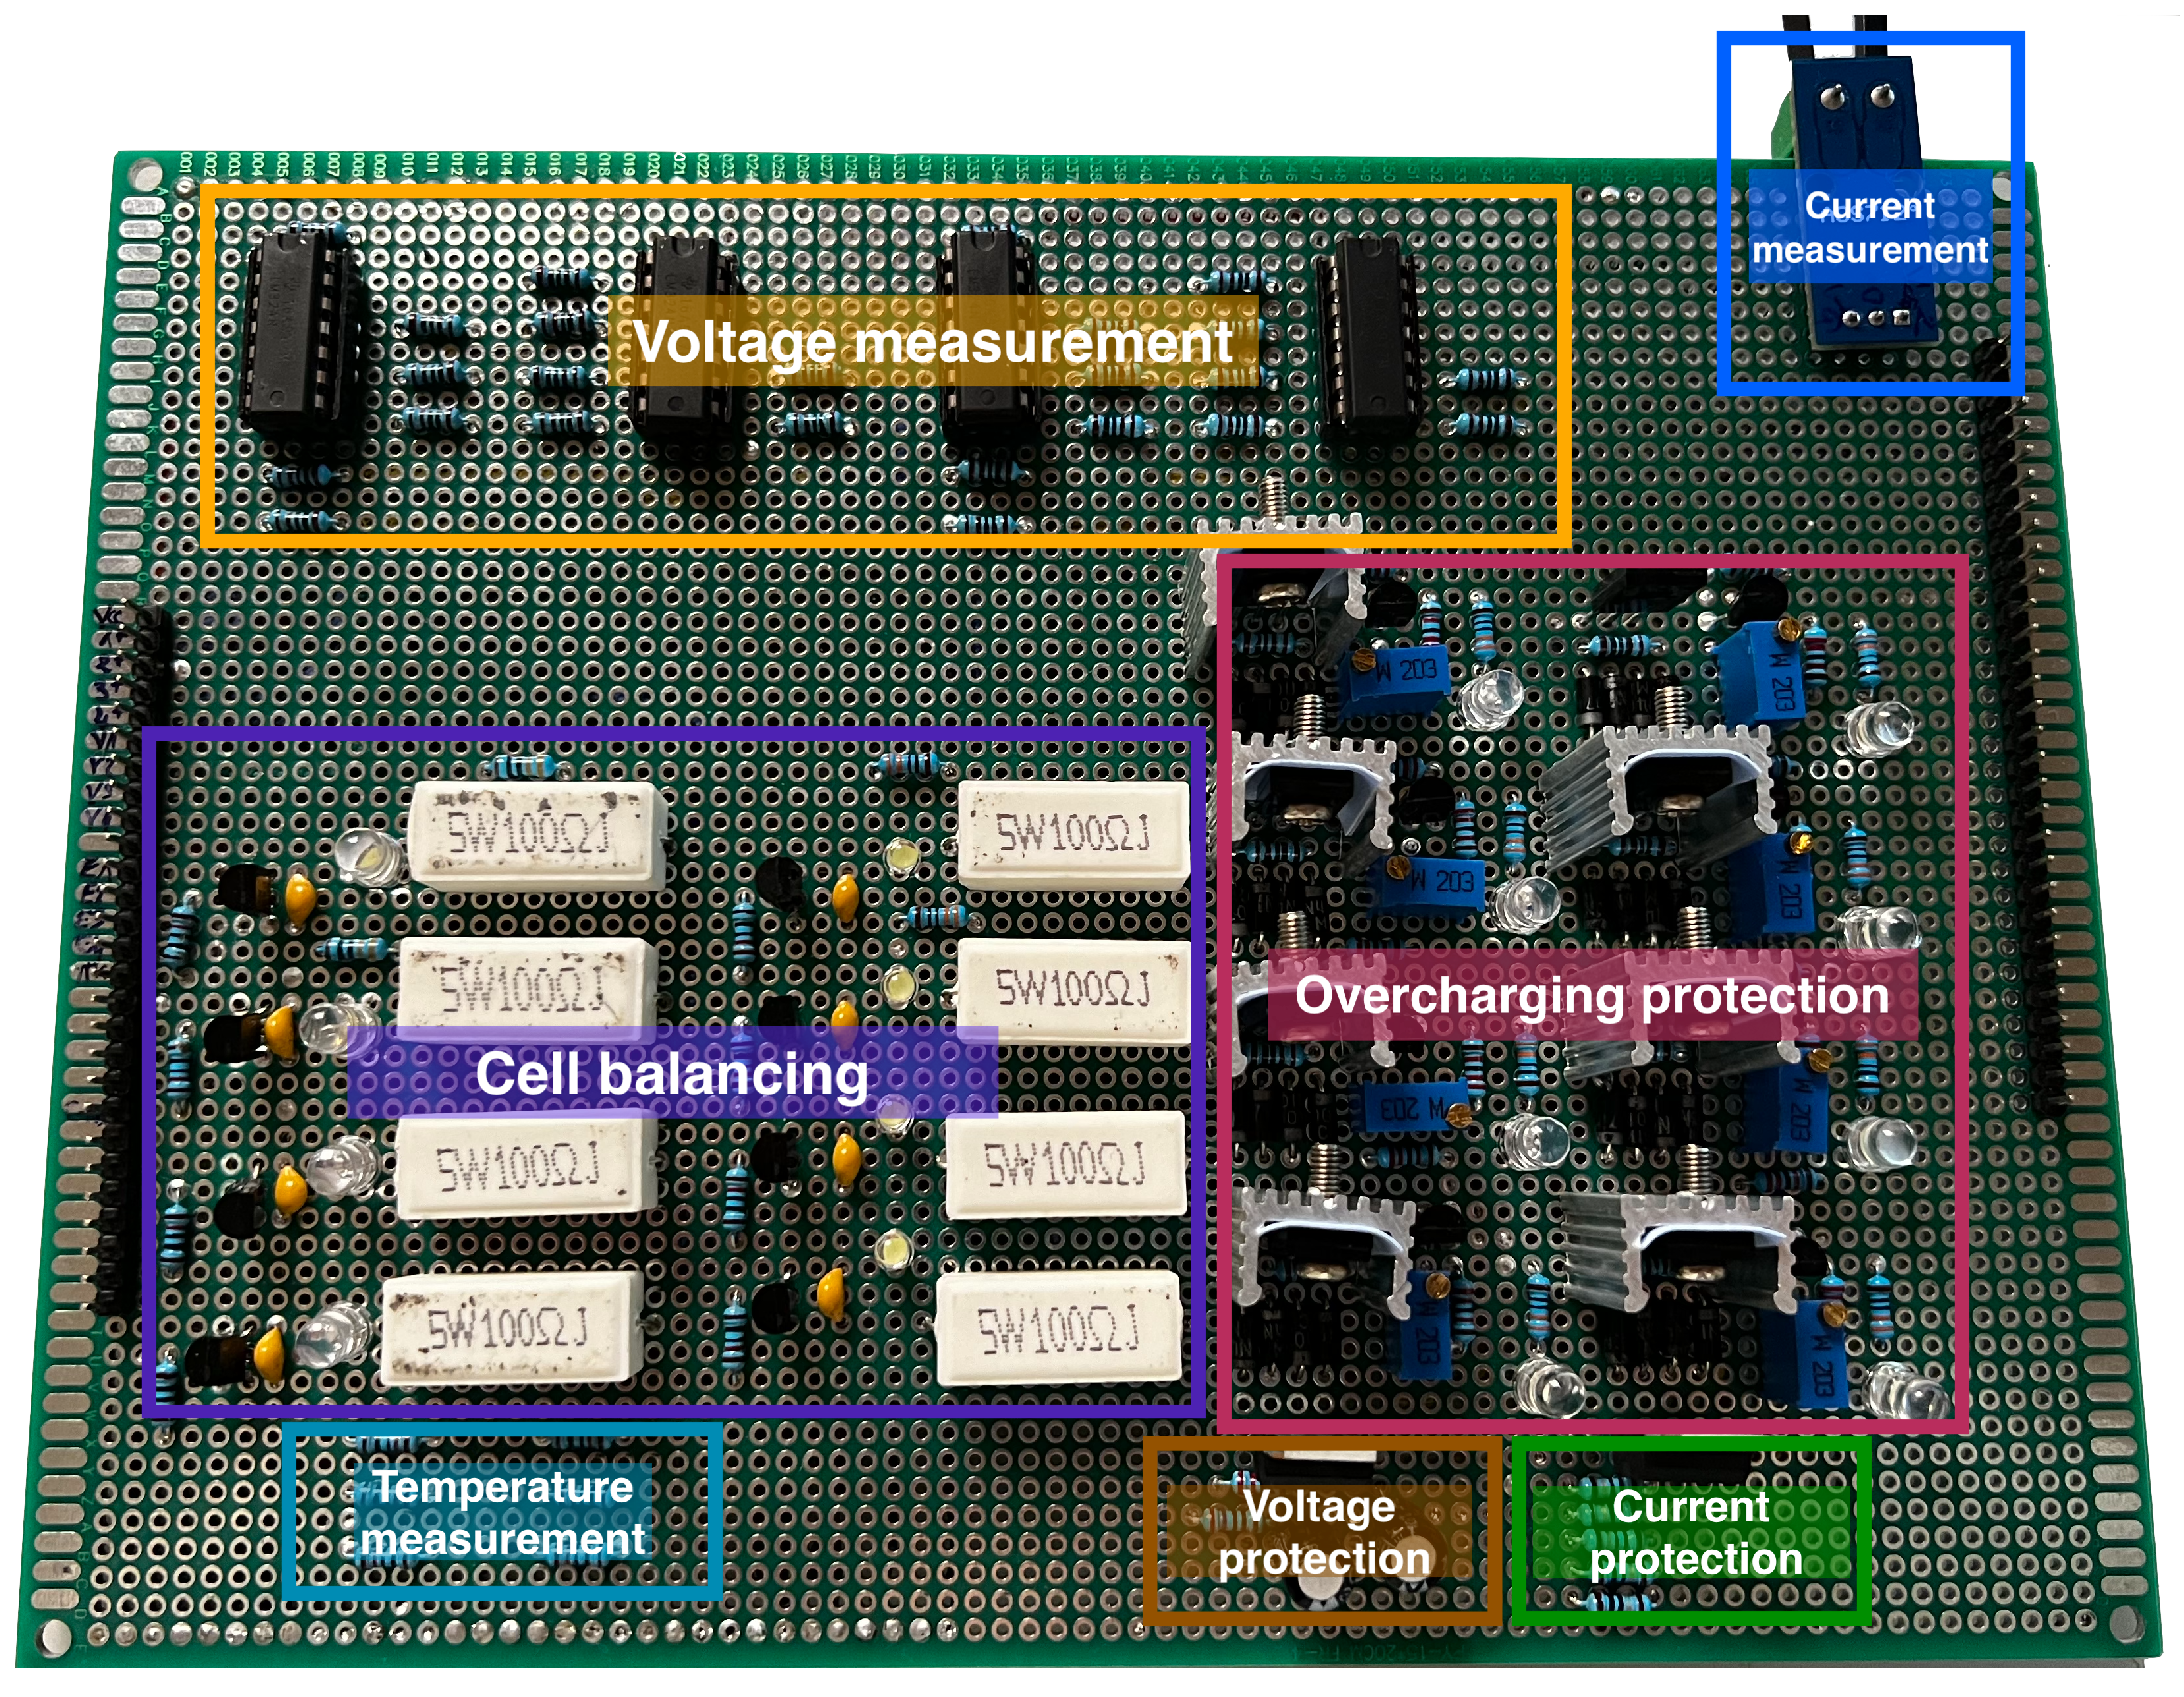
Figure 10 summarises the functions of the HMS measurement and protection sub-unit. It is responsible for data gathering, typically voltage acquisition of the pack and the voltage of each battery, pack current collection and temperature measurement. The collected data are transmitted to the STM32F4 for analog-to-digital conversion. The cell balancing block controls the charge distribution of the cells by bringing all cells to the same SOC, while the overcharging protection block ensures that the battery functions within its SOA during the charge and discharge cycle. The slave unit communicates the converted data to the Raspberry Pi 3 through SPI communication. The Raspberry Pi uses the collected information to estimate the battery states and control the protection and management units.
3.1. Voltage Acquisition
The real-time measurement of individual cell voltage is a crucial task that is directly related to the performance of the HMS. It helps to keep the battery within its safe operating zone, spot cell voltage differences, and estimate its remaining capacity. For a pack of series-connected cells, the reference point remains constant, which hinders the individual cell voltage measurement. This problem does not appear for the first cell directly connected to the ground. Nevertheless, the voltage of other cells must be calculated based on the voltage of the previous cell. A simple way to assess this will be the usage of a voltage divider to map down the potential levels before measuring them. However, this will reduce the resolution of the voltage read to more than 0.1 V. In this study, two OPA4197s (Texas Instruments, Dallas, USA) are used to measure the voltage of each battery in the pack. The first Quad Op-Amp acts as a buffer circuit to prevent the cells from getting loaded individually, while the second forms a differential amplifier circuit.
Figure 11 illustrates the circuit diagram for measuring the voltage across each battery of the pack.
Pins PA1-PA4 are connected to the ADC pins of the STM32F429 discovery board.
3.2. Current Measurement
In addition to voltage measurement, the HMS requires readings of the battery current which is essential for estimating the battery SOC and remaining useful life (RUL) and to perform security and safety functions. The accuracy of the current measurement will directly influence the performance of the HMS. Here, we propose using the Hall-effect-based current sensor ACS712-30A (Allegro Microsystems, Worcester, MA, USA) with a sensitivity of 66 mV/A to measure the current that flows from the pack to the load, as shown in
Figure 12. The slave board receives the measured current through the PA0 ADC pin.
3.3. Temperature Measurement
LIBs are sensitive to temperature. High and low temperatures outside the optimal range of operation will accelerate the ageing process, leading to battery failure and even explosion. Thus, tracking temperature evaluation inside the pack is essential to ensure the pack cells operate within their SOA. The proposed HMS uses six 10 KΩ negative temperature coefficient (NTC) thermistors placed between the adjacent cells in the battery pack to measure the temperature.
Figure 13 shows the temperature acquisition circuit. The thermistor is connected to a 10 KΩ fixed resistor, which is used as a reference to probe the decrease and increase in the NTC resistance. The STM32 (STMicroelectronics, Geneva, Switzerland) reads the resistance value and converts it to temperature using the Steinhart and Hart equation.
3.4. Cell Balancing
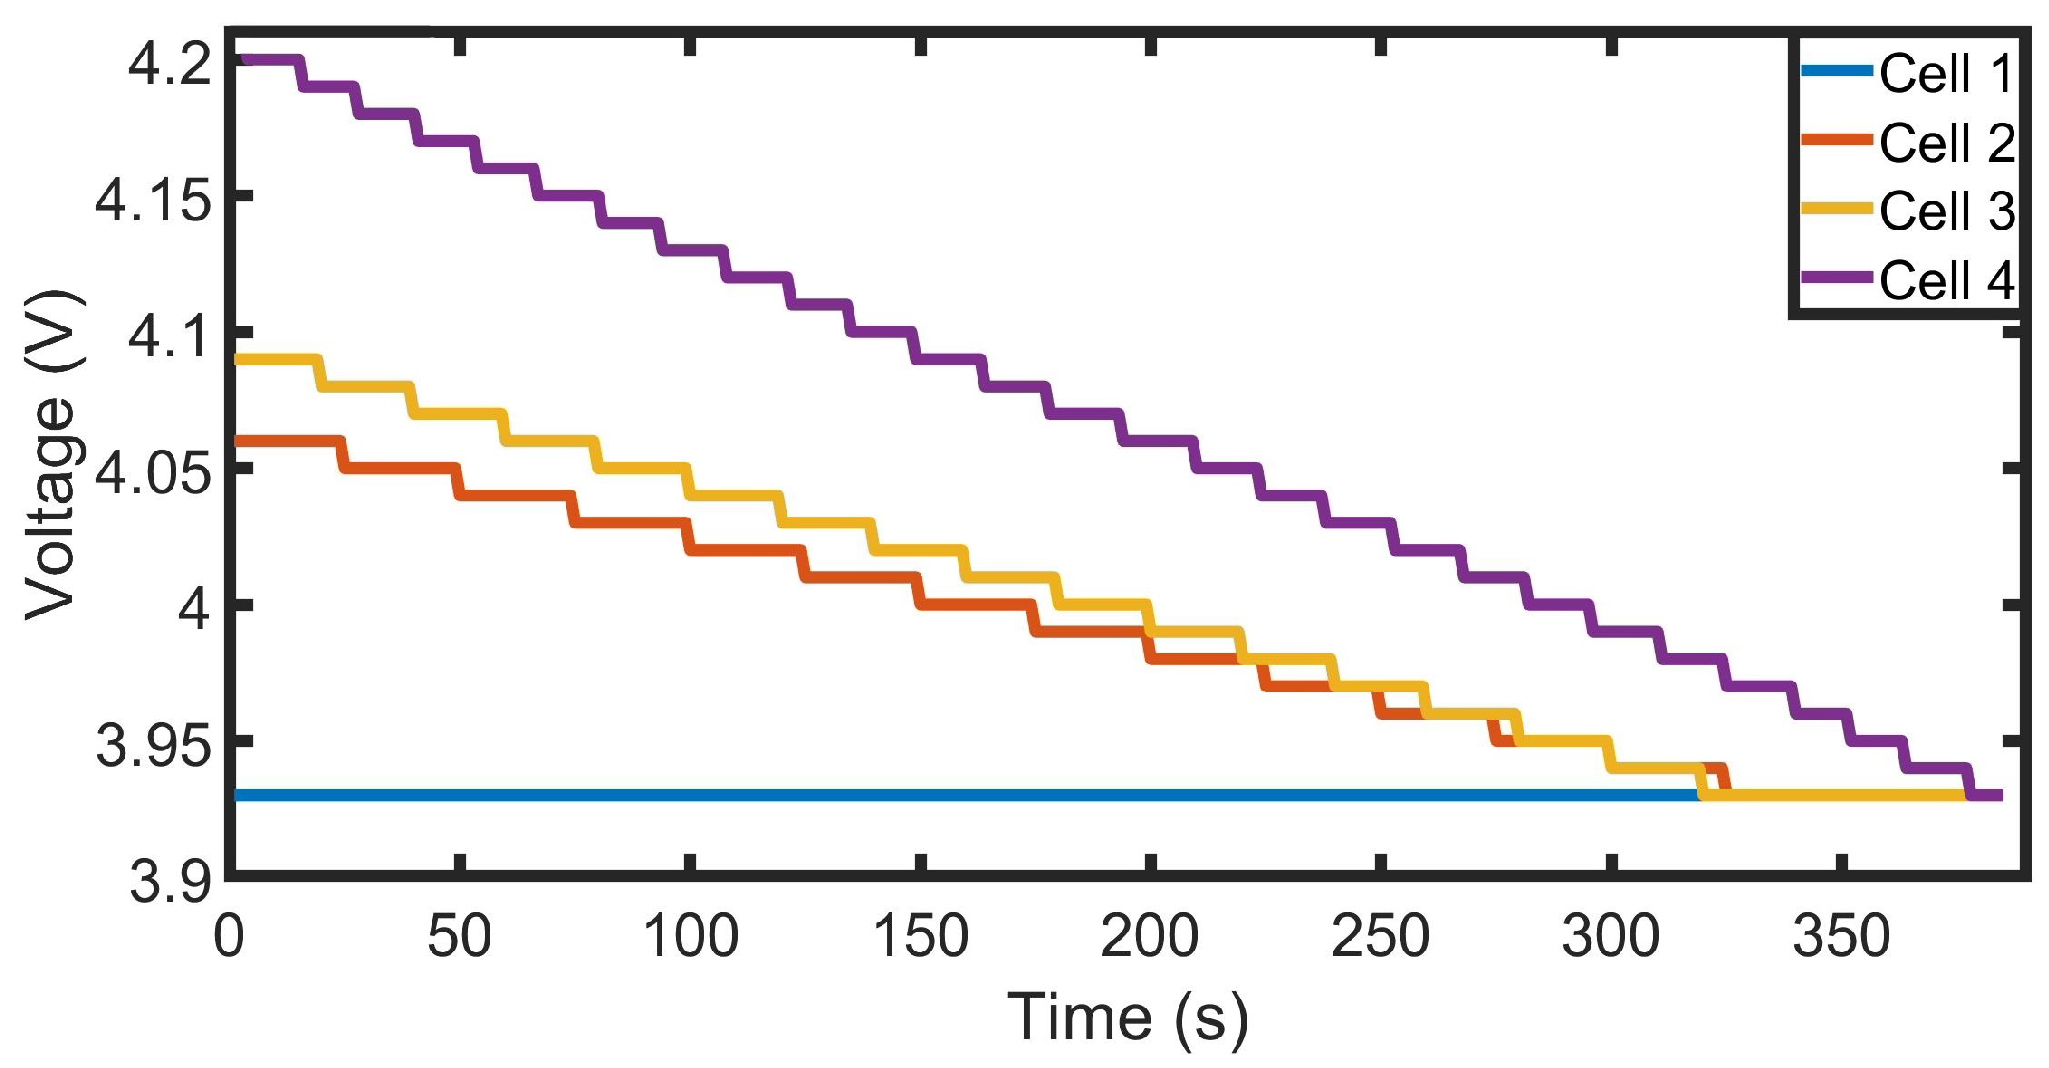
One major problem that the control system must tackle is voltage imbalance. This problem arises because of cell-to-cell variation and different charging histories, specifically when cells are connected in series. During operation, the uneven temperature distribution inside the pack and the varying internal resistance cause the cells to charge/discharge at various rates; some cells could drain before others, and thus, the pack is considered fully discharged while it still has available energy and vice versa.
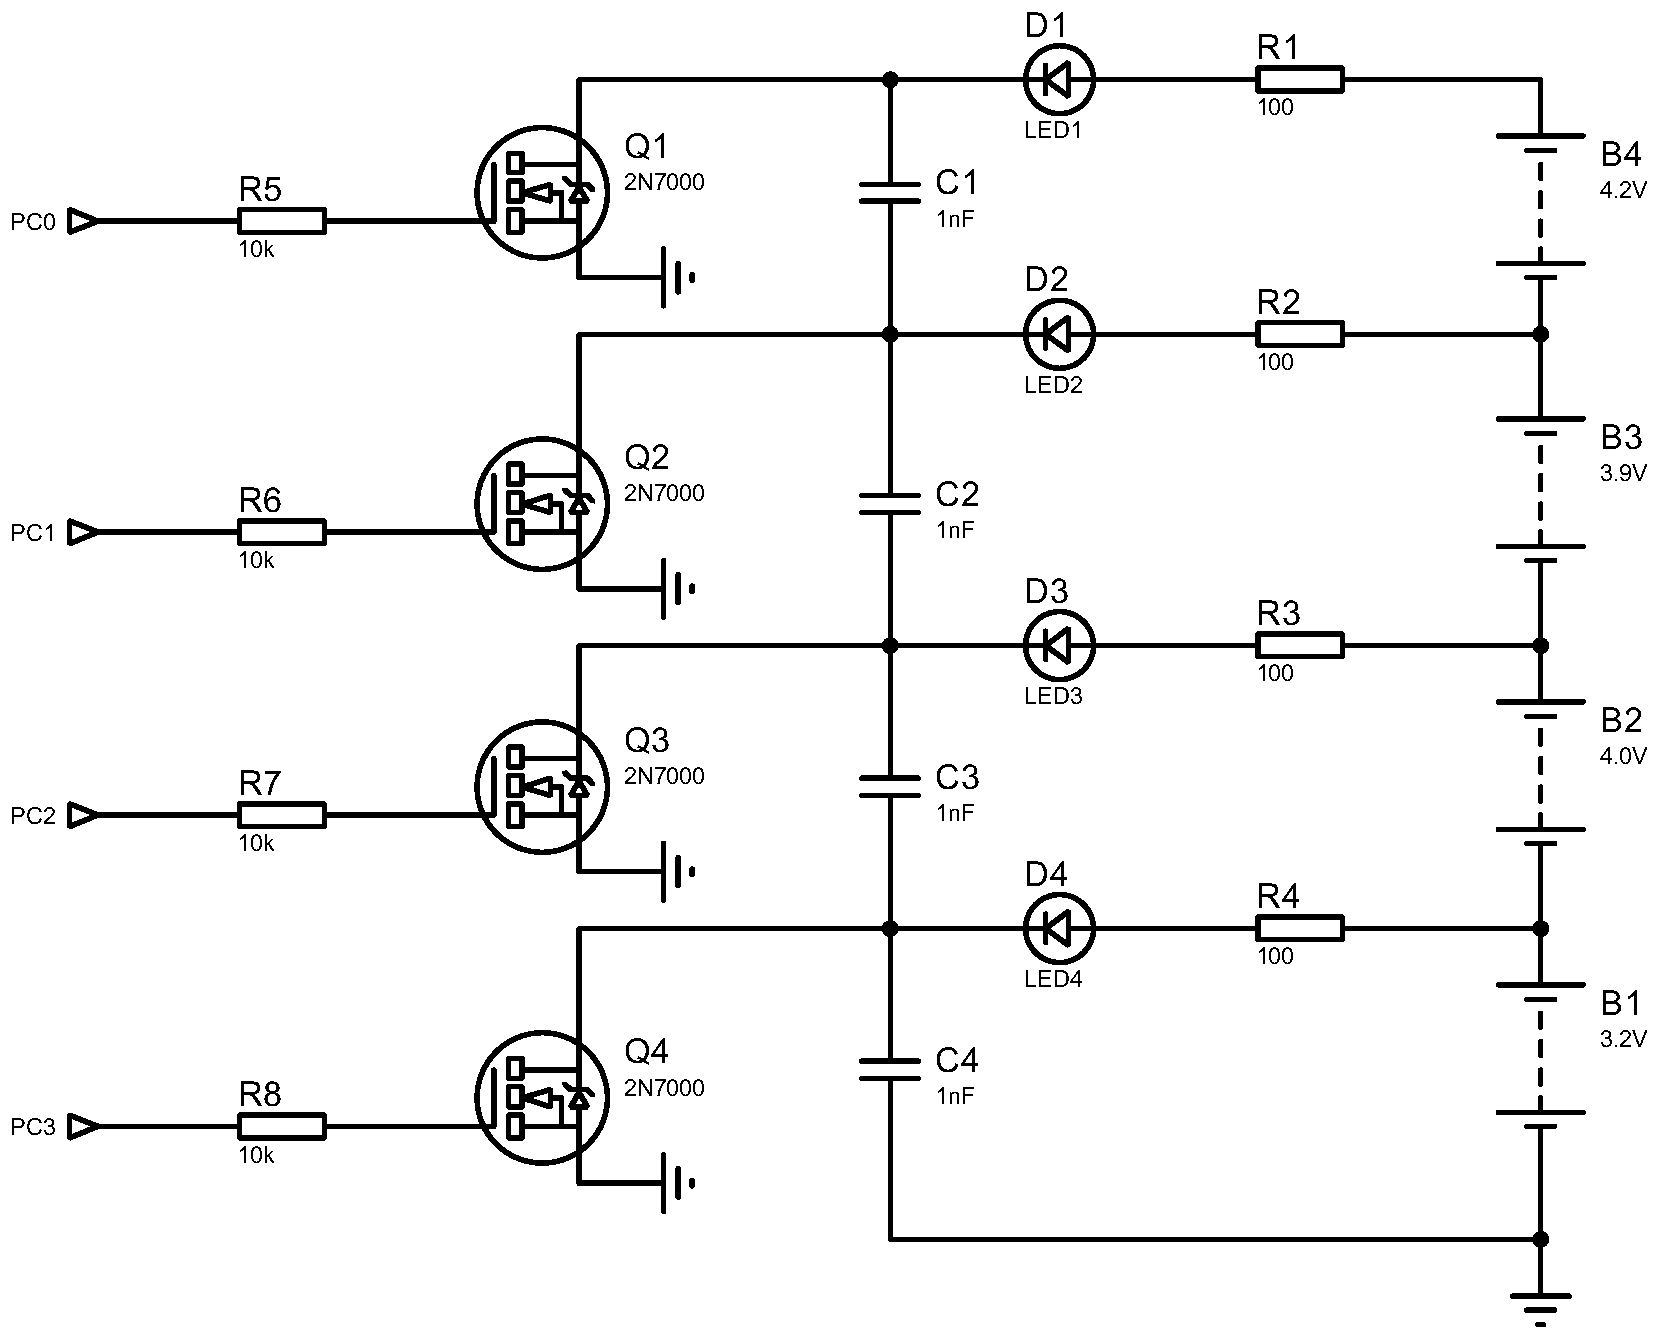
Given the above, cell balancing is fundamental for the safety and longevity of the battery. It refers to the process of bringing the SOC levels of the pack cells closer to each other to maximise the battery’s capacity. In this study, we adopt passive cell balancing, a widely used technique by commercial BMS, to even out charge distribution. The method offers the best compromise between system performance and cost.
Figure 14 shows the proposed cell-balancing circuit diagram. PC0–PC3 pins are used to activate the battery equalisation circuit. When the voltage difference between cells exceeds the permitted value, the STM32 triggers the corresponding 2N7000 NPN MOSFET (ON Semiconductor, Phoenix, AZ, USA) to discharge the cell with a higher voltage. The 100
resistance is the discharging resistance. Each cell is associated with an LED that lights on when balancing is activated.
5. Conclusions
This work presents an HMS to monitor a 4s2p NMC battery pack. The proposed HMS adopts a master–slave topology, enhancing the system’s reliability and scalability. The platform performs efficient cell balancing, ensures over-charge protection, and monitors key parameters, including individual cell voltage, current drawn from the battery pack, and temperature variations at six hot spots.
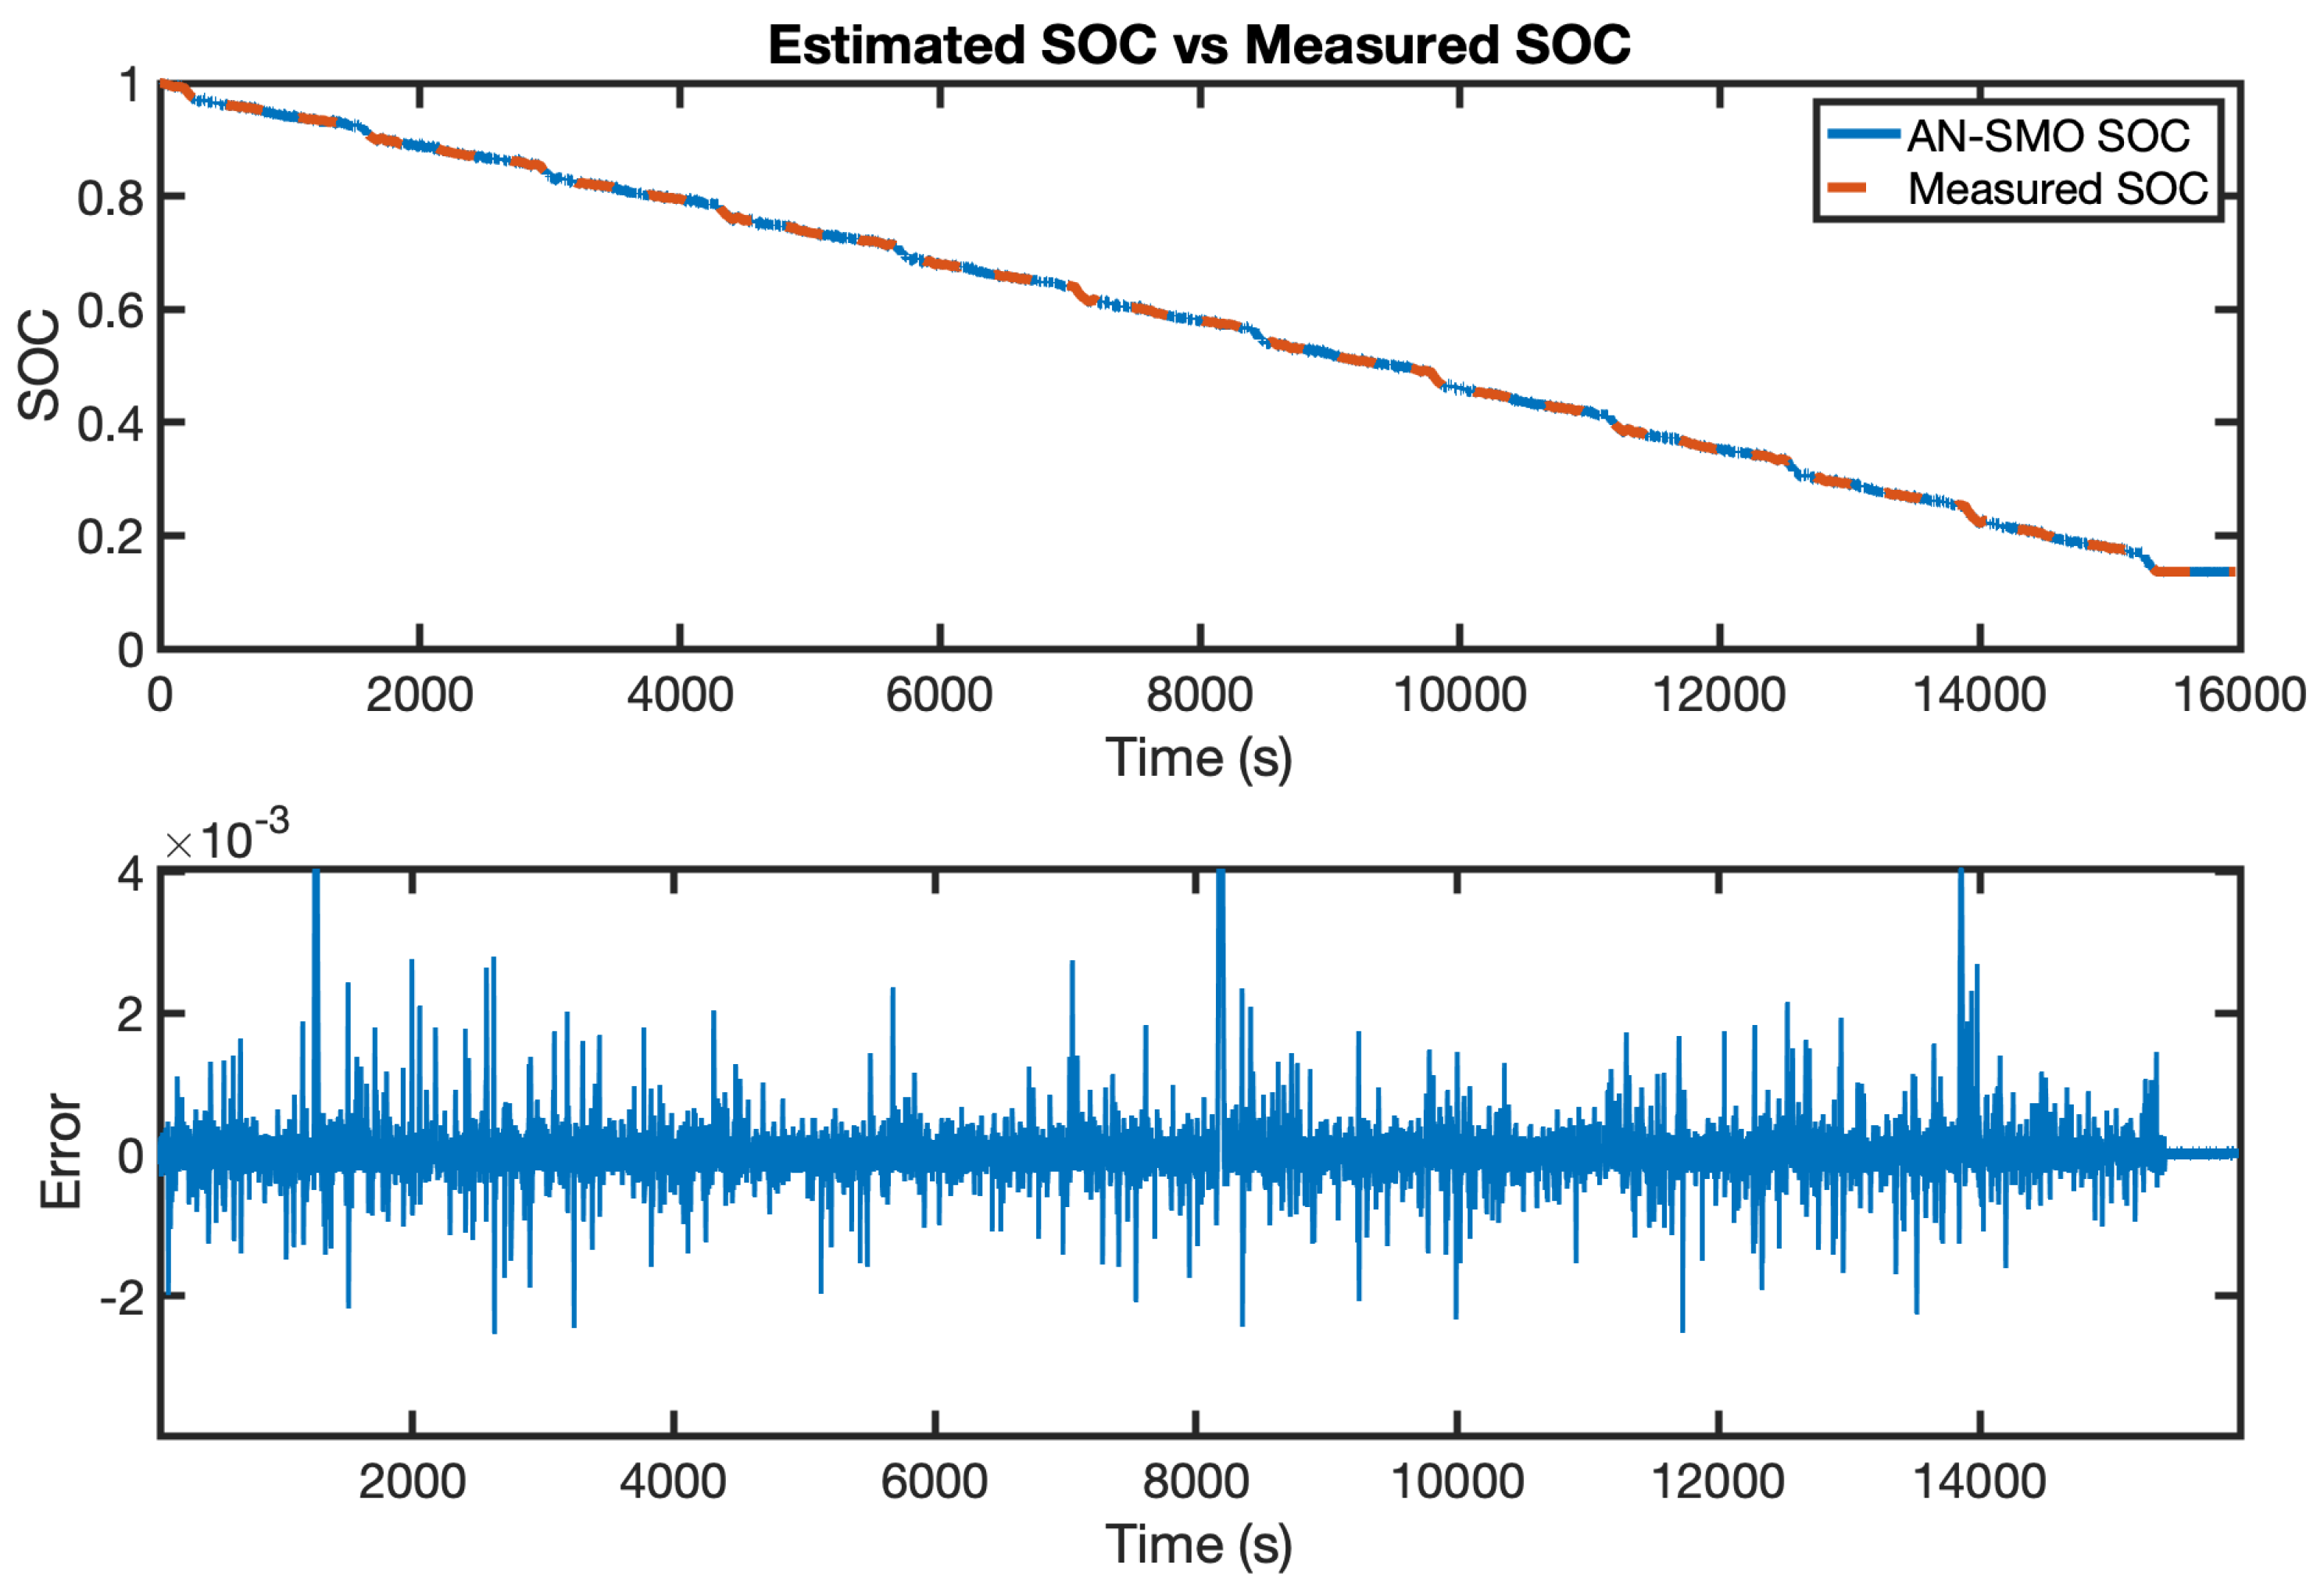
An enhanced online battery model has been developed. The time-varying model parameters are identified in real time using the FFRLS algorithm, which helps optimise the battery usage, extend its lifespan and improve the accuracy of model-based approaches. The nonlinear OCV–SOC relationship is captured using a seventh-order polynomial function. The model showed good performance under a wide range of conditions, where the estimation errors under the UDDS test are bounded within −0.06 V, 0.06 V at −10 °C, −0.04 V, 0.03 V at 10 °C, −0.025 V, 0.026 V at 25 °C and −0.02, 0.02 V at 40 °C. The proposed model furthermore proved its accuracy when compared to an offline model. Following this, the AN-SMO was applied to estimate the battery SOC based on the proposed battery model. The algorithm was tested, and its accuracy was validated where the absolute maximum estimation error did not exceed 0.01082.
The LSTM approach effectively tracks battery capacity fade, demonstrating highly accurate predictions with capacity estimates closely aligning with actual measurements. Quantitatively, the proposed approach reduced the capacity prediction error by 15% compared to conventional methods, demonstrating its effectiveness in real-world applications. These findings show that the proposed HMS and battery model not only improve battery management precision but also contribute to extending battery lifespan and reducing degradation, offering a more robust solution for electric vehicle and energy storage systems.


