Article

Characteristics of Supercritical CO2 Non-Mixed Phase Replacement in Intraformational Inhomogeneous Low-Permeability Reservoirs

Unconventional Petroleum Research Institute, China University of Petroleum, Beijing 102249, China
*
Author to whom correspondence should be addressed.
Energies 2024, 17(22), 5608; https://doi.org/10.3390/en17225608
Submission received: 29 September 2024 / Revised: 20 October 2024 / Accepted: 4 November 2024 / Published: 9 November 2024
(This article belongs to the Section H: Geo-Energy)

Abstract

:
Under the influence of the sedimentation process, the phenomenon of intraformational non-homogeneity is widely observed in low-permeability reservoirs. In the development process of water and gas replacement (WAG), the transport law of water and gas and the distribution of residual oil are seriously affected by the non-homogeneity of reservoir properties. In this paper, a study on two types of reservoirs with certain lengths and thicknesses is carried out, and a reasonable development method is proposed according to the characteristics of each reservoir. Firstly, through indoor physical simulation experiments combined with low-field nuclear magnetic resonance scanning (NMR), this study investigates the influence of injection rate and core length on the double-layer low-permeability inhomogeneous core replacement and pore throat mobilization characteristics. Then, a two-layer inhomogeneous low-permeability microscopic model is designed to investigate the model’s replacement and pore throat mobilization characteristics under the combined influence of rhythmites, gravity, the injection rate, etc. Finally, based on the results of the core replacement and numerical simulation, a more reasonable development method is proposed for each type of reservoir. The results show that for inhomogeneous cores of a certain length, the WAG process can significantly increase the injection pressure and effectively seal the high-permeability layer through the Jamin effect to improve the degree of recovery. Moreover, for positive and reverse rhythm reservoirs of a certain thickness, the injection rate can be reduced according to the physical properties of the reservoir, and the gravity overburden phenomenon of the gas is used to achieve the effective development of the upper layers. The effect of the development of a positive rhythm reservoir therefore improved significantly. These findings provide data support for improving the development effectiveness of CO2 in low-permeability inhomogeneous reservoirs and emphasize the importance of the influence of multiple factors, such as injection flow rate, gravity, and rhythm, in CO2 replacement.

1. Introduction

With the exploitation of conventional reservoirs gradually entering the bottleneck period, many old oil fields have gradually entered a stage involving a high water content and low degree of recovery [1,2,3]. Unconventional reservoirs have gradually become the focus of petroleum exploration and development at the present stage, in which the efficient exploitation of low-permeability reservoirs—those with permeability of less than 50 mD—is the current focus of research efforts [4,5,6,7,8,9,10]. Supercritical CO2 has low viscosity, strong diffusivity, and a strong extraction effect, and it easily enters into smaller pores, which helps to improve the sweep volume and microscopic oil replacement efficiency. Thus, supercritical CO2 replacement is suitable for the development of low-permeability reservoirs [11,12,13,14,15]. The injection of CO2 to improve the degree of recovery is the current focus domestically and internationally to improve crude oil recovery (in contrast, nitrogen replacement is unable to extract and pump oil, the small molecular weight of methane leads to high mixing pressures with crude oil; moreover, steam replacement at the same temperature is much less recoverable than supercritical CO2 replacement, resulting in excessive energy losses) [16,17,18,19,20].
Intraformational inhomogeneity refers to the vertical inhomogeneity within a single sand body of a reservoir, which directly affects the seepage characteristics of fluids in the reservoir. It is usually determined by a combination of sedimentation and tectonism, leading to significant differences in grain size, permeability, and other indicators in different regions [20,21,22,23]. The size and sorting of particles during deposition further increase the complexity of reservoirs, and low-permeability intervals (e.g., muddy interbedded layers) in reservoirs can also restrict the longitudinal flow of fluids. In contrast, variations in particle size further affect the seepage characteristics of fluids. Therefore, it is necessary to study the CO2 replacement characteristics of inhomogeneous low-permeability reservoirs [24,25].
For inhomogeneous reservoirs of a certain length, WAG is a method commonly used to enhance the degree of oil recovery. After gas flushing occurs in the high-permeability layer, shortening the injection–extraction cycle and combining it with multiple rounds of alternating water–CO2 injection is beneficial in enhancing the degree of recovery [26,27,28]. Water replacement alone is ineffective in low-permeability reservoirs with high non-homogeneity. CO2 replacement helps to improve recovery, but it is highly susceptible to gas flushing at a later stage. The WAG process can delay gas flushing and improve the CO2 replacement effect, and its recovery degree is higher than that of continuous CO2 injection [29,30,31]. The WAG method effectively maintains reservoir pressure, facilitates the diffusion of CO2 into the matrix, and effectively controls gas flushing in low-permeability reservoirs above 10 mD [32,33]. Haihai Dong et al. recommended the early implementation of WAG, with a water to CO2 ratio of 1:1 when the effect is better, and through micro-CT and long core replacement experiments (15 cm), they found that the degree of recovery is only 47.95% in larger pore throats in the CO2 flushing channels. The WAG method can be used to enhance the secondary pore space and small- to medium-sized pore space of the residual oil; as a result, the degree of recovery is significantly improved [34,35,36,37].
For inhomogeneous reservoirs of a certain thickness, the degree of recovery gradually decreases with the continuous water replacement process, and a large amount of residual oil is mainly concentrated at the top of the reservoir, forming a layer of residual oil. The gas-assisted gravity drive (GAGD) method has been used to improve the development of secondary and tertiary oil recovery stages [38]. In developing heavy oil reservoirs using SAGD technology, CO2 is usually used to reduce both the viscosity of the heavy oil and steam heat loss to improve the degree of oil recovery [39]. Lanxiang Shi et al. have experimentally shown that the development effect of carbonated 120 °C hot water is comparable to that of 200 °C steam replacement. The CO2-assisted hot water replacement method requires less energy than the steam replacement method [40]. Compared with the free-fall gravity drainage (FFGD) method, CO2-AGD, an injection process with superior performance, not only improves the degree of recovery but also effectively delays the timing of gas flushing and has a better development effect in bottom water replacement reservoirs [41].
In the CO2-AGD process, horizontal wells can mobilize the oil layer above the water surface, and a stably advancing oil–gas interface is the key to improving the development effect of CO2-assisted gravity replacement [42]. Xiaolong Chen et al. demonstrated through high-pressure flat plate visualization experiments that in the non-mixed-phase, gravity limits the stability of the oil–gas leading edge, and the sweep areas of the different gas injection modes are significantly different. In the mixed phase, gravity has almost no effect; in non-mixed phase replacement, the injection rate dramatically limits the degree of CO2-AGD recovery, and under mixed-phase conditions, the injection rate is no longer the primary influence [43]. Gas breakthrough timing and sweep volume are primarily influenced by permeability inhomogeneity, injected gas viscosity, mixed-phase conditions, and reservoir dip [44]. Al-Mudhafar et al. discovered that permeability anisotropy significantly affects the effectiveness of CO2-AGD development in homogeneous and inhomogeneous reservoirs; they did so through numerical simulation of stochastic images of several reservoirs [45]. Mohammad Yunus Khan et al. calculated that the gravity divergence length (the distance that water and gas travel together before they fully diverge) increases with increasing reservoir dip and aqueous-phase flow capacity and decreases with decreasing gravity number, vertical permeability, and horizontal permeability anisotropy through analytical modeling [46]. Furthermore, changes in the core resulting from fracking or drilling activities can also significantly impact CO2 displacement [47,48].
This article studies two types of intra-layer inhomogeneous reservoirs with a certain length and thickness. The effects of core length and injection velocity on the displacement and pore throat mobilization characteristics of reservoirs with a certain length were investigated through physical simulation experiments of double-layer inhomogeneous cores. The COMSOL (2019) numerical simulation of a double-layer inhomogeneous micro pore throat model investigates the influence of gravity, injection velocity, and rhythm on oil displacement characteristics and the pore throat utilization degree of reservoirs with a certain thickness. Based on experimental and simulation results, reasonable development methods for various reservoirs are proposed. The research in this article can provide an experimental basis and data support for the supercritical CO2 oil recovery and pore throat utilization laws of low-permeability inhomogeneous reservoirs.

2. Materials and Methods

2.1. Supercritical CO2 Displacement Experiment Materials

Under the condition of 150 °C/40 MPa, the experimental equipment’s size limitation makes it impossible to carry out larger-scale physical simulation experiments. However, it is still possible to change a specific condition in the experiment (e.g., injection rate, core length) and examine the effect of each condition on the experimental results (e.g., injection pressure, oil recovery), which has great utility.

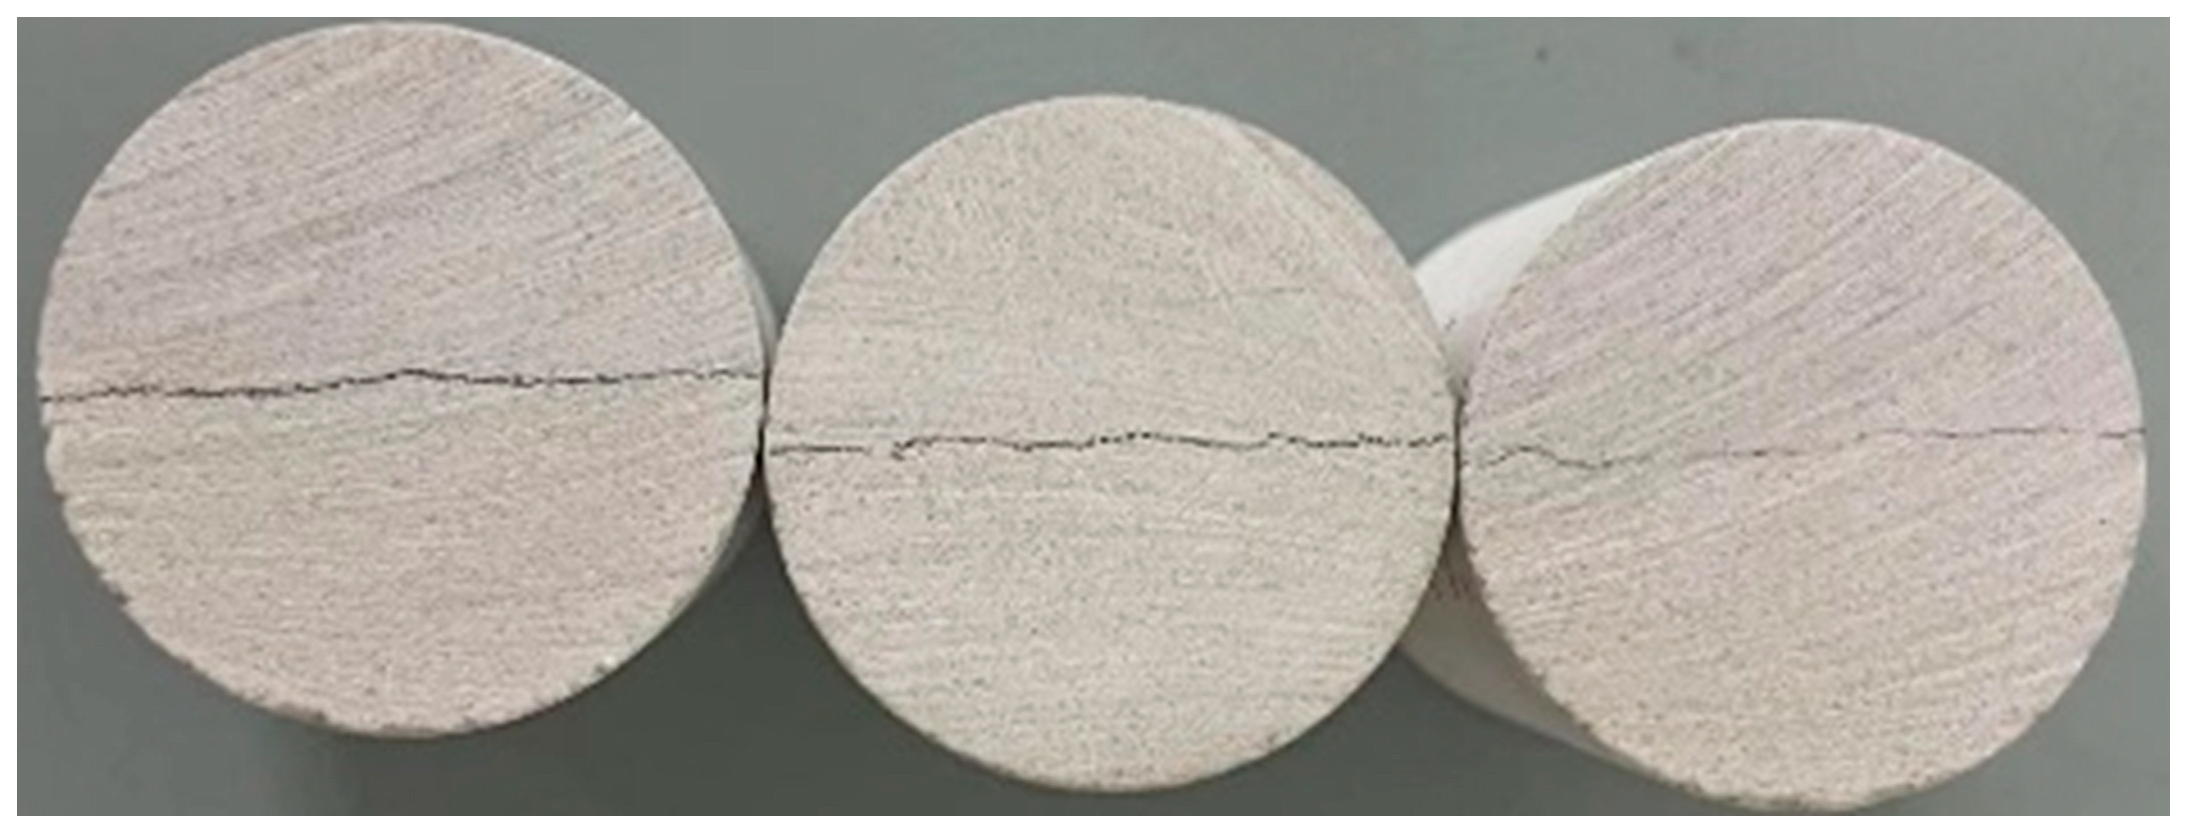
2.1.1. Cores Used in Experiments

To investigate the displacement characteristics of supercritical CO2 in inhomogeneous reservoirs, indoor physical simulation experiments were conducted using a double-layer inhomogeneous core (due to limitations in the core gripper size, the core’s maximum diameter is 3.8 cm; if the core exceeds two layers, the thickness of each layer becomes too small, which increases the difficulty of core production and complicates experimental phenomena, making it less conducive to later analysis). The total permeability of the core was 42.5 mD, with the permeability of each layer being 10 mD and 100 mD, respectively. All core samples used in the experiments were sourced from the same core plate to ensure comparability among the experimental groups. After drilling, cutting, and polishing the core plate, cylindrical core samples with a diameter of 3.8 cm and lengths of 5 cm, 10 cm, and 20 cm were obtained for the experimentation. The cross-section of the rock core is shown in Figure 1 (the sides and two ends of the rock must be polished to prevent gaps between gripper components and rock cores to ensure all the water and gas flow into the porous medium).

2.1.2. Experimental Oil, Water and Gas

The gas used was high-purity CO2 with a purity of 99.9%. Simulated formation water with a mineralization degree of 8912.08 mg/L was injected during the experiment to simulate actual reservoir conditions. The specific formula is detailed in Table 1. In this experiment, we utilized simulated oil with a viscosity of 2.135 mPa·s at 25 °C/0.1 MPa.

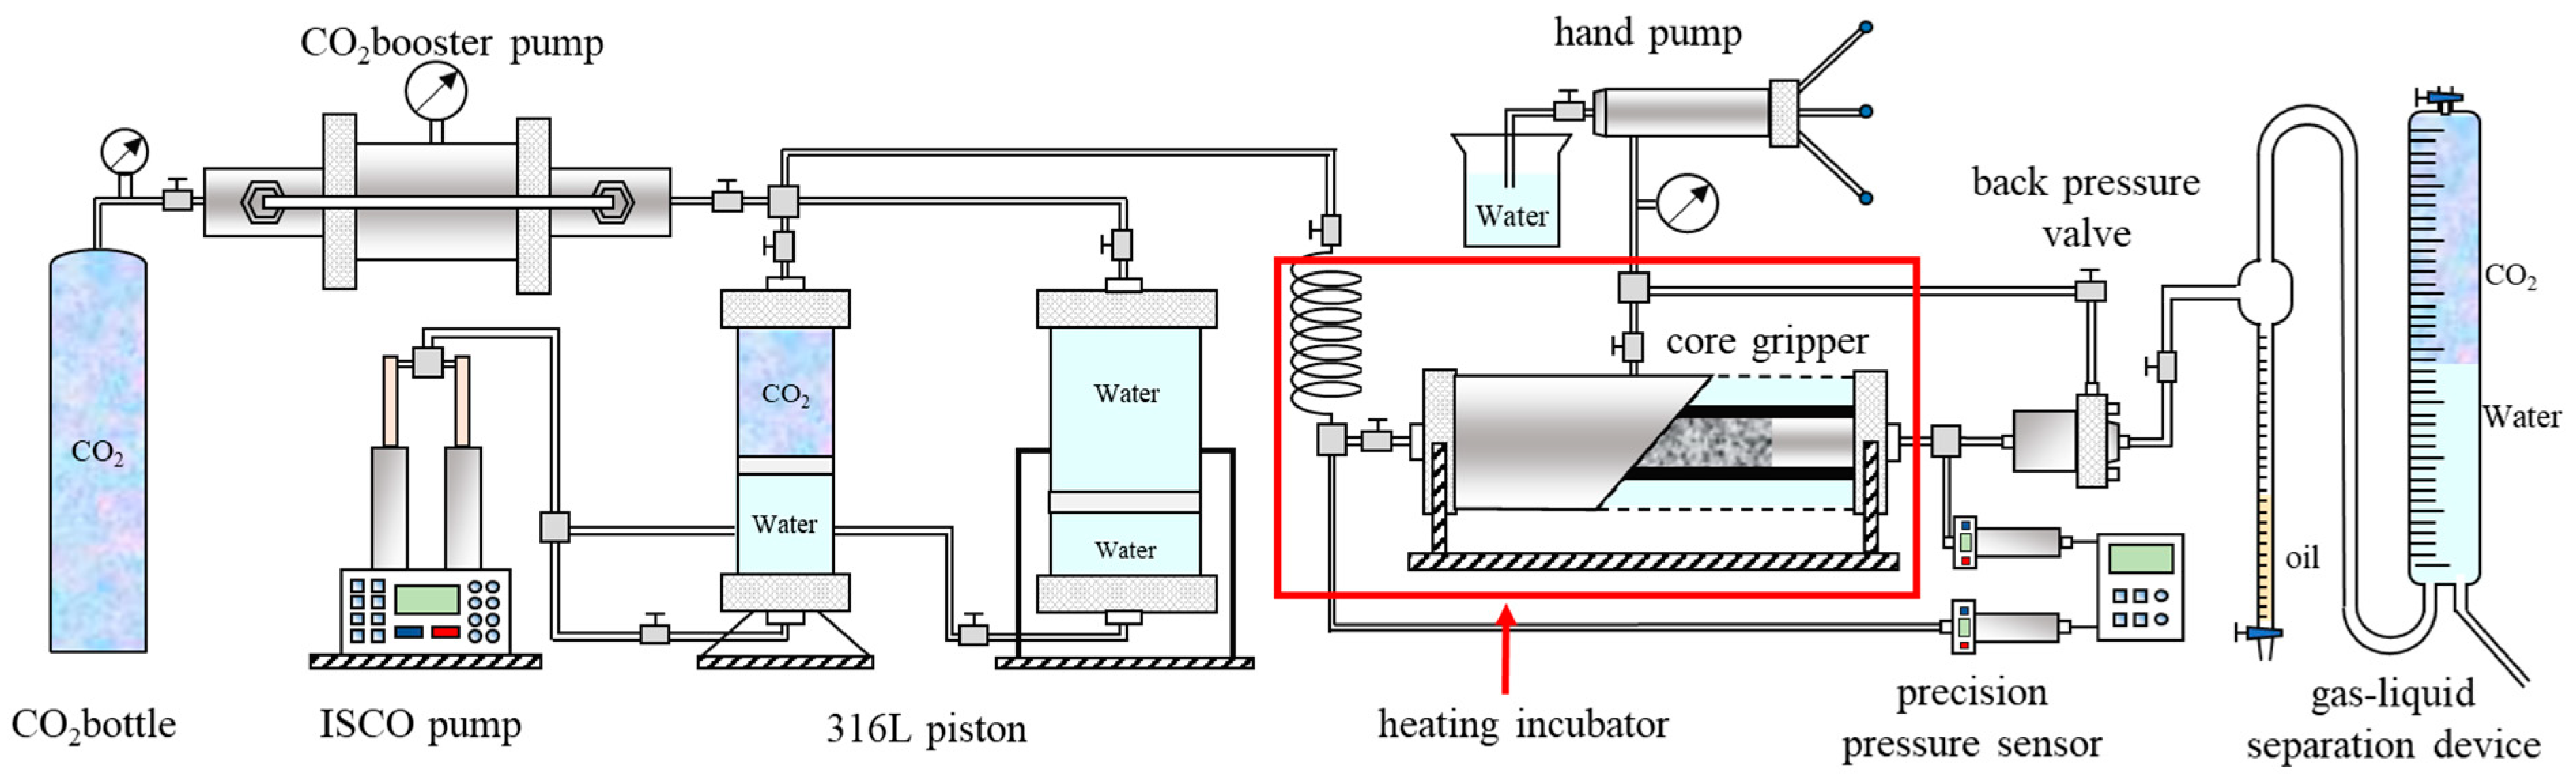
2.1.3. Experimental Equipment and Flowcharts

The experiment was conducted using high-temperature/high-pressure core displacement equipment, which is capable of withstanding temperatures ranging from 10 ℃ to 150 ℃ and pressures ranging from 0 to 50 MPa. The experimental setup comprised three groups: a normal-temperature/high-pressure group, a high-temperature/high-pressure group, and a normal-temperature/normal-pressure group. The experimental flowchart is illustrated in Figure 2.
The normal-temperature/high-pressure group comprised an ISCO precision flow pump (flow control range: 0.001 mL/min to 10 mL/min), a CO2 cylinder (5 MPa at 23 °C), two 316L pistons (maximum pressure: 50 MPa, resistant to CO2 corrosion, 500 mL capacity), a CO2 booster pump (maximum pressure: 70 MPa), two precision pressure sensors (range: 0 to 50 MPa, accuracy: 0.01 MPa), a back pressure valve (maximum pressure: 32 MPa), and an air compressor (maximum pressure: 0.6 MPa). The high-temperature/high-pressure group consisted of a core gripper (maximum pressure: 50 MPa, maximum temperature: 160 °C), a constant temperature chamber (maximum temperature: 200 °C), a fine adjustment valve, and a confining pressure control system (ensuring that the confining pressure remained higher than the injection pressure during displacement). The high-temperature/high-pressure group served as the central displacement body. The normal-temperature/normal-pressure group included a gas–liquid separation device, a liquid measurement device, and a drainage gas measurement device.
Among them, the core gripper was crafted from 316L steel, which is resistant to CO2 corrosion. The sealing ring was crafted from a high-strength fluorine-containing ring capable of withstanding high temperatures of 150 °C (the sealing ring had to be replaced at the end of experiments above 120 °C and could be used three times in experiments between 90–120 °C; it did not need to be replaced in experiments below 90 °C), ensuring the smooth progress of the high-temperature/high-pressure CO2 displacement experiments. (All equipment used in this study comes from Yongruida Company, Beijing, China.)

2.2. Experimental Program and Experimental Steps for Supercritical CO2 Displacement

2.2.1. Experimental Program

The experimental temperature was maintained at 150 ℃, controlled by the constant temperature chamber, and the minimum experimental pressure was 40 MPa, regulated by the back pressure valve (the minimum miscible pressure of simulated oil at 150 ℃ was 48.98 MPa, indicating a non-miscible displacement). WAG was initiated once it reached 95% water content during the water displacement. Each injection length was approximately 0.8 PV, and the experiment concluded after two rounds of WAG.
For the 5 cm long cores, two injection rates of 0.4 mL/min and 0.6 mL/min were employed. The oil was flushed out after the experiment to prepare for the next experiment (to ensure the same pore throat structure). For 10 cm and 20 cm cores, an injection rate with superior displacement efficiency was selected for other experiments.

2.2.2. Experimental Steps

The displacement cores were all low-permeability with relatively small volumes, resulting in a small pore volume. Therefore, strict control of oil evaporation was necessary during the experiment. The displacement pressure was high (>40 MPa), and it was crucial to manage the pressure difference strictly during the pressure relief process. An excessive pressure difference can lead to an excessively high gas flow rate, which may carry out the remaining oil in the core after displacement, resulting in experimental errors.
The experimental steps for inhomogeneous core immiscible supercritical CO2 displacement were as follows:
(1) After cutting the core to the specified size, we dried and weighed it. Subsequently, vacuum pumping and saturated oil treatment were performed. Due to the low permeability of the cores and their large diameter (3.8 cm), the vacuum pumping time needed to exceed 8 h, and the simulated saturated oil time needed to exceed 6 h. After saturation of the oil, we weighed the core and calculated the pore volume (saturated oil was directly applied after vacuum pumping to ensure that there was still a large amount of oil in the low-permeability layer).
(2) After the core was taken out, it was quickly loaded into the gripper, and a confining pressure of 2 MPa was applied. After closing the inlet and outlet, the core was heated to 150 ℃ using the constant temperature chamber (the core heating time took 4 h; without confining pressure, oil will escape into the annular space of the gripper, and if the inlet and outlet are not closed, oil vapor will escape out of the gripper—these operations can minimize oil loss during the heating process).
(3) After heating the core to 150 ℃, it was necessary to pressurize the water piston to 40 MPa then use a hand pump to increase the confining pressure of the gripper to 42 MPa while simultaneously increasing the pressure of the back pressure valve to 40 MPa. After that, the core inlet and outlet could be opened. Due to the low permeability of the core, it took about 120 s for the core tail to reach 40 MPa, and then water displacement began.
(4) After the water content during the water displacement reached 95%, we suspended the experiment, closed the inlet and outlet of the holder, recorded the internal pressure of the core, and then pressurized the CO2 piston. The pressure of the gas source was fixed at 5 MPa, and the booster pump could compress 5 MPa CO2 into the piston. When the CO2 piston pressure reached 40 MPa, the boosting could be ended.
(5) After boosting the CO2 piston to 40 MPa (ensuring that the piston pressure was 0.2 MPa higher than the core internal pressure as much as possible), we opened the core inlet and outlet (at this time, the piston pressure was slightly higher than the core internal pressure, and we anticipated a slight pressure disturbance after opening the lets for about 30 s before stabilizing). After the pressure and gas flow rate became stable, the flow rate was set, and the CO2 displacement (WAG) was started. We then recorded the experimental data. After injecting 0.8 PV, we suspended the experiment, closed the holder inlet and outlet, and recorded the core internal pressure.
(6) The process was the same as (3); after the water piston was pressurized to 40 MPa, we opened the inlet and outlet of the gripper, set the flow rate after the pressure stabilizes, and started water displacement, converting 0.8 PV to CO2 displacement.
(7) We recorded the oil production, CO2 production, and pressure at all times during the displacement process. After two rounds of WAG (3.2 PV), we closed the core lets, stopped heating, and prepared for pressure relief;
(8) The pressure relief port was placed at the inlet end of the core, and the fine adjustment valve controlled the size of the pressure relief port during the process. The pressure drop rate was strictly controlled, which controlled the gas discharge rate from the core. After measurement, it was found that a gas discharge rate of 150–200 mL/min was controllable, and the remaining oil in the core would not be carried out, meaning the remaining oil could be better preserved after displacement in the core.
(9) After 1 h of pressure relief, the temperature dropped, and the confining pressure decreased. It was necessary to re-apply the confining pressure to ensure that gas was only discharged from the pressure relief port until the pressure at the outlet end dropped to 0 MPa, which took approximately 2 h.
(10) Since a core with a length of 5 cm needs to be scanned by NMR, the fine pressure relief steps in (8) and (9) had to be used. Direct gas release was sufficient for cores with a length of 10 cm and 20 cm.

2.3. Numerical Simulation of Comsol for Supercritical CO2 Displacement

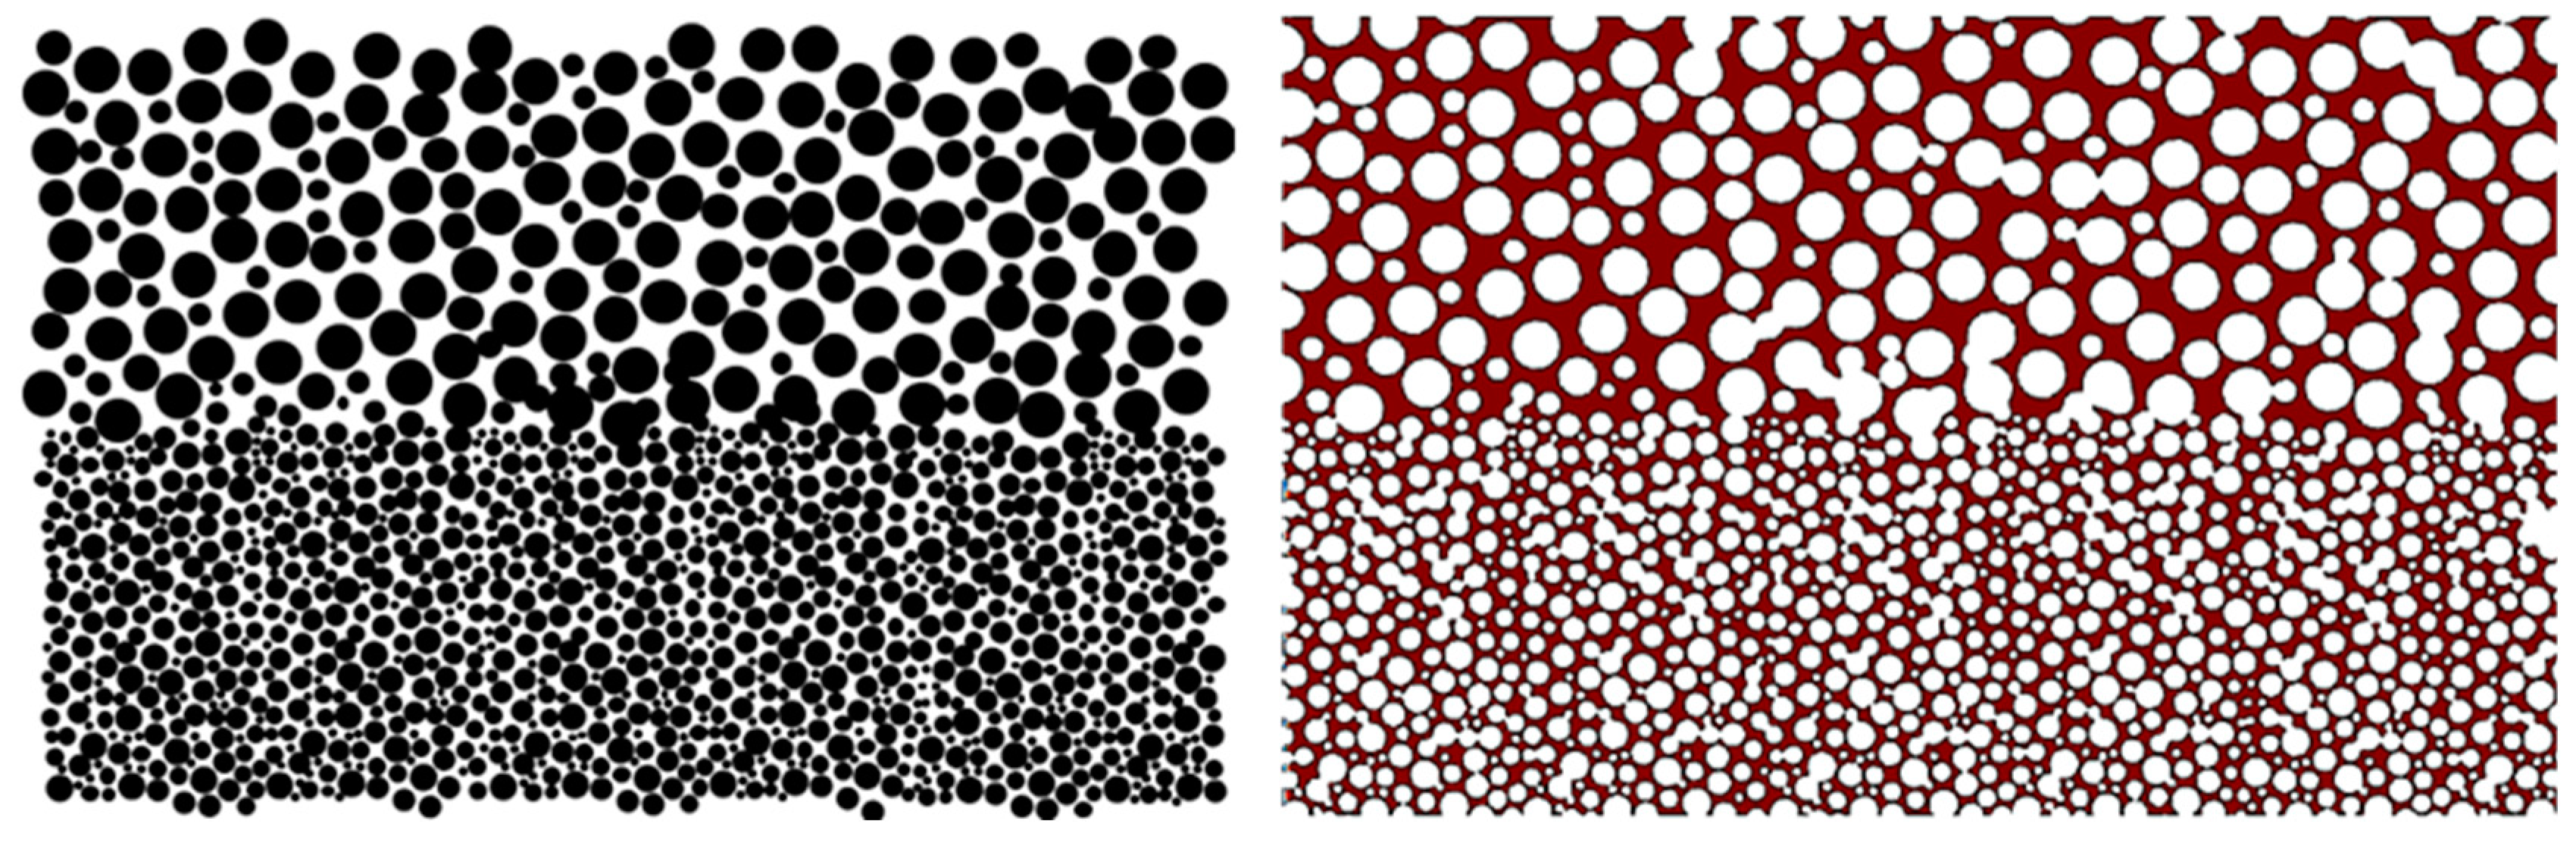
2.3.1. Introduction to the Bilayer Low-Permeability Inhomogeneous Model

The characteristics of low-permeability inhomogeneous reservoirs lie in vertical variations in rock particle size, permeability, compaction degree, and other factors. During the model calculation process, if the rock particles in the small-scale model have more edges and corners, this directly increases the complexity of the computational grid. With the involvement of the laminar flow and gravity fields, the model is prone to non-convergence. Therefore, to highlight the vertical variation characteristics of the reservoirs and simplify the simulation difficulty, the rock particles are directly designed as spheres, and different diameter spheres are randomly stacked and filled to design a low-permeability inhomogeneous model with two layers of high and low permeability (too many layers will increase the difficulty of subsequent data analysis and make it impossible to determine the influencing factors). Although the small ball model improves the roundness of actual rock particles, it retains the complex sorting and disordered accumulation between rock particles, and the pore structure is still highly complex. Therefore, this model is still efficient. The influence of the displacement characteristics of different injection methods on the overall model and low-permeability layers was investigated by setting different injection and production ports and injection rates. Figure 3 shows the original inhomogeneous model image and the cropped result.

2.3.2. Model Parameter Design

In the software, we set the model size to 100 × 60 μm and set the contact angle to 90°, indicating neutral wetting. We then set the displacement temperature to 150 ℃ and the pressure to 40 MPa. We set the viscosity and density of the oil to 2.135 mPa·s and 885 g/mL, respectively, and those of CO2 to 0.05 mPa·s and 525 g/mL, respectively. We adopted a laminar flow physical field with a surface tension of 0.01 N/m, considering gravity with a direction from top to bottom.
By adjusting various injection and production methods and different injection rates, we compared displacement effects and sought the optimal development approach for both positive and reverse rhythmic reservoirs. Figure 4 depicts the different injection methods and speeds. The half-edge injection-production mode’s injection speeds were set to 1 μm/s and 10 μm/s, respectively. Due to the doubled injection range, the injection was is halved to 0.5 μm/s and 5 μm/s for the full-edge injection-production mode to ensure consistent injection volume over the same period.
CO2 tends to diffuse upwards due to gravity. Therefore, the injection end of the reverse rhythm formation was exclusively located on the low-permeability layer (positioning it on the upper high-permeability layer would diminish the utilization degree of the low-permeability layer). We investigated the development effects under various injection methods, including injection rates of 1 μm/s and 10 μm/s, low-injection/high recovery, and a low-injection/low-recovery model.
CO2 diffused more quickly in the upper high-permeability layer under gravity for the positive rhythm model. The production end was set in the lower high-permeability layer to enhance the utilization degree of the low-permeability layer. There was no need to select an injection horizon for the same-injection/same-recovery model, except for halving the injection rate.

3. Results and Discussion

3.1. Water and Gas Alternation (WAG) Displacement and Pore Throat Utilization Characteristics in Low-Permeability Inhomogeneous Cores

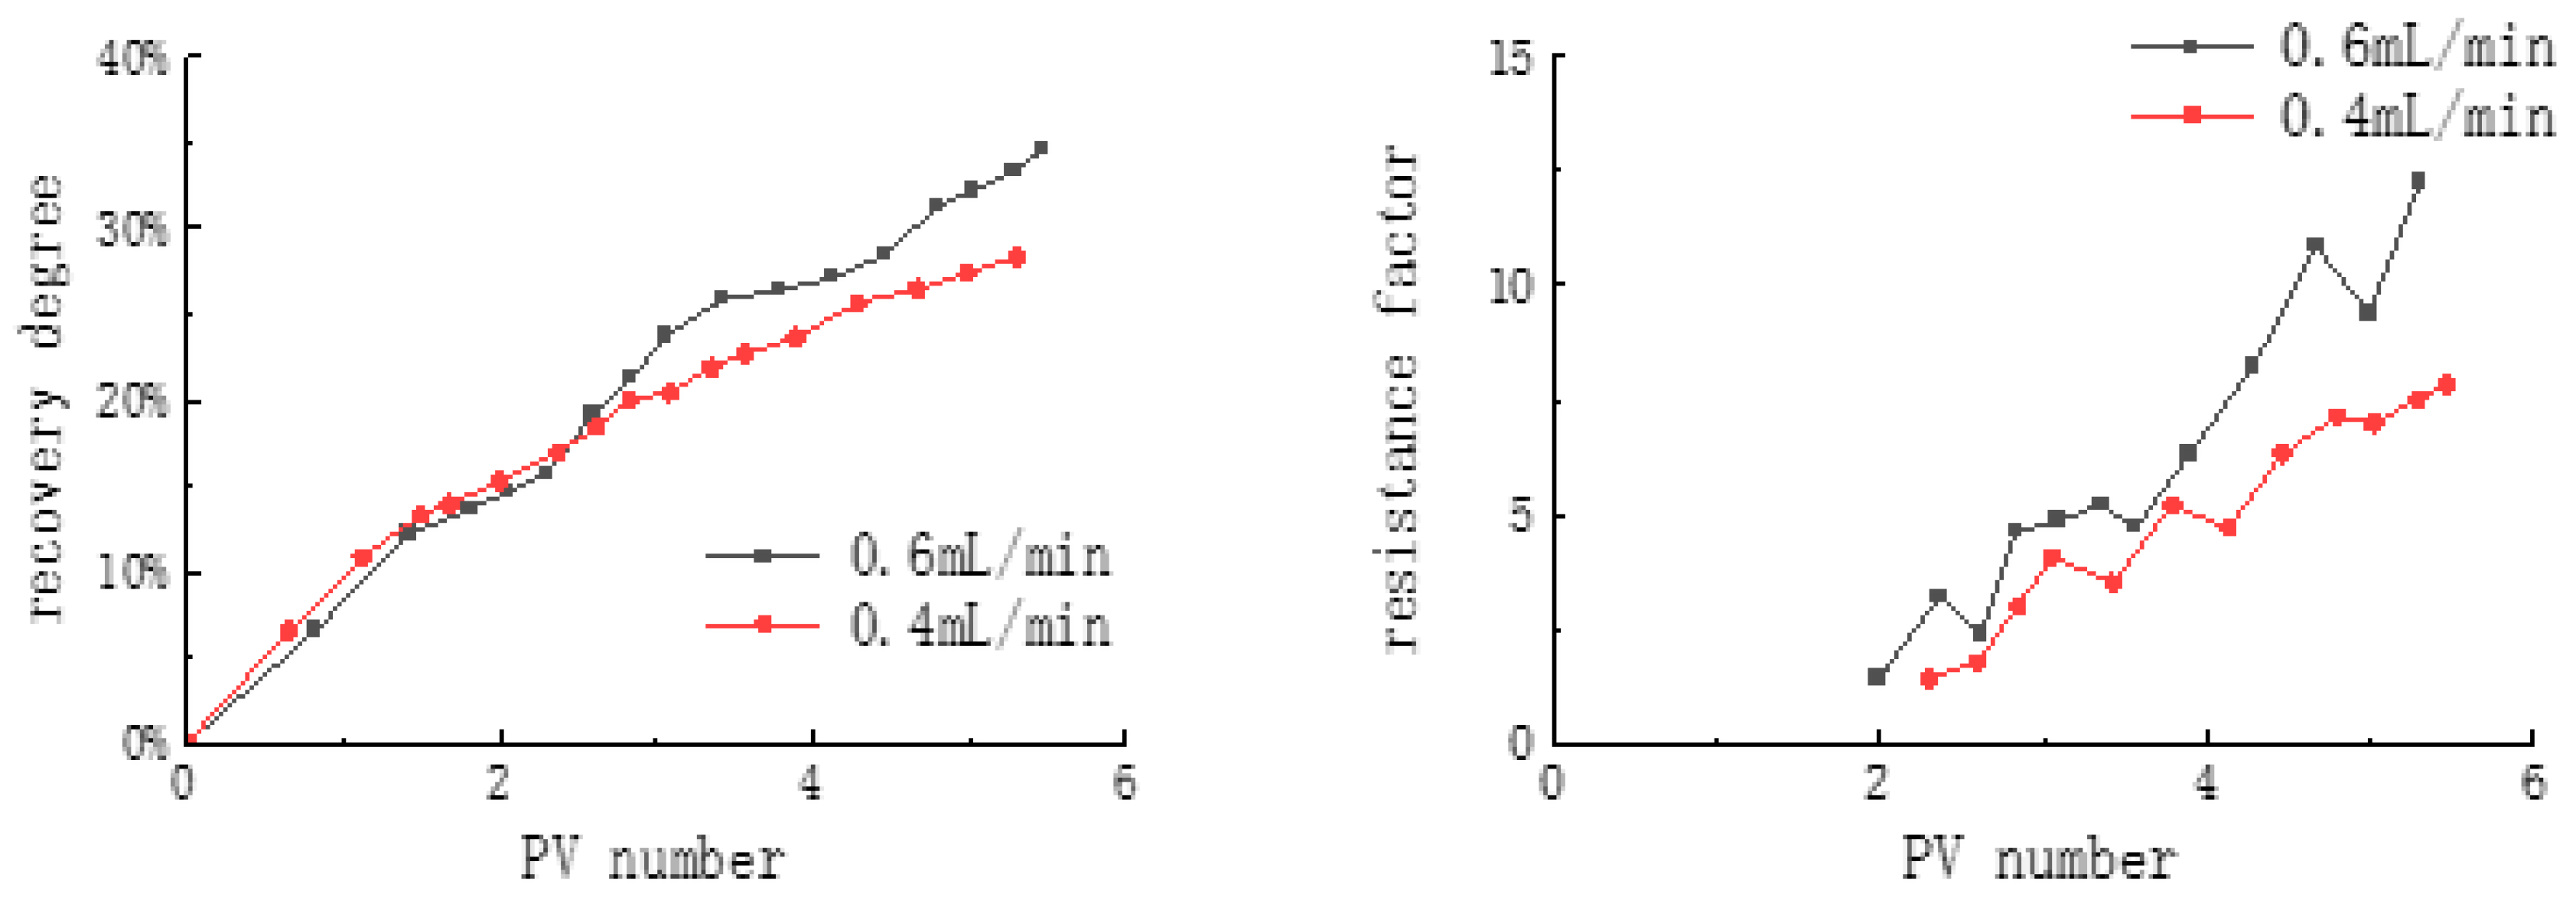
3.1.1. Influence of Different Velocities on WAG Displacement Characteristics in Inhomogeneous Cores

Figure 5 compares the recovery degree and resistance factor at two different injection flow rates. At an injection rate of 0.6 mL/min, the recovery degree after displacement is 34.54%, the recovery degree with WAG increases to 19.86%, and the resistance factor can reach 12.24. At an injection rate of 0.4 mL/min, the recovery degree after displacement is 28.33%, the recovery degree with WAG rises to 13.06%, and the resistance factor can reach 7.84. (the resistance factor is calculated by using the stable pressure difference in the later stage of water displacement as the denominator and the instantaneous injection pressure during WAG as the numerator.)
From the two comparative graphs, it is evident that there are no significant differences between the two flow rates during the water displacement stage (the water displacement recovery rate is 14.68% at 0.6 mL/min, with a stable pressure difference of approximately 0.049 MPa in the later stage; the water drive recovery rate is 15.27% at 0.4 mL/min, with a stable pressure difference of approximately 0.045 MPa in the later stage). However, a notable difference arises between the two flow rates during WAG. The 0.6 mL/min group exhibits higher increases in recovery degree and resistance factors than the 0.4 mL/min group, and this disparity persists until the end of the displacement process.
During WAG, blocking relies on the Jamin effect at the water–gas interface within porous media. The additional resistance from the curved liquid surface boosts the injection pressure and decelerates the flow rate. Consequently, this enhances the swept volume of the displacement phase in low-permeability layers, thereby improving the recovery degree. As the flow rate increases, the gas and water injection volume per unit of time also rises, leading to a more pronounced Jamin effect. These effectively elevate the resistance factor, further boosting the recovery degree. Therefore, in practical displacement processes, it is advisable to appropriately increase the injection rate based on the reservoir’s physical properties, which is conducive to enhancing the recovery degree.

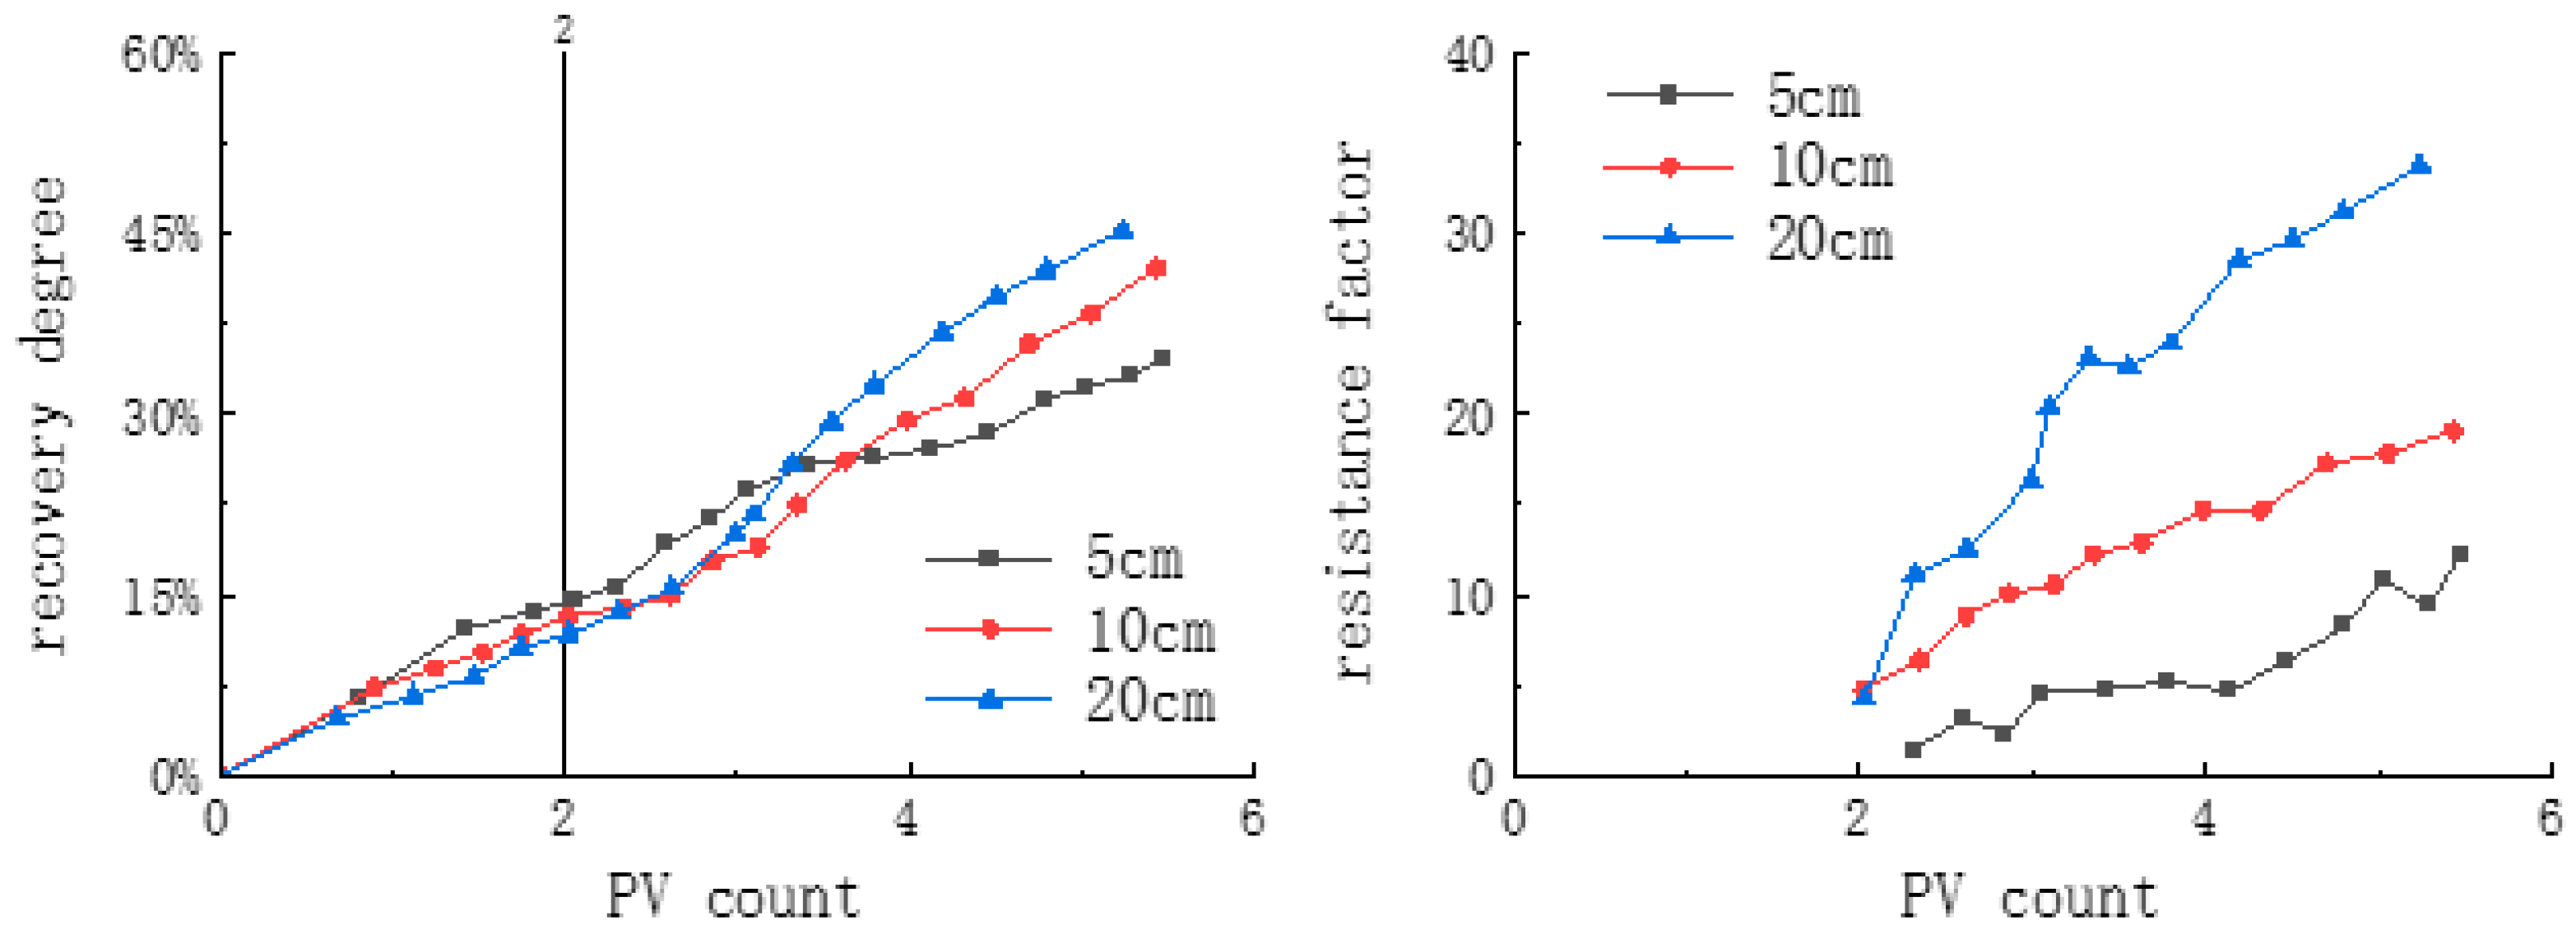
3.1.2. Influence of Core Length on the Effect of WAG

Based on the above results, a 0.6 mL/min injection flow rate was selected for WAG experiments across other core lengths (10–20 cm). Cores with a diameter of 3.8 cm and lengths of 10 cm and 20 cm were drilled from the original inhomogeneous core plate, and the WAG experiments were conducted at an injection rate of 0.6 mL/min. Figure 6 compares WAG’s recovery degree and resistance factor in inhomogeneous cores of different lengths. The length of the slug in the water displacement is approximately 2 PV, followed by two rounds of WAG, with each slug length ranging from 0.4–0.5 PV.
It can be found from Figure 6 that during water displacement, the longer the core, the lower the water displacement recovery degree (from short to long cores, the recovery degree is 14.69–13.19–11.78%). During WAG, despite a longer core delaying the increase in recovery degree, the increase in recovery degree is more significant (18.85–28.89–33.78%). At the same time, the longer the core length, the higher the core resistance factor. At the end of displacement, the resistance factors are 12.24–19.05–33.70.
As the length of the core increases due to its inhomogeneity, gas breakthrough along the high-permeability layer becomes more pronounced. This phenomenon results in a decrease in the recovery degree of the low-permeability layer, ultimately leading to a lower waterflooding recovery degree in longer cores. WAG primarily relies on the additional curved pressure formed by the Jamin effect to increase injection pressure while appropriately blocking the high-permeability layer. The longer the core length, the longer it takes for bubbles to migrate to the outlet end, which results in a later increase in recovery degree at the outlet end, causing an unavoidable delay. However, simultaneously, the pressure at the inlet end will immediately rise. The longer the core, the more bubbles accumulate, leading to a more significant pressure difference and a higher resistance factor.

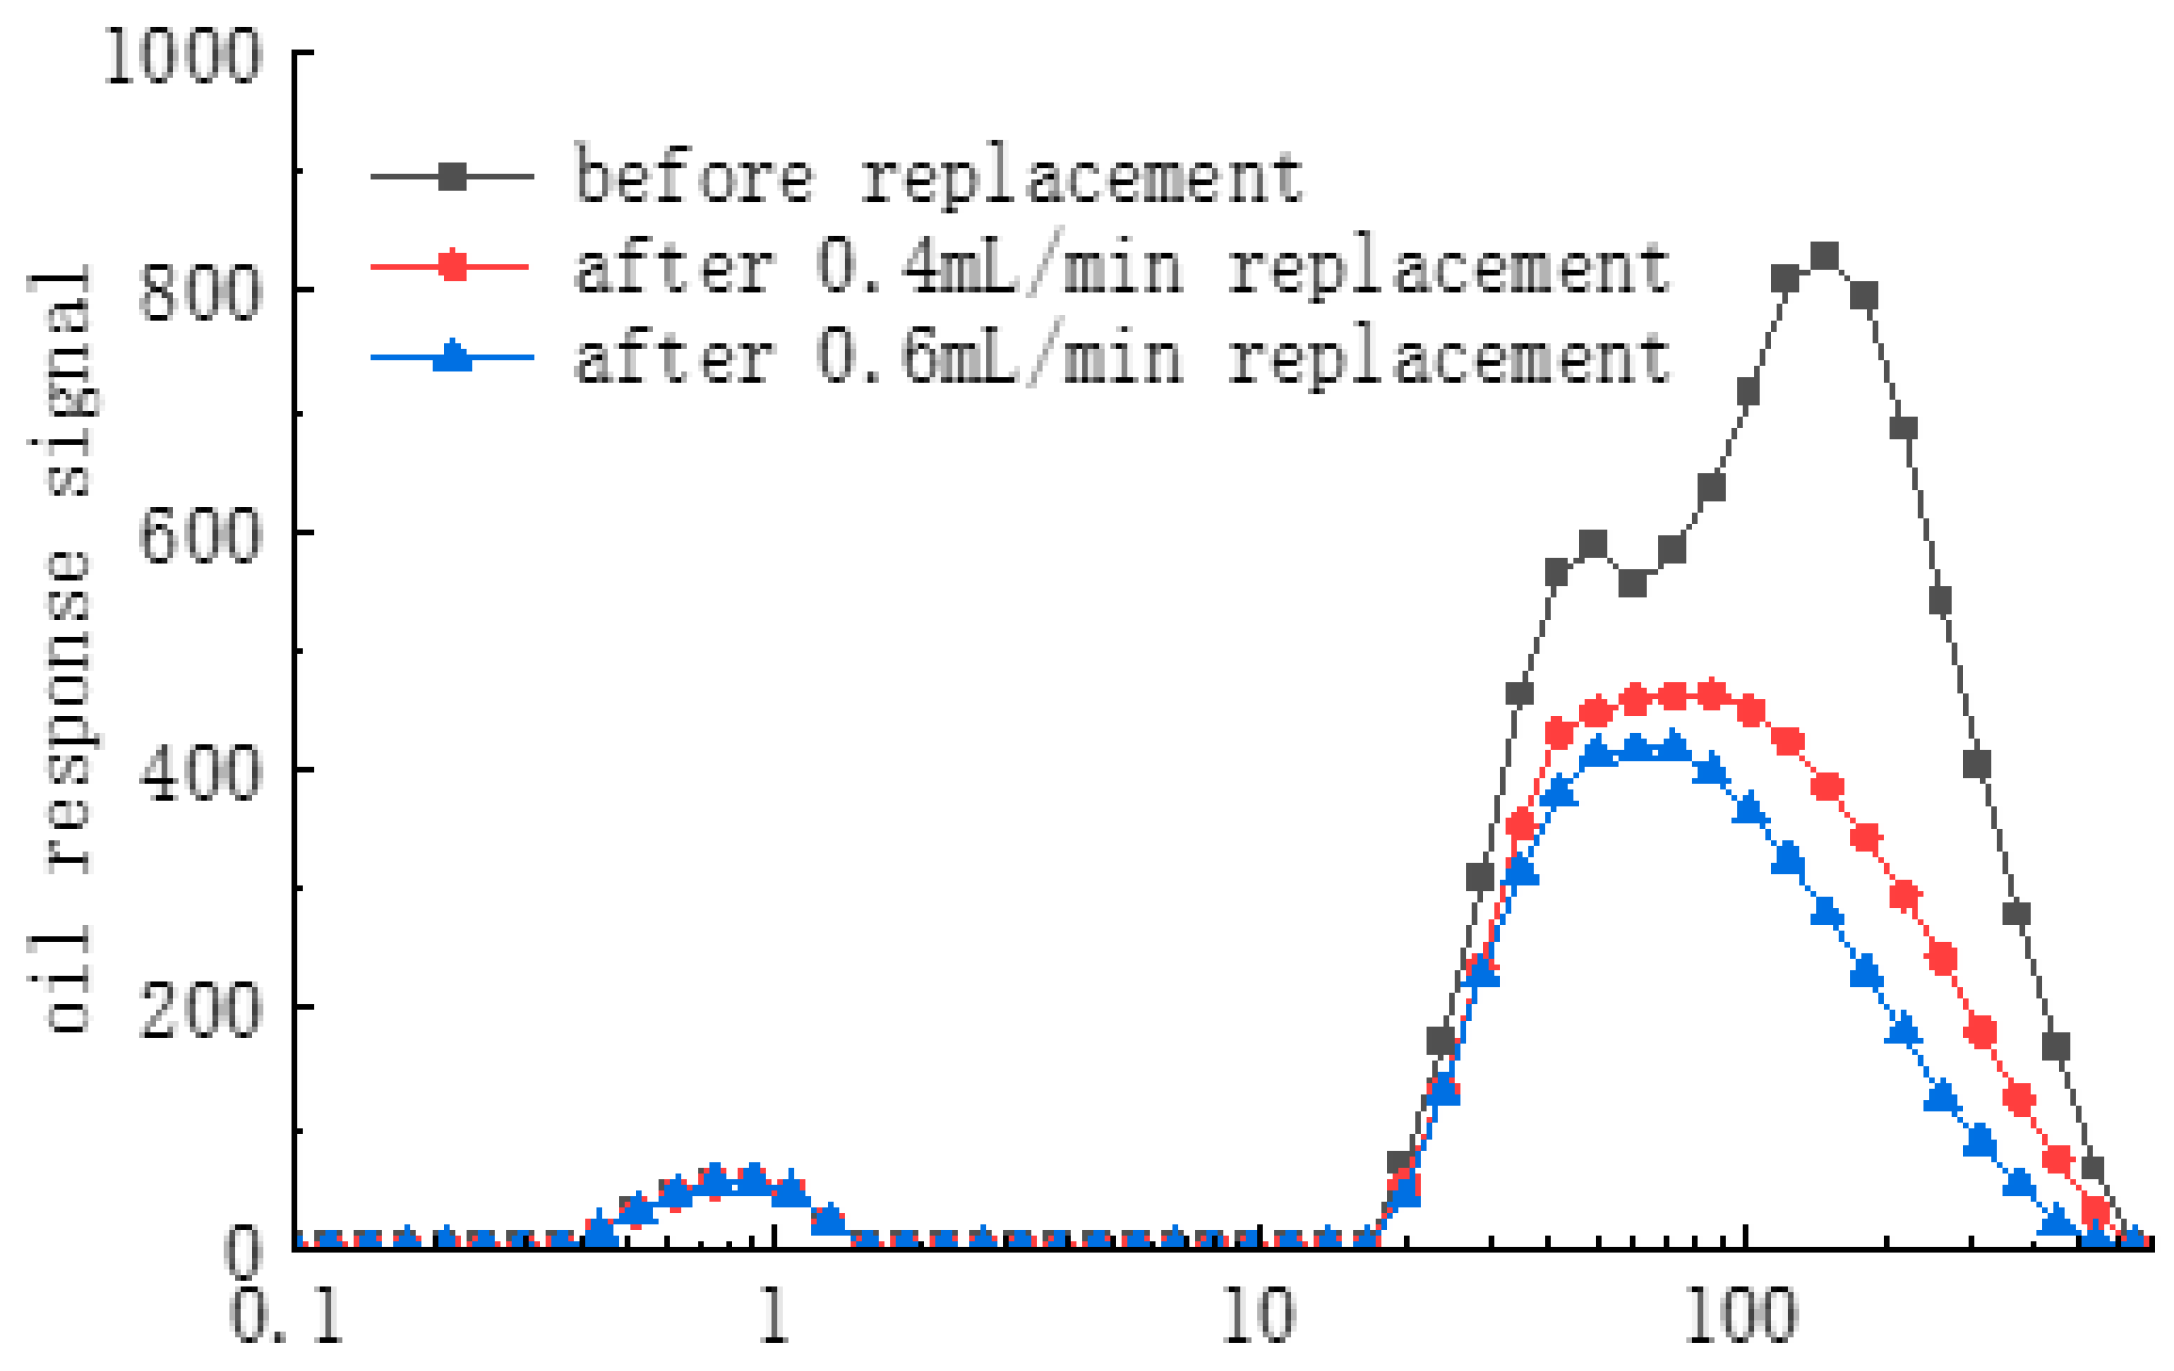
3.1.3. Characteristics of Pore Throat Utilization for WAG in Low-Permeability Inhomogeneous Cores

Figure 7 and Figure 8 illustrates T2 maps and the pore throat utilization degree for a 5 cm long core after WAG at 0.6 and 0.4 mL/min injection rates. In comparing the two figures, it becomes evident that WAG primarily utilizes pores and throats larger than 1 μm. Specifically, pores throats larger than 2.5 μm are utilized to a degree of 55–79%, those between 1–2.5 μm are utilized to 33.57–42.25%, and pore throats smaller than 10 nm remain entirely unused. For pores throats between (1-10)μm, the utilization degree ranges from 23.39% to 28.66%. Upon increasing the flow rate, the utilization degree of larger pore throats becomes more thorough, showing some improvement in medium-sized pore throats.
In contrast, the enhancement for small pore throats remains relatively feeble. This phenomenon indicates that increasing the flow rate does not enable CO2 to penetrate more petite pore throats due to limitations in pore throat size and interfacial effects. However, the increase in pressure effectively expands the swept area of CO2, significantly enhancing the utilization degree of large and medium-sized pore throats. One should consider increasing the injection pressure or adopting miscible displacement further to enhance the utilization degree of small pore throats.

3.2. Non-Mixed-Phase Displacement Simulation Results from Low-Permeability Inhomogeneous Models

3.2.1. Simulation Results and Recovery Degree

The simulation results of all models are plotted as shown in Figure 9, Figure 10 and Figure 11. The overall and low-permeability layer recovery degrees while using 12 injection methods are shown in Table 2 and Table 3, and all of them are compared and analyzed using the injection volume as the standard.
Each model’s rhythms and injection methods are simplified for easy description and documentation. For example, the description of low-injection low-production reverse rhythm is simplified to “reverse/low-in/low-out”, same-injection same-production positive rhythm is simplified to “positive/same-in/same-out”, and low-injection high-production positive rhythm is simplified to “positive/low-in/high-out”. All subsequent descriptions in the text are in simplified form.

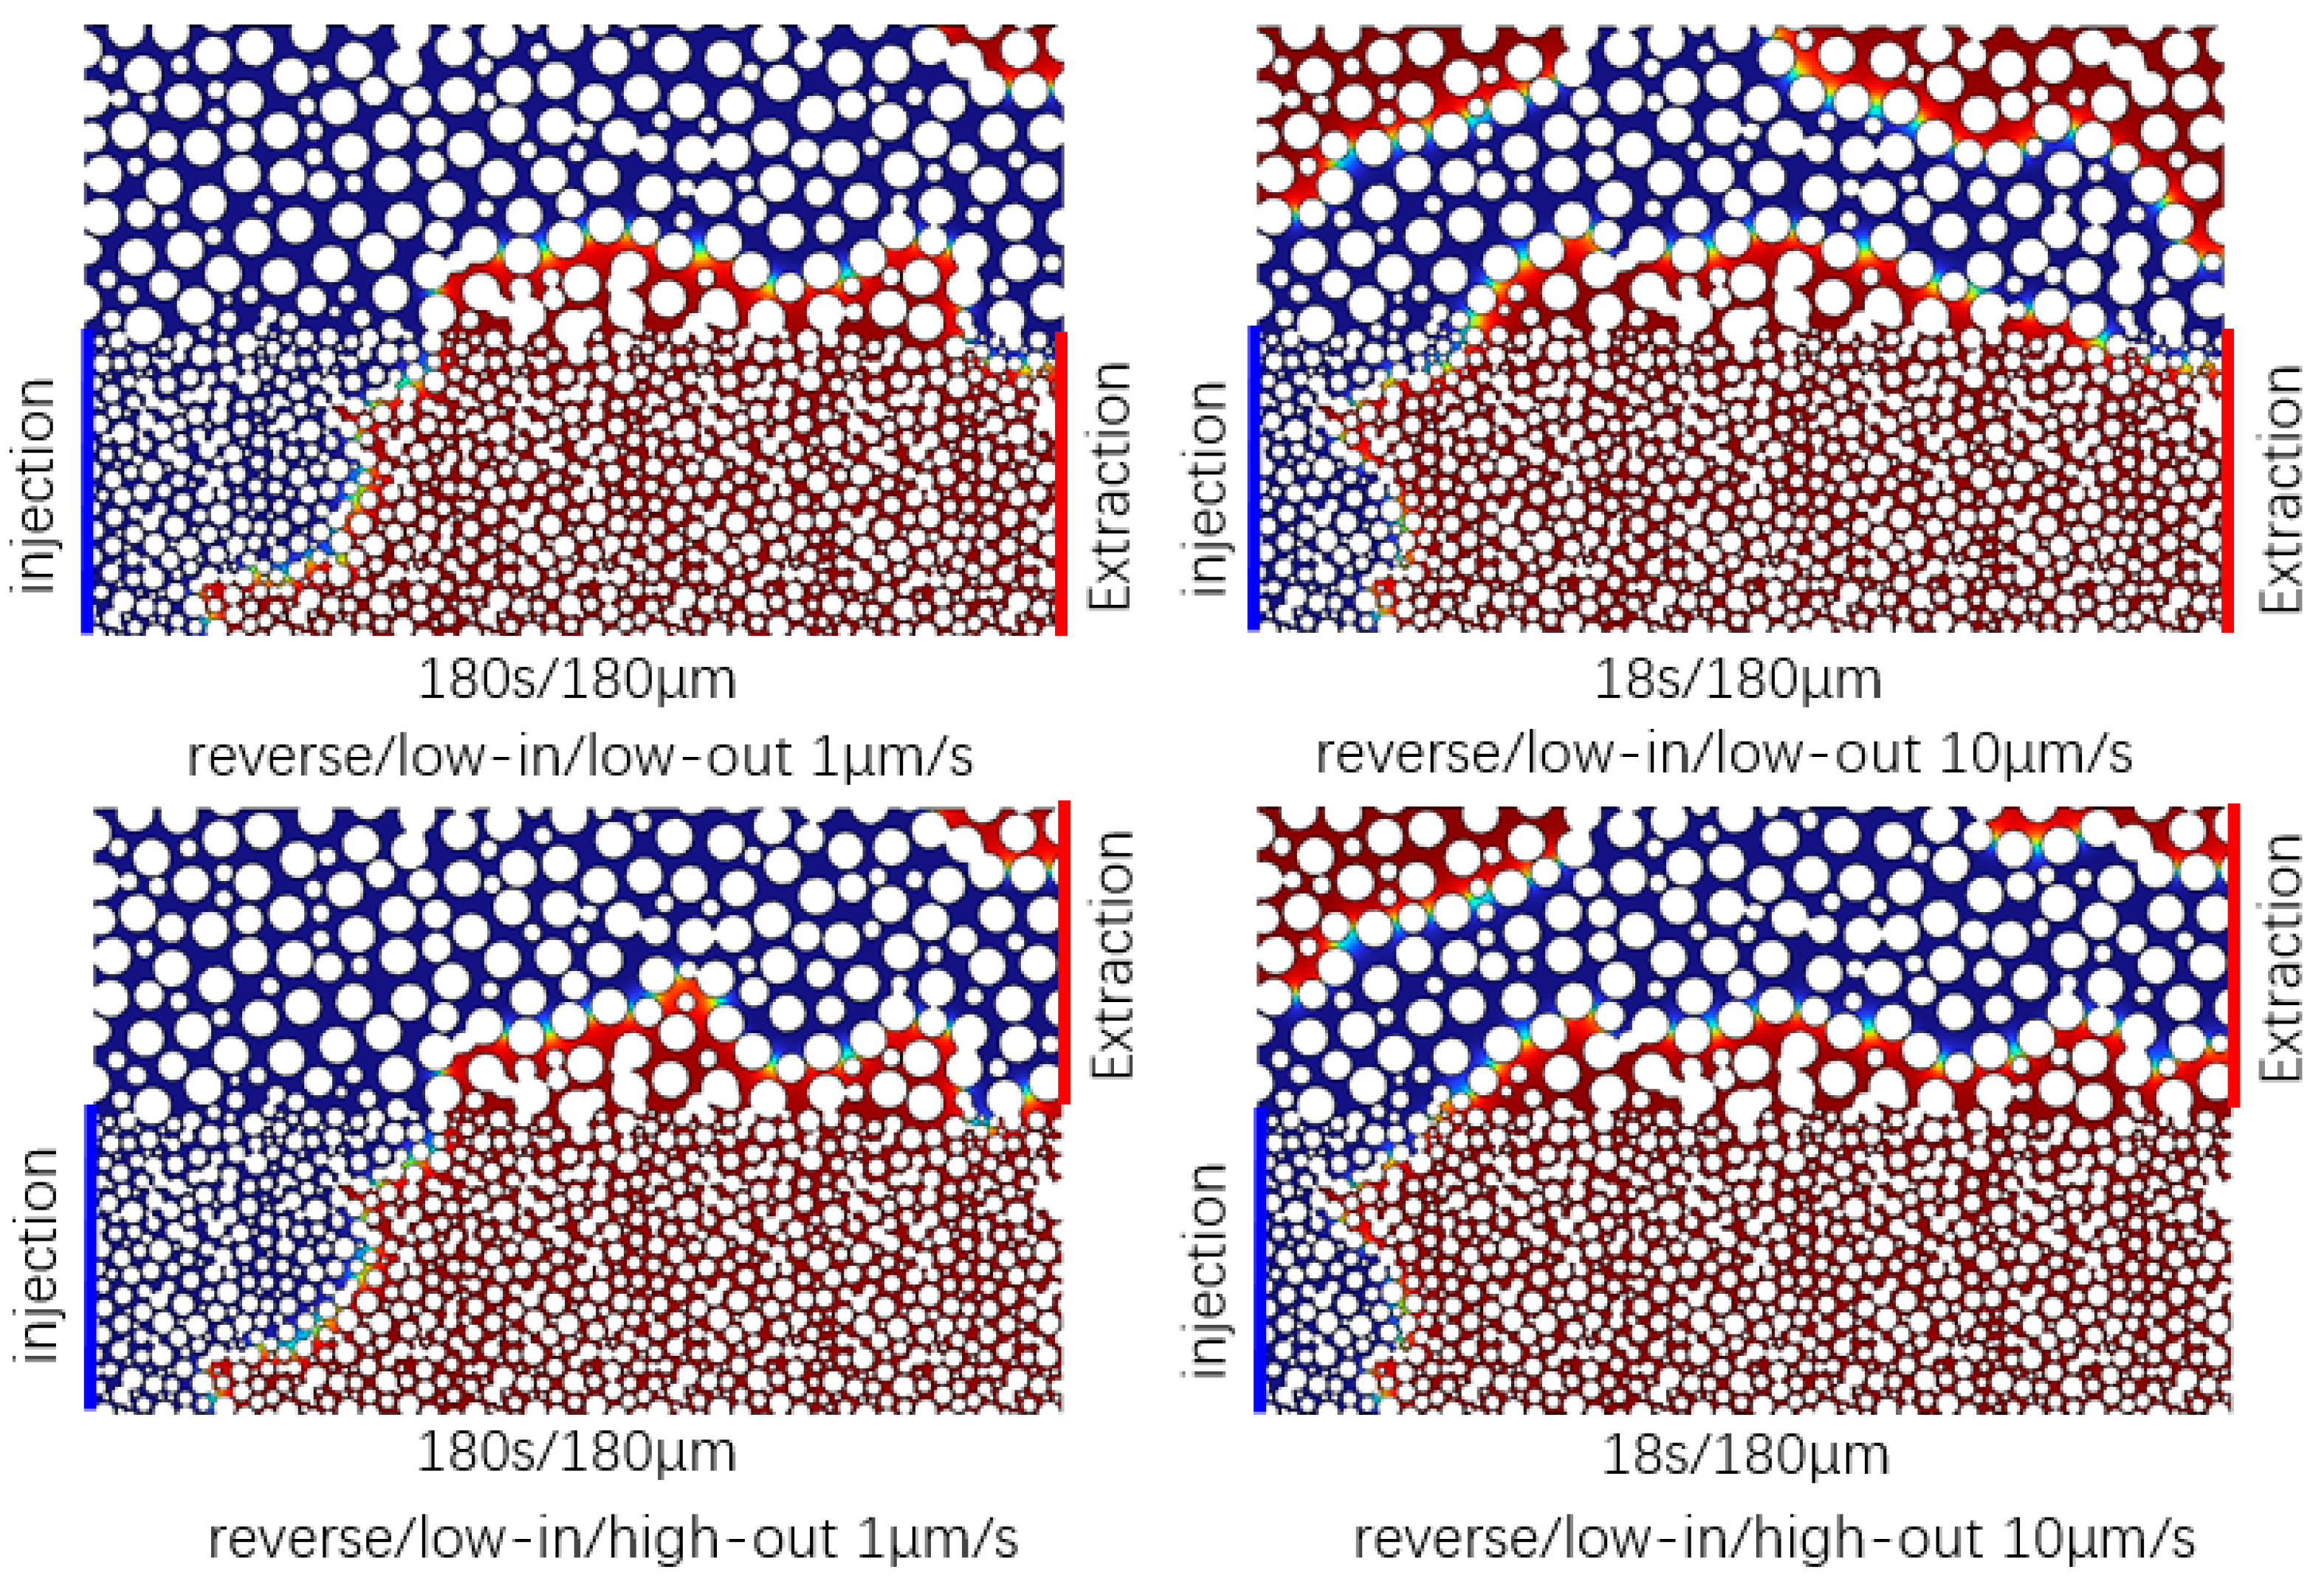
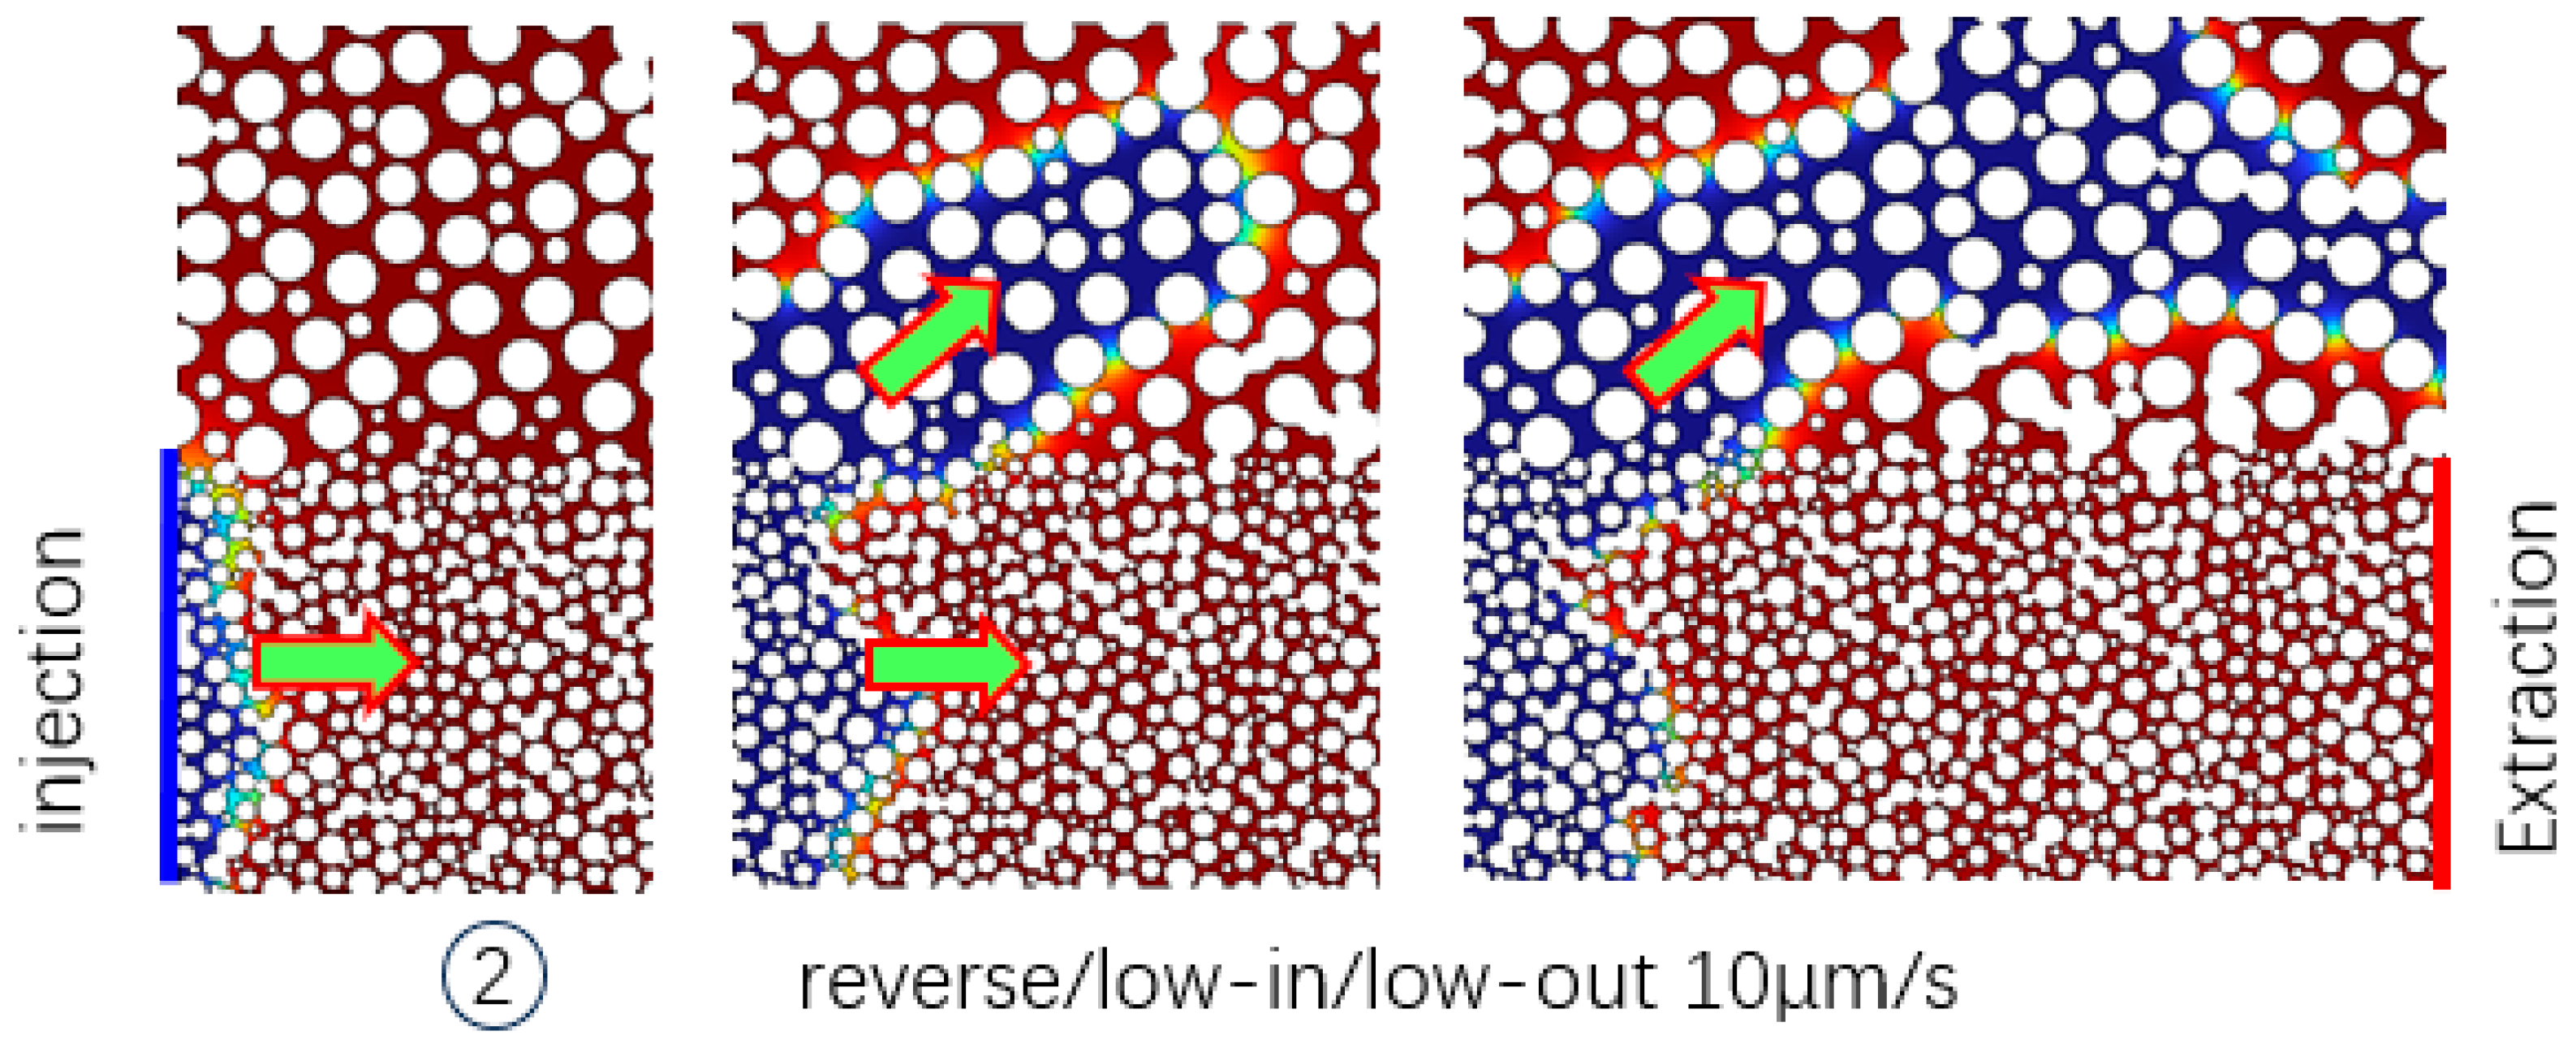
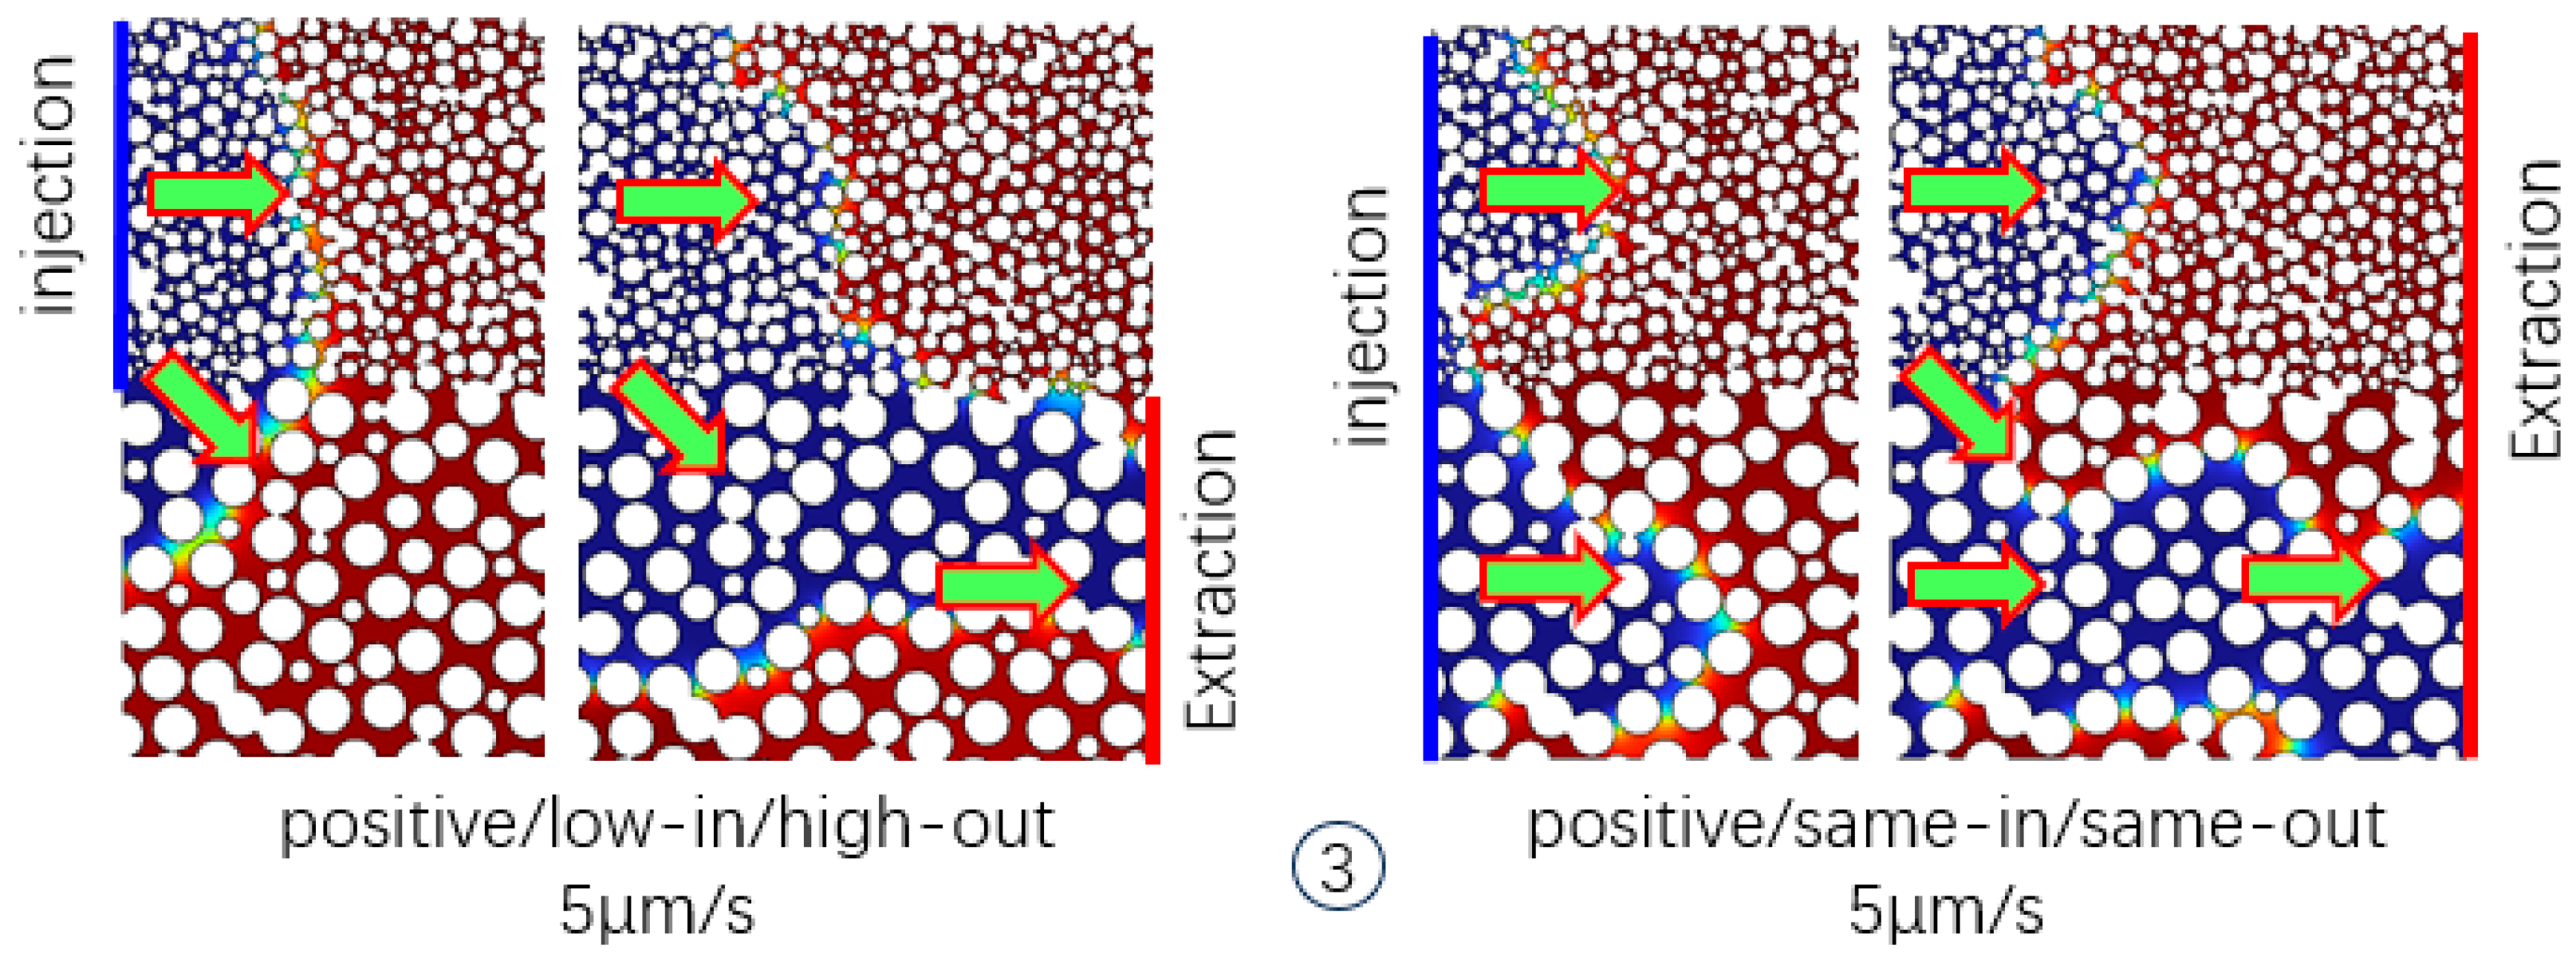
3.2.2. Influence of Gravity and Flow Rate Together on the Characteristics of the Displacement

The presence of porous media affects the injection speed of fluids, directly impacting the pressure distribution within the inhomogeneous model. As the injection speed increases, although it enhances the fluid power, the flow resistance also rises due to the oil–gas interface effect. The pressure distribution becomes even more intricate after incorporating gravity. Pressure changes directly influence the fluid migration direction within the model, subsequently impacting displacement characteristics. The variations in displacement stage images depicted in Figure 12 show this phenomenon.
Figure 12 illustrates the final displacement state diagram for the same-in/same-out model with positive and reverse rhythms when the injection volume is 180 μm. The figure reveals that the gas generally tends to move upward due to gravity upon reducing the flow velocity, and this is particularly evident in high-permeability layers. This suggests that the lower the flow velocity, the more pronounced the influence of gravity.
Figure 13 compares the positive and reverse rhythm models’ overall and low-permeability reservoir recovery degrees with different injection rates. The two figures reveal that flow velocity in the same-in/same-out model significantly influences the positive rhythm model. Reducing the flow velocity boosts the recovery degree of the upper low-permeability layer by 42% (from 20.71% to 62.27%) and increases the overall recovery degree by 14% (from 42.08% to 57.93%). In contrast, the reverse rhythm model is less affected by flow velocity in the same-in/same-out model. The flow velocity increases the recovery degree by 5% (from 48.95% to 53.95%). Due to gravity, the upper high-permeability layer has a higher recovery degree, whereas the lower low-permeability layer has a lower one (from 12.80% to 21.70%). Upon increasing the flow velocity, both the high-permeability and low-permeability layers experience a decrease in recovery degree.

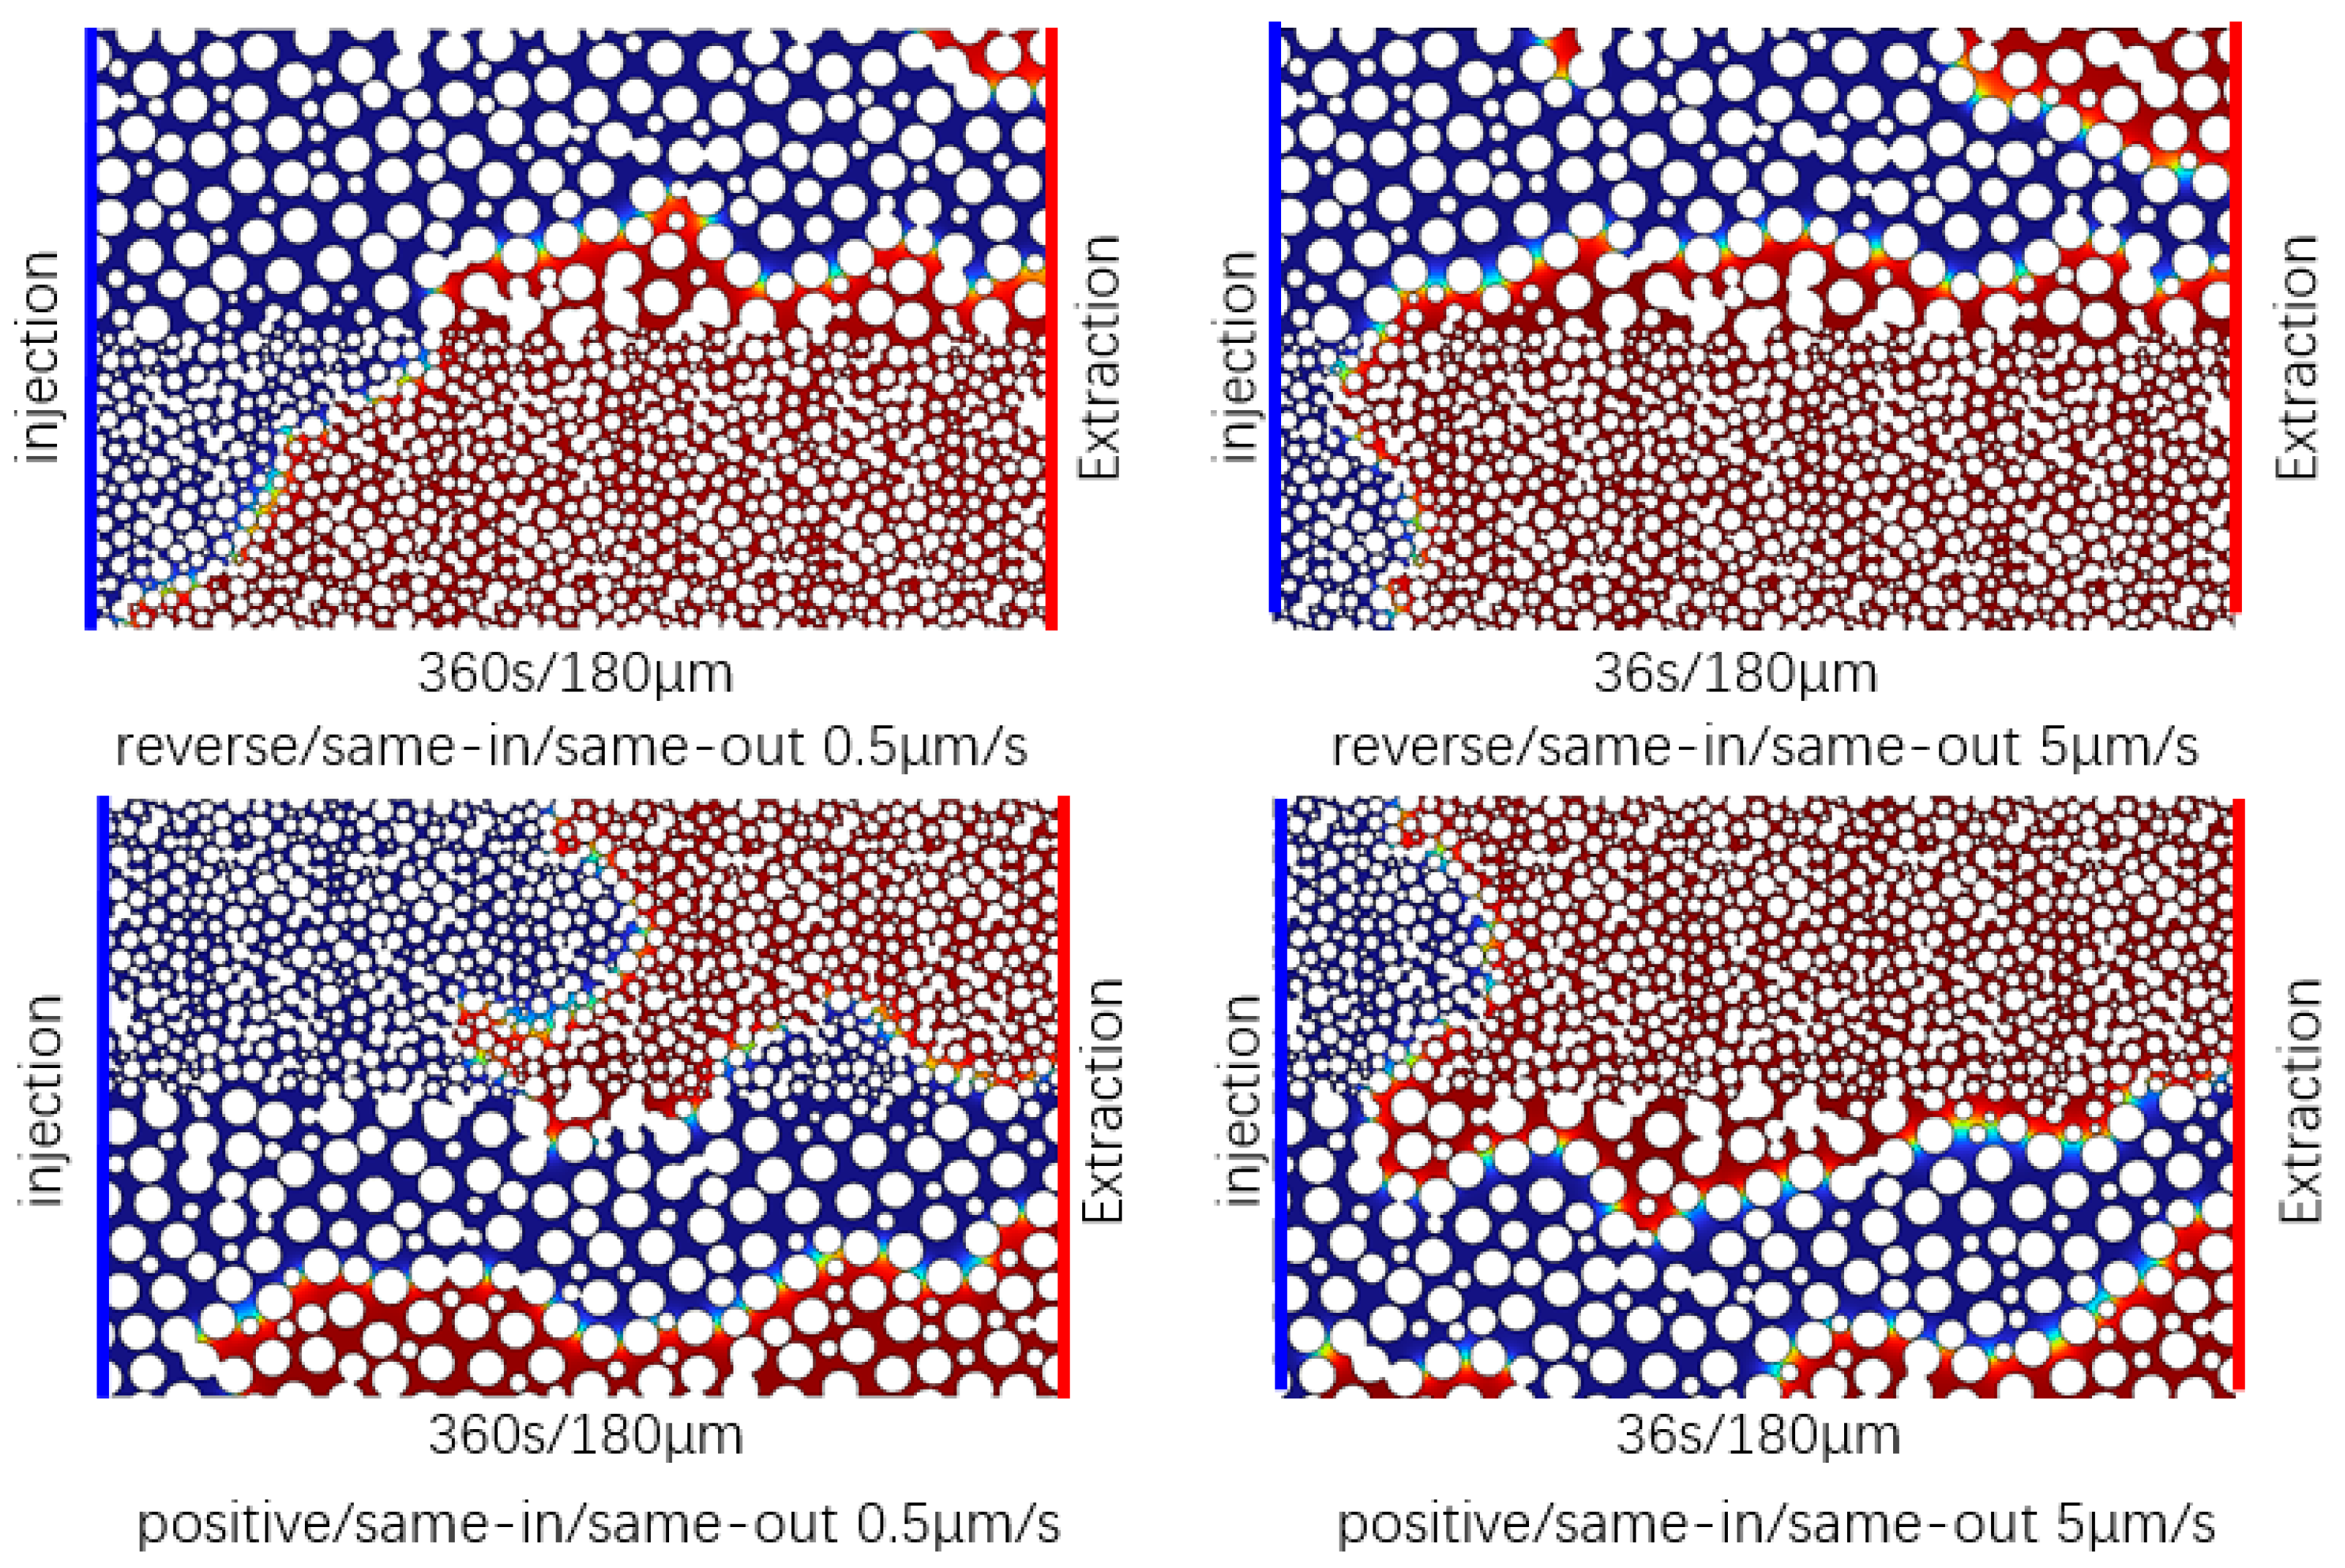
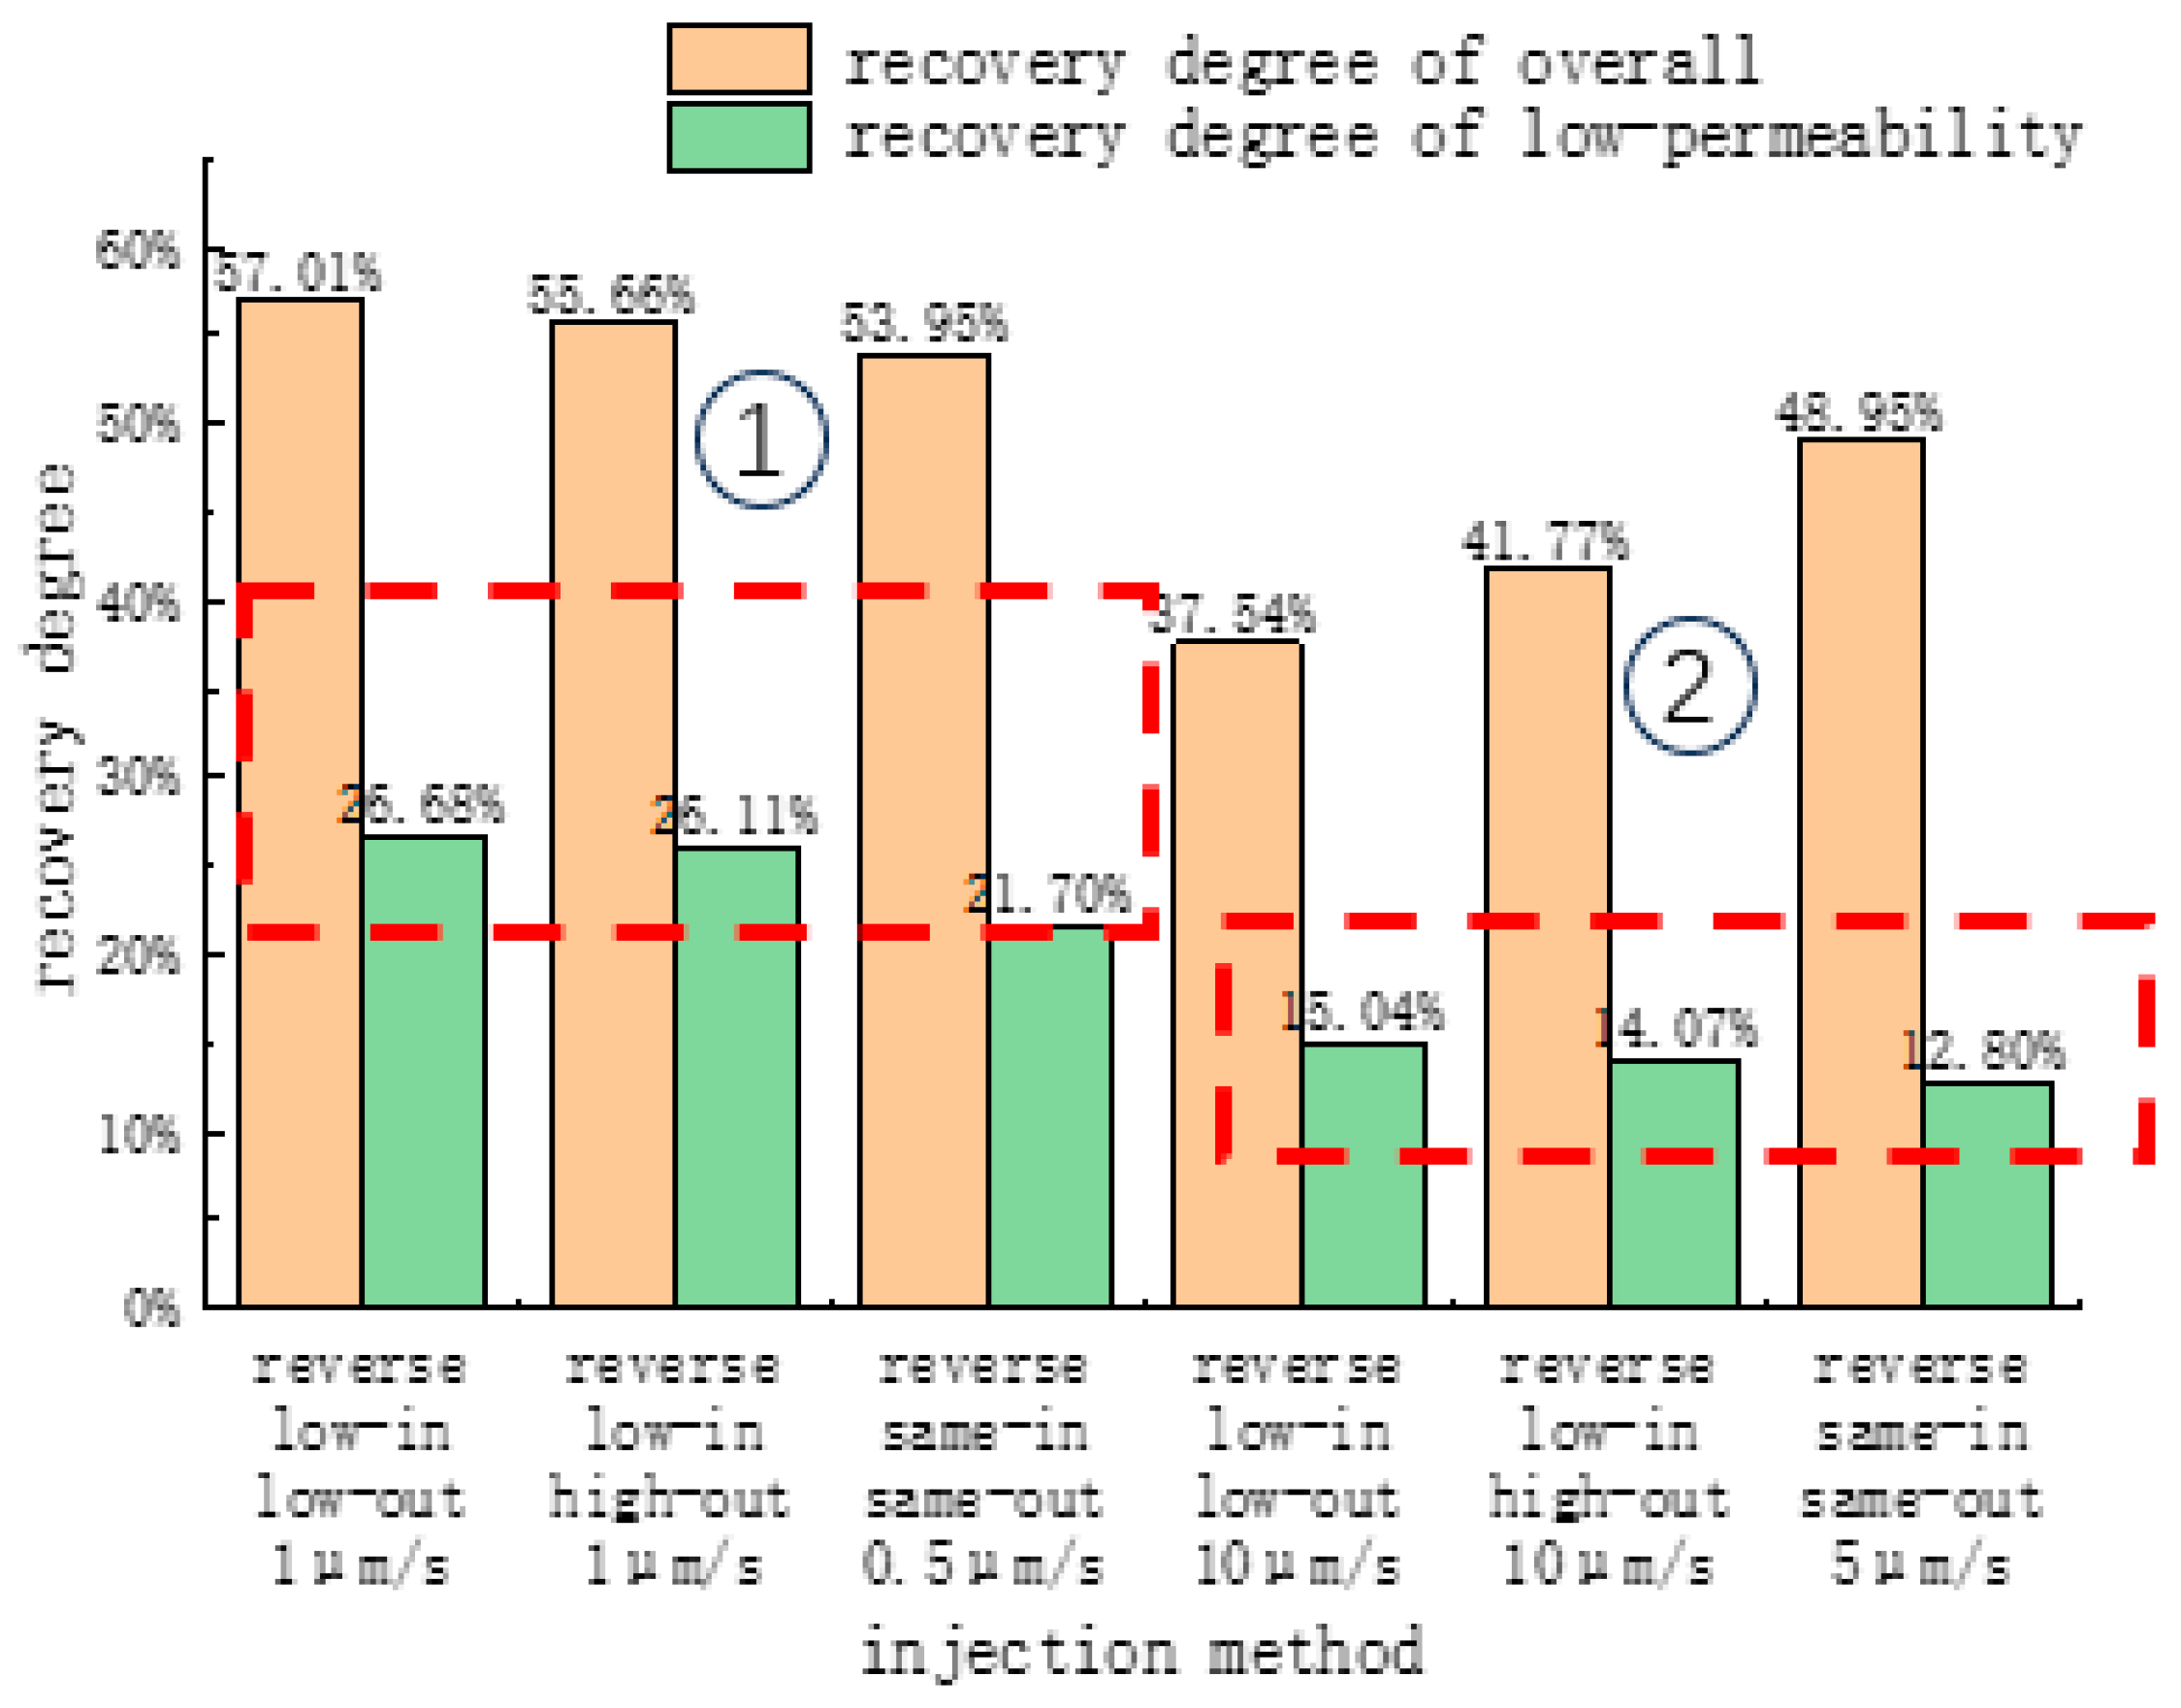
3.2.3. Preferred Development Methods for Reverse-Rhythm Reservoirs

As illustrated in Figure 14, the recovery degree of the low-permeability layers with reverse rhythms using the six injection methods can be arranged from high to low. The reverse rhythmic injection methods can be divided into low-speed and high-speed groups based on the differences in recovery degree and fluid flow patterns. The recovery degree of the low-permeability layer in the low-speed group is 21.70–26.68%, and the overall recovery degree is 53.95–57.01%, with a slight difference. In contrast, the recovery degree of the low-permeability layer in the high-speed group is 12.80–15.04%, and the overall recovery rate is 37.54–48.95%, showing a significant increase.
Figure 15 shows the main flow pattern of gas in the low-speed group. Taking the reverse/low-in/low-out model as an example, the gas first travels along the low-permeability layer. Due to the high capillary force in the low-permeability layer, it is difficult to break through. Under the promotion of gravity, it crosses the boundary between the two layers and enters the high-permeability layer. Due to the relatively low gas injection flow rate and the significant effect of gravity, the gas continues to move upward after entering the high-permeability layer until it concentrates at the top of the high-permeability layer. Due to limited space in the upper part, during the continuous injection of gas, it will move downwards to the lower low-permeability layer and the right outlet in the high-permeability layer. The downward movement promotes the utilization of the low-permeability layer, and after reaching the outlet end to the right, the gas breaks through and forms a flow channel. The displacement tends to stabilize at this point, and the high-permeability layer’s recovery degree rises very slowly.
Figure 16 illustrates the gas flow pattern in the high-speed group with the reverse rhythm. Due to the high injection flow rate, the gas exhibits some propulsion capability in the low-permeability layers during the initial displacement stage. However, the high injection flow rate also results in significant percolation resistance, rapidly causing the gas to advance toward the high-permeability layers with lower resistance. Additionally, the high flow rate significantly diminishes the influence of gravity, preventing the gas from filling the upper of the high-permeability layers. Consequently, the gas has no downward movement trend and flows directly to the right outlet. The gas quickly breaks through, leading to a lower recovery rate in the low-permeability layers.
In the reverse rhythm model, the recovery degree of the high-permeability layers significantly influences the overall recovery degree. In the high-speed group, the recovery degree gradually increases from low-in/low-out to low-in/high-out and then to the same-in/same-out due to the limitation of the inlet and outlet locations. This gradually expands the contact area between the gas and the high-permeability layers, promoting production in these layers and resulting in a significant increase in the recovery degree of the high-speed group. In the low-speed group, due to the influence of gravity, the upper high-permeability layers are filled with CO2 and gradually move downward, leading to relatively similar development effects in the high-permeability layers and a slight difference in overall recovery degree. After comparative analysis, it is believed that low-speed, low-in/low-out scenarios have the best development effect on the reverse reservoir. The lower flow rate strengthens the influence of gravity, forming a phenomenon in which CO2 is enriched in the upper part and pushed down to the lower low-permeability layer.

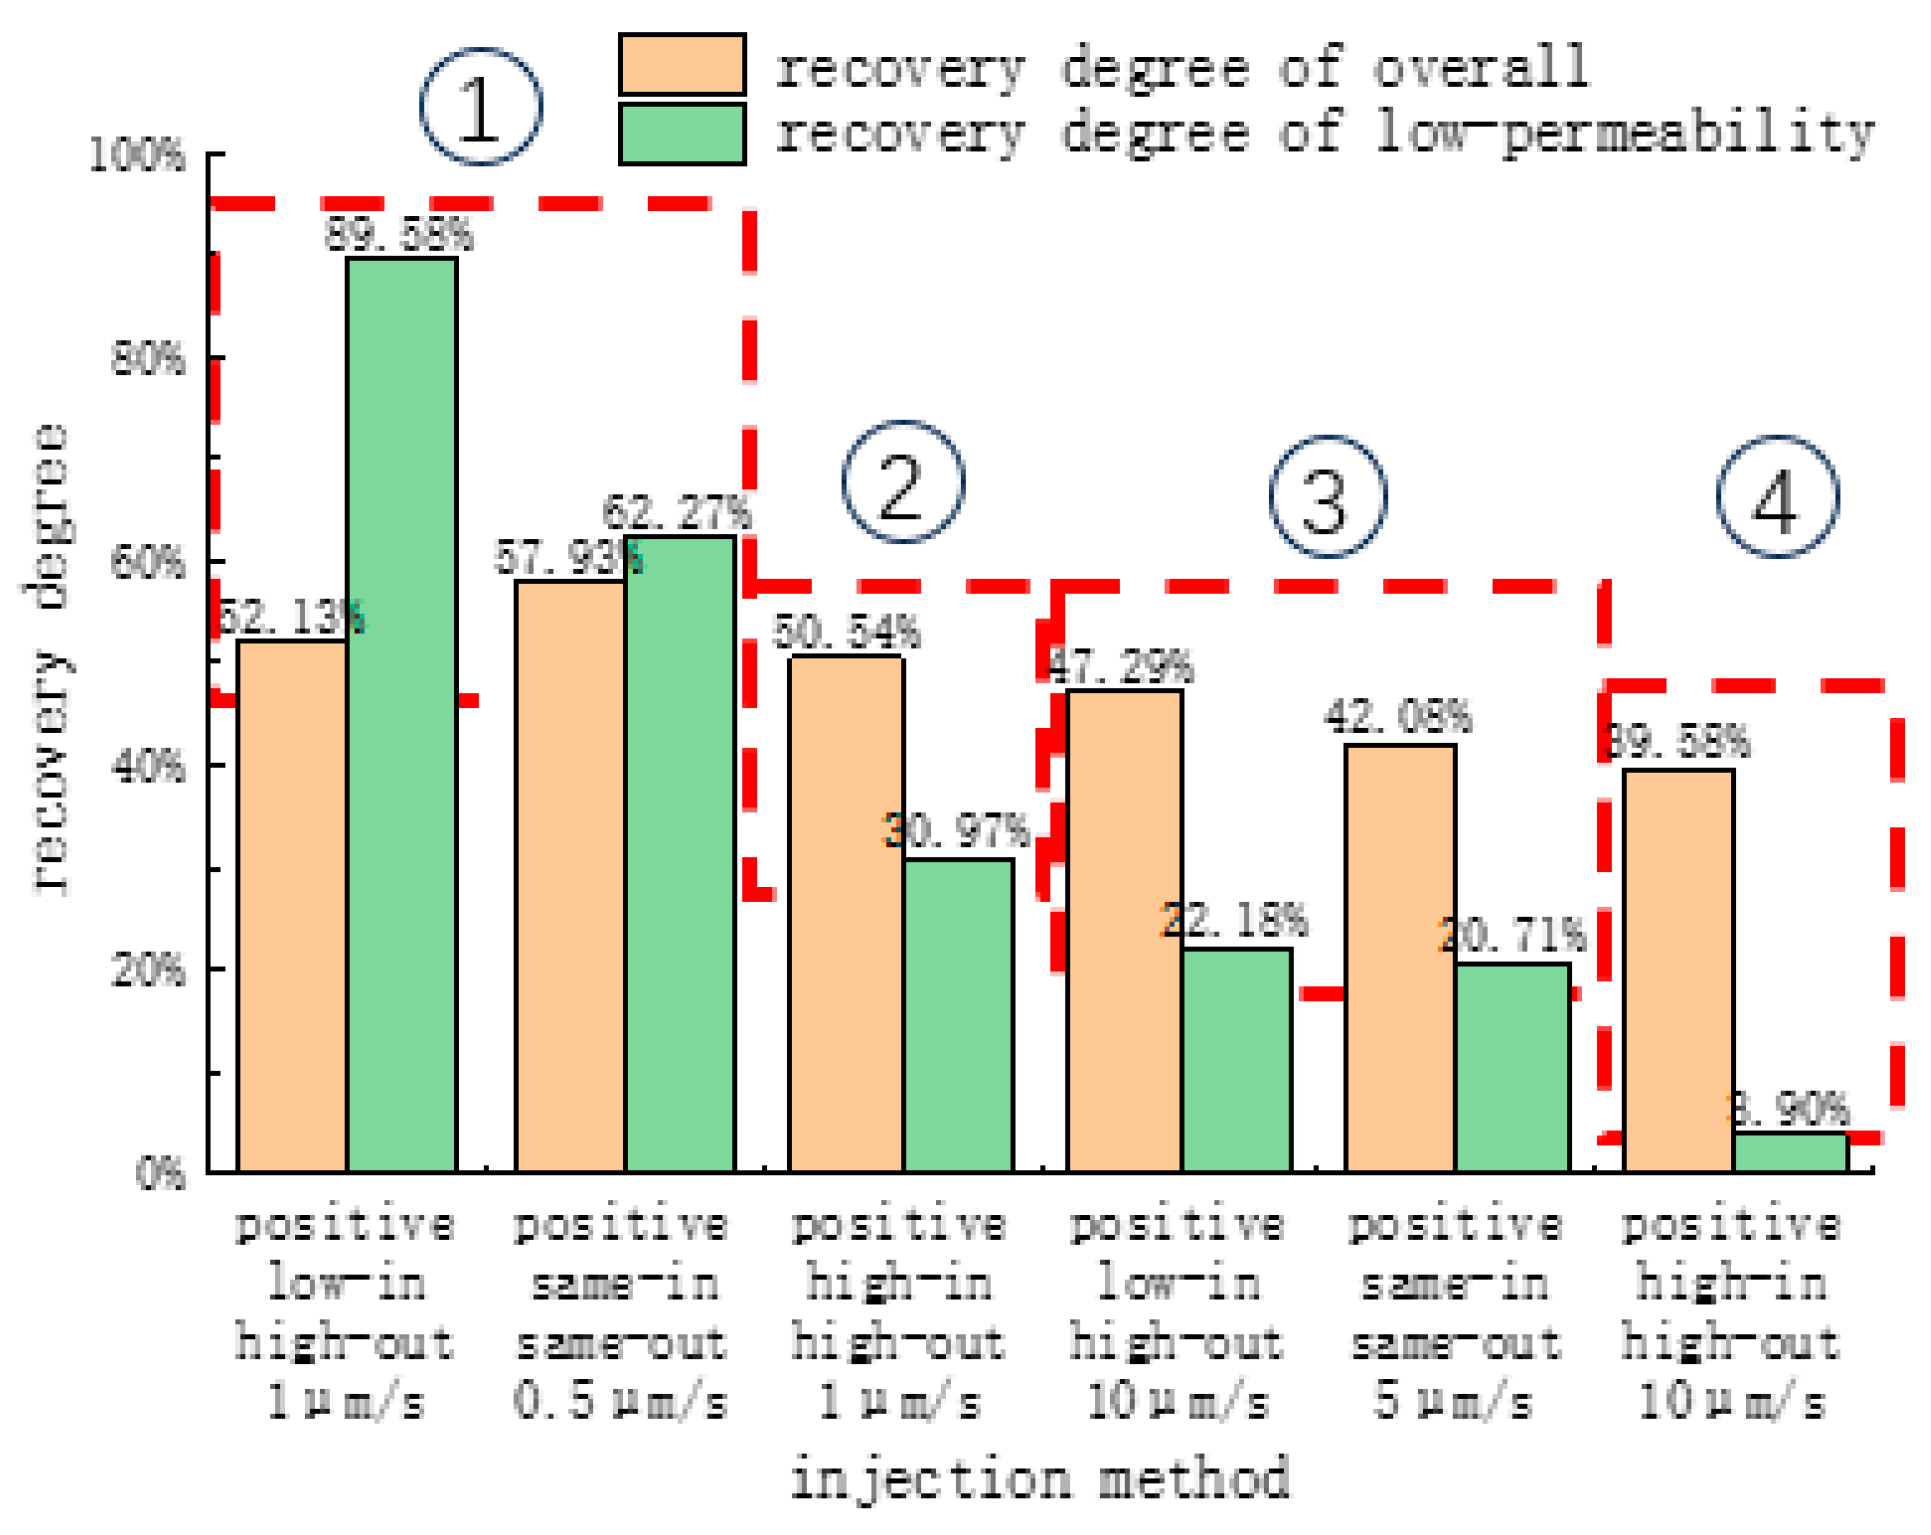
3.2.4. Preferred Development Methods for Positive-Rhythm Reservoirs

As depicted in Figure 17, the recovery degree of the low-permeability layers with positive rhythm using six injection methods is arranged in descending order. Based on the variations in recovery degree, the positive rhythm injection methods can be categorized into two groups, low-speed and high-speed, which can further be subdivided into four types according to fluid flow characteristics. The overall recovery degree of the positive rhythm model spans from 39.58% to 62.27%, closely resembling that of the reverse rhythm model. The recovery degree in the low-permeability layers ranges from 3.90% to 89.58%, exhibiting a substantial variation.
Category 1 (Figure 18) comprises two groups: low-speed/low-in/high-out and low-speed/same-in/same-out. Both groups inject CO2 into low-permeability layers and achieve a high recovery degree. In the same-in/same-out group, seepage channels are formed first in the high-permeability layer, causing gas in the low-permeability layer to divert and flow into the high-permeability layer with lower seepage resistance. In contrast, the CO2 in the low-in/low-out group is influenced by gravity, accumulating at the top and moving downward and to the outlet, resulting in a lower recovery degree in the low-permeability layers of the same-in/same-out group compared to the low-in/low-out group.
Category 3 (Figure 19) encompasses high-speed/low-in/high-out and high-speed/same-in/same-out. The recovery degree for the low-permeability layers in these two groups is 22.18% and 20.17%, respectively. Due to the high flow velocity, the gas encounters greater resistance in the low-permeability layer. Soon after injection, it shifts towards the lower high-permeability layer and ultimately flows out. Due to the minimal influence of gravity on the high-velocity CO2, there is almost no upward movement trend once it flows into the high-permeability layer, which is particularly evident in the same-in/same-out group.
The injection locations for categories 2 and 4 are identical (Figure 20). However, due to the significant difference in injection flow rates, the gas in the low-velocity group tends to move upward due to gravity during the injection process, resulting in a recovery rate of 30.97% in the low-permeability layer. In contrast, the high-speed group shows almost no upward movement trend, and the recovery degree of the low-permeability layer is only 3.90%.

4. Conclusions

(1) For an inhomogeneous reservoir, which relies on the Jamin effect formed when water and gas are alternately injected, the recovery degree of the core can be effectively improved, and the appropriate increase in flow rate can strengthen the effect of WAG. With the lengthening of the core, the resistance factor and recovery degree prompt a certain degree of enhancement; after gas injection, the pressure at the injected end of the core rises immediately, and there is a delay in the enhancement of the recovery degree in the long core. In the process of non-mixed-phase WAG replacement, which is affected by the size of the core pore throats and the interfacial effect, the increase in the injection flow rate effectively enhances the degree of large and medium-sized pore throat utilization. However, it has a weaker enhancement effect on medium- and small-sized pore throats. According to this paper’s results, in the actual reservoir development process, the injection pressure will rise immediately in the early stage of the implementation of WAG. However, due to the long distance between the injection and production wells, the delay in the increase in the recovery degree will be more serious, so it is necessary to prolong the WAG implementation appropriately. The water and gas injection can be appropriately increased by the reservoir conditions to facilitate an effective increase in the oil recovery degree. Methods such as pressurization and mixed-phase replacement should improve the utilization degree by reducing the interfacial tension for the small-sized pore throats in the reservoir rock.
(2) Different diameters and numbers of balls are randomly combined to design a low-permeability double-layer inhomogeneous model. After simulation, it is found that gravity and flow rate will affect the effect of replacement, and the larger the flow rate, the smaller the effect of gravity; moreover, the effect of gravity is more significant at low flow rates.
(3) During the development of the actual reservoir, i.e., the reverse-rhythm reservoir, the low-velocity/low-in/low-out model is most suitable; after CO2 is enriched at the top of the reservoir under the effect of gravity, it will move downward to mobilize oil in the low-permeability layer, and the maximum recovery degree of the low-permeability layer can be up to 26.68%. For the positive-rhythm reservoir, the low-velocity/low-in/high-out model is most suitable, with CO2 being enriched in the upper part of the model. With the replacement, the CO2 will be transported downwards through the reservoir, and the final recovery degree of the low-permeability layer may be up to 89.58%. Both kinds of the rhythmic reservoir are suitable for development with a low flow rate so that they can exploit the effect of gravity. With the CO2 enrichment in the upper part of the model, the CO2 is slowly transported to the lower layer and the outlet (the effect of improvement on the positive rhythm is even more apparent).

Author Contributions

Conceptualization, M.L. and K.S.; methodology, M.L. and K.S.; software, M.L. and L.W.; validation, M.L. and L.W.; formal analysis, M.L. and T.W.; investigation, M.L. and L.W.; resources, H.F.; data curation, M.L.; writing—original draft preparation, M.L., T.W. and L.W.; writing—review and editing, H.F. and T.W.; visualization, L.W.; supervision H.F.; project administration, K.S.; funding acquisition, M.L. and K.S. All authors have read and agreed to the published version of the manuscript.

Funding

This research received no external funding.

Data Availability Statement

The original contributions presented in the study are included in the article, further inquiries can be directed to the corresponding author.

Acknowledgments

Thanks to Zhihui Yang and Zhanjun Sun of the Hebei Ruiniu Company for their experimental technical guidance; thanks to Jian Ding and Hai Liu for the experimental equipment and to Baodong Gu and Yinghua Zhang for the experimental core and fracturing equipment.

Conflicts of Interest

The authors declare no conflict of interest.

References

  1. Zhang, Q.; Liu, J.-F.; Gao, Z.-H.; Chen, S.-Y.; Liu, B.-Y. Review on the Challenges and Strategies in Oil and Gas Industry’s Transition towards Carbon Neutrality in China. Pet. Sci. 2023, 20, 3931–3944. [Google Scholar] [CrossRef]
  2. Yuan, S.; Han, H.; Wang, H.; Luo, J.; Wang, Q.; Lei, Z.; Xi, C.; Li, J. Research Progress and Potential of New Enhanced Oil Recovery Methods in Oilfield Development. Pet. Explor. Dev. 2024, 51, 963–980. [Google Scholar] [CrossRef]
  3. Zheng, X.; Shi, J.; Cao, G.; Yang, N.; Cui, M.; Jia, D.; Liu, H. Progress and Prospects of Oil and Gas Production Engineering Technology in China. Pet. Explor. Dev. 2022, 49, 644–659. [Google Scholar] [CrossRef]
  4. Qiu, L.; Wang, S.; Hu, B.; Yan, J.; Deng, S.; Shen, J.; Shi, C.; Ge, X.; Chen, B. A Review on High-Value Development and Utilization of Unconventional Methane-Containing Gaseous Fuel Resources. Energy Convers. Manag. 2024, 319, 118980. [Google Scholar] [CrossRef]
  5. Manfroni, M.; Bukkens, S.G.F.; Giampietro, M. Securing Fuel Demand with Unconventional Oils: A Metabolic Perspective. Energy 2022, 261, 125256. [Google Scholar] [CrossRef]
  6. Di, S.; Cheng, S.; Cao, N.; Gao, C.; Miao, L. AI-Based Geo-Engineering Integration in Unconventional Oil and Gas. J. King Saud Univ. -Sci. 2021, 33, 101542. [Google Scholar] [CrossRef]
  7. Yan, D.; Zhao, L.; Song, X.; Tang, J.; Zhang, F. Fracability Evaluation Model for Unconventional Reservoirs: From the Perspective of Hydraulic Fracturing Performance. Int. J. Rock Mech. Min. Sci. 2024, 183, 105912. [Google Scholar] [CrossRef]
  8. Verma, A.; Pal, N.; Kumar, N.; Al-Yaseri, A.; Ali, M.; Ojha, K. Nanoparticles Stabilized Foam Fluid for Hydraulic Fracturing Application of Unconventional Gas Reservoirs: A Review of the Properties, Progress and Future Prospects. Pet. Res. 2024, in press. [CrossRef]
  9. Zhang, S.; Zhang, B.; Wang, X.; Feng, Z.; He, K.; Wang, H.; Fu, X.; Liu, Y.; Yang, C. Gulong Shale Oil Enrichment Mechanism and Orderly Distribution of Conventional—Unconventional Oils in the Cretaceous Qingshankou Formation, Songliao Basin, NE China. Pet. Explor. Dev. 2023, 50, 1045–1059. [Google Scholar] [CrossRef]
  10. Bai, Y.; Pu, W.; Jin, X.; Shen, C.; Ren, H. Review of the Micro and Macro Mechanisms of Gel-Based Plugging Agents for Enhancing Oil Recovery of Unconventional Water Flooding Oil Reservoirs. J. Mol. Liq. 2024, 399, 124318. [Google Scholar] [CrossRef]
  11. Prasad, S.K.; Sangwai, J.S.; Byun, H.-S. A Review of the Supercritical CO2 Fluid Applications for Improved Oil and Gas Production and Associated Carbon Storage. J. CO2 Util. 2023, 72, 102479. [Google Scholar] [CrossRef]
  12. Gou, B.; Li, X.; Guo, J.; Liu, C.; Chen, C.; Guan, C. Experimental Investigation of the Impacts of Supercritical Carbon Dioxide on Acid-Etching Fracture Morphology and Conductivity in Tight Carbonate Reservoir. Fuel 2024, 360, 130526. [Google Scholar] [CrossRef]
  13. Jiang, J.; Rui, Z.; Hazlett, R.; Lu, J. An Integrated Technical-Economic Model for Evaluating CO2 Enhanced Oil Recovery Development. Appl. Energy 2019, 247, 190–211. [Google Scholar] [CrossRef]
  14. Davoodi, S.; Al-Shargabi, M.; Wood, D.A.; Mehrad, M.; Rukavishnikov, V.S. Carbon Dioxide Sequestration through Enhanced Oil Recovery: A Review of Storage Mechanisms and Technological Applications. Fuel 2024, 366, 131313. [Google Scholar] [CrossRef]
  15. Liu, B.; Shi, J.; Wang, M.; Zhang, J.; Sun, B.; Shen, Y.; Sun, X. Reduction in Interfacial Tension of Water—Oil Interface by Supercritical CO2 in Enhanced Oil Recovery Processes Studied with Molecular Dynamics Simulation. J. Supercrit. Fluids 2016, 111, 171–178. [Google Scholar] [CrossRef]
  16. Wang, L.; Zhang, Y.; Zou, R.; Zou, R.; Huang, L.; Liu, Y.; Meng, Z.; Wang, Z.; Lei, H. A Systematic Review of CO2 Injection for Enhanced Oil Recovery and Carbon Storage in Shale Reservoirs. Int. J. Hydrog. Energy 2023, 48, 37134–37165. [Google Scholar] [CrossRef]
  17. Mukherjee, M.; Misra, S.; Gupta, A. Control of Pore-Size Distribution on CO2 Adsorption Volume and Kinetics in Gondwana Coals: Implications for Shallow-Depth CO2 Sequestration Potential. J. Nat. Gas Sci. Eng. 2021, 89, 103901. [Google Scholar] [CrossRef]
  18. Lang, D.; Lun, Z.; Lyu, C.; Wang, H.; Zhao, Q.; Sheng, H. Nuclear Magnetic Resonance Experimental Study of CO2 Injection to Enhance Shale Oil Recovery. Pet. Explor. Dev. 2021, 48, 702–712. [Google Scholar] [CrossRef]
  19. Wang, Z.; Li, S.; Jin, Z.; Li, Z.; Liu, Q.; Zhang, K. Oil and Gas Pathway to Net-Zero: Review and Outlook. Energy Strategy Rev. 2023, 45, 101048. [Google Scholar] [CrossRef]
  20. Wang, Z.L.; Chen, H.L. The Distribution and Evolution of Fluid Pressure and Its Influence on Natural Gas Accumulation in the Upper Paleozoic of Shenmu-Yulin Area, Ordos Basin. Sci. China Ser. D Earth Sci. 2007, 50, 59–74. [Google Scholar] [CrossRef]
  21. Chi, G.; Giles, P.S.; Williamson, M.A.; Lavoie, D.; Bertrand, R. Diagenetic History and Porosity Evolution of Upper Carboniferous Sandstones from the Spring Valley #1 Well, Maritimes Basin, Canada—Implications for Reservoir Development. J. Geochem. Explor. 2003, 80, 171–191. [Google Scholar] [CrossRef]
  22. Spina, V.; Olagundoye, O.; Chizea, C.; Pellettier, J.; Onyeanuna, C.; Parsa, A.; Joubert, T.; Fashanu, M.; Enuma, C.; Ifihan, J.J.; et al. Unravelling the Impact of Geological Heterogeneities in the Reservoir Management. An Integrated Study of the Deep-Water Akpo Field (Niger Delta). Mar. Pet. Geol. 2023, 150, 106132. [Google Scholar] [CrossRef]
  23. Handhal, A.M.; Ettensohn, F.R.; Al-Abadi, A.M.; Ismail, M.J. Spatial Assessment of Gross Vertical Reservoir Heterogeneity Using Geostatistics and GIS-Based Machine-Learning Classifiers: A Case Study from the Zubair Formation, Rumaila Oil Field, Southern Iraq. J. Pet. Sci. Eng. 2022, 208, 109482. [Google Scholar] [CrossRef]
  24. Mclaughlin, J.F.; Garcia-Gonzalez, M. Detailed Geologic Characterization of Core and Well Data from the Weber and Madison Formations and Associated Seals at a Potential CO2 Sequestration Site in Southwest Wyoming: Definining the Lithologic, Geochemical, Diagenetic, and Burial Histories Relative to Successful CO2 Storage. In Geological CO2 Storage Characterization; Springer: Berlin/Heidelberg, Germany, 2013. [Google Scholar] [CrossRef]
  25. Kassem, A.A.; Nabawy, B.S.; Mogren, S.; Abdel-Fattah, M.I.; Radwan, A.A.; Ibrahim, E. Implications of the Depositional and Diagenetic Attributes on the Reservoir Properties of the Siliciclastic Mangahewa Formation, Taranaki Basin, New Zealand: Integrated Petrographical and Petrophysical Studies. Mar. Pet. Geol. 2024, 164, 106823. [Google Scholar] [CrossRef]
  26. Wei, J.; Zhou, J.; Li, J.; Zhou, X.; Dong, W.; Cheng, Z. Experimental Study on Oil Recovery Mechanism of CO2 Associated Enhancing Oil Recovery Methods in Low Permeability Reservoirs. J. Pet. Sci. Eng. 2021, 197, 108047. [Google Scholar] [CrossRef]
  27. Jia, P.; Cui, C.; Wu, Z.; Yan, D. Influence of Reservoir Heterogeneity on Immiscible Water-Alternating-CO2 Flooding: A Case Study. Energy Geosci. 2024, 5, 100272. [Google Scholar] [CrossRef]
  28. Gao, Y.; Zhao, M.; Wang, J.; Zong, C. Performance and Gas Breakthrough during CO2 Immiscible Flooding in Ultra-Low Permeability Reservoirs. Pet. Explor. Dev. 2014, 41, 88–95. [Google Scholar] [CrossRef]
  29. Jadhawar, P.S. Co2-Assisted Gravity Drainage EOR: Numerical Simulation and Scaling Models Study. Ph.D. Thesis, The University of Adelaide, Adelaide, Australia, 2010. [Google Scholar]
  30. Enab, K.; Ertekin, T. Screening and Optimization of CO2-WAG Injection and Fish-Bone Well Structures in Low Permeability Reservoirs Using Artificial Neural Network-ScienceDirect. J. Pet. Sci. Eng. 2020, 200, 108268. [Google Scholar] [CrossRef]
  31. Lv, G.; Li, Q.; Wang, S.; Li, X. Key Techniques of Reservoir Engineering and Injection—Production Process for CO2 Flooding in China’s SINOPEC Shengli Oilfield. J. CO2 Util. 2015, 11, 31–40. [Google Scholar] [CrossRef]
  32. Wang, Y.; Shang, Q.; Zhou, L. Utilizing Macroscopic Areal Permeability Heterogeneity to Enhance the Effect of CO2 Flooding in Tight Sandstone Reservoirs in the Ordos Basin. J. Pet. Sci. Eng. 2021, 196, 107633. [Google Scholar] [CrossRef]
  33. Zhao, Y.; Song, Y.; Wang, T.; Liu, Y.; Jiang, L.; Zhu, N.; Yang, W. Visualisation of Water Flooding and Subsequent Supercritical CO2 Flooding in Fractured Porous Media with Permeability Heterogeneity Using MRI. Energy Procedia 2013, 37, 6942–6949. [Google Scholar] [CrossRef]
  34. Yu, B.; Zhang, X.; Du, M.; Ju, Y. Evaluation and Selection of CO2-Water Alternating Flooding Favorable Area Based on Flow-Units Analysis. Energy Procedia 2017, 114, 4557–4563. [Google Scholar] [CrossRef]
  35. Rabemanana, V.; Violette, S.; de Marsily, G.; Robain, H.; Deffontaines, B.; Andrieux, P.; Bensimon, M.; Parriaux, A. Origin of the High Variability of Water Mineral Content in the Bedrock Aquifers of Southern Madagascar. J. Hydrol. 2005, 310, 143–156. [Google Scholar] [CrossRef]
  36. Zhang, L.; Zhao, F.L.; Hou, J.R. Experimental Study of Improving the CO2 Flooding Development Effect in Ultra-Low Permeability Reservoir. Adv. Mater. Res. 2012, 594–597, 2470–2474. [Google Scholar] [CrossRef]
  37. Wei, J.; Anlun, W. Experimental and Simulation Investigations of Carbon Storage Associated with CO2 EOR in Low-Permeability Reservoir. Int. J. Greenh. Gas Control 2021, 104, 103203. [Google Scholar] [CrossRef]
  38. Jadhawar, P.S.; Sarma, H.K. Effect of Well Pattern and Injection Well Type on the CO2-Assisted Gravity Drainage Enhanced Oil Recovery. J. Pet. Sci. Eng. 2012, 98–99, 83–94. [Google Scholar] [CrossRef]
  39. Wang, C.; Liu, P.; Wang, F.; Atadurdyyev, B.; Ovluyagulyyev, M. Experimental Study on Effects of CO2 and Improving Oil Recovery for CO2 Assisted SAGD in Super-Heavy-Oil Reservoirs. J. Pet. Sci. Eng. 2018, 165, 1073–1080. [Google Scholar] [CrossRef]
  40. Shi, L.; Liu, P.; Shen, D.; Liu, P.; Xi, C.; Zhang, Y. Improving Heavy Oil Recovery Using a Top-Driving, CO2-Assisted Hot-Water Flooding Method in Deep and Pressure-Depleted Reservoirs. J. Pet. Sci. Eng. 2019, 173, 922–931. [Google Scholar] [CrossRef]
  41. Al-Obaidi, D.A.; Al-Mudhafar, W.J.; Al-Jawad, M.S. Experimental Evaluation of Carbon Dioxide-Assisted Gravity Drainage Process (CO2-AGD) to Improve Oil Recovery in Reservoirs with Strong Water Drive. Fuel 2022, 324, 124409. [Google Scholar] [CrossRef]
  42. Zheng, W.; Li, Z.; Huang, H.; Cao, X.; Wu, G.; Wang, J.; Kang, H. Evaluation and Improvement of CO2 Assisted Gravity Drainage for Enhanced Oil Production in China. Energy Rep. 2023, 10, 4465–4473. [Google Scholar] [CrossRef]
  43. Xiaolong, C.; Yiqiang, L.; Xiang, T.; Huan, Q.; Xuebing, S.; Jianghao, L. Effect of Gravity Segregation on CO2 Flooding under Various Pressure Conditions: Application to CO2 Sequestration and Oil Production. Energy 2021, 226, 120294. [Google Scholar] [CrossRef]
  44. Khan, M.Y.; Mandal, A. Improvement of Buckley-Leverett Equation and Its Solution for Gas Displacement with Viscous Fingering and Gravity Effects at Constant Pressure for Inclined Stratified Heterogeneous Reservoir. Fuel 2021, 285, 119172. [Google Scholar] [CrossRef]
  45. Al-Mudhafar, W.J.; Rao, D.N.; Srinivasan, S. Reservoir Sensitivity Analysis for Heterogeneity and Anisotropy Effects Quantification through the Cyclic CO2-Assisted Gravity Drainage EOR Process—A Case Study from South Rumaila Oil Field. Fuel 2018, 221, 455–468. [Google Scholar] [CrossRef]
  46. Khan, M.Y.; Mandal, A. Analytical Model for Gravity Segregation in WAG Displacement Recovery of Inclined Stratified Reservoirs. J. Pet. Sci. Eng. 2020, 186, 106722. [Google Scholar] [CrossRef]
  47. Li, Q.; Li, Q.; Wang, F.; Wu, J.; Wang, Y. The Carrying Behavior of Water-Based Fracturing Fluid in Shale Reservoir Fractures and Molecular Dynamics of Sand-Carrying Mechanism. Processes 2024, 12, 2051. [Google Scholar] [CrossRef]
  48. Li, Q.; Li, Q.; Han, Y. A Numerical Investigation on Kick Control with the Displacement Kill Method during a Well Test in a Deep-Water Gas Reservoir: A Case Study. Processes 2024, 12, 2090. [Google Scholar] [CrossRef]
Figure 1. Core cross-section physical diagram.
Energies 17 05608 g001
Figure 2. Flowchart of CO2 and water displacement experiments.
Energies 17 05608 g002
Figure 3. Original image and cropped results of low-permeability inhomogeneous model.
Energies 17 05608 g003
Figure 4. Diagram of different injection modes and injection speeds.
Energies 17 05608 g004
Figure 5. Comparison of recovery degree and resistance factor at two injection flow rates (the experimental temperature is 150 °C, and the experimental minimum pressure is 40 MPa).
Energies 17 05608 g005
Figure 6. Comparison of recovery degree and resistance factors of WAG in inhomogeneous cores of different lengths.
Energies 17 05608 g006
Figure 7. Comparison of T2 maps after displacement at different injection rates.
Energies 17 05608 g007
Figure 8. Comparison diagram of post-displacement pore throat utilization at different injection rates.
Energies 17 05608 g008
Figure 9. Comparison of the final displacement results of low-in/low-out and low-in/high-out with the reverse rhythm model (where ‘injection’ is the injection end and ‘extraction’ is the production end; ‘180 s/180 μm’ is the injection time/volume; ‘reverse/low-in/low-out 1 μm/s’ is the model and injection method; the blue part of the picture is CO2; the red part is crude oil; and the colored part is the oil–gas transition zone).
Energies 17 05608 g009
Figure 10. Comparison of the final displacement results of low-in/high-out and high-in/high out with the positive rhythm model.
Energies 17 05608 g010
Figure 11. Comparison of the final displacement results of same-in/same-out with the positive and reverse rhythm model.
Energies 17 05608 g011
Figure 12. When 180 μm is injected, the final displacement state diagram of the positive rhythm and reverse rhythm same-in/same-out models can be obtained (The difference in oil and gas distribution in yellow borders in the figure reflects the effect of gravity.).
Energies 17 05608 g012
Figure 13. Comparison of overall and low-permeability layers with positive and reverse rhythm models at different injection rates.
Energies 17 05608 g013
Figure 14. Low-permeability layer and overall recovery degree of each injection method in reverse rhythm (“1” refers to the ”reverse low-speed groups”, “2” refers to the ”reverse high-speed groups”. the red box represents the grouping situation).
Energies 17 05608 g014
Figure 15. Reverse-rhythm low-speed group gas flow pattern diagram (“1” refers to the ”reverse low-speed groups”).
Energies 17 05608 g015
Figure 16. Reverse-rhythm high-speed group gas flow pattern diagram ( “2” refers to the ”reverse high-speed groups”).
Energies 17 05608 g016
Figure 17. Low-permeability layer and overall recovery degree of each injection method in positive rhythm (“1” refers to the ”category 1”, “2” refers to the ”category 2” “3” refers to the ”category 3” “4” refers to the ”category 4”, the red box represents the grouping situation).
Energies 17 05608 g017
Figure 18. Category 1 gas flow pattern diagram (The green arrow in the figure represents the direction of CO2 flow).
Energies 17 05608 g018
Figure 19. Category 3 gas flow pattern diagram.
Energies 17 05608 g019
Figure 20. Category 2 and Category 4 gas flow pattern diagrams.
Energies 17 05608 g020
Table 1. Ionic species and concentration of experimental water.
Ionic SpeciesK+ & Na+Mg2+Ca2+ClSO42−HCO3CO32−
Ionic Concentration
mg/L
2704.3011.8768.49880.5020.454690.9468.49
Total Mineralization8912.08 mg/L
Table 2. Overall stage recovery degree using 12 injection–production methods.
Inject Method/Inject Volume/Recovery Degree30 μm60 μm90 μm120 μm150 μm180 μm
reverse/low-in/low-out 1 μm/s9.27%24.00%34.97%47.28%56.58%57.01%
reverse/low-in/low-out 10 μm/s12.32%24.95%36.26%36.77%36.93%37.54%
reverse/low-in/high-out 1 μm/s13.40%26.01%39.15%51.76%54.38%55.66%
reverse/low-in/high-out 10 μm/s14.38%26.44%40.66%40.82%41.70%41.77%
reverse/same-in/same-out 0.5 μm/s21.86%33.51%46.75%53.13%53.27%53.95%
reverse/same-in/same-out 5 μm/s21.47%35.74%47.08%48.37%48.80%48.95%
positive/low-in/high-out 1 μm/s13.23%24.29%36.66%49.96%51.81%52.13%
positive/low-in/high-out 10 μm/s14.84%28.98%43.52%46.46%47.07%47.29%
positive/high-in/high-out 1 μm/s22.78%43.68%49.70%49.75%50.41%50.54%
positive/high-in/high-out 10 μm/s20.51%38.10%38.44%38.74%38.89%39.58%
positive/same-in/same-out 0.5 μm/s17.85%35.21%53.27%54.94%57.06%57.93%
positive/same-in/same-out 5 μm/s19.72%37.89%42.00%42.13%42.21%42.08%
Table 3. Low-permeability layer recovery degree using 12 injection–production methods.
Inject Method/Inject Volume/Recovery Degree30 μm60 μm90 μm120 μm150 μm180 μm
reverse/low-in/low-out 1 μm/s14.43%15.20%22.24%24.44%25.78%26.68%
reverse/low-in/low-out 10 μm/s7.62%12.00%13.04%13.19%13.22%15.04%
reverse/low-in/high-out 1 μm/s13.41%17.35%19.52%22.68%22.92%26.11%
reverse/low-in/high-out 10 μm/s8.73%11.02%12.24%13.95%13.96%14.07%
reverse/same-in/same-out 0.5 μm/s7.22%8.95%10.15%14.06%17.94%21.70%
reverse/same-in/same-out 5 μm/s5.34%5.68%6.39%7.31%11.01%12.80%
positive/low-in/high-out 1 μm/s19.49%42.21%69.94%81.87%88.81%89.58%
positive/low-in/high-out 10 μm/s14.49%18.09%20.42%20.51%20.75%22.18%
positive/high-in/high-out 1 μm/s11.92%24.98%29.24%29.54%30.52%30.97%
positive/high-in/high-out 10 μm/s1.34%2.03%3.01%3.28%3.82%3.90%
positive/same-in/same-out 0.5 μm/s21.63%33.20%48.00%51.52%61.08%62.27%
positive/same-in/same-out 5 μm/s13.50%14.87%16.26%18.32%20.38%20.71%
Disclaimer/Publisher’s Note: The statements, opinions and data contained in all publications are solely those of the individual author(s) and contributor(s) and not of MDPI and/or the editor(s). MDPI and/or the editor(s) disclaim responsibility for any injury to people or property resulting from any ideas, methods, instructions or products referred to in the content.

