
Low-Carbon Dispatch Method for Active Distribution Network Based on Carbon Emission Flow Theory


Abstract
1. Introduction
- (1)
- Based on the CEF theory, the dynamic carbon emission intensity calculation model of gas units, energy storage equipment, and a lossy ADN is established to realize the carbon emission measurement of each link. On this basis, a low-carbon dispatch model is proposed for distributed sustainable energy access scenarios, taking into account operational safety and low-carbon benefits.
- (2)
- The ADN low-carbon dispatch problem is modeled as a Markov decision-making process, which takes into account the uncertainties caused by carbon emission intensity changes in the main network, load changes, and changes in distributed sustainable energy generation, and improves the SAC algorithm of deep reinforcement learning by adopting a Gaussian distribution reward function sampling strategy, which effectively improves the stability of the training process of the intelligence and the algorithm performance.
2. Distributed Power Modeling for ADNs
2.1. Gas Unit Model
2.2. Energy Storage Equipment Model
3. Carbon Emission Flow Theory for ADNs
3.1. Calculation of Carbon Emission Distribution in ADNs
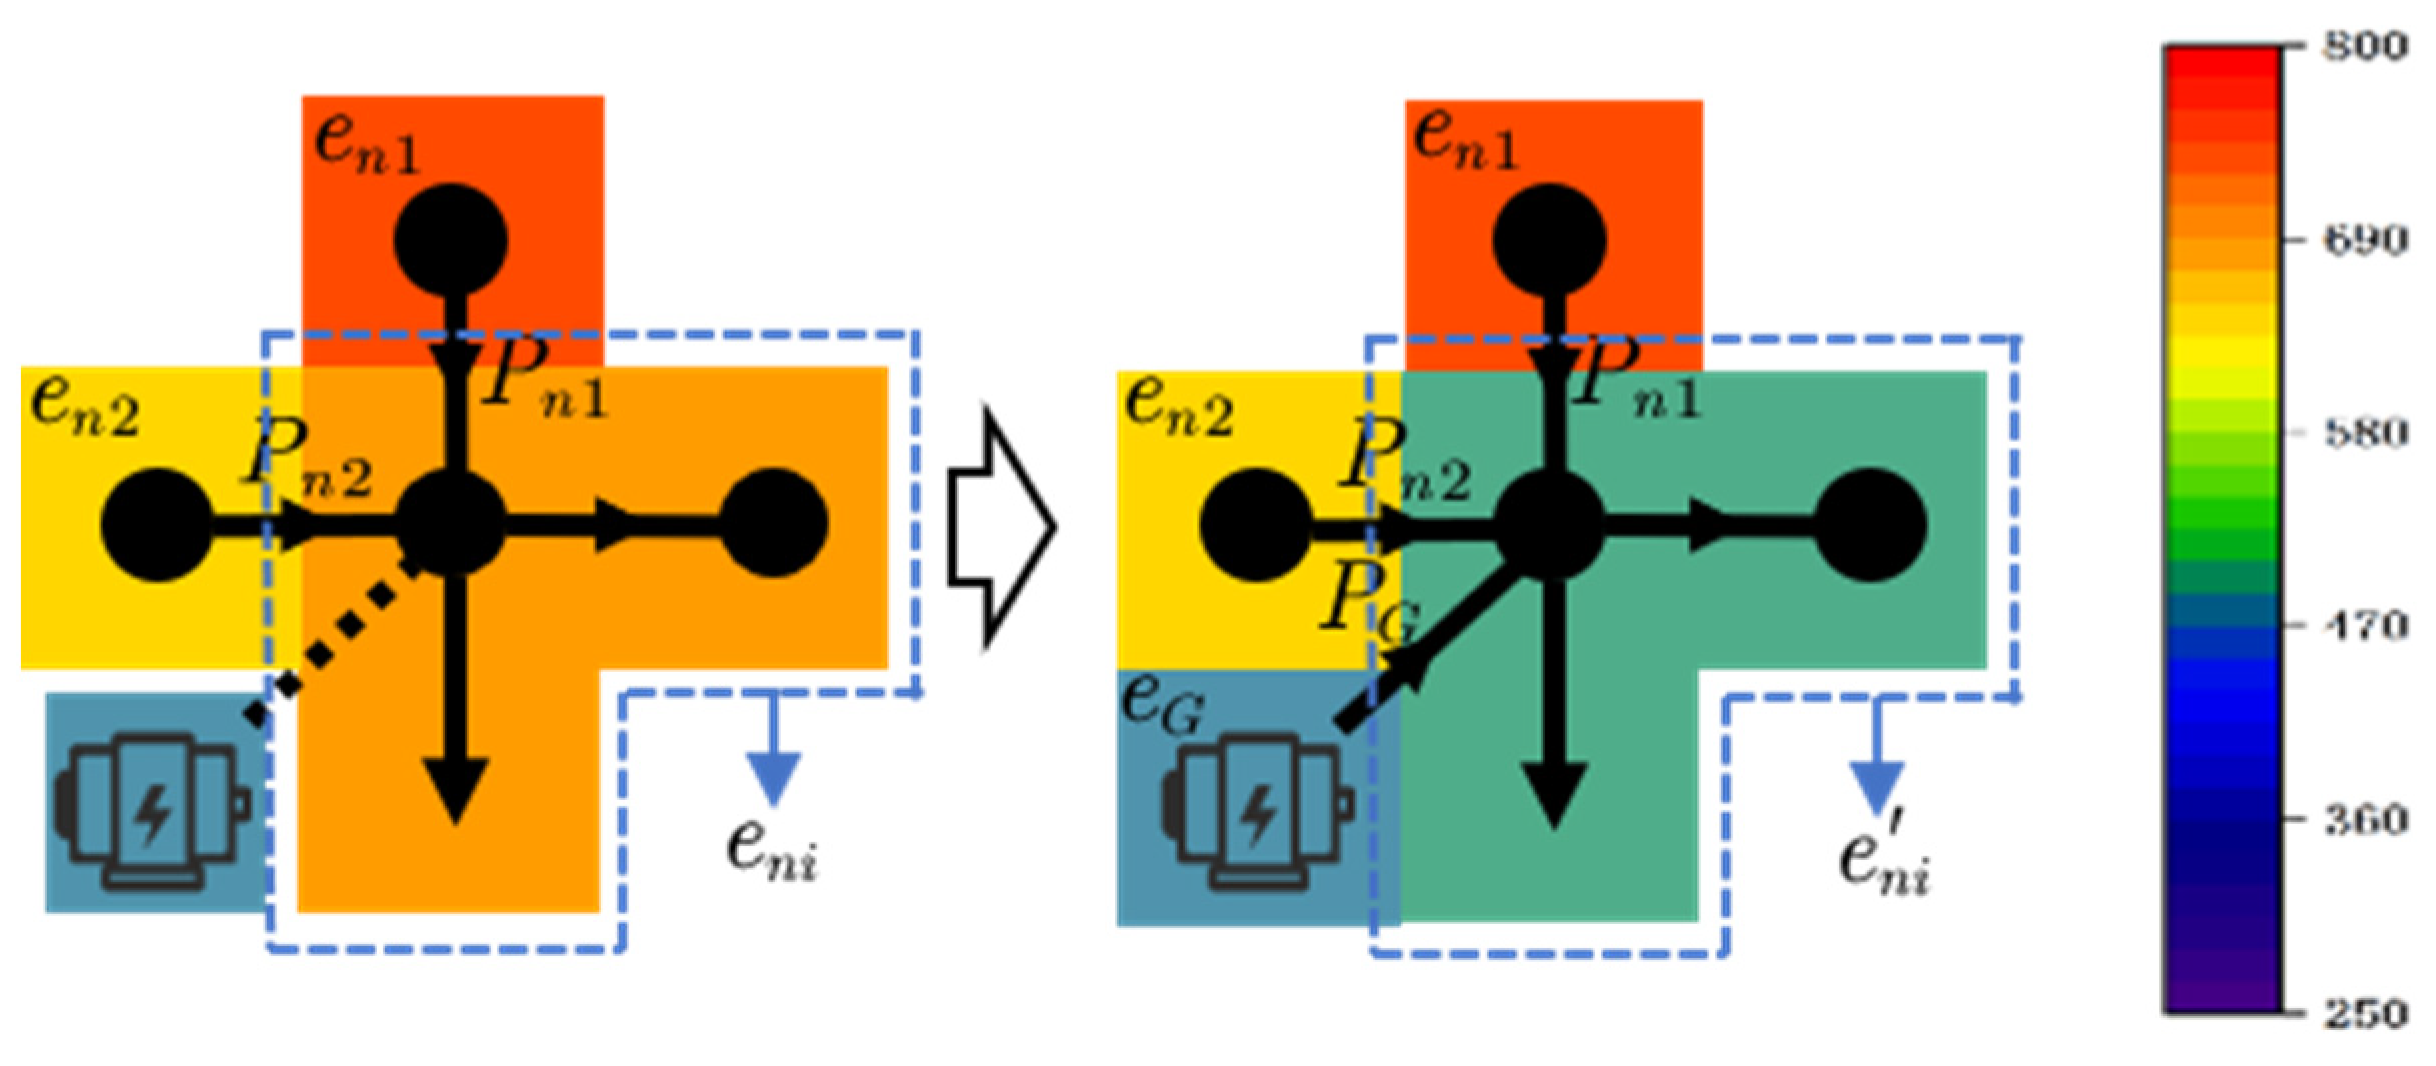
3.2. Dynamic Effects of Distributed Power Sources on Nodal Carbon Potentials
4. Low-Carbon Dispatch Model for ADN
4.1. The Objective Function
4.2. The Constraints
- (1)
- Power flow constraintswhere Pi(t) and Qi(t) denote the active and reactive power of node i at time t, respectively; Ui(t) and Uj(t) represent the voltage values of node i and node j at time t, respectively; Gi,j(t) and Bi,j(t) denote the conductance and conductance of node i and j, respectively; and θi,j(t) denotes the phase angle difference of node i and j.
- (2)
- Security constraintswhere and are the node voltage upper and voltage lower limits; (t) is the line i-j current squared; (t) is the thermal capacity limit of the line; Pi,j(t) and Qi,j(t) denote the active and reactive power of line i-j; and denote the maximum power limit of the line.
- (3)
- Stabilization constraintsNodal voltage deviation is an important indicator of power quality in distribution networks [28]. We define the maximum deviation voltage ratio in distribution networks aswhere Ui(t) denotes the voltage value of node i at time t; Ui,ref is the reference voltage value of node i. In order to ensure the voltage stability of the distribution network, the voltage deviation needs to be constrained within the ideal range:
- (4)
- Unit operating constraintsThe operation of gas-fired generating units and energy storage devices satisfies the operational constraints of Equations (1)–(5) in Section 1.
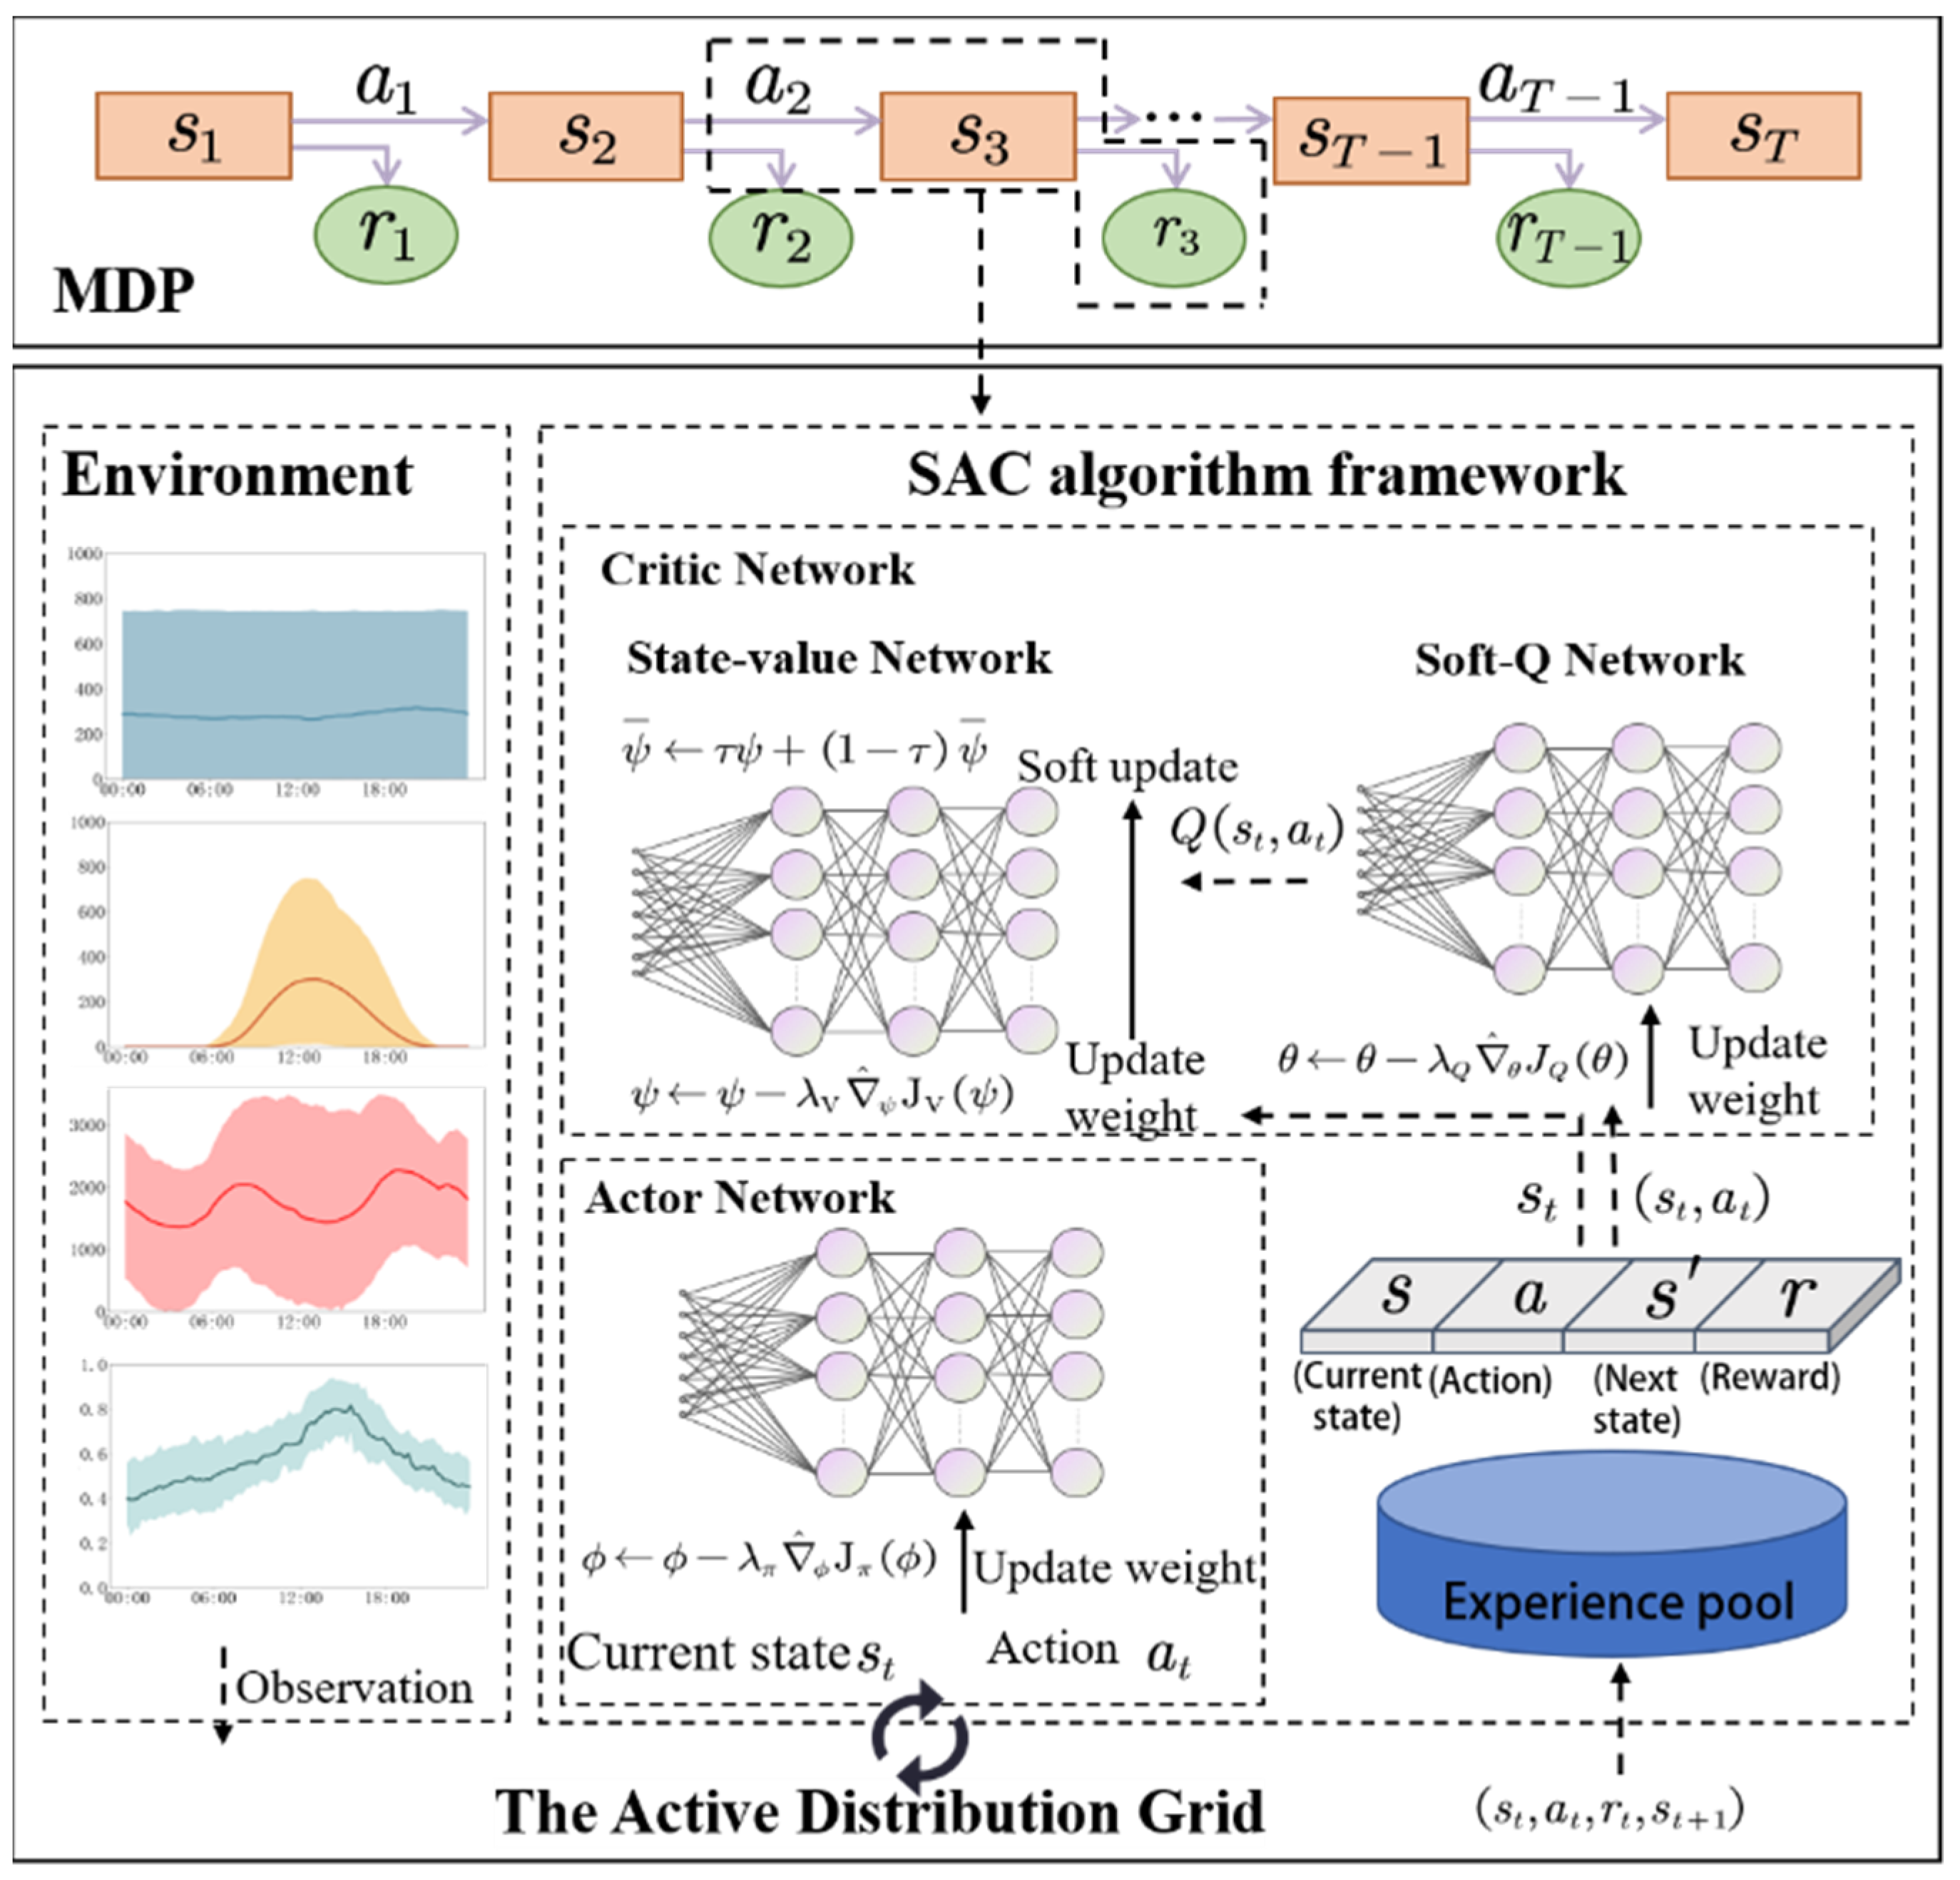
5. Solving Low-Carbon Dispatch Model for ADN Based on Improved SAC
5.1. Markov Decision Process Framework
- (1)
- is the state space that supports all gas units and energy storage devices in the distribution network to make action decisions. The variables in the state space are all continuous values.
- (2)
- is the action space. During the time period t, the intelligent body outputs the optimal action according to the environmental changes. The action at contains the unit output and the operating status of the energy storage device:where (t) denotes the active power of KM gas units at moment t and (t) denotes the charging power or discharging power of M energy storage devices.
- (3)
- p is the state transfer probability, which denotes the probability density of the current state st to move to the next state st+1 under action at. The transition process from st to st+1 can be expressed aswhere (t) and (t) are the action values in the current state and wt denotes the environmental randomness.
- (4)
- r denotes the reward returned from the environment for taking action at during each round of state transfer:where ET(t) is the single-step carbon emission cost during the dispatch cycle.
5.2. Improvement of Soft Actor–Critic Algorithm
- (1)
- Actor Network
- (2)
- Critic Networks
| Algorithm 1 Solving dispatch model based on improved SAC |
| 1: Initialize: |
| Policy network πϕ |
| Two Q networks and . |
| Target Q networks and . |
| Replay buffer . |
| 2: for each environment step do: |
| 3: Sample action at∼πϕ(⋅∣st) from the policy at state st. |
| 4: Execute action at, receive reward and next state st+1. |
| 5: Store transition (st, at, , st+1) in . |
| end for |
| 6: for each update step do: |
| 7: Randomly sample a batch of transitions (st, at, , st+1) from . |
| 8: Compute target value according to Equation (37). |
| 9: Update critic networks according to Equation (38): |
| 10: Update policy network according to Equation (35): |
| 11: Adjust temperature parameter α according to Equation (36): |
| 12: Update target Q networks: |
| end for |
| 13: Output: Learned policy network parameters |
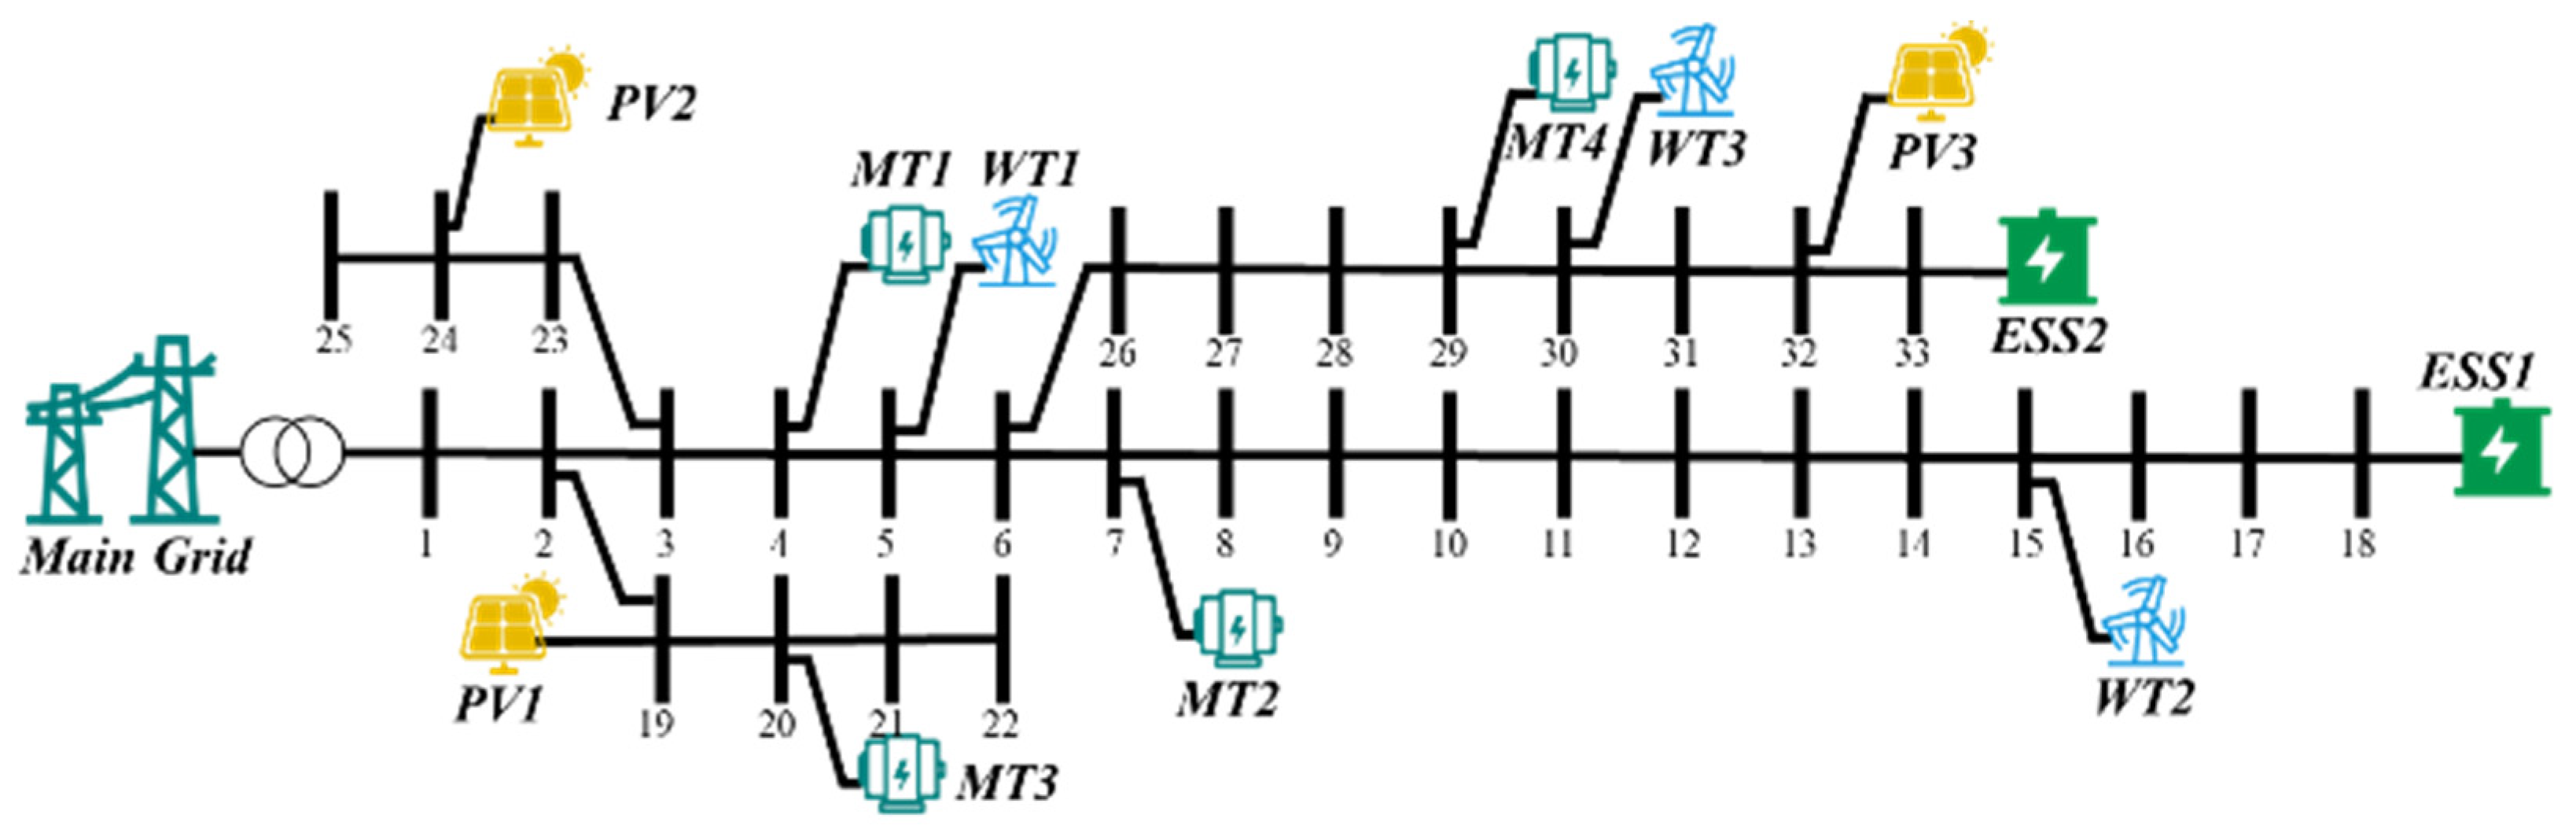
6. Case Simulation
6.1. Experimental Configuration
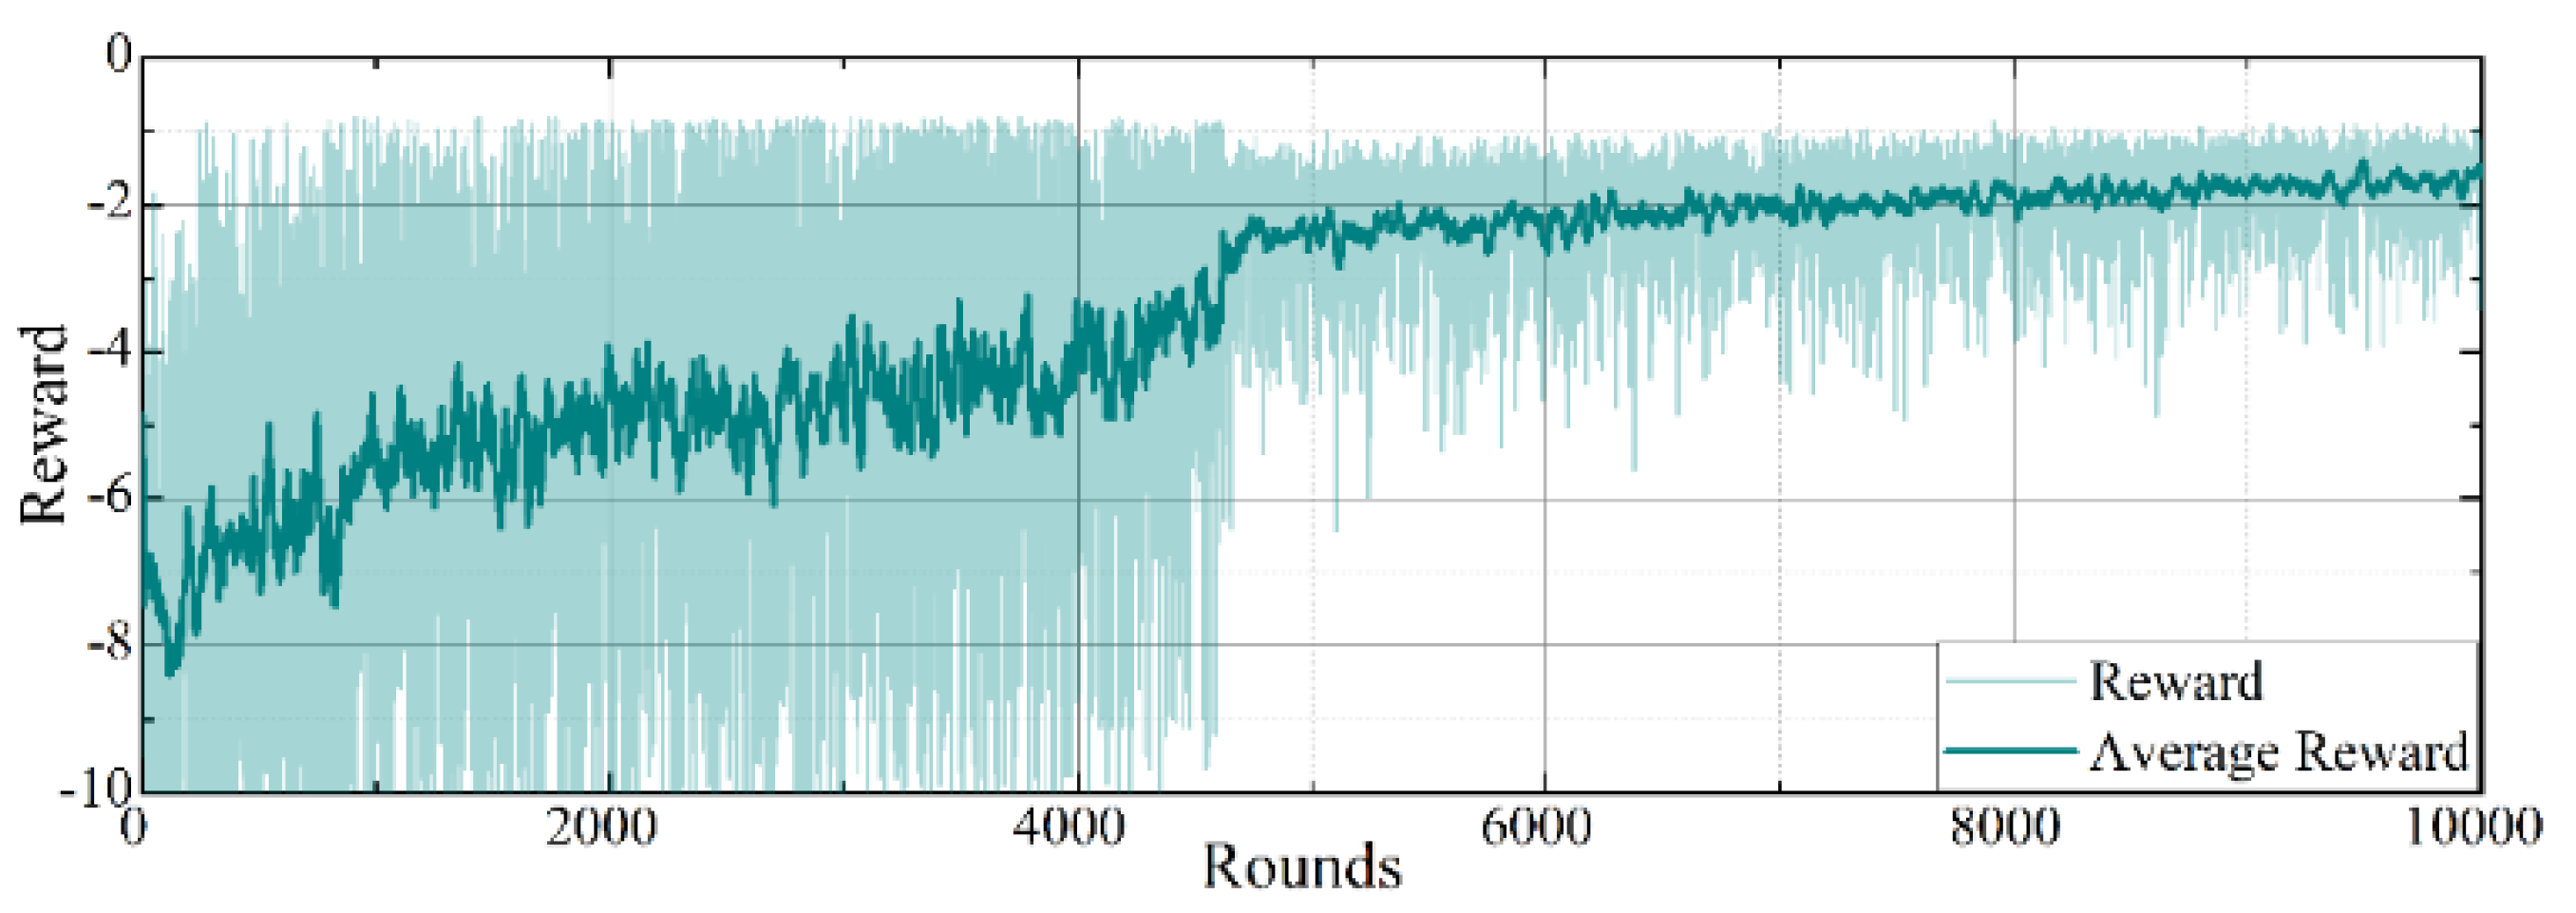
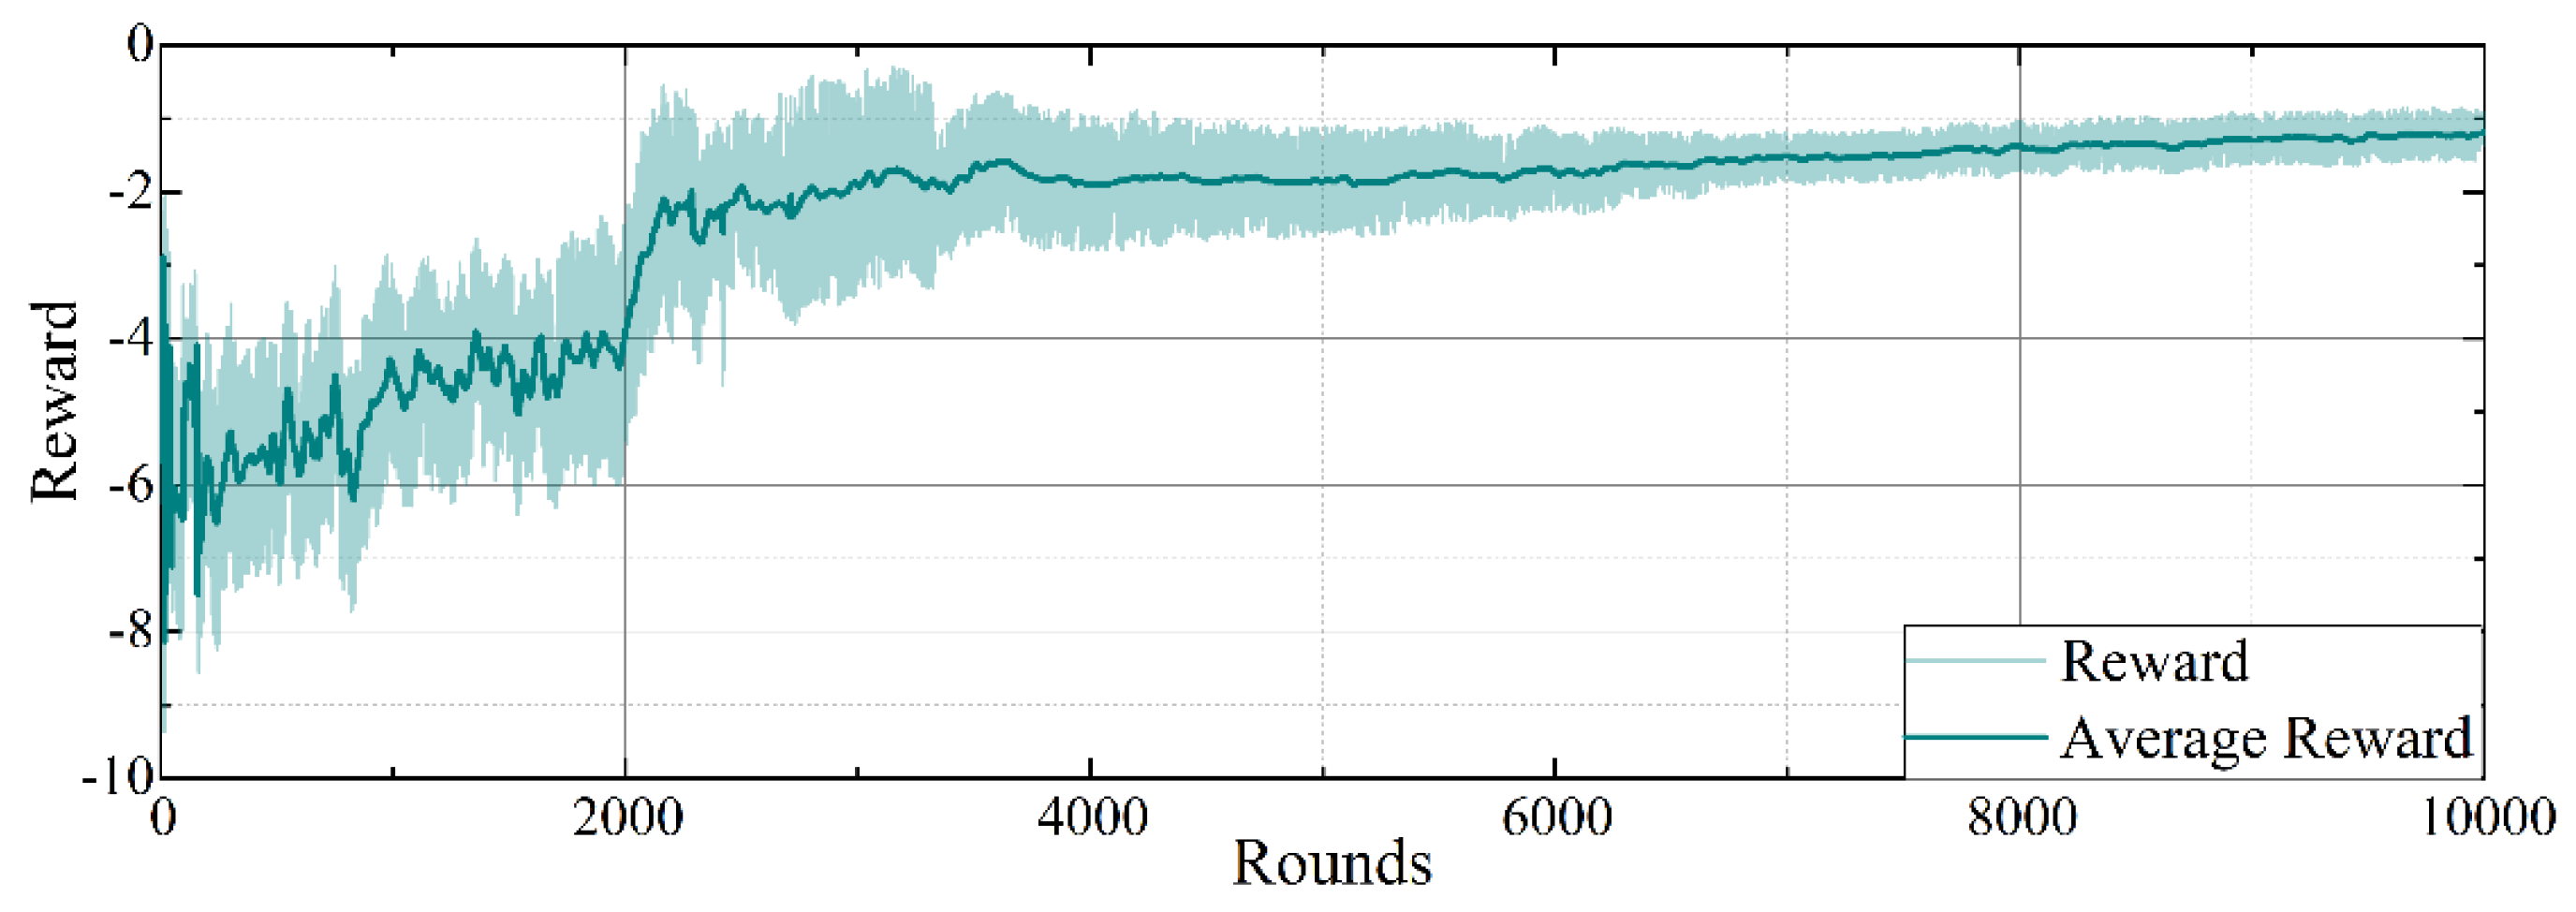
6.2. Evaluation of the Training Process
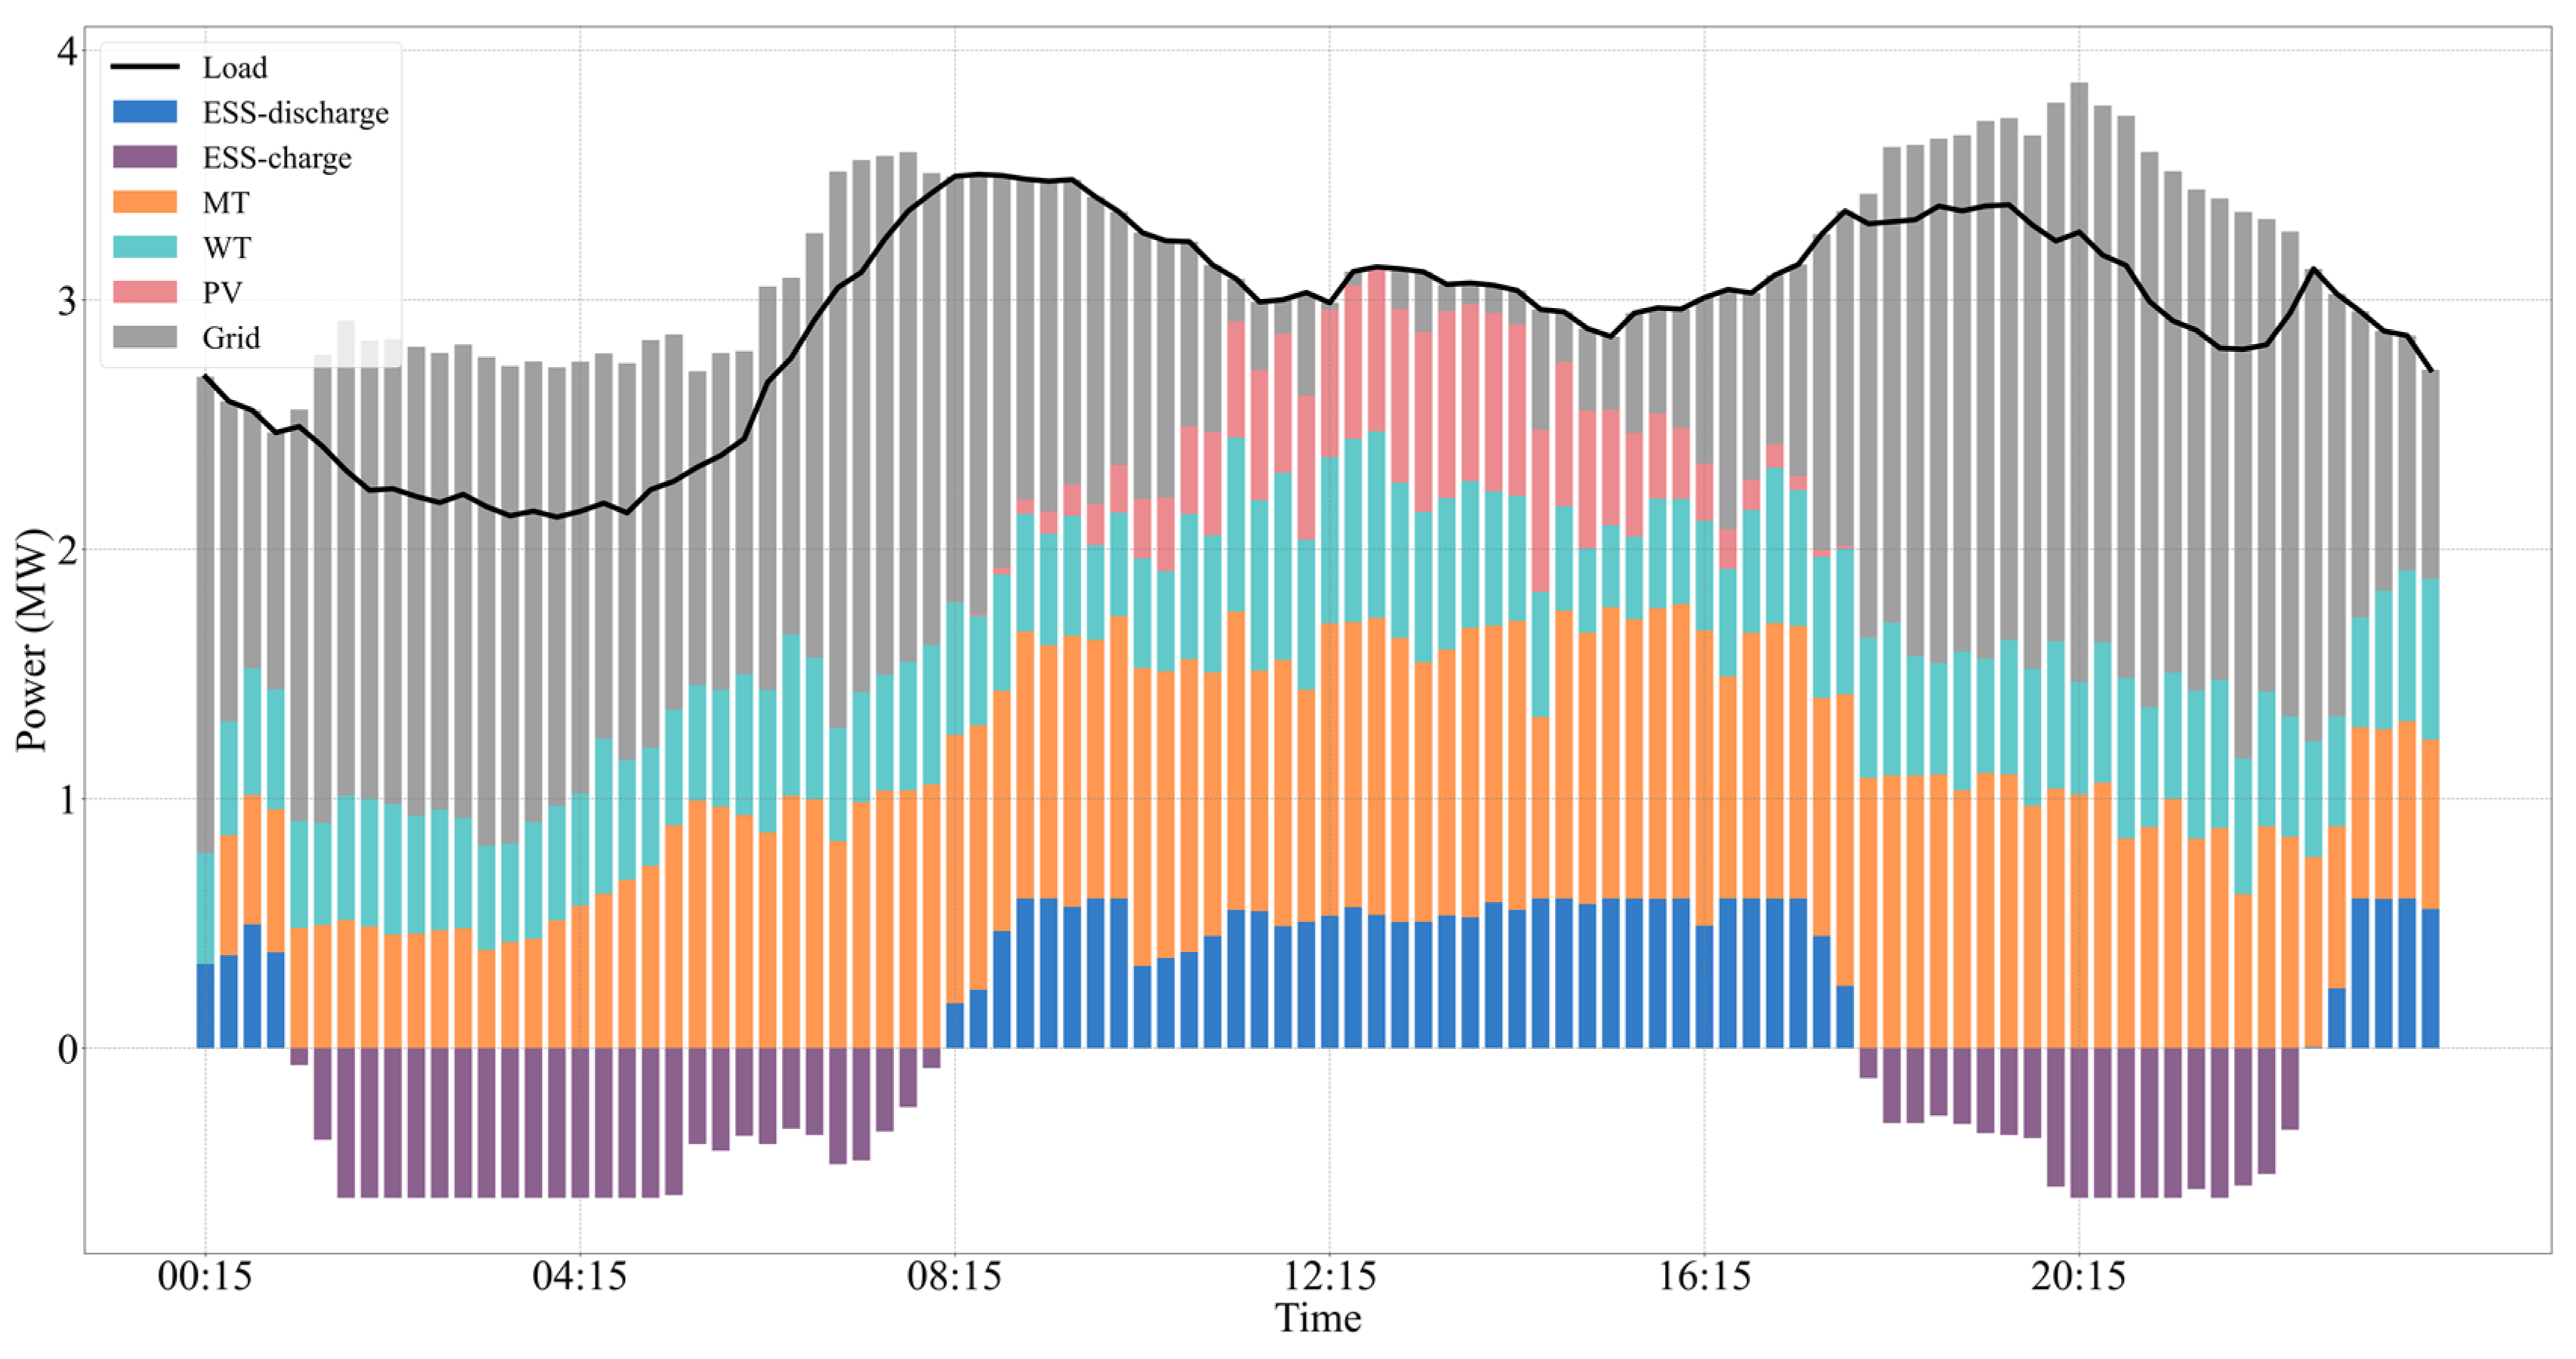
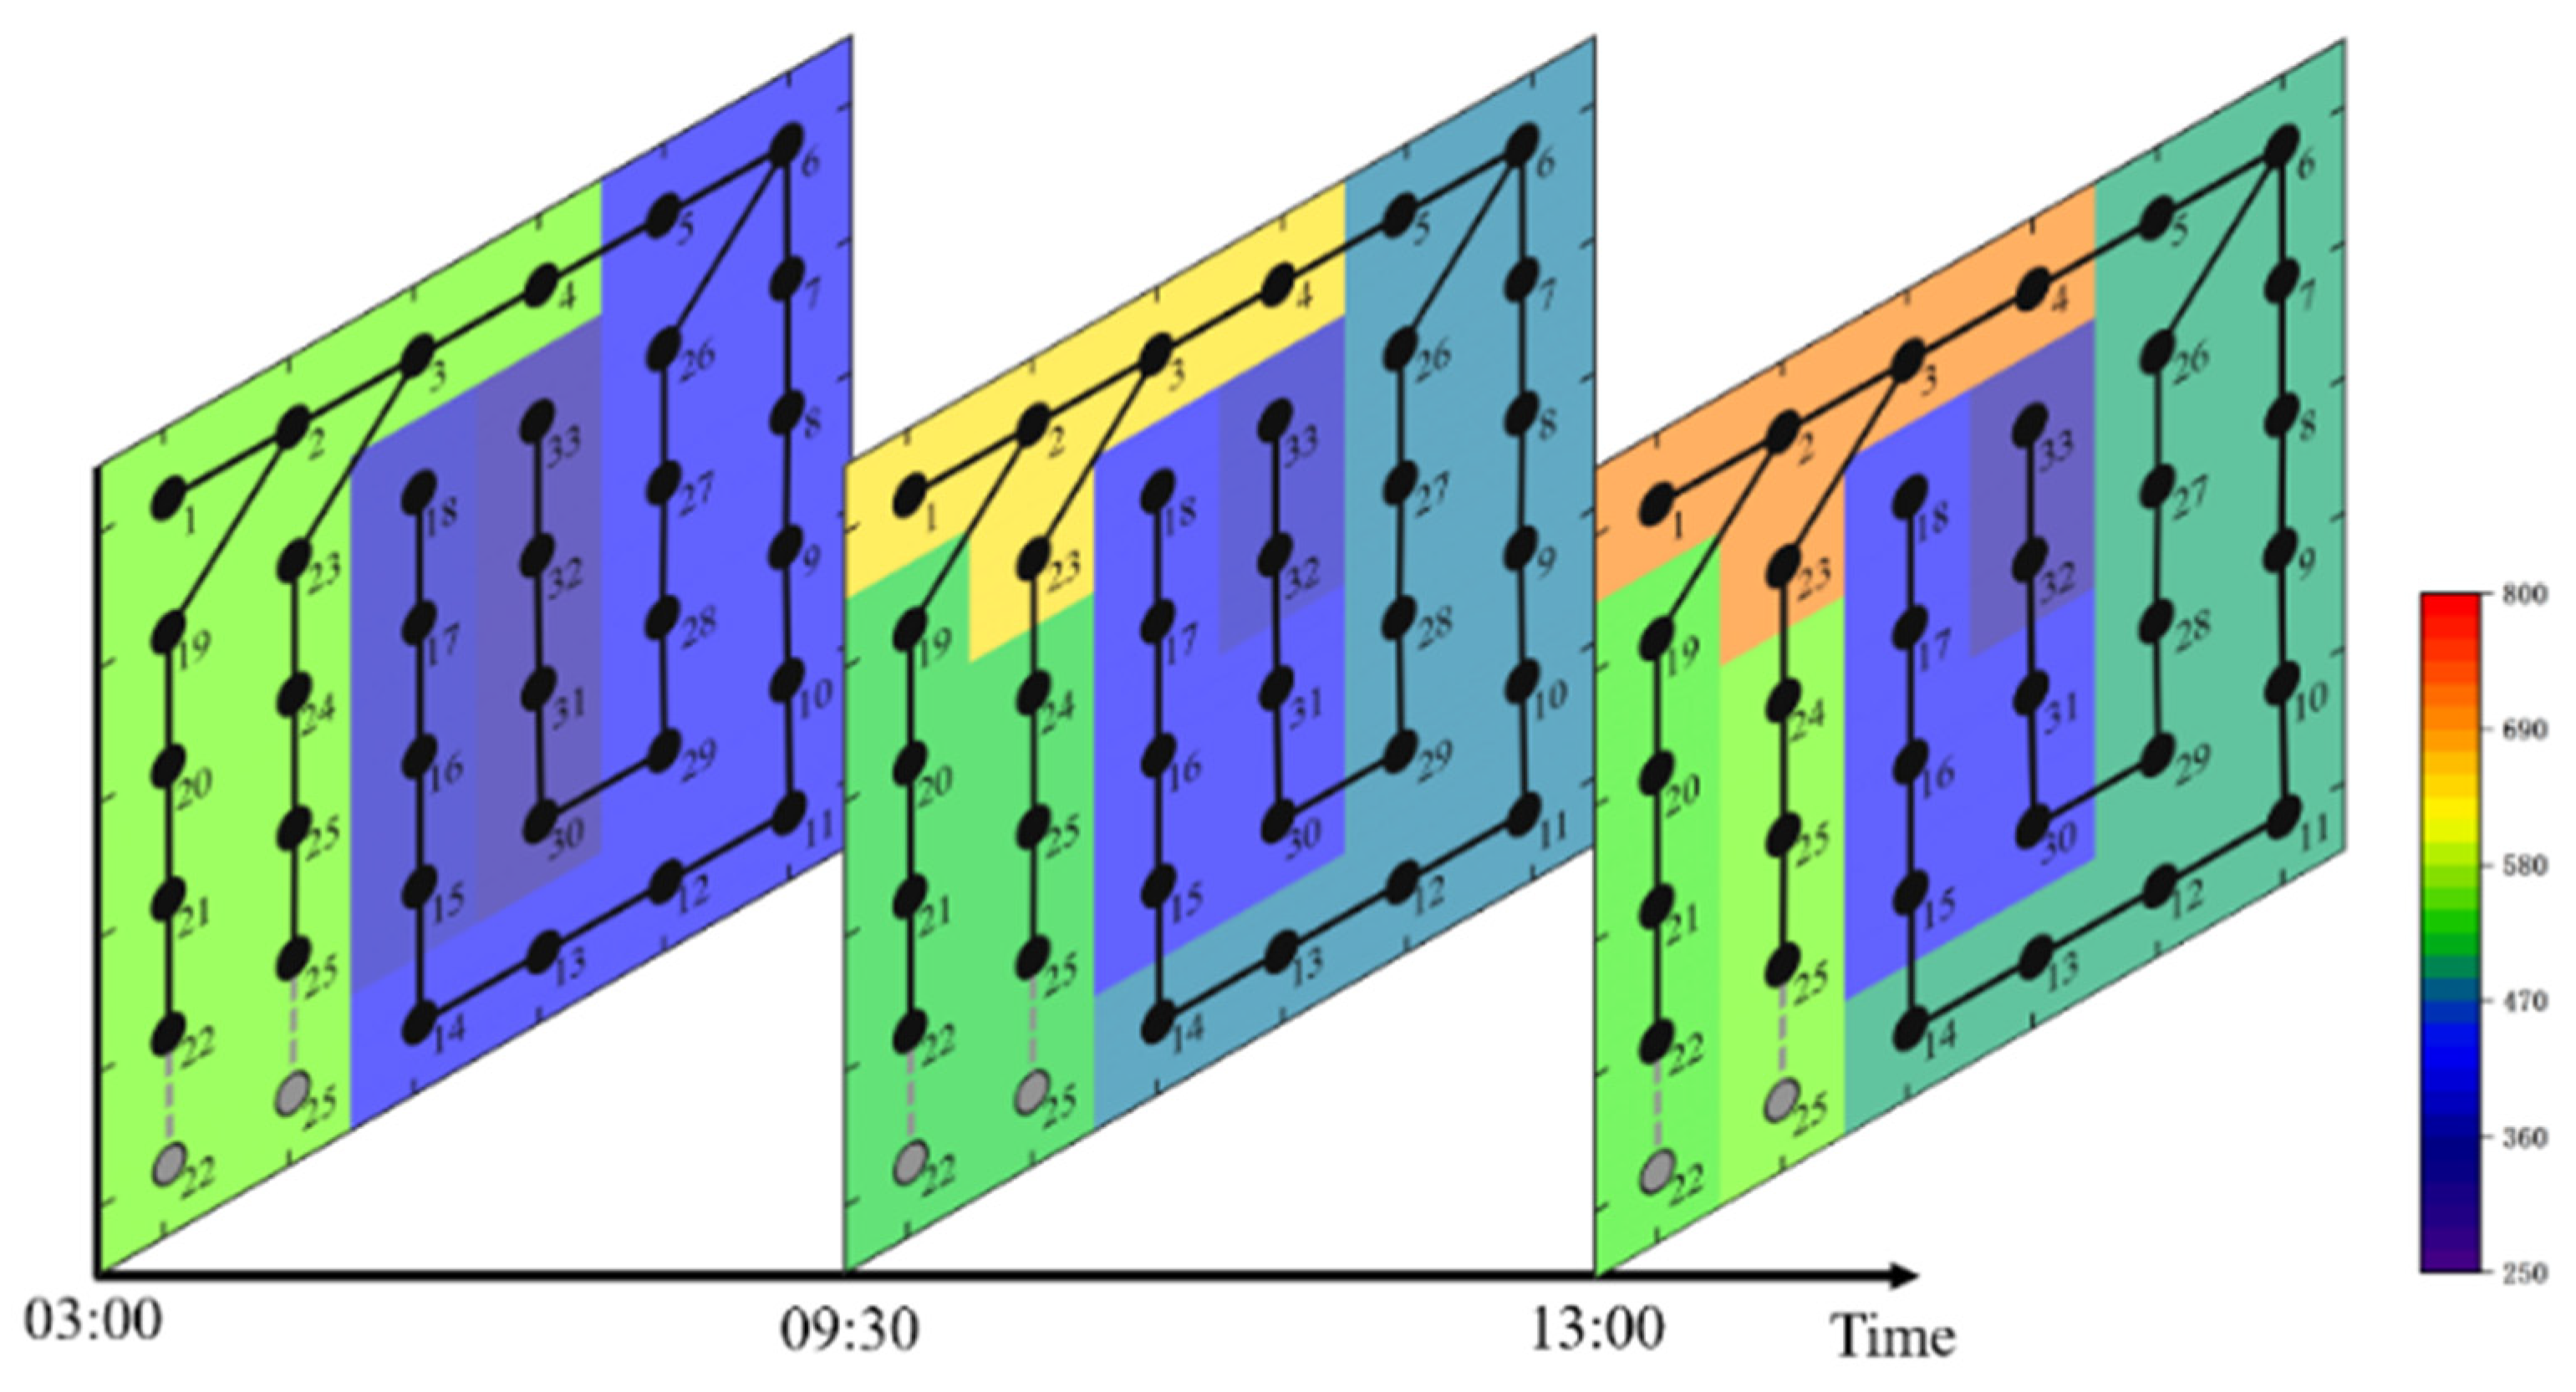
6.3. Scheduling Result Performance
6.4. Comparison of Model-Solving Algorithms
7. Conclusions
Author Contributions
Funding
Data Availability Statement
Conflicts of Interest
References
- Nakhli, M.S.; Shahbaz, M.; Jebli, M.B.; Wang, S. Nexus between economic policy uncertainty, renewable & non-renewable energy and carbon emissions: Contextual evidence in carbon neutrality dream of USA. Renew. Energy 2022, 185, 75–85. [Google Scholar]
- Scarlat, N.; Prussi, M.; Padella, M. Quantification of the carbon intensity of electricity produced and used in Europe. Appl. Energy 2022, 305, 117901. [Google Scholar] [CrossRef]
- Zhao, G.; Yu, B.; An, R.; Wu, Y.; Zhao, Z. Energy system transformations and carbon emission mitigation for China to achieve global 2 C climate target. J. Environ. Manag. 2021, 292, 112721. [Google Scholar] [CrossRef] [PubMed]
- Chilvers, J.; Bellamy, R.; Pallett, H.; Hargreaves, T. A systemic approach to mapping participation with low-carbon energy transitions. Nat. Energy 2021, 6, 250–259. [Google Scholar] [CrossRef]
- Gu, C.; Liu, Y.; Wang, J.; Li, Q.; Wu, L. Carbon-oriented planning of distributed generation and energy storage assets in power distribution network with hydrogen-based microgrids. IEEE Trans. Sustain. Energy 2022, 14, 790–802. [Google Scholar] [CrossRef]
- Xu, W.; Yu, B.; Song, Q.; Weng, L.; Luo, M.; Zhang, F. Economic and low-carbon-oriented distribution network planning considering the uncertainties of photovoltaic generation and load demand to achieve their reliability. Energies 2022, 15, 9639. [Google Scholar] [CrossRef]
- Chen, S.; Liu, Y.; Guo, Z.; Luo, H.; Zhou, Y.; Qiu, Y.; Zhou, B.; Zang, T. Deep reinforcement learning based research on low-carbon scheduling with distribution network schedulable resources. IET Gener. Transm. Distrib. 2023, 17, 2289–2300. [Google Scholar] [CrossRef]
- Qing, Y.; Liu, T.; He, C.; Nan, L.; Dong, G.; Gao, W.; Yu, Y. Low-carbon coordinated scheduling of integrated electricity-gas distribution system with hybrid AC/DC network. IET Renew. Power Gener. 2022, 16, 2566–2578. [Google Scholar] [CrossRef]
- Chen, L.; Zhou, Y. Low carbon economic scheduling of residential distribution network based on multi-dimensional network integration. Energy Rep. 2023, 9, 438–448. [Google Scholar] [CrossRef]
- Li, B.; Song, Y.; Hu, Z. Carbon flow tracing method for assessment of demand side carbon emissions obligation. IEEE Trans. Sustain. Energy 2013, 4, 1100–1107. [Google Scholar] [CrossRef]
- Kang, C.; Zhou, T.; Chen, Q.; Xu, Q.; Xia, Q.; Ji, Z. Carbon emission flow in networks. Sci. Rep. 2012, 2, 479. [Google Scholar] [CrossRef] [PubMed]
- Kang, C.; Zhou, T.; Chen, Q.; Wang, J.; Sun, Y.; Xia, Q.; Yan, H. Carbon emission flow from generation to demand: A network-based model. IEEE Trans. Smart Grid 2015, 6, 2386–2394. [Google Scholar] [CrossRef]
- Notton, G.; Nivet, M.L.; Voyant, C.; Paoli, C.; Darras, C.; Motte, F.; Fouilloy, A. Intermittent and stochastic character of renewable energy sources: Consequences, cost of intermittence and benefit of forecasting. Renew. Sustain. Energy Rev. 2018, 87, 96–105. [Google Scholar] [CrossRef]
- Notton, G.; Nivet, M.L.; Voyant, C.; Paoli, C.; Darras, C.; Motte, F.; Fouilloy, A. Enhancing smart grid integrated renewable distributed generation capacities: Implications for sustainable energy transformation. Sustain. Energy Technol. Assess. 2024, 66, 103793. [Google Scholar]
- Dashtaki, A.A.; Hakimi, S.M.; Hasankhani, A.; Derakhshani, G.; Abdi, B. Optimal management algorithm of microgrid connected to the distribution network considering renewable energy system uncertainties. Int. J. Electr. Power Energy Syst. 2023, 145, 108633. [Google Scholar] [CrossRef]
- Zhao, C.; Qin, X.; Wang, A.; Song, R.; Zhou, W.; Sun, Z. Design of photovoltaic-energy storage-load forecasting and optimal control method for distributed distribution network based on reinforcement learning. In Proceedings of the Ninth International Conference on Energy Materials and Electrical Engineering (ICEMEE 2023), Guilin, China, 25–27 August 2023; SPIE: Bellingham, WA, USA, 2024; Volume 12979, pp. 902–907. [Google Scholar]
- Zhang, X.; Wu, Z.; Sun, Q.; Gu, W.; Zheng, S.; Zhao, J. Application and progress of artificial intelligence technology in the field of distribution network voltage Control: A review. Renew. Sustain. Energy Rev. 2024, 192, 114282. [Google Scholar] [CrossRef]
- Yang, T.; Zhao, L.Y.; Liu, Y.; Feng, S.; Pen, H. Dynamic Economic Dispatch for Integrated Energy System Based on Deep Reinforcement Learning. Autom. Electr. Power Syst. 2021, 45, 39–47. (In Chinese) [Google Scholar]
- Li, Y. Deep reinforcement learning: An overview. arXiv 2017, arXiv:1701.07274. [Google Scholar]
- Cao, D.; Hu, W.; Xu, X.; Wu, Q.; Huang, Q.; Chen, Z.; Blaabjerg, F. Deep reinforcement learning based approach for optimal power flow of distribution networks embedded with renewable energy and storage devices. J. Mod. Power Syst. Clean Energy 2021, 9, 1101–1110. [Google Scholar] [CrossRef]
- Hosseini, M.M.; Parvania, M. On the feasibility guarantees of deep reinforcement learning solutions for distribution system operation. IEEE Trans. Smart Grid 2023, 14, 954–964. [Google Scholar] [CrossRef]
- Xing, Q.; Chen, Z.; Zhang, T.; Li, X.; Sun, K. Real-time optimal scheduling for active distribution networks: A graph reinforcement learning method. Int. J. Electr. Power Energy Syst. 2023, 145, 108637. [Google Scholar] [CrossRef]
- Lu, Y.; Xiang, Y.; Huang, Y.; Yu, B.; Weng, L.; Liu, J. Deep reinforcement learning based optimal scheduling of active distribution system considering distributed generation, energy storage and flexible load. Energy 2023, 271, 127087. [Google Scholar] [CrossRef]
- Xu, D.; Wu, Q.; Zhou, B.; Li, C.; Bai, L.; Huang, S. Distributed Multi-Energy Operation of Coupled Electricity, Heating, and Natural Gas Networks. IEEE Trans. Sustain. Energy 2019, 11, 2457–2469. [Google Scholar] [CrossRef]
- Ibrahim, H.; Ilinca, A.; Perron, J. Energy storage systems—Characteristics and comparisons. Renew. Sustain. Energy Rev. 2008, 12, 1221–1250. [Google Scholar] [CrossRef]
- Zhou, T.; Kang, C.; Xu, Q.; Chen, Q. Preliminary Investigation on a Method for Carbon Emission Flow Calculation of Power System. Autom. Electr. Power Syst. 2012, 36, 44–49. (In Chinese) [Google Scholar]
- Shirmohammadi, D.; Hong, H.W. Reconfiguration of electric distribution networks for resistive line losses reduction. IEEE Trans. Power Deliv. 1989, 4, 1492–1498. [Google Scholar] [CrossRef]
- Gupta, N.; Swarnkar, A.; Niazi, K.R. Distribution network reconfiguration for power quality and reliability improvement using Genetic Algorithms. Int. J. Electr. Power Energy Syst. 2014, 54, 664–671. [Google Scholar] [CrossRef]
- Haarnoja, T.; Zhou, A.; Hartikainen, K.; Tucker, G.; Ha, S.; Tan, J.; Kumar, V.; Zhu, H.; Gupta, A.; Abbeel, P.; et al. Soft actor-critic algorithms and applications. arXiv 2018, arXiv:1812.05905. [Google Scholar]
- Silver, D.; Lever, G.; Heess, N.; Degris, T.; Wierstra, D.; Riedmiller, M. Deterministic policy gradient algorithms. In Proceedings of the International Conference on Machine Learning, PMLR, Beijing, China, 22–24 June 2014; pp. 387–395. [Google Scholar]
- Schulman, J.; Wolski, F.; Dhariwal, P.; Radford, A.; Klimov, O. Proximal policy optimization algorithms. arXiv 2017, arXiv:1707.06347. [Google Scholar]


| Type | Parameters | Value |
|---|---|---|
| Wind power units | 250 kW | |
| Photovoltaic array | 250 kW | |
| Gas units | 300 kW | |
| / | −60/60 kW/15 min | |
| Energy storage devices | 0.85 | |
| / | −300/300 kW | |
| 20% | ||
| 85% | ||
| Ncycle | 8000 | |
| The main net | 7% |
| Parameters | Value |
|---|---|
| Learning rate of Actor | 1 × 10⁻⁵ |
| Learning rate of Critic | 1 × 10⁻⁵ |
| Decay ratio of learning rate | 0.5 |
| Batch size | 256 |
| Epoch | 10,000 |
| Discount factor | 0.97 |
| Parameter update speed | 0.01 |
| Temperature parameter | 0.01 |
| Buffer size | 1 × 10⁴ |
| Buffer initial fill | 2560 |
| Updates frequency | 10 |
| Method | Proposed Method | SAC | PPO | DDPG |
|---|---|---|---|---|
| Carbon Emission (kgCO2) | 50,325 | 53,749 | 54,051 | 57,668 |
Disclaimer/Publisher’s Note: The statements, opinions and data contained in all publications are solely those of the individual author(s) and contributor(s) and not of MDPI and/or the editor(s). MDPI and/or the editor(s) disclaim responsibility for any injury to people or property resulting from any ideas, methods, instructions or products referred to in the content. |
© 2024 by the authors. Licensee MDPI, Basel, Switzerland. This article is an open access article distributed under the terms and conditions of the Creative Commons Attribution (CC BY) license (https://creativecommons.org/licenses/by/4.0/).
Share and Cite
Bian, J.; Wang, Y.; Dang, Z.; Xiang, T.; Gan, Z.; Yang, T. Low-Carbon Dispatch Method for Active Distribution Network Based on Carbon Emission Flow Theory. Energies 2024, 17, 5610. https://doi.org/10.3390/en17225610
Bian J, Wang Y, Dang Z, Xiang T, Gan Z, Yang T. Low-Carbon Dispatch Method for Active Distribution Network Based on Carbon Emission Flow Theory. Energies. 2024; 17(22):5610. https://doi.org/10.3390/en17225610
Chicago/Turabian StyleBian, Jiang, Yang Wang, Zhaoshuai Dang, Tianchun Xiang, Zhiyong Gan, and Ting Yang. 2024. "Low-Carbon Dispatch Method for Active Distribution Network Based on Carbon Emission Flow Theory" Energies 17, no. 22: 5610. https://doi.org/10.3390/en17225610
APA StyleBian, J., Wang, Y., Dang, Z., Xiang, T., Gan, Z., & Yang, T. (2024). Low-Carbon Dispatch Method for Active Distribution Network Based on Carbon Emission Flow Theory. Energies, 17(22), 5610. https://doi.org/10.3390/en17225610