
Quantitative Characterization of Surfactant Displacement Efficiency by NMR—Take the Tight Oil of Chang 8 Member of Yanchang Formation in Fuxian Area, Ordos Basin, as an Example


Abstract
1. Introduction
2. Experiments
3. Results and Discussion
4. Conclusions
- (1)
- This finding indicates the presence of an optimal surfactant concentration, with NP-10 achieving its minimum interfacial tension at a concentration of 0.1%. Similarly, GPHQ-1 also exhibits a minimum interfacial tension at this same concentration, whereas FSD-952 reaches its minimum at a higher concentration of 0.4%. Notably, GPHQ-1 demonstrates the lowest recorded interfacial tension value of 0.0762 mN/m.
- (2)
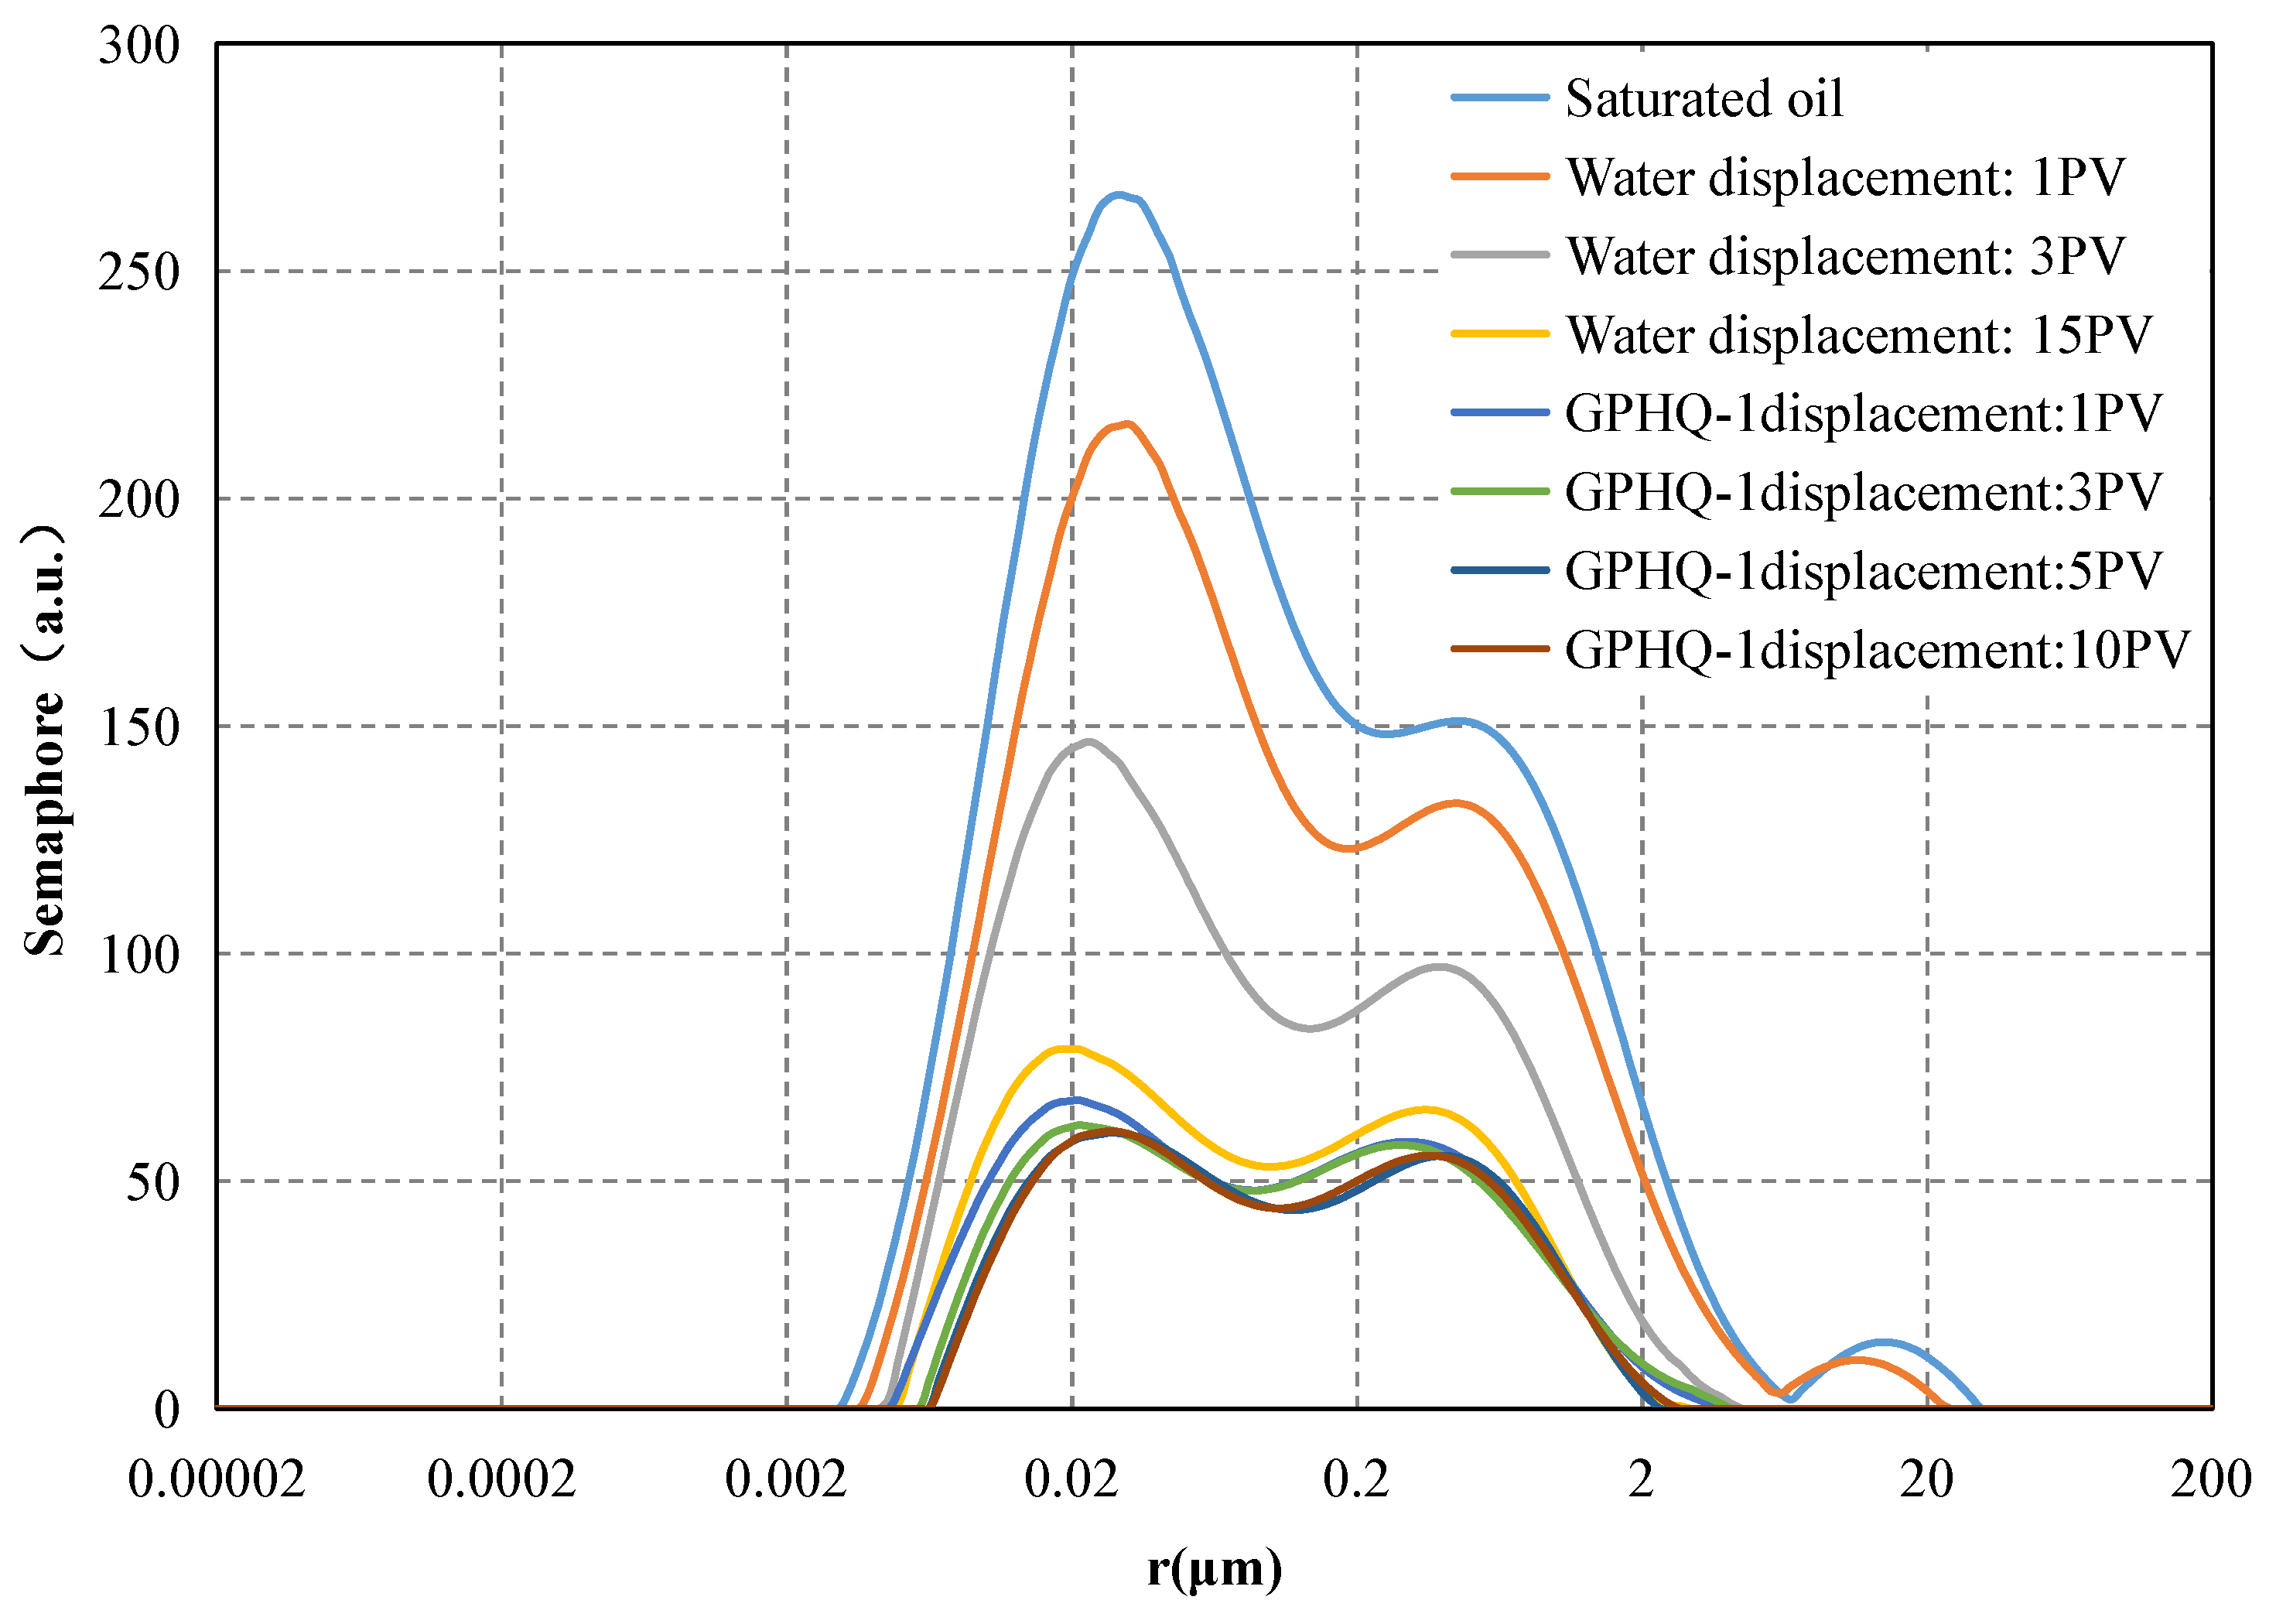
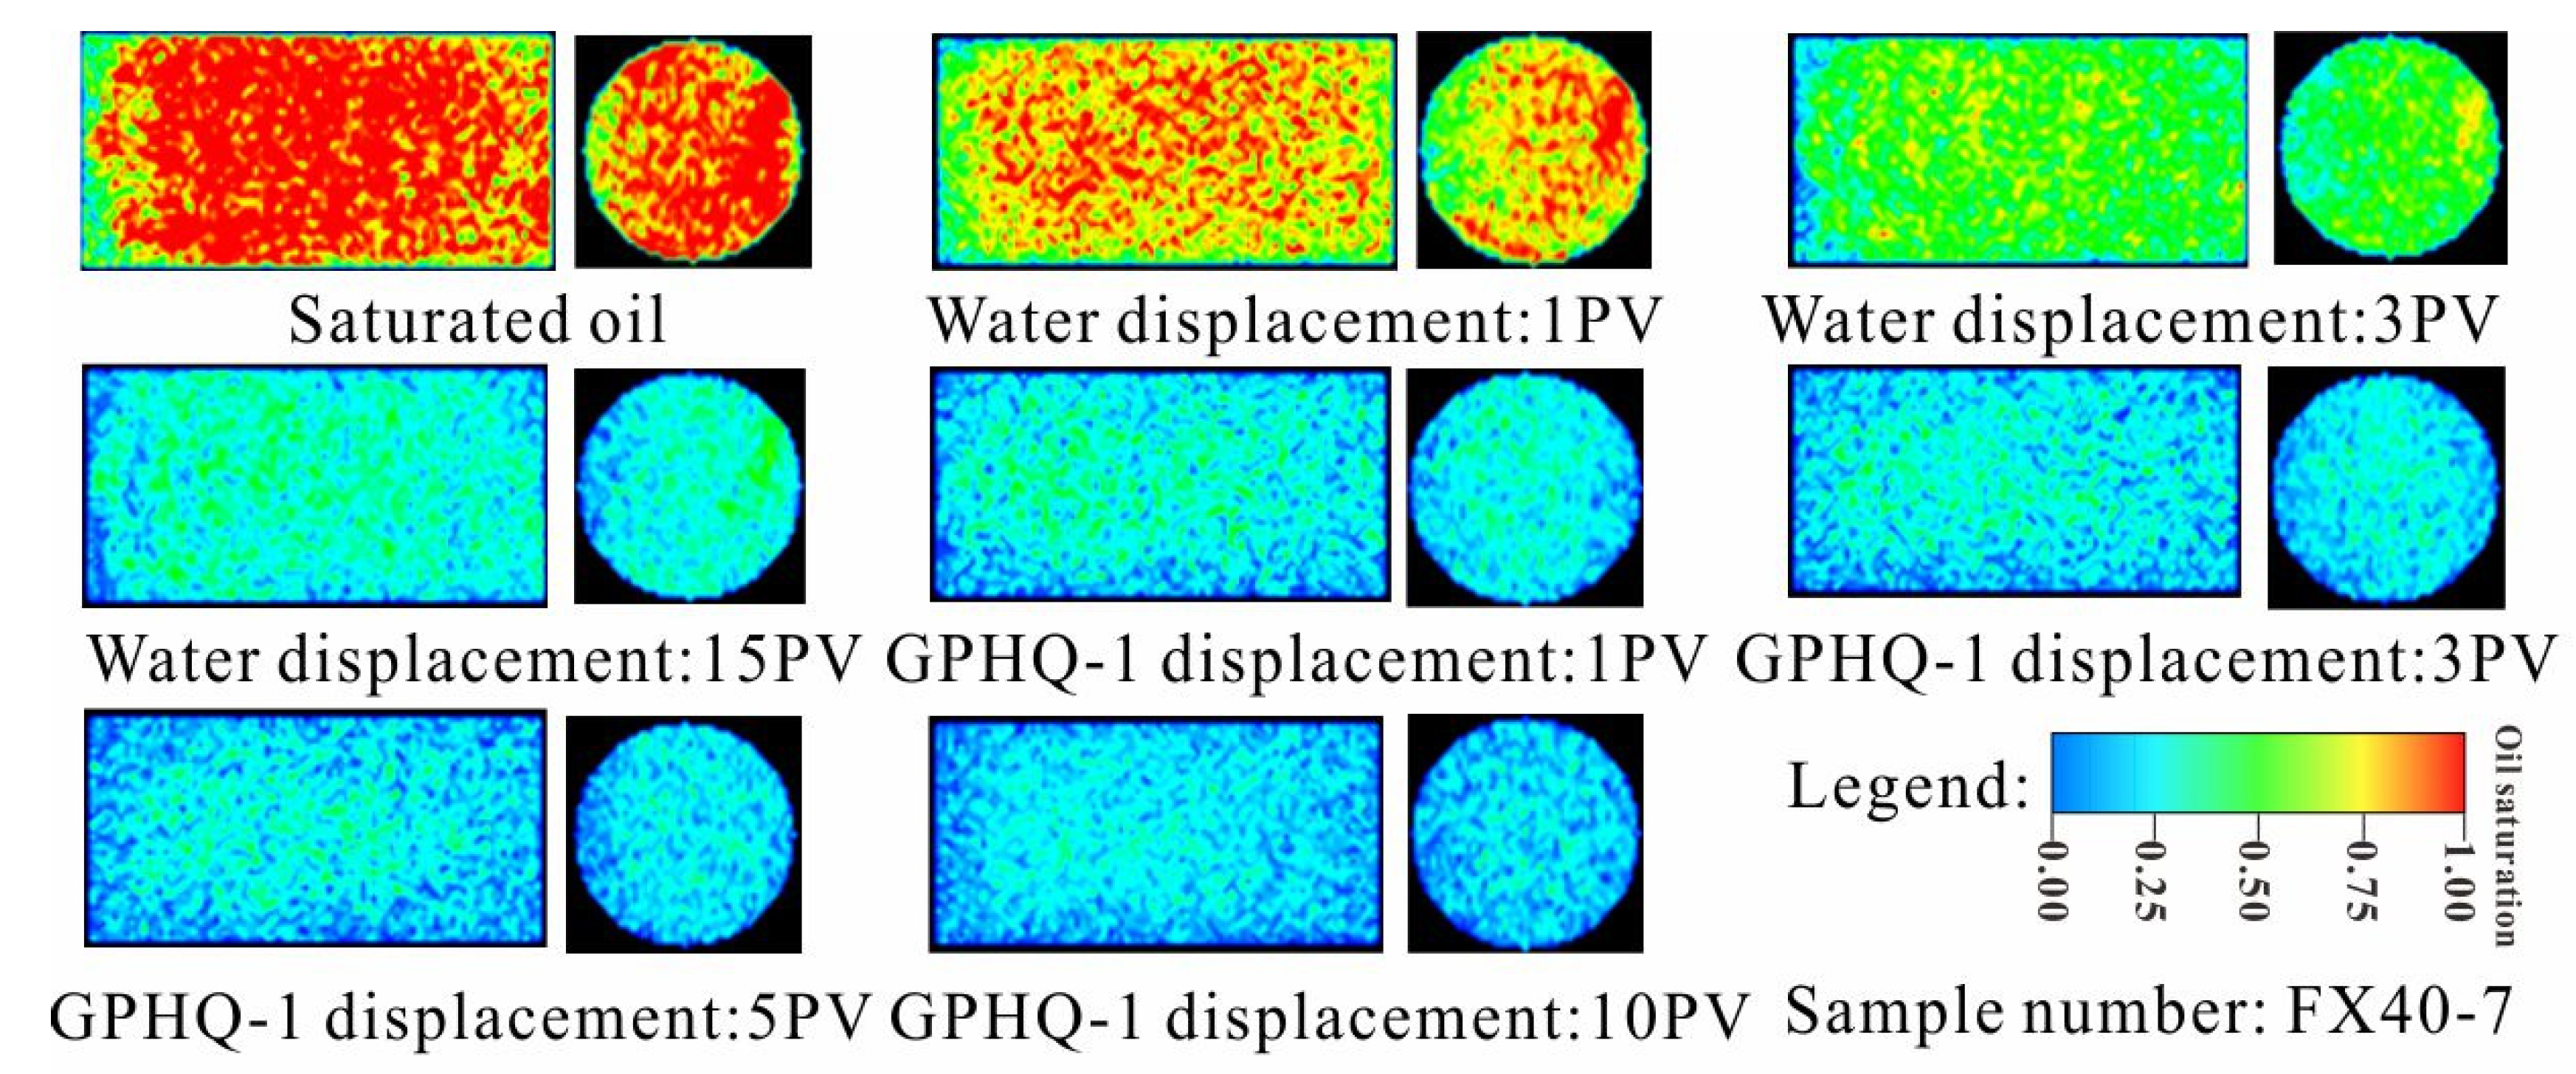
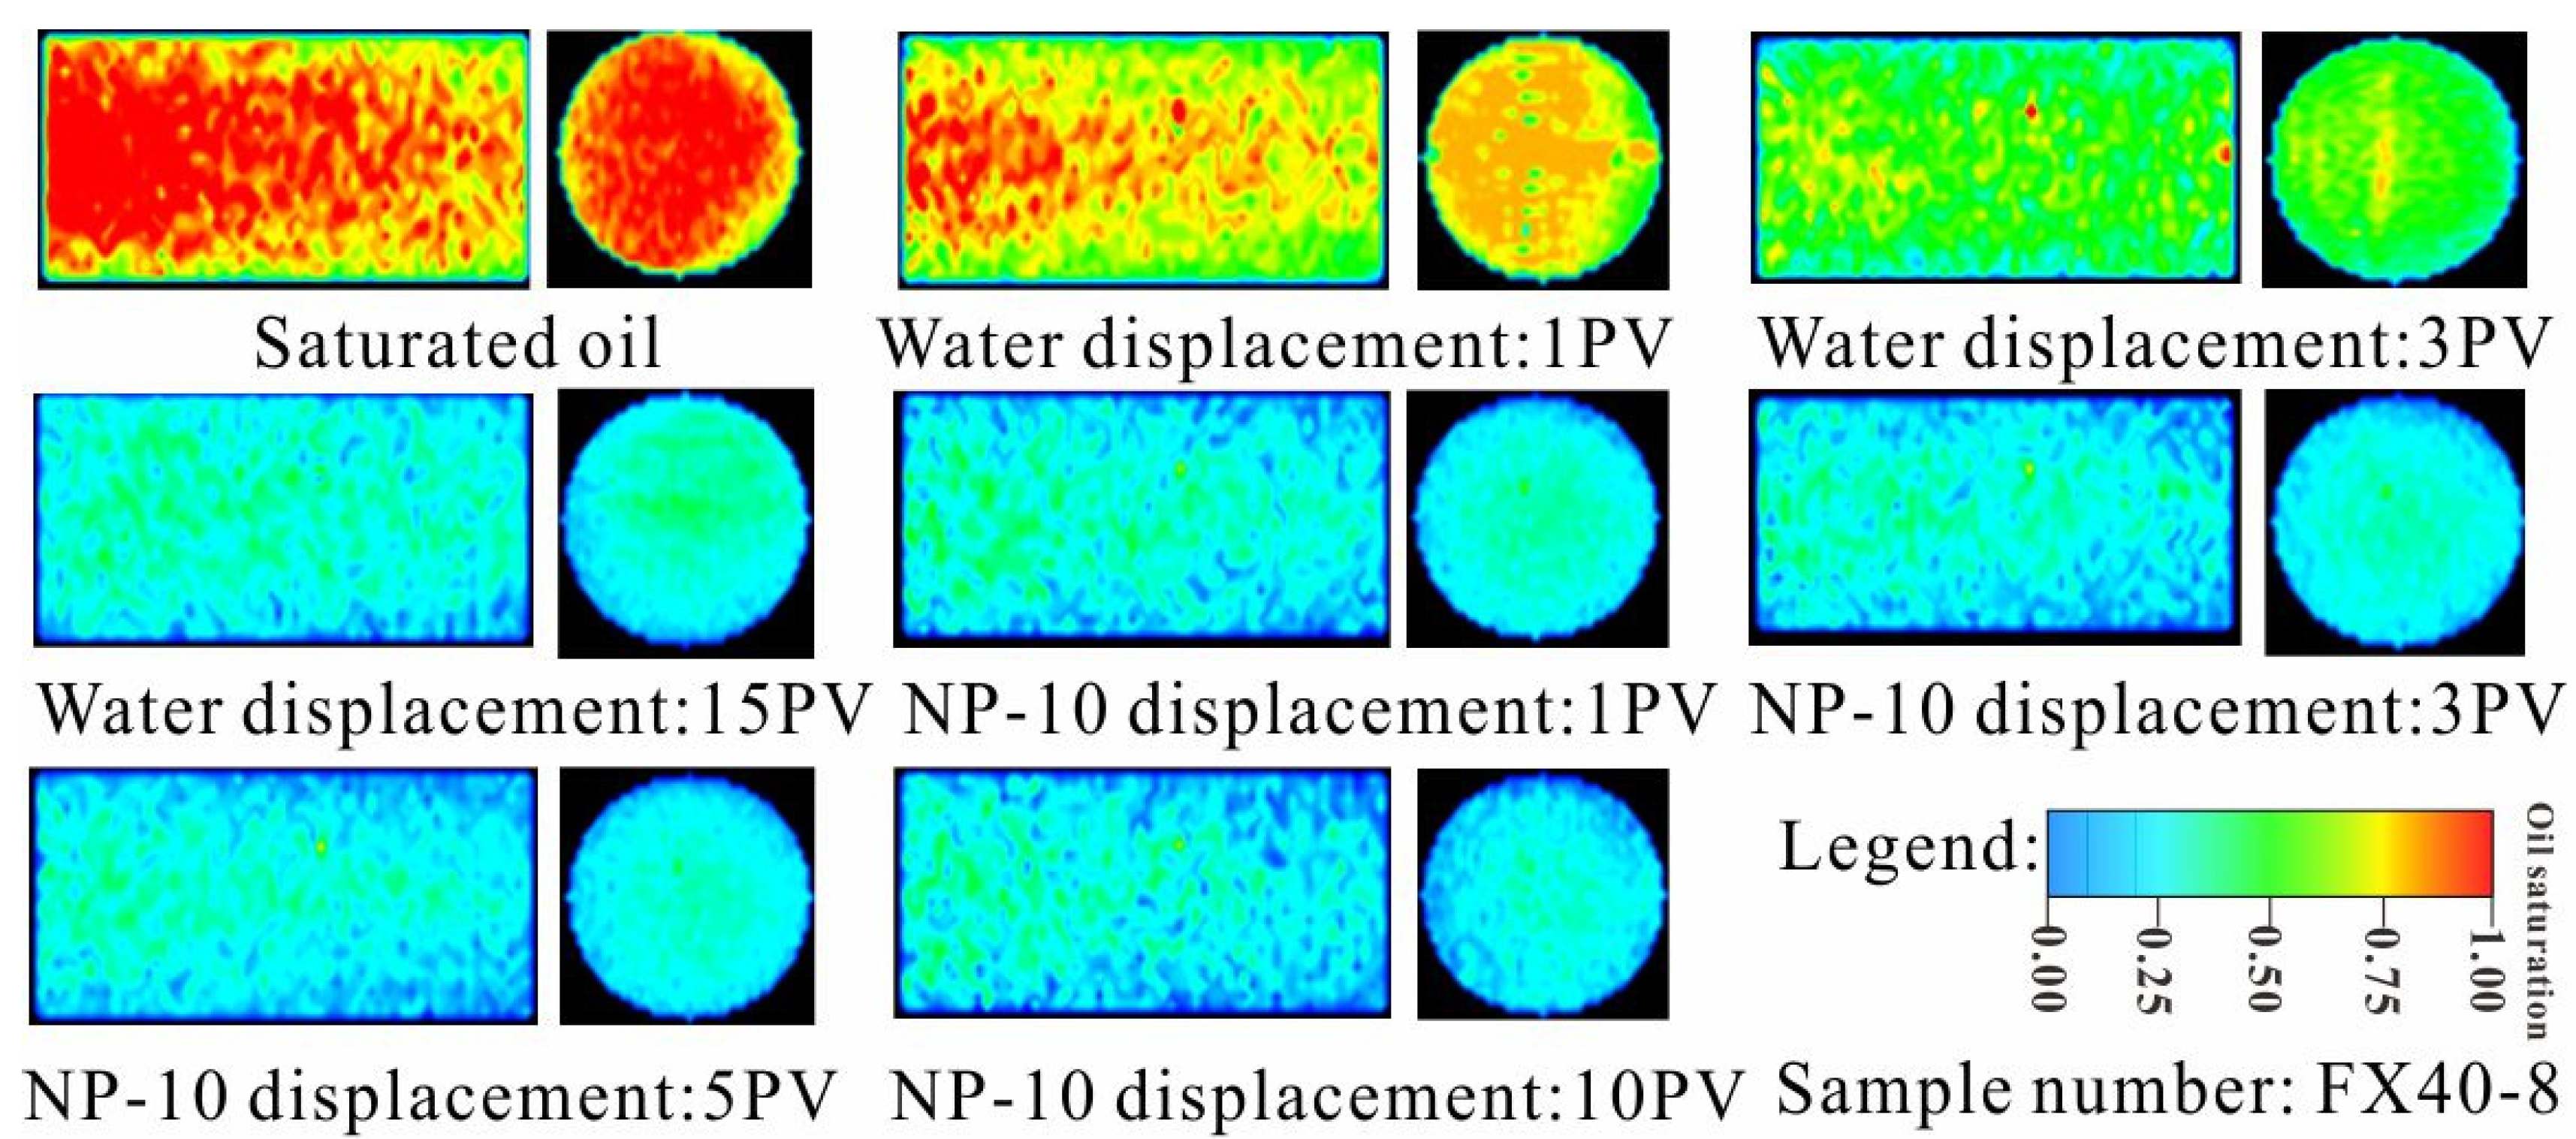
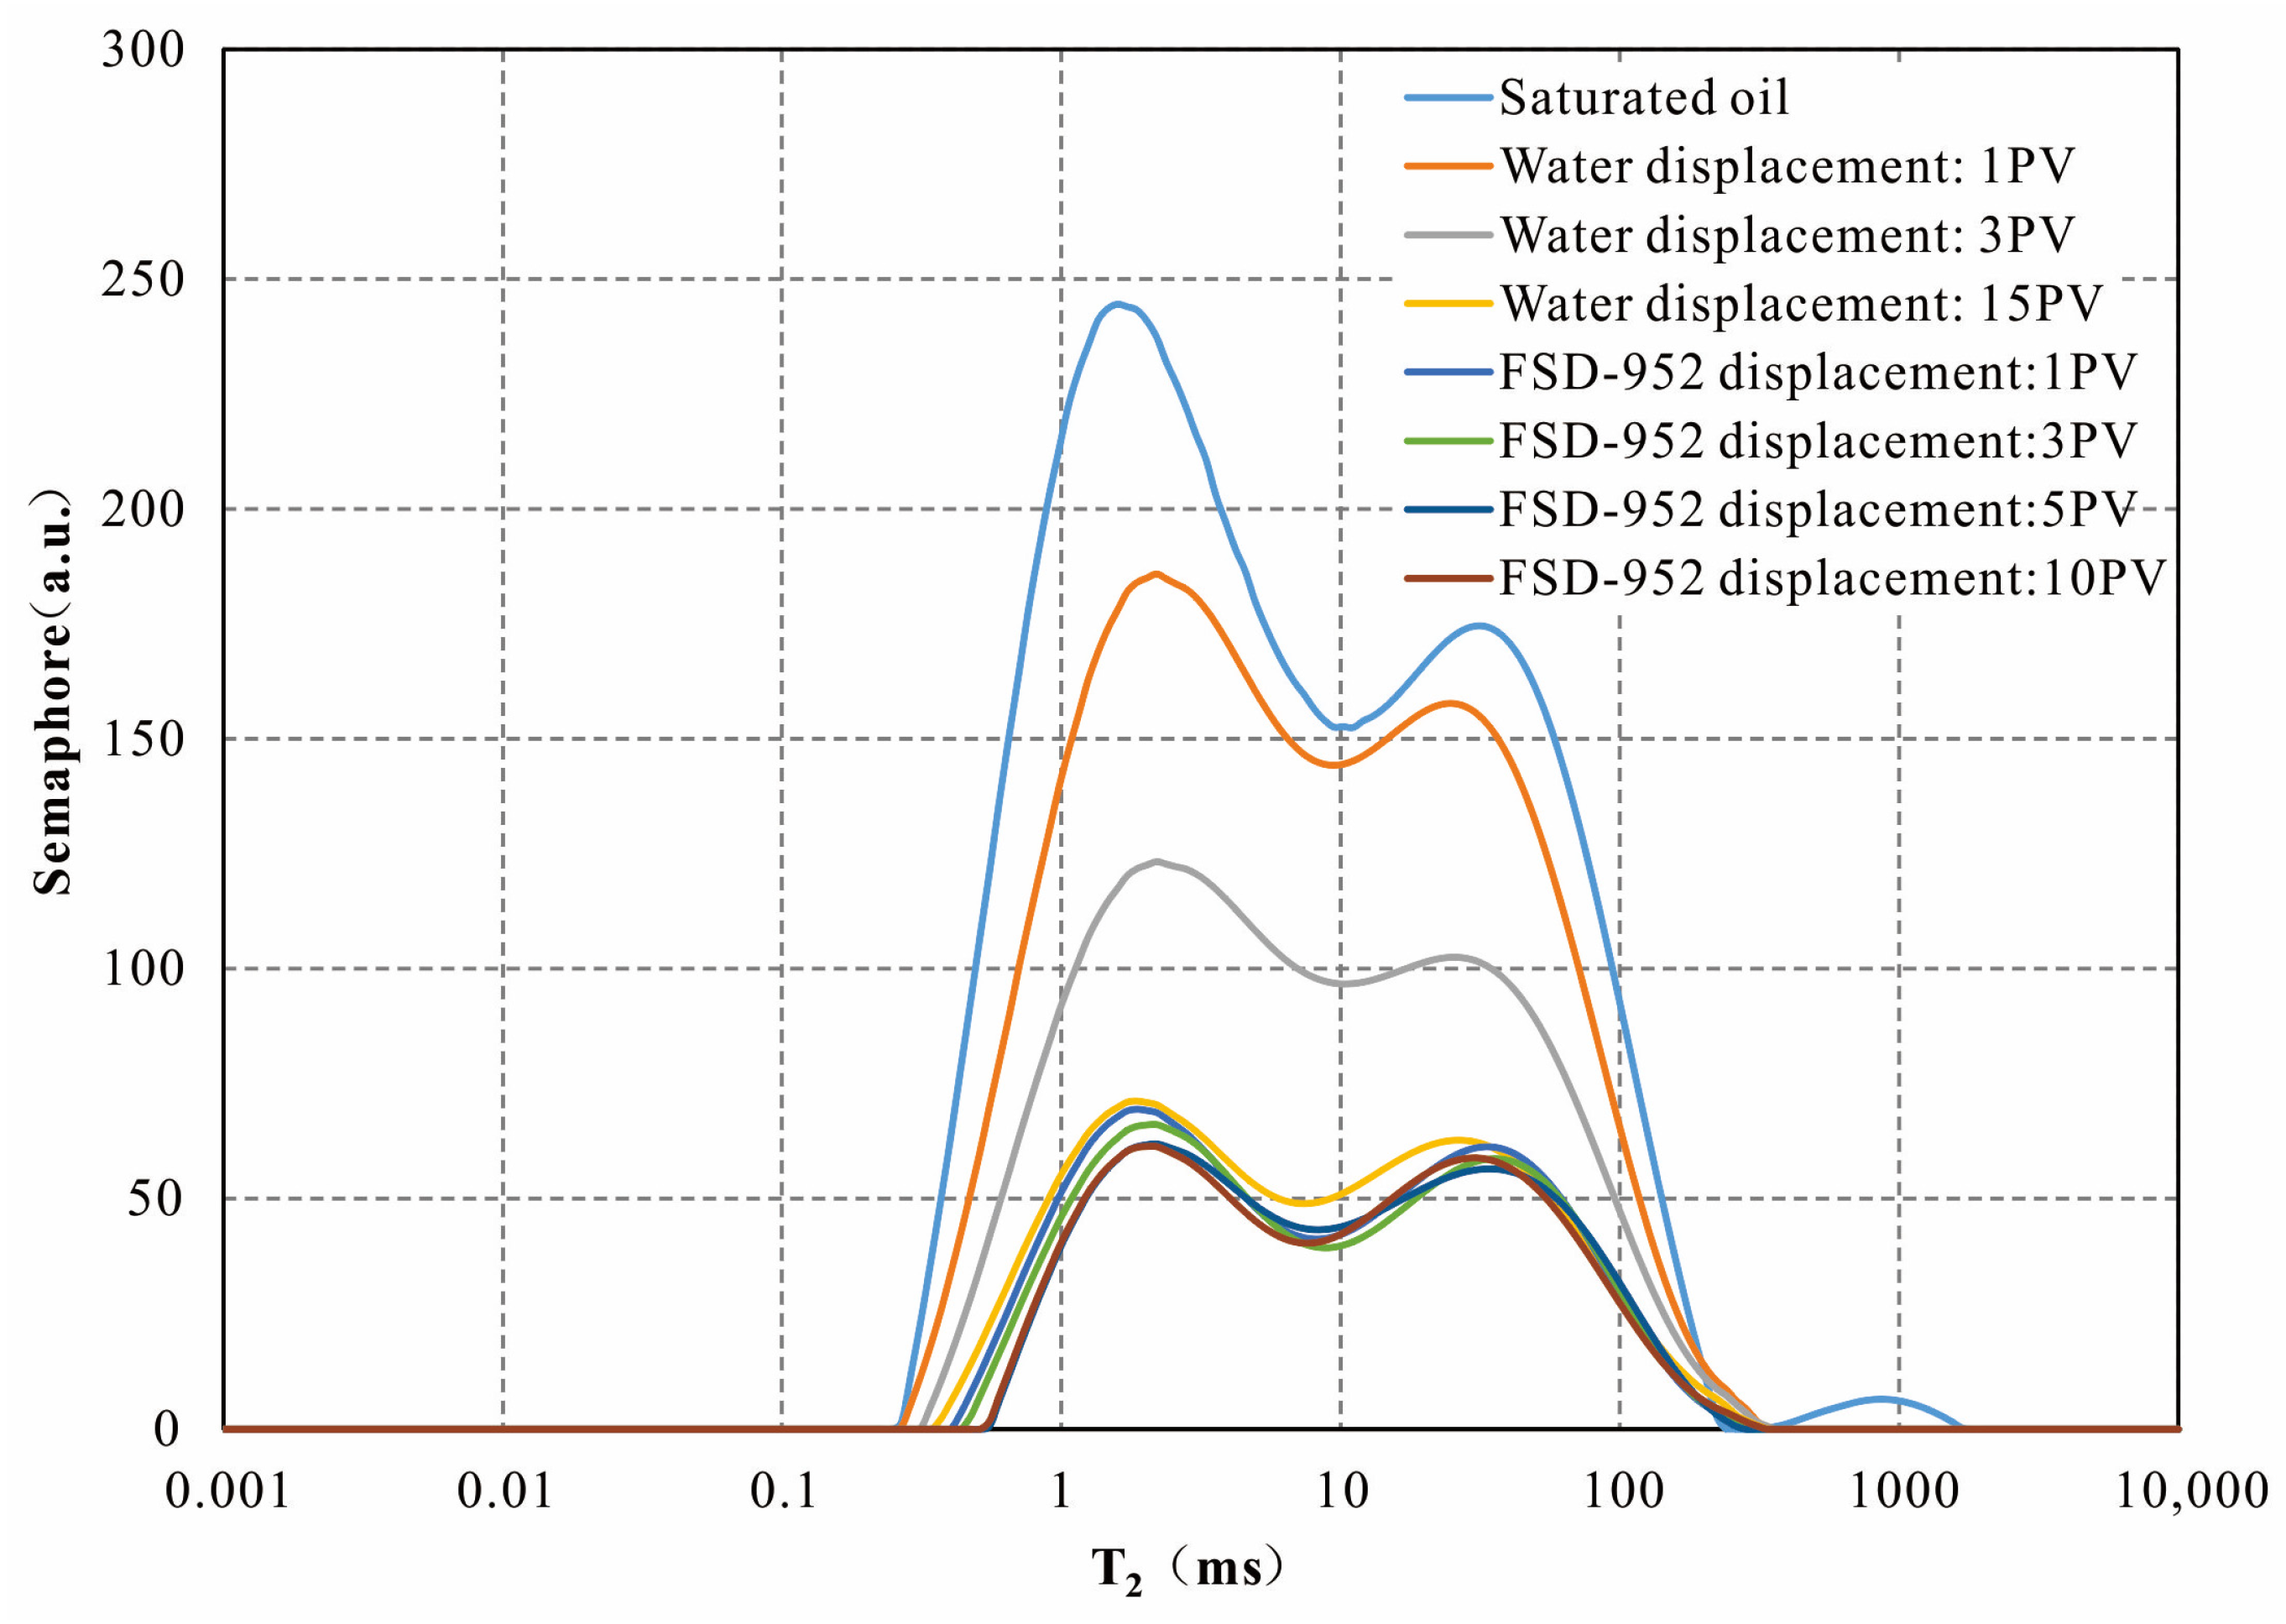
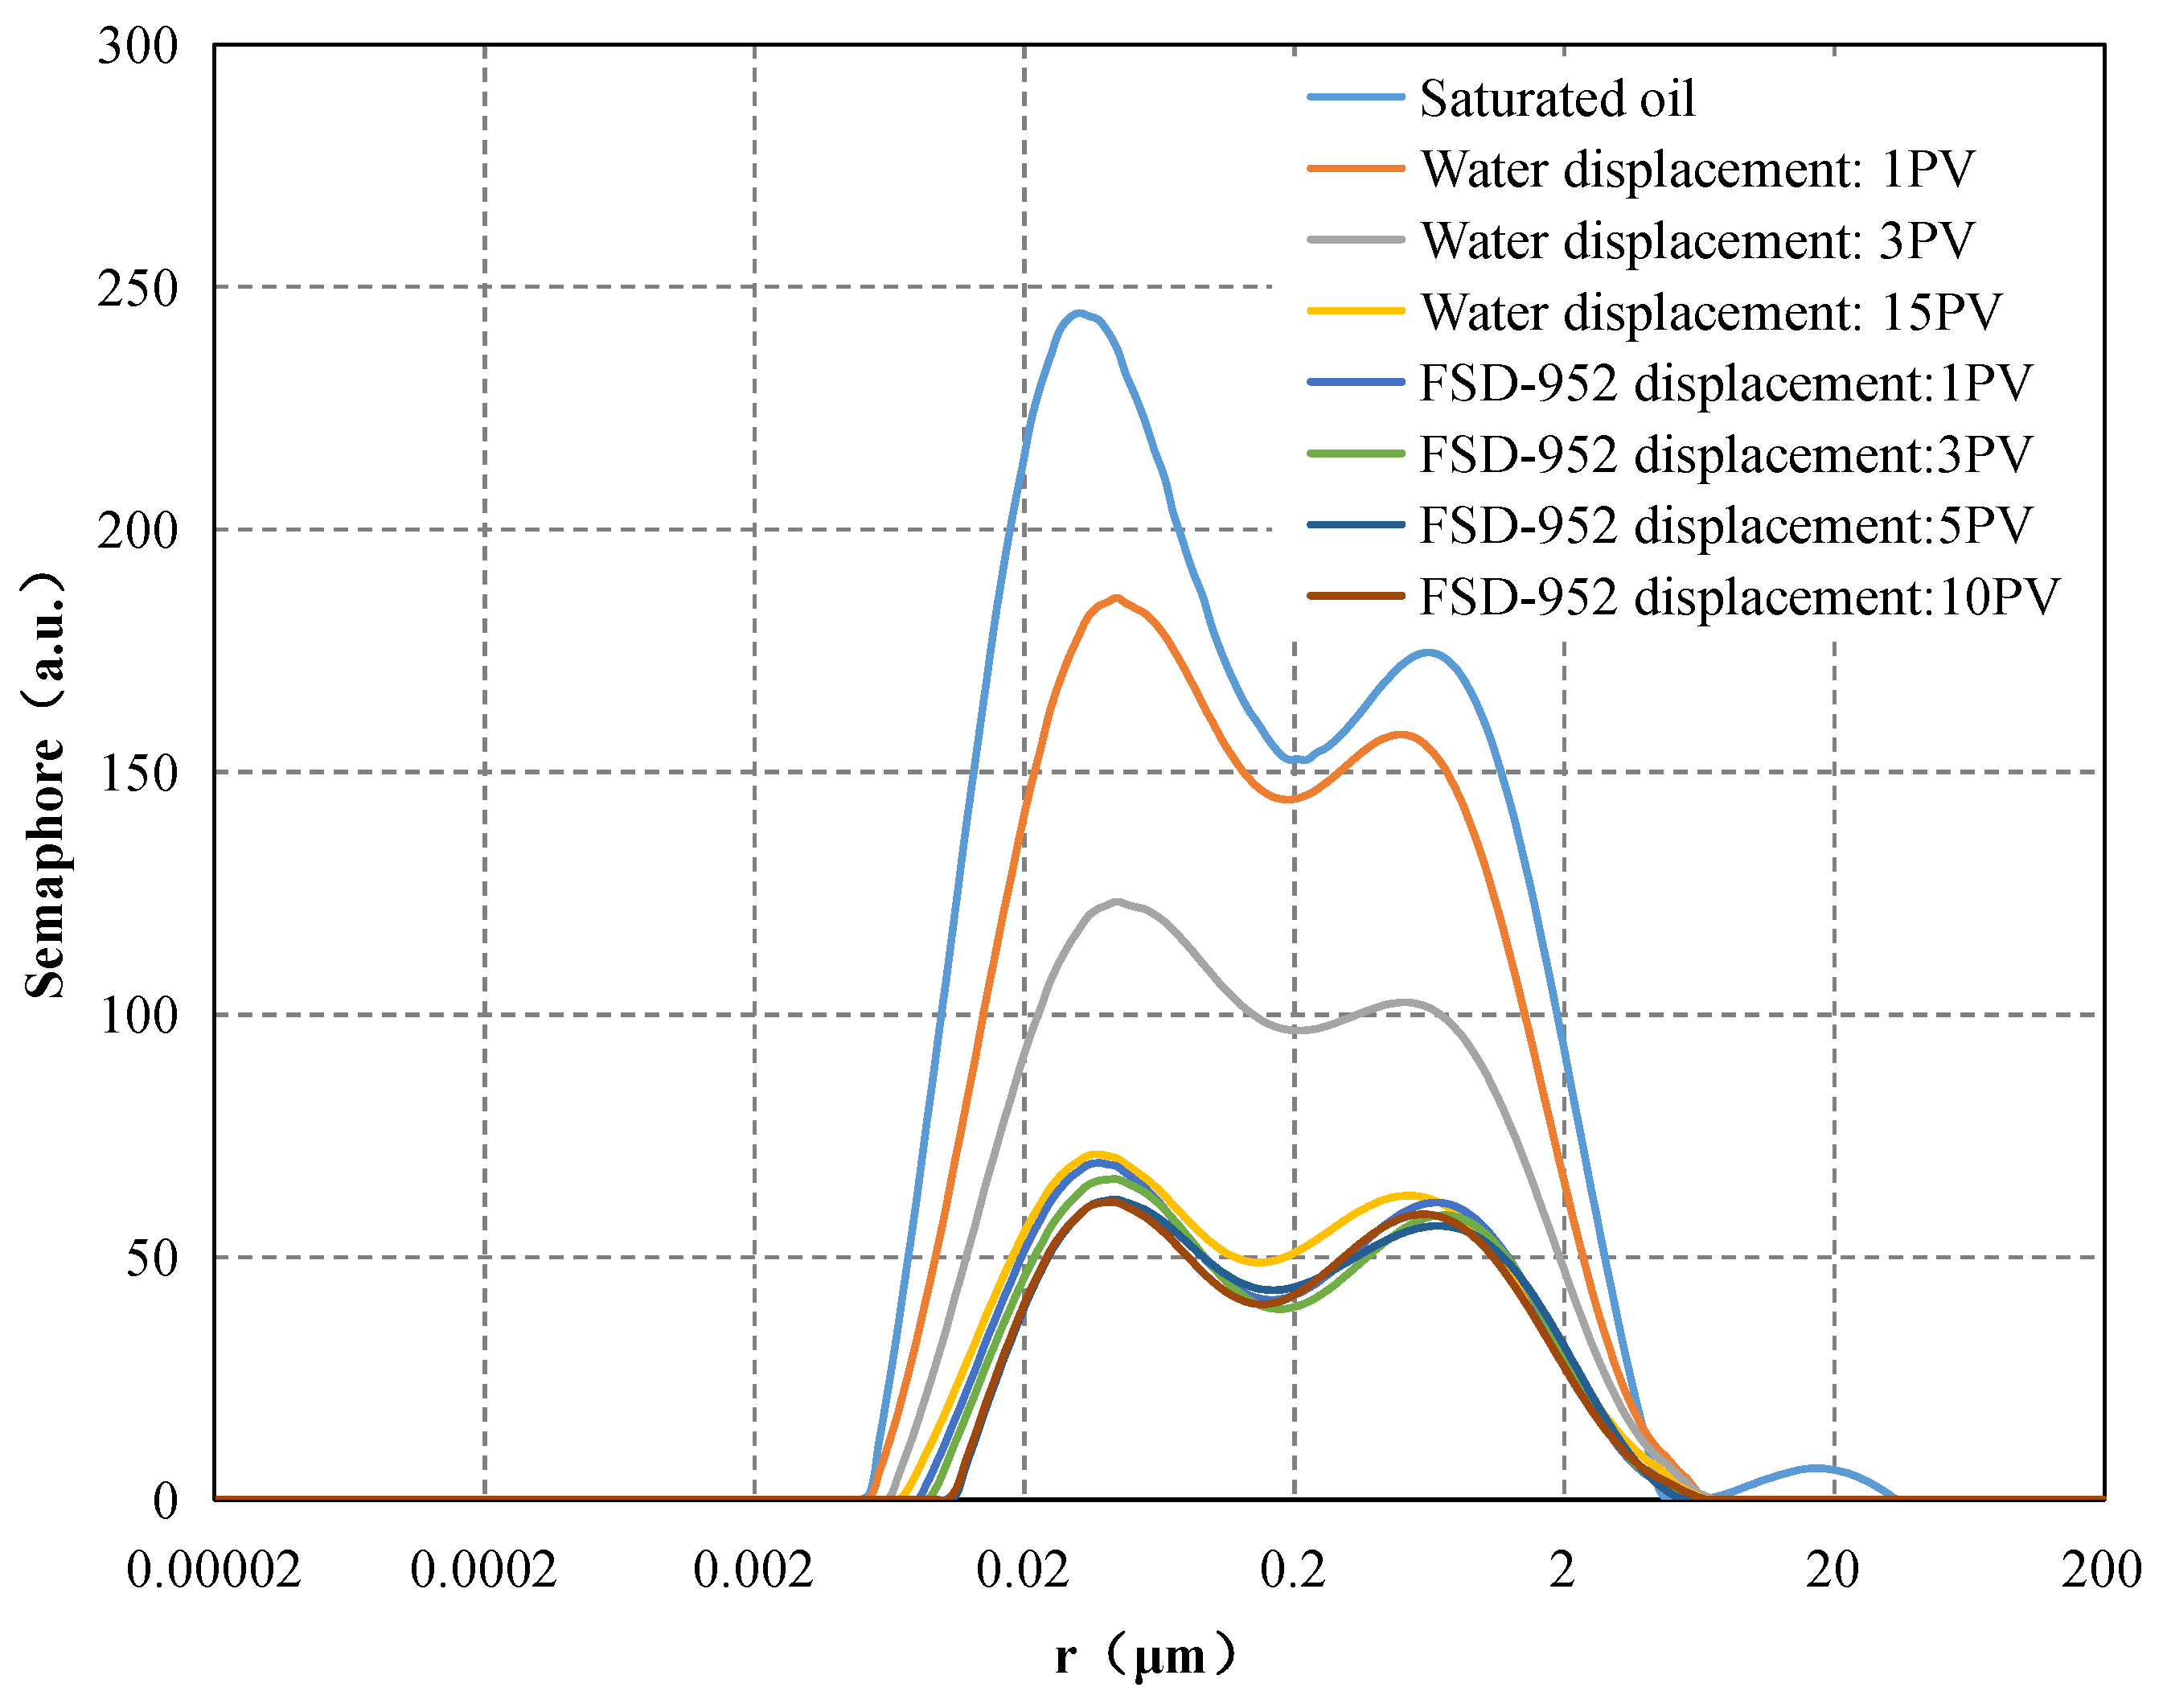
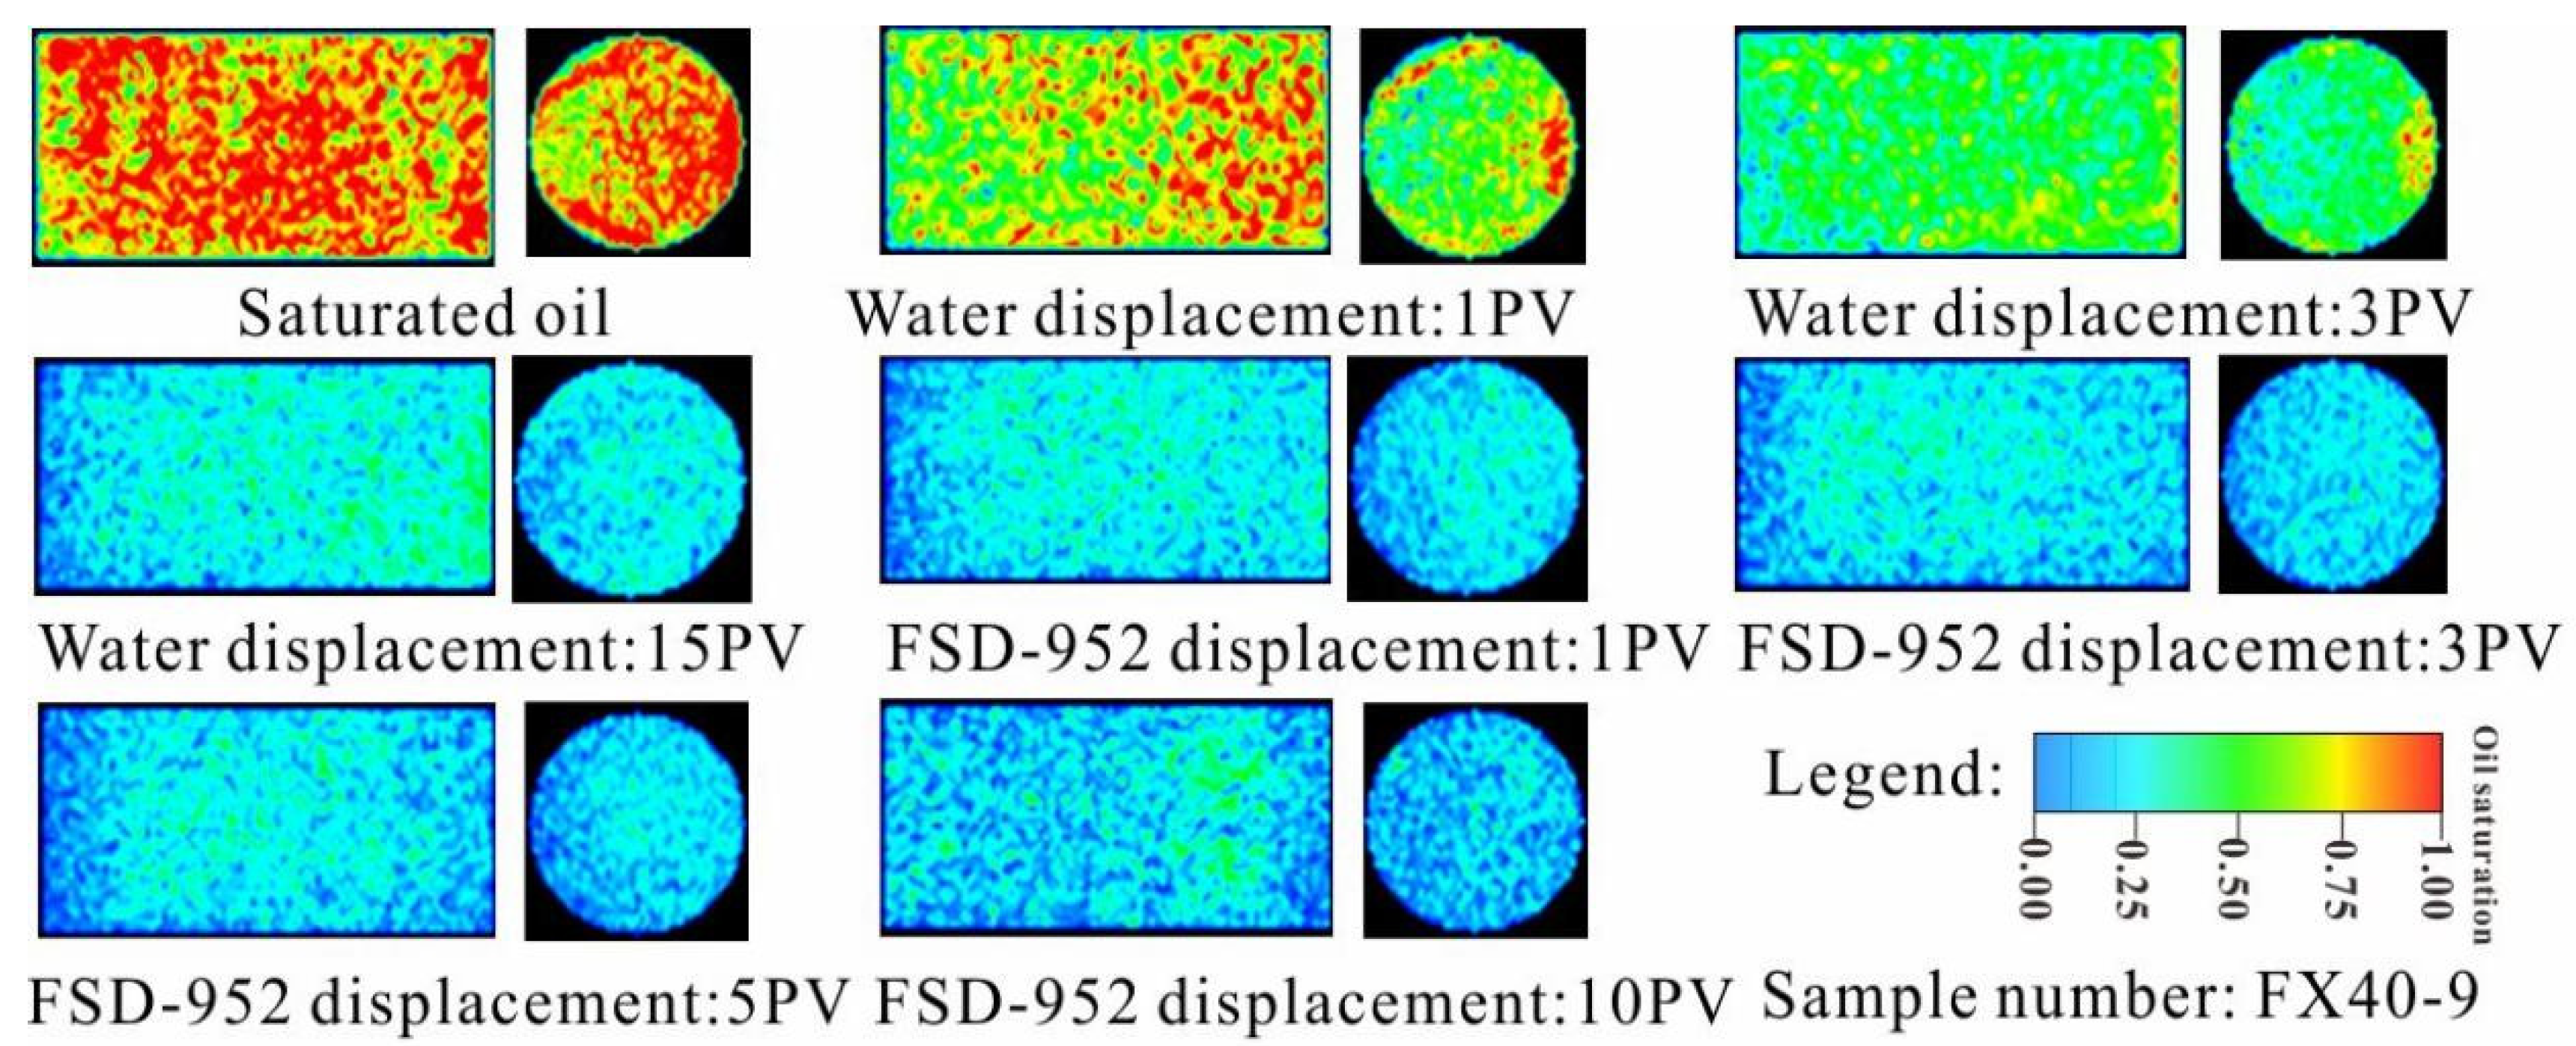
- In terms of oil displacement efficiency and enhancement, the ranking is GPHQ-1 > FSD-952 > NP-10. The oil displacement efficiencies for the surfactants GPHQ-1, FSD-952, and NP-10 exhibited increases of 6.67%, 4.81%, and 3.7%, respectively. The minimum pore sizes corresponding to the displacements facilitated by GPHQ-1, NP-10, and FSD-952 were determined to be 0.01 μm, 0.02 μm, and 0.03 μm, respectively.
- (3)
- In the context of developing the Fuxian Chang 8 reservoir, the GPHQ-1 surfactant is utilized to perform displacement tests, specifically aimed at extracting crude oil confined within small pore spaces.
Author Contributions
Funding
Data Availability Statement
Acknowledgments
Conflicts of Interest
References
- Zhao, X.; Liao, G.; Liu, W.; Peng, B.; Luan, H.; Chen, Q.; Su, X.; Feng, Y. New advances in surfactant EOR mechanism: Micellar solubilization and in-situ emulsification. Sci. Sin. Chim. 2023, 53, 1088–1103. [Google Scholar]
- Hou, Z. Influence of Surfactant Molecular Structure on Oil/Water Interface Aggregation Behavior and Oil Displacement Efficiency. Ph.D. Thesis, Northeast Petroleum University, Daqing, China, 2023. [Google Scholar]
- Gao, X.; Zhang, L.; Li, J.; Zhou, X.; Zhao, X.; Lyu, T. Chemical Analysis of Surfactants and Experimental Study on Improving Oilfield Recovery. Contemp. Chem. Ind. 2023, 52, 2931–2934. [Google Scholar]
- Hou, X.; Lu, Y.; Fang, B.; Zhang, F.; Hu, G. Research progress on application of surfactants in unconventional oil and gas stimulation. Petrochem. Technol. 2023, 52, 734–741. [Google Scholar]
- Kang, W.; Wang, K.; Li, Z.; Lv, W.; Yang, H.; Jia, R.; He, Y. Study on slow-release surfactant nanocarriers in low-permeability reservoirs. China Surfactant Deterg. Cosmet. 2022, 52, 1147–1154. [Google Scholar]
- Liu, H.; Cai, X.; Tian, F.; Zheng, Y.; Lu, X.; Lan, L. Synthesis of fluorocarbon surfactant and development of its compound surfactant system for depressurization and increasing injection. Chem. Eng. Oilgas 2022, 51, 84–90. [Google Scholar]
- Li, W.; Li, Z.; Zhang, D.; Zhang, C.; Li, Y. Highly Stable Supercritical CO2 Foam with Zwitterionic Surfactant and Nanoparticle as Foaming Agents for Channeling Blocking. Oilfield Chem. 2024, 41, 101–107. [Google Scholar]
- Han, X.; Wei, L.; Liu, W.; Bai, Y. Impact of Oil-Displacing Agent on the Emulsification Stability of Oily Wastewater in Alkali-Free Ternary Composite Flooding. Appl. Chem. Ind. 2024, 53, 1817. [Google Scholar]
- Li, Z.; Pu, D.; Xiong, Y.; Wu, D.; Jin, C.; Guo, Y. Research progress of nanomaterials for oil displacement in enhancing oil recovery. Chem. Ind. Eng. Prog. 2023, 43, 5035. [Google Scholar]
- Bera, A.; Belhaj, H. Application of nanotechnology by means of nanoparticles and nanodispersions in oil recovery—A comprehensive review. J. Nat. Gas Sci. Eng. 2016, 34, 1284–1309. [Google Scholar] [CrossRef]
- Liu, H.; Jin, X.; Ding, B. Application of nanotechnology in petroleum exploration and development. Pet. Explor. Dev. 2016, 43, 1107–1115. [Google Scholar] [CrossRef]
- Eltoum, H.; Yang, Y.; Hou, J. The effect of nanoparticles on reservoir wettability alteration: A critical review. Pet. Sci. 2021, 18, 136–153. [Google Scholar] [CrossRef]
- Wang, C. Applied Basic Research and Adaptability Evaluation of Surfactant Flooding in Ultra-Low Permeability Reservoirs. Ph.D. Thesis, Shaanxi University of Science and Technology, Xi’an, China, 2018. [Google Scholar]
- Yang, J.; Huang, Z.; Dong, X.; Liu, Y. Surfactant Oil Displacement System Research of Ansai Oilfield. Oilfield Chem. 2015, 32, 559–563. [Google Scholar]
- Chen, G.; Song, Y.-P.; Tang, D.-Y.; Zhao, J.-R. Evaluation and Application of a New Surfactant Oil-Displacing Agent in Low Permeability Oilfield. Oilfield Chem. 2014, 31, 410–418. [Google Scholar]
- Li, G.; Yang, W.; Wei, J.; Zhao, G.; Qing, X.; Wang, Y. Analysis on Chemical Mechanism of Surfactant Flooding and Experimental Study on Reducing Pressure and Increasing Injection. Contemp. Chem. Ind. 2023, 52, 2947–2949. [Google Scholar]
- Roldán-Carrillo, T.; Gladys-Castorena, C.; Salazar-Castillo, R.O.; Hernández-Escobedo, L.; Olguín-Lora, P.; Gachuz-Muro, H. Hybrid low salinity water and surfactant process for enhancing heavy oil recovery. Pet. Explor. Dev. 2023, 50, 1278–1288. [Google Scholar] [CrossRef]
- Wei, B.; Wang, Y.; Zhao, J.; Kadet, V.; Pu, W. Influence laws of solid-liquid interface characteristics on the imbibition behaviors of tight/shale reservoirs: A case study of tight reservoirs in Member 7 and 8 of Yanchang Formation and shale reservoirs in Longmaxi Formation. Acta Pet. Sin. 2023, 44, 1683–1692. [Google Scholar]
- Peng, Y.; Qv, C.; Xv, C. Enhanced Oil Recovery Technology of Modified Surfactant Flooding in Low-permeability Reservoirs in Yanchang Oilfield. Contemp. Chem. Ind. 2022, 51, 1302–1310. [Google Scholar]
- Hu, J.; Jin, C.; Shi, L.; Guo, Y. Surface active-polymer flooding agent for medium and low permeability reservoir. Fine Chem. 2023, 40, 2064–2072. [Google Scholar]
- Du, M.; Yang, Z.; Lyu, W.; Li, Z.; Wang, G.; Chen, X.; Qi, X.; Yao, L.; Zhang, Y.; Jia, N.; et al. Experiment of dynamic seepage in tight/shale reservoirs under matrix fracture coupling. Pet. Explor. Dev. 2024, 51, 403–415. [Google Scholar] [CrossRef]
- Bai, S.; Cheng, D.; Wan, J.; Yang, L.; Peng, H.; Guo, X.; Zeng, J. Quantitative characterization of sandstone NMR T2 spectrum. Acta Pet. Sin. 2016, 37, 382. [Google Scholar]
- Zhong, G.; Wu, Y.; Wang, S.; Li, Y.; Lei, K.; Li, Y.; Yang, S. Review on the application of nuclear magnetic resonance technology in carbon dioxide geological sequestration and utilization. Prog. Geophys. 2024, 39, 0225–0240. (In Chinese) [Google Scholar]
- Li, Q.; Li, Q.; Wang, F.; Wu, J.; Wang, Y. The Carrying Behavior of Water-Based Fracturing Fluid in Shale Reservoir Fractures and Molecular Dynamics of Sand-Carrying Mechanism. Processes 2024, 12, 2051. [Google Scholar] [CrossRef]
- Li, Q.; Li, Q.; Han, Y. A Numerical Investigation on Kick Control with the Displacement Kill Method during a Well Test in a Deep-Water Gas Reservoir: A Case Study. Processes 2024, 12, 2090. [Google Scholar] [CrossRef]


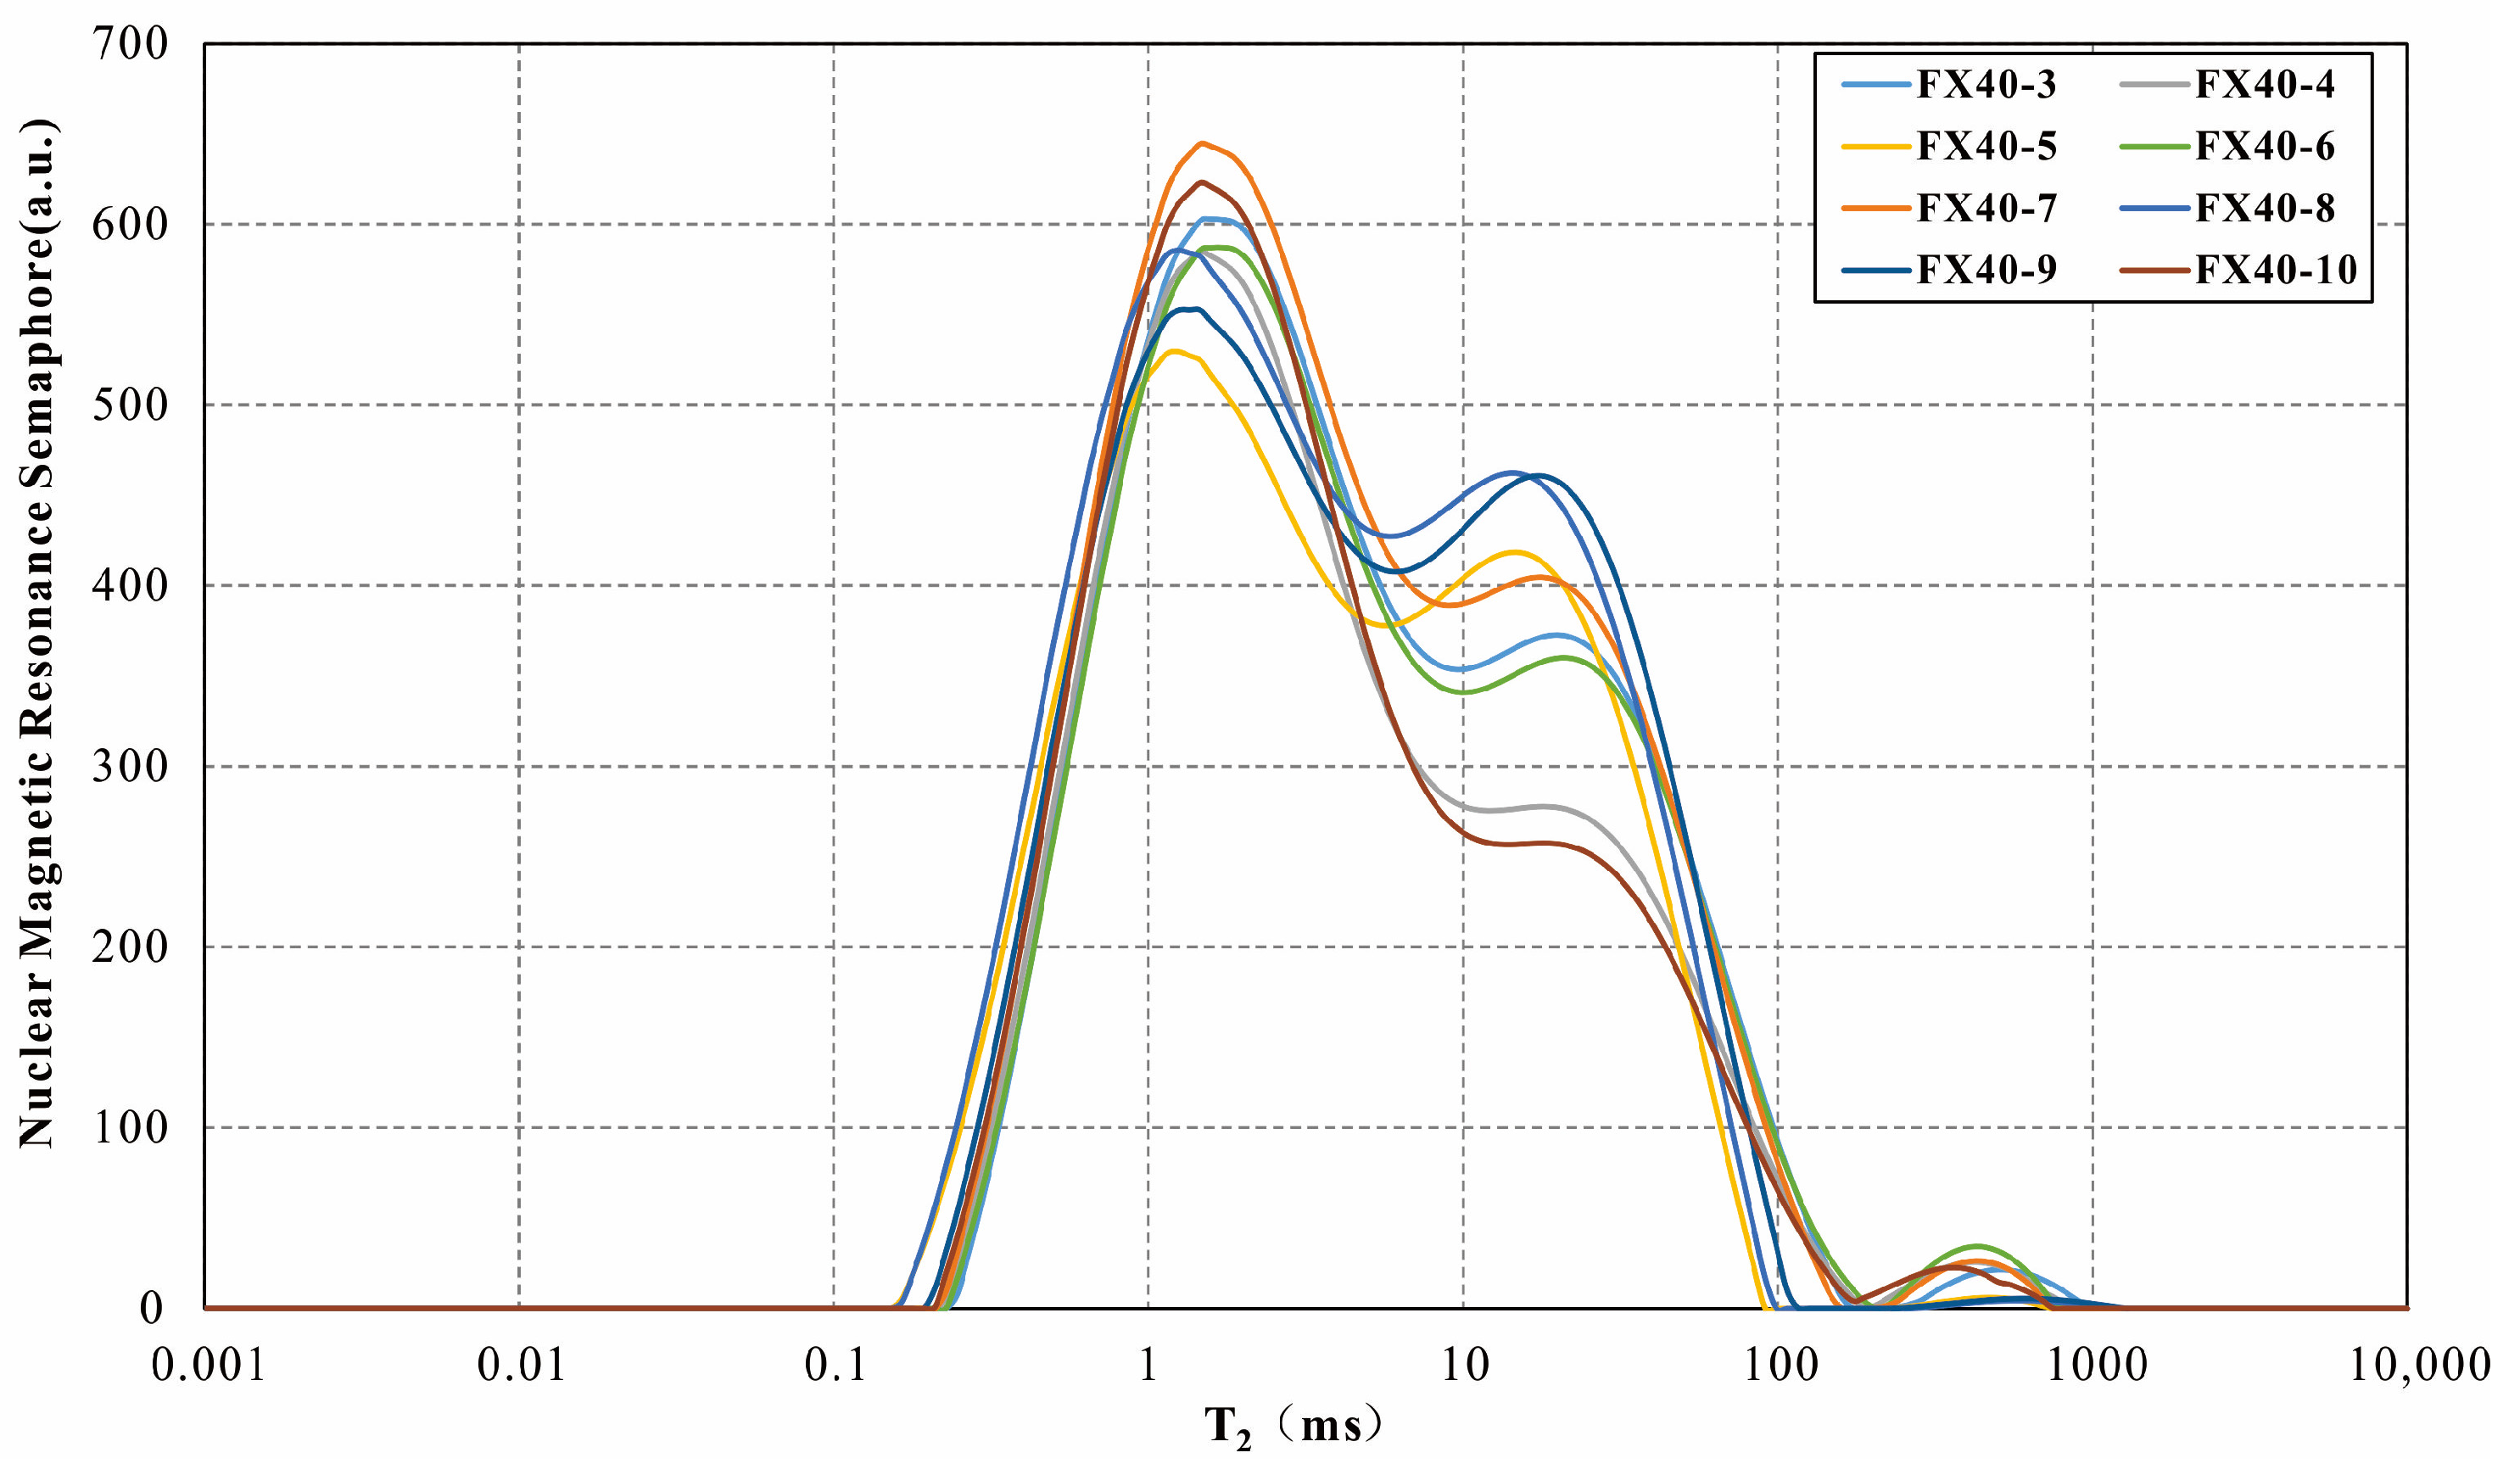
| Sample Number | Dismantle the Saturated Semaphore System (a.u.) | Nuclear Magnetic Conversion of Water (g) | Sample Volume (cm3) | Drying Quality (g) | Saturation Mass (g) | Saturated Water Mass (g) | Weighing Water Volume (cm3) | Nuclear Magnetic Porosity (%) | Permeability (×10−3 μm2) |
|---|---|---|---|---|---|---|---|---|---|
| FX40-3 | 27,538.4249 | 2.6940 | 23.82 | 55.187 | 58.004 | 2.817 | 2.817 | 11.31 | 0.0364 |
| FX40-4 | 24,473.6074 | 2.3942 | 25.04 | 59.070 | 61.583 | 2.513 | 2.513 | 9.56 | 0.0134 |
| FX40-5 | 26,216.2458 | 2.5647 | 21.59 | 49.764 | 52.459 | 2.695 | 2.695 | 11.88 | 0.0282 |
| FX40-6 | 27,040.7879 | 2.6454 | 24.92 | 58.106 | 60.881 | 2.775 | 2.775 | 10.62 | 0.0293 |
| FX40-7 | 29,535.1240 | 2.8894 | 24.93 | 57.572 | 60.625 | 3.053 | 3.053 | 11.59 | 0.0353 |
| FX40-8 | 29,352.0413 | 2.8715 | 24.84 | 57.535 | 60.577 | 3.042 | 3.042 | 11.56 | 0.0264 |
| FX40-9 | 28,379.1914 | 2.7763 | 23.71 | 55.055 | 58.004 | 2.949 | 2.949 | 11.71 | 0.0379 |
| FX40-10 | 24,985.8269 | 2.4443 | 25.17 | 59.190 | 61.762 | 2.572 | 2.572 | 9.71 | 0.0117 |
| Mass Concentration (%) | Interfacial Tension (mN/m) | ||
|---|---|---|---|
| NP-10 | GPHQ-1 | FSD-952 | |
| 0.05 | 1.2789 | 5.8041 | 0.8116 |
| 0.1 | 0.5434 | 0.0762 | 0.3197 |
| 0.2 | 2.5823 | 0.2951 | 0.4919 |
| 0.3 | 4.5744 | 0.4919 | 0.3689 |
| 0.4 | 4.1317 | 1.4264 | 0.123 |
| 0.5 | 4.5484 | 2.1642 | 0.9592 |
| Serial Number | Semaphore Signaling Mechanism | Displacement Efficacy (%) | Export Assessment |
|---|---|---|---|
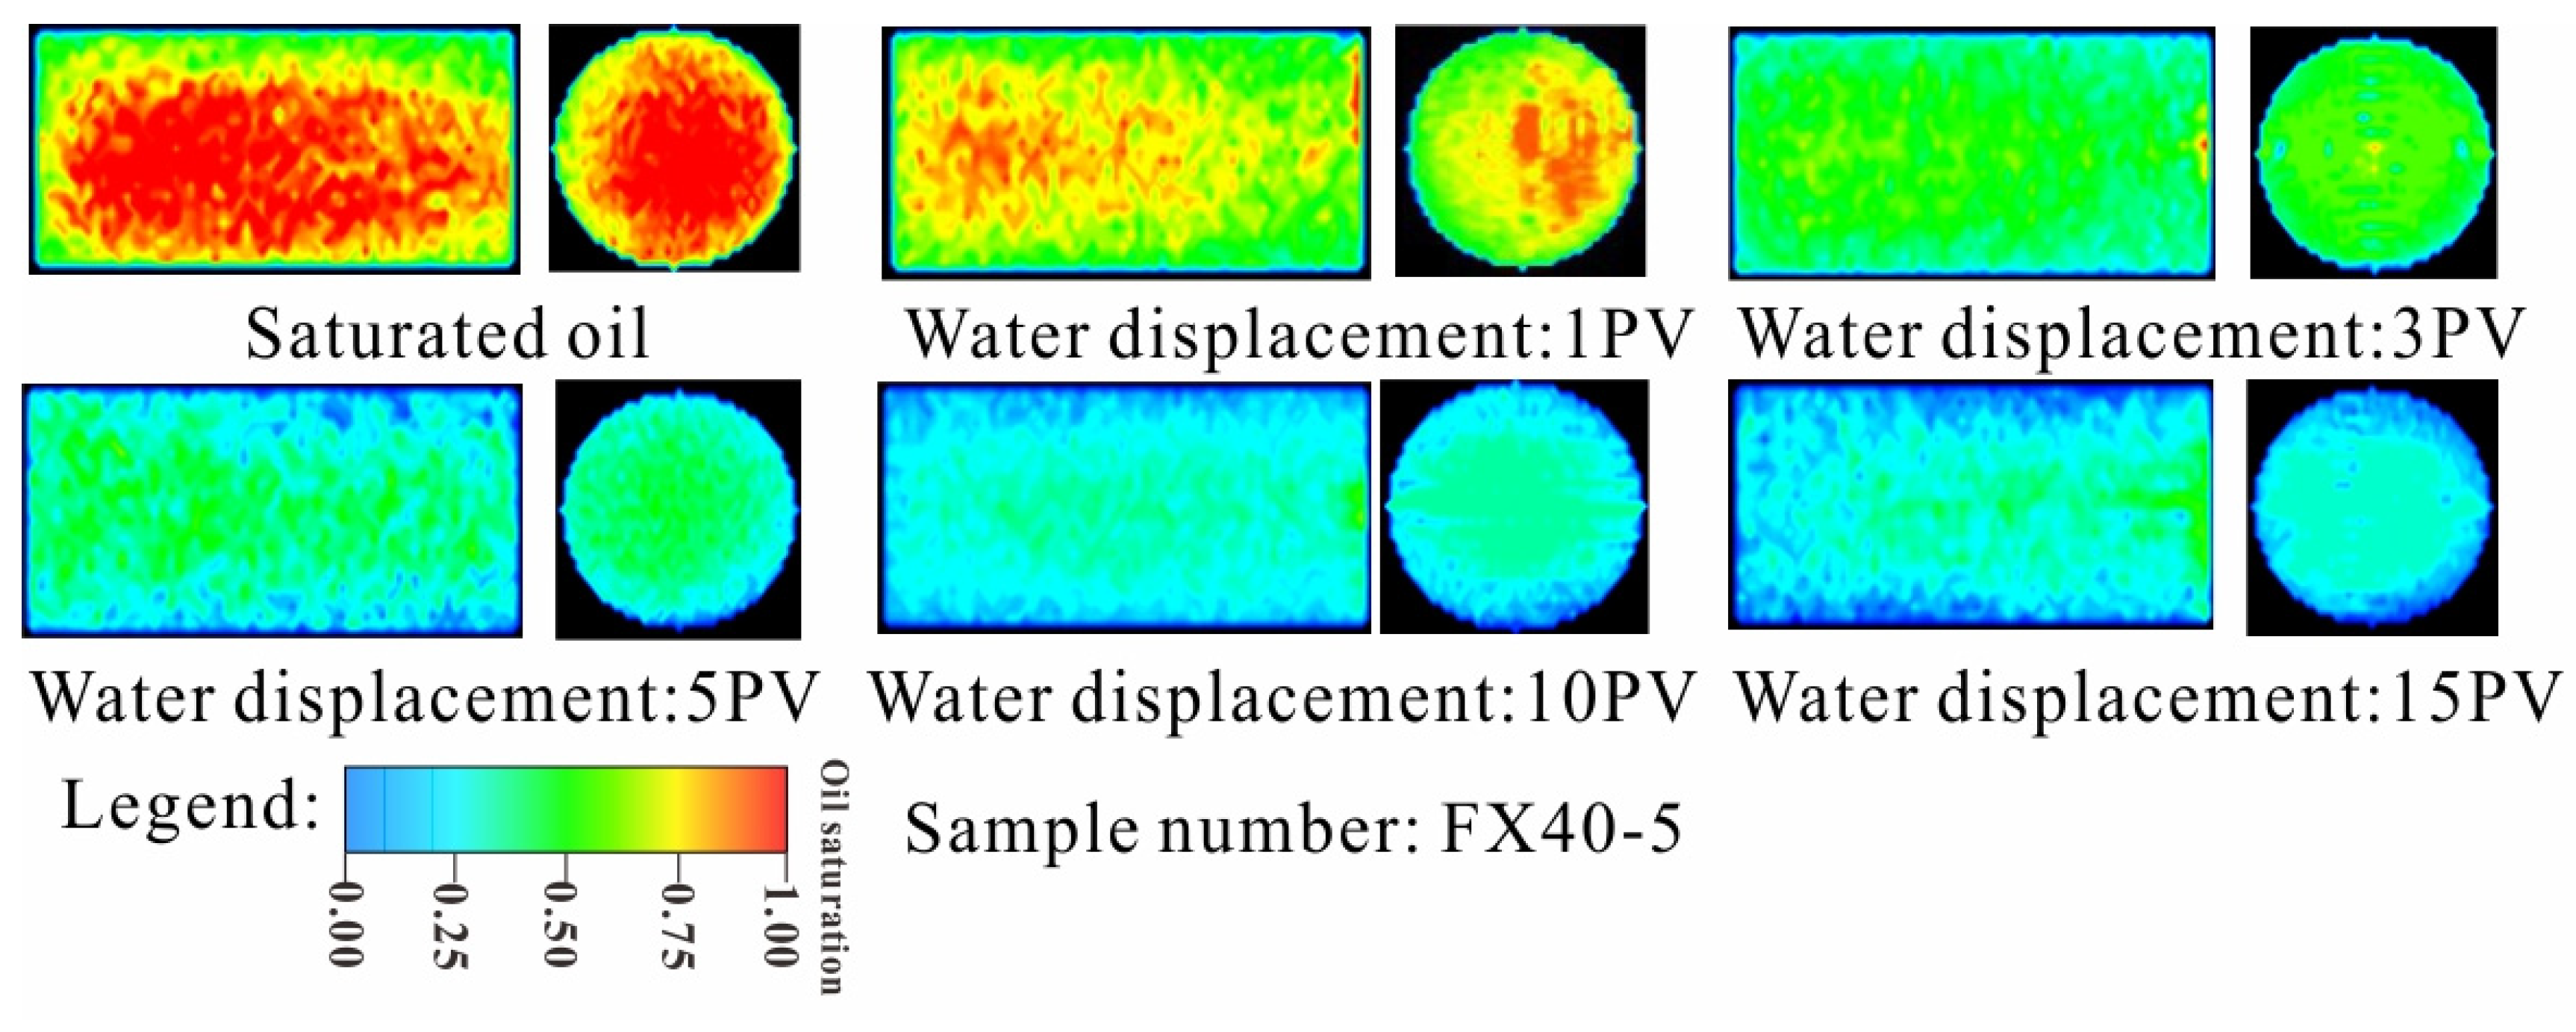
| Saturated oil | 12,232.50237 | \ | |
| Water displacement: 1 PV | 9959.651072 | 18.58 | Oil: 0.5 mL; Water: 2.1 mL |
| Water displacement: 3 PV | 6725.102383 | 45.02 | Oil: 1.2 mL; Water: 6.7 mL |
| Water displacement: 5 PV | 4867.58397 | 60.21 | Oil: 1.6 mL; Water: 11.7 mL |
| Water displacement: 10 PV | 3991.148893 | 67.37 | Oil: 1.8 mL; Water: 25.1 mL |
| Water displacement: 15 PV | 3859.676573 | 68.45 | Oil: 1.9 mL; Water: 38.6 mL |
| Serial Number | Semaphore Signaling Mechanism | Displacement Efficacy (%) | Export Assessment |
|---|---|---|---|
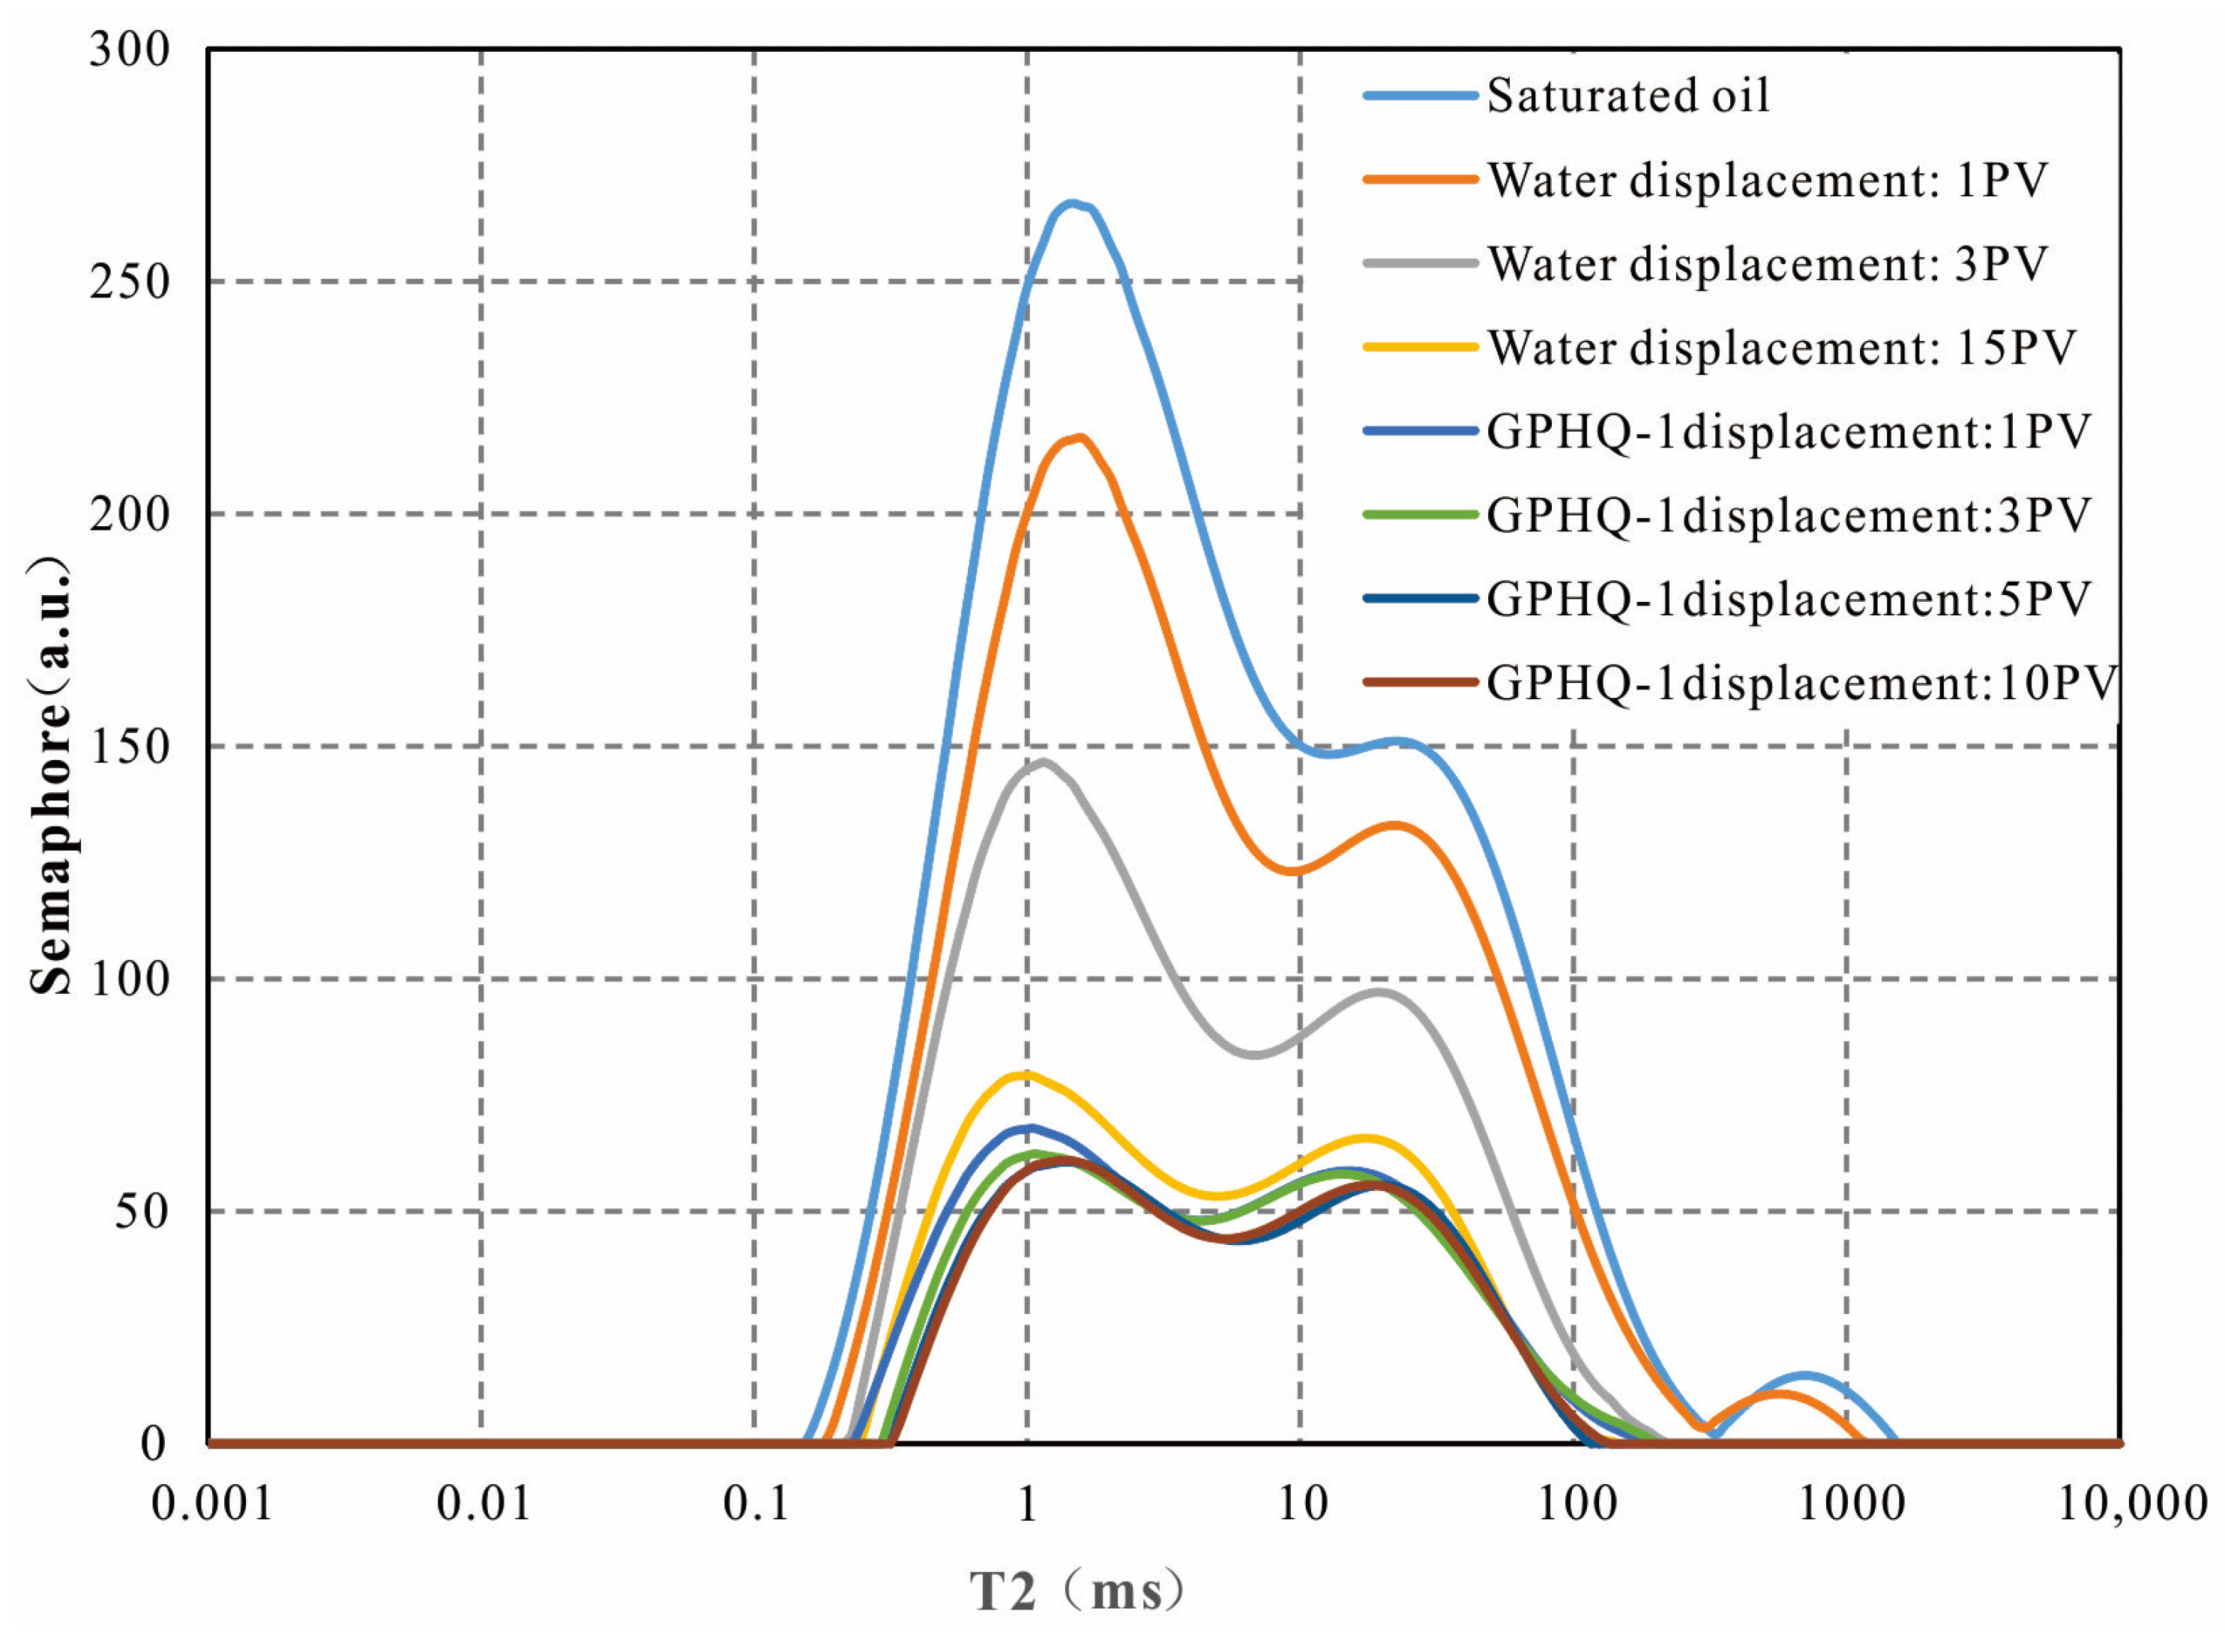
| Saturated oil | 13,140.52747 | \ | \ |
| Water displacement: 1 PV | 10,528.229 | 19.88 | Oil: 0.6 mL; Water: 2.4 mL |
| Water displacement: 3 PV | 6854.644385 | 47.84 | Oil: 1.4 mL; Water: 7.6 mL |
| Water displacement: 15 PV | 3982.990105 | 69.69 | Oil: 2.0 mL; Water: 43.3 mL |
| GPHQ-1 displacement: 1 PV | 3569.593656 | 72.84 | Oil: 2.1 mL; Water: 45.8 mL |
| GPHQ-1 displacement: 3 PV | 3336.725734 | 74.61 | Oil: 2.2 mL; Water: 51.9 mL |
| GPHQ-1 displacement: 5 PV | 3123.122055 | 76.23 | Oil: 2.3 mL; Water: 57.9 mL |
| GPHQ-1 displacement: 10 PV | 3105.888178 | 76.36 | Oil: 2.3 mL; Water: 73.0 mL |
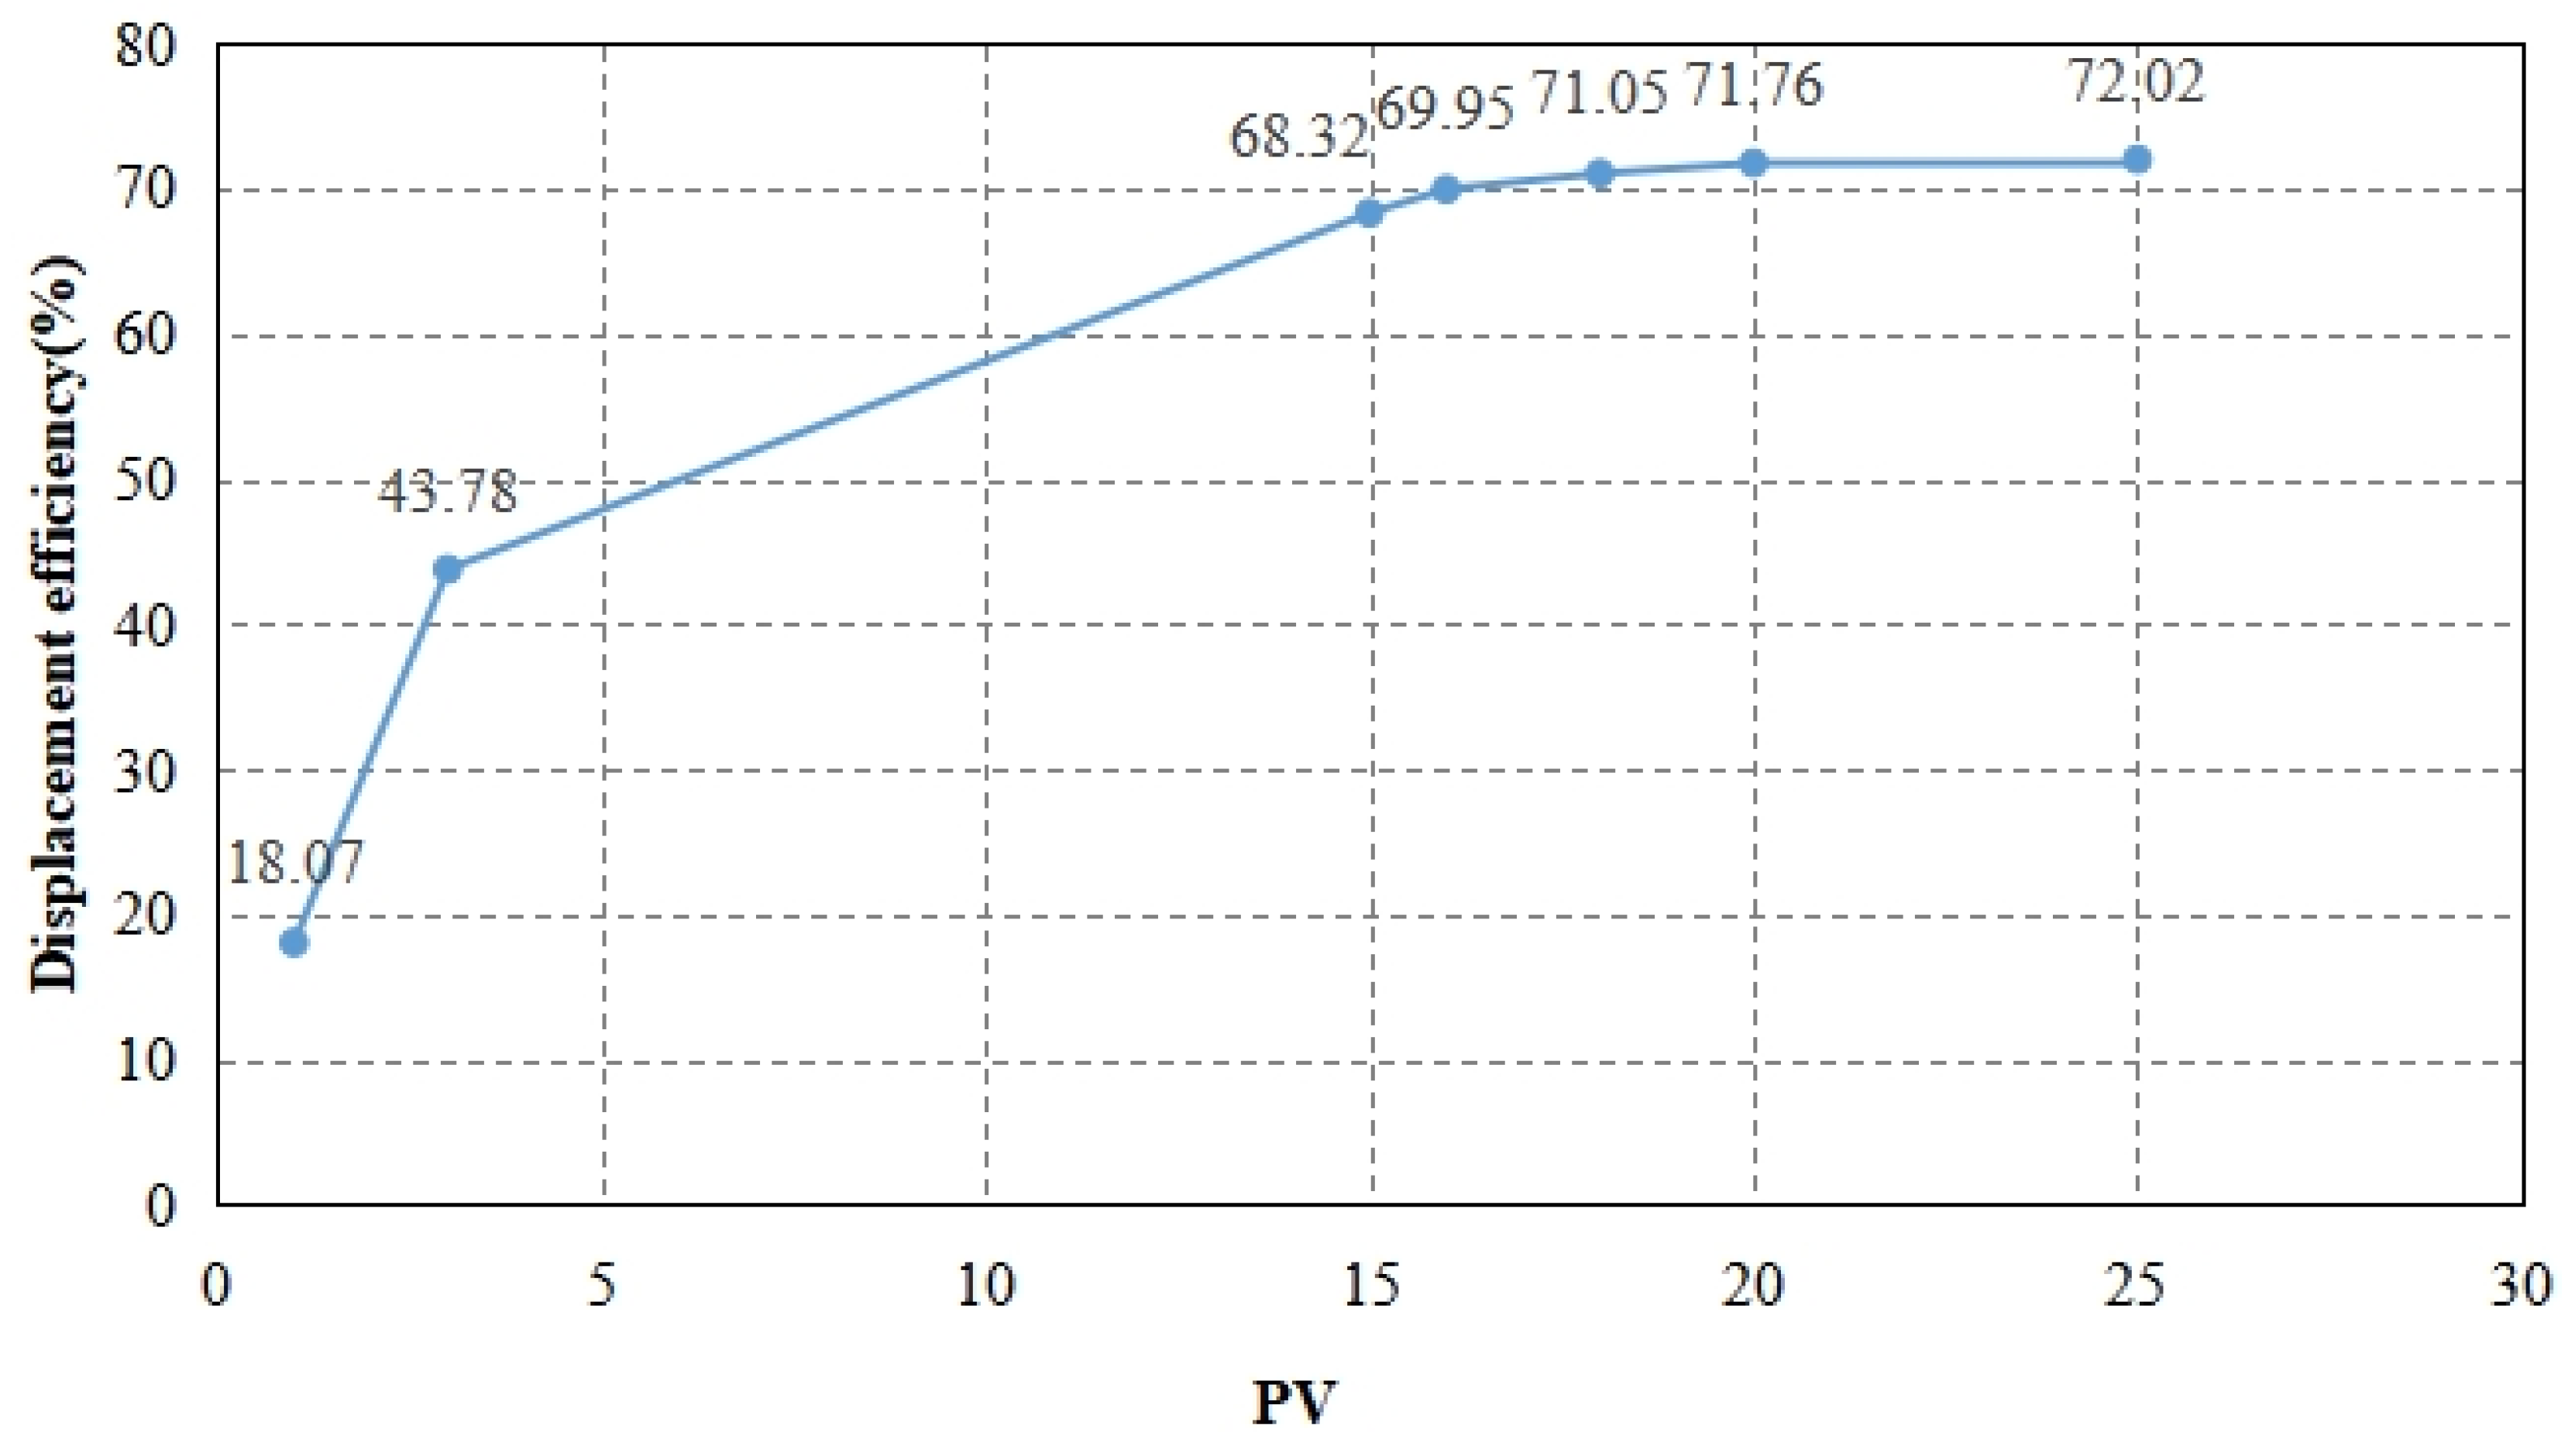
| Serial Number | Semaphore Signaling Mechanism | Displacement Efficacy (%) | Export Assessment |
|---|---|---|---|
| Saturated oil | 13,112.76797 | \ | |
| Water displacement: 1 PV | 10,743.60803 | 18.07 | Oil: 0.5 mL; Water: 2.4 mL |
| Water displacement: 3 PV | 7372.014108 | 43.78 | Oil: 1.3 mL; Water: 7.5 mL |
| Water displacement: 15 PV | 4154.704748 | 68.32 | Oil: 2.0 mL; Water: 43.1 mL |
| NP-10 displacement: 1 PV | 3940.328825 | 69.95 | Oil: 2.1 mL; Water: 46.0 mL |
| NP-10 displacement: 3 PV | 3796.351371 | 71.05 | Oil: 2.2 mL; Water: 51.5 mL |
| NP-10 displacement: 5 PV | 3703.289228 | 71.76 | Oil: 2.2 mL; Water: 57.8 mL |
| NP-10 displacement: 10 PV | 3668.95556 | 72.02 | Oil: 2.2 mL; Water: 73.3 mL |
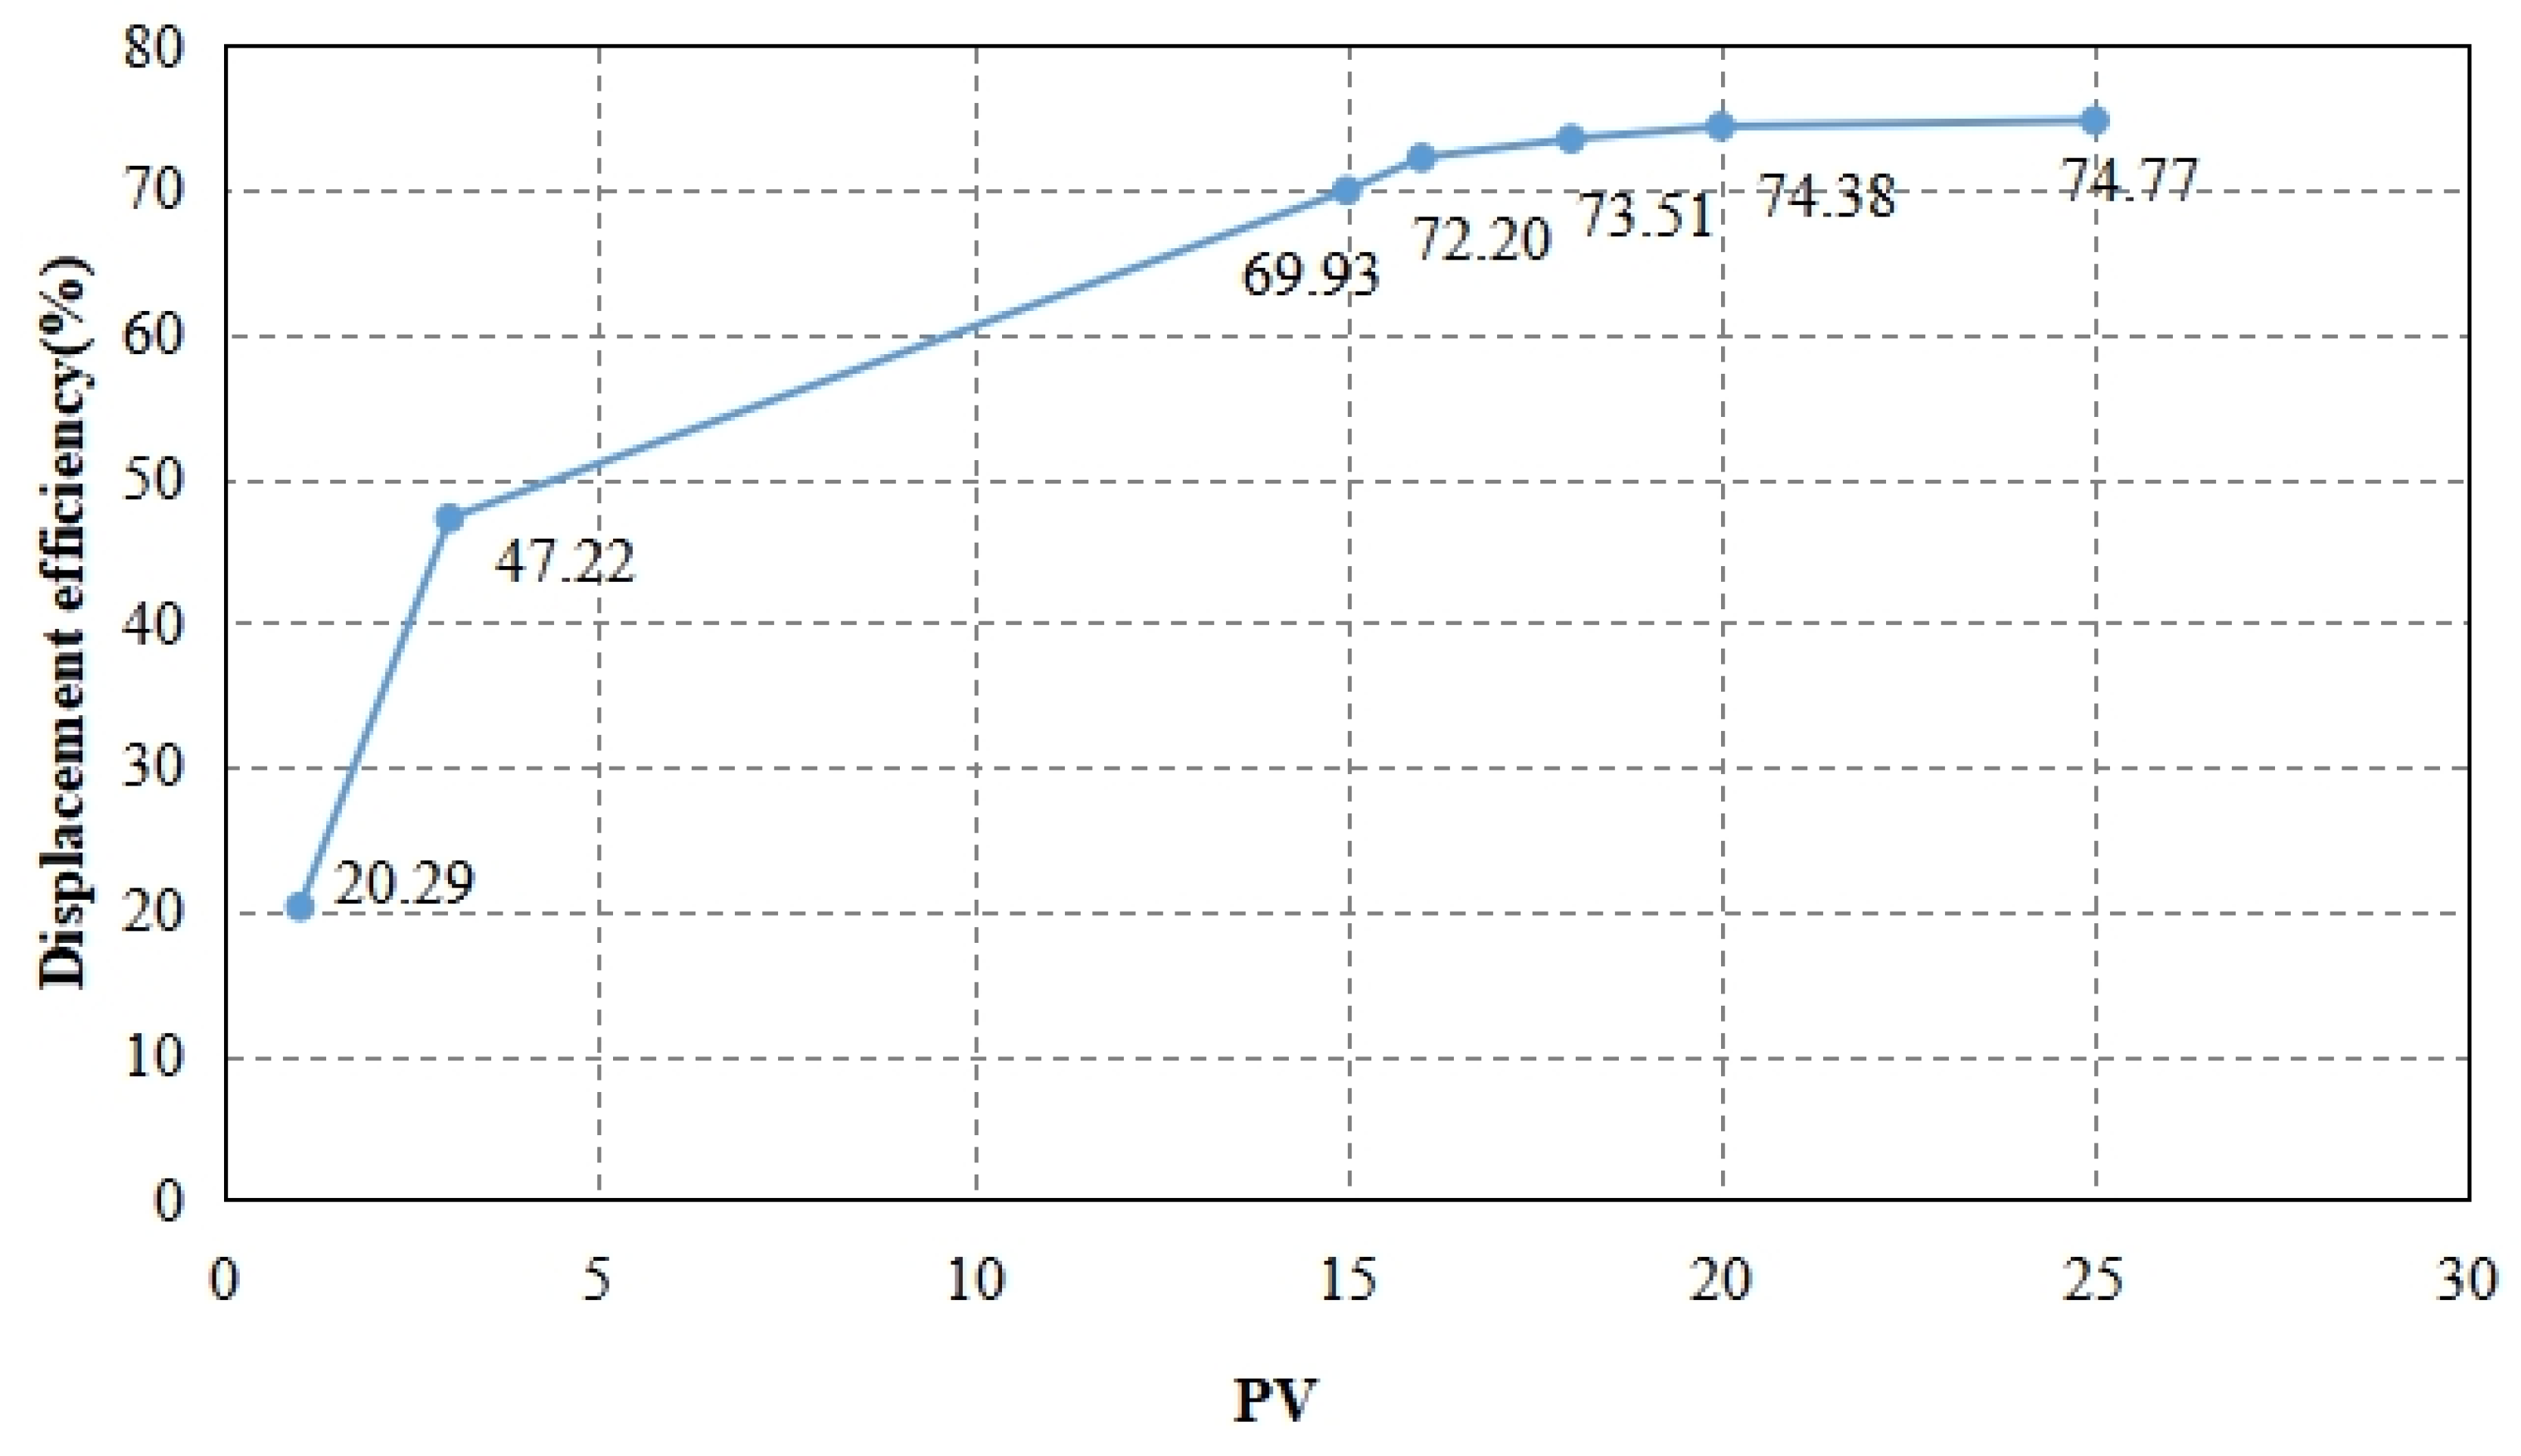
| Serial Number | Semaphore Signaling Mechanism | Displacement Efficacy (%) | Export Assessment |
|---|---|---|---|
| Saturated oil | 12,520.55878 | \ | |
| Water displacement: 1 PV | 9979.569271 | 20.29 | Oil: 0.6 mL; Water: 2.2 mL |
| Water displacement: 3 PV | 6607.750386 | 47.22 | Oil: 1.3 mL; Water: 7.2 mL |
| Water displacement: 15 PV | 3764.514041 | 69.93 | Oil: 1.9 mL; Water: 42.1 mL |
| FSD-952 displacement: 1 PV | 3480.752139 | 72.20 | Oil: 2.0 mL; Water: 44.2 mL |
| FSD-952 displacement: 3 PV | 3316.6376 | 73.51 | Oil: 2.1 mL; Water: 50.0 mL |
| FSD-952 displacement: 5 PV | 3208.011019 | 74.38 | Oil: 2.1 mL; Water: 55.8 mL |
| FSD-952 displacement: 10 PV | 3158.338058 | 74.77 | Oil: 2.2 mL; Water: 70.8 mL |
Disclaimer/Publisher’s Note: The statements, opinions and data contained in all publications are solely those of the individual author(s) and contributor(s) and not of MDPI and/or the editor(s). MDPI and/or the editor(s) disclaim responsibility for any injury to people or property resulting from any ideas, methods, instructions or products referred to in the content. |
© 2024 by the authors. Licensee MDPI, Basel, Switzerland. This article is an open access article distributed under the terms and conditions of the Creative Commons Attribution (CC BY) license (https://creativecommons.org/licenses/by/4.0/).
Share and Cite
Yin, H.; Zhong, G.; Liu, J.; Wu, Y. Quantitative Characterization of Surfactant Displacement Efficiency by NMR—Take the Tight Oil of Chang 8 Member of Yanchang Formation in Fuxian Area, Ordos Basin, as an Example. Energies 2024, 17, 5450. https://doi.org/10.3390/en17215450
Yin H, Zhong G, Liu J, Wu Y. Quantitative Characterization of Surfactant Displacement Efficiency by NMR—Take the Tight Oil of Chang 8 Member of Yanchang Formation in Fuxian Area, Ordos Basin, as an Example. Energies. 2024; 17(21):5450. https://doi.org/10.3390/en17215450
Chicago/Turabian StyleYin, Hu, Gaorun Zhong, Jiangbin Liu, and Yanjun Wu. 2024. "Quantitative Characterization of Surfactant Displacement Efficiency by NMR—Take the Tight Oil of Chang 8 Member of Yanchang Formation in Fuxian Area, Ordos Basin, as an Example" Energies 17, no. 21: 5450. https://doi.org/10.3390/en17215450
APA StyleYin, H., Zhong, G., Liu, J., & Wu, Y. (2024). Quantitative Characterization of Surfactant Displacement Efficiency by NMR—Take the Tight Oil of Chang 8 Member of Yanchang Formation in Fuxian Area, Ordos Basin, as an Example. Energies, 17(21), 5450. https://doi.org/10.3390/en17215450