1. Introduction
According to a recent report of the International Council on Clean Transportation (ICCT) [
1], in 2021 the transport industry accounted for a third of all CO
2 emissions and a quarter of all greenhouse gas emissions in the European Union, not including the indirect emissions produced by fuel creation and vehicle production. More importantly, the transport sector is almost the only sector, where, due to the increasing demand for freight transport by light- and heavy-duty vehicles, the emissions have been rising compared to 1990 [
2] and are expected to continue to rise without intervention.
To combat climate change, under the “Fit for 55” legislative package, the EU is committed to reduce its total emissions by at least 55% by 2030 (compared to 1990 levels) and to be the world’s first climate-neutral continent by 2050. To deliver on this commitment, the EU Commission has proposed specific EU regulatory CO2 reduction targets for 2030 in the problematic road transport sector, i.e., 55% and 30% reduction in CO2 emissions from cars and trucks, respectively. Through a back-casting methodology from these proposed targets, the European Automobile Manufacturers’ Association (ACEA) and its partners have calculated the necessary vehicle park composition and charging infrastructure developments that are necessary to reach the targets provided that decarbonization of the sector primarily happens via BEVs and stationary charging. Their “European EV Charging Infrastructure Masterplan” (EVCI masterplan for short) estimates that to reach the desired 2030 CO2-reduction targets economic actors need to make large annually investments until 2030 and beyond: EUR 8bn in charging infrastructure equipment and installation, EUR 4bn in grid upgrades, and EUR 7bn in renewables.
The importance of a timely roll-out of charging infrastructure that meets the spatial energy demand pattern of electromobility with matching charging supply capacity cannot be understated. The importance is also reflected in the more effective demand-driving-oriented pathway of the EVCI masterplan [
2] in which public charging infrastructure is rolled out faster initially. This is needed to drive the uptake of EVs [
3], but comes at the cost of lower initial charging network utilization that needs to be compensated by infrastructure development subsidies, which need to be strategically allocated. A charging supply pattern that closely matches the charging demand is also the foundation of electric transport operations on the infrastructure and the closeness of the match will ultimately determine the limits of charging infrastructure utilization and transport costs in an electrified road transport system.
To gain a better understanding of how many slow overnight chargers and public opportunity and destination fast chargers are needed at functional locations (homes, destinations, depots, terminals, and along main transport corridors of the TEN-T network) and thereby to reduce the fear of bad investments or lost assets in economic actors, the EVCI masterplan [
2] analyzes usage patterns of different types of vehicles and transports that they are used for. The EVCI masterplan even provides the spatial distribution of the chargers types at the country levels, for different regional archetypes (city/town/rural) and major highway corridors (e.g., see Exhibit 10 of [
2]), but these spatial insights do not consider the availability of charging space and power, and are static and coarse, which makes them less useful for practical site and network planning in the context of design challenges of an evolving landscape that is described next.
The infrastructure design challenge is manifold. First, the currently dominating home, depot, terminal, and destination charging behaviors shaped by the current but potentially quickly or abruptly changing technical capabilities (e.g., Megawatt Charging System (MCS) [
4] and new battery technologies [
5] representing longer vehicle ranges and shorter charging times, dynamic charging on Electric Road Systems (ERS) [
6,
7,
8,
9,
10,
11,
12], battery swapping [
13,
14], etc.) represent a major transport energy demand shift in space and time. Second, on the energy supply side, the access to, the cost of, and the development lead times of grid transmission capacity are limited at locations and times, are not known globally, and can be excessive, respectively. Furthermore, the grid capacity aspects are clearly network dependent. Third, the locations of current refueling infrastructures have evolved over a century to cater for the energy demands of a fossil-fuel- and internal-combustion-engine-based road transport system and are not aligned in space and service offerings with the energy and charging demand patterns of electromobility. In relation, the access to, the cost of, and the development lead times of the suitable new real-estate and services are also limited and can be excessive. Fourth, in addition to purchase and operations costs, vehicle adoption rates and their spatial patterns are to a large extent influenced by the accessibility and convenience of charging services. Finally, while policies, regulations, and subsidies can steer and to some extent coordinate infrastructure developments, charging infrastructure is primarily developed opportunistically and in competition by multiple economic actors of different types that have different and often conflicting business objectives. The above-described connected and moving parts are collectively referred to as deep uncertainties of transport electrification. There is a large body of scientific evidence that human reasoning and intuition cannot manage these uncertainties as they often fail to account for feedback loops, non-linearity [
15], and the important transport-route-based network dependencies in electromobility (see
Section 2.2). This failure leads to suboptimal and inefficient developments, a fear of lost assets, hesitant investments, and ultimately a slow transition.
The key role of charging infrastructure placement and dimensioning is widely recognized, and many researchers have developed methodologies and case studies to deliver decision support. For detailed literature reviews and summaries from different perspectives, see [
9,
16,
17,
18]. Methods can be broadly classified by their primary design data source, network design and optimization objectives, and system boundaries/focus for infrastructure planning. In terms of primary design data source, approaches rely on the road network [
19], vehicle counts, traffic flows, or Average Annual Daily Traffic (AADT) [
18], origin–destination flows [
17], transport routes [
9], or subsets of GPS logs [
16]. For network design and optimization objectives, methods focus on ensuring even network coverage [
18], maximizing demand coverage by optimizing flows passing through (with or without double counting and accounting for multiple stops) [
9,
17,
18], or utilizing logistics patterns, such as stop frequency and duration [
16], or driving time and rest regulations [
17]. Lastly, system boundaries and focus for infrastructure planning vary, from charging infrastructure in the transport network to power distribution network planning, or an integrated approach [
20]. In relation, the herein proposed data-driven SDSS primarily uses transport routes to design and optimize for demand coverage that maximizes the flows passing through without double counting and considering multiple stops due to range limitations. However, the proposed planning methodology and SDSS is in sharp contrast to the single objective, single economic actor focused, and static decision support that many previous work provides as follows. First, it supports a user to evaluate and optimize charging plans under different transport electrification scenarios from/with multiple user-defined perspectives/objectives. Second, it implements a generic, interactive, and incremental charging network planning process that supports infrastructure developers in multiple types of analysis (network location validation and ranking, network expansion, etc.). Third, it supports the dynamic adaptive planning paradigm [
15] to manage the deep uncertainties related to access and cost of grid capacity and real-estate and the impacts of competition from multiple independent actors. Finally, the methodology can be applied in collaborative planning practices to support the efficient allocation of charging infrastructure subsidies.
With this background in mind, the aim of this research is to design and test dynamic adaptive planning and a system to enable stakeholders to make evidence-based and objective plans for transport scenarios under the deep uncertainties of the domain. The main contributions of this paper are as follows. First, this paper presents a detailed account of some of the deep uncertainties of the transport electrification and charging infrastructure planning domain. Second, this paper introduces and motivates the necessity of route-based network concepts for demand-centric charging network design. Third, this paper presents the design principles, components, dynamic adaptive planning support, analytic features, and map-based interfaces of an SDSS that has been interactively developed based on feedback of 33 industrial stakeholder organizations in commercial co-creation activities. Finally, this paper presents the views of the stakeholders about the three aforementioned contributions of the paper.
2. Materials and Methods
The general approach to address the above application-specific decision support needs used
co-creation to understand and effectively address the decision makers’ needs and organizational settings [
21] as well as to accelerate product innovation and development and digital industrial transformation [
22].
Section 2.1 outlines deep uncertainties in transport electrification.
Section 2.2 discusses the demand-centric, route-based network design approach, which plays a crucial role in optimizing the planning process. Finally,
Section 2.3 details the components, analytic tools, and planning features of the prototyped decision support system, which were designed to address these considerations effectively. Finally,
Section 2.4 describes the co-creation activities that fueled the iterative product refinement based on customer feedback.
The design methodology is rooted in three generic decision support design principles:
Responding to Deep Uncertainties: First, the SDSS must adapt to deep uncertainties [
23], such as fluctuating grid capacities, evolving charging behaviors, and changing policy frameworks, by integrating new data as it becomes available [
24].
Demand-Centric Charging Network Design: Second, plans, especially network plans, are holistic, i.e., the parts of the plans depend on each other and when a part is changed, potentially all parts of the plan have to be re-evaluated and potentially revised [
25] (see
Section 2.2).
Dynamic Adaptive Planning Support in SDSS: Finally, while data, analytics, visualizations, models, and simulations can aid a user in making rational decisions by enforcing that the decisions fulfill multiple criteria or maximize one or more objectives, for a number of reasons any successful computerized decision support system has to allow its users to freely alter a plan regardless of its criteria fulfillment or optimality [
26].
2.1. Deep Uncertainties in Transport Electrification
Deep uncertainties are those that cannot be quantified or predicted with precision, due to a lack of historical data or constantly evolving conditions [
23]. Unlike risks, which can be assessed probabilistically, deep uncertainties are characterized by a lack of knowledge about future developments. This is particularly relevant in transport electrification, where rapid technological advancements, shifting policies, and emerging market dynamics continually reshape the landscape, making long-term infrastructure planning inherently uncertain.
Shortcomings of a Static, One-Fits-All Charging Infrastructure Masterplan
An important consideration in the realm of transport electrification is the skepticism towards a static, one-size-fits-all charging infrastructure masterplan. Although such masterplans (e.g., [
2]) can be useful to guide the forming of policy instruments at different levels, they have limited practical utility for the various types of individual organizations that take up different implementation roles in the transport electrification ecosystem.
Table 1 outlines the key deep uncertainties that individual organizations should consider when formulating transport electrification strategies and making investment decisions.
Given their unique opportunities, resources (financial, real-estate, technology, etc.), business challenges, objectives, and strategies, individual organizations combine and weigh the above aspects and devise strategies and investment and implementation plans to roll out more often than not competing charging infrastructure networks. In such a setting, a single masterplan has limited utility.
2.2. Demand-Centric Charging Network Design
For the purposes of long-term charging infrastructure planning, the geometries and weights of transports along routes on a road network can accurately capture most important aspects of transport electrification [
36]. These include the energy-use of vehicles, their arrival State of Charge (SoC) and hence charging demand at stations in a network, as well as which transport routes enable the full electric operations of a network of stations. In particular, as
Figure 1 illustrates, under a logical energy-use and charging behavior model (described in
Section 2.3.2), the charging demand (e.g., number of charging sessions) has only a weak relation to the traffic flows or vehicle counts. Furthermore, the charging demands at stations in a network affect each other. On one hand, two nearby stations can serve the charging needs of a specific transport route and thereby loose charging demand to each other. On the other hand, as the network is expanded with a station (see Plan B in
Figure 1), the expansion can enable the electric operations of new transport routes and thereby generate charging demand on other stations. The losses tend to be more local and are not merely based on the road network distance between stations but rather on the transport work along the transport routes that link the stations. In comparison, a network expansion can induce charging demand at
any station in the network.
The importance of route-based aspects in estimating charging demand and battery electric operations enablement (for short BEV enablement) of transport routes is shown in
Figure 1. Through a simple example that makes logical assumptions about energy-use and charging behavior, the figure illustrates that (1) traffic flows (aka vehicles counts) do not contain the necessary information to accurately calculate the charging demand or BEV enablement of a single or a network of stations and (2) that one cannot determine and meaningfully talk about such Key Performance Indicators (KPIs) as charging demand and BEV enablement for a single station in isolation but only in relation to a network of stations. The latter aspects are also referred to as network dependence and network effects.
The example assumes a logical simplified energy-use model that is also used in industry and in commercial practice. Namely, that the energy that vehicles use is directly proportional to the transport weight (Gross Transport Weight (GTW) or Gross Combined Weight (GCW)) and the transport route, i.e., the path that the truck takes in the road network from the origin to the destination of the transport. While the weather, the vehicle’s speed, the road elevation profile, and road surface along the route can substantially affect the energy-use, in practice an average or worst-case scenario for these variables can be, should be, and is assumed for long-term resource planning. Consequently, the energy-use of a transport route can be modeled as the product of the transport weight and transport route length. In the example, the width of the lines as well as the truck symbols represent the transport weights of three transport routes. The length of the transport routes is proportional to the depicted line length. The examples also assume a realistic charging behavior where a truck only stops to charge at a station if the SoC, shown as a color shade between green (100% SoC) and black (0% SoC), of the truck is below a threshold (e.g., 30% SoC)
and without charging the truck would not be able to reach its destination or the next station on its route. Additionally, it is assumed (but is not illustrated in
Figure 1) that the charging of a truck is limited by its battery capacity and a maximum charging time, which in practice is often set to the minimum length (45 min) of the regulated rest stop that drivers have to take every 4.5 h.
Given these logical assumption, Plan A on the left shows a station that three vehicles pass through, i.e., the traffic flow is 3. Yet only the 40 t truck will stop to charge, representing 1 charging session in the amount that the 40 t truck needs to complete its route. Notably, the 20 t truck does not need to charge to complete its route and the 30 t truck is not even able to reach the station and hence the charging network does not enable the electrification of this transport route. In Plan B, the network is expanded with a second station to the left of the first station. In this case both the traffic flow and the charging sessions is 1. The addition of the second station also enables the electric operation of the 30 t truck. Notably, this also increases the number of charging sessions and the amount of charging demand at the first station. But in general, the addition of a station more often than not decreases the number of sessions and charging demand at other stations in the network because a truck has generally more opportunities to acquire the same energy it needs to complete its route. Hence the total charging demand is spread across a larger supply of charging stations. These impacts of stations on each other are called route-based network impacts in charging demand. As the example illustrated, other KPIs like BEV enablement are also governed by route-based network impacts. Other relevant aspects and KPIs of transport electrification that are governed by route-based network impacts include grid load and flexibility, dynamic pricing opportunities, feasibility of e-fleet operation, charging queues and charger utilizations, charging network resilience, as well as vehicle adoption and customer journey, which are related to concept of BEV enablement. Notably, the impacts of any change in the network are impossible to estimate accurately without simulating the energy-use and charging behavior of the trucks that are operated on the transport routes. Through a little thought process, one can also see that the impacts can propagate to virtually any part of the network and can either be positive of negative for a given KPI.
Finally, from a charging network planning perspective, the example illustrates that the traffic flows (aka vehicles counts) do not contain the necessary information to accurately calculate the number of charging sessions and amount of charging demand or any of the other KPIs. In fact, the only relation that exists between the traffic flow and the number of charging sessions at a station in a network is that the number charging sessions is always less than or equal to the traffic flow. In other words, this states the obvious that “some of the vehicles that pass by will stop to charge”. How many and which vehicles and how much they will charge are simply impossible to calculate from traffic flows. So planning and optimizing the KPIs for a network of stations with traffic flows is doomed to yield suboptimal results. In fact, experimental results have shown that plans derived with so-called route-based network analytics for locations such as charging demand in network, charging demand from electrified routes, increase in number of electrified routes, and increase in ton-km of electrified routes can increase charging demand and BEV enablement KPIs by several factors. For example, for light commercial vehicles (taxis), methods using route-based network analytics can find electric road placements that electrify up to 4 times as much transport work than methods that optimize the placement based on traffic flows [
9].
Charging Network Demand Concepts
A number of route-based network demand concepts and analytics are at the heart of the SDSS. The more central concepts and analytics include route catchment, demand in isolation, demand loss in network, demand in network, demand from fully electric, total network demand, demand gain, and BEV enablement. The more detailed definitions of the concepts are as follows:
Route Catchment: The route catchment of an existing or planned charging infrastructure location is the set of transport route parts where the energy used along the transport routes towards the location could be replenished at the location according to the transport electrification scenario.
Demand in Isolation: The energy that vehicles would charge at the location if the network consisted of only one station at the location according to the transport electrification scenario. The demand values refer to the maximum demand that the charging behavior model allows in the transport electrification scenario. In particular, it is only limited by the vehicle’s arrival SoC and battery size, the maximum rest stop duration, and the charging power. This means that some vehicles charge more than they need to complete their transport routes.
Demand Loss in Network: The part of the demand in isolation of the location that is lost to other stations in the network. This loss is a consequence of the charging (behavior) model of the transport electrification scenario. Specifically, stations that share parts of their route catchment have the ability to cater for the transport energy demand of the shared parts. Alternatively, a vehicle with a route that has parts in the shared route catchment of two stations can potentially charge at either one or at both of the stations according to the charging (behavior) model. Effectively, the two stations share part of the transport energy demand of the route. It is important to note that stations can suffer losses due to and inflict losses on other stations in the network. The loss suffered between two stations is not reflexive, i.e., the loss of station A due to station B is not the same (in terms of value and source) as the loss of station B due to station A. Finally, the losses can also be subdivided based on the customer and competitor network memberships of the respective stations, which a user might logically want to minimize or maximize in their network design.
Demand in Network: The expected maximum energy that vehicles would charge at the location accounting for the demand losses or sharing in the network according to the transport electrification scenario. This is a maximum value assuming that all transport routes can be operated in fully electric mode. It assumes that other stations outside of the simulated network enable the vehicles to complete their routes, representing an optimistic demand estimate where these external stations do not inflict demand loss.
Demand from Fully Electric: The expected energy that vehicles would charge at the location accounting for demand lost to other stations in the network in the given transport electrification scenario. In contrast to demand in network, this value only includes demand from transport routes that can be operated in fully electric mode from origin to destination on the analyzed charging network. This represents a more realistic demand estimate since it only includes routes that the network enables to operate in electric mode.
Demand Gain: The utility or “benefit” of adding a location to the network accounting for the demand lost to and demand losses inflicted on other stations in the network.
Total Network Demand: The sum of the demand in network values of all the stations in the network.
BEV Enablement: The number of transport routes, the number of vehicle-kilometers (vkm), or the transport work in ton-kilometers (tkm) that can be carried out in fully electric operations. Moreover, BEV enablement is defined for single station or a set of stations (i.e, network). Finally, the increases or decreases in BEV enablement are defined for the addition or deletion of stations (s) to and from a network. BEV enablement is central to the ‘customer journey’ concept that is widely used in marketing and sales to optimize the experience customers.
2.3. Dynamic Adaptive Planning Support in SDSS: Components and Analytic and Planning Features of the SDSS
At the core of the SDSS,
dynamic and
adaptive planning empower users to make decisions that are responsive both to immediate changes and long-term shifts in the competitive landscape.
Dynamic Planning refers to the ability to continuously adjust decisions based on real-time information about changes in external conditions, such as competitor actions. This approach emphasizes flexibility and responsiveness, allowing users to optimize their strategies in response to immediate changes [
15].
Adaptive Planning involves creating strategies that are robust under uncertainty and capable of evolving over time. This approach allows users to adjust plans based on long-term feedback, ensuring that strategies remain effective as new information becomes available [
15]. By combining both dynamic and adaptive elements, the SDSS provides a comprehensive decision support framework that allows users to react swiftly to present challenges while continuously improving their plans for future growth.
The SDSS facilitates dynamic planning by providing updated data on competitor station deployments, allowing users to make timely adjustments to their network strategies. By integrating data from multiple sources, the system offers scenario simulation tools that enable users to evaluate and implement revised strategies in real time. In supporting adaptive planning, the SDSS enables users to refine long-term strategies based on charging utilization data. After station deployment, the system tracks usage patterns to guide the users in the iterative adjustment of future plans. Additionally, the SDSS includes scenario-based planning tools that allow users to explore potential market and infrastructure developments, adapting strategies as new information becomes available, thus enhancing long-term network resilience and performance. By integrating both dynamic and adaptive planning capabilities, the SDSS equips users with a flexible decision-making framework. This framework supports adjustments to immediate challenges while enabling continuous refinement of strategies to address evolving market conditions and uncertainties. As a result, the system ensures that network design remains optimized and resilient, meeting both present and future demands.
To support the dynamic and adaptive planning under deep uncertainty, this section provides an overview of the main components and analytic features of the SDSS.
Section 2.3.1 introduces the geographical data layers and synthetic transport route datasets that form the foundation of the SDSS.
Section 2.3.2 details the structure of transport electrification scenarios, including transport routes, electric vehicle models, energy-use models, charging behaviors, and the network of charging stations. The Multi-Criteria Evaluation (MCE) framework, which is used to assess location suitability, is discussed in
Section 2.3.3.
Section 2.3.4 introduces methods for transport electrification scenario evaluation and charging network optimization.
Section 2.3.5 covers the interactive planning process, enabling users to analyze multiple scenarios. The SDSS interface with its key analytical components is presented in
Section 2.3.6.
Section 2.3.7 discusses reporting capabilities for scenario analysis and station performance.
Section 2.3.8 details the system’s adaptations for collaborative planning, with a focus on the Regional Electrification Pilots (REPs) and other strategic applications. Finally,
Section 2.3.9 provides an overview of the SDSS prototype and its functionalities for infrastructure planners.
2.3.1. Data
Since several aspects have to be considered during planning, the designed SDSS contains a collection of geographical data layers across Europe that are harmonized and kept up-to-date for easy decision-making. The layers include the existing charging stations, the truck stops with their services, and the patterns of commercial logistics in the form of the prevalence of short and long truck stoppings from the ACEA analysis [
16]. For Sweden, the layers also include the high/medium voltage grid transmission/distribution lines, the locations of regional transformers, the terrain-and-land-cover-based cost estimate for 10 MW grid connection to nearest regional transformer, and the restriction and priority areas for subsidies.
Table 2 provides a comprehensive overview of the number of some of these features by country. It should be noted, however, that certain critical geographical data layers, such as high/medium-voltage grid lines, regional transformers, and designated priority subsidy areas, are available exclusively for Sweden.
Finally, but most importantly, in order to support the transport-demand-centric charging infrastructure design according to the concept in
Section 2.2, the layers include 100 s of millions of synthetic annual freight and long-distance private car trips across 26 countries in Europe based on the ETISplus project [
37,
38]. The details of the information sources and the synthetic route data generation process are described in the following paragraphs.
Synthetic Annual Freight and Person Transport Route Data: The process used to generate the route data builds upon the methodology of researchers from the Fraunhofer Institute for Systems and Innovation Research and the Karlsruhe Institute for Technology (KIT) [
39]. The Fraunhofer/KIT methodology uses data collected during the ETISplus project [
37]. During the ETISplus project, 17 participants gathered the annual flow volumes of passengers and freight transported throughout Europe from different EU and national sources. Then, they iteratively calibrated the parameters of a logistics and a travel model until the models’ outputs closely aligned with observed data, e.g., known totals, average distances per ton, and measured traffic flows on the roads [
38]. The main output of the calibrated ETISplus models are the origin–destination (OD) matrices per transport mode and trip purpose between 1,675 Nomenclature of Territorial Units for Statistics [
40] (NUTS-3) regions [
41].
The Fraunhofer/KIT methodology can be summarized as follows. For each pair in the OD matrix, the centroids of the NUTS-3 regions are determined and the least-cost path between origin and destination is calculated using Dijkstra’s algorithm. A simplified road network of ETISplus, containing all E-roads and other essential roads and ferry connections for freight transport, is used to allocate the entire freight traffic flow between the OD pair to the corresponding single least-cost path [
39].
The Fraunhofer/KIT methodology has some shortcomings when it comes to estimating the charging demand. All inter-regional routes between an OD NUTS-region pair use the same route. Transport movements within individual regions are not at all represented. Combined with the simplification of the transport network, the routing simplifications mean that the actual freight transport on a substantial part of the roads is not represented. Finally, the transport mass on the individual routes between two regions is assumed to be constant based on the average annual transport weight between regions, which is approximately the same between countries [
42].
The route generation process for the SDSS refines the Frauenhofer/KIT methodology to eliminate the above-described shortcomings as well as extends it to include the routes for long-distance private car trips as follows. The refined process uses the original and more comprehensive road network of ETISplus, which also included major arterial roads and has a total of 58,453 links.
The refined process also eliminates the assumption that all transports between a NUTS-3 region pair use a single route between the network nodes that are closest to the centroid of the respective NUTS-3 regions. Specifically, using population counts from WorldPop [
43] as proxies for transport demand, the refined process first approximates the likelihood of a network node being the origin or destination of a transport route with the number of inhabitants that live closest to the network node. Then, for each NUTS-3 region pair, the refined process calculates the top
most likely node pairs, routes between them, and assigns the number of transports to the routes proportional to the likelihood of the node pair or route.
To eliminate the uniform transport weight shortcoming, based on statistics of truck fleets and their operations in Sweden and Germany from Eurostat [
44], the refined process probabilistically assigns higher transport mass in four classes (10 ton, 20 ton, 30 ton, and 40 ton) to longer transport trips.
To support the planning of fast-charging infrastructure for private cars, using a similar methodology based on the private car OD matrices from ETISplus with constant 2 ton car weight, the refined process also calculates the routes for long-distance private car trips over 200 km.
Statistics about the so derived synthetic annual transport route dataset in terms of the number of routes and related data file sizes for freight and long-distance private cars in 26 European countries are shown in
Table 2.
It is important to note the above-described datasets are included by default, but the SDSS is built in a modular fashion so that new data layers can be added to it. These layers can be system-wide global layers or could be user-specific per country. Information in these new layers can be combined with the default layers for comprehensive decision-making via a multi-criteria evaluation framework (see
Section 2.3.3). More importantly, it is important to note that the transport route dataset can be filtered by route length, transport weight, and vehicle class (truck vs. car) to support the planning of charging networks for different transport applications. Finally, the default transport route dataset can be replaced with datasets that represent the transport energy demand of specific fleets (e.g., trucks of a specific logistics company, taxis, or buses of a transit network) and can be derived from alternative sources (e.g., fleet management systems, transport management system, or mobile phone data).
2.3.2. Transport Electrification Scenarios for Electrified Road Transport System Simulations
At the core of the SDSS are data-driven simulations of an electrified road transport systems according to user-defined transport electrification scenarios. A specific Transport Electrification scenario (TE scenario) is defined by five key components: (1) a transport route dataset, (2) an electric vehicle model, (3) an energy-use model, (4) a charging (behavior) model, and (5) a network of charging stations.
Transport route dataset: The transport route dataset forms the foundation by providing a collection of transport routes that represent the transport of goods or people within the road network. Each transport route is characterized by its total mass, which includes the mass of both the vehicle and its cargo, moving from an origin to a destination along a specific route. The route itself is represented as a series of interconnected edges within the road network. To maintain a consistent spatial resolution throughout the system, the edges of the road network are further divided into segments with a maximum length of 5 km.
Electric vehicle model: The SDSS incorporates an electric vehicle model that is characterized by its battery size, measured in kilowatt-hours (kWh), and the initial SoC at the beginning of each transport route. While these variables can be uniquely defined for each transport route, the SDSS offers user-friendly configuration options. For instance, the user can specify the battery size for the heaviest transport weight class, which, in the default synthetic datasets, is 40 tons. The system then automatically scales the battery sizes proportionally for lighter transport weight classes, such as 30 t, 20 t, and 10 t. A similar approach is applied to the initial SoC, which can be uniformly set for all transport routes to simplify the configuration process.
Energy-use model: The energy consumption of an electric vehicle on a specific transport route is influenced by a complex interplay of factors, including the vehicle’s energy efficiency, weight, speed, road conditions (like inclines and surface type), and external elements such as weather. To effectively address this, the SDSS utilizes a simplified yet powerful energy-use model. This model estimates energy consumption by considering the total mass of the vehicle and cargo, the length of the route, and a user-defined energy-use coefficient, expressed in kWh per ton-kilometer (kWh/tkm). As with the battery size, the user can define a single energy-use coefficient for the heaviest transport weight class (40 t in the default datasets), which is then linearly scaled to up to a certain percent (e.g., 200%) for lighter transport weight classes to reflect their typically higher energy consumption per ton-kilometer. This simplified energy-use model provides a practical approach for long-term charging infrastructure planning. Importantly, the model allows for future expansion to incorporate additional factors that can impact energy-use, potentially varying along the route, such as road elevation profiles, surface types, and vehicle speeds. This can be achieved by integrating a kinetic vehicle model or a parametric statistical model that is estimated from real-world energy consumption observations from a fleet management system.
Charging (behavior) model: A core component of TE scenario is the charging (behavior) model, which determines where and how much vehicles charge along their transport routes. The model offers two configurable options to simulate different charging behaviors. The first option mandates vehicles to stop and charge at every charging station they encounter along their designated route. In contrast, the second option enables a more dynamic charging strategy where vehicles only stop to recharge if their arrival SoC at a particular station falls below a user-defined minimum SoC charging threshold. Regardless of the selected configuration, the amount of charge a vehicle receives during a stop is restricted by (1) the available storage capacity of the vehicle battery (i.e., ), (2) the amount of charge that the vehicle’s battery can be charged with using the charging power of the charger during a maximum rest stop duration, and (3) the minimum charge amount that the vehicle needs to complete the route in electric mode. That is, a vehicle charges just enough and arrives at the destination with 0 SoC unless the energy stored in the vehicle battery initially is more than the energy that is needed by the transport route according to the energy-use model.
Network of charging stations: The final component of TE scenario is a network of charging stations where charging is possible. It represents the charging supply for the transport energy demand of the transport routes in the scenario.
2.3.3. Multi-Criteria Evaluation Framework
The SDSS adapts a Multi-Criteria Evaluation (MCE), a widely used method in Geographic Information Systems (GISs), to evaluate the suitability of locations from multiple perspectives [
45]. The MCE methodology in the SDSS calculates spatial proximity factors derived from geographical layers (
Section 2.3.1) and integrates analytical factors based on charging network demand concepts (Section Charging Network Demand Concepts). A single suitability score is generated for each location based on the user’s preferences, which can be used for comparing, ranking, and planning infrastructure roll-outs.
To support detailed analysis, the SDSS distinguishes between factors, which influence the suitability score, and constraints, which define whether a location is feasible. Factors such as charging demand or proximity to existing infrastructure positively impact suitability, while factors like grid connection costs might decrease it. Constraints are binary and exclude unviable options. The system’s scoring process assigns weights to factors based on their relative importance, ensuring that both positive and negative influences are appropriately scaled. The final scores, normalized between 0 and 100, enable straightforward comparisons across locations, and predefined weight templates simplify the process by prioritizing specific planning goals, such as optimizing demand or balancing logistics.
The factors listed in
Table 3 are divided into key areas such as proximity to infrastructure, charging demand, competition effects, and grid considerations. These factors help guide the evaluation of locations, enabling planners to balance the various competing objectives involved in charging infrastructure roll-out.
2.3.4. Transport Electrification Scenario Evaluation and Charging Network Optimization
The SDSS supports the evaluation of a TE scenario according to its components defined in
Section 2.3.2 via data-driven simulations. To provide fast response times for interactive planning capabilities on the dataset sizes presented in
Table 2, the SDSS pre-computes all static location factor values based on an
analysis buffer around potential station locations (i.e., road network edge segments (The SDSS implements a (semi-)automated process for mapping arbitrary locations to road network edge segments based on proximity, traffic flows, and other criteria)) and employs transport route data compression, indexing, and demand analytics caching techniques to improve the performance of a straight-forward implementation of the simulations. The improvements speed up the scenario by one to two orders of magnitude depending on dataset characteristics. The details of these improvements are beyond the scope of this paper and are the proprietary technologies of Gordian Logistics Optimization Systems.
The SDSS also supports the optimization of the charging network for different TE scenarios. In particular, this functionality allows one to find an optimized placement of stations in a network for the TE scenario. The optimization tasks can be informally defined as follows. Given the definition of all the components of a TE scenario (including a potentially empty
network of charging stations), a set of candidate locations
C, and a user-defined number of (new) stations
, select
k candidate locations that maximize the sum of scores of all the stations in the network (including the selected candidate locations) according the user-defined criteria in
Section 2.3.3.
Due to the
combinatorial number of feasible solutions, as it is usual in mathematical optimization, the SDSS adopts an iterative greedy network expansion approach to find an approximate, near-optimal solution. In particular, at each iteration the method expands the network of stations with the candidate location that maximizes the sum of scores of the selected candidates
in the network. The phrase “ìn the network” is emphasized because due to the route-based network effects described in
Section 2.2 and the charging network demand concepts (i.e.,
demand loss in network,
demand in network,
demand from fully electric, and
BEV enablement) each of which can be factors that contribute to the score of a station, on every edition of a station the scores of the stations already in the network have to be recalculated. This means that in a naive implementation the TE scenario has to be re-simulated whenever a new candidate is considered to be included in the network. Although the greedy choices drastically reduce the total number of re-simulations during a TE scenario optimization from
to
, for realistic problem sizes (e.g.,
,
) the millions of simulations at national and international scale are still computationally prohibitive.
To speed up the computations, the SDSS employs proprietary transport route data compression, indexing, and demand analytics caching techniques as well as search space pruning. In particular, because generally a candidate location’s charging demand in the network monotonically decreases (As it is explained in
Section 2.2 and Section Charging Network Demand Concepts,
demand from fully electric and
BEV enablement of a station location can increase as the network is expanded, but in practice the decrease in other factor values that are used to calculate the score of locations according the MCE framework (see
Section 2.3.3) still decrease on network expansions) as other new stations are added to the network to serve the transport energy demand of the TE scenario, the candidate location’s charging demand values and score, which have been calculated in a previous iteration of the network expansion, can be effectively used to compare against the values and score of the current-best-candidate found in the current iteration and can be used to prune the candidate location. These advanced data management and pruning techniques speed up the simulation-based optimizations 3 to 5 orders of magnitude depending on data characteristics and problems size compared to baseline implementations and enable charging network placement optimizations at national and international level in a matter of minutes.
2.3.5. Interactive Planning Process for Multiple Scenario Analysis Types
Based on the above-described components and features, the SDSS provided multiple scenario analysis types and planning options through a simple interactive planning process that is depicted in
Figure 2. The process starts with setting vehicle and charging model parameters. Next, the user has the possibility to (optionally) define competitor, customer, and candidate station locations based on uploaded POIs locations or POI (charging stations, truck stops, truck stoppings) that are stored in the SDSS/Gordian database (see
Table 2).
With the weights set, the user can perform an “Existing Location Ranking” analysis of the customer or the competitor stations. At this stage, the user can also perform a “Manual Site Exploration and Network Expansion” analysis by selectively, iteratively, and interactively adding from the candidate station locations through a map interface to the initial charging network based on the factors and scores of the locations. They can then immediately review charging- demand- or transport-electrification-effect-based KPIs of the added station and monitor network expansion criteria (e.g., total network demand, BEV enablement) (Ad-hoc deletion of a selected station from a network is also provided). If the candidate locations represent different potential partner locations, with the same functionality, the user can perform “Potential Partner Analysis”. Through the network optimalization functionality, given the initial charging network, the user can perform a “While Spot Analysis” of the network by finding the next N best locations from the candidate locations that maximize a combination of the user-defined KPIs via the MCE framework. Two other notable aspects of the planning process, especially for the use of “White Spot Analysis”, are its iterative and human-in-loop/interactive aspects. These aspects are part of the loop-back in the process from the “Goal met?” condition to the optional “Define candidate locations” step. In this loop, the SDSS is used to find the next N best candidates, which then the user can choose to (1) ignore, (2) add to the network with or without positional modification, or (3) exclude from future selections by close examination of the geographical context of the candidates (e.g., base maps with semantically enriched satellite and aerial images) and the quantitative basis for the selection (i.e., factor values) or external information such as the lack of or high cost of real-estate and/or grid capacity.
Notably, one additional type of analysis that the SDSS supports through the optional inclusion of (existing or planned) customer stations in the initial network, is “Customer Location Validation” analysis. In this analysis, the existing or planned customer stations are geographically overlayed with the locations that are optimized with a “White Spot Analysis” according to the user-defined criteria for the scenario. If an existing station can be geographically closely matched to an optimized location, then the station is said to be validated according to the user-defined criteria for the scenario.
2.3.6. SDSS Interface with Analytic Components
The SDSS supports planners through different analytic features for making informed decisions during
incremental EV network planning.
Figure 3 illustrates a practical example of applying these analytics features to assess the impact of a change to the transport electrification scenario. In general, any part of the transport electrification scenario described in
Section 2.3.2 can be changed, but the practical example illustrates the addition of a new charging station to an existing network, consisting of both customer and competitor stations. Specifically, the SDSS provides four key analytical components: location demand evaluation, BEV enablement evaluation, significantly affected stations identification, and network-level statistics.
Location demand evaluation: This analytic component allows planners to assess the potential charging demand of a selected site by interacting with a map, as demonstrated in Map (b) of
Figure 3. This component displays both the
demand in isolation and the
demand in network. Additionally, it provides key data such as the catchment area and AADT on the catchment area segments. A unique aspect of this tool is its ability to visualize the impact of the new station on other stations—both customer and competitor—within the network. This is displayed through pie charts at the location of each station, indicating the proportional change in demand. In the example, a network of 10 stations (5 customer-owned and 5 competitor stations) is considered, with
Location 1 being evaluated for potential expansion. The
demand in isolation for
Location 1 is calculated at 148,021 MWh, while the
demand in network is reduced to 127,136 MWh—a 14% reduction due to competition within the network. Pie charts at other station locations provide a clear visualization of the relationship between
demand in isolation and
demand in network.
BEV enablement evaluation: As shown in Map (c) of
Figure 3, this analytic component allows planners to assess the impact of a charging station on the number of transport routes that can be carried out entirely using electric vehicles, directly influencing the customer journey. This tool visualizes how many new routes will be enabled by adding a charging station at the location being evaluated. The map displays road segments where
BEV enablement changes, highlighting them in green. The width of each green road segment is proportional to the number of routes enabled, providing a clear representation of the electrification effect of the change, i.e., the addition of the new station in the network. In the example of
Location 1, the map shows all the transport routes that will become fully electric due to the addition of the new station. Furthermore, when the scenario involves a negative impact—such as the removal of one or more stations—the map reflects this by changing the color of affected road segments to red. This component helps planners understand the broader implications of network expansion on charging infrastructure and the overall customer experience.
Significantly affected stations: As illustrated in Map (d) of
Figure 3, this analytic component allows planners to analyze how existing customer stations are impacted by the addition of a new station. This tool visually distinguishes between positively affected stations, shown in green, and negatively affected stations, shown in red. The level of significance can be adjusted by the user, enabling a customized analysis of station impacts. For stations identified as significantly affected, three key metrics are calculated and displayed: change in charging volume, change in
demand in network, and change in
demand in fully electric. These effects may be either positive or negative, and the most affected stations—both positively and negatively—are highlighted in a table. In the example, the significance threshold is set to 5%, and two stations are identified as significantly affected. One station, highlighted in green, shows a 6.95% increase in charging volume, a 7.64% increase in
network in demand, and a 24.56% rise in
demand from fully electric. Conversely, a red-highlighted station experiences a 16.02% decrease in charging volume and a 15.93% decrease in
demand in network, but a 12.67% increase in
demand from fully electric. These decreases in demand are attributed to the deterministic charging model based on the SoC (see
Section 4).
Network-level statistics: The SDSS also offers insights into network-level statistics, including
total network demand,
BEV-enabled tkm, and
BEV-enabled routes. Additionally, the system evaluates the share of charging demand contributed by customer and competitor stations, as well as their combined role in enabling electric vehicle operations. As shown in Map(e) of
Figure 3, adding a new station at
Location 1 leads to significant positive changes at the network level. The
total network demand increased from 769.48 GWh/year to 867.38 GWh/year, with the customer network demand rising substantially from 380.55 GWh/year to 503.04 GWh/year. The customer’s gain in the
BEV enablement is also highlighted in the horizontal stacked charts. The customer’s
BEV-enabled tkm rises from 6.6% to 10.03%, while the combined tkm share for both customer and competitor stations grew from 5.6% to 7.4%. However, competitor stations experience a drop in their
BEV-enabled tkm share, falling from 8.8% to 7%, reflecting the loss inflicted on competitors due to the expansion of customer infrastructure. A similar pattern emerges for
BEV-enabled routes, where the customer’s share increases from 8.3% to 11.8%, and the competitor’s share decreases from 8.1% to 7.4%. These changes underscore how the introduction of a single station can drastically enhance the customer’s influence within the network, simultaneously weakening the competitors’ role and reducing their demand.
The analytic components discussed earlier are not limited to evaluating the effects of adding a single station. These tools are equally capable of assessing more complex scenarios, such as adding or removing multiple stations, as well as changes to underlying models like the EV model, energy-use model, charging model, and charging supply. By leveraging the SDSS’s flexibility, planners can explore how modifications to any of these elements affect the entire network. Whether dealing with station-level changes or broader model adjustments, the system consistently provides valuable insights into charging demand, BEV enablement, and the competitive landscape, helping planners make informed decisions for both short-term adjustments and long-term strategic planning.
In summary, the analytic components location demand evaluation, BEV enablement evaluation and significantly affected stations provide comprehensive tools for planners to assess the effects of network expansion on individual stations and the overall network. On the other hand, the network-level statistics offer a broader understanding of network dynamics and the interplay between customer and competitor stations, providing planners with the necessary data to optimize network design for future electric vehicle infrastructure.
2.3.7. Analysis Reports
While the SDSS supports the management of multiple plans for multiple scenarios that the user can explore and continuously develop according to the dynamic adaptive planning paradigm, it can also produce a Station Ranking and Transport Electrification Impact Report, which provides a summary of a plan for a transport electrification scenario, and individual Station Performance Reports.
One of the key outputs is the
Station Ranking and Transport Electrification Impact Report, which offers an overview of the electrification potential of a proposed charging network. The report summarizes key metrics such as the fraction of transport work and routes that can be electrified based on the initial SoC of vehicles and the projected annual charging demand for both customer and competitor stations in the network. It also includes the overall impact of newly proposed stations on the existing network, highlighting changes in network performance such as increased electrified transport work and charging demand. The map within the report visualizes the placement and ranking of both existing and proposed stations. A sample of this report can be viewed in [
46].
Additionally, the SDSS generates
Station Performance Reports, which provide granular insights into the performance of individual stations. These reports offer detailed metrics such as the station’s rank within the network, expected revenue, energy demand (in MWh), and the number of charging sessions categorized by vehicle weight classes. The reports also assess the impacts of network-wide factors, such as demand cannibalization or competition from other stations. For a full example of a Station Performance Report, see [
47].
Both reports help in understanding how individual stations and the network as a whole contribute to transport electrification, facilitating informed decision-making in charging infrastructure planning.
2.3.8. SDSS Adaptations for Collaborative Planning
Building on the flexible planning process described in
Section 2.3.5, the system can be streamlined for different collaborative use cases, each requiring specific configurations, user inputs, and analysis outputs to provide the most relevant planning support. In fact, one such adaptation is already in use in the
Regional Electrification Pilots (REPs) Analysis Tool, which supports the 2023 grant call by the Swedish Energy Agency. Additionally, further adaptations are being discussed, including tools for
strategic subsidy allocations evaluation and continuous
Electric Vehicle Charging Infrastructure (EVCI) monitoring, showcasing the system’s flexibility to meet evolving planning needs. These adaptations go beyond the commercial analysis types to provide targeted solutions for collaborative contexts.
As described above, the core functions of the SDSS have been tailored to allow the collaborative holistic network planning of competing economic actors and provide quantitative support information for applicants to the 2023 REP grant call of the Swedish Energy Agency. In this case, the SDSS has been adapted to support collaborative network planning in a situation where competing stakeholders or multiple entities must work together to achieve shared infrastructure goals. The SDSS adaptation, called the REP tool, integrates data from multiple sources, including previously funded public charging stations, traditional transport flow data (AADT), and route-based transport data. It offers both a free version, which enables users to analyze an unlimited number of locations for subsidy eligibility based on established criteria, and a premium version that provides in-depth analysis of the strategic placement of stations within the public network. Key features include demand forecasting for each site, ranking of proposed locations based on their contribution to the electrification of freight transport, and the ability to assess the overall impact on CO
2 emissions and network performance. The process begins by creating an account and logging in. Users then add potential charging station locations, linking them to the nearest exit from the TEN-T network. Users can then customize assumptions related to factors like battery size and charging behavior and set preferences for ranking location, such as proximity to truck stops, AADTs, priority roads, etc. The prioritization of preferences affects the analysis and ranking of public charging stations. Finally, users run the subsidy and network placement analyses, generating reports on strategic placement and station ranking. Examples of these reports include the station ranking and network impact assessment [
46], station-specific details [
47], and subsidy fulfillment analysis [
48]. This approach allows users to prioritize locations based on traffic flow, proximity to transport corridors, and other key variables, making it easier to choose locations that are the most optimal, both from an application and a financial perspective.
Similar adaptations can also help to evaluate and manage strategic charging network subsidy allocations plans for which the need is clearly highlighted in the recent assignment of the Swedish Government to the Swedish Energy Agency [
49]. In this scenario, the SDSS would be configured to integrate predefined REP criteria, such as geographic distribution goals, eligibility thresholds, and network performance targets. Evaluators would input details of proposed charging station locations. By using the input, the adaptation could then generate objective, data-driven reports that rank the submitted applications according to their alignment with REP goals, potential to enhance the electrification of freight transport, and contribution to reducing CO
2 emissions. This type of adaptation would streamline the evaluation process, providing precise, quantitative support for decision-making and ensuring that grant funds are directed towards the most impactful projects. Such a configuration would offer a powerful tool for managing the grant allocation process with increased efficiency and transparency.
Another potential adaptation of the SDSS is for continuously monitoring the deployment of Electric Vehicle Charging Infrastructure (EVCI). In collaboration with the Electrification Taskforce of the European Automobile Manufacturers Association (ACEA), a service is being considered to track EVCI roll-out in response to projected charging demands, with potential integration into the AFIR observatory. The proposed SDSS adaptation would continuously update data on existing and planned charging stations, providing real-time insights into how supply aligns with evolving demand for electric freight transport. It would generate reports and heatmaps to highlight areas where infrastructure is insufficient and identify high-priority regions for further development. These heatmaps could also indicate regions with high ROI potential, enabling stakeholders to make data-driven decisions and optimize infrastructure roll-out to meet increasing electrification demands.
2.3.9. Prototype System Overview
The prototyped SDSS enables infrastructure planners to carry out dynamic and adaptive planning of charging networks under deep uncertainties. As illustrated in
Figure 4, the system allows users to configure transport electrification scenarios, define and modify charging networks, and set the weights of different factors in the MCE framework. These three elements—scenario assumptions, network definition, and factor weights—are used together when optimizing station placement. Through interactive evaluation, users can assess the effects of network-level changes, such as adding or removing charging stations, and understand how these changes impact overall system performance.
Users begin by setting up the transport electrification scenario, where they define assumptions such as battery size, energy-use, and charging behavior for vehicles (see
Section 2.3.2 for more details). Once these scenario parameters are configured, users can define the charging network by adding or removing customer and competitor stations. Locations can be uploaded via CSV files or selected from a built-in Point of Interest (POI) database (see
Section 2.3.5).
After defining the network, users can set the weights of different factors in the MCE framework to reflect their planning priorities, such as proximity to infrastructure, grid connection costs, or expected demand. The optimization process then combines the transport scenario assumptions, network configuration, and factor weights to identify the best candidate locations for new charging stations. This integrated approach ensures that the optimal locations are determined not only by individual factors but by how they interact with the broader network and user-defined criteria.
Users can then evaluate individual locations in greater detail, assessing catchment areas and network-level impacts. The SDSS allows users to visualize how demand is redistributed across the network and to compare the performance of various locations based on multiple criteria (see Section Charging Network Demand Concepts). Additionally, the system ranks each location based on MCE, and users can view the results through visual aids like spider charts (see
Section 2.3.3).
Finally, the SDSS provides users with network-level statistics, such as total demand, network size, and BEV enablement, displayed directly on the map interface. Stations are ranked according to their MCE performance, allowing users to make informed decisions about expanding their charging infrastructure.
2.4. Co-Creation Activities
The general and application-specific design principles, components, dynamic adaptive planning support and related analysis types, analytic features, and map-based interfaces of the SDSS have not been developed in vacuum in one go but have rather been iteratively improved and extended based on the feedback of a large number of different kinds of stakeholders in commercial settings. To solicit the feedback, a pragmatic approach and the double roles of the author’s were used. Specifically, the feedback was elicited via pre-sales and multi-session strategic collaboration discussions and pilots including workshops and interactive joint planning sessions. The discussions adopted the SPIN sales methodology [
50], in which a potential solution is positioned by asking open-ended questions about the customer’s
Situation,
Problem, and its
Implication and the
Need payoff of a potential solution (SPIN). If conducted optimally, the SPIN sales methodology can lead to a mutual understand of the customer’s pain points on a profound level to spotlight their biggest needs. Due to the nature of these discussions, they can rightly also be viewed as interviews with stakeholders and qualitative user studies.
The motivations for the chosen pragmatic approach are three-fold. Firstly, the benefits and the complex nature of the route-based network concepts and related network design methodologies that are the foundations the proposed decision support are easier to explain through examples and the use of a practical tool than through hypothetical discussions. Second, while the customers often use scenario analysis in infrastructure investment planning and are keenly aware of the deep uncertainties about the supply side of transport electrification (i.e., access the grid capacity and real-estate and presence of competition) in their plans, the unorthodox planning methodologies of interactive spatial planning and dynamic adaptive planning [
15], which are well suited to deal with unique challenges of the customer and the uncertainties of a transition are also easier to explain through examples and the use of a practical tool than through hypothetical discussions. Finally, prototyping an adequate SDSS that meets the needs of stakeholders and reduces the risk of investments that infrastructure developers face is arguable one of the most effective ways of creating an impact and accelerating the green transition of the transport sector.
Users from 33 organizations were interviewed. The interviewed organizations primarily included stakeholders that based on their commercial activities and roles in the ecosystem are faced with large charging infrastructure investment decisions or can influence the choices and opportunities of other stakeholders. The stakeholders can be grouped into six groups using their relations to charging infrastructure investments, which can be described as follows:
Charging Point as a Service (CPaaS) providers: CPaaS providers are often the unregulated business side of grid companies with specialized business units that develop different types of physical and digital solutions for charging, energy management, and e-mobility as a service. The interviewed CPaaS providers included Ellevio Energy Solutions, Vattenfall Network Solutions, E.ON Drive & Clever, Skellefteå Kraft, and Virta.
Fuel companies: Fuel companies own and operate networks of fuel stations. Fuel companies gradually and strategically introduce fossil-free fueling options including EV charging to their existing stations and new sites. The interviewed fuel companies included OK/Q8, Preem, BP, and Circle K.
Charging Point Operators (CPOs): CPOs through real-estate acquisitions or strategic partnerships with real-estate owners establish and operate networks of charging stations. The interviewed CPOs included Recharge, Allego, VCG, InCharge, Milence, EnBW, and IONITY.
Heavy-Duty Vehicle (HDV) manufacturers: To enable the green transition of the transport sector, HDV manufacturers develop different types of electric vehicle propulsion systems including BEVs, PHEVs, FCEVs, etc. But the successful sale and adoption of these vehicles require different types and amounts of alternative fueling infrastructures to be deployed so that the vehicles can operate a wide range of transport missions. To this extent, they often create internal business units that provide energy and charging solutions either directly to their customers (fleet operators/logistics companies and haulers/carriers) in connection to the vehicle sale (lease) or in collaboration with strategic partners. The interviewed HDV manufacturers included Scania (Stockholm, Sweden), Scania Charging Solutions (Stockholm, Sweden), TRATON SE (Munich, Germany), Volvo Trucks (Gothenburg, Sweden), Volvo Energy (Gothenburg, Sweden), and Lion Electric (Quebec, QC, Canada).
Fleet operators/logistics companies: Fleet operators try to respond to the green transport service demand of their customers, the transport buyers. To beat the competition, they look beyond the depot- and terminal-charging-based electrification of first/last-mile logistics and increasingly consider the establishment of private and semi-public off-site charging and refueling infrastructure to enable the electrification of their middle-mile logistics via opportunity charging often in collaboration with strategic partners. The interviewed fleet operators included PostNord, Amazon Transport Services, DB Schenker, DHL, and Contargo.
Interest and research organizations and governments: This group of stakeholders do not directly win or lose on specific charging infrastructure investments but rather with their actions influence other ecosystem players. They tend to represent the interests of their constituents that either have a specific or a general interest in transport electrification developments and sustainable transportation at large. As they represent larger groups, they tend to have a more holistic perspective on the developments and in their objectives. The stakeholders in this group included Fraunhofer, NOW GmbH, VDE, Swedish Energy Agency, Swedish Transport Administration, and ACEA electrification task force.
The job titles and roles of individuals at the above organizations included the following: Chief Executive Office, Chief Commercial Officer, Chief Financial Officer, Chief Growth Officer, Managing Director, Network Strategy and Planning Manager, Network Development Project Manager, Data Analytics and Market Insights Manager, Business and Market Intelligence Manager, Regional Lead, Senior Business Development Manager, Head of E-mobility, Senior Green Technology Lead, Head of Charging Strategy, Head of Charging Solutions and Infrastructure, Head of Charging and Infrastructure Business Development, Energy Solutions and Sustainable mobility Manager, Senior Strategy Advisor, Strategy Project Manager, Real-Estate Developer, and Real-Estate Lawyer.
To preserve the privacy of the individuals and the confidentiality of the information exchanged during the interviews, the names and any direct ties to individual organizations are omitted.
3. Results
The results or output of the above-described activities are two-fold: a commercially available SDSS and the insights from qualitative user evaluations of the SDSS with 33 stakeholder organizations in commercial discussions and pilots.
3.1. Comprehensive SDSS for Planning Charging Infrastructure in 26 European Countries
The SDSS that supports the dynamic adaptive planning of charging networks under deep uncertainties (as it is described in
Section 2.3) is commercially available as a Software-as-a-Service with different subscription levels and models. It is available for the planning of charging network infrastructures for freight and long-distance car trips within and across 26 countries in Europe. The commercial product also includes features for the management of multiple plans as well as tracking of analytics credits that are linked to the subscriptions.
3.2. Insights from Qualitative User Evaluations
The second set of results are the insights gained via the qualitative user evaluations during the co-creation activities and and pilot studies with 33 stakeholders as described in
Section 2.4. The stakeholders’ perspectives on requirements for charging infrastructure planning (and operations) are of two types: general perspectives, and SDSS and methodology-specific perspectives.
General Perspectives
In terms of their electrification strategy, while most stakeholders are aware of the land- and capacity-grabbing phenomena as well as the availability and impact of subsidies and clearly understand that delayed decisions and roll-outs can cost them market shares and position, they are also aware that the public charging demand from battery electric heavy-duty vehicles (trucks and busses) is not here yet and the public charging demand for private cars is growing slower than expected. Therefore, they want to be very careful about where, when, how much, and what type of charging and related services they want to invest in.
Other important aspects of the stakeholder planning strategy and process include (1) the physical constraints (size) of sites; (2) the typical 3-year period from site plan to opening date; (3) the 3–5 MSEK grid connection costs that can include the installation of the connecting power line, the transformer, and in some cases local grid reinforcement costs, which are perceived to be invoiced to the customer who orders it first (i.e., there can be benefits of being second); (4) the fact that a large fraction of the costs are upfront/CAPEX-bound costs that relate to long-term real-estate leases and grid service subscription; and (5) the uncertainty about the long-term business case of energy storage assets (i.e., battery storage management systems) for peak shaving and grid flexibility services.
3.3. SDSS and Methodology-Specific Perspectives
Most stakeholders understand the route-based network effects. In particular, they understand the different types of demand estimates of the SDSS and that they can only be calculated with the help of the transport routes (i.e., a station’s demand in isolation, demand in network, demand from fully electric).
They also found scenario-specific meaning behind the different demand KPIs and can clearly see value in planning with the different KPIs. For example, they understood and valued the BEV enablement or “customer journey” in a network concept. They especially see value of this concept in a variant of the SDSS where they could go to transport companies and convince them how they can enable the transport companies’ journey on a specific subset of their stations and thereby reduce the risk of investments by securing customers.
They also understand that the route-based network dependencies between station demands in a network arise from the fact that two stations on the route of a specific vehicles are not equally important for the vehicle to charge on to complete its route. Hence they acknowledge that that the route-based network dependencies are a valid foundation for realistic charging demand estimation. They also find it important to be able to plan with these dependencies when evaluating the impacts of current and anticipated competition.
While network planner and strategist stakeholders are very analytical and have an appreciation for the level of details of the route-based network models and the transport electrification assumptions that are behind the charging demand analytics, they are also keenly aware of how the assumptions they make/parameters they set will affect the demand estimates. Hence they are missing features in the SDSS that somehow allows them to manage the trade-off between the specificity of the analytics and the parameter sensitivity of the models.
Although stakeholders are sometimes limited in their planning strategy and process as to what extent they can adjust plans, their investment strategy is usually sequential and some even lean towards a wait-and-see strategy. Therefore, some stakeholders acknowledged that an adaptive dynamic planning approach and planning information management can be of valuable.
Finally, for stakeholders that have a large amount of business intelligence from years of operations of fossil refueling stations, they have a domain knowledge and empirical data about important local, non-route-based transport-demand-centric site attributes that influence the demand. Hence, while they realize that route-based network effects are hard enough to understand and explore with a custom-designed map interface, they need functionality to integrate the new route-based demand analytics with their existing business intelligence data and systems.
4. Discussion
Unlike previous academic quantitative studies that are reviewed in
Section 1 and try design a single holistic charging infrastructure with a specific and criteria and objectives, the present study questions the utility of such a static, one-fits-all design for practical investment decisions. In practice, independent economic actors with different opportunities, capabilities, and objectives need to continuously plan and build their charging networks during a longer transition period. To provide planning support in this setting, the present paper details the design and features of an SDSS that support the flexible dynamic adaptive planning of independent actors and gives collaborative planning use cases how the components and flexible planning processes can be streamlined to support these. For the first time, the study introduces and motivates the necessity of route-based network concepts for demand-centric charging network design. Finally, the study also reports on qualitative user studies with 33 stakeholders who generally confirm that the dynamic adaptive planning methodology is useful and the route-based charging demand concepts are logical and useful in charging network design.
An alternative to data-driven strategic planning of transport electrification is the learning-by-doing approach. For example, the REEL [
51] and E-Charge [
52] projects focus on pilots and real-world demonstrations to address the challenges of electrifying heavy road transport. The REEL project, funded by the Strategic Vehicle Research and Innovation program (FFI), establishes and evaluates around 70 regional logistics flows across Sweden. These demonstrations provide valuable insights into vehicle performance, charging requirements, and logistics system adaptations through collaboration between logistics actors, hauliers, truck manufacturers, and grid operators. Similarly, the E-Charge project focuses on testing real logistics flows and developing MCS charging infrastructure, to explore solutions for long-distance electrification. Another common method is the case study approach, which involves studying existing plans and conducting interviews to learn from past successes and failures. However, this method often struggles to anticipate future needs and lacks the ability to account for evolving factors such as grid capacity and market dynamics.
Each method has its strengths and weaknesses. The REEL and E-Charge pilot-based approaches provide practical insights through real-world testing but are limited in scalability and long-term strategic planning. These methods excel at gathering real-time data but may not easily translate into broader, nationwide infrastructure solutions. The case study method offers valuable lessons from historical projects but is constrained by its retrospective nature, selection bias, and inability to dynamically model complex networks. In contrast, the data-driven simulation method presented in this paper offers greater flexibility and scalability. By simulating various scenarios and adjusting designs based on new data, this method supports continuous and adaptive planning, making it better suited for managing the uncertainties and interdependencies that characterize large-scale transport electrification projects.
While the stakeholders found the planning methodology and the SDSS features useful, the qualitative user evaluations also highlighted several possible improvements for future work. Firstly, the TE scenario models can be improved. In particular, the current
charging (behavior) model assumes that vehicles deterministically stop and charge at a station when their SoC is below a specified threshold. This can lead to unexpected and unrealistic demand sharing between nearby stations in a dense network. A more realistic probabilistic charging model based on SoC is planned to be introduced, which will better reflect real-world conditions and improve the overall accuracy of network demand estimation and charging station optimization. However, the current deterministic model is maintained deliberately to exploit proprietary transport route data compression, indexing methods, and analytics caching techniques. Without these simplifications, runtimes could increase significantly, making optimization impractical in the intended use cases of DAP and SDSS. The current model also does not have any space and grid capacity constraints on charging stations, which can be introduced to better reflect real-world constraints. Second, the stakeholders also realized the sensitivity of the results on the TE scenario parameters, which future developments can address with spatial sensitivity analysis methods [
45]. The analysis could include evaluating location and rank stability metrics and generating demand-weighted density maps to visualize the spatial importance of stations under diverse parameter settings. This would allow users to better understand the regional impacts of different parameter settings, improving the robustness of network planning under various spatial constraints. Third, related to the ideas and methods of spatial sensitivity analysis, analytics features that measure (1) the static robustness of the charging network against single, regional, and random station failures or (2) the importance of a station in a charging network’s transport electrification performance could be developed. Finally, improvements could focus on the integration of new information (e.g., observed usage patterns for existing charging infrastructure, terminals, and depots) into models and/or the MCE framework as factors.


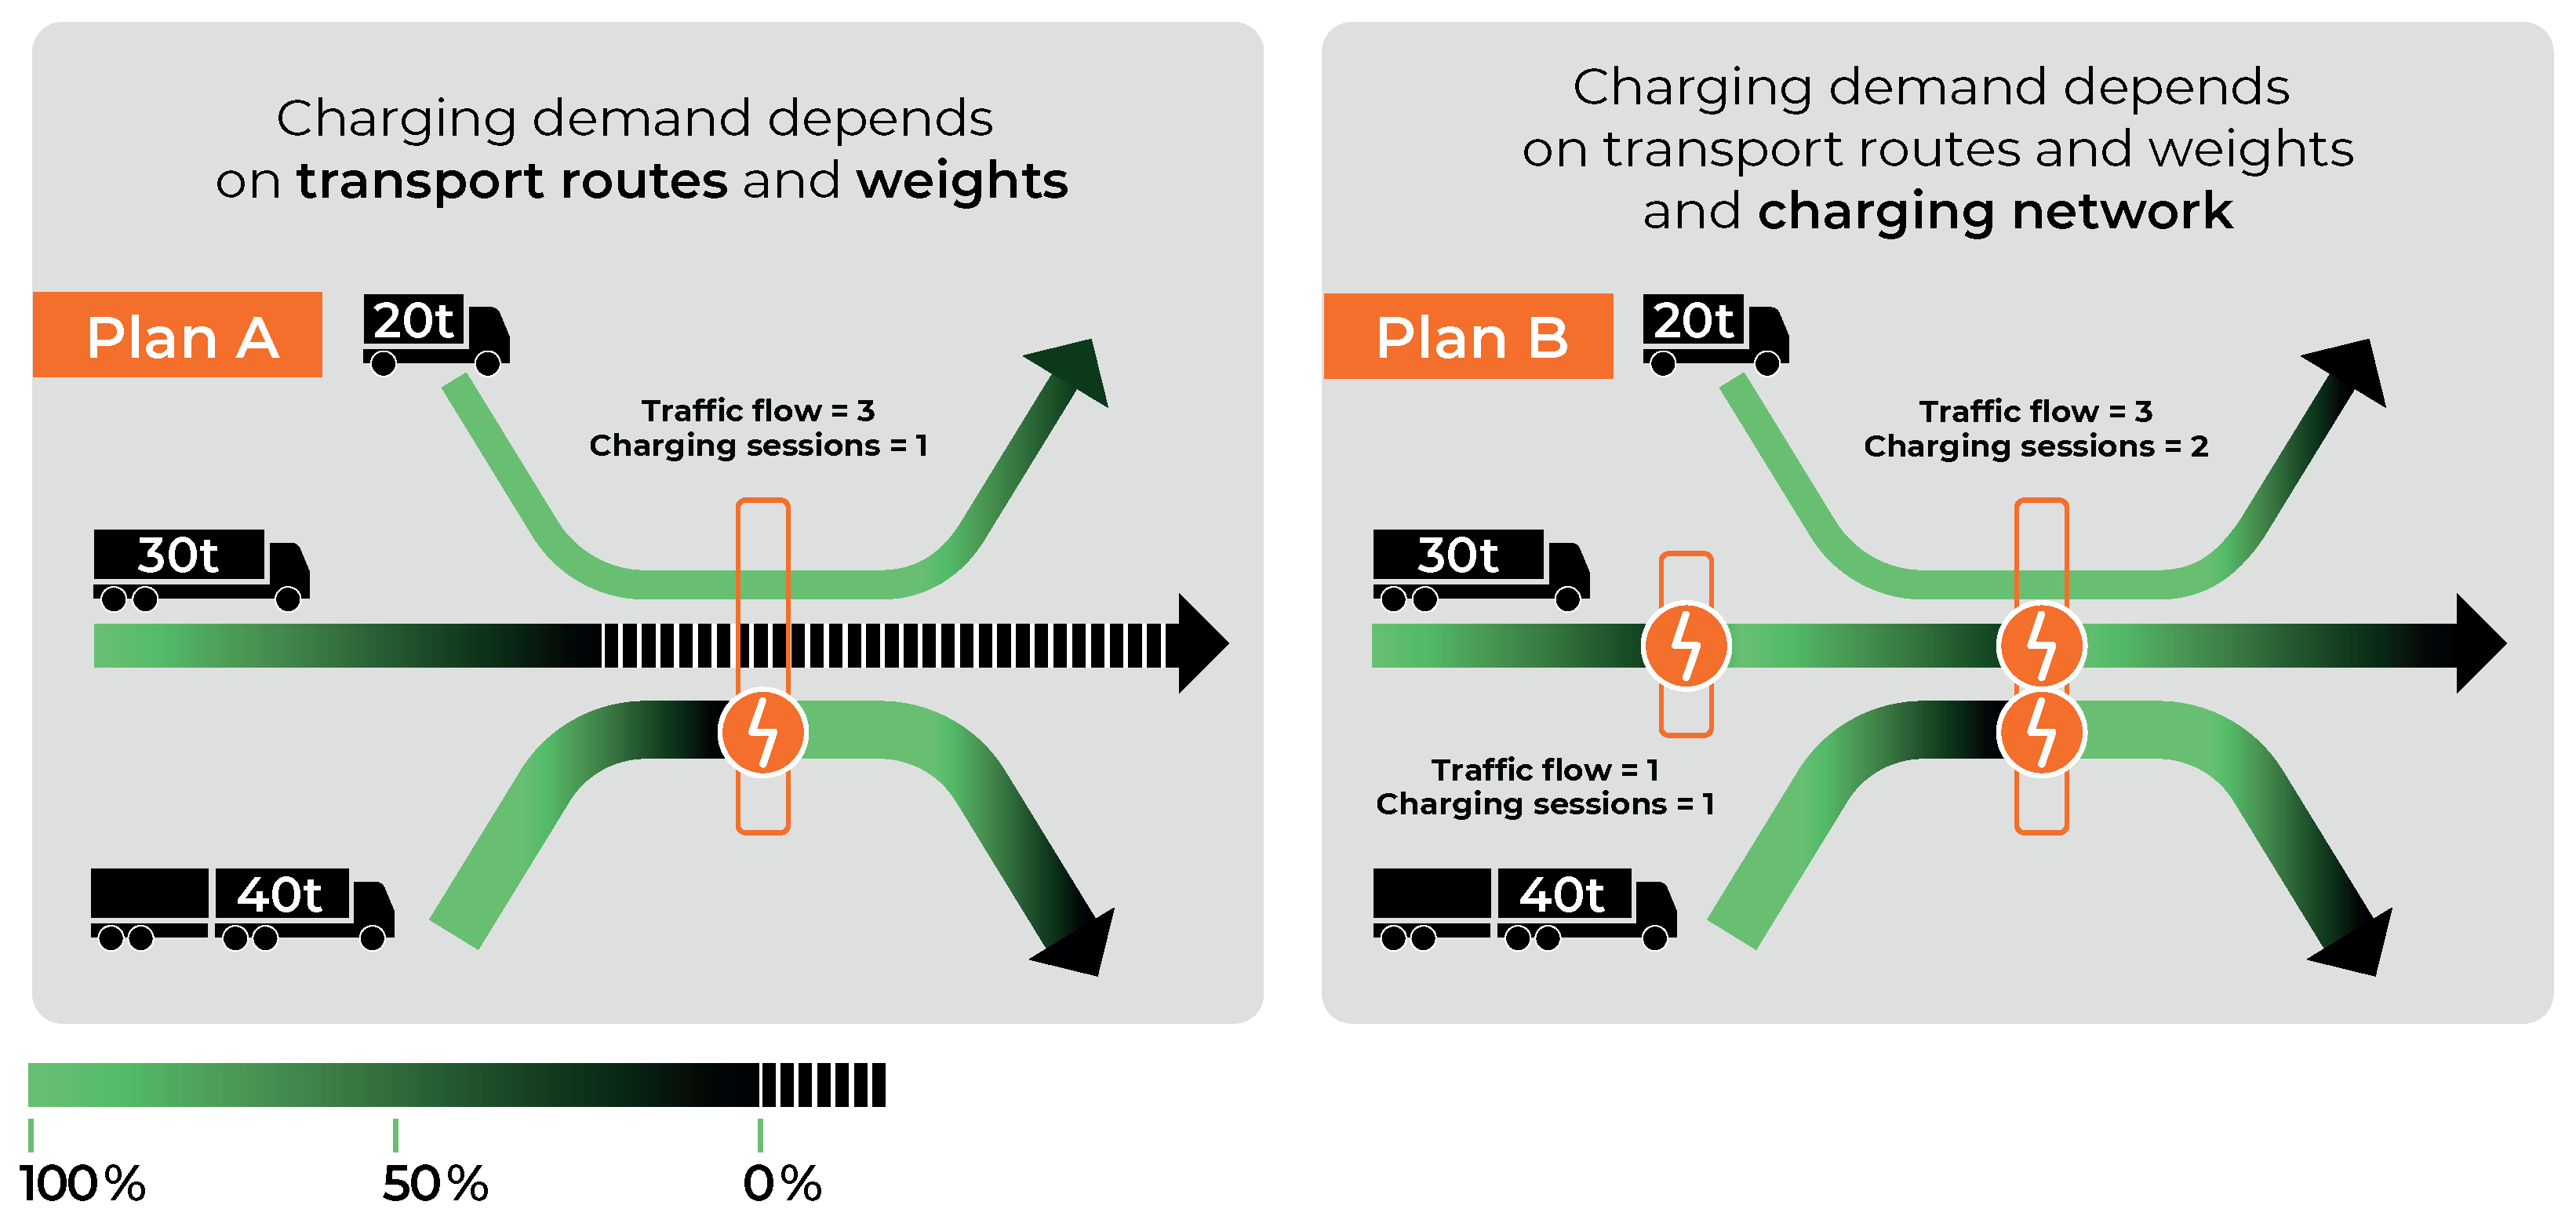
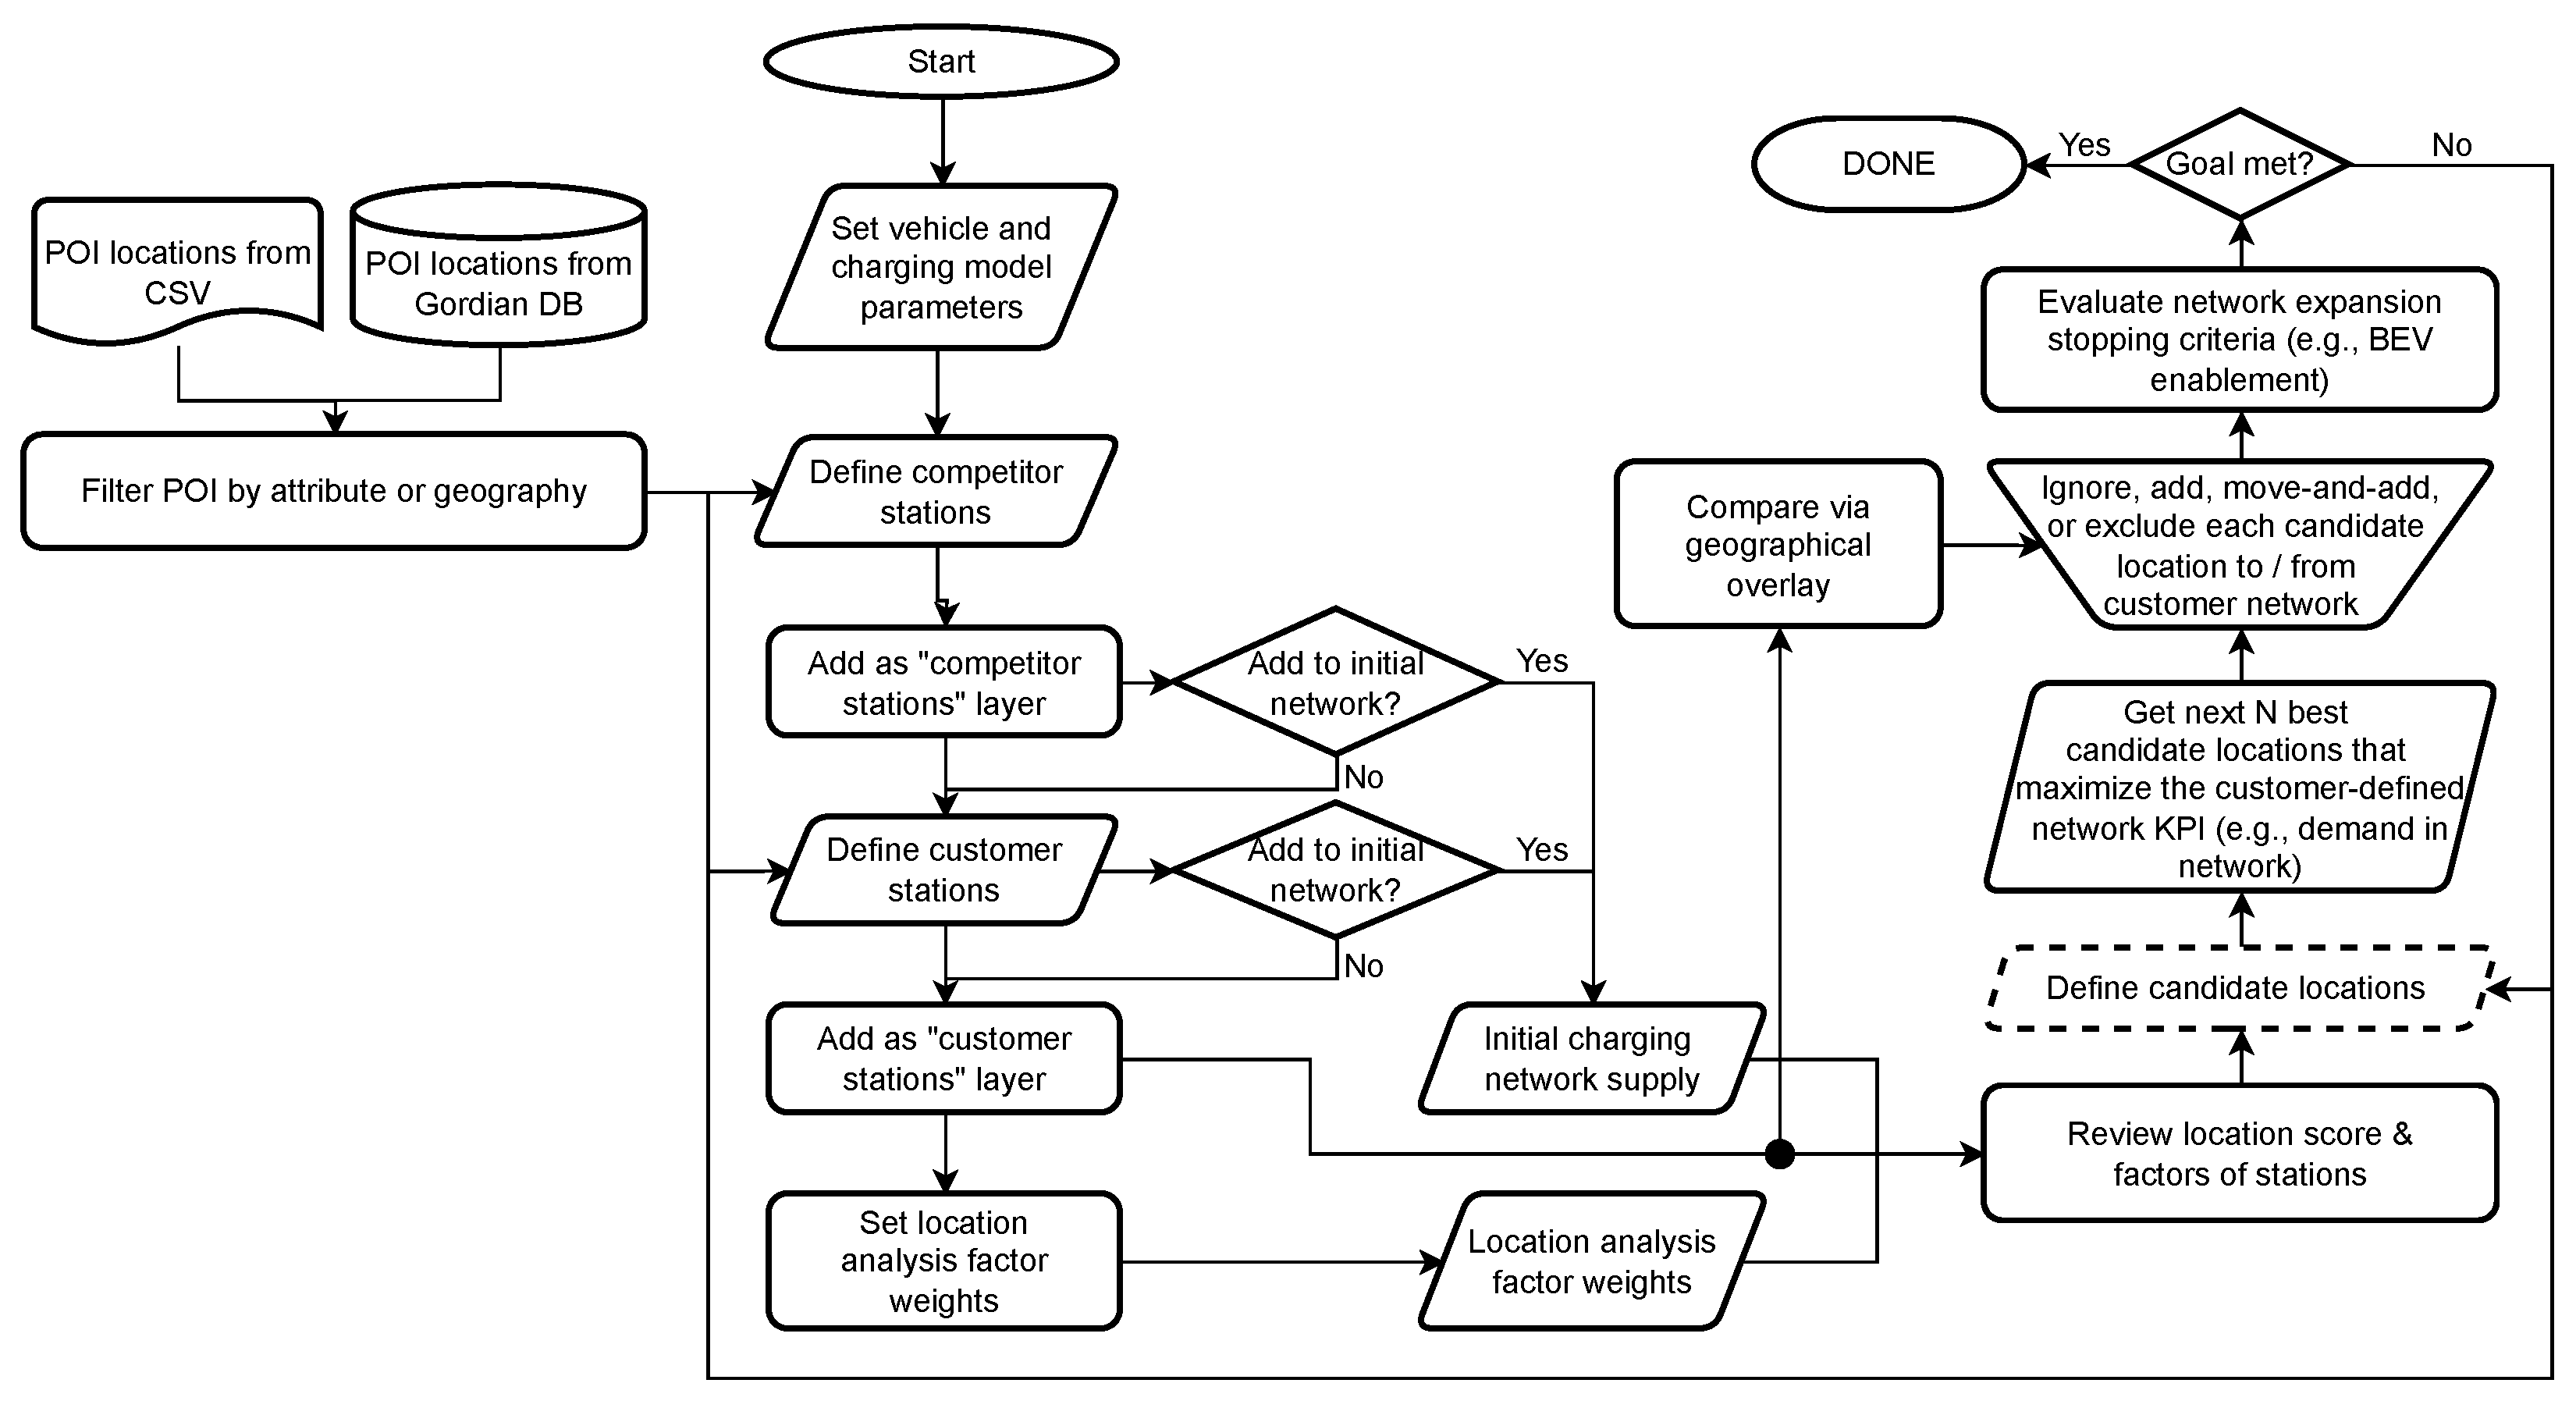
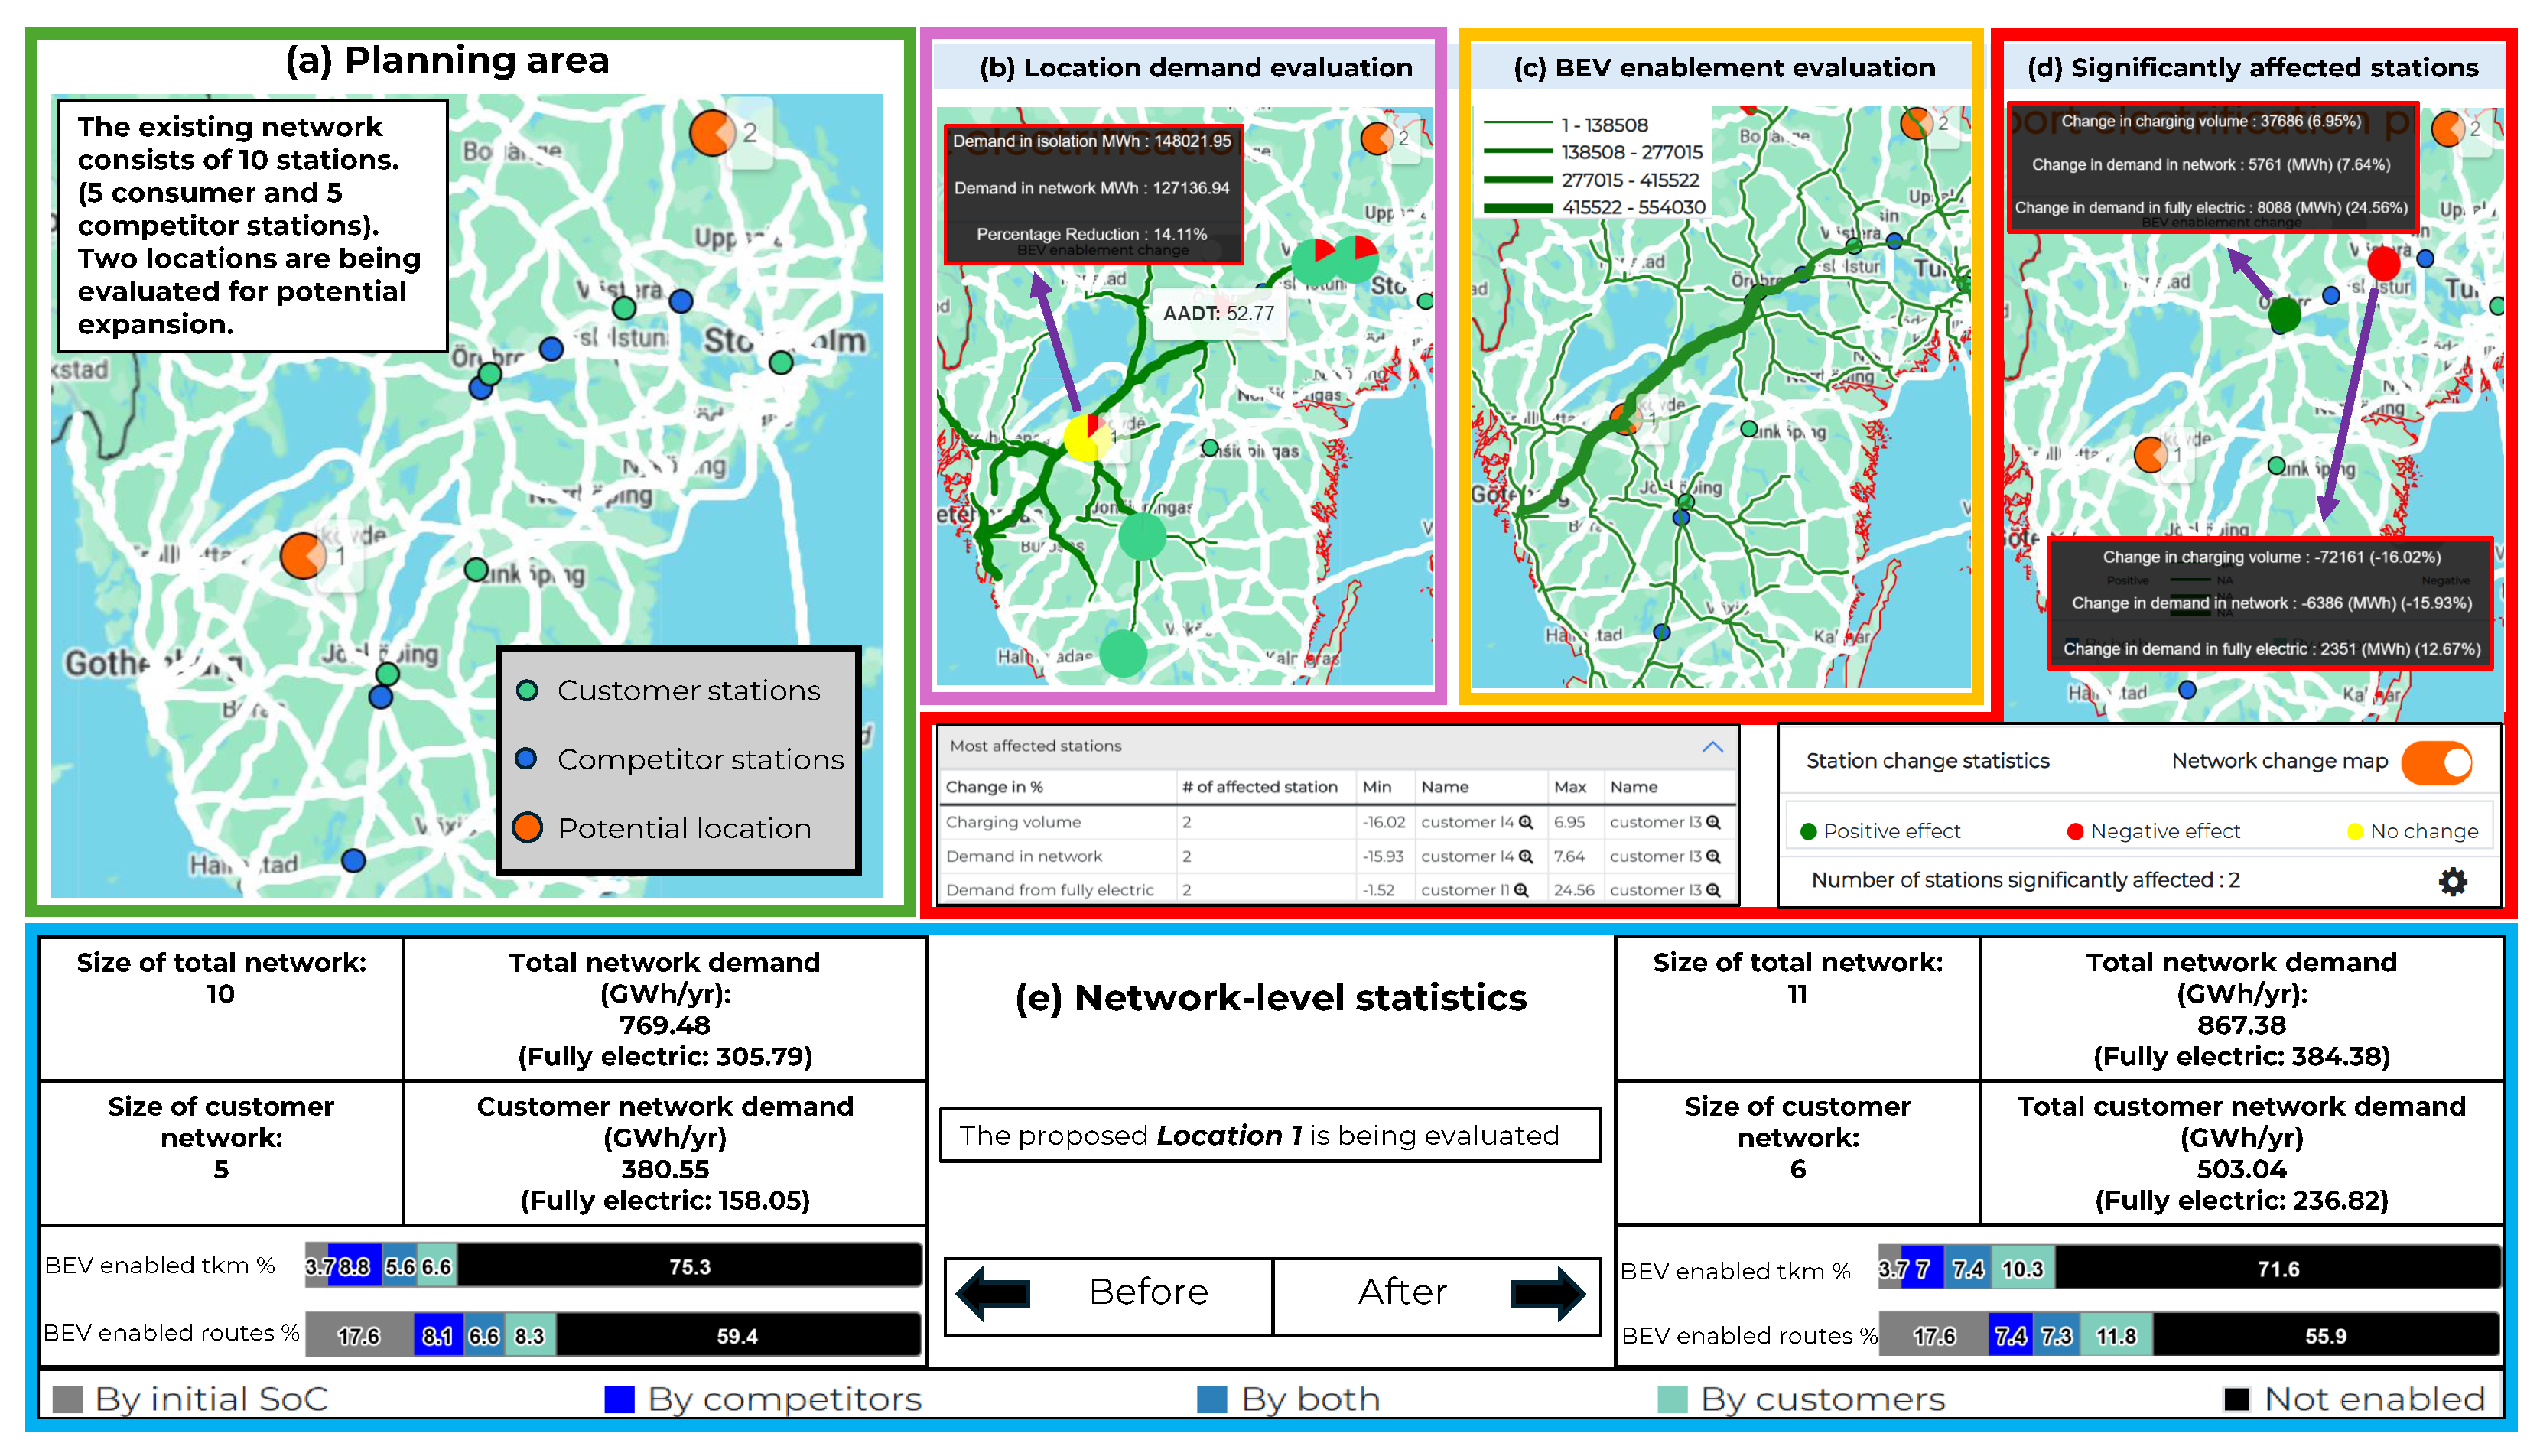
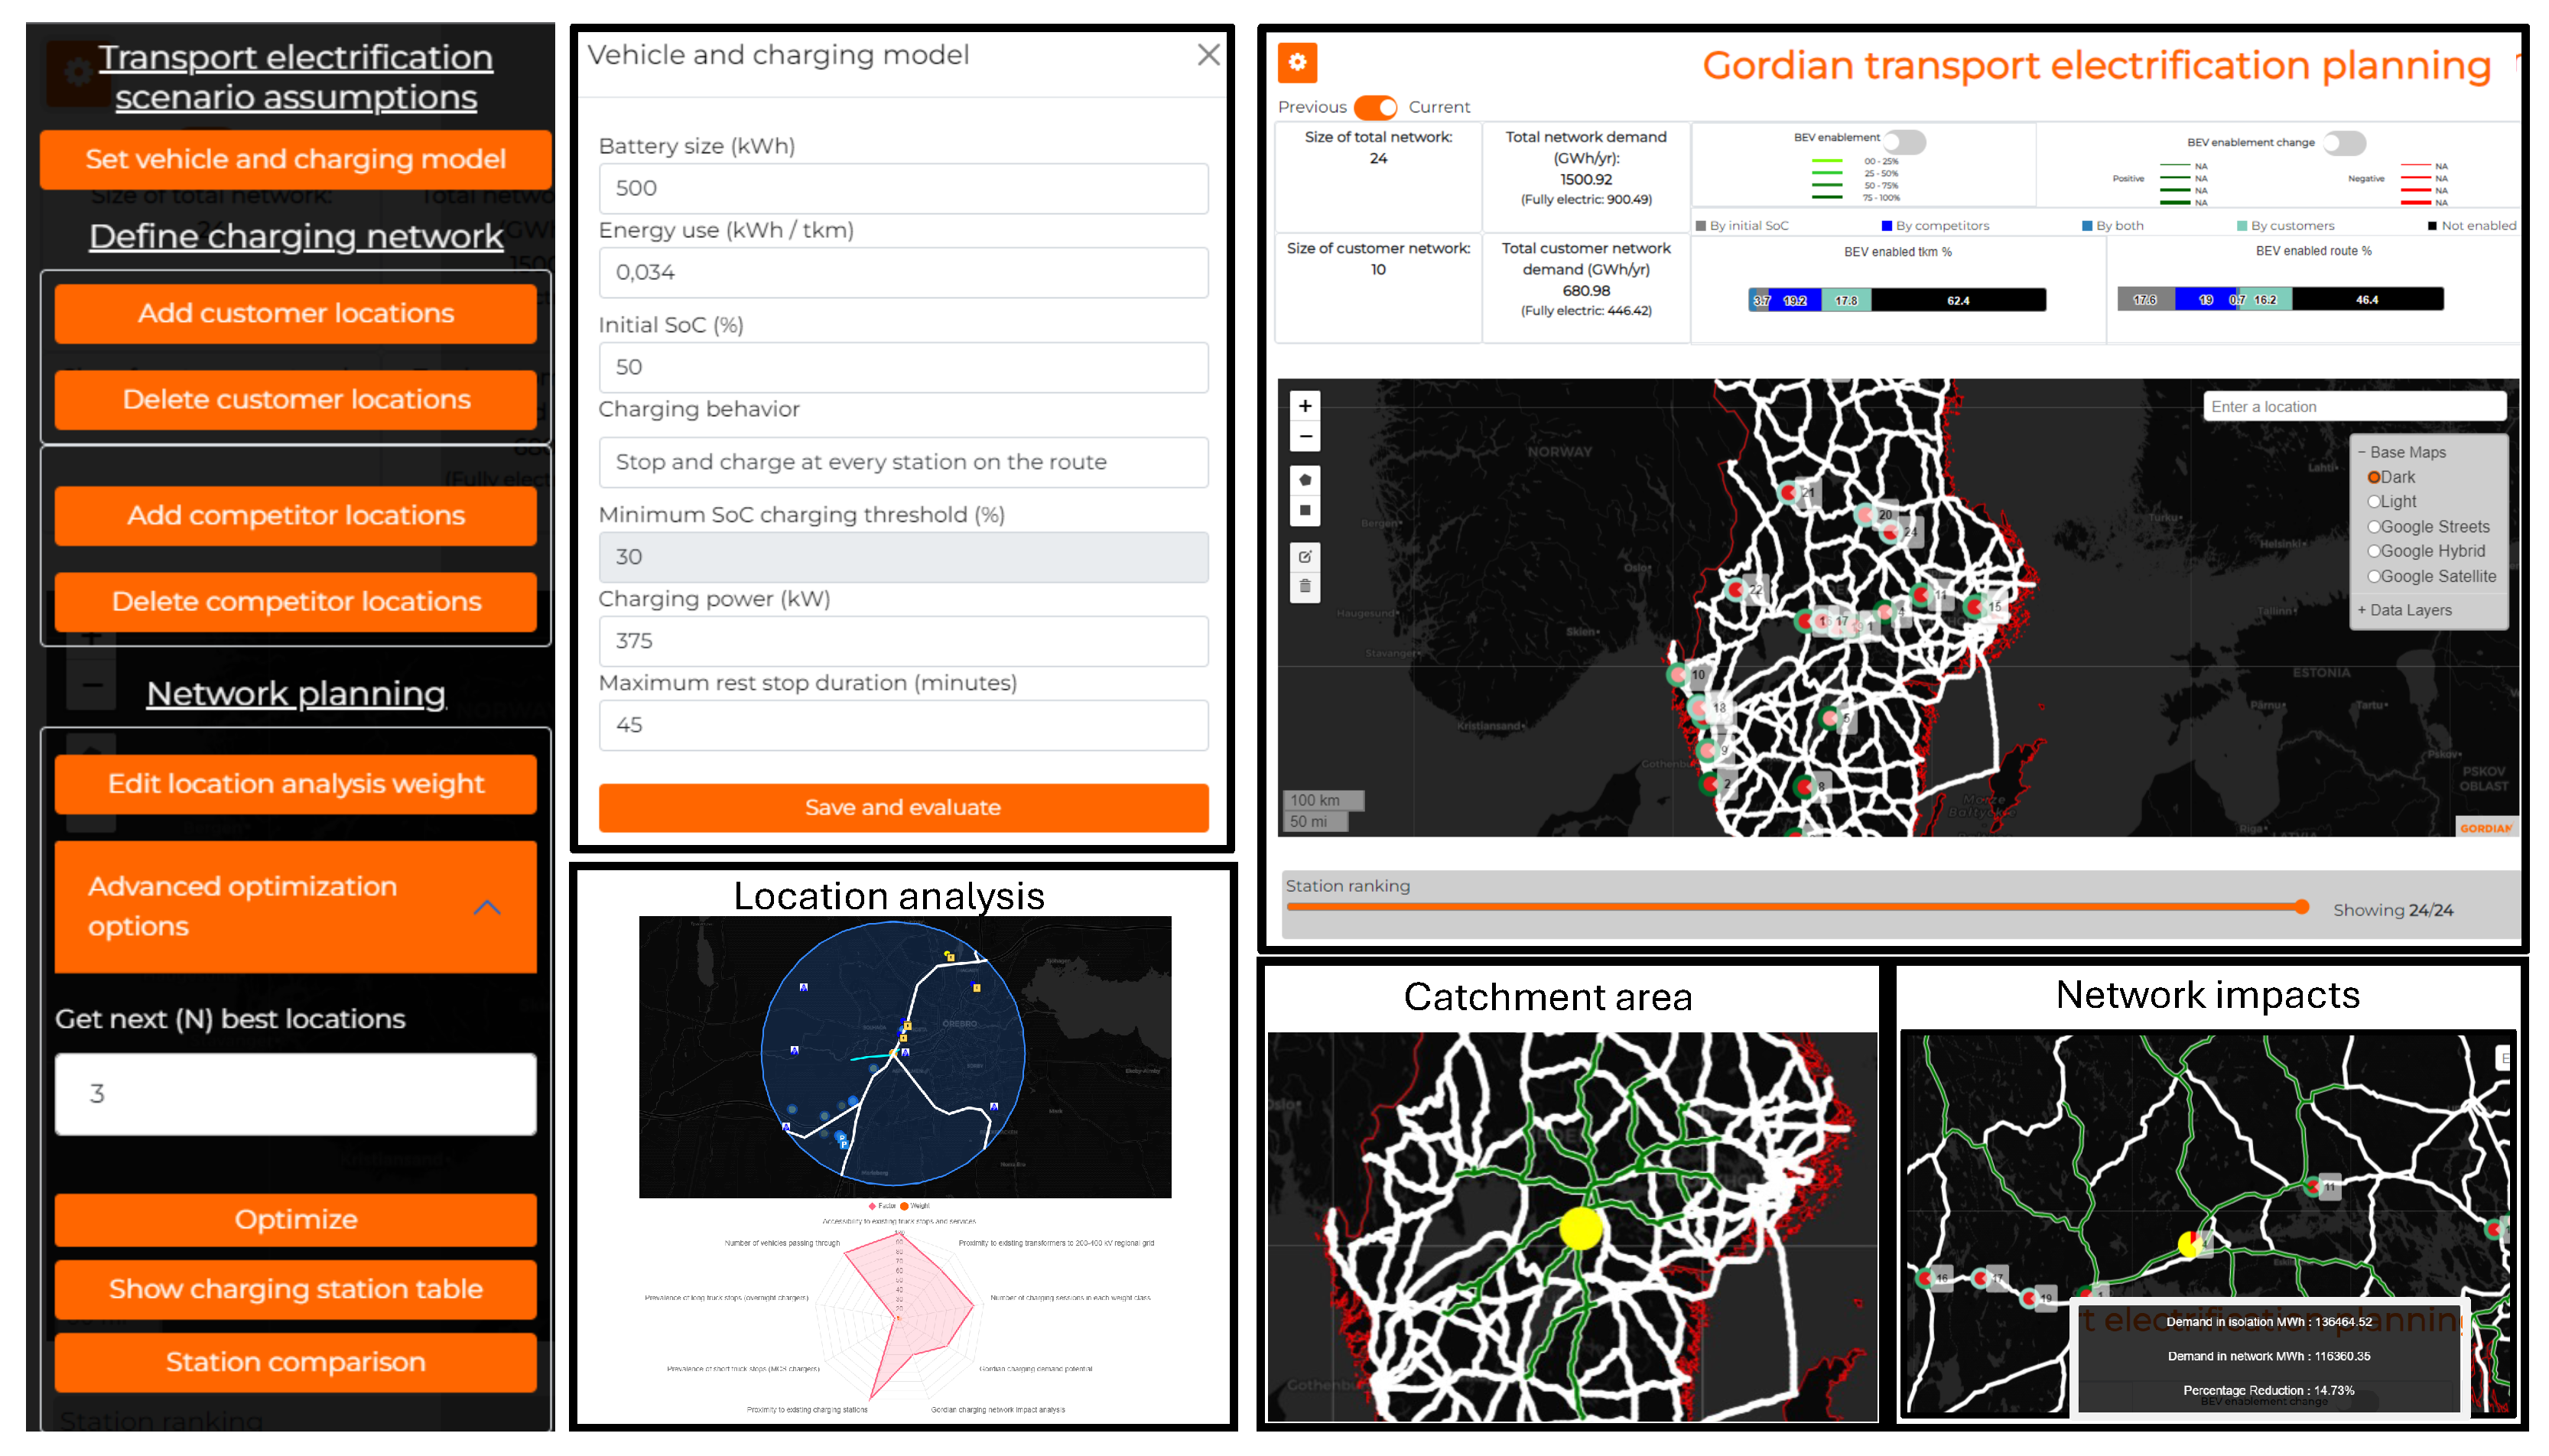
