Abstract
Battery electric vehicles represent a technological pathway for reducing carbon emissions in personal road transport. However, for the widespread adoption of this type of vehicle, the user experience should be similar to that of combustion engine vehicles. To achieve this objective, a robust and reliable public charging infrastructure is essential. In Spain, the electric recharging infrastructure is growing quickly in metropolitan areas but much more slowly on roads and highways. The upcoming charging stations must be located along high-volume traffic corridors and in proximity to the Trans-European Transport Network. The main contribution of this research is to offer a method for examining the essential electricity infrastructure investments required in scenarios involving substantial electric vehicle adoption. The methodology includes a sensitivity analysis of fleet composition and market share, recharging user behavior, charging station density, and vehicle efficiency improvements. To this end, the authors have developed a simplified probabilistic model, addressing the effect of the involved parameters through a comprehensive scenario analysis. The results show that the actual number of high-capacity charging plugs on Spanish roads is significantly lower than the European regulation requirements for the year 2030 considering an electric vehicle market share according to the Spanish Integrated National Energy and Climate Plan 2021–2030 objectives and it is far from the necessary infrastructure to cover the expected demand according to the traffic flow. Under these circumstances, the charging peak power demand reaches over 7.4% of the current Spanish total power demand for an electric vehicle fleet, which corresponds to only 12% of the total.
1. Introduction
Currently, Spain has the fourth largest passenger vehicle fleet in Europe, with over 26 million light-duty vehicles (LDVs) on the road at the end of 2022 [1]. Nevertheless, there exist only around 110,000 electric private cars [2], representing 0.5% of the light-duty vehicle fleet. The growth rate of electric vehicles in Spain is slower than that in other European countries, with a new passenger car registration share of near 4% in 2022. The Spanish Integrated National Energy and Climate Plan 2021–2030 (PNIEC), as part of the European Union (EU) energy and climate targets for 2030, has established the objective of achieving a fleet of 5 million electric vehicles (EVs) and 500,000 charging spots in Spain by 2030, with a 100% share of new LDV registrations composed of EV by 2040 [3].
Battery electric vehicles (BEVs) are available in a wide range of car body types but with limited ranges in real driving conditions [4,5,6]. Furthermore, the capacity of batteries tends to gradually diminish with time, which harms the current driving range of BEVs [7]. This characteristic of electric vehicles, along with the limited availability of public charging points, restricts their use to metropolitan areas where the daily distances traveled are short, usually less than 65 km [8], and where scheduled charging predominates, either at home or in the workplace [9]. Currently, car manufacturers are trying to expand the range of battery electric vehicles for long-distance travel by increasing energy storage and vehicle charging power capacity. These improvements have negative impacts on vehicle efficiency and acquisition price. However, these solutions must be accompanied by an adequate charging infrastructure, both in terms of station locations and the number and availability of fast-charging plugs (DCFC), delivering power from 50 to 350 kW. It is found that when the vehicle’s battery energy storage is between 40 and 60 kWh and there exists a sufficient charging infrastructure, it is possible to cover long journeys greater than the BEV range without time delays [9]. In addition, there are significant interactions between electric powertrains and charging infrastructure when the BEV market share is over 5% [10,11]. China is an example of this situation, with more than 7 million electric vehicles on the road. In these cases, the issues that arise are related to the management of the electric distribution systems (EDSs) during periods of high electricity demand or with vehicle-to-grid (V2G) operation [12], as well as the control of emissions of the electricity system [13].
The European regulation [14] establishes the basis for the development of alternative fuel refueling and recharging infrastructure, particularly the objectives of the charging infrastructure for light electric vehicles. Since 2024, EU Member States have ensured that for each new light battery electric vehicle registered, a total available power of at least 1.3 kW must be supplied through public-access charging stations. Additionally, when the proportion of light battery electric vehicles compared to the total fleet of light vehicles registered reaches at least 15%, the regulation fixes values for charging station density and their available power. Following these regulation guidelines, the Trans-European Transport Network (TEN-T) should have available charging stations for light EVs, in each direction of travel, with a maximum distance of 60 to 100 km between them, depending on the average daily traffic flow (ADTF) on the road. Each charging station (CS) should meet the following minimum requirements by 2035: (i) available power of at least 600 kW and (ii) inclusion of at least two DCFC plugs with an individual power availability of at least 150 kW.
Meeting European regulations and national policy objectives involves the widespread adoption of BEVs and the installation of an adequate number of DCFC stations, which implies a significant grid electric power demand by 2030 according to Spanish PNIEC objectives. The growing demand for charging events could result in long-term consequences for the electrical infrastructure, such as a decreased lifespan of transformers, increased degradation of feeder networks, considerations regarding service quality, and the need for capacity upgrades at substations [15]. Nevertheless, in Spain, as of 2023, there are only 4185 fast-recharging plugs with a power capacity of over 50 kW [16], most of them located in metropolitan areas with high population density like Madrid and Barcelona, and less than 5% of charging stations meet the 60 km distance criterion [17]. Therefore, the current recharging infrastructure on the highways and traffic corridors of Spain is under-dimensioned.
Several studies have evaluated the impact of BEV charging on the electricity infrastructure (generation, transmission, and distribution) due to the additional load and variations in the daily power generation peaks. An initial comprehensive investigation conducted by the National Renewable Energy Laboratory (NREL) [18] suggested that the increased electricity demand caused by BEV charging would likely have minimal negative repercussions on the electricity generation infrastructure in the United States but noted the impact on distribution networks as the most critical concern. Another study suggested that the widespread use of BEVs with higher battery capacities and the establishment of broader charging accessibility might diminish the peak demand from charging or shift the maximum demand time frame to one that is not aligned with peak household demand [19]. Furthermore, the stress of EDSs [20] could be reduced by implementing storage facilities at the CSs and promoting the potential provision of V2G services by electric vehicle owners [21].
An analysis of large-scale BEV charging demand at a national level has been explored in several previous research works. The Monte-Carlo simulation (MCS) approach has been frequently adopted to handle the problem using different types of probability distribution functions (PDFs) for some input variables to consider spatiotemporal uncertainties. Zheng et al. [22] projected the increased demand for EV charging for a Chinese city in the medium and long term using probabilistic models to represent EV charging patterns. Su et al. [23] investigated the BEV fleet charging power demand in New Zealand considering several BEV fleet characteristics, market penetration, and charging behaviors. Mitrakoudis and Alexiadis [24] presented a modeling process for the annual simulation of EV charging load in Greece taking into account the battery capacities of an electrified fleet, charging behavior, daily traveled distances, or seasonal and workday–weekend effects. Similar studies have been performed in other countries. For instance, the ZERO organization report [25] on Norway’s infrastructure suggests a 40–60 km distance to cover the charging demand. The case of USA was analyzed by NREL [26] using DCFC spacing of 64 to 160 km. In other studies, this assessment was made with statistical tools and stochastic models as a function of vehicle characteristics, such as battery state of charge (SoC) or driving range [27], and user behavior, such as driving and charging practices [28] or road trips [29], or a mixture of some of these characteristics [30]. Zhou et al. [31] estimated the charging demand using a fluid dynamic traffic model combined with a queuing strategy. Wu et al. [32] use a multi-agent traffic flow simulation approach for solving CS site selection and calculating the adequate number of charging plugs (CPs) per CS by simulating user driving routes and charging behaviors. The results obtained on China’s highways pointed out the necessary equilibrium between the number of CSs and the quantity of CPs per CS for reducing queue times and minimizing facility cost investments. Moses Babu [33] studied the impact of CS location in the EDS using a multi-objective particle swarm optimization (PSO) algorithm to minimize power losses and voltage variations. Silber [34] analyzed the power dimensioning of CS using a stochastic MCS applied to the German market. Their study indicated that the location of CSs has a minimum effect on CS maximum power, while the number of available CSs and the frequency of BEV arrivals reduce or increment the rate of the power installed at a CS in relation to the maximum available power delivered by the EDS [35,36].
Additional research works examine the spatial distribution of electric vehicle supply equipment (EVSE) infrastructure in the national road network utilizing Geographic Information System (GIS) tools [37], specifying preferred locations and suggesting that CSs should be situated in pre-existing built-up areas, such as gas stations or rest stops. In other cases, when CS charging data are available, it is possible to predict future charging scenarios using traditional statistical techniques, machine learning, or hybrid methodologies [38]. However, other studies used population density data and the proportion of BEV users for the estimation [39].
Specifically, planning the BEV-charging infrastructure for Spain has been explored in a few related studies. For instance, Colmenar-Santos’ research work analyzes the minimum quantity of CSs for interurban displacements through the definition of the distance between CSs on Spanish highways using vehicle data from manufacturers [40]. In this study, a maximum distance of 60–70 km is recommended, resulting in around 384 to 423 fast-charging stations for the state highway network. A study conducted by ECODES [41] focuses on the evolution of the electric vehicle fleet up to 2030 following the objectives set by the PNIEC, forecasting the deployment of 58,230 fast-charging points and an installed capacity of around 3170 MW nationwide. A study by ICCT [42] suggests a proportion of 250 BEVs per DCFC for nonmetropolitan areas by 2030. Conversely, Fernández’s research work [43] analyzes the influence of rising power demands on the EDS due to the generalized introduction of BEVs in metropolitan areas with power demands up to 50 kW and the Spanish transition to green energy sources. The research points out that, under certain conditions, the transition towards electromobility and the reduction in, or even the elimination of, non-renewable power sources could lead to the collapse of the Spanish electrical system.
As may be seen, the literature that simultaneously analyzes CS planning and deployment and EDS requirements is scarce and diverse, based on probabilistic models to characterize EV charging patterns and predictive models to estimate the future EV market share, taking into account spatial and temporal concerns. Accordingly, the developed algorithms manage the random behavior of EV charging patterns using classic stochastic models, assigning individual random values to the model variables according to a PDF with a determined rate, often based on historical data. In this sense, uncertainty is addressed by assigning multiple values to the model input variables, simulating a high number of scenarios. The frequencies of the results generated by these simulations will follow a normal distribution establishing the probabilities of the results. This is the basis of the stochastic approach developed for this study. The Central Limit Theorem (CLT) [44] states that when a large number of random variables are summed, the resulting variable follows a distribution that is approximately equal to a normal distribution. This methodology has been used in a previous work by the authors [43].
However, it is necessary to move away from theoretical planning methods towards comprehensive real-world case studies [45]. In addition, the charging infrastructure development will span multiple years. Thus, a gradual implementation over time must be contemplated, taking into account the starting infrastructure already installed [46].
The objective of this study is to highlight that the development of an expanding network of charging stations on highways and roads also requires EDS planning to avoid possible service issues. To this end, the authors have developed a probabilistic model to analyze the impact of the high power requirements of fast-charging events on long road trips. Additionally, the model is applied to Spain and estimates the charging infrastructure in a Spanish state-controlled road network (SRN) that would fulfill regulation 2023/1804. Despite SRNs representing only 16% of the total Spanish road network, they account for 52.5% of total traffic and around 47% of the TEN-T network. The Spanish TEN-T road network represents 12,369 km and includes around 7.5% of the total Spanish road network. This study is focused on passenger vehicles and DCFC chargers installed within the time frame from the years 2025 to 2030.
The novelty of this study relies on the analysis of the impact of the growing power demands resulting from the use of BEVs on long road trips on national power demand using historical data on traffic flow and, simultaneously, considering aspects related to user behavior and BEV market evolution in terms of volume, fleet mix, and technical characteristics. This study aims to achieve a public charging infrastructure equivalent to the fossil fuel station network. Several scenarios, including a sensitivity analysis of BEV fleet composition and market share, charging behavior, charging station density, and vehicle efficiency improvements, are evaluated. Three different technologies of BEVs have been selected, considering an operating range from 200 to 500 km based on mid-sized vehicles. On the other hand, the customer behavior effect is expressed through the range threshold level between charging events, the time spent recharging the vehicle, and the probability of using non-public charging devices. Additionally, different charging station densities and vehicle efficiency cases have been evaluated. Finally, the results are presented by autonomous community regions along the years of the time frame under study.
The results show that the actual number of high-capacity charging plugs on Spanish roads is approximately 2.5 times lower than the European regulation requirements for the year 2030 considering a BEV market share aligned with PNIEC objectives and 10.5 times lower than the necessary infrastructure to cover the expected demand according to the traffic flow. Under these circumstances, the vehicles’ peak power demand reaches over 7.4% of the Spanish total power demand in the year 2024, reaching 2.6 MW.
The article is structured in three main sections. The methodology section explains the probabilistic method used for assessing the national aggregated power demand due to charging infrastructure in the SRN, the calculation of the quantity of DCFC plugs, and the design of the scenarios analyzed in this study. The second section shows and analyzes the results obtained from applying the method outlined in the preceding section to various potential scenarios in Spain. Finally, the third section presents the conclusions, study limitations, and further investigation steps.
2. Methodology
The charging process for private light-duty BEVs on long journeys will vary depending on the specific attitudes of the drivers and the distances traveled per trip. The charging events can be categorized into two types:
- Non-scheduled charging event: This type of charging is usually performed at public service stations. This situation represents the upper bound of power charging demand, using fast chargers to reduce time.
- Scheduled charging event: In this case, the driver will use longer rest periods, like a stop for dinner in a restaurant or to spend the night in a hotel, to charge the vehicle. The vehicle charging will be performed at a restaurant, hotel, or service station near the travel path. In this case, the charging event is less power-demanding because there is more time available for recharging the vehicle.
This research work is focused on the first type of charging possibility, where BEV users traveling along the highway will use the available infrastructure of fast charging (over 50 kW) randomly. This behavior is similar to the current refueling habit of internal combustion engine vehicles. On this basis, the study scope includes long-distance travel, higher than the vehicle range, and waypoint (not scheduled) DC fast charging. In addition, the spatial resolution is limited to the SRN, which covers the state-controlled roads in the Spanish peninsula, except Navarra and the Basque Country.
Finally, the charging infrastructure sizing should fulfill regulation 2023/1804 in terms of minimum charging station density, power capacity, and number of high-power charging plugs. In this sense, this study considers that all the CPs at a station can deliver the maximum power requested by the vehicle. Additionally, standard DCFC devices may have up to three plugs of different types, but only one of them can be used at full power at a time.
The total power demand in a day at the national level is assessed by extrapolating the electric power charging demand of a CP at a determined station located within the SRN. The individual power demand is estimated using a probabilistic method based on a three-level probability scheme. On this basis, the electric power demand is disaggregated by autonomous communities, with a time resolution of hours for electric load profiles and years for infrastructure deployment up to the year 2030. The proposed methodology is presented schematically in Figure 1.
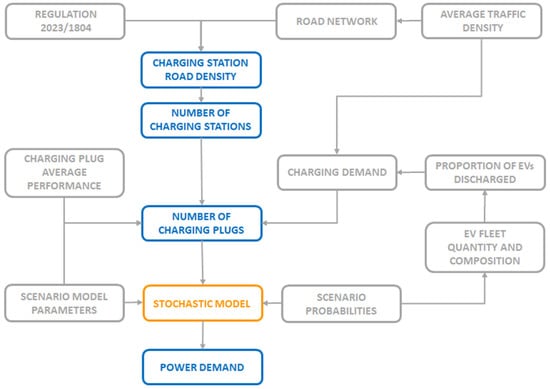
Figure 1.
Methodology scheme.
The following paragraphs explain the stochastic approach used for modeling the randomness of the system, intending to estimate the daily electric power demand and the total number of CPs. Finally, the design of the model scenarios analyzed in this study is presented.
2.1. Modeling the Randomness of the System
The estimation of the power demand of a CP at a determined station is based on a three-level probability scheme (Figure 2). This hierarchical structure allows for the classification of the power demand of a CP in a specific time slot. To achieve more accurate results, one hour is divided into three 20 min time slots (TSs). This time slot duration is suitable considering the average power supplied to the vehicle and 5 min of plug operation. In these conditions, it is possible to gain over 60 km of vehicle range in the worst-case scenario.
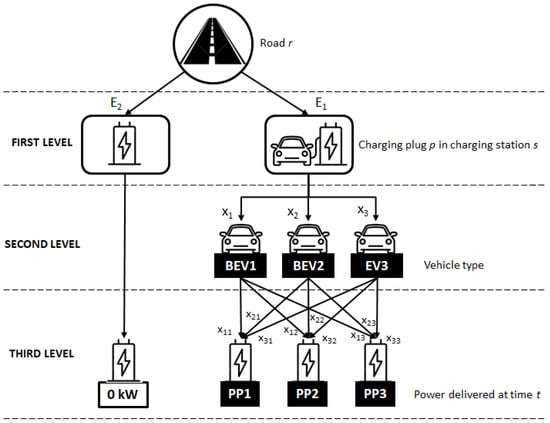
Figure 2.
Probability scheme.
In Figure 2, the first level is related to the likelihood of a vehicle starting to recharge. The decision to plug in the vehicle is based on the minimum range that the user establishes, but this value should be high enough to reach the nearest charging station. Depending on the battery capacity and vehicle efficiency, this threshold level is expressed with different values of remaining kilometers to charge the vehicle. In addition, the probability is also a function of traffic density on the road where the charging station is located.
The second level is determined by the type of vehicle. Vehicle classification is based on their range. Taking into account the vehicles currently available on sale on the Spanish market, three categories have been considered (Table 1). Therefore, the vehicle range is a function of battery capacity and vehicle efficiency. Energy consumption will depend on vehicle characteristics (i.e., weight and aerodynamic resistance) and driving influence factors, such as speed, driver behavior, climate, road conditions, and battery state of health. However, in this study, it is assumed that the battery is in perfect condition and the vehicle efficiency is similar to highway and mild weather driving conditions.

Table 1.
Vehicle categories and characteristics.
The third level is related to the charging power delivered by the charger plug. Charging is possible by using a regular plug—in Europe CCS Combo 2 located at a public charging station. How fast the BEV can charge depends on the power capacity of the charging plug and the maximum charging capacity of the internal vehicle charger. DC fast chargers can deliver a peak power from 50 kW up to 350 kW. In this study, it is considered that all the CPs at the station have the same characteristics and can deliver three power levels to the vehicles (Table 2). Fast charging facilitates extended journeys by maximizing the range added in the shortest amount of time possible. Nevertheless, charging efficiency notably decreases once the battery reaches SoC 80%. Consequently, rapid charges typically stop short of reaching 80% SoC. Therefore, considering the power delivered by the CP and the maximum amount of power that the vehicle can handle, this study distinguishes between the following:
Table 2.
Charging plug power levels.
- Peak power: maximum power provided by a charge plug.
- Average power: average value delivered to the vehicle by the plug over a charging session.
Each CP of a station can deliver power to a vehicle at each TS in an arbitrary way. In this sense, the discrete random variable Wpt is the power delivered by a CP p in a TS t, as expressed in Equation (1), where parameters are the probabilities of each power demand level (APi) expressed in kilowatts:
The mean value of the random power delivered by a CP is calculated according to the probabilistic laws (Equation (2)):
The probabilities of each power demand level (Pi) depend on the conditions of each scenario and they can be calculated as compound probability equations according to Equations (3)–(6), following the probability scheme shown in Figure 2. In Figure 2, the first level corresponds to the probability of whether the charging point is in operation (E1) or not (E2). It is evident that if there are no vehicles plugged into the charging point, the power delivered is zero. The second level takes into account the different types of vehicles that can recharge at the charging station, allocating a series of probabilities (x1, x2, and x3) to each vehicle type (BEV1, BEV2, and BEV3). Finally, the third level establishes the set of probabilities (xij) for delivering a power level APj to the corresponding vehicle BEVi plugged into a specific TS. For example, x32 represents the probability of delivering the power level AP2 (128 kW) to a vehicle type BEV3. It is considered that the DC charging capacity of a vehicle type BEV1 is below 50 kW and 150 kW for a BEV2 type, but the BEV3 type can demand up to 350 kW. Therefore, the probability of a BEV1 vehicle recharging at power level AP2 (x12) or AP3 (x13) is zero. Similarly, this applies to BEV2 vehicles at power level AP3 (x23), while a BEV3 vehicle can charge at any power level.
Therefore, the power delivered by a number n of plugs at a TS t will adjust a random variable (, and it is defined as the sum of the power delivered by each independent plug ( as seen in Equation (7).
When there exists a large number of CPs, it is possible to apply the Central Limit Theorem (CLT), and the probability distribution of the random variable , which corresponds to the total power delivered in a TS t, follows a normal distribution function. Then, the expected national power demand ( per TS t is obtained from Equation (8), where NCP is the total number of CPs.
2.2. Sizing the Total Number of Charging Plugs
The total number of charging plugs (NCP) is determined by the sum of the CPs per charging station (CPs) located in the SRN (Equation (9)).
The number of charging stations (NCS) in the SRN depends on the charging station density considered in each road (RCSr). Regulation 2023/1804 defines the maximum distance between consecutive CS as a function of the annual average daily distance (AADT). For roads with an AADT of over 3000 vehicles per day, the maximum distance covered can take values between 60 and 100 km if the AADT is fewer than 3000 vehicles. Additionally, along roads with an AADT of fewer than 8500 vehicles, it is possible to set up one charging station in only one direction of travel. However, the regulation establishes a minimum of one charging station per direction of travel on highways and also on roads with an AADT of over 3000 vehicles.
In consequence, the total number of charging stations () calculated in Equation (10) is the sum of the charging stations (CSr) per road r in the SRN, considering that the total number of roads in the SRN (NR) is 388 [47].
The infrastructure size depends on the charging demand level in each charging station. The charging demand level (CDs) in a charging station s in every TS is calculated in Equation (11) and is a function of the average daily traffic intensity on the road where it is located (ADTs), the number of charging stations per the direction of travel (KRr), the proportion of BEVs in the traffic flow (C1b), the proportion of discharged vehicles in the road (C2r), and the proportion of vehicles coming from a different region than that in which the road is located or local vehicles but with no home charging option (C3f).
Traffic intensity (ADTs) expresses the expected maximum number of vehicles that will cover the road section where the charging station is located. This parameter is estimated using the values of an hourly traffic intensity distribution (KIH(t)), and the average daily traffic intensity in the road section under consideration (AADTs*) according to Equation (12).
The hourly traffic intensity distribution (KIH(t)) used (see Figure 3) is based on a typical hourly variation in traffic volume suggested by the Traffic Monitoring Guide of the U.S. Department of Transportation [48]. This graph shows the typical evening peak hours on road routes during weekdays. The is estimated using the annual data provided by the Spanish Ministry of Transport [49]. Furthermore, the value is projected for future years using the yearly total fleet estimation.
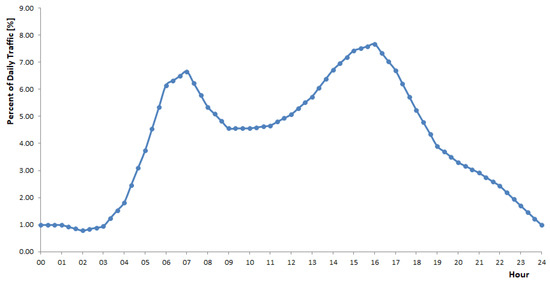
Figure 3.
Hourly traffic intensity distribution (KIH(t)).
The proportion of BEVs in the traffic flow (C1b) is estimated through the market share of this type of vehicle in the Spanish fleet. The BEV share estimation is determined using a logistic growth function fit [50,51], considering a total fleet size in Spain of 32.7 million vehicles in the year 2030.
In addition, the proportion of discharged vehicles (C2r) estimation is obtained through Equation (13). It is a function of the charging station density (RCSr) per road r recommended by the regulation and the vehicle range between recharging events (RGR). The RGR value approximation (Equation (14)) is built using a range of reference (RGref) and a range threshold (RGth). The RGref value is calculated as a function of the probabilities (xi) and ranges (RGi) of the different vehicle types (BEVi) in the traffic flow in each scenario analyzed (Equation (15)). On the other hand, the RGth parameter considers when the driver decides to stop to recharge the vehicle and it is a variable scenario that expresses an issue of the random behavior of BEV users.
Finally, the charging demand is corrected considering only the traffic from vehicles outside of the respective region and local traffic that does not use scheduled charging at home or the workplace (see Equation (16)). The proportion of local traffic (Kca) is estimated using the distribution of vehicles registered in these provinces obtained from the Spanish General Directorate of Traffic (DGT) [52]. The percentage of local vehicles that use private charging devices (Khc) is a scenario parameter that simulates one aspect of the charging behavior of BEV users.
The number of charging stations per direction of travel (KRr) is defined in the regulation and depends on the type of road and traffic density, and it can be either one station per direction or one for both directions.
Therefore, the number of CPs delivering power in determined TS t (CPs_w(t)) depends on the charging demand in this TS and the number of previously working CPs (Equation (17)). The number of CPs previously in operation is determined by the number of expected time slots for charging (NTSw), which depends on the vehicle types (BEVi) and the average power delivered to the vehicle (APj).
Therefore, the quantity of TSs for charging (NTSij) a determined vehicle type (BEVi) with an average power depends on the vehicle efficiency (EFFi) and the power delivered for charging the vehicle (APj), as seen in Equation (18):
Consequently, the expected values for the number of time slots required for charging (E(NTSij)) are calculated according to the probabilistic laws (Equation (19)), where Pij are the probabilities of each vehicle type (BEVi) recharge with a determined power demand level (APj) (Equation (20)).
However, the authors do not consider queues. Instead, it is assumed that charging stations can accommodate all types of demand. Accordingly, the number of charging plugs per charging station s (CPs) is determined by the maximum number of charging plugs delivering power in a specific TS t in a day (Equation (21)).
In addition, the proposed charging infrastructure must fulfill the recommendations of regulation 2023/1804. In this regulation, a charging station should have a minimum available power of 300 kW per conventional road and 600 kW per highway, with a minimum of one high-power charging plug (150 kW) in the former case and two in the latter case.
Finally, probability E1 is the proportion of charging plugs delivering power and the total number of charging plugs in the charging station at a specific TS t, according to Equation (22):
2.3. Design of Scenarios
A scenario-based methodology was employed to examine and evaluate potential future scenarios related to BEV uptake for long trips that could pose challenges to the Spanish electric system. The scenarios are delineated through the assignment of values to the model definition parameters for the subsequent sensitivity analysis. The scenarios and the boundaries of associated model parametric sensitivities are derived from a blend of existing data on BEV markets/technologies and various potential evolutionary pathways. However, a reference scenario is formulated to serve as a baseline for examining the influence of the set of scenario definition parameters. This approach facilitates the evaluation of the future power demand and charging infrastructure requirements relative to the growing national fleet of BEVs and underlines the connections with consumer preferences and technological evolution.
The parameters considered for assessing the potential scenarios are explained in the following paragraphs, and Table 3 shows a summary of the parametric sensitivities explored.
Table 3.
Summary of the scenarios analyzed.
Table 3 shows the scenarios analyzed and the selected values for each variable of the model. The following paragraphs expose the explanation of the variables considered and the purpose of the selected scenarios.
2.3.1. Scenarios Analyzed
A statistical approach is necessary if electric vehicle charging is considered a random process. This is the reason why the authors have developed an environment that handles this randomness and, at the same time, allows for proposing and managing different scenarios. These scenarios, as a portion of reality, provide the values to complete the probabilistic formulation to obtain the expected results. The investigation was performed for seventeen scenarios (S0 to S17), which are clearly defined in Table 3. These scenarios are explained with a set of corresponding values selected for those parameters that define the random variables generated. In addition, the scenarios are simulated every year of this study’s temporary horizon. The analyzed scenarios are as follows:
- Scenario S0: This scenario is the reference case of this study.
- Scenarios S1, S2, S9, and S10: These scenarios explore the influence of BEV fleet size and the mix of BEV types (xi).
- Scenarios S3, S4, S7, S8, S13, S14, and S17: These scenarios cover the charging behavior of BEV users in terms of the range threshold (RGth), the percentage of users that use private chargers (Khc), the probability of using a determined charging power demand (xij), and the time spent in charging events (tce).
- Scenarios S5 and S6: These scenarios analyzed the effect of incrementing or reducing the charging station density (RCSr) suggested by the regulation.
- Scenarios S11 and S12: These scenarios consider the influence of variations in the BEV powertrain efficiency (EFFi).
- Scenarios S15 and S16: These scenarios study the influence of the proportion of local traffic on the roads (Kca).
2.3.2. Proportion of BEVs in the Spanish Market
This research work is structured around the charging infrastructure needed in the SRN to meet the demand in scenarios with different adoption rates of BEVs. Projections of the BEV market penetration rate in the year 2030 are based on the available data on the growth of the Spanish light-duty vehicle fleet from the year 2018 to the year 2022 [52]. Three cases of BEV share of up to 10%, 12%, and 15% penetration of BEVs in 2030 are determined using a logistic growth function fit (C1b_2030) (Figure 4). The first case follows the business-as-usual Spanish BEV market tendency of the last six years [2], with 3.2 million BEVs. Meanwhile, the second case represents a moderate share of BEVs. This case is aligned with the PNIEC objectives [53], with 3.9 million BEVs. The third case shows a high share of BEVs, with 4.9 million vehicles.
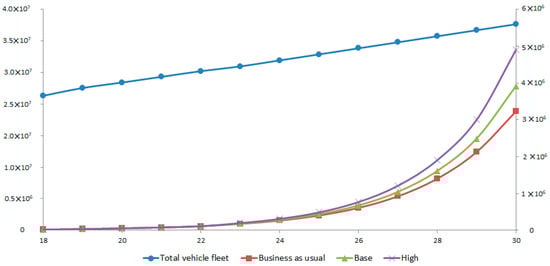
Figure 4.
BEV penetration scenarios in Spain and total fleet size from the year 2025 to 2030.
2.3.3. Charging Behavior of BEV Users
Moreover, it is assumed that BEVs will be driven in a similar way to how today’s internal combustion cars are driven, but with a different approach to travel. Stops are scheduled not for driver rest, but to recharge the vehicle. Additionally, drivers are often unlikely to wait until the battery is fully depleted before recharging. Furthermore, the charging speed at DCFC stations typically decreases as the battery reaches higher states of charge due to safety concerns, prompting consumers to leave before the battery is completely charged to minimize charging time. These issues are simulated using the following model parameters: the range threshold (RGth), the time spent on charging events (tce), the probability of using a determined charging power demand (xij), and the percentage of users that use private chargers (Khc).
The range threshold for the charging event is a function of the vehicle range and the driver’s range anxiety. In the investigation, three levels of range threshold are used: 120 km (conservative case), 90 km (base case), and 60 km (confident case). These values are selected to be consistent with the average distance between charging stations required by regulation 2023/1804, which ranges between 60 and 100 km. The conservative case expresses that users tend to charge every time they have the opportunity to do so, with a battery state of charge (SoC) at the start of charging of 60–80% [8].
On the other hand, considering the different average power levels delivered to the vehicle (APi) (see Table 1), it is possible to gain a maximum of 60 km, 170 km, and 255 km of vehicle range for the different vehicle types in a 20 min time slot. Therefore, depending on the battery state of charge before charging, a plug will be occupied by the same vehicle during more than one TS. When the user preferences are oriented to minimize the time spent at the recharging station, the vehicle will spend the minimum quantity of TS to charge the battery and gain enough range to reach the nearest charging station. However, if the user prefers to recharge to maximum battery capacity, the vehicle could spend from two to eight TSs charging depending on the charging power and the vehicle battery capacity. In this investigation, both user behaviors are analyzed.
The owners of vehicle types BEV2 and BEV3 have the option to select the charging power level (AP1, AP2, or AP3). Since it is considered that all the charging plugs can deliver all the charging power levels available, then the driver can choose. This situation is considered assigning the probabilities xij. The medium case, in which BEV3 users prefer high power for charging and BEV2 users do not have a clear preference, is the most probable scenario. However, in the low scenario, a lower power level is preferred. In contrast, for the high scenario, the users choose the maximum power available for their vehicle.
Moreover, the percentage of local vehicles that use the private charging infrastructure is considered with a value of 70% for the base case; meanwhile, the optimistic and pessimistic cases feature 90% and 50%, respectively. The base case is established using the number of vehicles that do not have access to a private parking space. According to INE data [54], there exist around 10 million private parking places; therefore, if the Spanish BEV fleet in the year 2030 reaches 4.9 million vehicles, it is reasonable to consider that over 50% of battery electric vehicles will have the option of scheduled charging. The optimistic case is aligned with the value used in other studies [29,42].
2.3.4. Charging Station Density Factor
The reference scenario considers the guidelines of European regulation 2023/1804. In this sense, road traffic corridors should have charging stations available for light BEVs, in each direction of travel, with a maximum distance of 60 to 100 km between them depending on the average daily traffic flow on the road. Each CS should meet the following minimum requirements by no later than 2035: (i) available power of at least 600 kW and (ii) inclusion of at least two DCFC plugs with an individual power availability of at least 150 kW. However, to analyze the effect of CS density on power demand, two sensitive cases of coverage index (Δ(RCSr)), either 30% worse or better than that proposed by the regulations, have been proposed.
2.3.5. BEV Fleet Mix
This study distinguishes among three categories of BEVs according to the driving range and the power charging capacity (Table 1). The BEV fleet mix variation aims to depict the relative adoption rates of short- and long-range BEVs expressed with the probabilities xi. For instance, in the reference scenario, the range specifications of the BEVs correspond to the vehicles sold in recent years and those available for sale in the current market [55]. In this scenario (Figure 5), there is a preference for BEVs with a driving range of 350 km. This situation corresponds to the market share segmentation by range realized based on the data provided by the DGT statistics [52]. Accordingly, the values of the probabilities are x1 (17%), x2 (66%), and x3 (17%). During sensitivity analysis, a scenario with a preference for shorter ranges is considered, with a predominance of BEVs with a driving range of 200 km, while the long-range sensitivity entails BEVs with a driving range of 500 km as the most preferred option on the market.
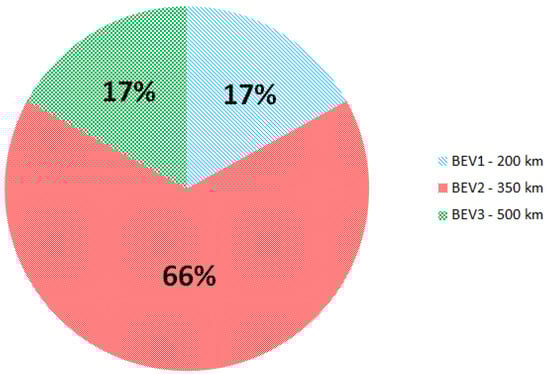
Figure 5.
Proportion of the different types of BEVs in the Spanish fleet mix by the year 2023.
2.3.6. Vehicle Technology Evolution
An annual increase in efficiency (Δ(EFFi)) of up to 1.0% is considered under real-world conditions [56]. Therefore, this analysis includes an annual vehicle efficiency improvement effect using a reduction factor for energy consumption. The pessimistic case considers a 0% reduction; meanwhile, the reference case uses 0.6% and the optimistic one applies 1%.
2.3.7. Proportion of Local Traffic
Local vehicles will have more probability of recharging in non-public infrastructures. There are no data available on vehicle mobility between the provinces in Spain; for this reason, the proportion of local traffic is estimated based on the number of registered vehicles in each of the autonomous communities, according to data provided by the DGT [52]. Regarding this, to contrast the effect of this hypothesis, the authors have applied a weighting factor to the distribution of vehicles registered in these regions as a scenario parameter (Kca). The selection of values for the weighting factor is based on the assumption that the traffic flow mostly consists of vehicles located in the region. The base case considers a 70% weighting value, which means that the regions with a high proportion of registered vehicles will have 70% of local vehicles in the traffic flow. Two more values are considered, 50% for the scenario with a high share of foreign vehicles in the traffic flow and 90% for the opposite scenario, where only 10% of the vehicles in the traffic flow are foreign.
3. Results and Discussion
This section outlines and presents the outcomes related to the expected power demand and the quantity of charging plugs for the reference scenario described earlier at the national level and divided by region. Subsequently, it evaluates the effect of the different scenario parameters on the power demand and charging infrastructure sizing. Finally, the obtained results are compared with previous research studies.
3.1. National Results in the Reference Scenario
A simulation at the national level was conducted using the parameters outlined in the reference scenario. This study reveals that about 1127 charging stations will be necessary by the year 2030. Each should be spaced by 60 km to ensure convenient access for BEV drivers throughout the SRN. Figure 6 illustrates the growth evolution considering the coverage of the expected Spanish road traffic flow. This value contrasts with the 4714 fossil fuel stations located on Spanish roads [57].
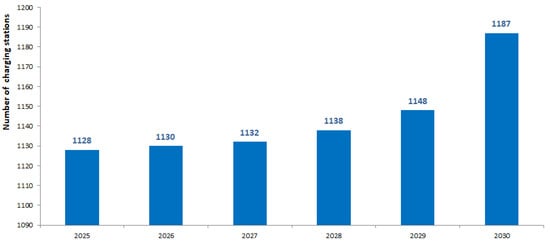
Figure 6.
Required DCFC charging stations for roads and highways from the year 2025 to 2030.
The total projected figures for charging plugs nationwide are displayed in Figure 7 for two cases, one following the minimum requirements demanded by European regulation 2023/1804 and the other to fulfill the charging demand of the national vehicle fleet. By the year 2030, it is projected that approximately 32,700 charging plugs will be in operation to accommodate 3.9 million BEVs. These estimates equate to approximately 8.4 plugs per 1000 BEVs. The existing public charging infrastructure by the end of the year 2023 represents around 10.5% of the projected plug count estimates for 2030. Meanwhile, only 7820 plugs are necessary to meet the regulation in the next six years. This means a ratio of around 800 plugs per year.
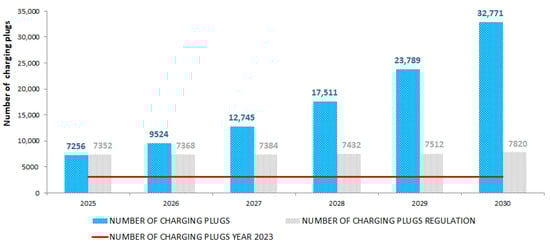
Figure 7.
Required DCFC charging plugs for roads and highways from the year 2025 to 2030.
Plug requirements at individual stations fluctuate based on the traffic demands of the roads of each region. Figure 8 demonstrates this variation for the reference scenario in the years 2025 and 2030. In the year 2025, most of the charging stations (93%) will require 5 to 15 plugs to meet peak demand. However, in the year 2030, the majority of the charging stations (91%) should have 5 to 50 plugs. Conversely, a few stations, around 1%, may need over 85 plugs to adequately handle charging demand.
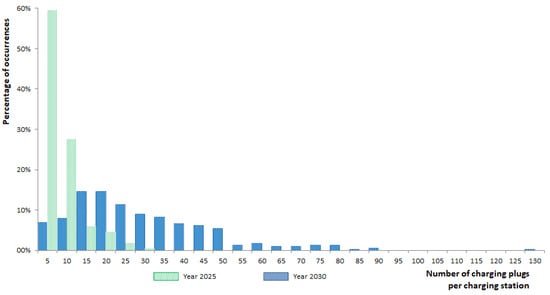
Figure 8.
Variations in the number of charging plugs per charging station between the years 2025 and 2030.
Charging plug requirements for each charging station located on individual roads are combined to determine the average number of plugs needed per charging station, based on station spacing and projected BEV adoption. Figure 9 shows these combined results for three market adoption scenarios. The scenarios range from 18 plugs per station with 42 km spacing and 3.2 million BEVs to 40 plugs per station with 78 km spacing and 4.9 million BEVs. For the reference scenario of kilometer spacing and 3.9 million BEVs, 27 plugs per station are necessary. In this scenario, an average of 30 plugs per charging station will cover 65% of the estimated charging demand.
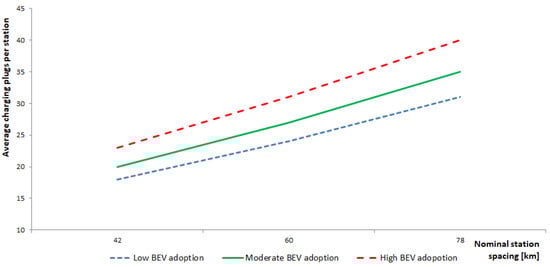
Figure 9.
Station spacing and number of charging plugs per charging station by the year 2030 (average annual quantity), considering different BEV adoption scenarios.
Figure 10 shows the expected maximum power demand at the national level under the reference scenario. The maximum power demanded by vehicle charging in 2030 represents over 7% of the total power demand on a random day in Spain meeting the expected road traffic demand and around 1.7% in case of the minimum requirements imposed by European regulations. In the first case, power demand accounts for 4% of the current renewable energy generation capacity for the electric vehicle fleet, which corresponds to 12% of the total.
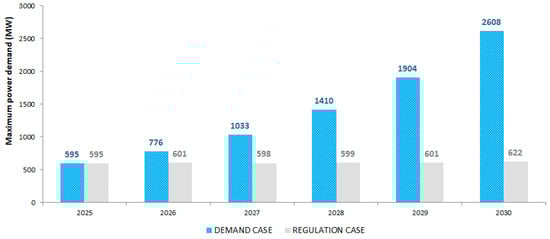
Figure 10.
Maximum power demand (MW) by year.
In this study, an average power delivered by the DCFC device is used for the estimation of power demand. The installation should be sized to provide the peak power. Therefore, the maximum power capacity determines the required power to be installed in the charging station. Figure 11 presents the comparison between the maximum power demand and the required installed power from the year 2025 to 2030.
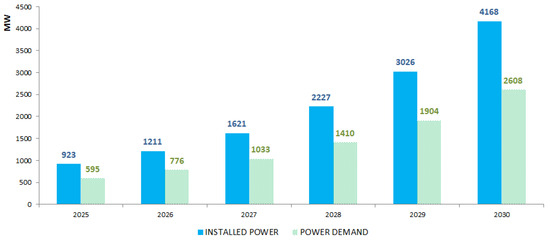
Figure 11.
Maximum power demand (MW) and power installed by year.
Figure 12 shows the evolution of the hourly expected power demand on a random day at the national level under the reference scenario in the years 2025 and 2030. As expected, power demand follows the trend set by hourly traffic intensity. Meanwhile, Figure 13 compares the road infrastructure power demand in the year 2030 with the total power demand expected in the year 2030 considering only the increment in vehicle consumption concerning the power demand in the year 2023. In this case, with the proposed power demand trend in the year 2030, the electric system could cope with the increase in consumption, despite the coincidence of power demand maximums between the hours of 6:00 and 8:00 a.m.
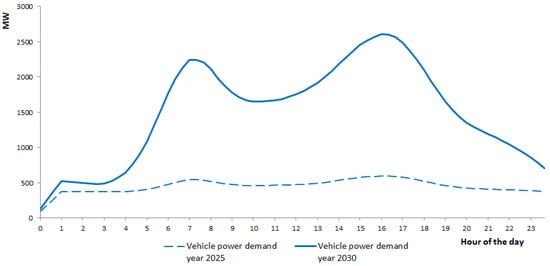
Figure 12.
Evolution of the expected hourly power demand (MW) from the year 2025 to 2030 to satisfy vehicle charging demands.
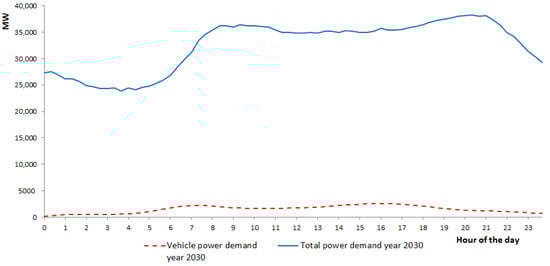
Figure 13.
Expected hourly maximum power demand (MW) by the year 2030 to satisfy vehicle charging demands.
Figure 14 compares the expected hourly power demand by the year 2030 for both cases, that stipulated in the regulation and that of meeting the expected road traffic demand. Under regulation conditions, the power demand is almost constant between the hours of 4:00 a.m. and 12:00 p.m. This behavior is due to the fact that the charging infrastructure is fully occupied during these hours, which means that there can be a certain number of vehicles that cannot recharge.
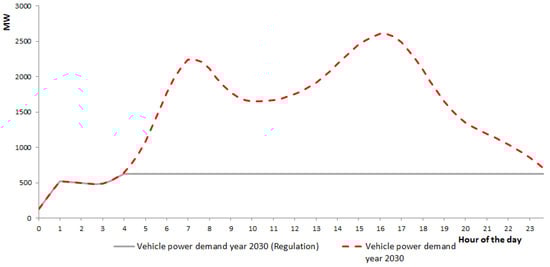
Figure 14.
Comparison of the expected hourly power demand (MW) by the year 2030 as stipulated by the regulation and to satisfy vehicle charging demands.
The authors have defined a new variable, the service factor (SF), as the ratio between the number of vehicles recharging and the total number of vehicles that need to be recharged. In this sense, Figure 15 shows the evolution of the SF in the years 2025 and 2030 for a national recharging infrastructure according to the minimum imposed by the European regulation. By the year 2025, with around 438 000 BEVs on the roads, it is possible to cover 90% of charging demand 100% of the time. However, the SF falls to a minimum of 36%, and only 16.7% of the time does the recharging infrastructure cover over 90% of the demand.

Figure 15.
Charging infrastructure service factor by the years 2025 and 2030 in the regulation case.
On the other hand, the authors have considered a no-queue situation. This means that the number of charging plugs will be oversized part of the time. Therefore, the authors have evaluated this effect using a utilization rate (UR) parameter. This parameter is the ratio of the number of working charging plugs and the total number of charging plugs available at the charging station. Figure 16 shows the UR for the years 2025 and 2030 in the reference scenario to satisfy vehicle charging demands. Considering a UR of 70%, the usual value for petrol service stations, by the year 2025, only 4.2% of the time do the plugs have a UR under 70%. But in the year 2030, this value goes up to 56.9%. This means that the more chargers have a low utilization rate, the lower the return on investment.
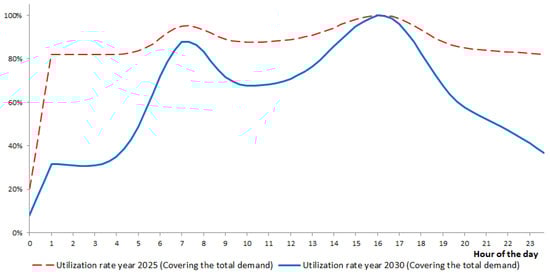
Figure 16.
Comparison of the charging plug utilization rate (UR) by the years 2025 and 2030 in the reference scenario to satisfy vehicle charging demands.
To analyze this situation, the authors have considered a case in which the charging plug infrastructure is sized to achieve a UR value of over 70% for the longest time possible with a minimum SF of 90%. In this case, by the year 2030, the percentage of time in which the UR is below 70% is reduced to 40.3%, and the total number of charging plugs is reduced by around 19.2% (Figure 17), with the corresponding infrastructure cost savings.
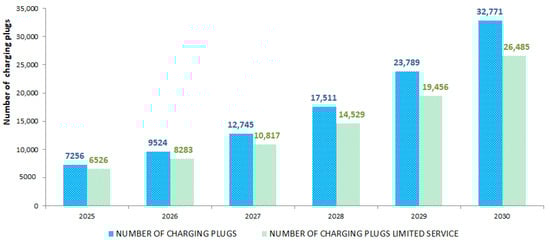
Figure 17.
Comparison of the evolution of the number of charging plugs in the reference scenario to satisfy vehicle charging demands and considering a limited service of a minimum of 90%.
3.2. Autonomous Communities: Results in the Reference Scenario
Figure 18 illustrates the evolution of the number of charging stations from the year 2025 to the year 2030 in Spanish regions. Regions with the largest surface area, such as Castilla y Leon (CL) and Andalucia (AN), have the largest number of charging stations. In contrast, regions such as Navarra and La Rioja present the lowest number of charging stations. In addition, regions such as Asturias (AS), Extremadura (EX), Murcia (MC), Navarra (NC), and La Rioja (RI) do not increase the number of service stations over the 5 years of the analyzed period. Others, such as Cantabria (CB), Madrid (MD) and Catalonia (CT), have an increment of 12% to 18%.
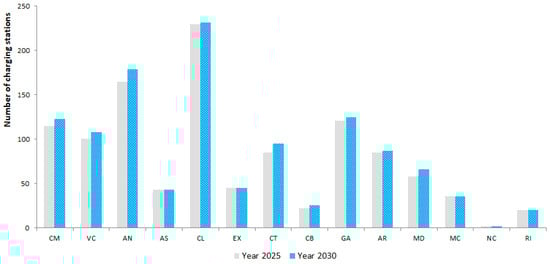
Figure 18.
Average number of charging stations by the years 2025 and 2030 in the Spanish autonomous communities. Comunidad de Castilla La Mancha (CM), Comunidad Valenciana (VC), Andalucia (AN), Asturias (AS), Comunidad de Castilla y Leon (CL), Extremadura (EX), Catalunya (CT), Cantabria (CB), Galicia (GA), Aragon (AR), Comunidad de Madrid (MD), Murcia (MC), Navarra (NC), and La Rioja (RI).
Figure 19 shows the evolution of the number of charging plugs in the Spanish autonomous communities from the year 2025 to 2030 referenced to data for the year 2023 under the reference scenario. As can be observed, at present, only Catalonia (CT) is close to the year 2025 objectives. All the Spanish regions are far from the 2030 objectives; the best case is that of Catalonia, which requires 4.5 times more than the current number of charging plugs. On the other extreme is Galicia, which needs to multiply its current number of charging plugs by a factor of 14. Interestingly, an atypical case is found in Navarra, where the current number of plugs is higher than the number expected to be needed in 2030. However, all the Spanish regions show a significant increment in the number of plugs during the period of analysis. The average increase in the year 2030 is 12 times higher than that presented in the year 2025, whereas the increase in the BEV fleet in the year 2030 is around 9 times higher.
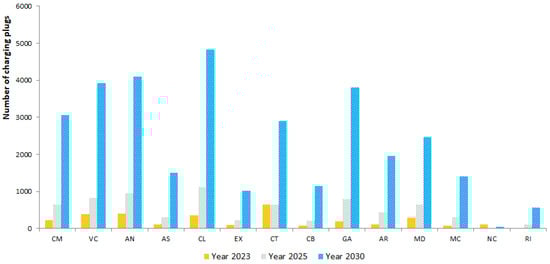
Figure 19.
The number of charging plugs in the years 2023, 2025, and 2030 in the Spanish autonomous communities. Comunidad de Castilla La Mancha (CM), Comunidad Valenciana (VC), Andalucia (AN), Asturias (AS), Comunidad de Castilla y Leon (CL), Extremadura (EX), Catalunya (CT), Cantabria (CB), Galicia (GA), Aragon (AR), Comunidad de Madrid (MD), Murcia (MC), Navarra (NC), and La Rioja (RI).
Figure 20 depicts the evolution of the average number of charging plugs per charging station in each Spanish region. Regions with a smaller surface area but with a higher traffic flow present a higher ratio of chargers per service station. This is the case of Cantabria (CB), Murcia (MC), Madrid (MD), Comunidad Valenciana (VC), and Asturias (AS). In the opposite situation are the regions of Castilla y Leon (CL), Aragon (AR), Andalucia (AN), and Extremadura (EX). The average number of charging plugs in a Spanish charging station is 30, which means that the power installed per charging station should be in the range of 1.5 MW to 10.5 MW.

Figure 20.
The average number of charging plugs per charging station by the years 2025 and 2030 in the Spanish autonomous communities. Comunidad de Castilla La Mancha (CM), Comunidad Valenciana (VC), Andalucia (AN), Asturias (AS), Comunidad de Castilla y Leon (CL), Extremadura (EX), Catalunya (CT), Cantabria (CB), Galicia (GA), Aragon (AR), Comunidad de Madrid (MD), Murcia (MC), Navarra (NC), and La Rioja (RI).
3.3. Sensitivity Analysis of National Results
This section shows how sensitive the results are to key assumptions. Figure 21 shows the scenario parameter-dependent elasticity of total national DCFC plugs. The total number of charging plugs in Spain is proportional to the charging power level, the BEV fleet mix, the charging station density, and the number of BEVs in the Spanish fleet. Surprisingly, the national BEV fleet size is not the most critical factor in this analysis. Instead, the BEV fleet mix and the charging power level have the greatest impact. For instance, if the number of BEVs decreases from the central estimate of around 4.9 million to 3.9 million, the quantity of DCFC plugs drops from 32,771 to 28,285. Conversely, if the BEV fleet mix is mainly composed of vehicles with a range of 500 km, the need for recharging points is drastically reduced to 19,685. In addition, if the drivers select the maximum vehicle allowable charging power capacity, the number of plugs decreases to 24,698.
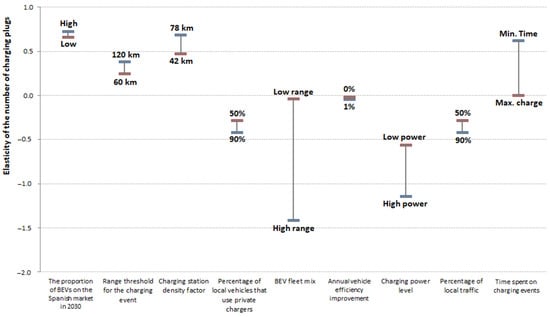
Figure 21.
Elasticity of the number of charging plugs with the model parameters.
Therefore, the order of influential parameters (from highest to lowest) is (1) the charging power level, (2) the BEV fleet mix, (3) the number of BEVs in the national fleet, and (4) the charging station density factor. However, the percentage of local vehicles that use private chargers, the percentage of local traffic, the range threshold for the charging event, and finally the time spent on vehicle charging have a significantly lower influence, while vehicle efficiency improvement has a negligible effect.
In this context, a growing BEV fleet will have less impact on the size of the infrastructure if users purchase vehicles with a range of around 500 km, drivers use high charging power, reducing the charging time, and the majority use private charging infrastructure for local trips. It is encouraged that drivers maximize the use of their vehicles’ available range. These BEV user variables should be followed with an adequate charging station density.
Figure 22 displays the results concerning electric power requirements. The analysis of the results indicates that the power requirements are mainly proportional to the national BEV fleet size and charging station density factor, followed by the percentage of local traffic, the percentage of local vehicles that use private chargers, and the charging power level. As a reference, when the BEV fleet is reduced from 4.9 million to 3.9 million (20.4% lower), the power requirement decreases from 2610 MW to 2250 MW (13.7% less). However, a reduction of 32.5% in the vehicle charging power level implies a national power requirement of 2180 MW (16.4% less).
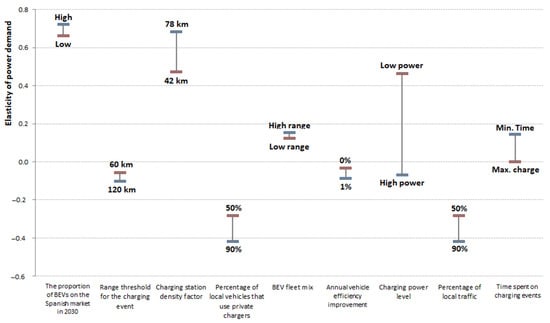
Figure 22.
Elasticity of the power demand with model parameters.
Consequently, the parameters with the greatest influence on power demand are (in order from highest to lowest) (1) national BEV fleet size, (2) charging station density, (3) the percentage of local traffic and the percentage of local vehicles that use private chargers, and (4) vehicle charging power level. However, variations in BEV fleet composition, the range threshold for charging events selected by the driver, and time spent on recharging, along with improvements in vehicle efficiency, have a lower impact on the power demand.
Therefore, the power requirements are expected to grow in scenarios with a high number of BEVs in the national fleet, a low charging station density factor, and a low use of private chargers.
Nevertheless, the parameters that cause positive effects on the reduction in infrastructure requirements involve an increase in the expected power demand. This is the case of the BEV fleet mix driven by vehicles with high range and the use of higher charging power levels. But if both infrastructure investment and power demand are taken into consideration, the best solution in a scenario with a high BEV uptake is a high charging station density factor and drivers using private charging infrastructure for local trips and also minimizing the time spent on charging events.
3.4. Discussion
Previous studies on this topic have investigated the planning of BEV charging infrastructure in Spain by 2030 under different approaches using several scenarios of BEV market sales focused on metropolitan and nonmetropolitan areas. Nevertheless, the results obtained are diverse because of the different starting assumptions used.
A study conducted by Colmenar-Santos [40], based on the topology of the road network, recommends a minimum of 384 charging stations for the 26,459 km of the Spanish road network, with a maximum charging station density of 61.5 and an average vehicle range of 150–200 km. These numbers seem to be insufficient when compared to the number of petrol stations currently in operation in Spain, which is 11,872 [57], of which about 4200 are on the roads. Notwithstanding this, if the topology of the charging station mirrors the road network and the locations are determined more accurately, the expected number of charging stations should be higher.
According to the General Directorate of Traffic data [52], the fleet of LCVs in Spain has more than 25 million passenger cars, of which 13.8 million are less than 14 years old, which is the average age of the vehicles on the roads in Spain. These numbers imply an average petrol station density of 3285 vehicles per petrol station, with one petrol station per 6.3 km. In the present analysis, under the reference scenario conditions, the authors have calculated a charging station infrastructure of 1187 stations with 3.9 million BEVs by the year 2030 with a charging station density of 60 to 100 km recommended by European regulation, which results in around 3285 BEVs per charging station, obtaining the same ratio as in the previous case of petrol stations. This result points out that the expected number of charging stations could be enough to satisfy the BEV demand.
However, a different issue is the number of pumps or recharging points at each service station. According to the study conducted by ECODES [41], considering a national passenger BEV fleet of 2.9 million and forecasting the deployment of a total of 58,230 fast-charging points with a recharging power in the range of 50 to 150 kW, approximately 20,460 are located in nonmetropolitan areas and an installed capacity of around 1115 MW. The results of this study projected that the 3.9 million BEVs used in the reference scenario show an infrastructure of 78,300 charging points and 1500 MW. These numbers contrast with the results obtained in the investigation of 32,771 charging points and 2608 MW for the peak power demand. However, the results are somewhat similar in terms of magnitude, and the differences are related to BEV characteristics and the limited power of the DCFC considered in the ECODES study.
The study by ICCT [42] suggests a proportion of 250 BEVs per DCFC for nonmetropolitan areas by 2030. The investigation shows a ratio of 119 BEVs per DCFC device. The result is consistent because the ICCT study includes plug-in electric vehicles with a battery capacity significantly lower than that of a BEV. But once again, if compared with a petrol station, the average efficiency of a petrol pump is around 20 vehicles per hour, this translates into 3 min per vehicle. Nevertheless, with DC fast chargers, it is possible to obtain an average of 50 kWh in 15 min; this could be equivalent to 15 min per vehicle in the best-case scenario. Otherwise, to fulfill a demand of 20 vehicles per hour, we only need one petrol pump but five DC fast chargers. The analysis carried out in this study proposes a total of 32,771 recharging plugs with an average of 30 chargers per service station, which would translate into approximately six petrol pumps, obtaining a meaningful result.
4. Conclusions
This study aims to propose a charging infrastructure plan based on consumer behavior and the actual performance of BEVs on the Spanish market using a stochastic approach. It has been demonstrated that the use of a probabilistic model that takes into account vehicle characteristics, driver preferences, and setting appropriate station spacing could help design a charging station network for Spanish roads and the necessary upgrades to the electric grid. Although the focus of the calculations is Spain, a general applicability of the methodology is possible.
The proposed DCFC infrastructure is significantly higher than the minimum requirements pointed out by the European regulation 2023/1804, with a significant maximum power demand level compared to the total power demand on a random day in Spain and the actual renewable energy production capacity of the Spanish electric system. In addition, it evaluates the specific charging infrastructure divided by regions. With this regard, Spanish regions need to substantially increase the current number of recharging points to cover the expected traffic demand of the year 2030 and to fulfill the European regulation requirements.
However, assessing the economic feasibility of these stations and their impact on the electric grid will present challenges, particularly due to low initial usage and the criteria for the average DCFC setup required to handle peak traffic levels. This could result in substantial capital and operating expenses, as well as significant effects on the electric grid. To fix these issues, the authors have defined the service factor (SF) parameter, as the ratio between the vehicles recharging and the total of vehicles that need to recharge, and the utilization rate (UR) parameter, as the ratio of the plugs working and the total number of plugs in a charging station. The results indicate that reducing the number of chargers with a 5% loss in the recharging service can improve the return on the investment by over 16%.
The sensitivity analysis reveals a connection between the expansion of the BEV fleet and the deployment of DCFC infrastructure. The charging power, charging station density, BEV electric range, and the use of private charging infrastructure significantly impact charging demand and, to a lesser extent, the range threshold for the charging event and the time spent on vehicle charging. Therefore, irrespective of the geographical scale, the charging infrastructure development must recognize the significance of consumer preferences regarding electric range and charging habits. Moreover, policymakers are advised to prioritize offering consumers sufficient charging accessibility, concerning charging station density, while also being prepared to assess station usage and expand charging capabilities, both in terms of power rating and the number of plugs, as the BEV market expands progressively.
A key assumption of this study is that BEVs must fulfill the role of a direct replacement of combustion vehicles within the national fleet. However, in reality, it remains uncertain whether consumers will hold BEVs to this standard. For instance, if the consumer has multiple vehicles, combustion vehicles might be perceived as the more convenient option for long-distance travel. Such ownership dynamics may lead to lower charging demand than what is estimated in this analysis. Likewise, the average daily traffic data utilized to estimate the charging infrastructure in this analysis presume that road traffic flow will remain consistent until 2030. However, personal mobility could change significantly due to economic and social factors. In addition, the expanding network of charging stations also presents potential business opportunities, and implementing smart charging strategies could optimize power usage and lessen the stress on electric power infrastructure.
However, the establishment of a nationwide network of DCFC stations has additional geographic hurdles that need to be addressed: (1) the accessibility of locations suitable for DCFC stations and (2) the availability of electric power infrastructure to feed these stations.
Finally, this investigation offers strategic guidelines to both public and private entities aiming to establish charging networks for roads and highways, allowing for an efficient utilization of investments and the foreseen electric infrastructure needs.
Author Contributions
O.C.: conceptualization, methodology, software, and writing—original draft. R.Á.F.: conceptualization, methodology, and writing—review and editing. M.P.: methodology and writing—review and editing. All authors have read and agreed to the published version of the manuscript.
Funding
This research received no external funding.
Data Availability Statement
Data are contained within the article.
Conflicts of Interest
The authors declare no conflict of interest.
Nomenclature
| AADT | annual average daily traffic |
| ADT | average daily traffic |
| BEV | battery electric vehicle |
| DC | direct current |
| DCFC | direct current fast charging |
| EDS | electric distribution system |
| EV | electric vehicle |
| EVSE | electric vehicle supply equipment |
| CLT | Central Limit Theorem |
| CS | charging station |
| CP | charging plug |
| LDV | light-duty vehicle |
| MCS | Monte Carlo simulation |
| probability distribution function | |
| PSO | particle swarm optimization |
| SF | service factor |
| SRN | Spanish road network |
| SoC | battery state of charge |
| TEN-T | Trans-European Transport Network |
| TS | time slot |
| UR | utilization rate |
| V2G | vehicle-to-grid |
References
- Eurostat. Passenger Cars in the EU. Statistics Explained. 2024. Available online: https://ec.europa.eu/eurostat/statistics-explained/index.php?title=Passenger_cars_in_the_EU#Overview:_car_numbers_grow_with_a_rapid_increase_in_electric_but_a_low_share_of_overall_alternative_fuels (accessed on 29 February 2024).
- Statista. Number of Electric Vehicles in Use in Spain between 2017 and 2022. Vehicles Road Traffic. 2024. Available online: www.aging-us.com (accessed on 29 February 2024).
- Boletin Oficial de las Cortes Generales. Proposición de Ley Sobre Cambio Climático y Transicion Energetica. In Proceedings of the Congreso de los Diputados XIII Legislatura, Madrid, Spain, 16 July 2019. [Google Scholar]
- Lohse-Busch, H.; Duoba, M.; Rask, E.; Stutenberg, K.; Gowri, V.; Slezak, L.; Anderson, D. Ambient temperature (20°F, 72°F and 95°F) impact on fuel and energy consumption for several conventional vehicles, hybrid and plug-in hybrid electric vehicles and battery electric vehicle. SAE Tech. Pap. 2013. [Google Scholar] [CrossRef]
- Neubauer, J.S.; Wood, E. Accounting for the variation of driver aggression in the simulation of conventional and advanced vehicles. SAE Tech. Pap. 2013. [Google Scholar] [CrossRef]
- Alvarez, R.; López, A.; De La Torre, N. Evaluating the effect of a driver’s behaviour on the range of a battery electric vehicle. Proc. Inst. Mech. Eng. Pt. D J. Automobile Eng. 2015, 229, 1379–1391. [Google Scholar] [CrossRef]
- Neubauer, J.S.; Wood, E. Will Your Battery Survive a World with Fast Chargers? SAE Tech. Pap. 2015. [Google Scholar] [CrossRef]
- Donati, A.V.; Panagiota, D.; Thiel, C.; Spadaro, A.; Gkatzoflias, D.; Drossinos, Y. Individual Mobility: From Conventional to Electric Cars; European Commission, JRC, Institute for Energy and Transport: Ispra, Italy, 2015. [Google Scholar] [CrossRef]
- Dixon, J.; Andersen, P.B.; Bell, K.; Træholt, C. On the ease of being green: An investigation of the inconvenience of electric vehicle charging. Appl. Energy 2020, 258, 114090. [Google Scholar] [CrossRef]
- Junquera, B.; Moreno, B.; Álvarez, R. Analyzing consumer attitudes towards electric vehicle purchasing intentions in Spain: Technological limitations and vehicle confidence. Technol. Forecast. Soc. Chang. 2016, 109, 6–14. [Google Scholar] [CrossRef]
- Harrison, G.; Thiel, C. An exploratory policy analysis of electric vehicle sales competition and sensitivity to infrastructure in Europe. Technol. Forecast. Soc. Chang. 2017, 114, 165–178. [Google Scholar] [CrossRef]
- Lei, X.; Yu, H.; Shao, Z.; Jian, L. Optimal bidding and coordinating strategy for maximal marginal revenue due to V2G operation: Distribution system operator as a key player in China’s uncertain electricity markets. Energy 2023, 283, 128354. [Google Scholar] [CrossRef]
- Lei, X.; Yu, H.; Yu, B.; Shao, Z.; Jian, L. Bridging electricity market and carbon emission market through electric vehicles: Optimal bidding strategy for distribution system operators to explore economic feasibility in China’s low-carbon transitions. Sustain. Cities Soc. 2023, 94, 104557. [Google Scholar] [CrossRef]
- European Parliament. Regulation (EU) 2023/1804 of the European Parliament and of the Council of 13 September 2023 on the Deployment of Alternative Fuels Infrastructure, and Repealing Directive 2014/94/EU; Official Journal of the European Union: Strasbourg, France, 2023. [Google Scholar]
- Green, R.C.; Wang, L.; Alam, M. The impact of plug-in hybrid electric vehicles on distribution networks: A review and outlook. Renew. Sustain. Energy Rev. 2011, 15, 544–553. [Google Scholar] [CrossRef]
- EAFO. Electric Recharging Points in Spain. European Alternative Fuels Observatory. 2024. Available online: https://alternative-fuels-observatory.ec.europa.eu/transport-mode/road/spain/infrastructure (accessed on 1 March 2024).
- ECODES. Charging Points for Electric Mobility in Spain; ECODES: Zaragoza, Spain, 2022. [Google Scholar] [CrossRef]
- Muratori, M. Impact of uncoordinated plug-in electric vehicle charging on residential power demand. Nat. Energy 2018, 3, 193–201. [Google Scholar] [CrossRef]
- Dixon, J.; Bell, K. Electric vehicles: Battery capacity, charger power, access to charging and the impacts on distribution networks. ETransportation 2020, 4, 100059. [Google Scholar] [CrossRef]
- Bayram, I.S.; Galloway, S.; Burt, G. A probabilistic capacity planning methodology for plug-in electric vehicle charging lots with on-site energy storage systems. J. Energy Storage 2020, 32, 101730. [Google Scholar] [CrossRef]
- Zheng, Y.; Shao, Z.; Shang, Y.; Jian, L. Modeling the temporal and economic feasibility of electric vehicles providing vehicle-to-grid services in the electricity market under different charging scenarios. J. Energy Storage 2023, 68, 107579. [Google Scholar] [CrossRef]
- Zheng, Y.; Shao, Z.; Zhang, Y.; Jian, L. A systematic methodology for mid-and-long term electric vehicle charging load forecasting: The case study of Shenzhen, China. Sustain. Cities Soc. 2020, 56, 102084. [Google Scholar] [CrossRef]
- Su, J.; Lie, T.T.; Zamora, R. Modelling of large-scale electric vehicles charging demand: A New Zealand case study. Electr. Power Syst. Res. 2019, 167, 171–182. [Google Scholar] [CrossRef]
- Mitrakoudis, S.G.; Alexiadis, M.C. Modelling Electric Vehicle Charge Demand: Implementation for the Greek Power System. World Electr. Veh. J. 2022, 13, 115. [Google Scholar] [CrossRef]
- Zero Emission Resource Organisation. Taking Charge-Introducing Fast Chargers in Nor; Zero Emission Resource Organisation: Oslo, Norway, 2012. [Google Scholar]
- Wood, E.; Rames, C.; Muratori, M.; Raghavan, S.; Melaina, M. National Plug-In Electric Vehicle Infrastructure Analysis; National Renewable Energy Lab (NREL): Washington, DC, USA, 2017. [CrossRef]
- Cao, W.; Wan, Y.; Wang, L.; Wu, Y. Location and capacity determination of charging station based on electric vehicle charging behavior analysis. IEEJ Trans. Electr. Electron. Eng. 2021, 16, 827–834. [Google Scholar] [CrossRef]
- Tal, G.; Raghavan, S.; Karanam, V.; Favetti, M.; Sutton, K.; Lee, J.H.; Nitta, C.; Kurani, K.; Chakraborty, D.; Nicholas, M.; et al. Advanced Plug-in Electric Vehicle Travel and Charging Behavior Final Report. CalEPA ARB Contract 12-319 2020. Available online: https://web.cs.ucdavis.edu/~cjnitta/pubs/2020_03.pdf (accessed on 23 September 2024).
- Alexander, M.; Lee, D.-Y. California Electric Vehicle Infrastructure for Long-Distance Travel Direct Current Fast Charging Needs to Enable Interregional Long-Distance Travel for Electric Vehicles; California Energy Commission: Sacramento, CA, USA, 2023.
- Lee, D.; Bopp, K.; Moniot, M.; Kandt, A. Fast Charging Infrastructure for Electrifying Road Trips to and from National Parks in the Western United States Fast Charging Infrastructure for Electrifying Road Trips to and from National Parks in the Western United States; National Renewable Energy Laboratory (NREL): Denver, CO, USA, 2023.
- Zhou, Z.; Lin, T. Spatial and temporal model for electric vehicle rapid charging demand. IEEE Trans. Smart Grid 2012, 3, 394–403. [Google Scholar]
- Wu, Y.; Lu, Y.; Zhu, Z.; Holguín-Veras, J. Optimizing Electric Vehicle Charging Infrastructure on Highways: A Multi-Agent-Based Planning Approach. Sustainability 2023, 15, 13634. [Google Scholar] [CrossRef]
- Moses Babu, K.V.S.; Chakraborty, P.; Pal, M. Planning of fast charging infrastructure for electric vehicles in a distribution system and prediction of dynamic price. Int. J. Electr. Power Energy Syst. 2024, 155, 109502. [Google Scholar] [CrossRef]
- Silber, F.; Scheubner, S.; Märtz, A. Analysis of the simultaneity factor of fast-charging sites using Monte-Carlo simulation. Int. J. Electr. Power Energy Syst. 2024, 155, 109540. [Google Scholar] [CrossRef]
- Zhang, H.; Moura, S.J.; Hu, Z.; Song, Y. PEV Fast-Charging Station Siting and Sizing on Coupled Transportation and Power Networks. IEEE Trans. Smart Grid 2018, 9, 2595–2605. [Google Scholar] [CrossRef]
- Wang, X.; Shahidehpour, M.; Jiang, C.; Li, Z. Coordinated Planning Strategy for Electric Vehicle Charging Stations and Coupled Traffic-Electric Networks. IEEE Trans. Power Syst. 2019, 34, 268–279. [Google Scholar] [CrossRef]
- Gkatzoflias, D.; Drossinos, Y.; Zubaryeva, A.; Zambelli, P.; Dilara, P.; Thiel, C. Optimal Allocation of Electric Vehicle Charging Infrastructure in Cities and Regions; European Commission, JRC, Institute for Energy and Transport: Ispra, Italy, 2016. [Google Scholar] [CrossRef]
- Jeon, Y.E.; Kang, S.B.; Seo, J.I. Hybrid Predictive Modeling for Charging Demand Prediction of Electric Vehicles. Sustainability 2022, 14, 5426. [Google Scholar] [CrossRef]
- Kongjeen, Y.; Junlakan, W.; Bhumkittipich, K.; Mithulananthan, N. Estimation of the quick charging station for electric vehicles based on location and population density data. Int. J. Intell. Eng. Syst. 2018, 11, 233–241. [Google Scholar] [CrossRef]
- Colmenar-Santos, A.; de Palacio, C.; Borge-Diez, D.; Monzón-Alejandro, O. Planning minimum interurban fast charging infrastructure for electric vehicles: Methodology and application to Spain. Energies 2014, 7, 1207–1229. [Google Scholar] [CrossRef]
- Ruíz Barrientos, F.M.; Gámiz Martínez, E.; Aspiazu Pérez, I.; Román Calvo, C.; Sallent Bayo, H. Estudio Sobre el Despliegue de la Infraestructura de Carga del Vehículo Eléctrico en España; ECODES: Zaragoza, Spain, 2021. [Google Scholar]
- Nicholas, M.; Wappelhorst, S. Spain’s Electric Vehicle Infrastructure Challenge: How Many Chargers Will be Required in 2030? ICCT: Berlin, Germany, 2021. [Google Scholar]
- Fernández, R.A. Stochastic analysis of future scenarios for battery electric vehicle deployment and the upgrade of the electricity generation system in Spain. J. Clean Prod. 2021, 316, 128101. [Google Scholar] [CrossRef]
- Hajiabadi, M.E.; Ghanbari, H.; Samadi, M. Comprehensive Review of Literature on the Statistical Behaviors of Electric Vehicle Aggregators (EVAs): Modelling the Pdf of Power Production of EVA Using Classic CLT. In Proceedings of the 2019 24th Electrical Power Distribution Conference (EPDC), Khorramabad, Iran, 19–20 June 2019; pp. 72–79. [Google Scholar] [CrossRef]
- Unterluggauer, T.; Rich, J.; Andersen, P.B.; Hashemi, S. Electric vehicle charging infrastructure planning for integrated transportation and power distribution networks: A review. ETransportation 2022, 12, 100163. [Google Scholar] [CrossRef]
- Metais, M.O.; Jouini, O.; Perez, Y.; Berrada, J.; Suomalainen, E. Too much or not enough? Planning electric vehicle charging infrastructure: A review of modeling options. Renew. Sustain. Energy Rev. 2022, 153, 111719. [Google Scholar] [CrossRef]
- Ministerio de Transportes y Movilidad Sostenible. Catálogo de la RCE. Catálogo y Evol La Red Carreteras 2021. Available online: https://www.transportes.gob.es/carreteras/catalogo-y-evolucion-de-la-red-de-carreteras (accessed on 6 March 2024).
- Federal Highway Administration. Traffic Monitoring Guide. Office of Highway Policy Information 2024. Available online: https://www.fhwa.dot.gov/policyinformation/tmguide/tmg_2013/traffic-monitoring-methodologies.cfm (accessed on 6 March 2024).
- Dirección General de Carreteras. Tráfico en las Estaciones de Aforo de la RCE; Ministerio de Transportes, Movilidad y Agenda Urbana: Madrid, Spain, 2022.
- Bellocchi, S.; Manno, M. Analysis of the Impact of Electric Vehicle Penetration on Italian Electric Supply System. In Proceedings of the 12th Conference on Sustainable Development of Energy, Water and Environment Systems (SDEWES 2017), Dubrovnik, Croatia, 4–8 October 2017; Volume 508119, pp. 1–33. [Google Scholar]
- Bush, B.W.; Muratori, M.; Hunter, C.; Zuboy, J.; Melaina, M.W. Scenario Evaluation and Regionalization Analysis (SERA) Model: Demand Side and Refueling Infrastructure Buildout; National Renewable Energy Lab (NREL): Golden, CO, USA, 2019.
- Dirección General de Tráfico. DGT Cifras. DGT En Cifras 2022. Available online: https://www.dgt.es/menusecundario/dgt-en-cifras/ (accessed on 20 April 2024).
- Ministerio para la Transición Ecológica y el Reto Demográfico. Plan Nacional Integrado de Energía y Clima (PNIEC) 2021–2030; MITECO: Madrid, Spain, 2020.
- INEbase. Censos de Población y Viviendas. Instituto Nacional de Estadística 2024. Available online: https://www.ine.es/dynt3/inebase/index.htm?type=pcaxis&path=/t20/e244/edificios/p03/&file=pcaxis&L=0 (accessed on 22 April 2024).
- Asociación Española de Fabricantes de Automóviles y Camiones. Informe Anual 2022; ANFAC: Madrid, Spain, 2022. [Google Scholar]
- Weiss, M.; Cloos, K.C.; Helmers, E. Energy efficiency trade-offs in small to large electric vehicles. Environ. Sci. Eur. 2020, 32, 46. [Google Scholar] [CrossRef]
- Ministerio para la Transformación Digital y de la Función Pública. Precio de Carburantes en las Gasolineras Españolas 2024. Available online: https://datos.gob.es/es/catalogo/e05068001-precio-de-carburantes-en-las-gasolineras-espanolas (accessed on 23 July 2024).
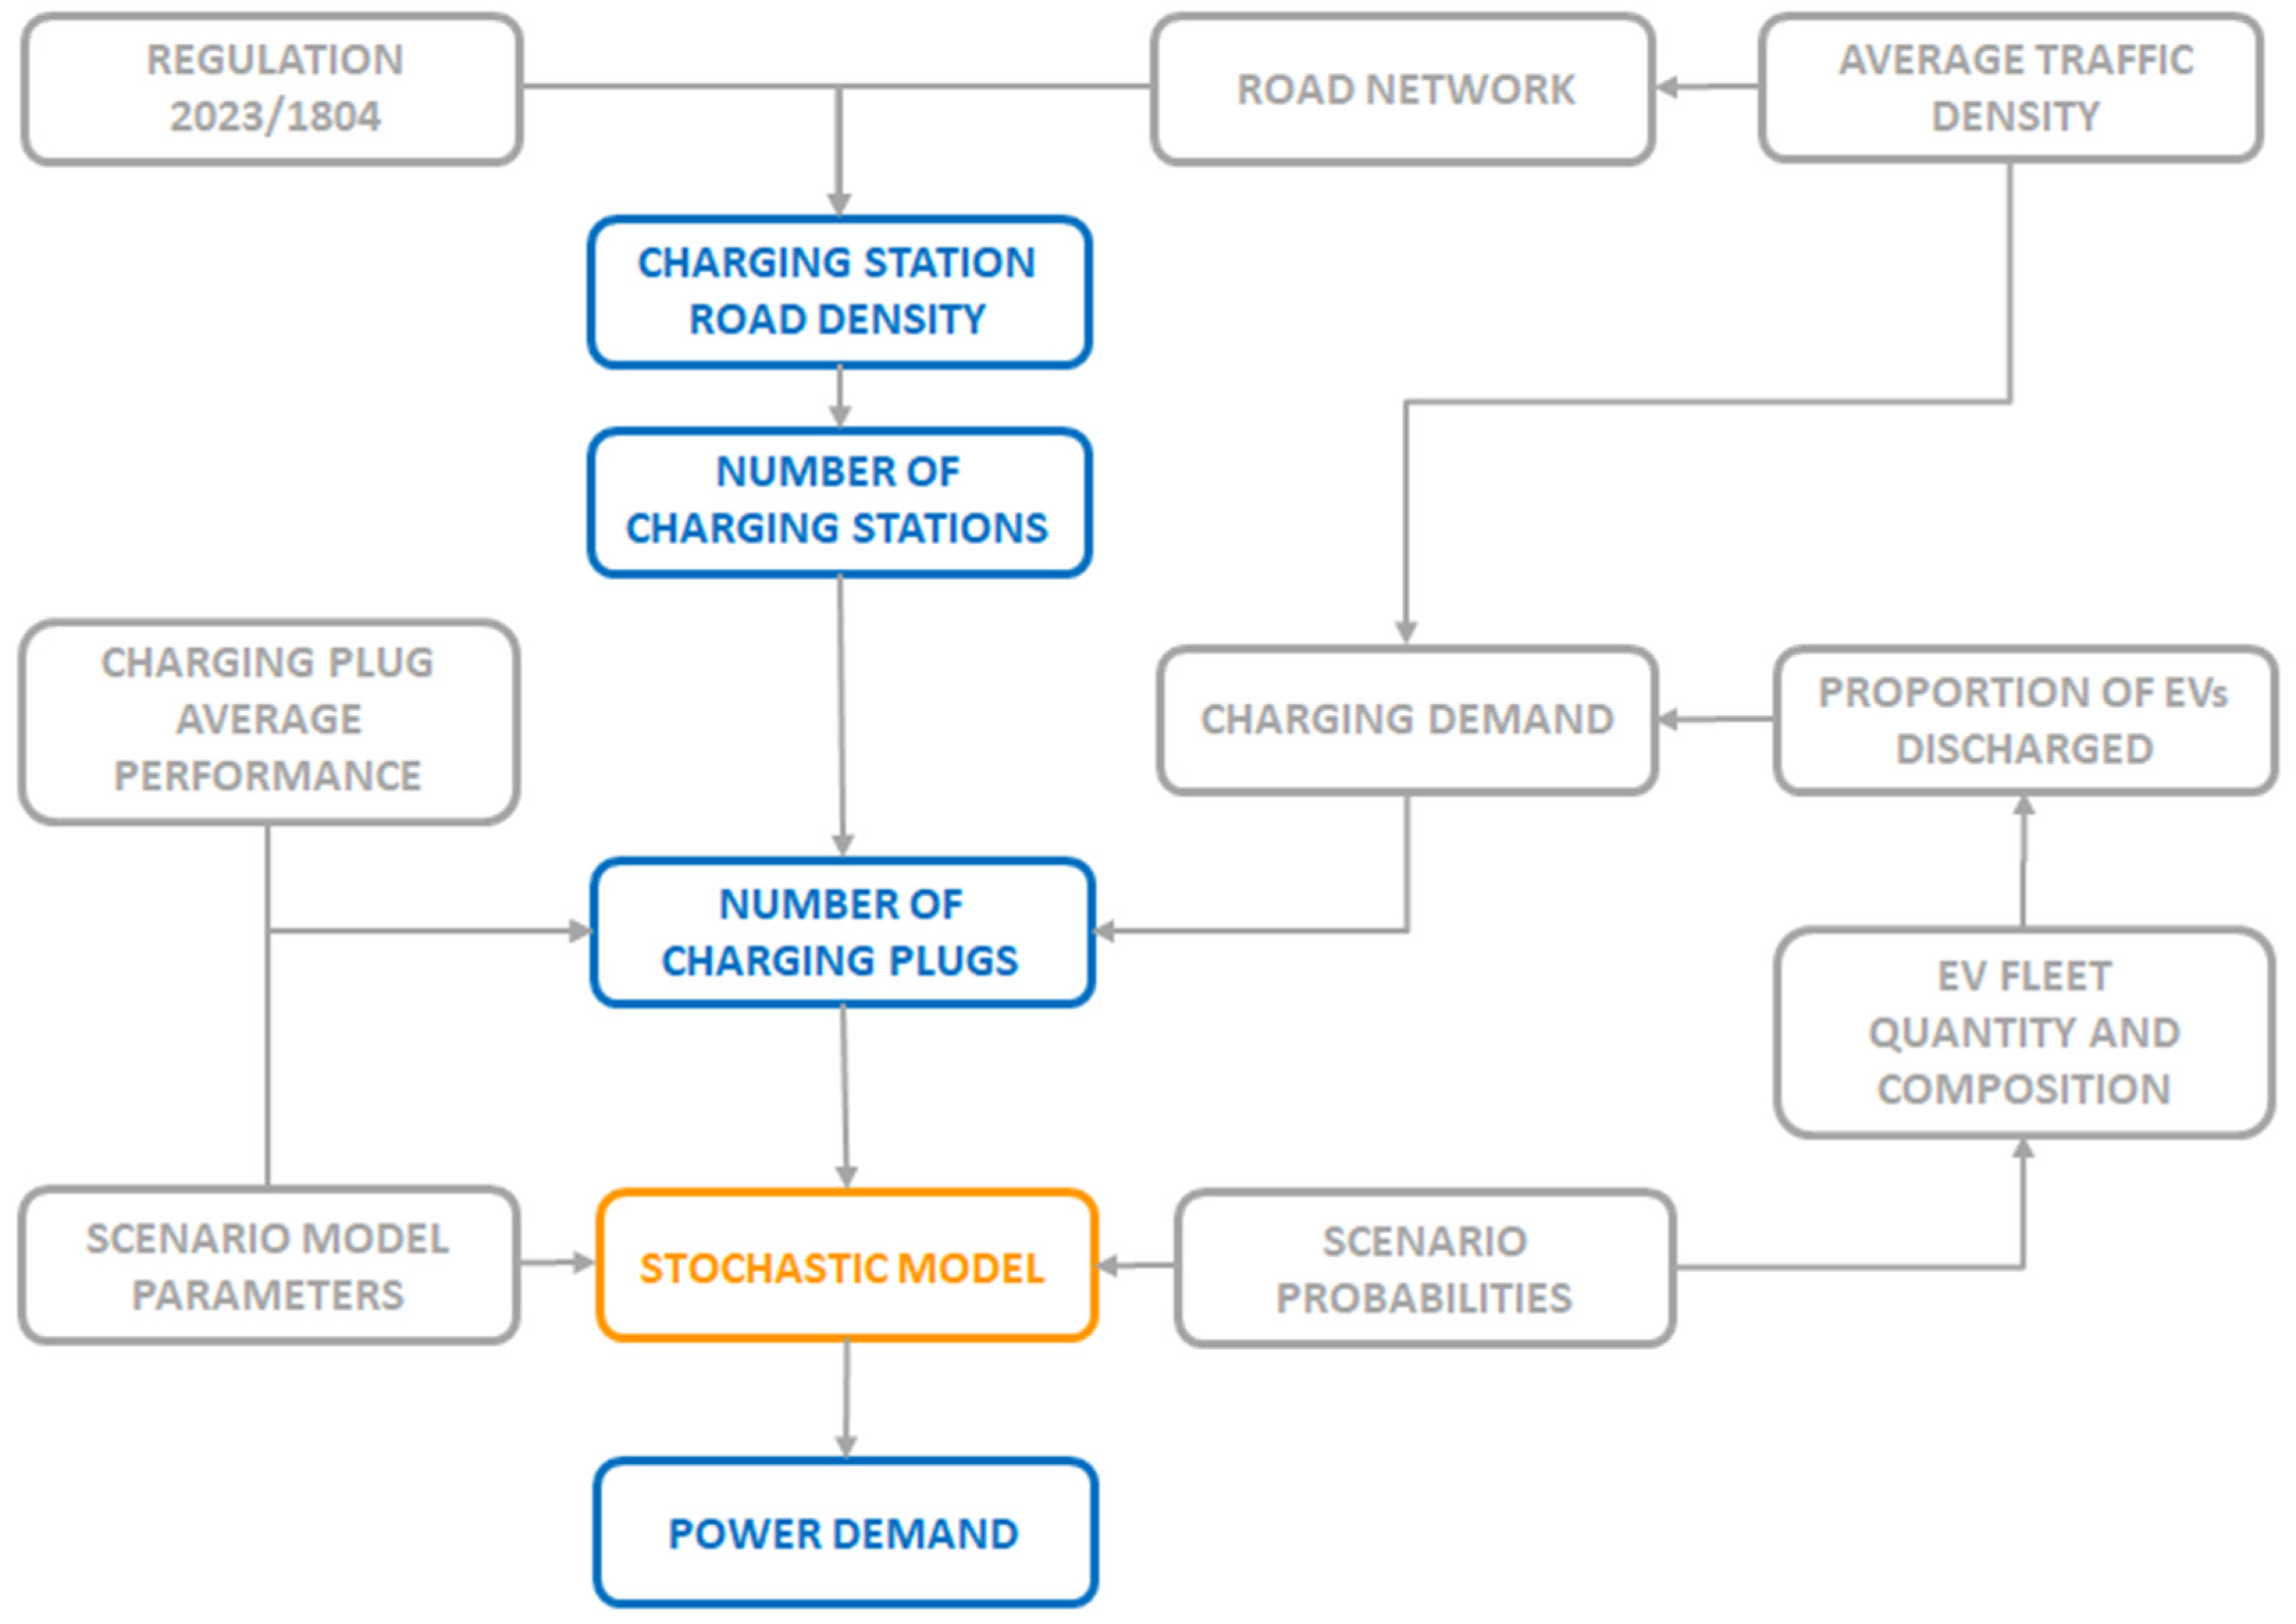
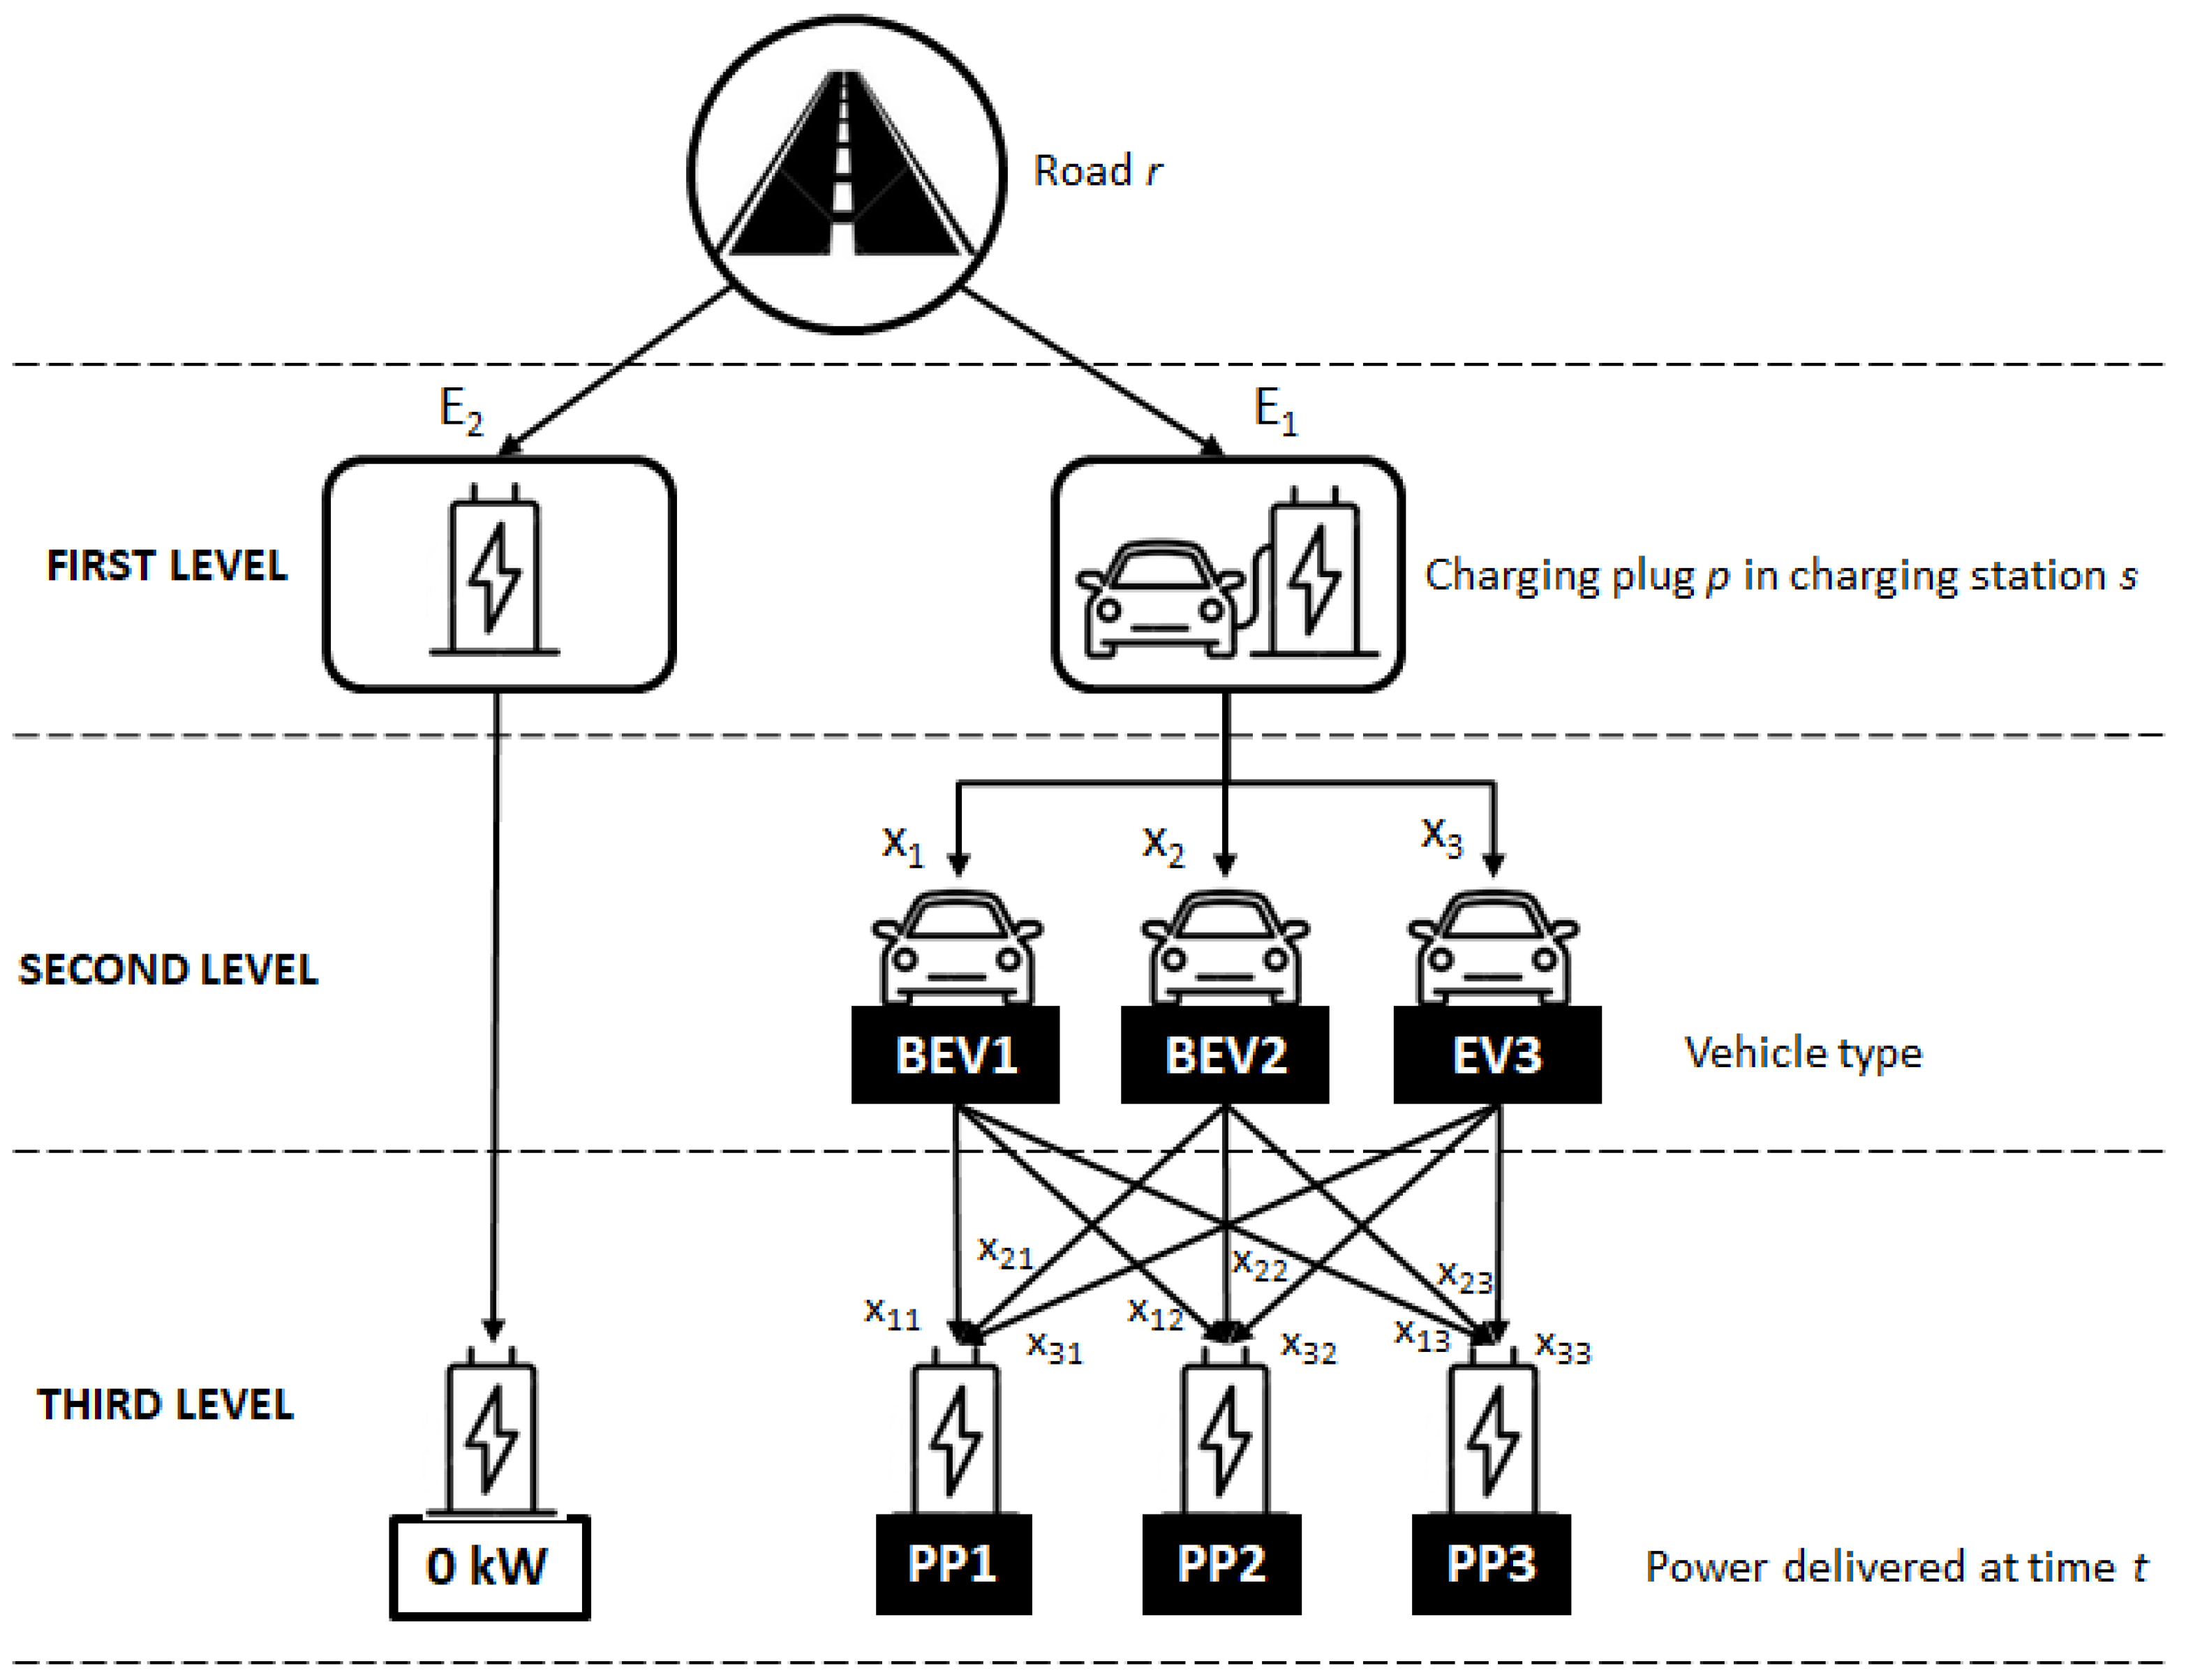
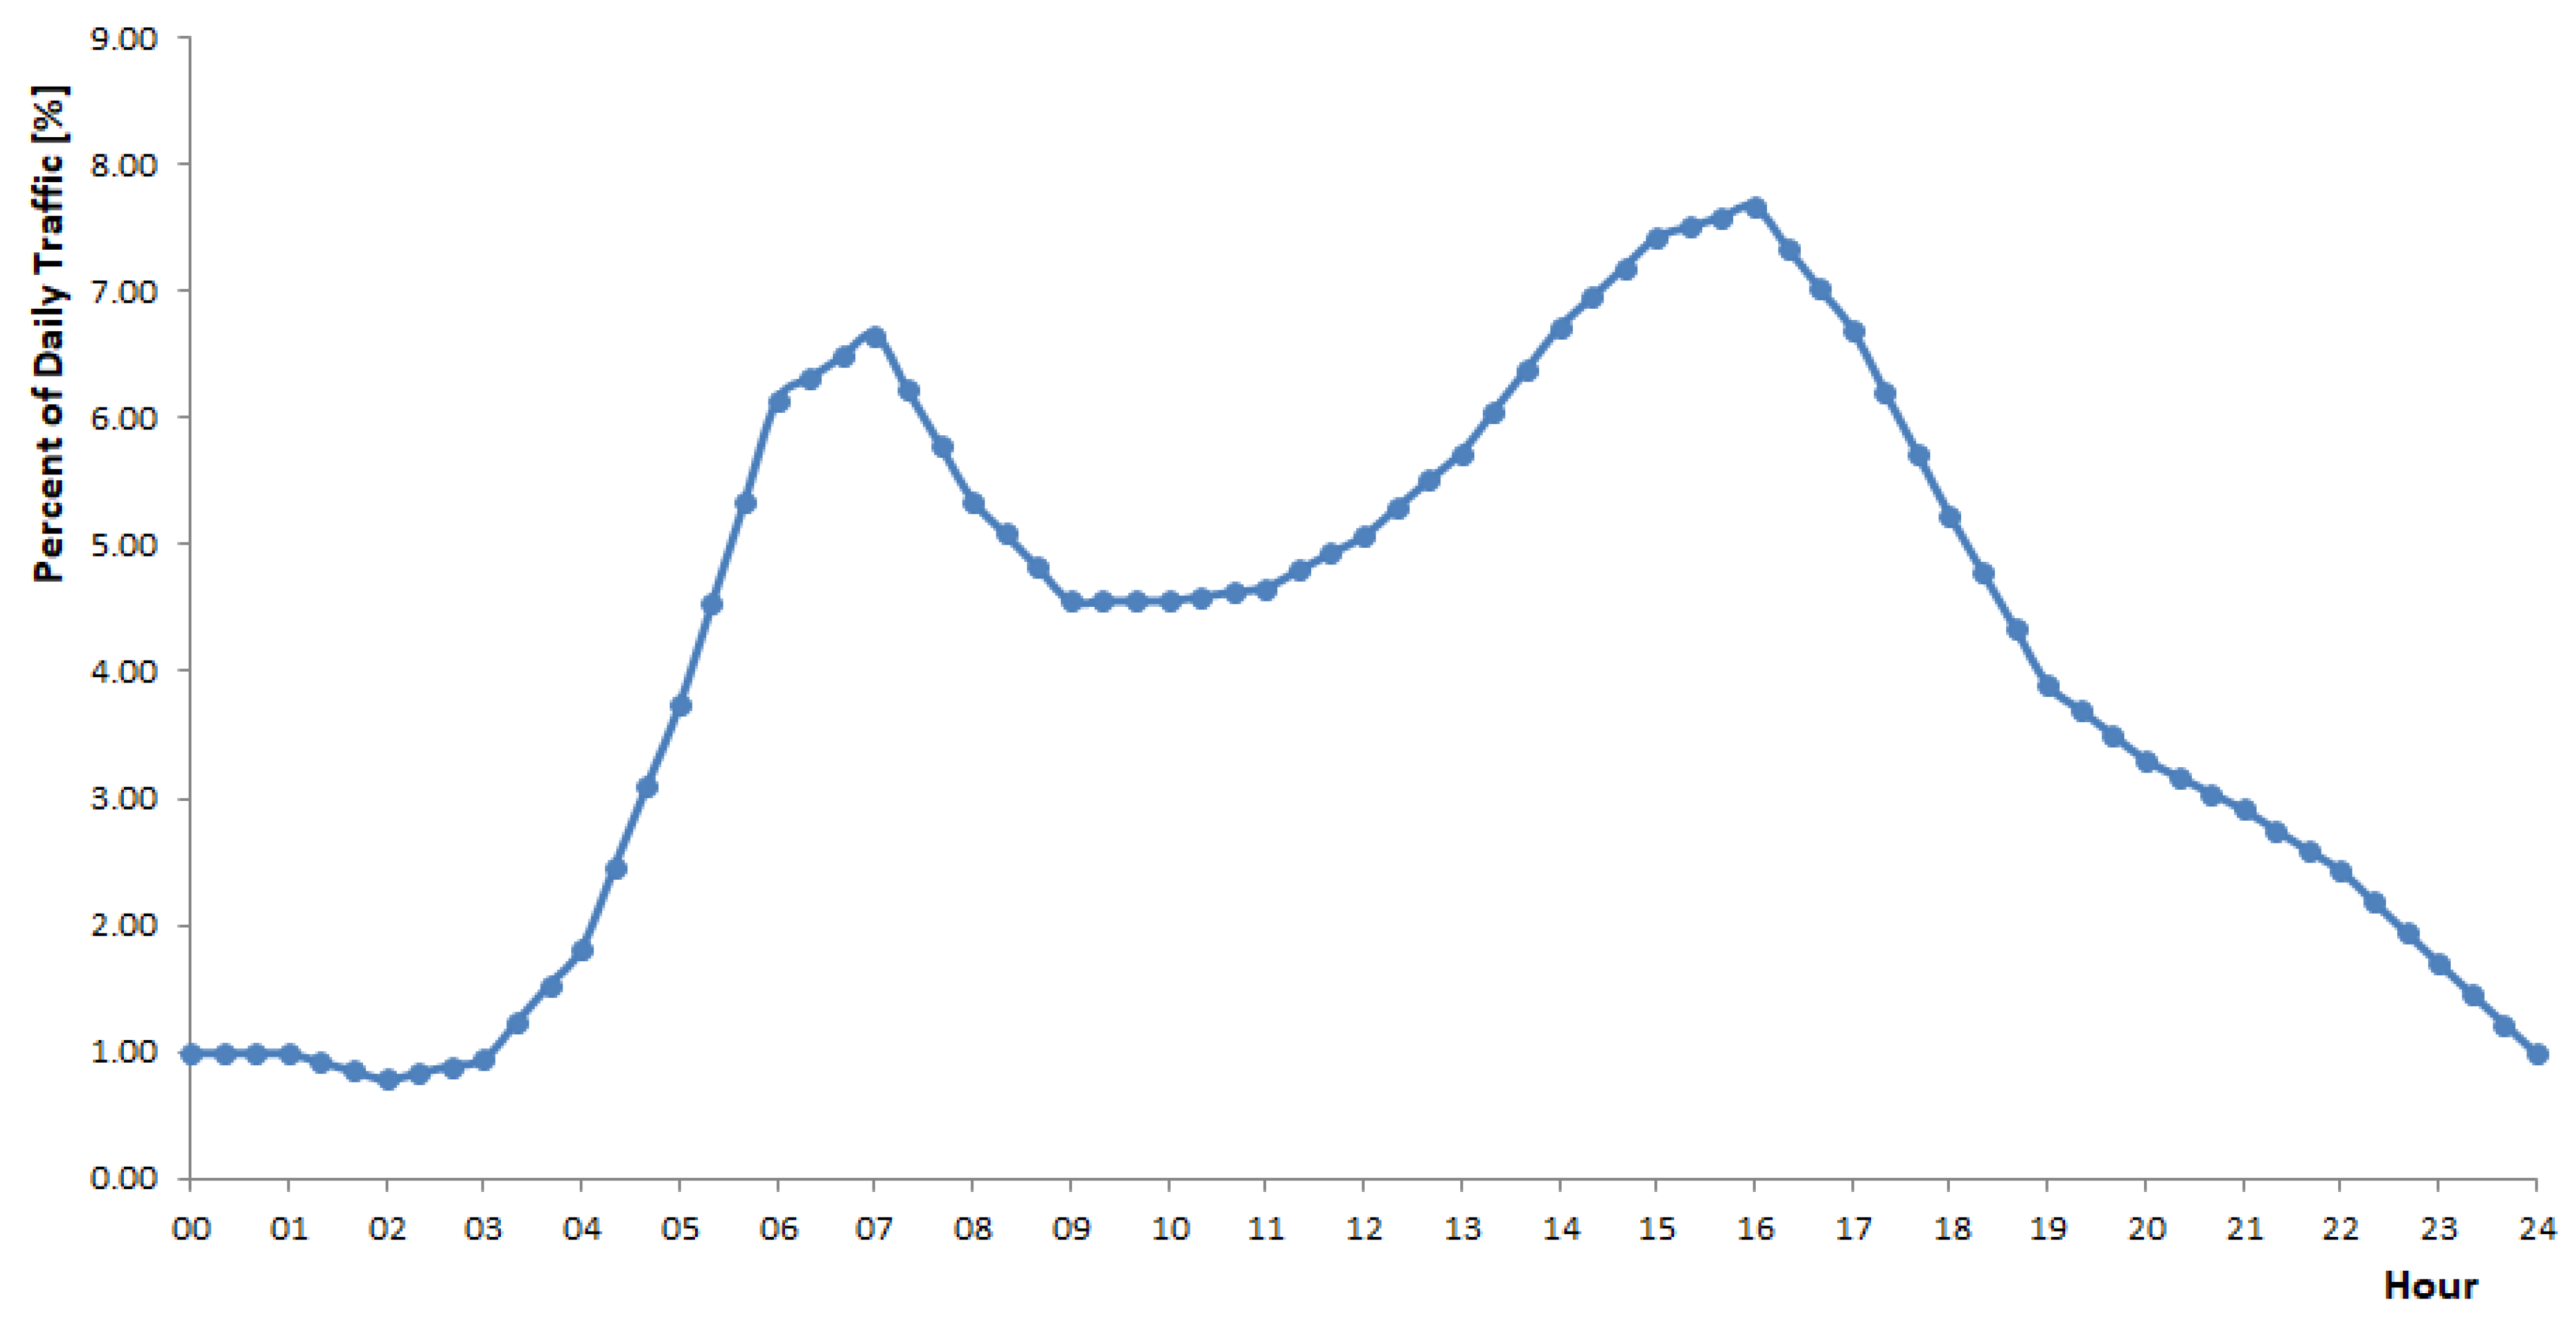
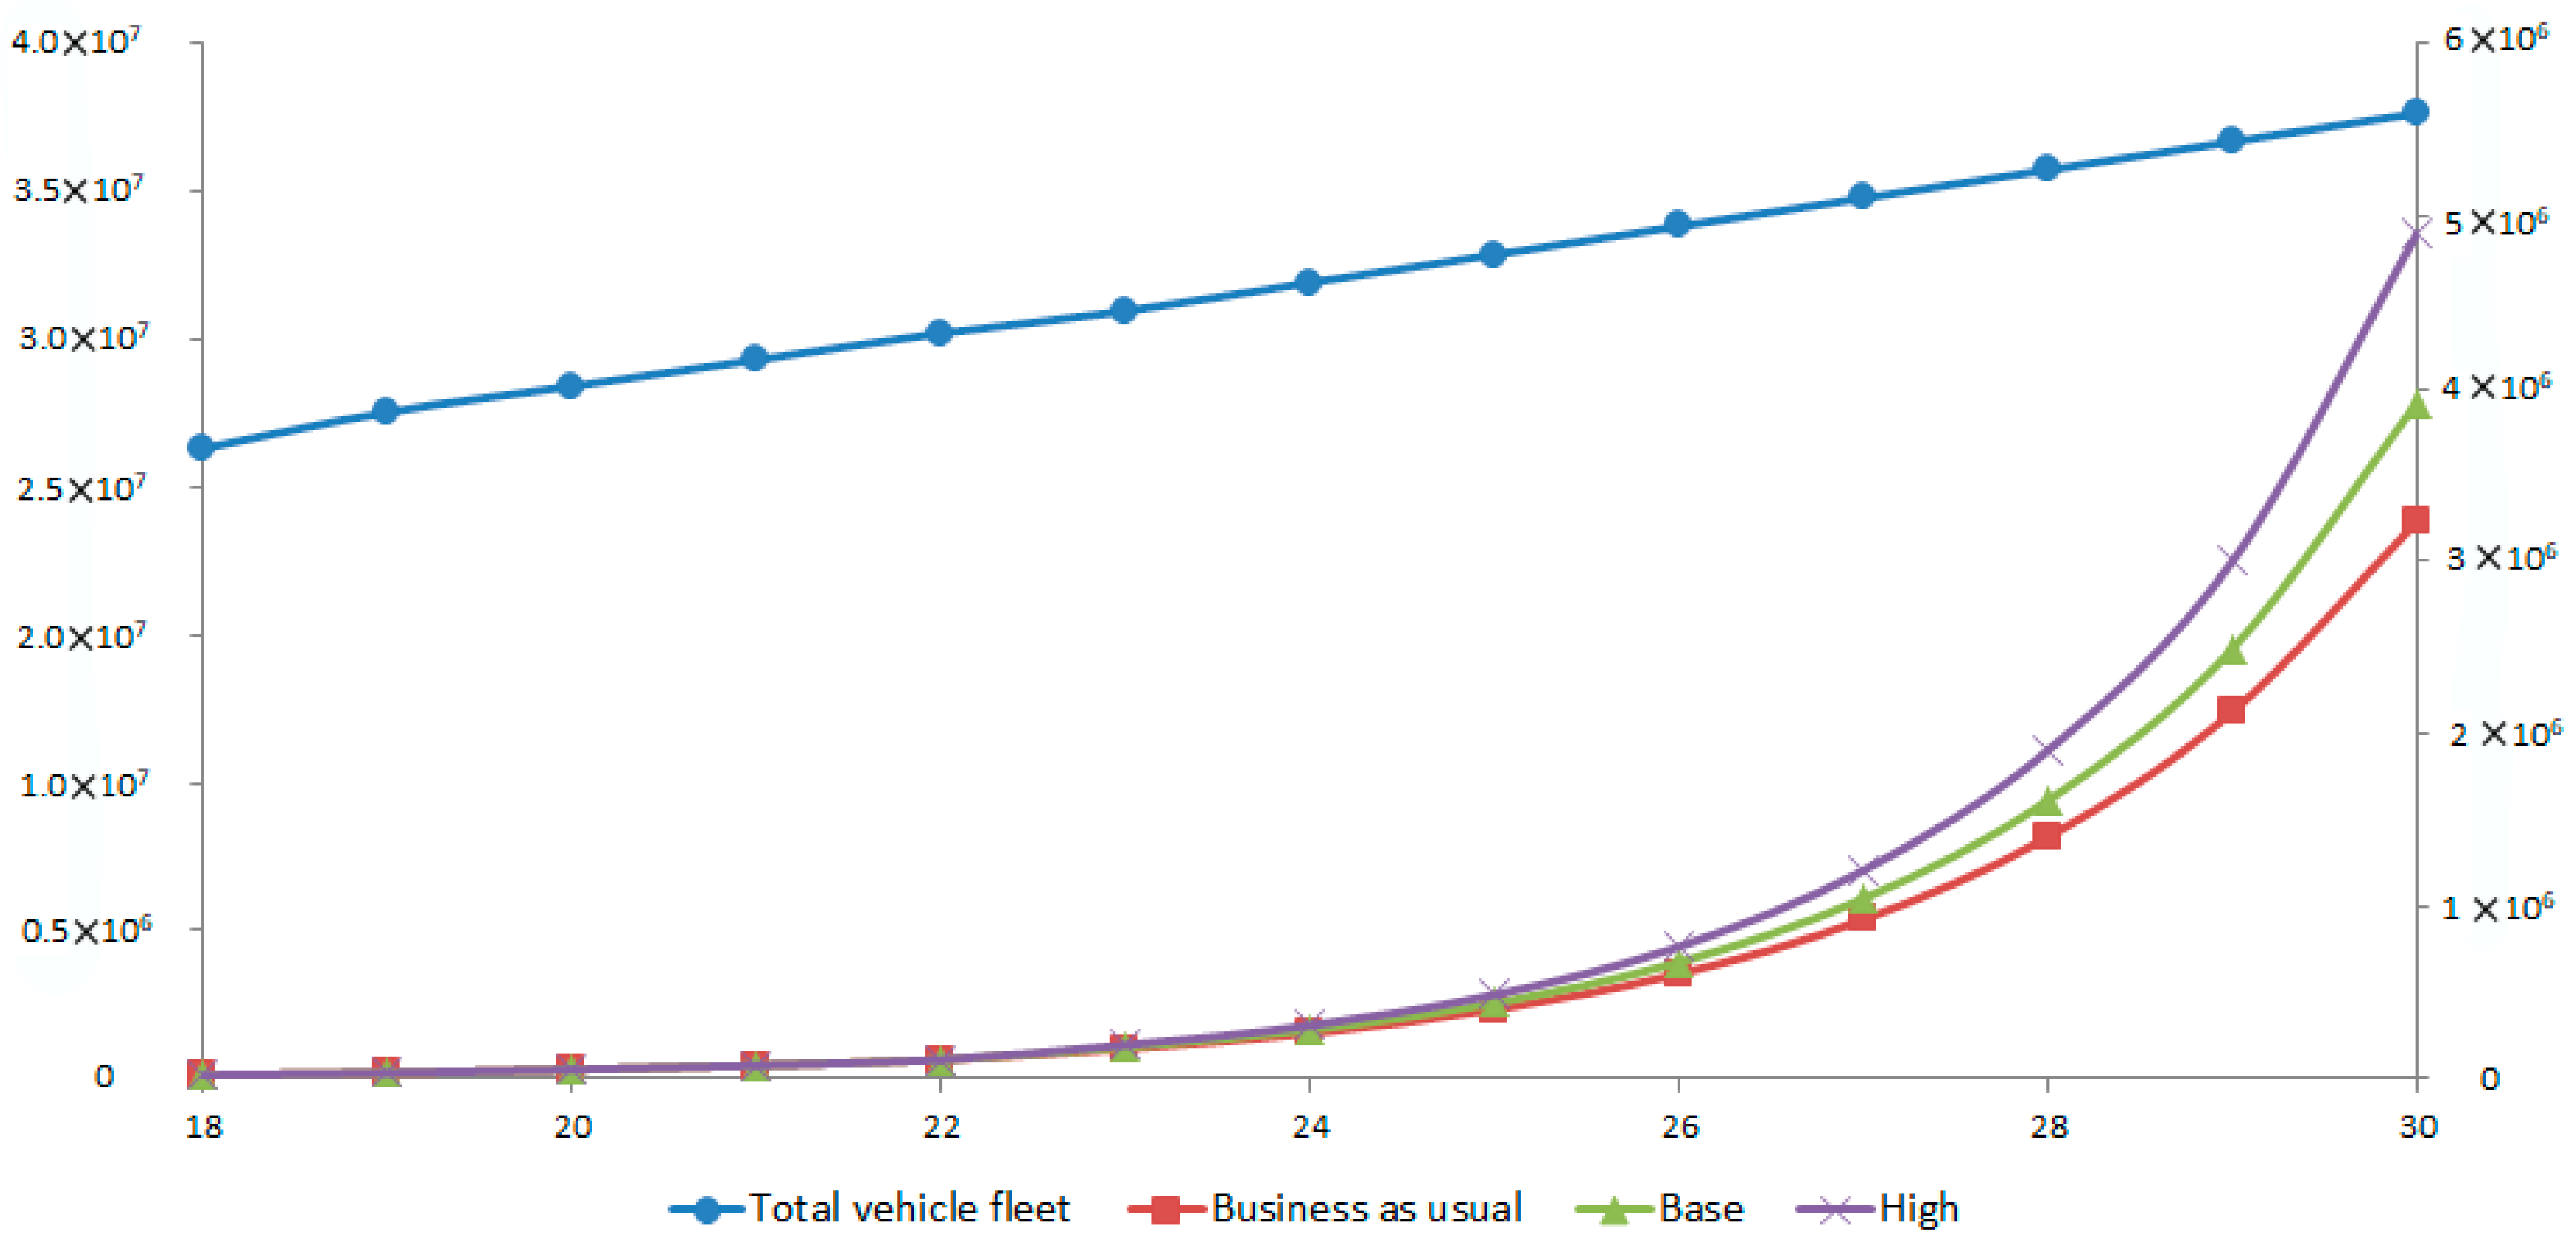


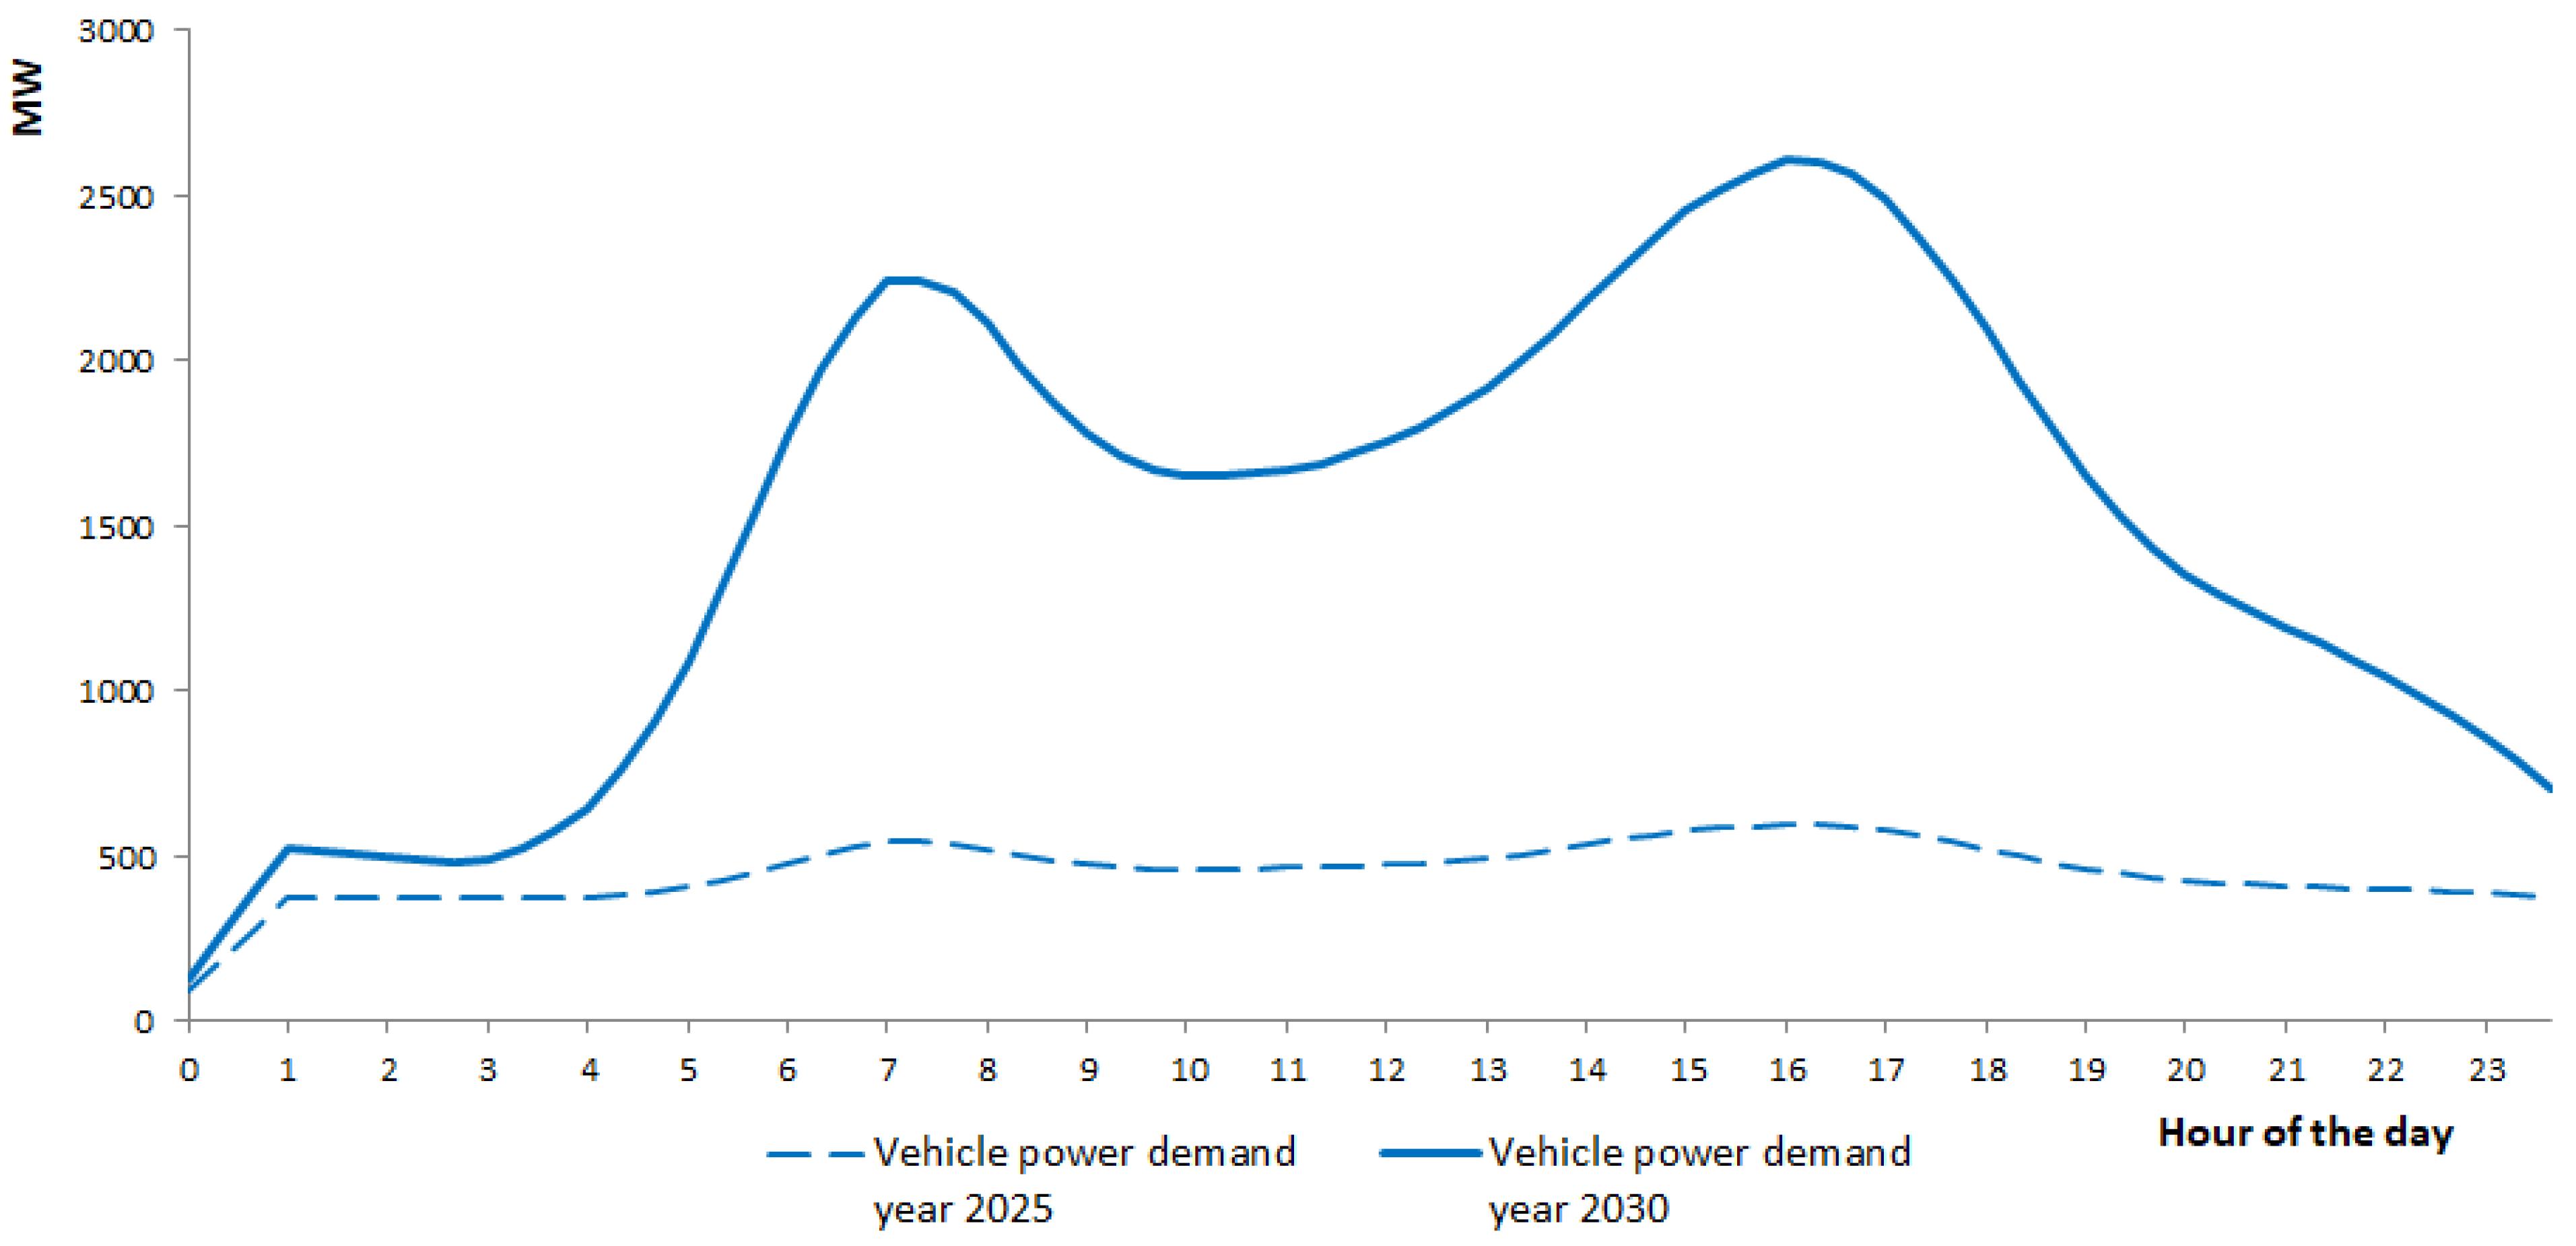

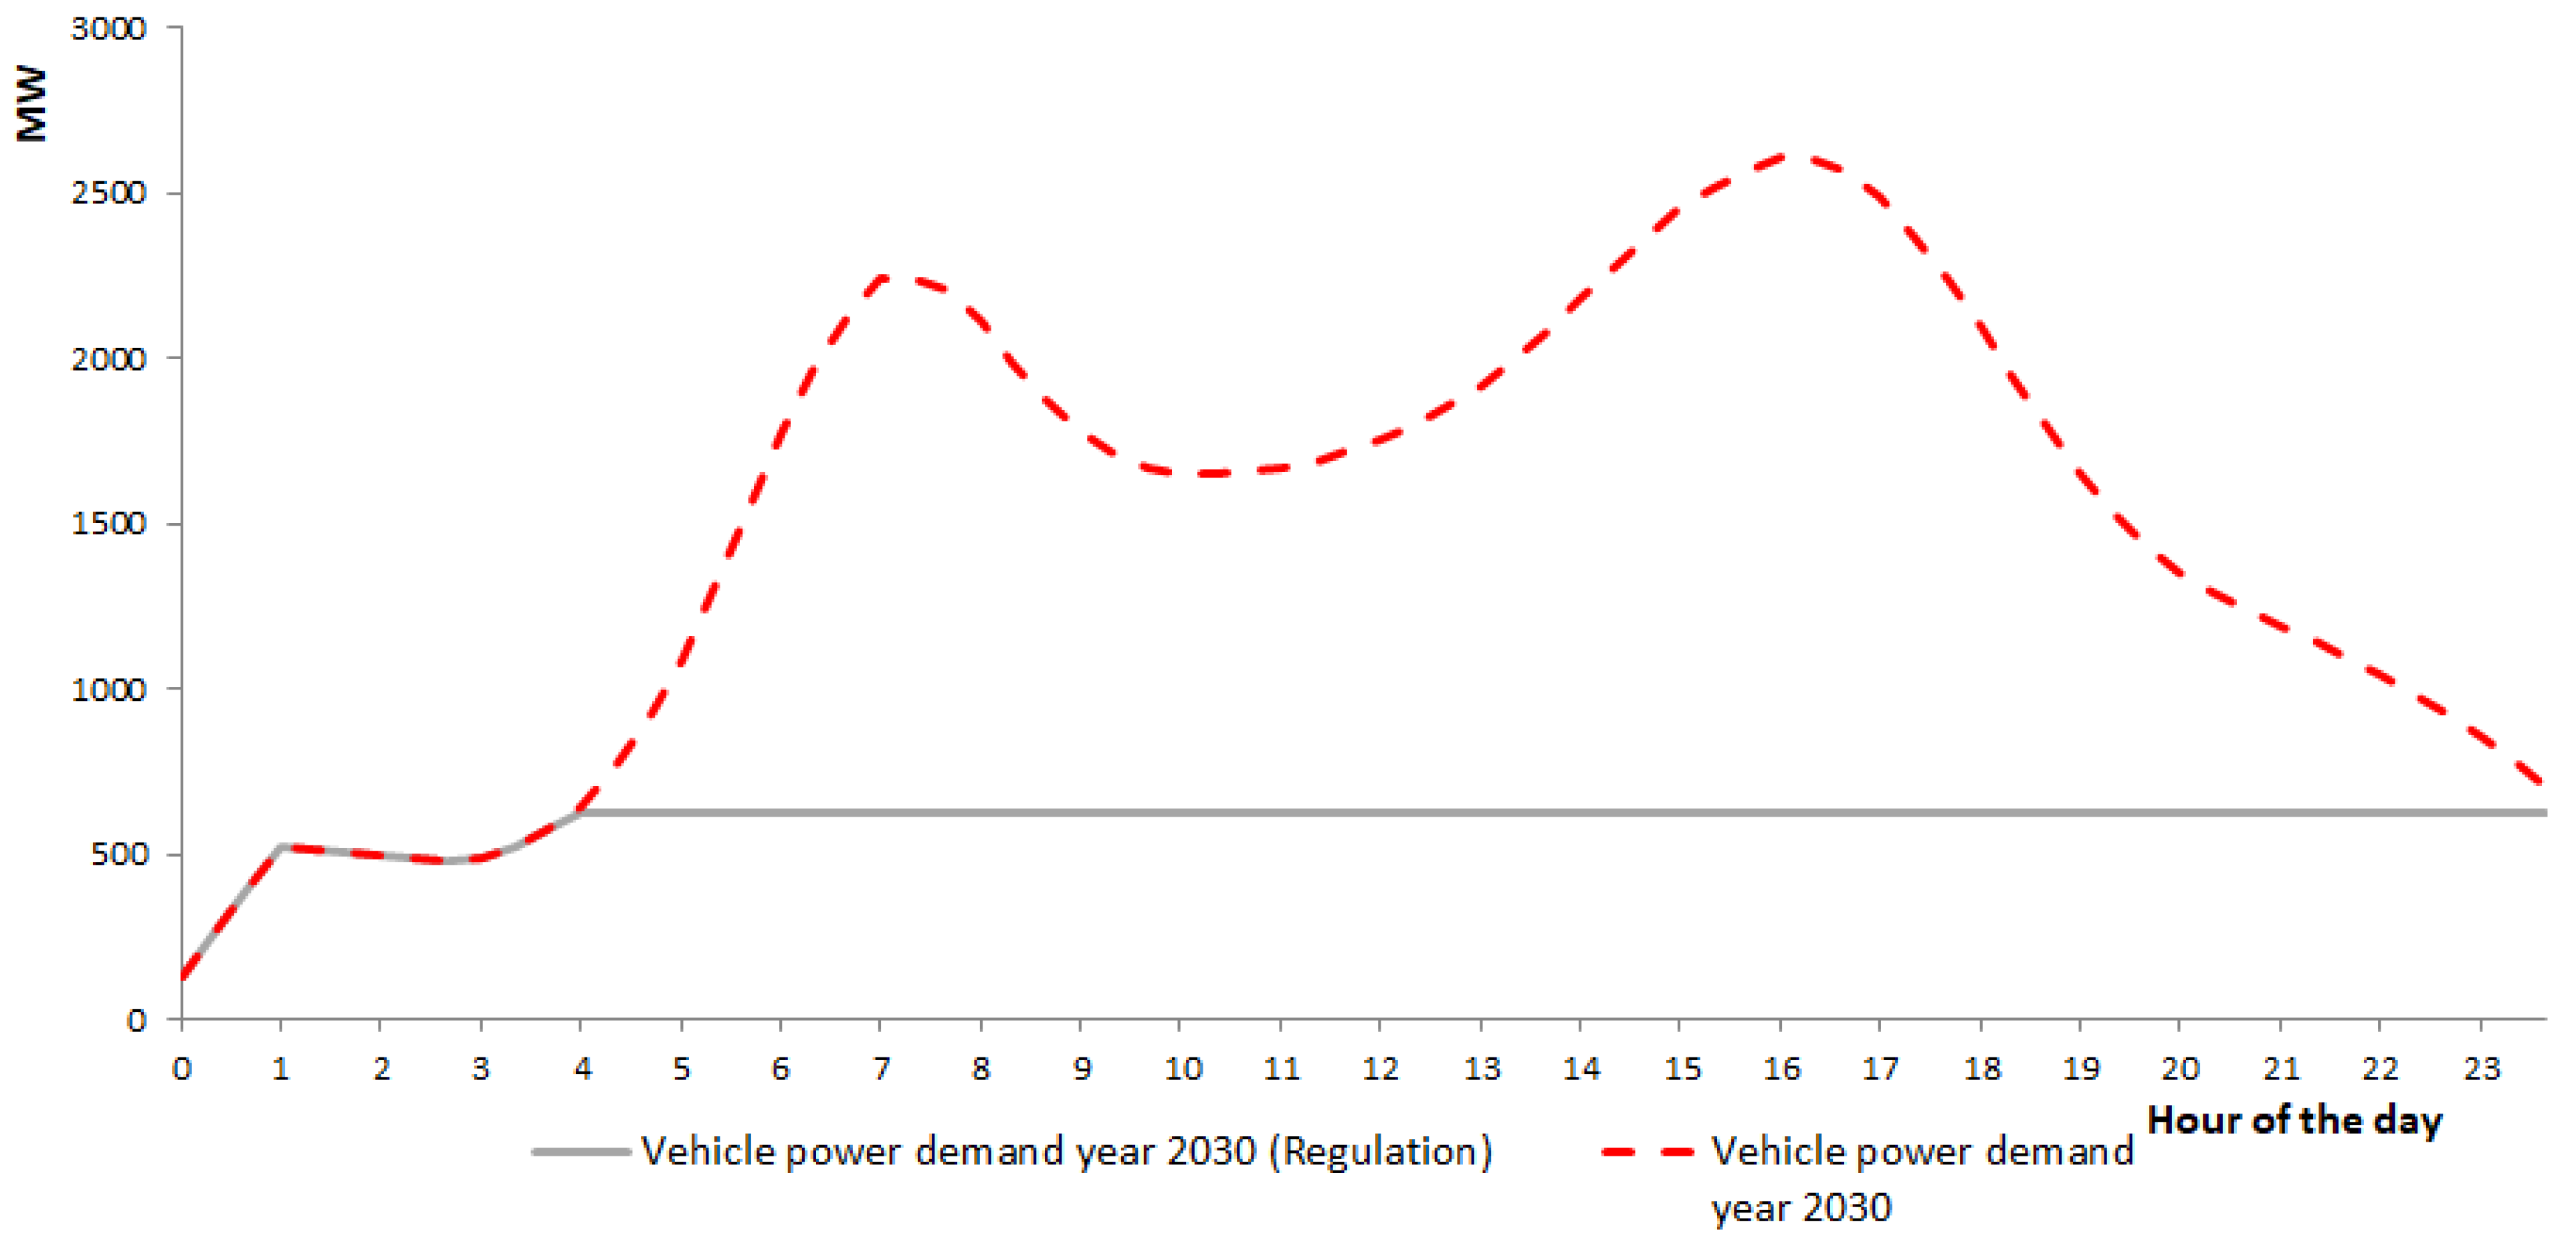
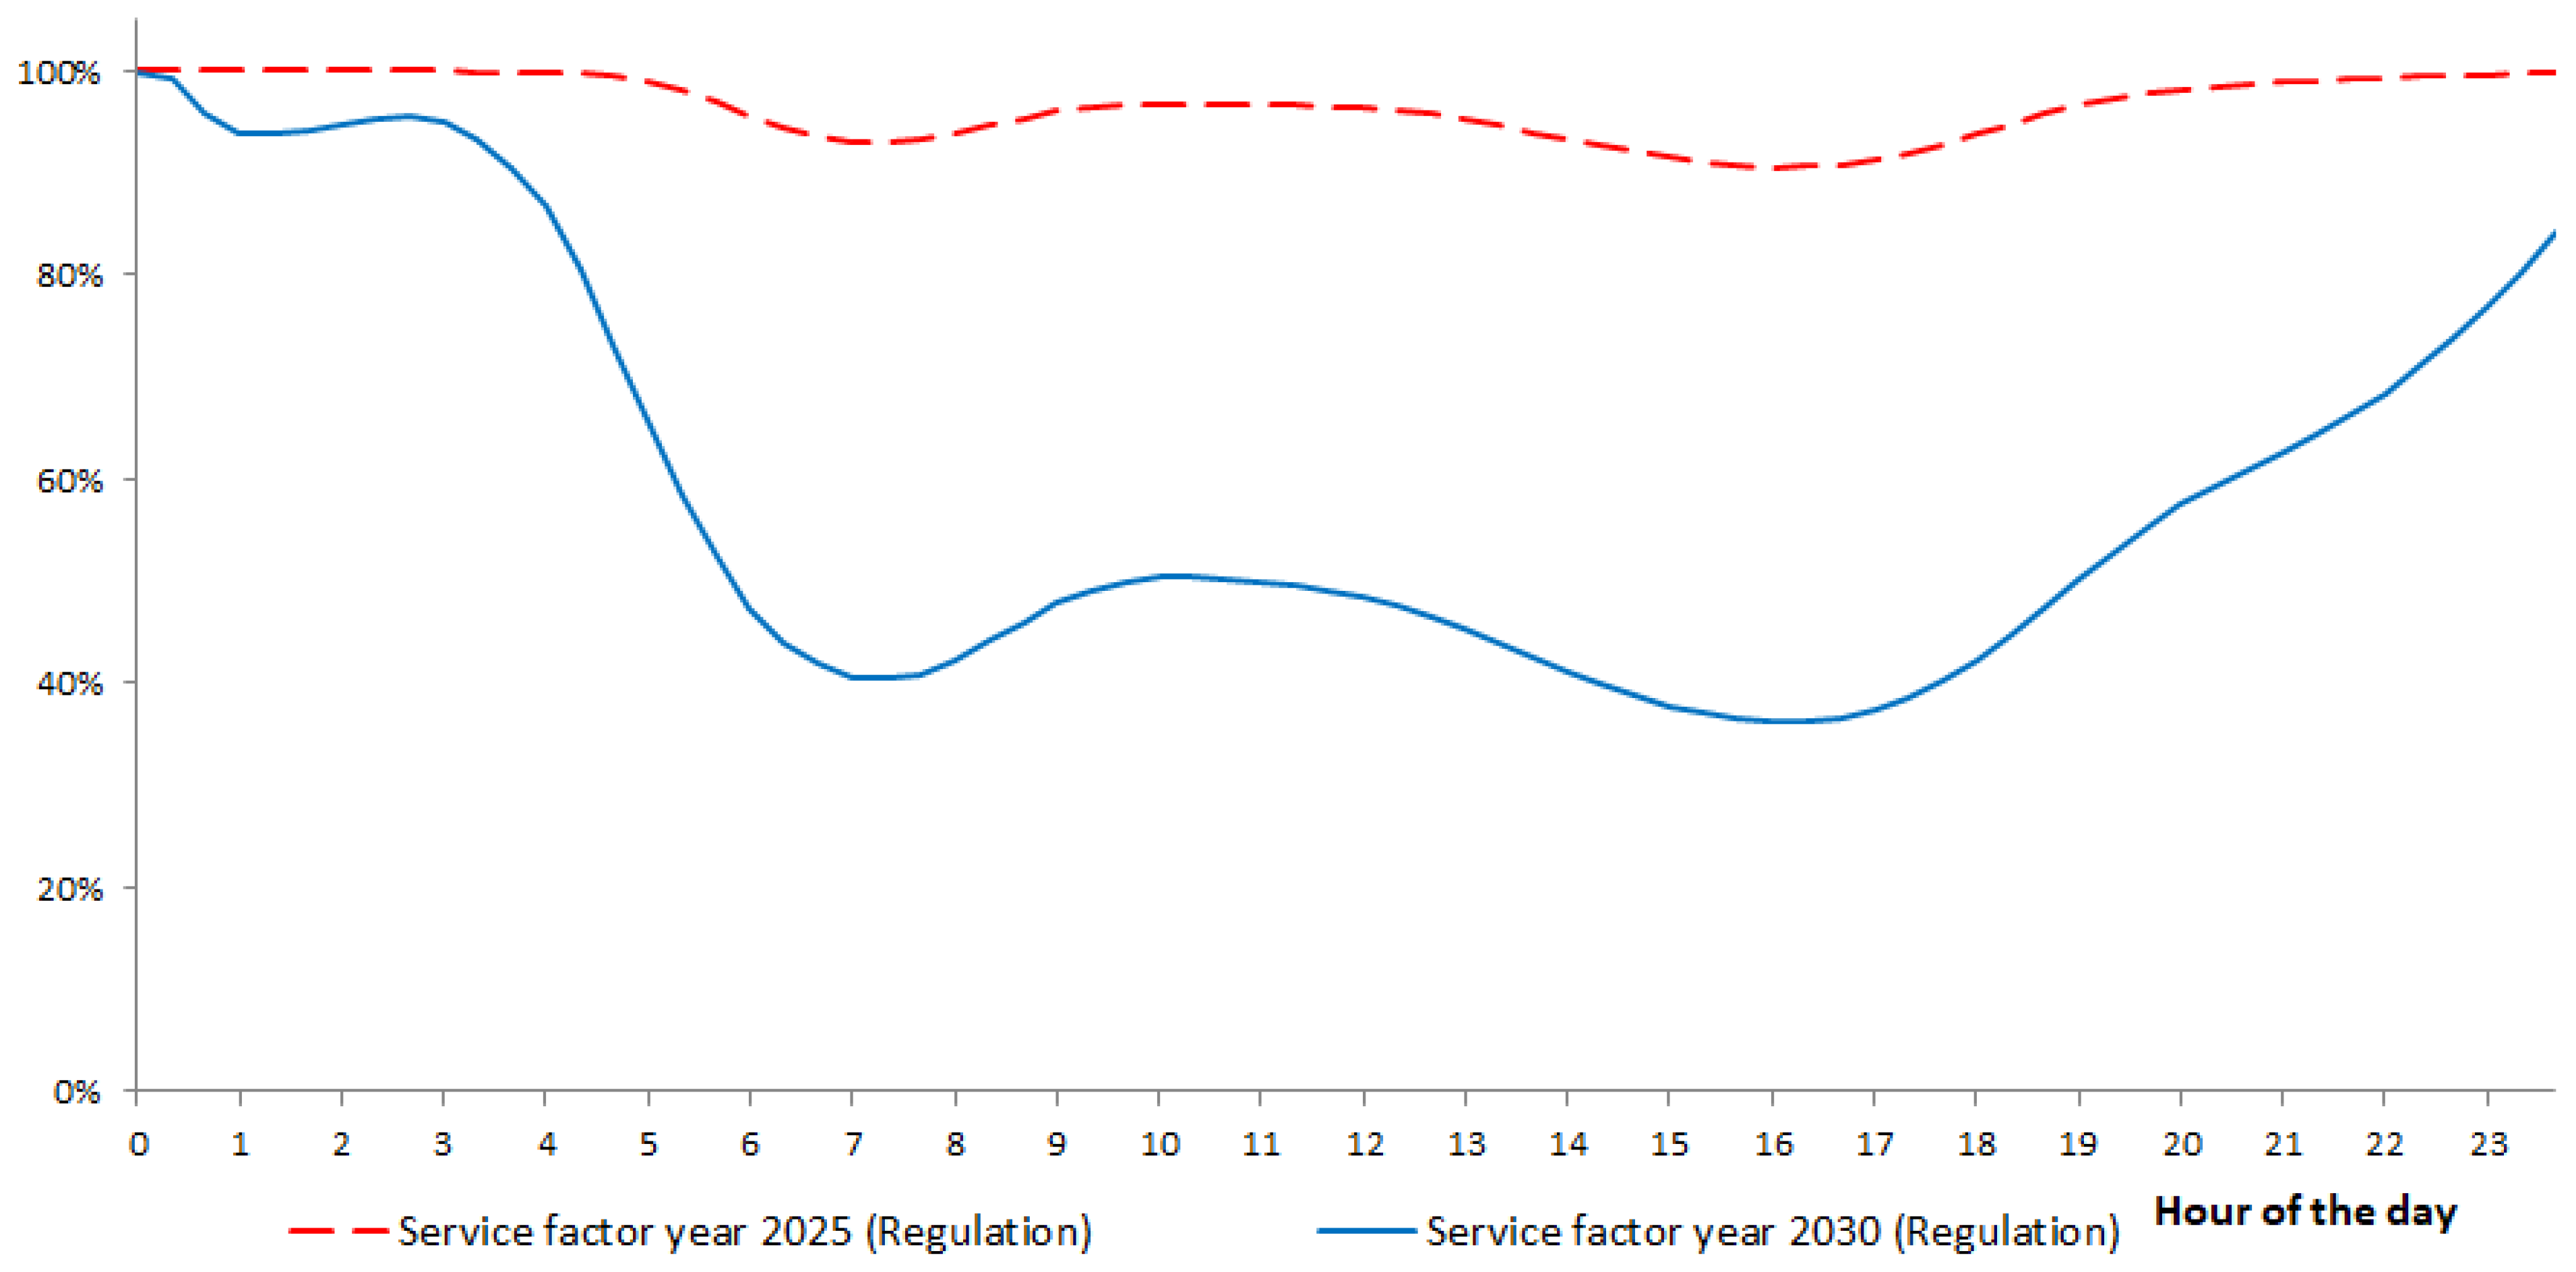
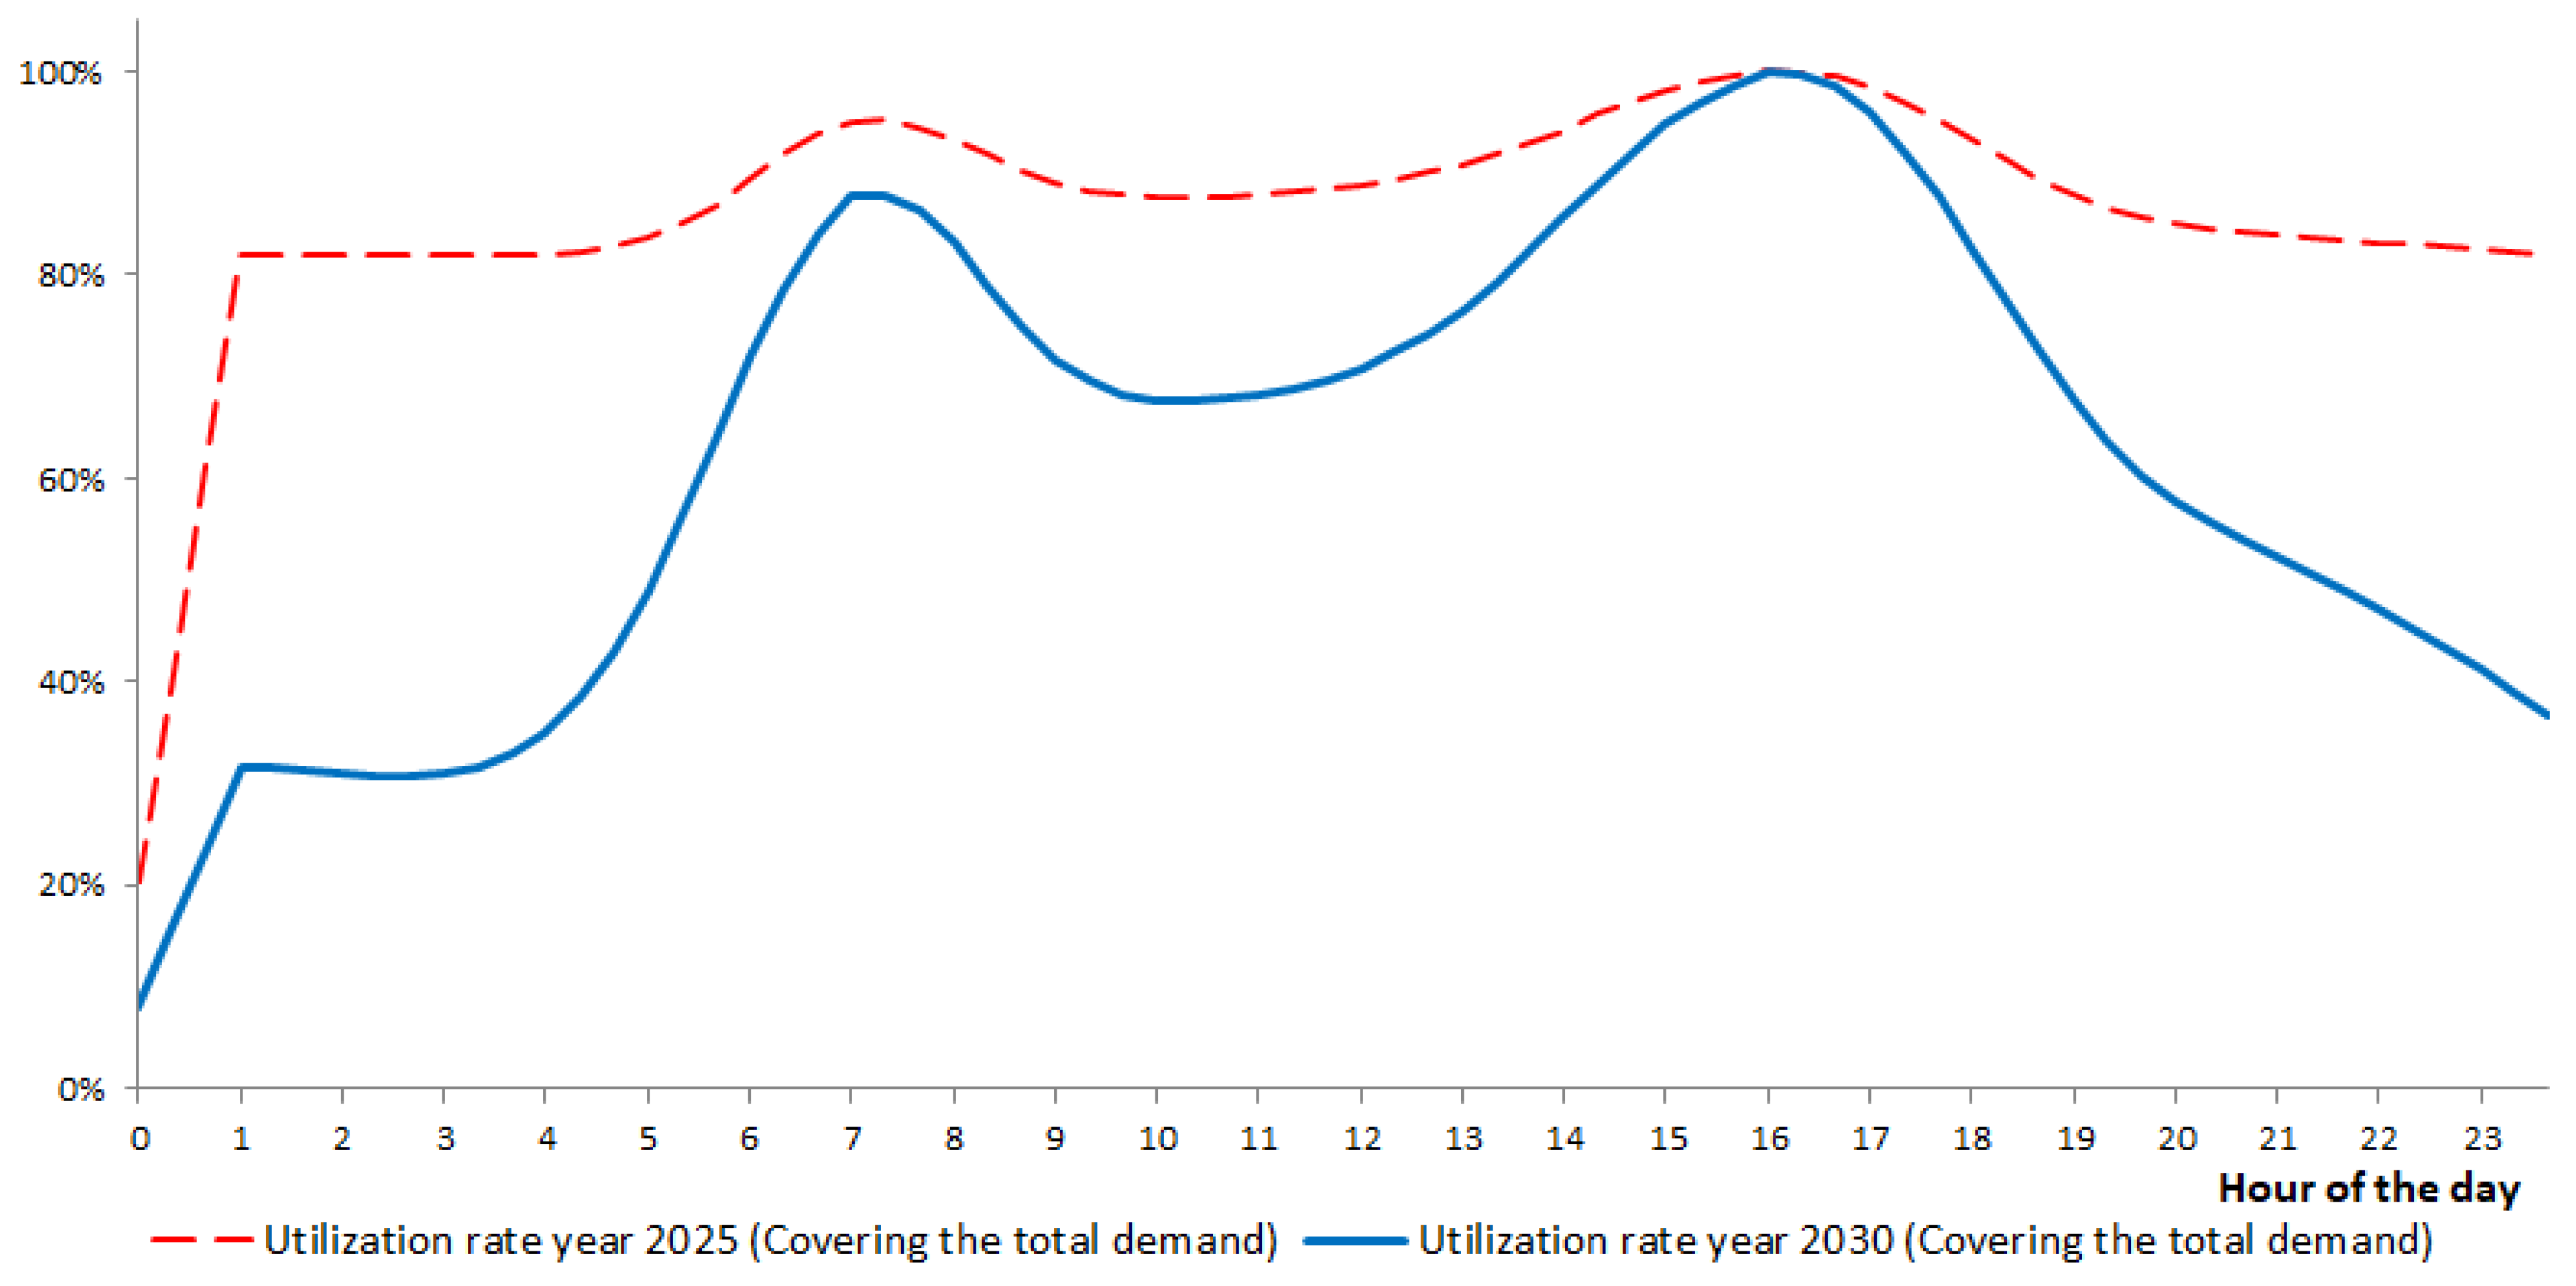
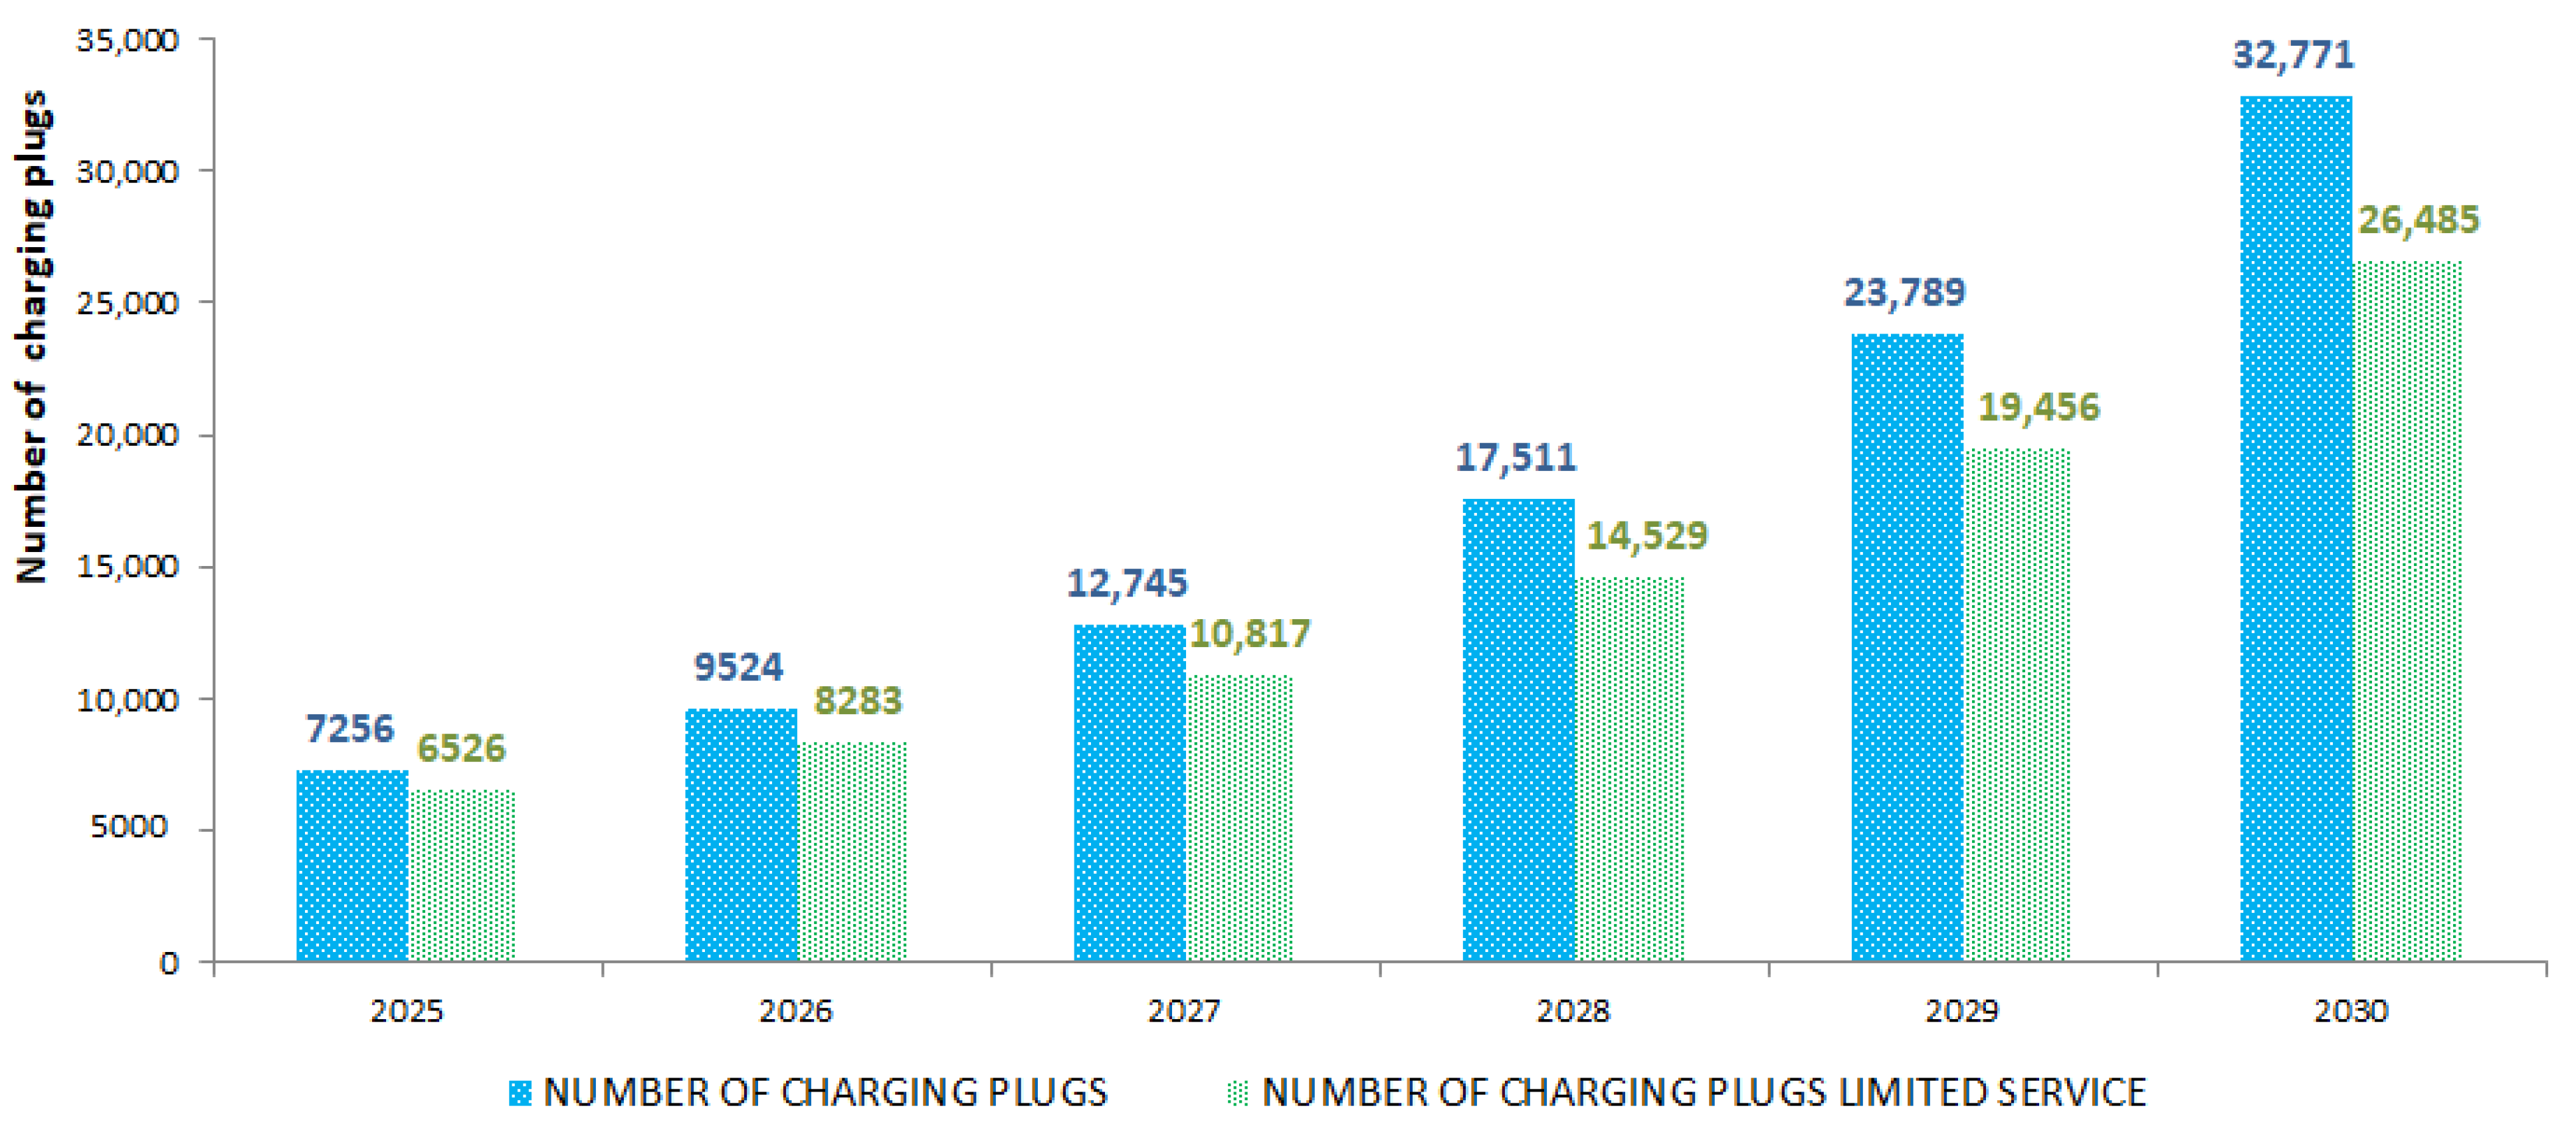
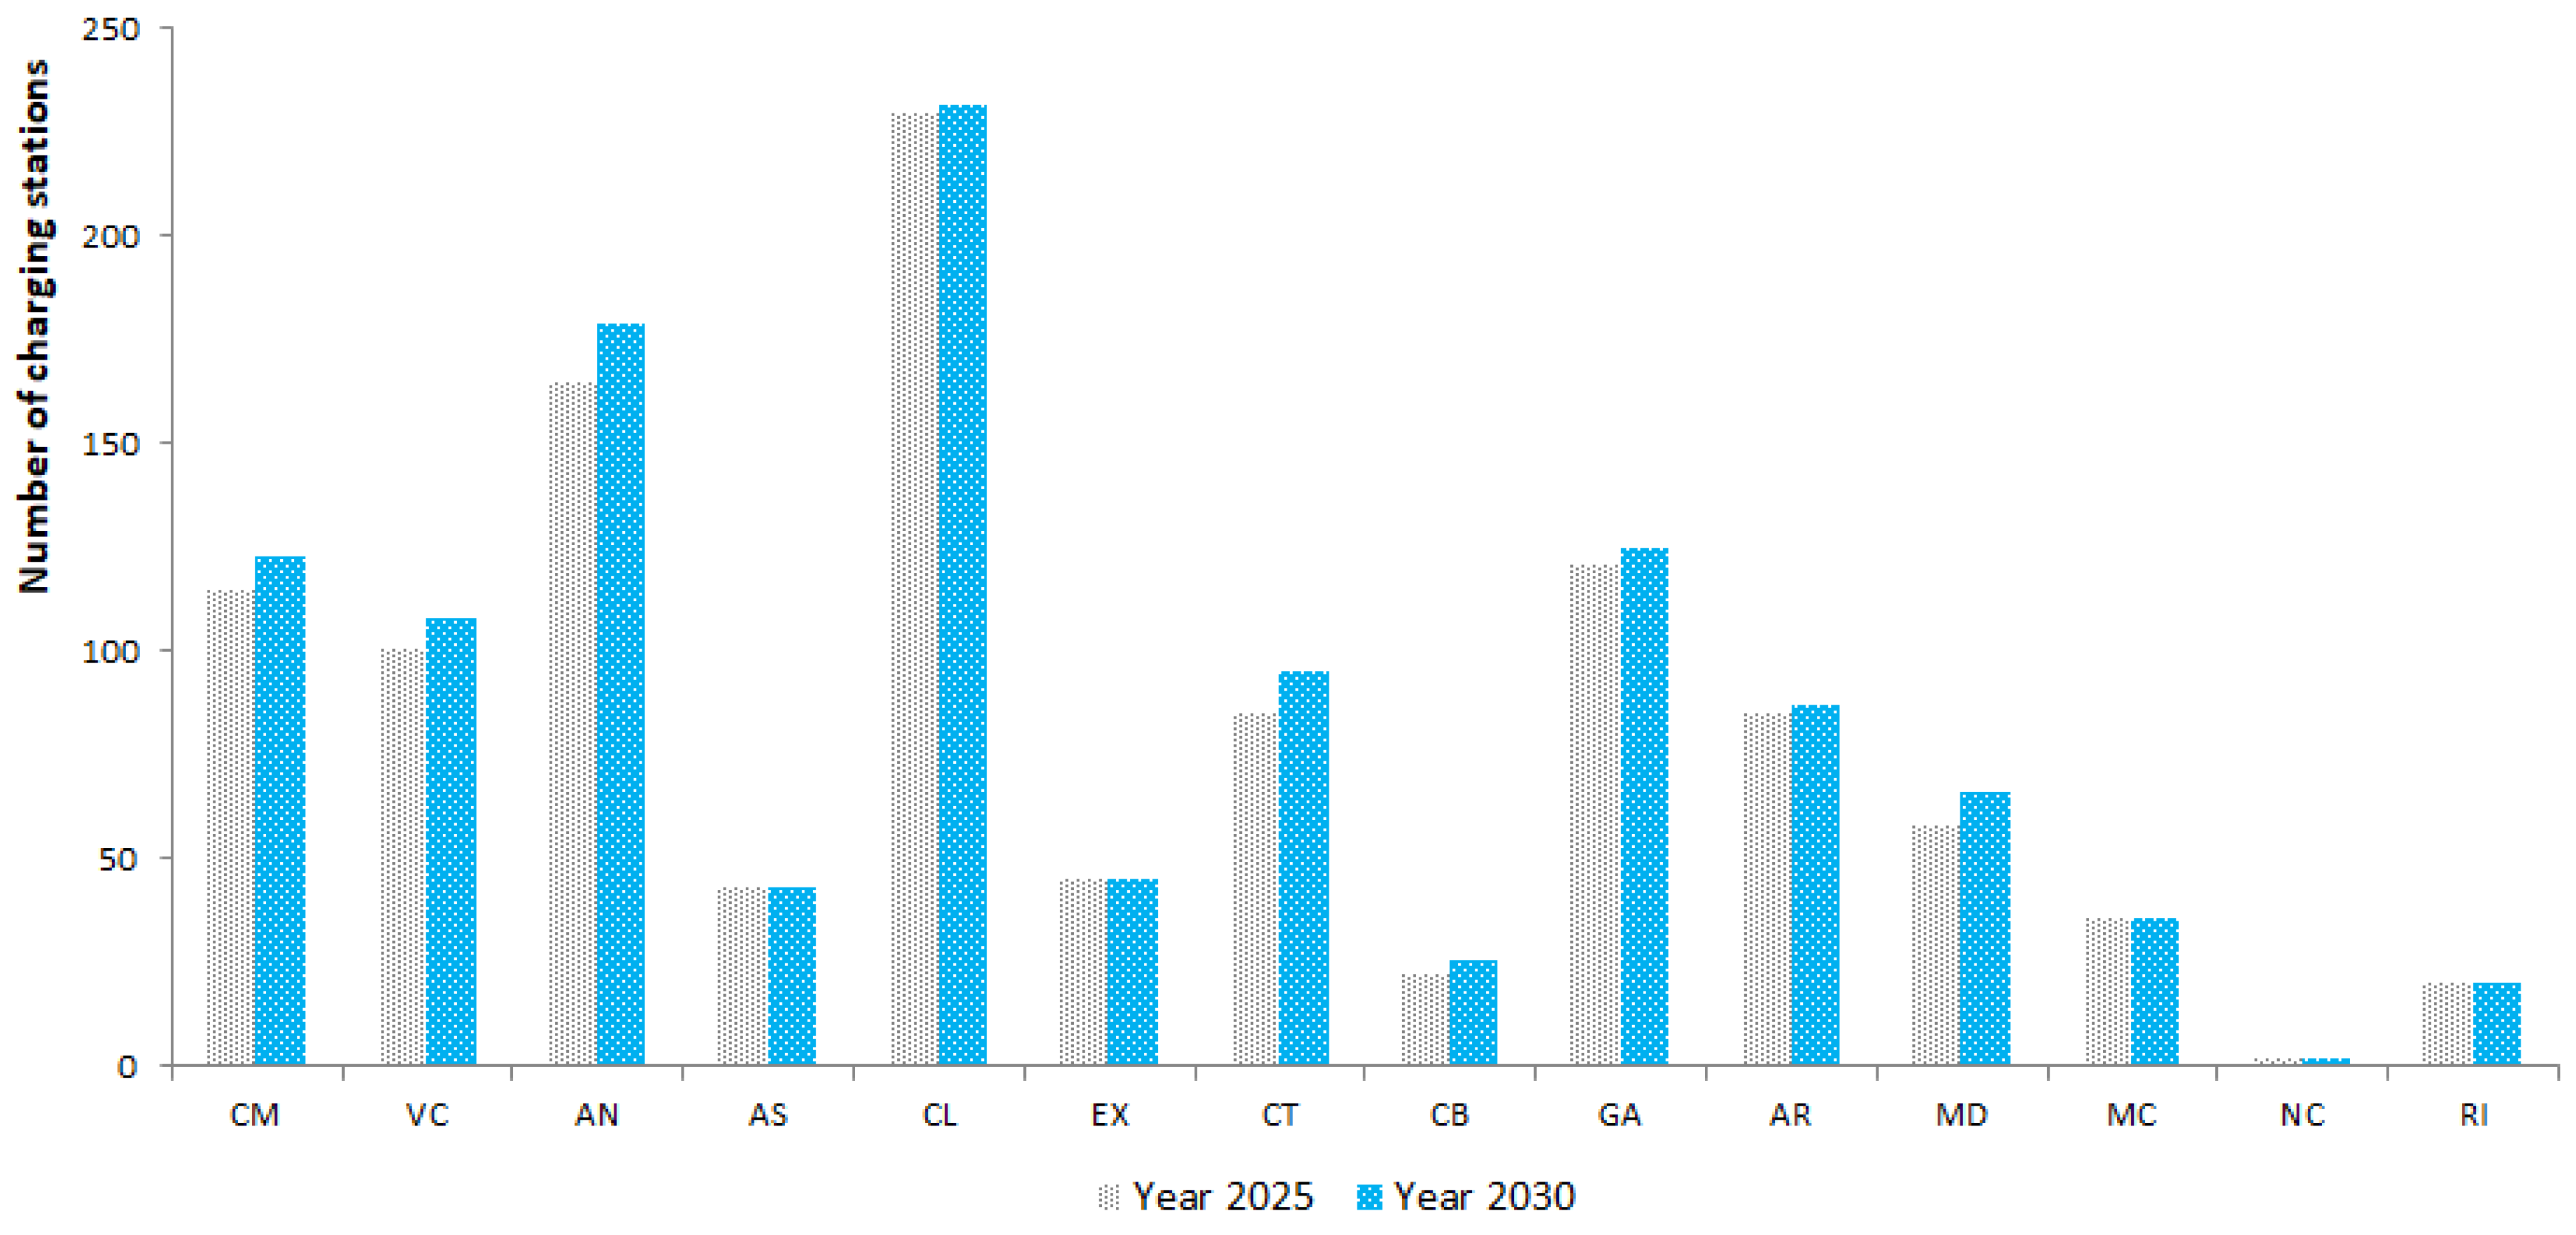
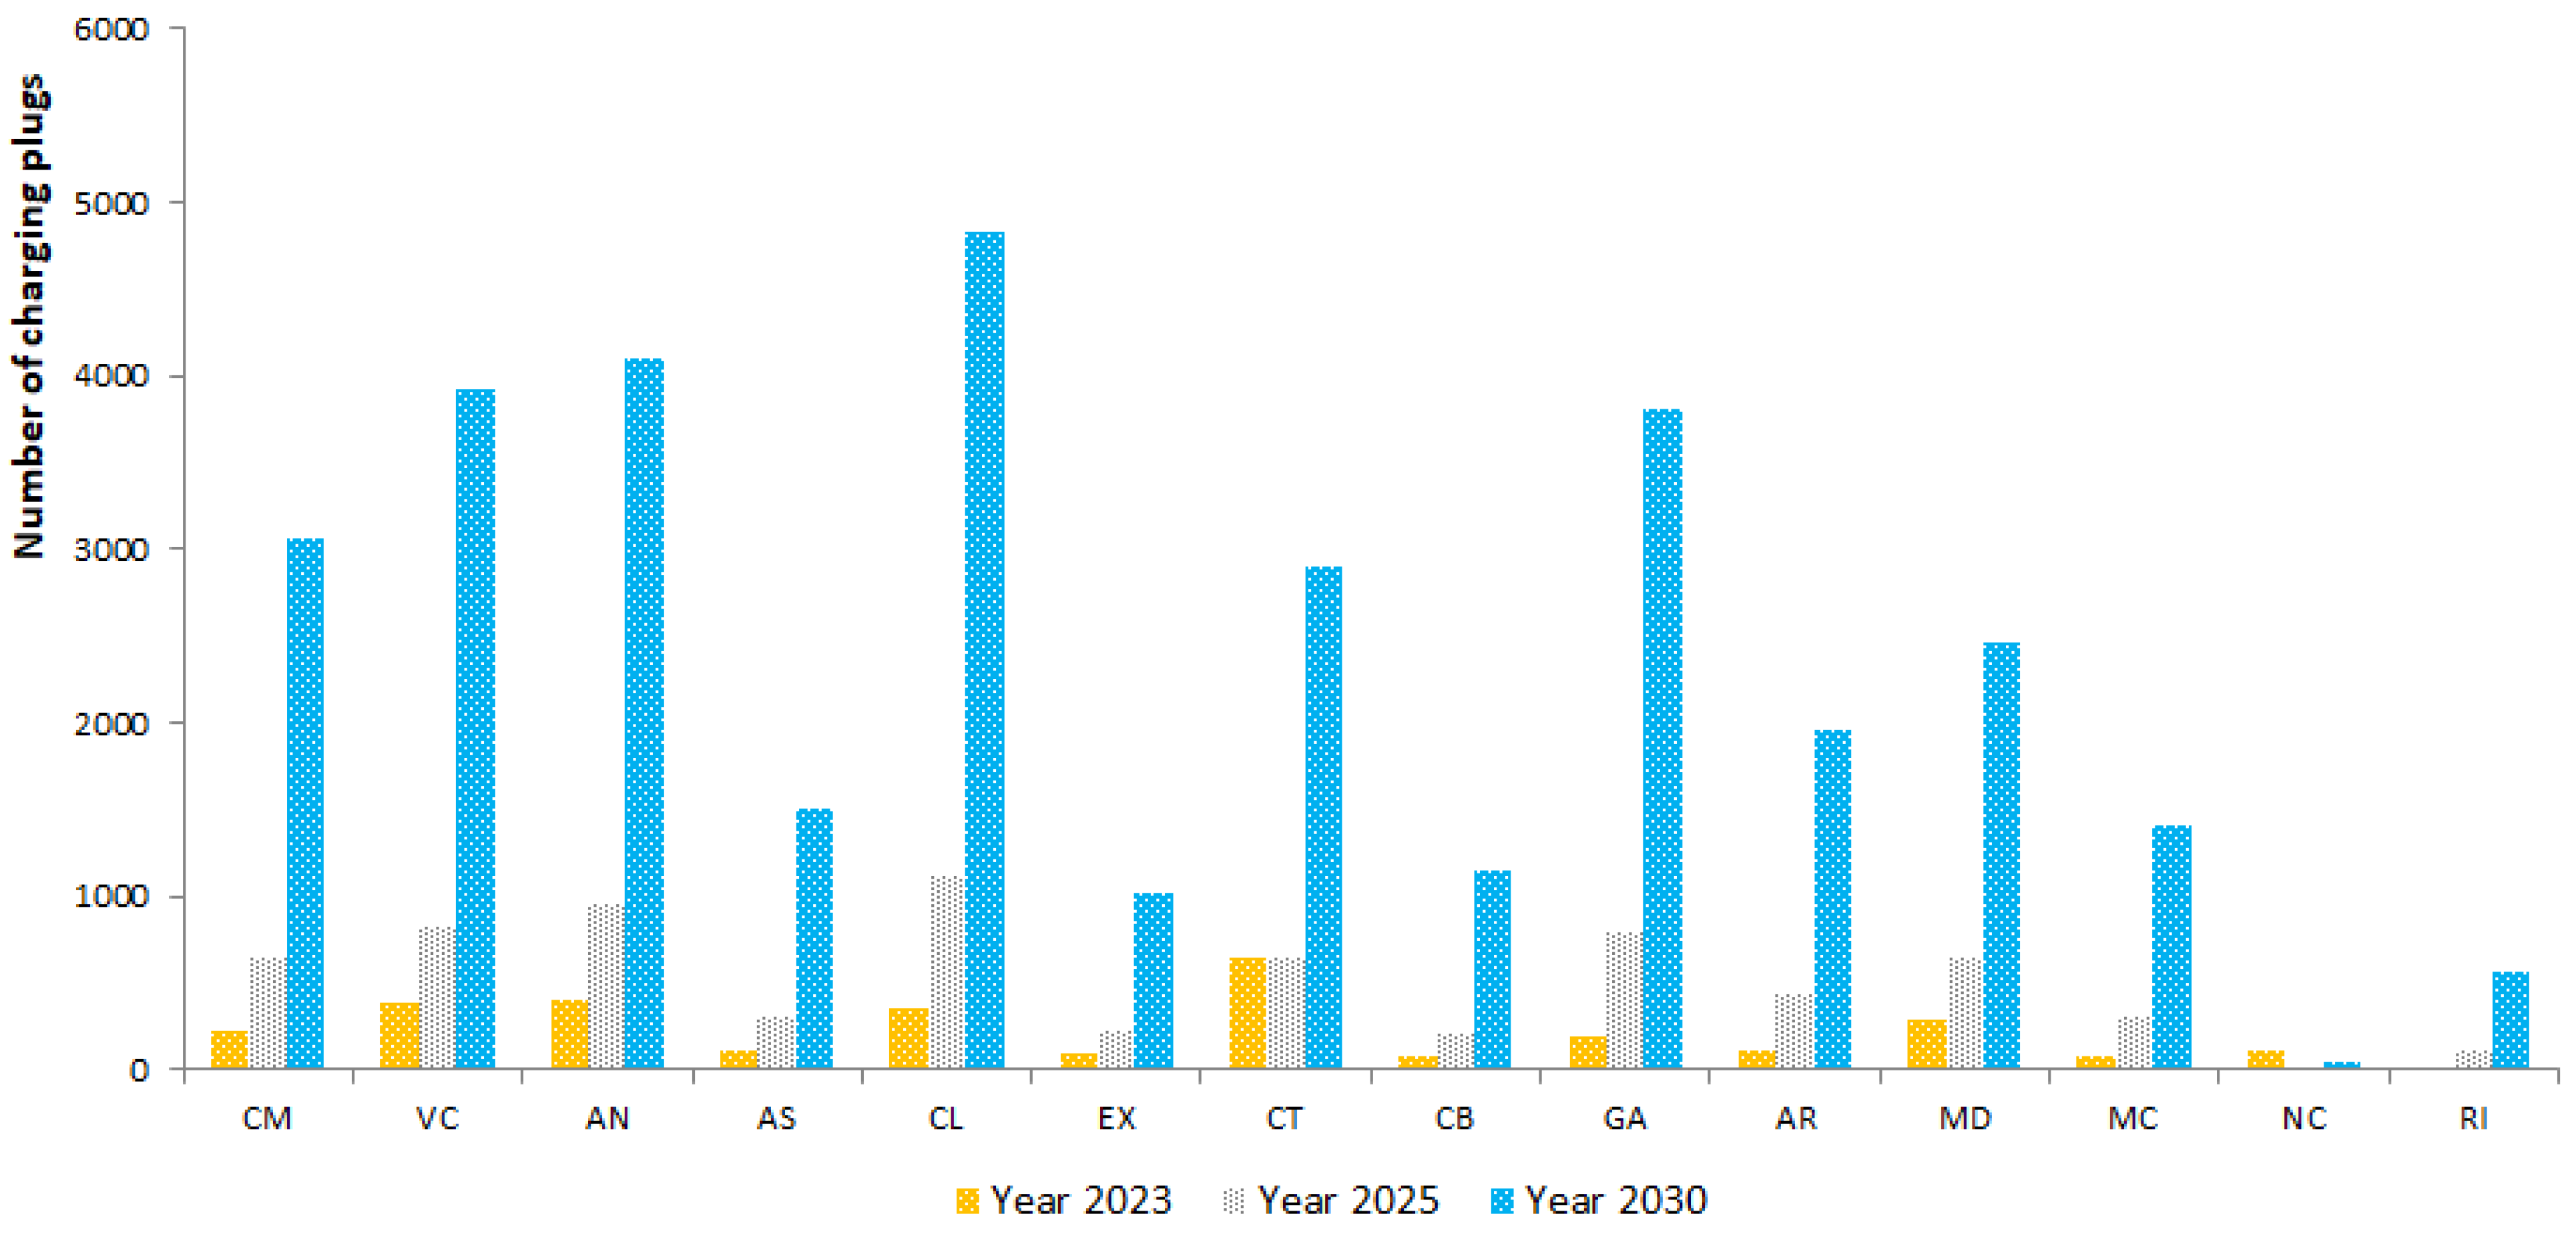
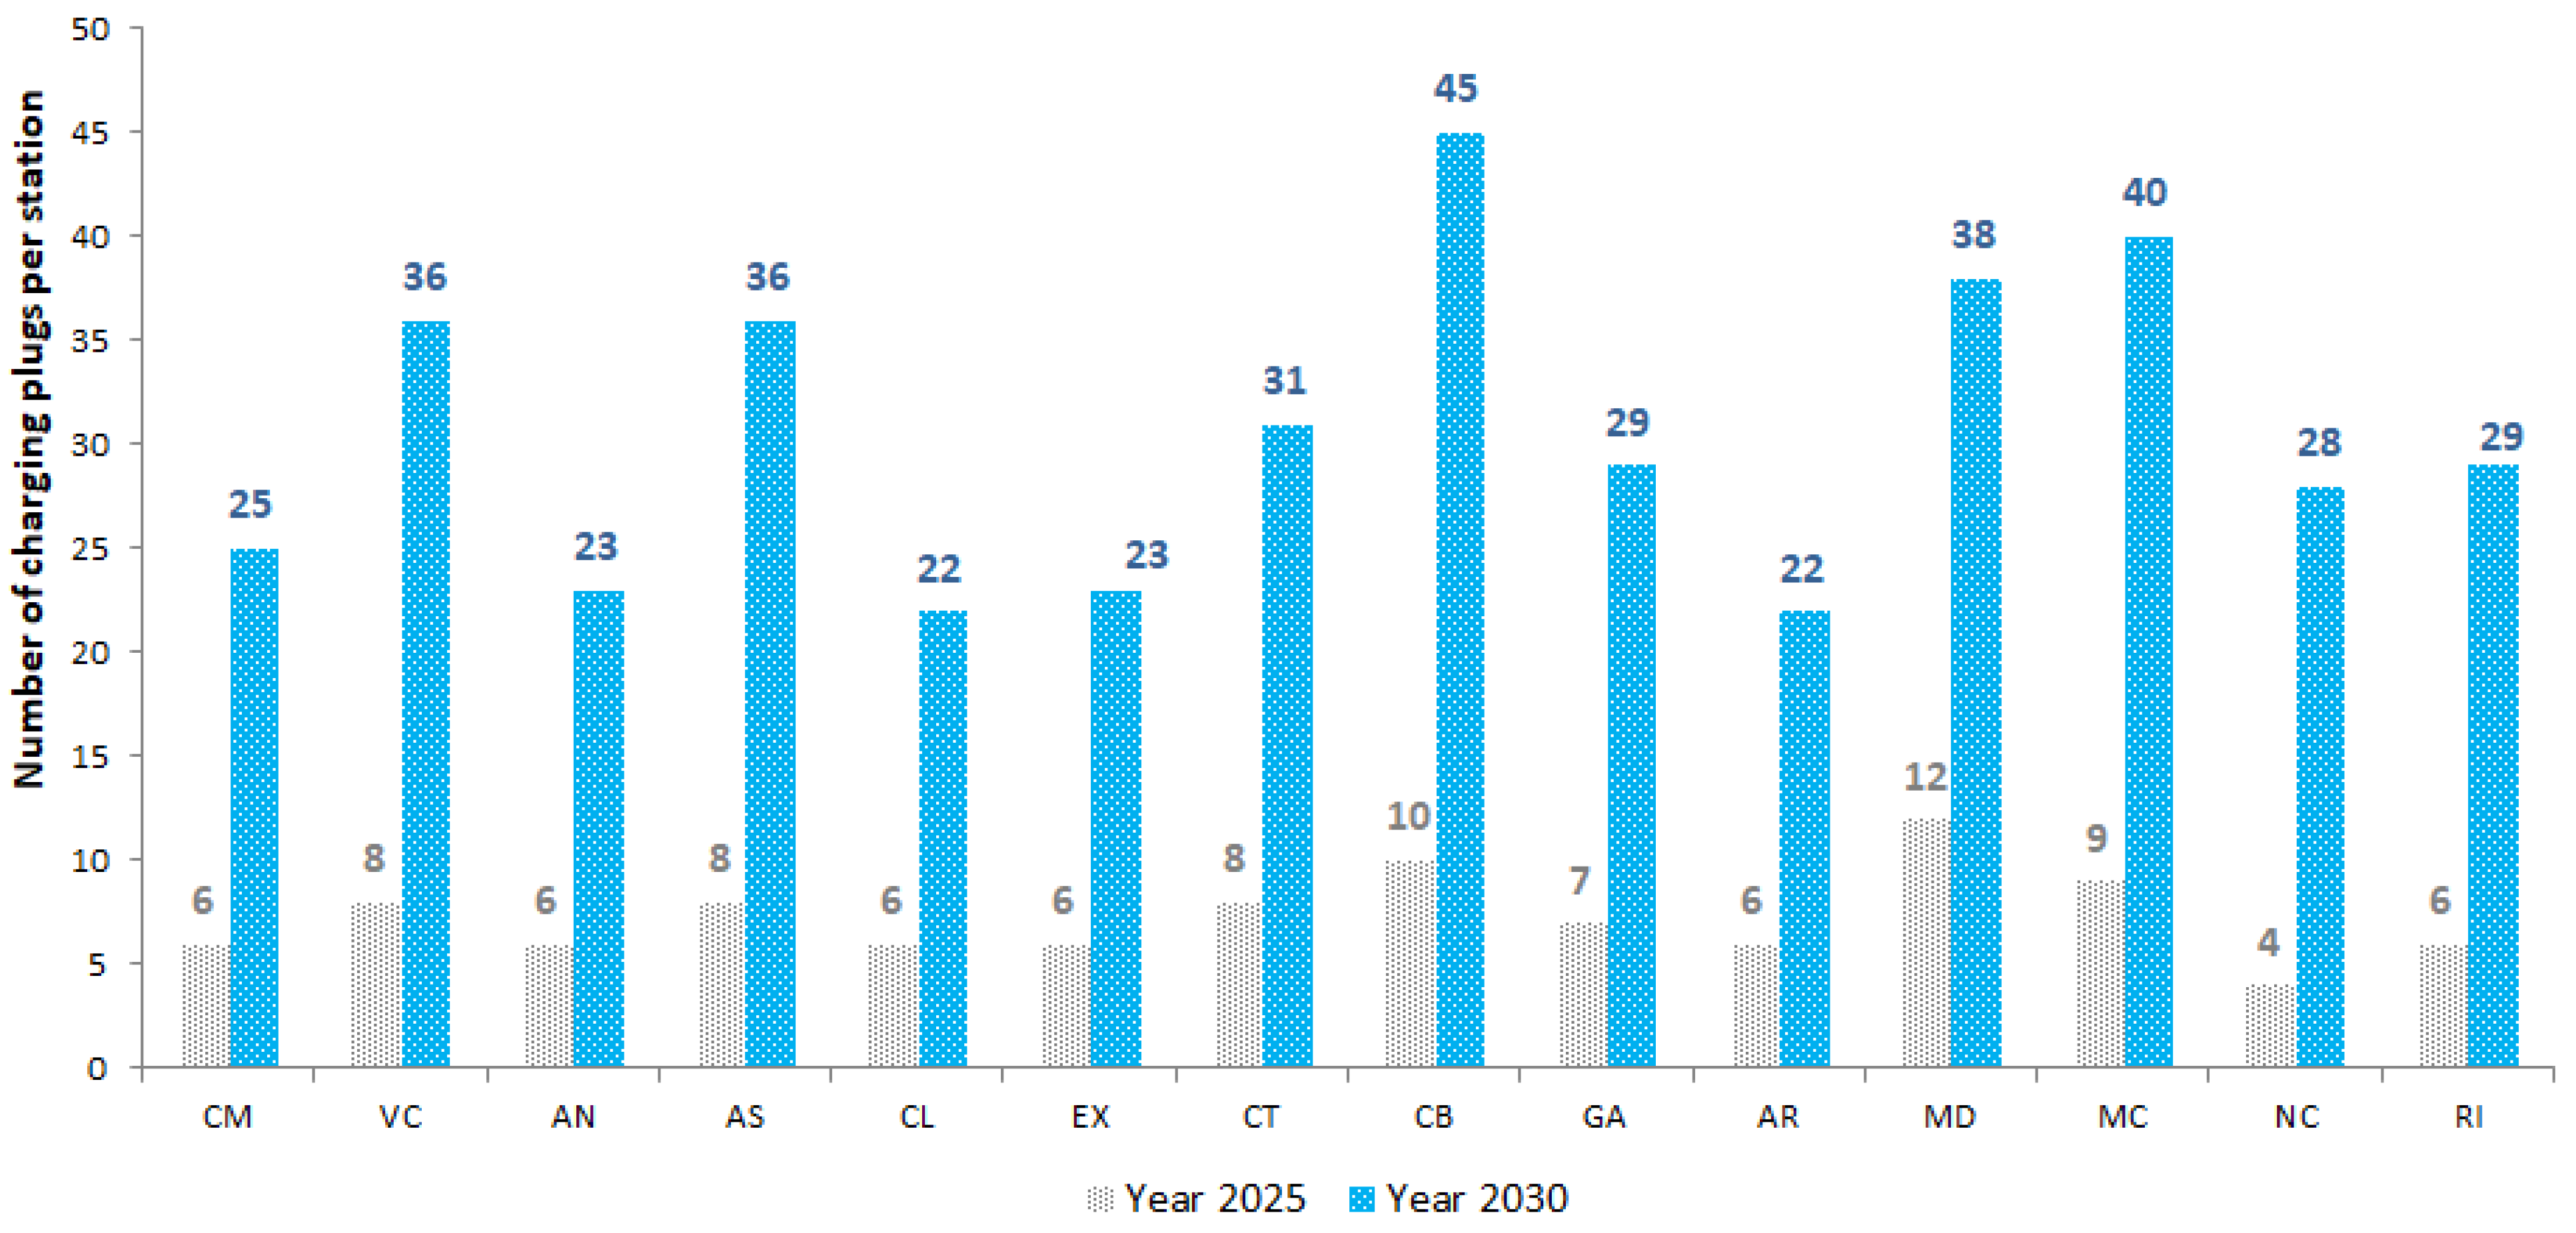
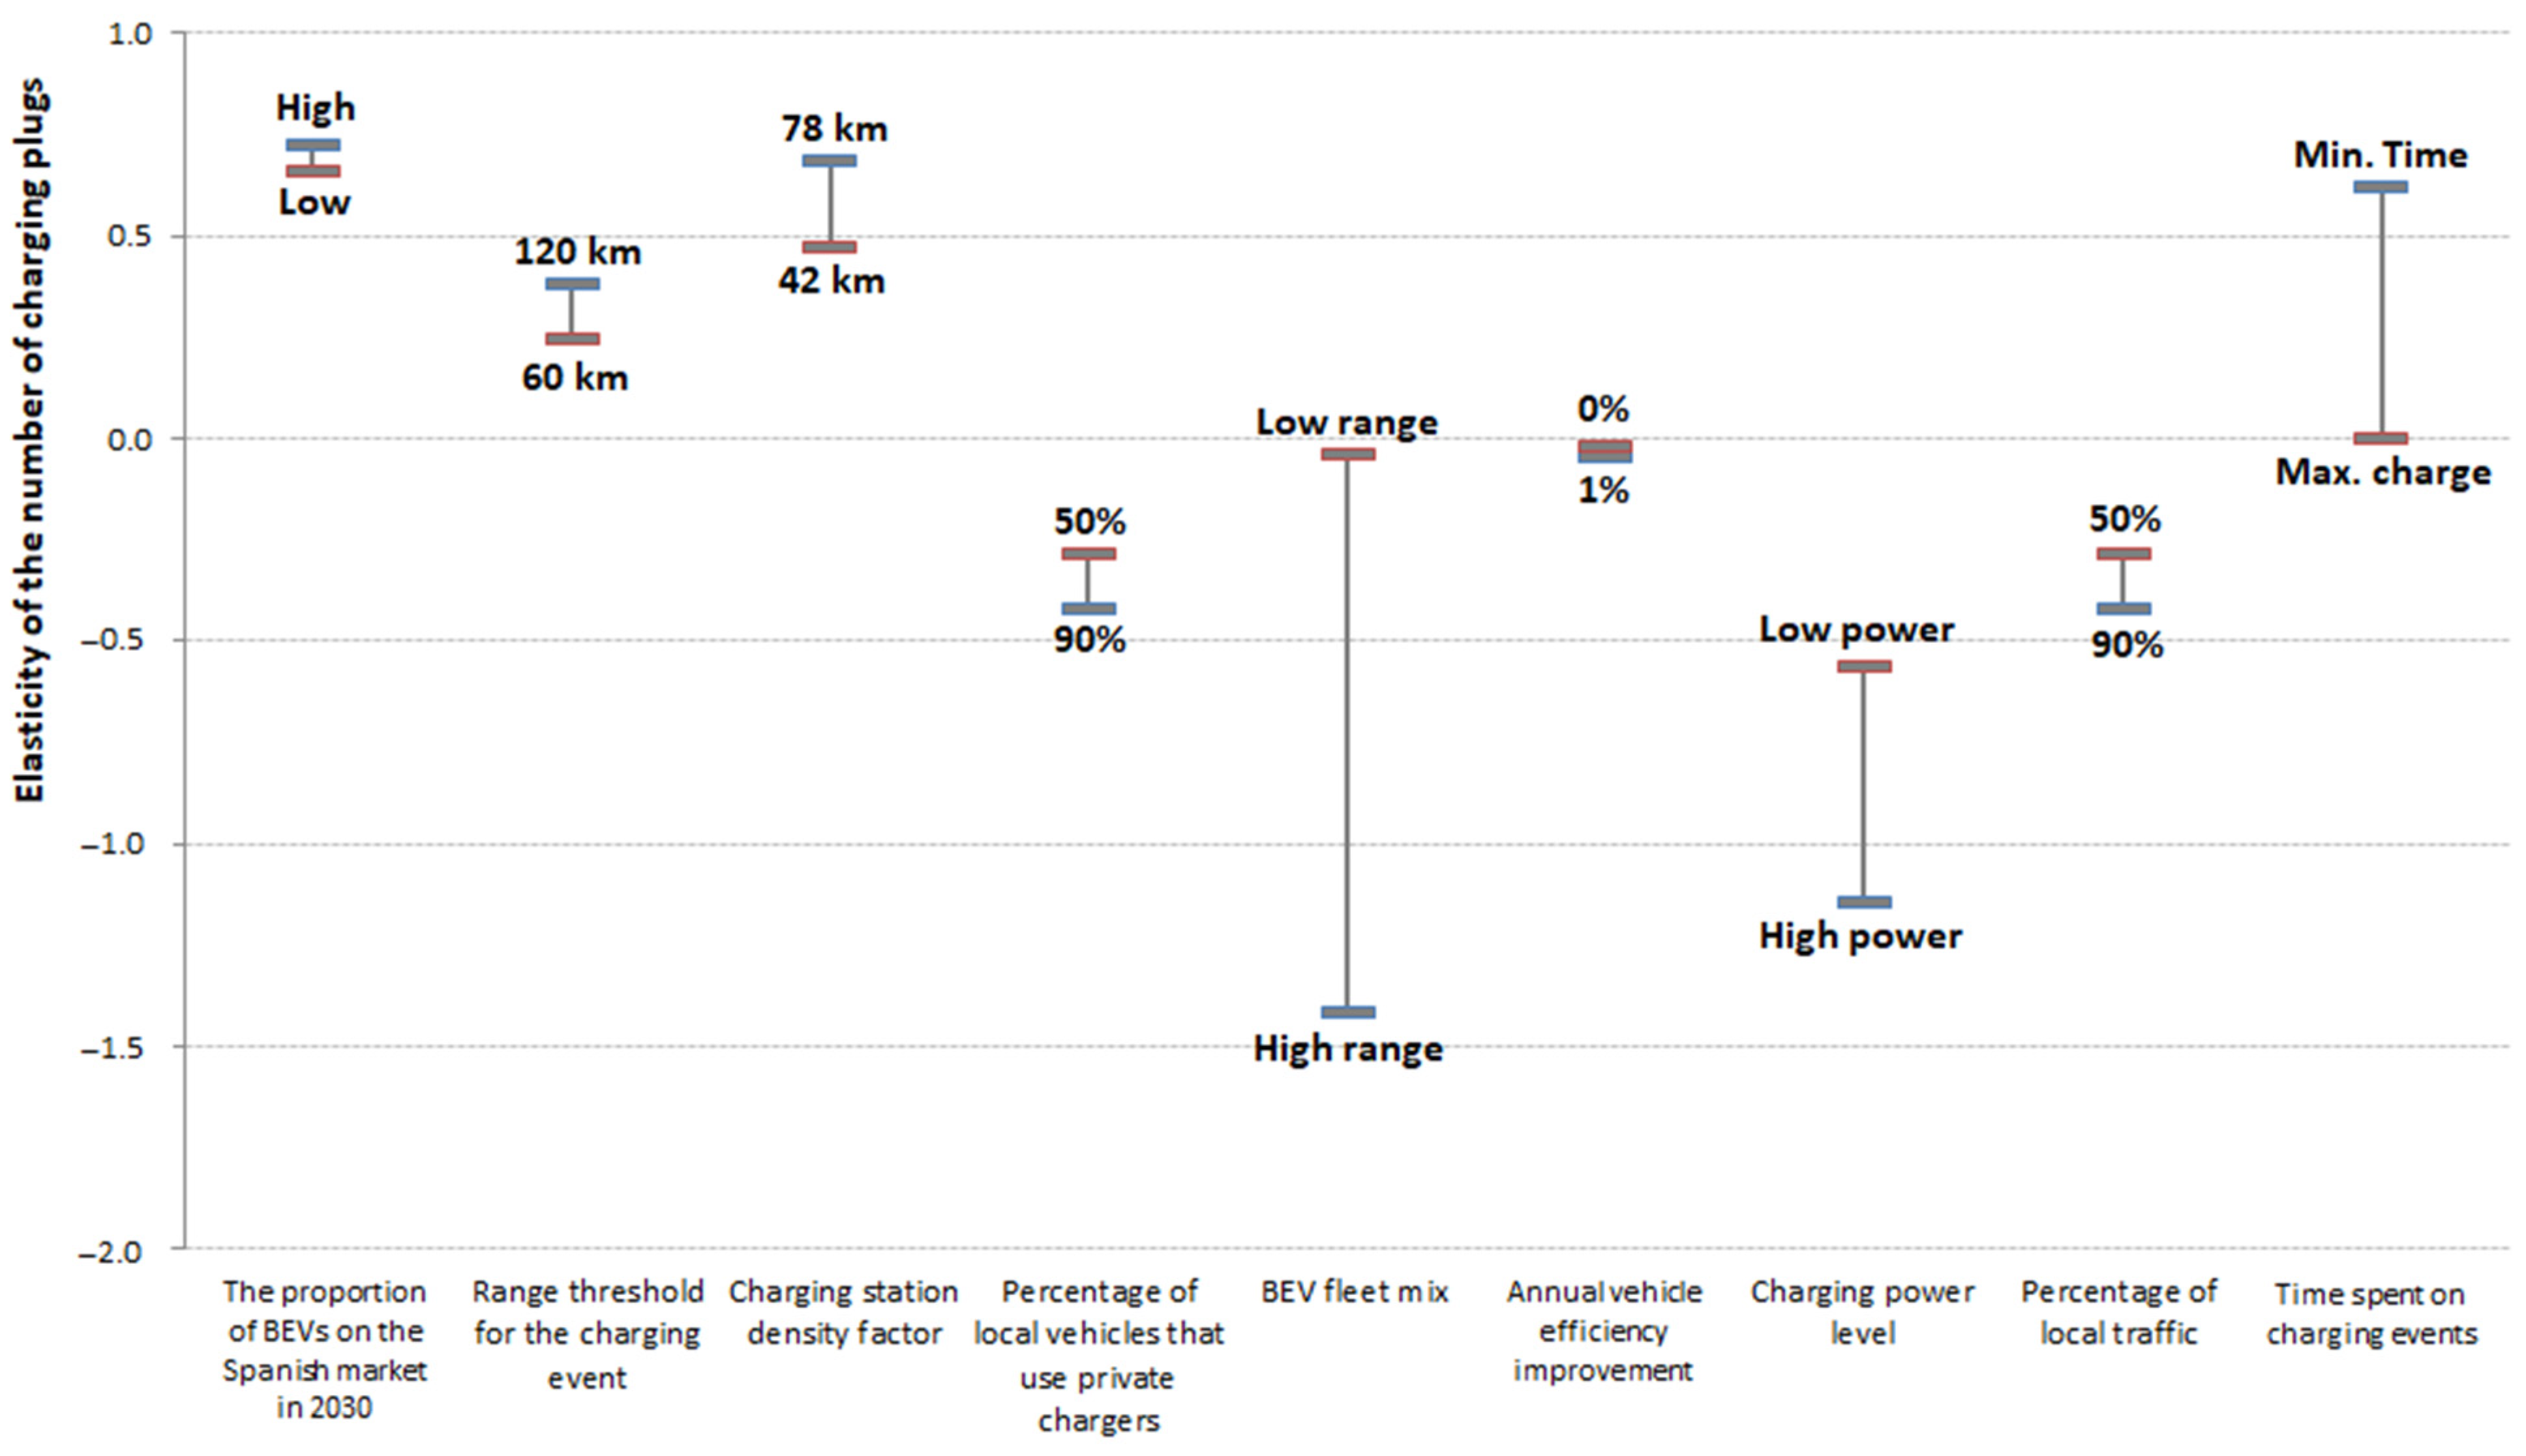
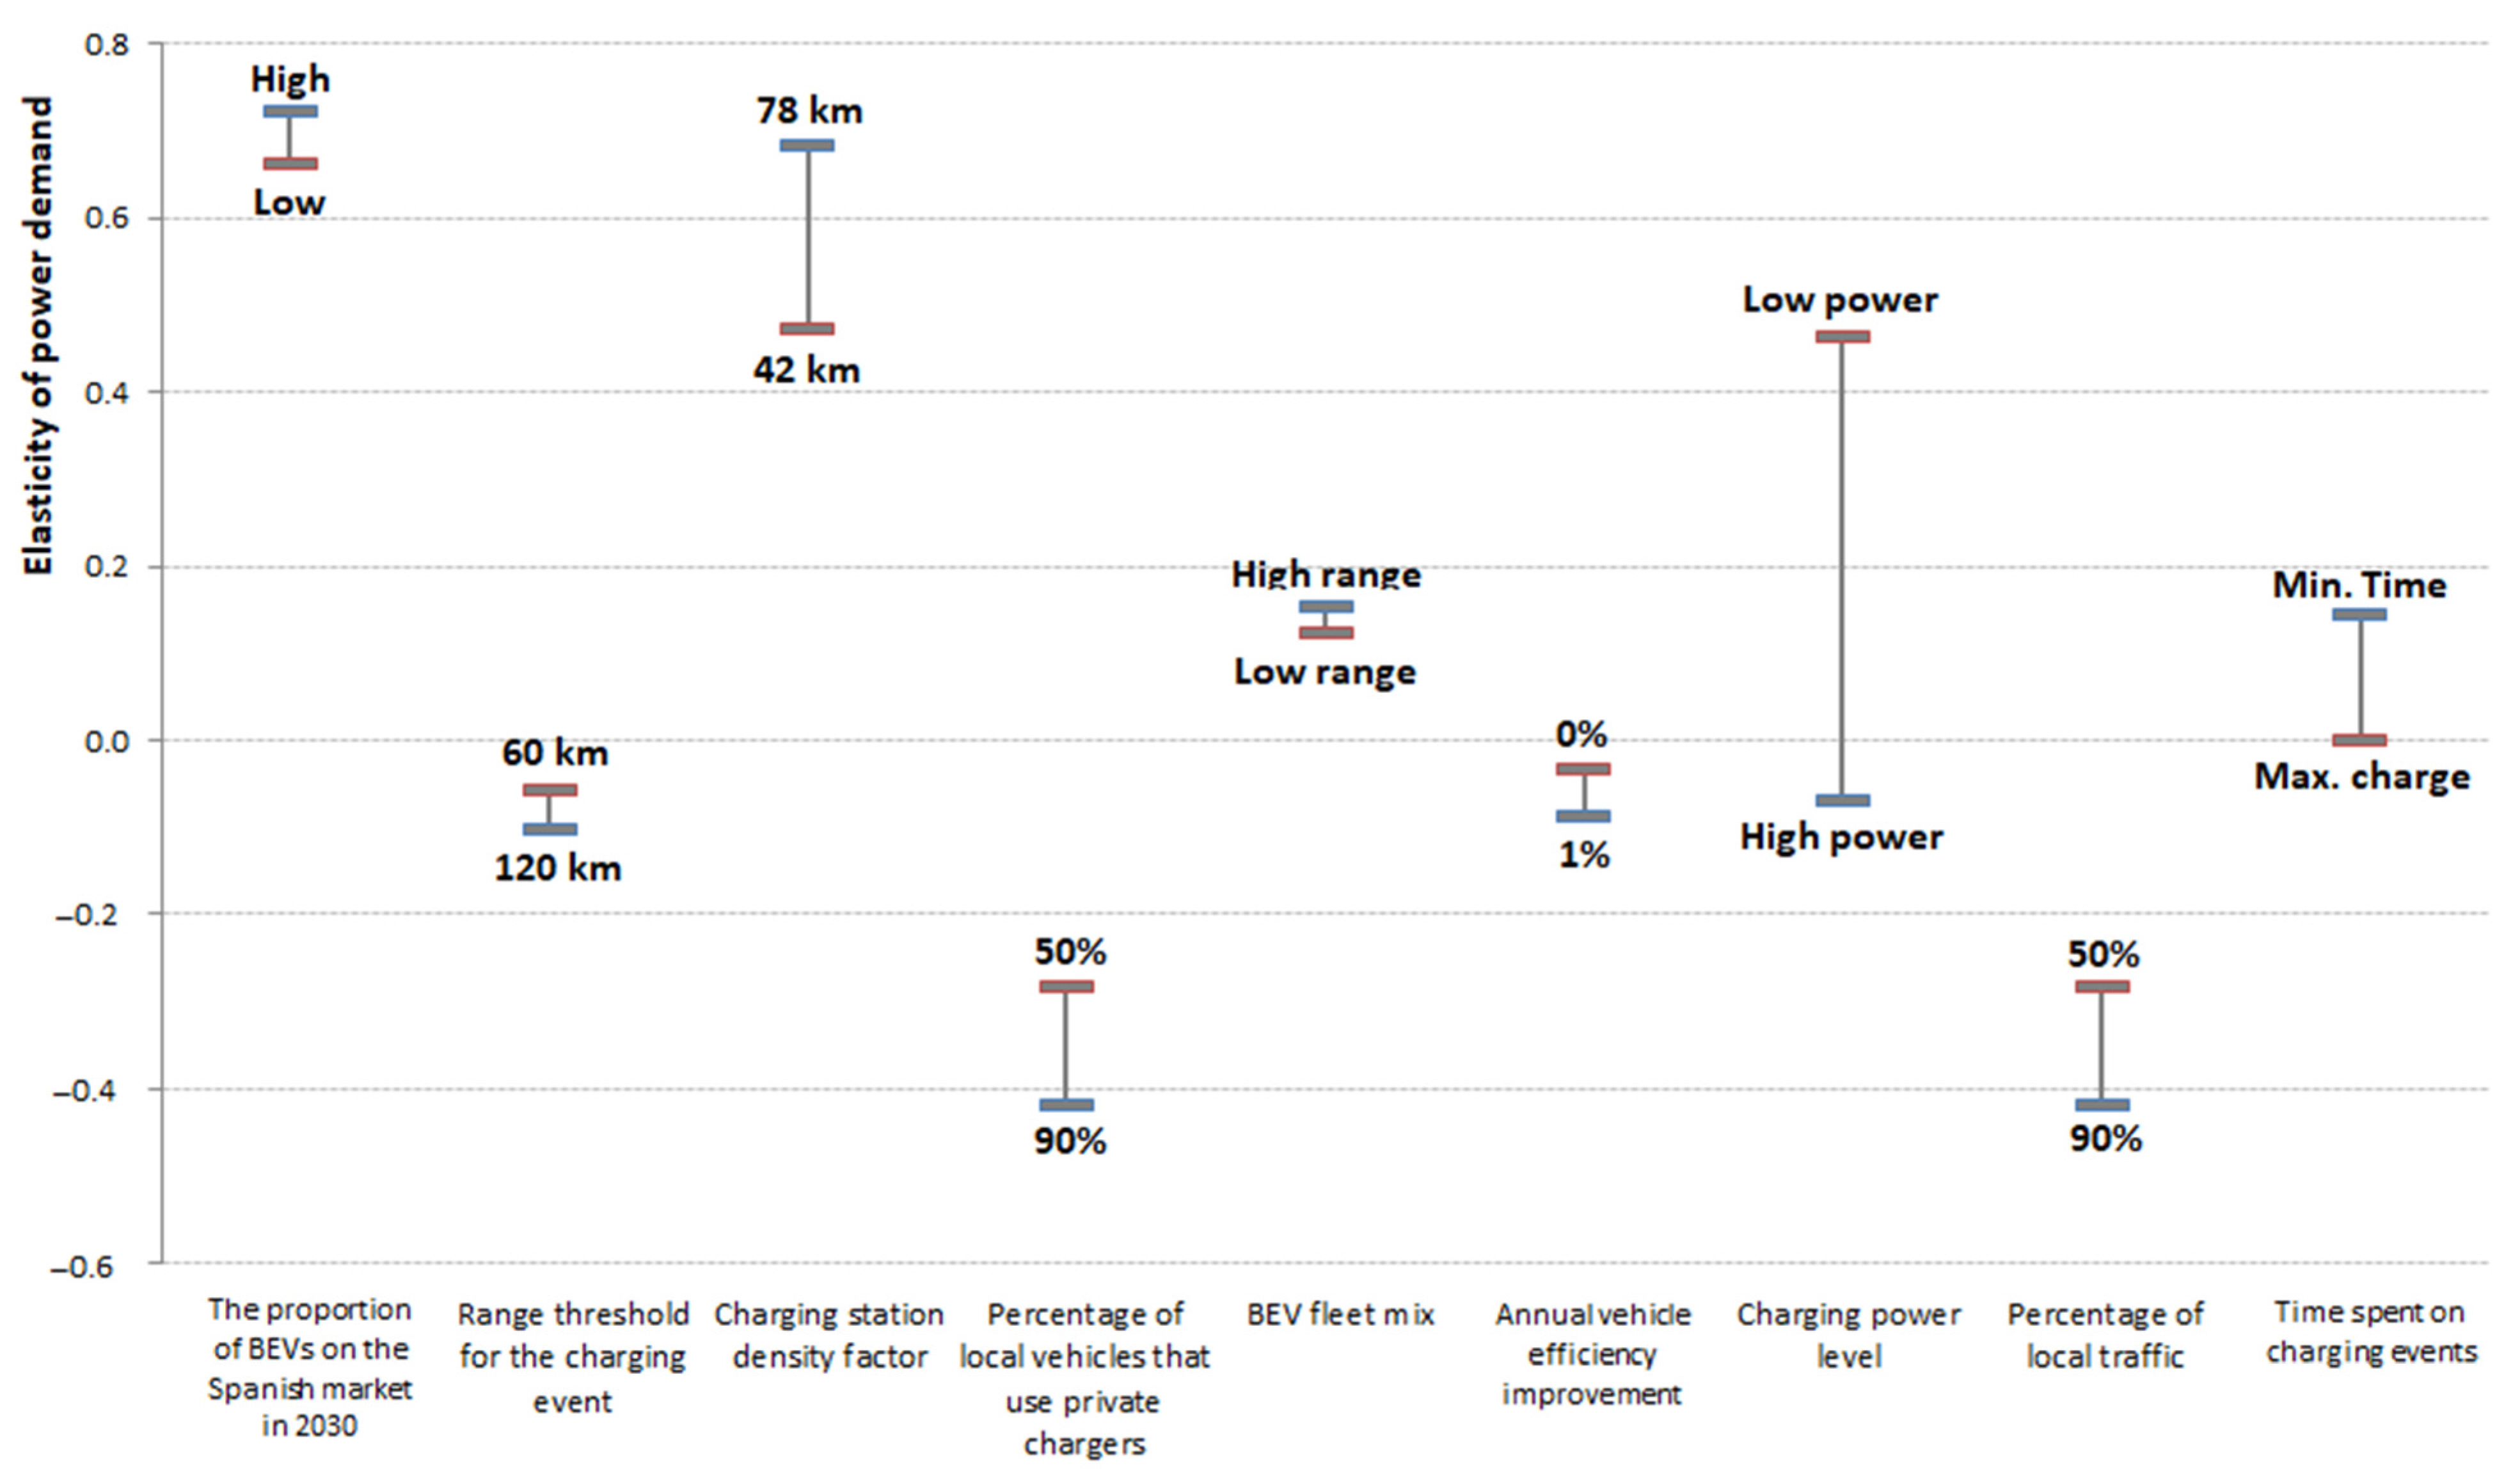
Disclaimer/Publisher’s Note: The statements, opinions and data contained in all publications are solely those of the individual author(s) and contributor(s) and not of MDPI and/or the editor(s). MDPI and/or the editor(s) disclaim responsibility for any injury to people or property resulting from any ideas, methods, instructions or products referred to in the content. |
© 2024 by the authors. Licensee MDPI, Basel, Switzerland. This article is an open access article distributed under the terms and conditions of the Creative Commons Attribution (CC BY) license (https://creativecommons.org/licenses/by/4.0/).