Abstract
High-voltage direct current (HVDC) transmission systems are widely used today due to their several advantages over high-voltage alternative current (HVAC) systems. They are primarily utilized in connecting different large grids or smaller independent networks, especially in submarine interconnections. Many studies have been conducted globally on the optimal planning, operation, and control of these power systems. Understanding the transient stability of these systems during significant disturbances is also of great importance. This paper specifically focuses on power systems with HVDC connections and high penetration of renewable energy sources. Analytical models were developed for power system components like HVDC converters, DC lines, and full converter wind generators. A simulation of a test-case power system was conducted, including various significant disturbances such as HVDC line trips, short circuits, power unit failures, and major changes in load. The voltage and frequency stability of the system under specific operational scenarios was also examined. The results obtained indicate technical limitations and operating guidelines to avoid undesirable conditions and system failure. In conclusion, adopting short-term stability tests the optimal operation point of the system, and the limitations in the penetration by RES units can be decided.
1. Introduction
High-voltage direct current (HVDC) technology has many applications in modern power grids. Most of these are met in the interconnections of different power systems. The increased use of HVDC transmission systems shows that they are expected to comprise multiple terminals of several HVDC transmission lines in the future [1]. HVDC technology has significant advantages over HVAC for long distances or for systems that operate with different nominal frequencies (i.e., lower operational cost, lower power losses, controllability of power flow, fast fault clearance, asynchronous interconnection between AC grids, thinner diameter conductors, no charging current issues, etc. [1,2]). HVDC systems using voltage source-based converters (VSC) are rapidly becoming the key platform of modern transmission grids, delivering higher amounts of electric power [2]. Long HVDC lines are usually weak having a low short-circuit ratio (SCR) and a low effective DC inertia constant [3]. Furthermore, wind power, which has become one of the most dominant renewable sources, is often met far from the consumers, where the power grid is relatively weak. The work in [4] presents the impacts of large-scale wind penetration on the energy supply industry. The lower the SCR, the weaker the AC grid, which may generate many operational problems such as voltage drop and frequency deviation [5].
There have been numerous studies worldwide focusing on optimal operation of interconnected mixed AC/DC grids [6,7,8,9,10,11,12,13,14,15]. Some studies have examined the optimal operation of mixed AC/DC networks, with emphasis placed on security-constrained optimal power flow (OPF) [6,7,8]. The OPF problem is complex and may be solved using nonlinear optimization techniques such as quadratic programming, interior-point methods, or heuristic methods. The optimal power flow of HVDC systems has many benefits and challenges, regarding multi-terminal HVDC topologies. This is mainly in super-grids where there are HVDC interconnections between different countries. The work in [16] presents such a method. This paper proposed a methodology to operate a hybrid DC/AC grid by solving a security-constrained economic dispatch in the DC grid. This method has been proven to be applied in a hybrid AC/DC meshed grid implementation by testing it in the DC grid test system provided by CIGRE.
In addition to these studies, there is ongoing research regarding the operation of HVDC converters. The effective control of VSC stations is crucial for the economic and secure operation of such networks. The works in [17,18] present VSC stations in various operational states. Only a few studies have focused on modeling and analyzing the impact of different VSC-HVDC control loops in weak AC grid connections [19]. Wang et al. [20] explored how the gain of the VSC-HVDC AC voltage controller affects the stability of a VSC-HVDC system connected to a weak AC grid. In another study [21], a small signal model was developed for a VSC-HVDC system linked to a weak AC grid, and a Nyquist stability analysis was conducted to examine the influence of distributed parameter DC cables and π-section DC cables. Additionally, there has been a thorough investigation of how PLL parameters affect the instability of VSC-HVDC systems. It has been shown that PLL gains affect the maximum power transfer capability. If the PLL gains are kept low, then the theoretical power transfer limit could be achieved [22]. In [23], a frequency limit droop controller (FLC) is introduced for VSC-HVDC systems to participate in system frequency stability control. This additional droop frequency limit controller can realize frequency stability control without considering communication between converter stations at the sender and receiver ends. Moreover, an optimization method for the parameters of the controller is proposed to suppress ultra-low-frequency oscillations as well as low-frequency problems occurring in the regional grid. Another improved droop control method is proposed in [24]. The droop is adaptively adjusted according to the power change. This work tries to provide corresponding characteristics under different operating conditions and to enhance the power regulation capability of the controller under high power fluctuations.
This work develops a systematic method for the operation assessment of weak power systems with HVDC interconnections and high wind power production. It focuses on optimal transmission system design decisions and operation considering transient stability analysis. The stability studies in this paper examine specific fault scenarios that could impact optimal steady-state operation. Previous works for optimal power flow have not included the dynamic stability of the system under consideration. Most of the previous works dealing with dynamic analysis, like in [21,22,23,24], focus on the dynamic operation of the HVDC converters in multi-terminal DC networks and in mixed AC/DC networks, but they do not examine the optimal operation of the whole interconnected power system. The contributions of this work can be summarized as follows:
- Incorporation of short-term dynamic stability tests into OPF studies for mixed AC/DC power systems. The method proposed in this paper aims to verify whether the steady-state optimal scenario remains valid in the event of a significant fault.
- Development and modification of analytical models of HVDC converters for simulation tests using MATPOWER [25] and MATDYN [26].
- Integration of wind power generator models in MatDyn software (Version 1.2). This work extends the work of reference [26] by adding models for wind power generators and incorporating OPF studies.
- Utilization of open-source code that is easy to modify system components’ models. The work contributes to the field of weak power system operation analysis and design by presenting a method of optimal power system operation based on a fast solver.
The rest of this article is organized as follows. Section 2 provides the configuration of the system under study as well as the proposed method for its optimal operation analysis. Section 3 presents the models of the power system’s components that were developed in this work to implement the proposed method. In Section 4, a case study system (modified IEEE 24-bus test case) is used to test the proposed method through exhaustive simulations. Finally, Section 5 provides the relevant discussion and drawn conclusions.
2. System Configuration and Methods
This work focuses on electric power systems that are interconnected through HVDC systems. Such networks can be found in island complexes, located far from the mainland. These networks are usually weak, and significant faults or disturbances could result in instability. Additionally, the presence of renewable energy sources (RES) in these systems reduces the stability margin of the system. OPF that incorporates transient stability analysis for this type of system constitutes a challenging problem that could provide valuable solutions for their reliable operation. Figure 1 illustrates the topology of the system being investigated.
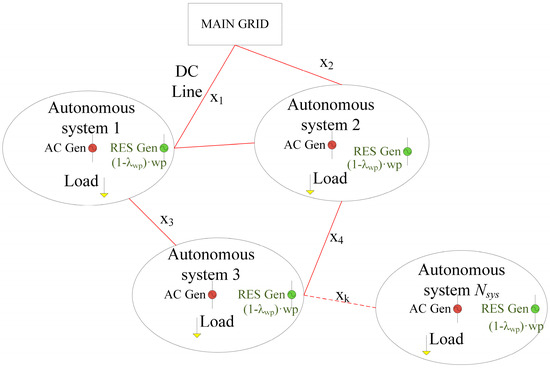
Figure 1.
Topology of the system under investigation.
The method proposed in this study is based on the consideration of various operational scenarios regarding power system loading and the amount of renewable energy source (RES) production. For each scenario, OPF is conducted to minimize the overall cost of power production. It involves the utilization of the particle swarm optimization (PSO) algorithm to calculate the optimal power transfers between the interconnected systems that lead to overall optimal operation. Moreover, suitable models of DC lines and power converters have been developed.
The flowchart in Figure 2 outlines the developed algorithm, which involves implementing the PSO method [27] for a specified number of scenarios related to system loads and wind power production. The decision variables in vector utilized by the PSO are structured as follows:
where represents the wind power production limitation factor ranging between 0 and 1, denotes the power transferred via the k-th DC line, with , and . indicates the total number of interconnections, or HVDC lines. Since the power losses of the converters are low compared to total system losses, they were neglected in this work.
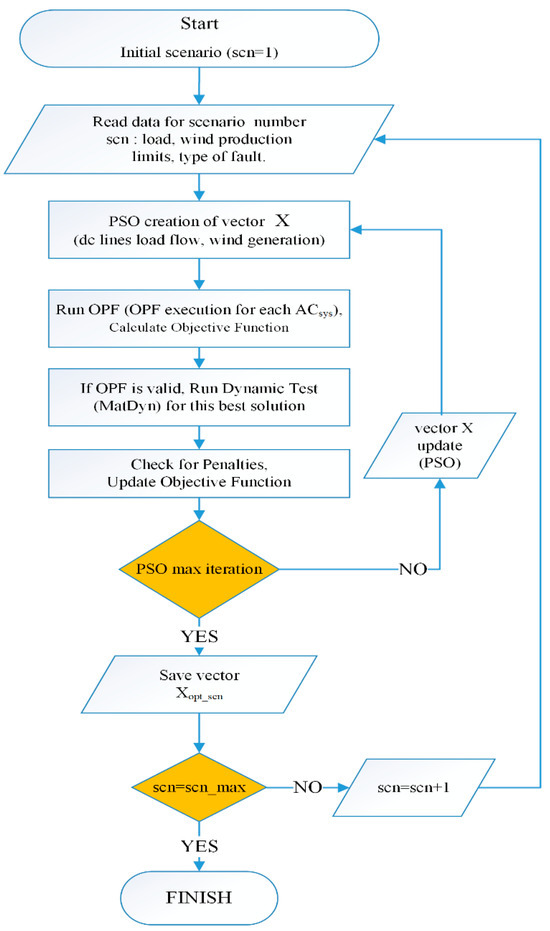
Figure 2.
Flowchart of the proposed method.
Considering that there is only one interconnection between two different power systems of the total interconnected power systems then the maximum value of is calculated as in the following:
The objective function of the OPF method is the total operation cost of the interconnected power systems. Each power system will have a minimum operation cost obtained by applying standard AC OPF calculations to each interconnected system and under an overarching optimal power dispatch to HVDC lines using the PSO method. The mathematical equations of the OPF method are not included in this paper for the sake of brevity and as it is well known in the literature. The standard AC OPF calculations can be found in [25]. The OPF solutions also ensure that all network constraints are satisfied. The objective function of the OPF problem is augmented with a penalty (Pen) representing the violation of transient stability constraints as in (3). Particle swarm optimization was used to solve the optimal operation of the interconnected power systems, considering transient stability tests as shown in Figure 2.
For each operational scenario, a PSO algorithm determines a decision vector X comprising the power flows of the DC interconnections and the wind power generation of each interconnected power systems. Given the decision vector X known, then OPF is applied to each of the interconnected power system. This involves calculating the production levels of each generator that minimize the operation cost of the power system, complying at the same time with all technical and operation constraints. Subsequently, transient stability tests are conducted, with a penalty function (Pen) triggered, and thus the solution is rejected if system instability is detected. Therefore, the final PSO optimal solution will include an assessment of the transient stability in the interconnected power systems. Dynamic models of power system components have been developed and modified for the purpose of these tests, which involve significant and critical disturbances such as three-phase short circuits, DC line openings, as well as power unit trips.
The developed algorithm utilizes bus voltages, generator angles, and speeds to determine the transient stability of the power system. A period t = tmax − tin, with a step time dt is used for the short-term transient stability test. When a significant voltage instability occurs, the corresponding penalty is applied, as depicted in Figure 3. Various voltage stability indices (VSIs) have been introduced in the literature. In [28], VSIs were reviewed by considering different aspects and viewpoints of the problem, revealing that VSIs should be based on concepts such as maximum power transferred through a line, existence of solutions for voltage equations, the Jacobian matrix, P–V curve, Lyapunov stability theory, and the maximum power transfer theorem. In [29], a systematic power system transient stability performance quantification method is proposed, which utilizes the existing North America Reliability Corporation assessment criteria. This method investigates cases of system separation, loss of sources, damping, and voltage sag during transient stability situations.
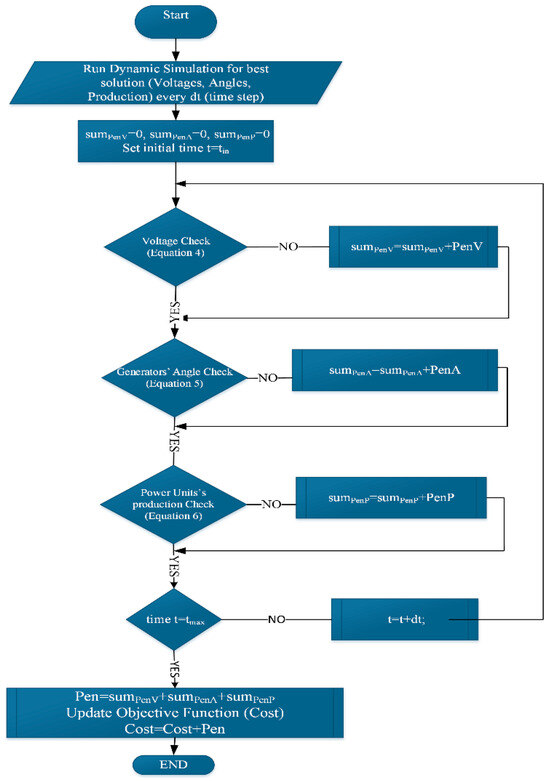
Figure 3.
Checking the results of dynamic test.
In this paper, a three-level transient stability check procedure was implemented based on voltage, frequency, and real power production variations indices. Voltage stability on the j-th bus is assessed using the range defined in (4). If the voltage falls outside of this range, the respective penalty cost PenV is included in the objective function. Frequency stability is assessed using the angles of the generators () as in inequality (5) [29]. The corresponding penalty cost is PenA if a violation occurs. The real power criterion is applied to the power generators using the constraint (6). At each time step, the power production of the total generators is calculated and compared to the steady-state operation of the specific scenario being studied (). If there is a total change in production of more than a specified amount (), the respective penalty cost is added to the objective function of the problem.
Additionally, a new voltage stability index, d, is proposed as defined in this work as shown in (7) and (8), based on the Voltage Collapse Proximity Index (VCPI) [28]. The area of voltage for each bus j (j = 1 … n) is calculated for voltages outside of the preset upper and lower limits () as described in (7) and (8). This voltage stability has been used in a MATLAB Power GUI application, created for the purpose of this work, and it is presented in the next session.
3. System Components Modelling
This section describes the mathematical models of the major power system components that were developed for this work. A typical VSC scheme was used for the converters of the HVDC transmission lines, as shown in Figure 4a.
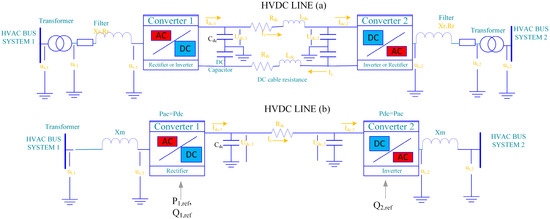
Figure 4.
HVDC system topology, converters, and DC line: (a) full model; (b) simplified model.
For each HVDC transmission system, two power converters and a DC line are utilized. Each converter is linked to an AC grid through a filter and a transformer. The DC line has been modeled using its Π-equivalent. A 2-pole DC transmission line is considered in the adopted scheme. For submarine interconnections, the use of the sea as an active part of the ground return, based on shoreline pond electrodes, has been proposed for cost limitation reasons. Refs. [30,31] present analytical models for the electric field, in shoreline pond electrode design, for a recent project, 1 GW, ±500 kV HVDC interconnection between Crete and mainland Greece. The work in [32] presents a techno-economic optimization analysis of an autonomous photovoltaic power system for the shoreline electrode substation of the above HVDC link. Figure 5 shows the block diagrams of the control systems of the power converters. More detailed analysis of the converter models can be found in [33,34]. The VSC uses a two-level pulse width modulation (PWM), where the modulation factor is the control variable. The relation between the AC and DC voltage is given as , where represents the modulation factor of the converter. Where , as it is assumed that the converter operates in rectangular modulation. The inverter controls the active power, while the rectifier of the HVDC system controls the DC voltage [35]. The reactive power can be controlled independently in each converter by the output AC voltage.
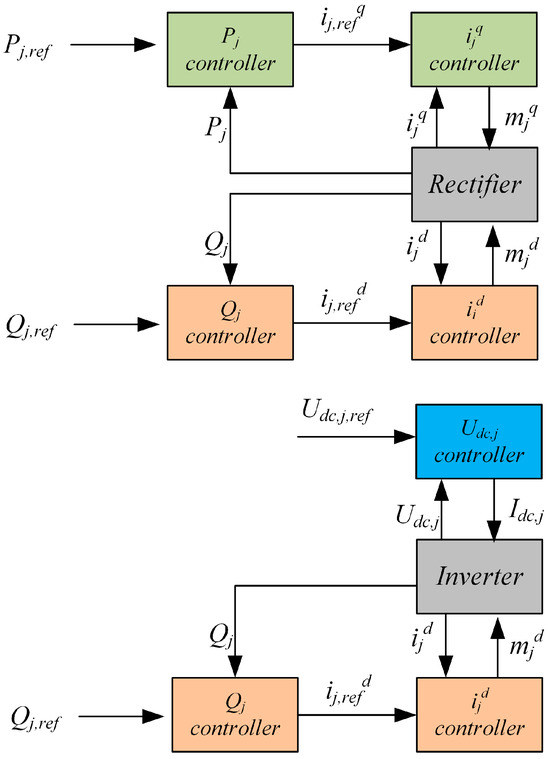
Figure 5.
Models for controlling the HVDC converters, rectifier and inverter.
The regulation of the DC voltage is achieved through active power flow control. This is possible by varying the angle of the output AC voltage. Therefore, when utilizing VSC-HVDC, it is possible to control the active power flow, reactive power flow, AC voltage, DC voltage, and support power system frequency.
Equations (9) and (10) calculate the active power () and reactive power () using the dq-axis voltage and current components. Equations (11) and (12) represent the differential equations for the current components of the filters in the dq axis. Equation (13) estimates the total capacitance of the HVDC line at each converter DC input. Equations (14)–(16) describe the operation of the DC side of the HVDC system.
where represents the voltage at the jth converter, denotes the AC grid voltage (bus of AC grid where the jth converter is connected), are the reactance and resistance of the converter output filter. indicates the AC voltage of the jth converter, represents the current to or from bus j, and is the angular velocity of the system. is the capacity of the converter plus half of DC line capacity. denotes the DC voltage at the DC side of the jth converter. Equations (14) and (15) include the differential equations of the DC side of each converter. Equation (16) accounts for the self-inductance of the DC line.
Figure 4b shows the simplified model that was used in this work. The induction has been neglected. The resistance of the filter has been neglected considering low power losses, and impedances of filter and transformer have been combined as , . Also, for simplicity and computational reasons, with the assumption of symmetry, only the one pole of the DC line was used in calculations. Equations (17)–(28) describe the operation of the HVDC rectifier as illustrated in Figure 4b and Figure 5. The variables and are computed and used as input for the model. are the outputs of the control model as described in [26]. and represent the speed and angle changes over the sample time for the dynamic model of a synchronous generator. and are the d-q components of the voltage change for the jth generator over the current sample time.
Similar equations also apply to model the operation of the inverter in the HVDC system. (29) and (30) represent a PI controller. Initially, at time t = 0, the integral value is set to 0.
The HVDC converter models have been appropriately modified to work with the MatDyn open-source software (Version 1.2). HVDC rectifier and HVDC inverter are modeled as equivalent synchronous generators. This is a widely established technique for steady-state studies (load flow calculations). For the dynamic operation of the models, appropriate adaptation has been made to the corresponding dynamic models of MatDyn software, according to the above equations. Figure 6 presents the input and output variables/magnitudes in the MATLAB R2013b (8.2.0.701) developed in this work (MatPower-MatDyn extension). The MatDyn software was extended in this work to include the two types of HVDC converters.
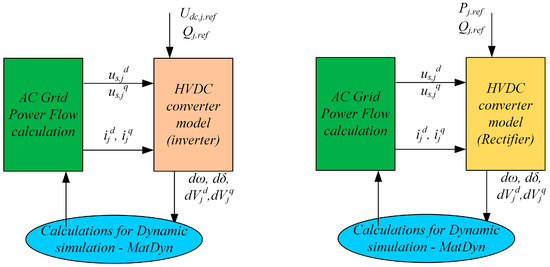
Figure 6.
HVDC converters modeling and implementation in MATLAB.
The wind generators have been modeled as depicted in Figure 7. Wind turbines with full power converters and synchronous generators were utilized. The models of the following subsystems need to be interconnected appropriately to obtain the wind turbine model:
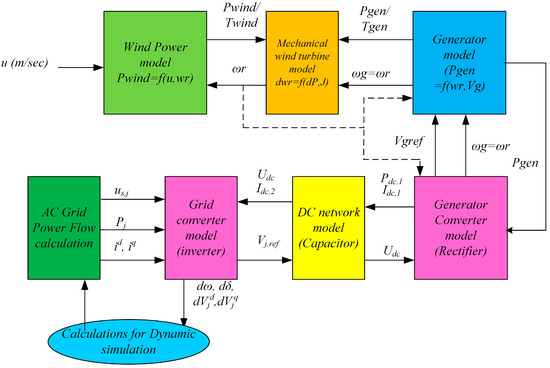
Figure 7.
Wind generator modeling.
- Wind power model
- Turbine mechanical model
- Electrical generator model
- Generator-side converter model (rectifier)
- DC side model
- Grid-side converter model (inverter)
The detailed models of all wind turbine subsystems were developed, but they are not included in this paper for the sake of brevity and because they can be found widely in the literature. The work in [36] presents a relevant wind farm analytical model for short-circuit level calculations in large power systems. Also, in [37] an optimal control method for variable-speed wind turbines (VSWTs) in islanded mode of operation is presented. The MATDYN software was also extended and modified to include these models.
To confirm the accuracy and effectiveness of the models created for this work, a comprehensive comparison was carried out using the respective models utilized in other widely used commercial software. This comparison involved testing on simpler systems with a few nodes, as well as the IEEE 9-bus system.
In summary, models were created for HVDC lines, as well as for variable speed wind turbines connected through power electronic devices in the context of this work. These models were based on established models in the literature and implemented through a wide extension and modification of MatDyn. They were also tested through comparisons with approved models of commercial software.
4. Testing the Algorithm—Case Study
A properly modified network based on the IEEE 24-bus case was modeled to test the proposed method. The IEEE 24 bus system consists of two different areas with two high voltage levels. These two areas are supposed to be connected through power transformers and AC lines. However, in this study, no AC interconnection is included. Instead, an HVDC connection between the two subsystems is used. By disconnecting these two subsystems, they become weaker compared to when they operate connected. Additionally, another system has been added, consisting of buses 25 and 26 in Figure 8. This 2-bus system acts as an infinite bus, representing a big and stable grid (main grid). The first HVDC line connects bus-25 to bus-15 and the second one connects bus-3 to bus-24, as shown in Figure 8. Furthermore, five wind parks have been connected to each of the two power systems.

Figure 8.
Examined test system.
4.1. System Data
The loads and transmission line data used in this study are the same as those of the standard IEEE 24-bus system. Power generators were grouped together without changing the total production capacity, and fuel consumption coefficients were adjusted to match the data of the IEEE 24-bus system (Table 1). Based on the literature [38], the cost of wind power production has been assumed to be constant at EUR 10/MWh. For OPF calculation, it has been considered to be zero to prevent wind generation curtailing due to its higher cost. The cost mentioned above is added after the OPF calculations for the calculated wind power generation. Based on the average cost of onshore wind parks in recent years [39], it should be higher at 20–40 EUR/MWh for financial reasons. Since buses 25–26 are part of a larger system, the fuel cost for the generator at bus 26 is clearly lower compared to the rest of the system being analyzed. Where wp represents the power production of each wind park that is set as a parameter. The total system nominal load is 2850 MW. The total installed power unit capacity is 2314 MW plus the capacity of the generator at bus no. 26 (large system). For each wind park, the nominal power production is 200 MW. wp is a parameter in the optimization problem representing the wind power generation, with the ability to be reduced if necessary to maintain system stability.

Table 1.
Data of the modified electric system under examination.
The resulting power transactions should adhere to the technical constraints of OPF equations, such as voltage, generator speeds, and current limits, as well as the corresponding transient stability limits. For the case study of this paper, was set at 30% of .
4.2. Simulation Scenarios
The MATPOWER software (Version 6.0) was used to solve the OPF problem of the system under study. In the developed PSO method, three decision variables were used (two variables for the power transfer of the two DC lines and one for wind power production curtailment), along with 10 particles and 20 epochs. The various scenarios that were conducted for wind power production and system loads are presented in Table 2. More scenarios could be tested for further investigation. However, this study aims to propose a practical tool that can identify the most effective solution (optimal solution) for a particular operational situation in the power system.

Table 2.
Examined scenarios.
The proposed method tests the system under different loading conditions, with and without interconnections, while considering its transient stability.
A 4 s period and a time step of dt = 0.01 sec were used for the short-term dynamic tests. For the purposes of this study, a smaller time step does not significantly differentiate the results. Most of the parameters used in the paper (like PI control constants, wind gens data, and DC line electrical data) are based on the cited international literature [17,26,33], where relevant sensitivity analysis is presented. The relevant data are provided in Appendix A. The PSO OPF algorithm introduced was utilized to simulate the operation of the mixed AC/DC system. Additionally, the standard AC OPF method was utilized to analyze the autonomous operation of the subsystems being examined. Through the developed code in MATLAB software, the proposed method intends to provide important conclusions and technical results to electrical power system operators, as well as to serve as a helpful tool for system planning studies in the future.
4.3. Test Results
Table 3 presents the simulation results on the total system operation cost (k$/h and in $/MWh), that have been obtained by testing the proposed method. The scenarios examined are listed in Table 2. In Table 3, Fuel Cost1 represents the fuel cost per MWh of load demand, and Fuel Cost2 represents the fuel cost per MWh generated by the conventional power units.

Table 3.
Cost per scenario.
In Figure 9, a comparison of the total fuel cost of energy produced between the interconnected and autonomous operation of the system for simulations without dynamic stability tests is given. Figure 10 presents a comparison of the total fuel cost of energy produced between the interconnected and autonomous operation of the system, including dynamic stability tests (short circuit fault at bus no. 1). The choice of bus no. 1 for the fault is indicative. Similar results are obtained for other bus-fault cases. In the test case of this paper, there was an average increase in cost of approximately 8%.
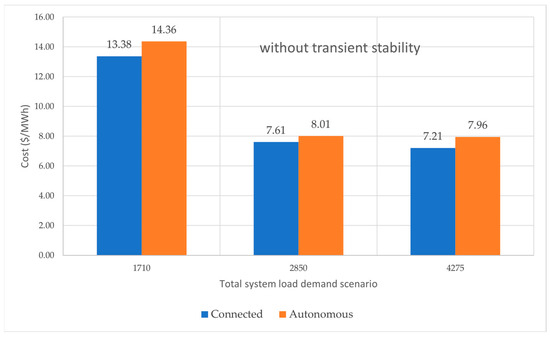
Figure 9.
Variation of system’s energy cost, without dynamic tests.
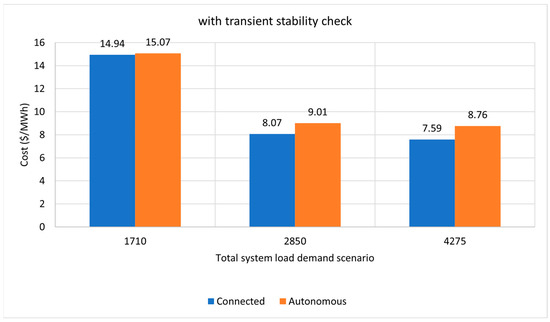
Figure 10.
Variation of system’s energy cost, considering dynamic tests.
The proposed method also calculates potential limitations on wind power generation to satisfy OPF constraints and meet dynamic criteria. Figure 11 shows the allowable wind power production for various system bus fault and loading scenarios. For the case study in this paper, an average curtailment of 45% for low load demand and 12.5% for normal load demand should be applied.
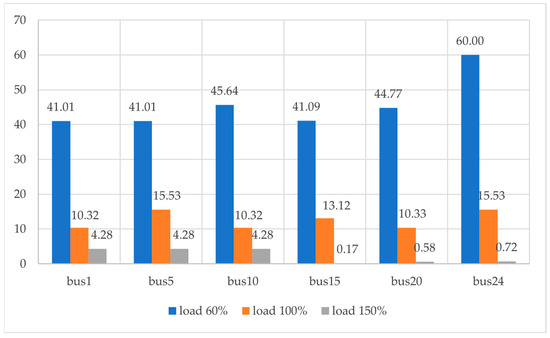
Figure 11.
Limitation (%) on wind power production—optimized wind park generation.
Limitations and changes to set points should also be applied to the power transfer on DC lines to prevent instability in the event of a particular power system fault. Figure 12 and Figure 13 demonstrate the maximum power transfer during various dynamic tests.
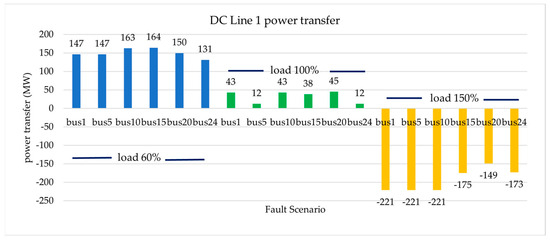
Figure 12.
DC line 1 maximum power transfer (ΜW).
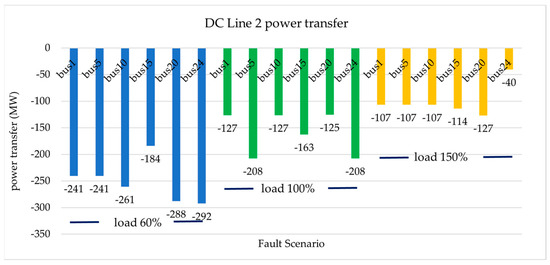
Figure 13.
DC line 2 maximum power transfer (MW).
To meet the requirements for the angles, speeds, and voltages during a significant fault, the conducted, indicated the limitations that should be imposed in certain cases. Figure 12 and Figure 13 show the results of tests for short circuit faults at buses no. 1, no. 5, no. 10, no. 15, no. 20, and no. 24 of the system under investigation, under three different loading scenarios. Table 4 presents the power transfer through the DC lines for the same loading scenarios, without fault events. In some fault cases (e.g., load 100%, fault at bus 5 and bus 24), the power transfer through DC lines is better than neglecting the transient stability study. This can be explained as, for stability reasons, a limitation in wind generation will make it necessary for the power flow on the DC lines to change in order to satisfy the load demand and OPF criteria.

Table 4.
DC lines power transfer, without stability tests.
The MatDyn software was appropriately modified by incorporating HVDC lines and converter models, as well as variable speed wind generators. Figure 14, Figure 15, Figure 16, Figure 17, Figure 18 and Figure 19 demonstrate power system magnitudes during transient stability simulations, for a test case in which a solid and balanced three-phase short circuit occurs at bus 8 at time t = 1.7 s and is cleared at time t = 1.8 s. The developed algorithm verifies magnitudes beyond certain limits and imposes penalties, as previously mentioned.
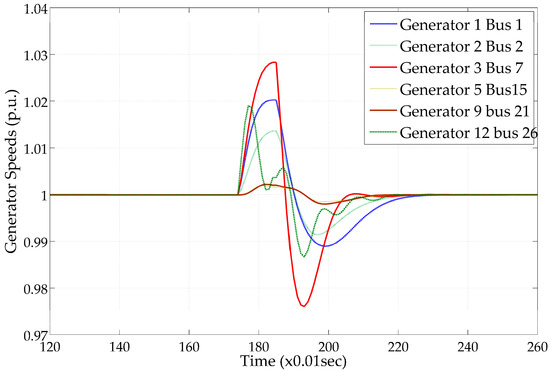
Figure 14.
Synchronous generators’ speeds.
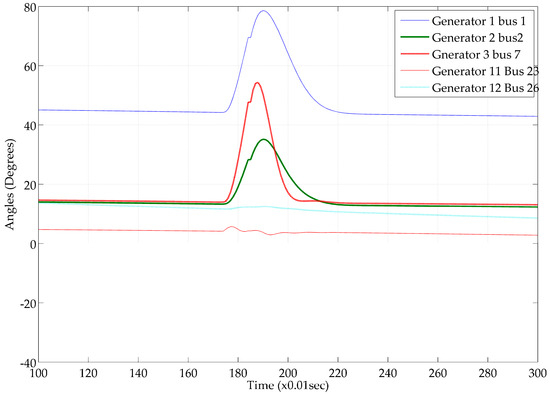
Figure 15.
Synchronous generators’ angles.
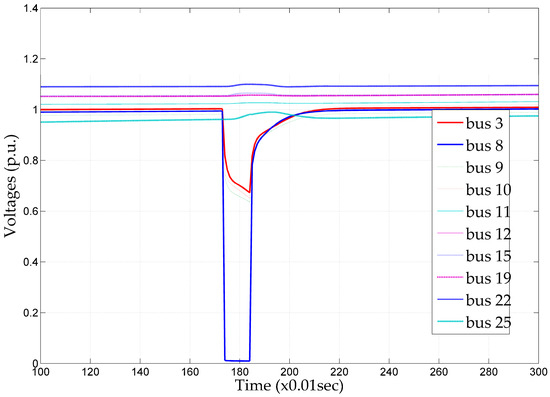
Figure 16.
Bus voltages (pu).
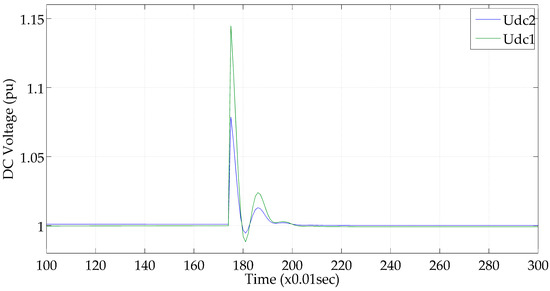
Figure 17.
DC line 2 voltage (pu).
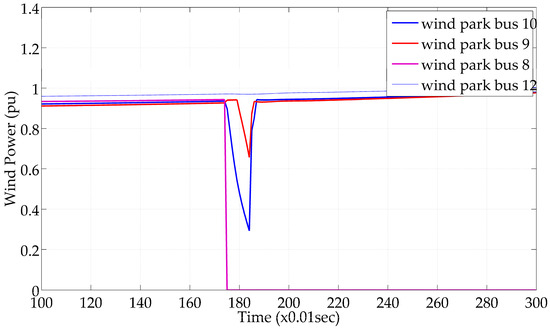
Figure 18.
Active power production of the wind parks.
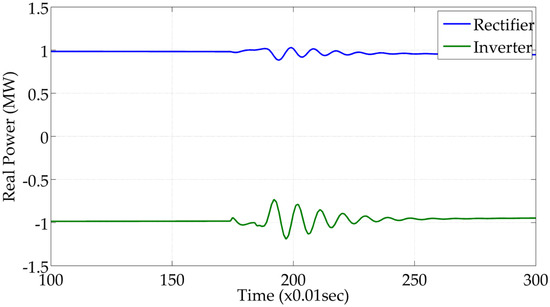
Figure 19.
Active power production of HVDC line 1.
In Figure 16, the voltages (per unit) of system scenario 3 are shown, where a balanced short circuit fault occurs on bus 8 at 1.7 s and is cleared in 1.8 s. Figure 17 shows the DC voltage variation per unit for both DC lines during the simulation period. Figure 18 displays the real power production of the wind parks connected to the system. The wind parks connected to buses 10 and 8 are disconnected due to low voltage levels.
Figure 19 shows the actual power variation for HVDC line 1. The vertical axis of the figure represents the real power in per unit, with the power base being 100 MW. This means that 100 MW is being transferred through the HVDC line. The significant fluctuations last for approximately half a second, with a maximum deviation of about 25 MW.
More specifically, based on the results of the simulations, the following can be noted:
- Wind turbines disconnect and go out of operation in case of significant errors near their area, despite FRT operation. This affects the overall capacity of RES that can participate in the scenario under examination.
- Adopting short-term stability control does not significantly affect the load of HVDC lines. This is a result of the fast response of electronic devices. The modification is important for very specific errors. However, the case of losing a highly loaded HVDC line should be examined.
- In every case of load demand, when we have interconnected systems, operational cost is lower compared to the autonomous operation.
The above conclusions have been validated by testing the proposed method on other test cases (ieee9-bus, ieee14-bus modified test systems, as well as in a simplified model of the real system of islands Crete and Cyprus). However, in this paper the well-known test case of ieee24-bus is presented.
4.4. Graphic User Interface Development
A MATLAB POWER GUI application was created for the test case system, utilizing a specific part of the proposed method as shown in Figure 20. The user of the application enters the scenarios of system loading and wind power generation. The application utilizes the PSO algorithm to compute DC line power transactions and total system optimum cost. Additionally, the user can perform a transient stability test for three-phase short circuits at a selected bus of the network. The application displays the voltages of system buses, along with the value of the voltage stability index introduced in this paper in (7) and (8).
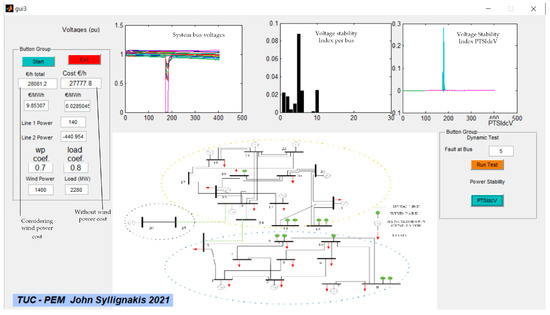
Figure 20.
MATLAB power GUI application (examined test case system).
5. Discussion and Conclusions
This work aims to contribute to studies on the optimal operation of mixed AC/DC power systems, including very short-term dynamic operation. The simulations that took place for the network under consideration clearly differentiate the results when considering the dynamic stability of the system. The test scenarios and stability criteria follow the common practice adopted in similar studies. A distinct advantage of this work is that it can validate or reject an optimal steady-state solution during the optimization process, taking into consideration additional criteria like transient stability indices, using a fast algorithm and software.
The MATLAB MatDyn software was modified and extended for the purposes of this work. A detailed model of the voltage source converter high voltage direct current (VSC HVDC) system, as well as a model of a full converter wind generator, including both the AC side and DC side, as well as the coupling between AC and DC and the control systems, was developed. The simplified models, obtained by neglecting small time constants, exhibit similar overall behavior to the complete model. This simplification offers numerous benefits, such as fewer equations, reduced data requirements, and larger time step sizes. DQ-axis models were employed for all examined power system components. The required execution time (duration of simulation) is significantly shorter compared to respective MATLAB Simulink tests. Valuable information can be gathered from transient stability tests, including the status of wind generators (disconnections), deviation of system frequency, and the power production of generators. One conclusion from this work is that including dynamic stability constraints in OPF studies can lead to more conservative but safer results. Additionally, it could be noted that power production from renewable energy sources sometimes should be limited for stability reasons. This may result, in some cases, in a re-evaluation of the planned overall installed capacity of renewable energy sources.
Wind generation non-fixed cost has a significant role. However, this work focuses on the technically acceptable power limits of wind parks. For this reason, wind generation was not considered in the calculations of the optimal load flow, assuming only its fixed cost. It is possible to include an appropriate cost model of wind generation in future work, which will be taken into consideration in the optimal load flow calculations. In the present work, it is considered that the absorbed wind power is the maximum technically possible, and it is remunerated at an average fixed price.
Author Contributions
Conceptualization, J.E.S. and F.D.K.; methodology, J.E.S. and F.D.K.; software, J.E.S.; validation, J.E.S. and F.D.K.; formal analysis, J.E.S.; investigation, J.E.S. and F.D.K.; data curation, J.E.S.; writing—original draft preparation, J.E.S.; writing—review and editing, J.E.S. and F.D.K.; visualization, J.E.S.; supervision, F.D.K. All authors have read and agreed to the published version of the manuscript.
Funding
This research received no external funding.
Data Availability Statement
The original contributions presented in the study are included in the article, further inquiries can be directed to the corresponding author.
Acknowledgments
The authors are thankful to the Departments of Electrical Engineering and Production and Management Engineering, Technical University of Crete, Chania-Greece, for providing facilities to conduct this research.
Conflicts of Interest
The authors declare no conflicts of interest.
Nomenclature
| Abbreviation | Meaning |
| HVDC | High voltage direct current |
| HVAC | High voltage alternating current |
| PLL | Phase locked loop |
| VSC | Voltage source converter |
| RES | Renewable energy sources |
| OPF | Optimal power flow |
| PSO | Particle swarm optimization |
| pu | Per unit |
| Variables | |
| Pen | Penalty |
| P, Q | Real power, reactive power |
| V, δ | Bus voltage, angle |
| u, i | Converter voltage, current |
| Udc, Idc | DC voltage, DC current |
| d | Voltage stability index |
| t | Time |
| Constants | |
| Capacitance, resistance of DC line | |
| Xr | HVDC filter impedance |
| Rr | HVDC filter resistance |
| ω | Circular speed |
| Wp | Wind power production coefficient |
| ld | Load coefficient |
| dt | Dynamic simulation step time |
| Indices | |
| j, f | Bus or converter number |
| ref | Reference |
| int | Internal |
| k | Number of HVDC line |
| sys | Number of autonomous system |
| scn | Scenario number |
Appendix A
Parameters for modified IEEE24-bus test case system:
- Current controllers ,
- Real power controllers ,
- Reactive power controllers ,
- DC voltage controllers ,
- HVDC line data (p.u.): Rdc = 0.05, Xm = 0.2, Cdc = 0.05, Sbase = 100 MVA, Vbase,AC = 132 kV, Vbase,DC = 250 kV.
References
- Haileselassie, T.M.; Uhlen, K. Power system security in a meshed north sea HVDC grid. Proc. IEEE 2013, 101, 978–990. [Google Scholar] [CrossRef]
- ABB Group. ABB Review. Special Report—60 Years of HVDC; ABB Group, Editorial Council: Zurich, Switzerland, 2014; ISSN 1013-3119. [Google Scholar]
- Khazaei, J.; Idowu, P.; Asrari, A.; Shafaye, A.B.; Piyasinghe, L. Review of HVDC control in weak AC grids. Electr. Power Syst. Res. 2018, 162, 194–206. [Google Scholar] [CrossRef]
- Kabouris, J.; Kanellos, F.D. Impacts of large-scale wind penetration on energy supply industry. Energies 2009, 2, 1031–1041. [Google Scholar] [CrossRef]
- IEEE Std 1204-1997; IEEE Guide for Planning DC Links Terminating at AC Locations Having Low Short-Circuit Capacities, Part I: AC/DC System Interaction Phenomena. IEEE: Piscataway, NJ, USA, 1997.
- Lin, Y.; Lin, Z.; Qiu, L.; Zhang, M. An improved approach on static security constrained OPF for AC/DC meshed grids with MMC-HVDC. In Proceedings of the IEEE PES Asia Pacific Power and Energy Conference, Xi’an, China, 25–28 October 2016; pp. 1–7. [Google Scholar]
- Saplamidis, V.; Wiget, R.; Andersson, G. Security constrained optimal power flow formixed AC and multi-terminal HVDC grids. In Proceedings of the IEEE Eindhoven PowerTech, Eindhoven, The Netherlands, 29 June–2 July 2015; pp. 1–6. [Google Scholar]
- Chatzivasileiadis, S.; Andersson, G. Security constrained OPF incorporating corrective control of HVDC. In Proceedings of the Power Systems Computation Conference (PSCC), Wroclaw, Poland, 18–22 August 2014. [Google Scholar]
- Yang, Z.; Zhong, H.; Bose, A.; Xia, Q.; Kang, C. Optimal power flow in AC-DC grids with discrete control devices. IEEE Trans. Power Syst. 2017, 32, 1461–1472. [Google Scholar] [CrossRef]
- Ayan, K.; Kilic, U. Optimal power flow of two-terminal systems using backtracking search algorithm. Electr. Power Syst. Res. 2016, 78, 326–335. [Google Scholar] [CrossRef]
- Nanou, S.I.; Tzortzopoulos, O.D.; Papathanassiou, A. Evaluation of an enhanced power dispatch control scheme for multi-terminal HVDC grids using Monte-Carlo simulation. Electr. Power Syst. Res. 2016, 140, 925–932. [Google Scholar] [CrossRef]
- Aragues-Penalba, M.; Beerten, J.; Rimez, J.; Hertem, D.V.; Gomis-Bellmunt, O. Optimal power flow tool for hybrid AC/DC systems. In Proceedings of the IET International Conference on AC and DC Power Transmission, Birmingham, UK, 10–12 February 2015; pp. 1–7. [Google Scholar]
- Aragues-Penalba, M.; Alvarez, A.E.; Galceran-Arellano, S.; Gomis-Bellmunt, O. Optimal power flow tool for mixed high-voltage alternating current and high-voltage direct current systems for grid integration of large wind power plants. IET Renew. Power Gen. 2015, 9, 876–881. [Google Scholar] [CrossRef]
- Gonzalez-Longatt, F.M. Optimal power flow in multi-terminal HVDC networks for dc system operator: Constant current operation. In Proceedings of the 2015 50th International Universities Power Engineering Conference (UPEC), Stoke on Trent, UK, 1–4 September 2015; pp. 1–6. [Google Scholar]
- Baradar, M.; Hesamzadeh, M.R.; Ghandhari, M. Modelling of Multi-terminal HVDC Systems in optimal power flow Formulation. In Proceedings of the IEEE Electrical Power and Energy Conference (EPEC), London, ON, Canada, 10–12 October 2012. [Google Scholar]
- Alshammari, K.; Alsiraji, H.A.; El Shatshat, R. Optimal Power Flow in Multi-Terminal HVDC Systems. In Proceedings of the 2018 IEEE Electrical Power and Energy Conference (EPEC), Toronto, ON, Canada, 10–11 October 2018; pp. 1–6. [Google Scholar] [CrossRef]
- Castro, L.M.; Acha, E. A unified modeling approach of multi-terminal VSC-HVDC links for dynamic simulations of large-scale power systems. IEEE Trans. Power Syst. 2016, 31, 5051–5060. [Google Scholar] [CrossRef]
- Acha, E.; Castro, L.M. A generalized frame of reference for the incorporation of multiterminal VSC-HVDC systems in power flow solutions. Electr. Power Syst. Res. 2016, 136, 415–424. [Google Scholar] [CrossRef]
- Castro, L.M.; Tovar-Hernández, J.H.; González-Cabrera, N.; Rodríguez-Rodríguez, J.R. Real-power economic dispatch of AC/DC power transmission systems comprising multiple VSC-HVDC equipment. Int. J. Electr. Power Energy Syst. 2019, 107, 140–148. [Google Scholar] [CrossRef]
- Wang, D.; Hou, Y.; Hu, J. Effect of AC voltage control on the stability of weak AC grid connected DFIG system. In Proceedings of the 2016 IEEE PES Asia-Pacific Power and Energy Engineering Conference (APPEEC), Xi’an, China, 25–28 October 2016; pp. 1528–1533. [Google Scholar] [CrossRef]
- Song, Y.; Breitholtz, C. Nyquist stability analysis of an AC-grid connected VSC-HVDC system using a distributed parameter DC cable model. IEEE Trans. Power Deliv. 2016, 31, 898–907. [Google Scholar] [CrossRef]
- Zhou, J.Z.; Ding, H.; Fan, S.; Zhang, Y.; Gole, A.M. Impact of Short-Circuit Ratio and Phase-Locked-Loop Parameters on the Small-Signal Behavior of a VSC-HVDC Converter. IEEE Trans. Power Deliv. 2014, 29, 2287–2296. [Google Scholar] [CrossRef]
- Jiang, H.; Zhou, Y.; Gao, Y.; Gao, S. Droop Frequency Limit Control and Its Parameter Optimization in VSC-HVDC Interconnected Power Grids. Energies 2024, 17, 3851. [Google Scholar] [CrossRef]
- Jing, L.; Wei, J.; Xia, L.; Fan, Z.; Zhou, J. An Improved Power-Sharing Method for a Multi-Terminal HVDC Transmission System Based on Adaptive Voltage Droop Control. Energies 2023, 16, 6276. [Google Scholar] [CrossRef]
- Zimmerman, R.D.; Murillo-Sanchez, C.E.; Thomas, R.J. MATPOWER: Steady-State Operations, Planning and Analysis Tools for Power Systems Research and Education. IEEE Trans. Power Syst. 2011, 26, 12–19. [Google Scholar] [CrossRef]
- Cole, S.; Belmans, R. MatDyn, A New Matlab-Based Toolbox for Power System Dynamic Simulation. IEEE Trans. Power Syst. 2011, 26, 1129–1136. [Google Scholar] [CrossRef]
- Syllignakis, J.E.; Kanellos, F.D. A PSO Optimal Power Flow (OPF) Method for Autonomous Power Systems Interconnected with HVDC Technology. Electr. Power Compon. Syst. 2021, 49, 67–78. [Google Scholar] [CrossRef]
- Modarresi, J.; Gholipour, E.; Khodabakhshian, A. A comprehensive review of the voltage stability indices. Renew. Sustain. Energy Rev. 2016, 63, 1–12. [Google Scholar] [CrossRef]
- Chen, S.; Onwuachumba, A.; Musavi, M.; Lerley, P. A quantification index for power systems transient stability. Energies 2017, 10, 984. [Google Scholar] [CrossRef]
- Kontargyri, V.T.; Tsekouras, G.J.; Prousalidis, J.M.; Tsirekis, C.D.; Leontaritis, K.; Alexandris, J.C.; Kanellos, F.D.; Deligianni, P.M.; Kontaxis, P.A.; Moronis, A.X. Comparison of Different Configurations for Shoreline Pond Electrode Station for HVDC Transmission Systems—Part I: Electric Field Study for Frames of Linear Electrode Arrangement Based on a Simplified Analytical Model. Appl. Sci. 2023, 13, 7136. [Google Scholar] [CrossRef]
- Tsekouras, G.J.; Kontargyri, V.T.; Prousalidis, J.M.; Kanellos, F.D.; Tsirekis, C.D.; Leontaritis, K.; Alexandris, J.C.; Deligianni, P.M.; Kontaxis, P.A.; Moronis, A.X. Alternative Simplified Analytical Models for the Electric Field, in Shoreline Pond Electrode Preliminary Design, in the Case of HVDC Transmission Systems. Energies 2022, 15, 6493. [Google Scholar] [CrossRef]
- Deligianni, P.M.; Tsekouras, G.J.; Tsirekis, C.D.; Kontargyri, V.T.; Kanellos, F.D.; Kontaxis, P.A. Techno-economic optimization analysis of an autonomous photovoltaic power system for a shoreline electrode station of HVDC link: Case study of an electrode station on the small Island of stachtoroi for the attica-crete interconnection. Energies 2020, 13, 5550. [Google Scholar] [CrossRef]
- Imhof, M.; Andersson, G. Dynamic modeling of a VSC-HVDC converter. In Proceedings of the Universities Power Engineering Conference, (Vsc 2), Dublin, Ireland, 2–5 September 2013. [Google Scholar] [CrossRef]
- Wang, Y.; Zhao, S.Z.; Huangfu, C.; Ruan, J.J. Dynamic model and control of voltage source converter based HVDC. In Proceedings of the Asia-Pacific Power and Energy Engineering Conference, APPEEC, Wuhan, China, 27–31 March 2009; pp. 1–5. [Google Scholar] [CrossRef]
- Meier, S. Novel Voltage Source Converter based HVDC Transmission System for Offshore Wind Farms; Department of Electrical Engineering Electrical Machines and Power Electronics, Royal Institute of Technology: Stockholm, Sweden, 2005. [Google Scholar]
- Kanellos, F.D.; Kabouris, J. Wind farms modeling for short-circuit level calculations in large power systems. IEEE Trans. Power Deliv. 2009, 24, 1687–1695. [Google Scholar] [CrossRef]
- Kanellos, F.D.; Hatziargyriou, N.D. Optimal control of variable speed wind turbines in islanded mode of operation. IEEE Trans. Energy Convers. 2010, 25, 1142–1151. [Google Scholar] [CrossRef]
- Khamees, A.K.; Abdelaziz, A.Y.; Eskaros, M.R.; El-Shahat, A.; Attia, M.A. Optimal power flow solution of wind-integrated power system using novel metaheuristic method. Energies 2021, 14, 6117. [Google Scholar] [CrossRef]
- Beiter, P.; Cooperman, A.; Lantz, E.; Stehly, T.; Shields, M.; Wiser, R.; Telsnig, T.; Kitzing, L.; Berkhout, V.; Kikuchi, Y. Wind power costs driven by innovation and experience with further reductions on the horizon. WIREs Energy Environ. 2021, 10, e398. [Google Scholar] [CrossRef]
Disclaimer/Publisher’s Note: The statements, opinions and data contained in all publications are solely those of the individual author(s) and contributor(s) and not of MDPI and/or the editor(s). MDPI and/or the editor(s) disclaim responsibility for any injury to people or property resulting from any ideas, methods, instructions or products referred to in the content. |
© 2024 by the authors. Licensee MDPI, Basel, Switzerland. This article is an open access article distributed under the terms and conditions of the Creative Commons Attribution (CC BY) license (https://creativecommons.org/licenses/by/4.0/).