1. Introduction
As global electricity consumption increases, many power plants are being constructed to increase power supply capacity. Most of these power plants are located far from major demand centers, resulting in significant losses due to long-distance transmission. To mitigate these losses, the transmission voltage is being increased. However, despite this increase, existing AC transmission lines are approaching their capacity limits due to the continued growth in power demand [
1,
2].
Medium-voltage direct current (MVDC) can be efficiently utilized in the integration of renewable energy sources such as wind farms and solar power generation. Furthermore, MVDC offers the advantage of enhancing transmission capacity [
3]. For high-capacity power, the increase in current leads to an increase in heat loss, ultimately posing a risk of reaching the maximum allowable temperature of the insulation material. Thus, the increase in permissible temperature is directly linked to the increase in transmission capacity. The most used insulator for power cables is cross-linked polyethylene (XLPE), which has a permissible temperature of 90 °C. In this study, polypropylene (PP), a thermoplastic material, was considered to increase the maximum allowable temperature of the insulator.
Since the allowable temperature of PP is 110 °C, the transmission capacity can be increased compared to XLPE. PP can accelerate production because it does not require a cross-linking process, and carbon dioxide reduction effects can be expected due to the absence of cross-linking by-products. Furthermore, it possesses the advantage of being recyclable as a thermoplastic material, making it environmentally friendly [
2,
4,
5,
6].
Due to its high rigidity and limited flexibility, PP material may pose difficulties in cable installation. To address these issues, one can blend an elastomer material or polyethylene (PE) material such as low-density polyethylene (LDPE) into PP to enhance flexibility [
7,
8]. When PP is subjected to a certain level of mechanical stress, white spots appear on the insulator, a phenomenon referred to as stress whitening. Stress whitening is observable to the naked eye and can cause a decrease in properties such as tensile strength and breakdown (BD) strength by creating cracks within the insulator [
9,
10,
11].
BD strength is an important factor used to determine if an insulator can withstand high voltages [
12]. It is utilized in the design of insulation thickness and the estimation of design lifespan. The BD strength of PP varies depending on the arrangement of its molecular structure. Especially, PP forms spherulites of a spherical shape during the process of crystallization. The size of these spherulites is determined by factors such as thermal history, temperature, and cooling rate gradient. Generally, there is a tendency for the BD strength to decrease as the size of the spherulites increases [
13].
The extruded cable exhibits variations in thermal conductivity depending on the insulation material used. The performance of the insulator may vary based on the extrusion conditions. PP and XLPE also have different thermal conductivities. In general, the thermal conductivity of XLPE is 0.22 W/mK at room temperature, while the thermal conductivity of PP ranges from 0.1 to 0.2 W/mK [
14,
15]. The inner section of the insulation layer in an extruded power cable is closer to the conductor and experiences a somewhat slower cooling rate, while the outer section, closer to the sheath, has a faster cooling rate. This difference in cooling rate causes a variation in the crystallinity of PP, which in turn leads to a change in BD strength.
In this study, experiments were conducted to develop an MVDC PP extruded cable. First, the DC BD strength of PP specimens was examined under different cooling conditions. Second, the AC and DC BD strength properties of the extruded cable were compared.
The evaluation targets for PP specimens were ambient air, cooling press, and water cooling under different cooling conditions. These three conditions simulated scenarios of both fast and slow cooling speeds.
The evaluation of BD strength in extruded cables focused on assessing uniformity by comparing the BD strength of insulators at different positions. The evaluation targets were MV-class DC PP model cables, commercial AC PP cables, and commercial AC XLPE cables. The BD strength evaluation method involved processing the insulator of the cable into a ribbon shape and comparing it with a DC cable and two types of AC cables of the same grade. To evaluate the uniformity of BD strength, insulators that had been processed into specimens were divided into five sections, and the BD strength of each section was compared. The BD strength was evaluated by applying AC and DC voltages separately. Both AC and DC voltages were used as test voltages due to the absence of commercial-grade MV-level DC cables and to test the DC voltage operation of AC cables.
If the uniformity of BD strength is not ensured in the insulating layer of the extruded cable, localized electric fields can become concentrated within the insulator, leading to serious risks during operation, such as dielectric breakdown.
This study distinguishes itself from others as it examines the uniformity of extruded PP cables based on BD strength performance and thickness. Furthermore, the feasibility of using insulators for MVDC cables was evaluated by assessing the AC and DC BD strengths of the tested insulator.
The structure of this paper is as follows: In
Section 2, the experimental setup for evaluating the BD strength of extruded cables under various cooling conditions is described. In
Section 3, the results of the BD strength evaluation are presented and visualized. In
Section 4, the evaluation results are discussed, and the limitations of the experimental method are mentioned.
Section 5 provides a summary of the experimental findings of the study.
2. Configuration of Experiments
2.1. Cooling Conditions of PP Specimens
Since the formation of spherulites in PP insulators depends on the cooling conditions, this study aimed to examine the changes in BD strength under different conditions. The PP material used for examining the cooling conditions was determined from previous research [
16,
17]. The PP specimens were fabricated using a hot press and subsequently cooled. The hot press maintained a pressure of 30 MPa at a temperature of 200 °C for 5 min.
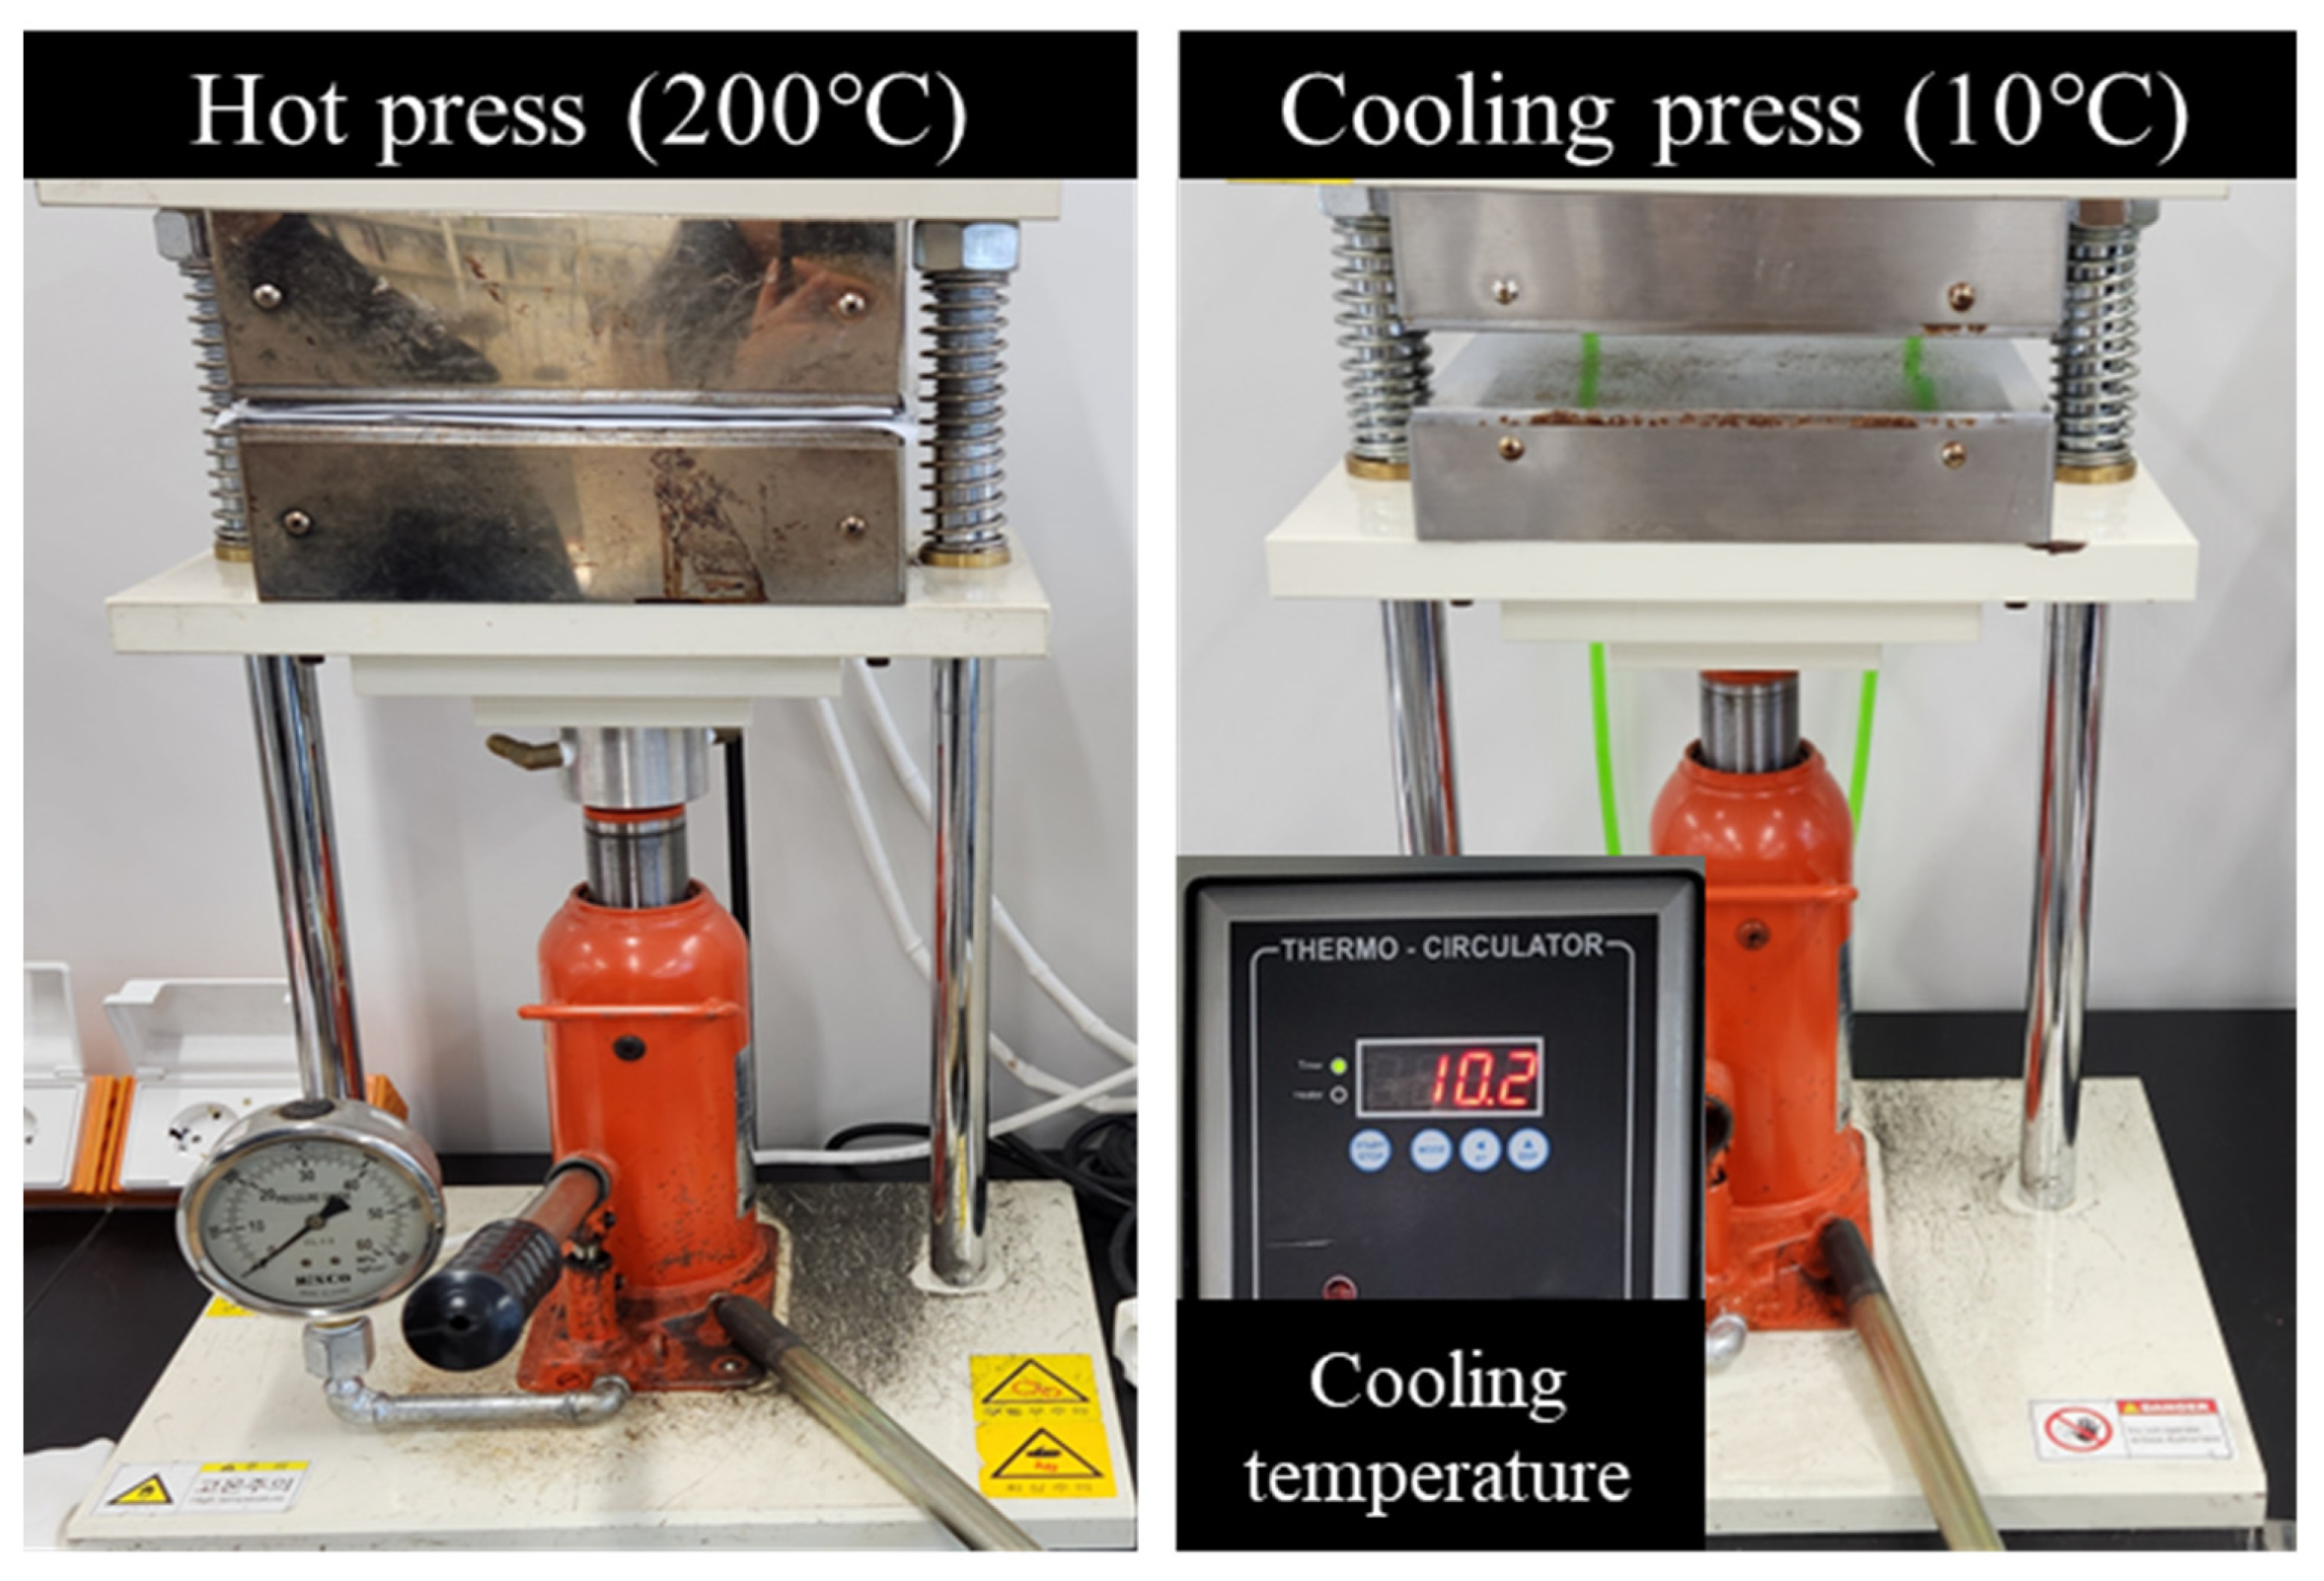
Figure 1 shows the configuration of the hot press and cooling press. The following three cooling conditions were considered:
Ambient air
Water cooling
Cooling press
The ambient air cooling was conducted at room temperature. The water-cooling process involved cooling in water at a temperature of 18 °C. The cooling press was set to a temperature of 10 °C for 5 min under a pressure of 30 MPa.
The BD strength test involved conducting a short-term DC BD test. This method applies voltage at a fixed elevation rate until dielectric breakdown occurs. An analysis of the BD strength properties is performed by converting the dielectric breakdown voltage into an electric field. The electrodes used in the test were cylindrical and flat, with their shape and size determined based on the specifications of IEC 60243. The cylindrical electrode had a diameter of 25 mm and a height of 30 mm, while the flat electrode was circular with a diameter of 70 mm. The cylindrical electrode was connected to the high-voltage section, while the flat electrode was connected to the ground. The maximum voltage of the DC intrinsically safe barrier was set to 80 kV, and the voltage elevation rate was set at 1 kV/s. The test was conducted inside silicone oil to prevent creeping discharge.
2.2. Evaluation of Uniformity of Extruded Cable’s BD Strength
Unlike XLPE, PP has low thermal conductivity, which can make it difficult to transfer heat to the interior of the insulator during cable extrusion. This can cause uneven BD strength in the insulator depending on the cooling rate after extrusion [
18]. Accordingly, to apply PP insulation material to power cables, it is necessary to verify the uniformity of BD strength.
The evaluation targets for the extruded cable were MV-class DC PP model cable (PP1), commercial AC PP cable (PP2), and commercial AC XLPE cable. The BD strength of each cable was evaluated by applying AC and DC voltages separately. The electrode systems used in each test were cylindrical and flat, identical to those used for the cooling conditions review. For the BD strength evaluation, the insulator of the PP model cable was processed into a specimen and compared with the two types of AC cables of the same grade.
The PP1 cable used in the experiment consists of an aluminum conductor with an insulation thickness of 6.6 mm. The PP2 cable also has an aluminum conductor but with an insulation thickness of 7.5 mm. The XLPE commercial cable consists of a copper conductor with an insulation thickness of 6.6 mm. All cables have internal and external insulation layers with a thickness of 1 mm.
The specimen retains its curvature because it was processed along the cylindrical shape of the cable. If the specimen is bent during the experiment, a gap may occur between the specimen and the electrode, making it difficult to measure the true breakdown voltage. To prevent this, the specimen underwent a high-temperature annealing process. The temperature of the annealing process was selected as 80 °C. The temperature was selected in consideration of the maximum allowable temperature of XLPE of 90 °C to minimize the effect of thermal stress on the performance change of the insulator during annealing.
To evaluate the uniformity of BD strength, the extruded cables were divided into five sections of equal length, and the BD strength of each section was compared.
Figure 2 depicts the cross-sectional view of the cable before the experiment, the processed shape of the specimen, and its division into five sections. The evaluation was conducted on the following sections: the outer section closest to the external semiconductor, the middle section located at the center, the three sections close to the inner conductor, and the two inner sections.
Figure 3 illustrates the electrode system used in the experiment.
The evaluation of BD strength was conducted by applying AC and DC test voltages separately. The AC BD strength evaluation was carried out to compare the insulators of AC cables, given the absence of commercial MVDC cables. Approximately 10 data points were obtained from the measurements of each section. The comparison of experimental results was conducted using the Weibull function. The analysis and visualization of the experimental results were performed using the commercial tool Weibull++ 2023.
Table 1 details the experimental conditions. During the AC test, the ramp voltage was applied at an elevation rate of 1 kV/s. The maximum applied voltage of the AC inner voltage device was 100 kV. The DC test was conducted using the same configuration as the cooling conditions review.
3. Experiment Results
3.1. DC BD According to Cooling Conditions of PP Specimen
The cooling conditions were ambient air, cooling press, and water cooling. Five data points were obtained from each short-term evaluation of DC BD strength. The results are shown in
Table 2. The cooling conditions included room temperature, 18 °C, and 10 °C.
Under ambient air conditions, the PP did not fail at the maximum DC voltage of 80 kV. Three out of five samples failed under the water-cooling condition, with an average BD strength of 307.4 kV/mm for the failed samples. Under the cooling press condition, all five samples experienced breakdown, with an average BD strength of 234 kV/mm. The experiment results confirmed that the DC BD strength varies depending on the cooling condition. Further discussion on this matter is presented in
Section 4.
3.2. Evaluation Result of Uniformity of Extruded Cable’s BD Strength
The AC and DC short-term BD strength tests were conducted on PP1, PP2, and XLPE for each section. The evaluation of the AC BD strength was performed on the inner, middle, and outer sections. For the DC BD strength, five sections were evaluated. Five data points were obtained for each section. If samples exhibited significant thickness variations or instances of creeping discharge, additional experiments were conducted to ensure an equal number of samples for accurate comparison.
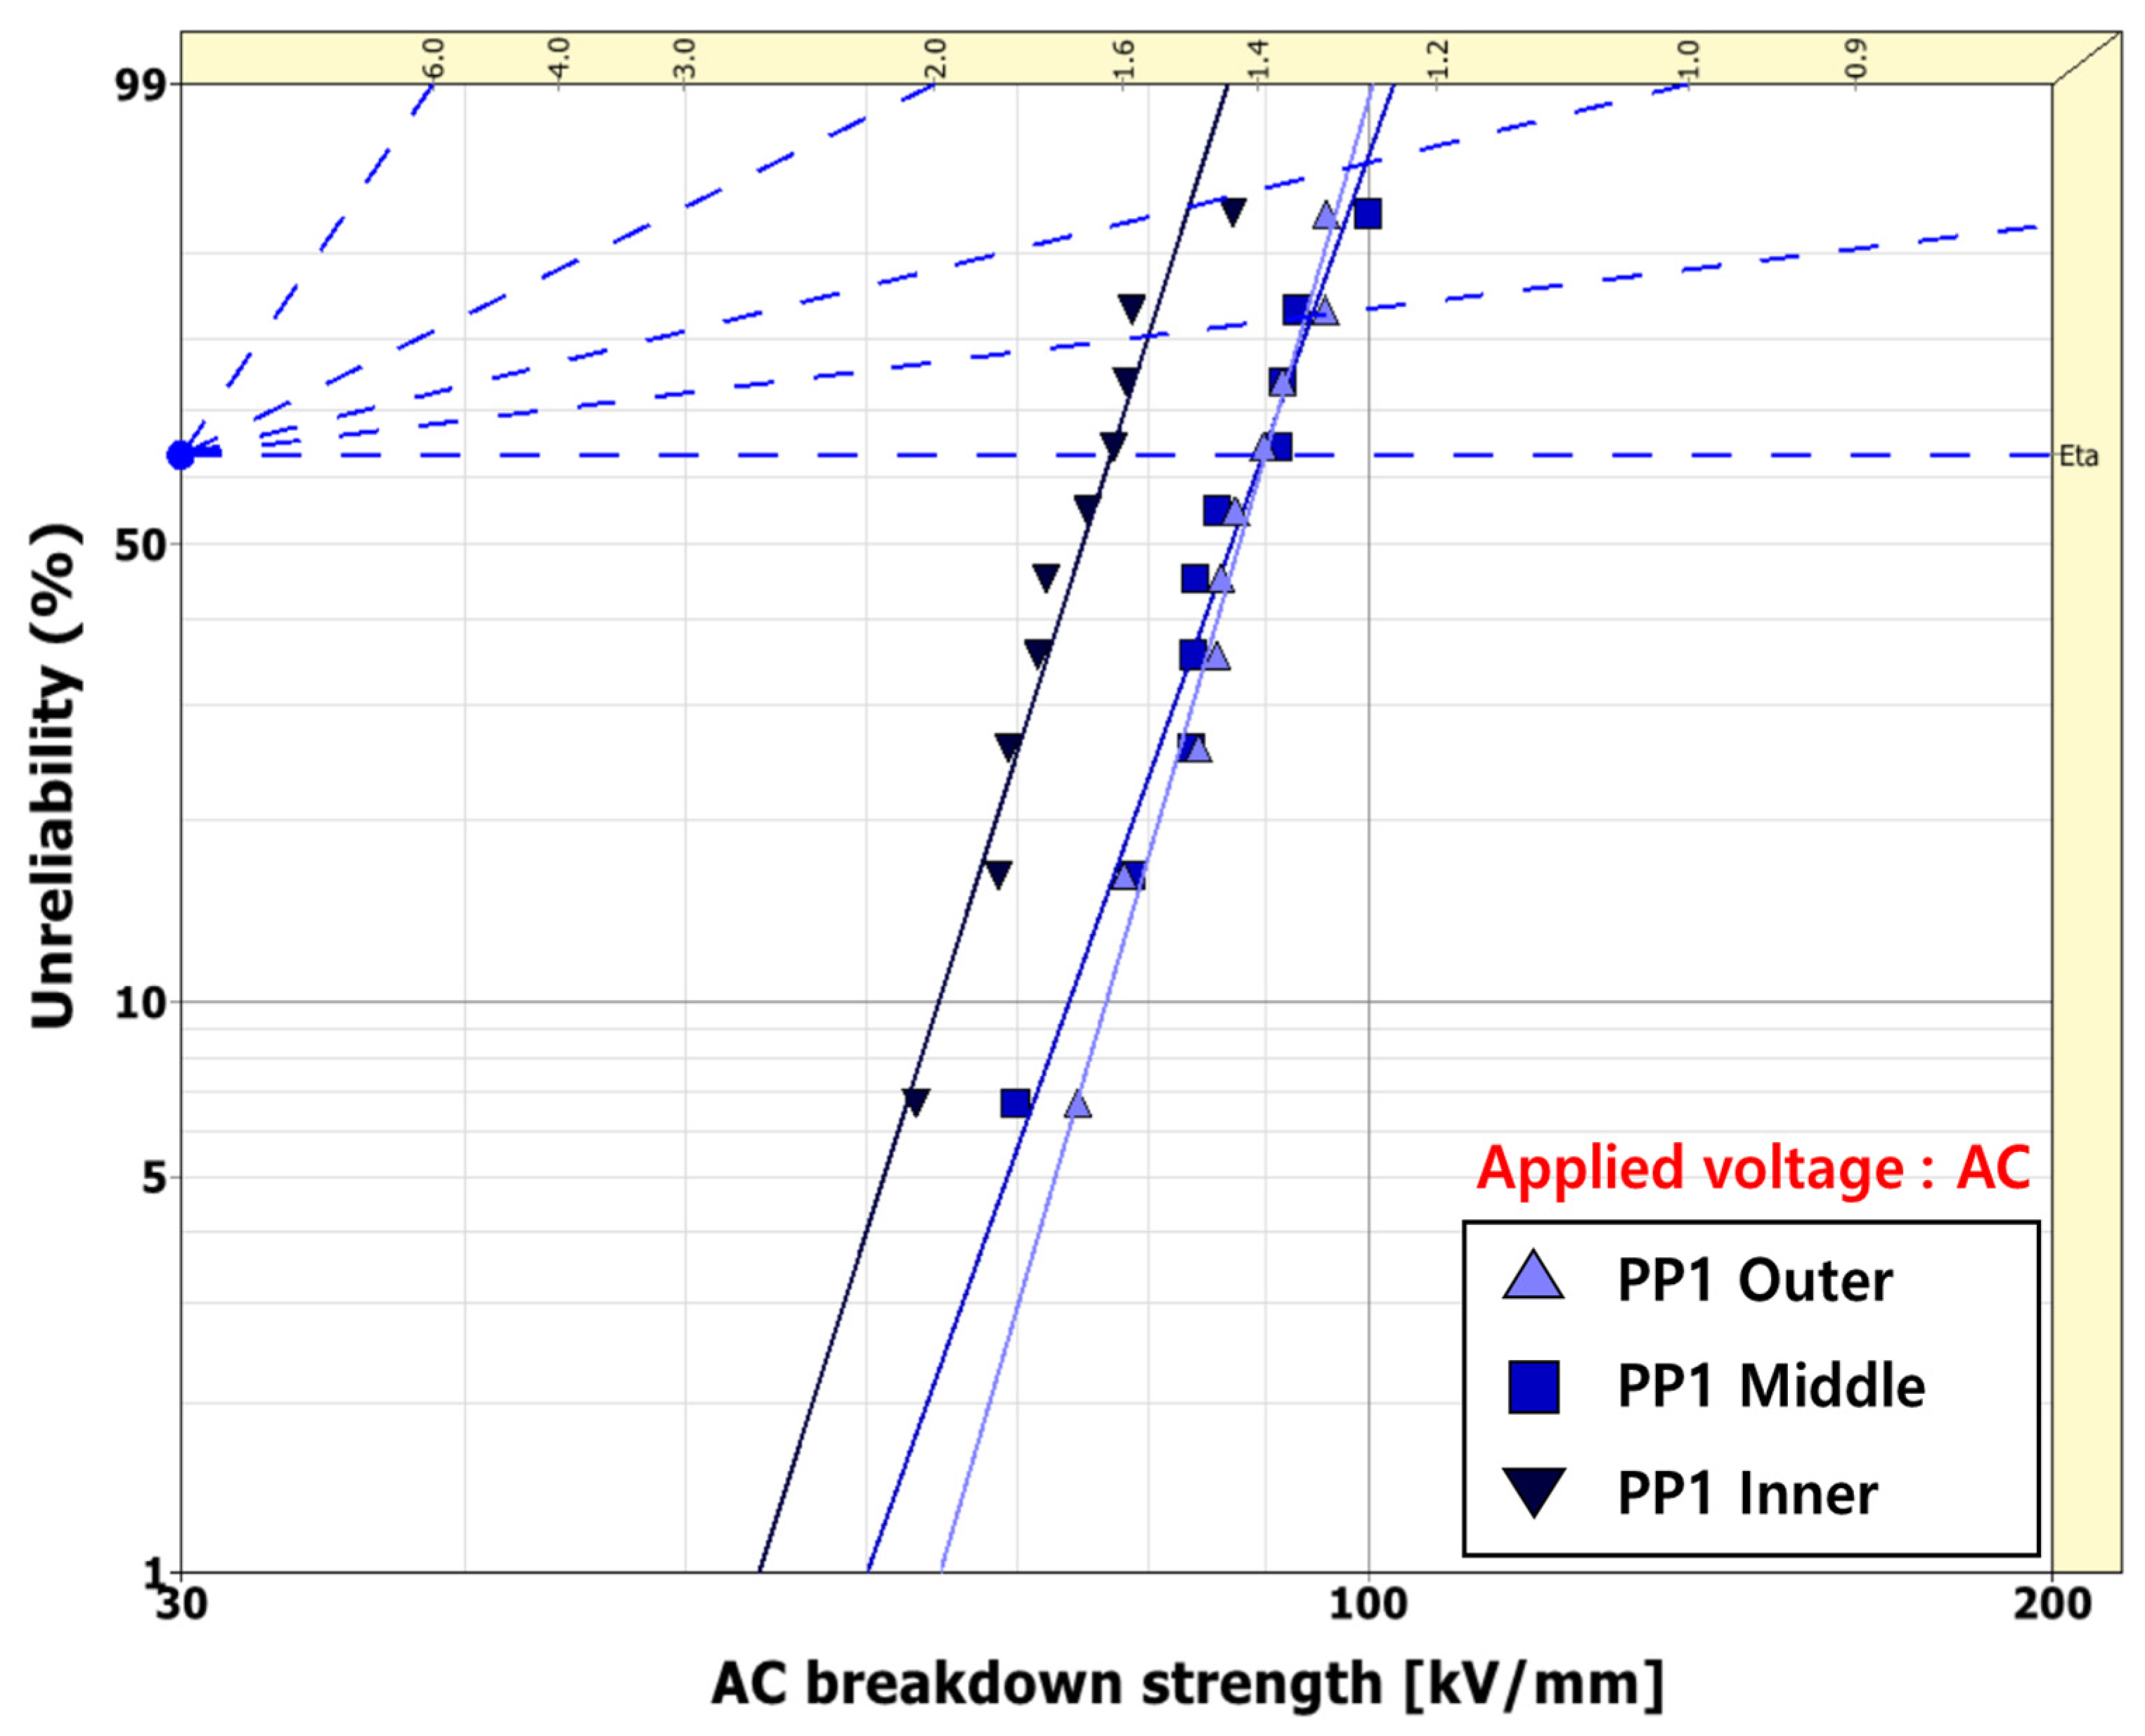
Figure 4,
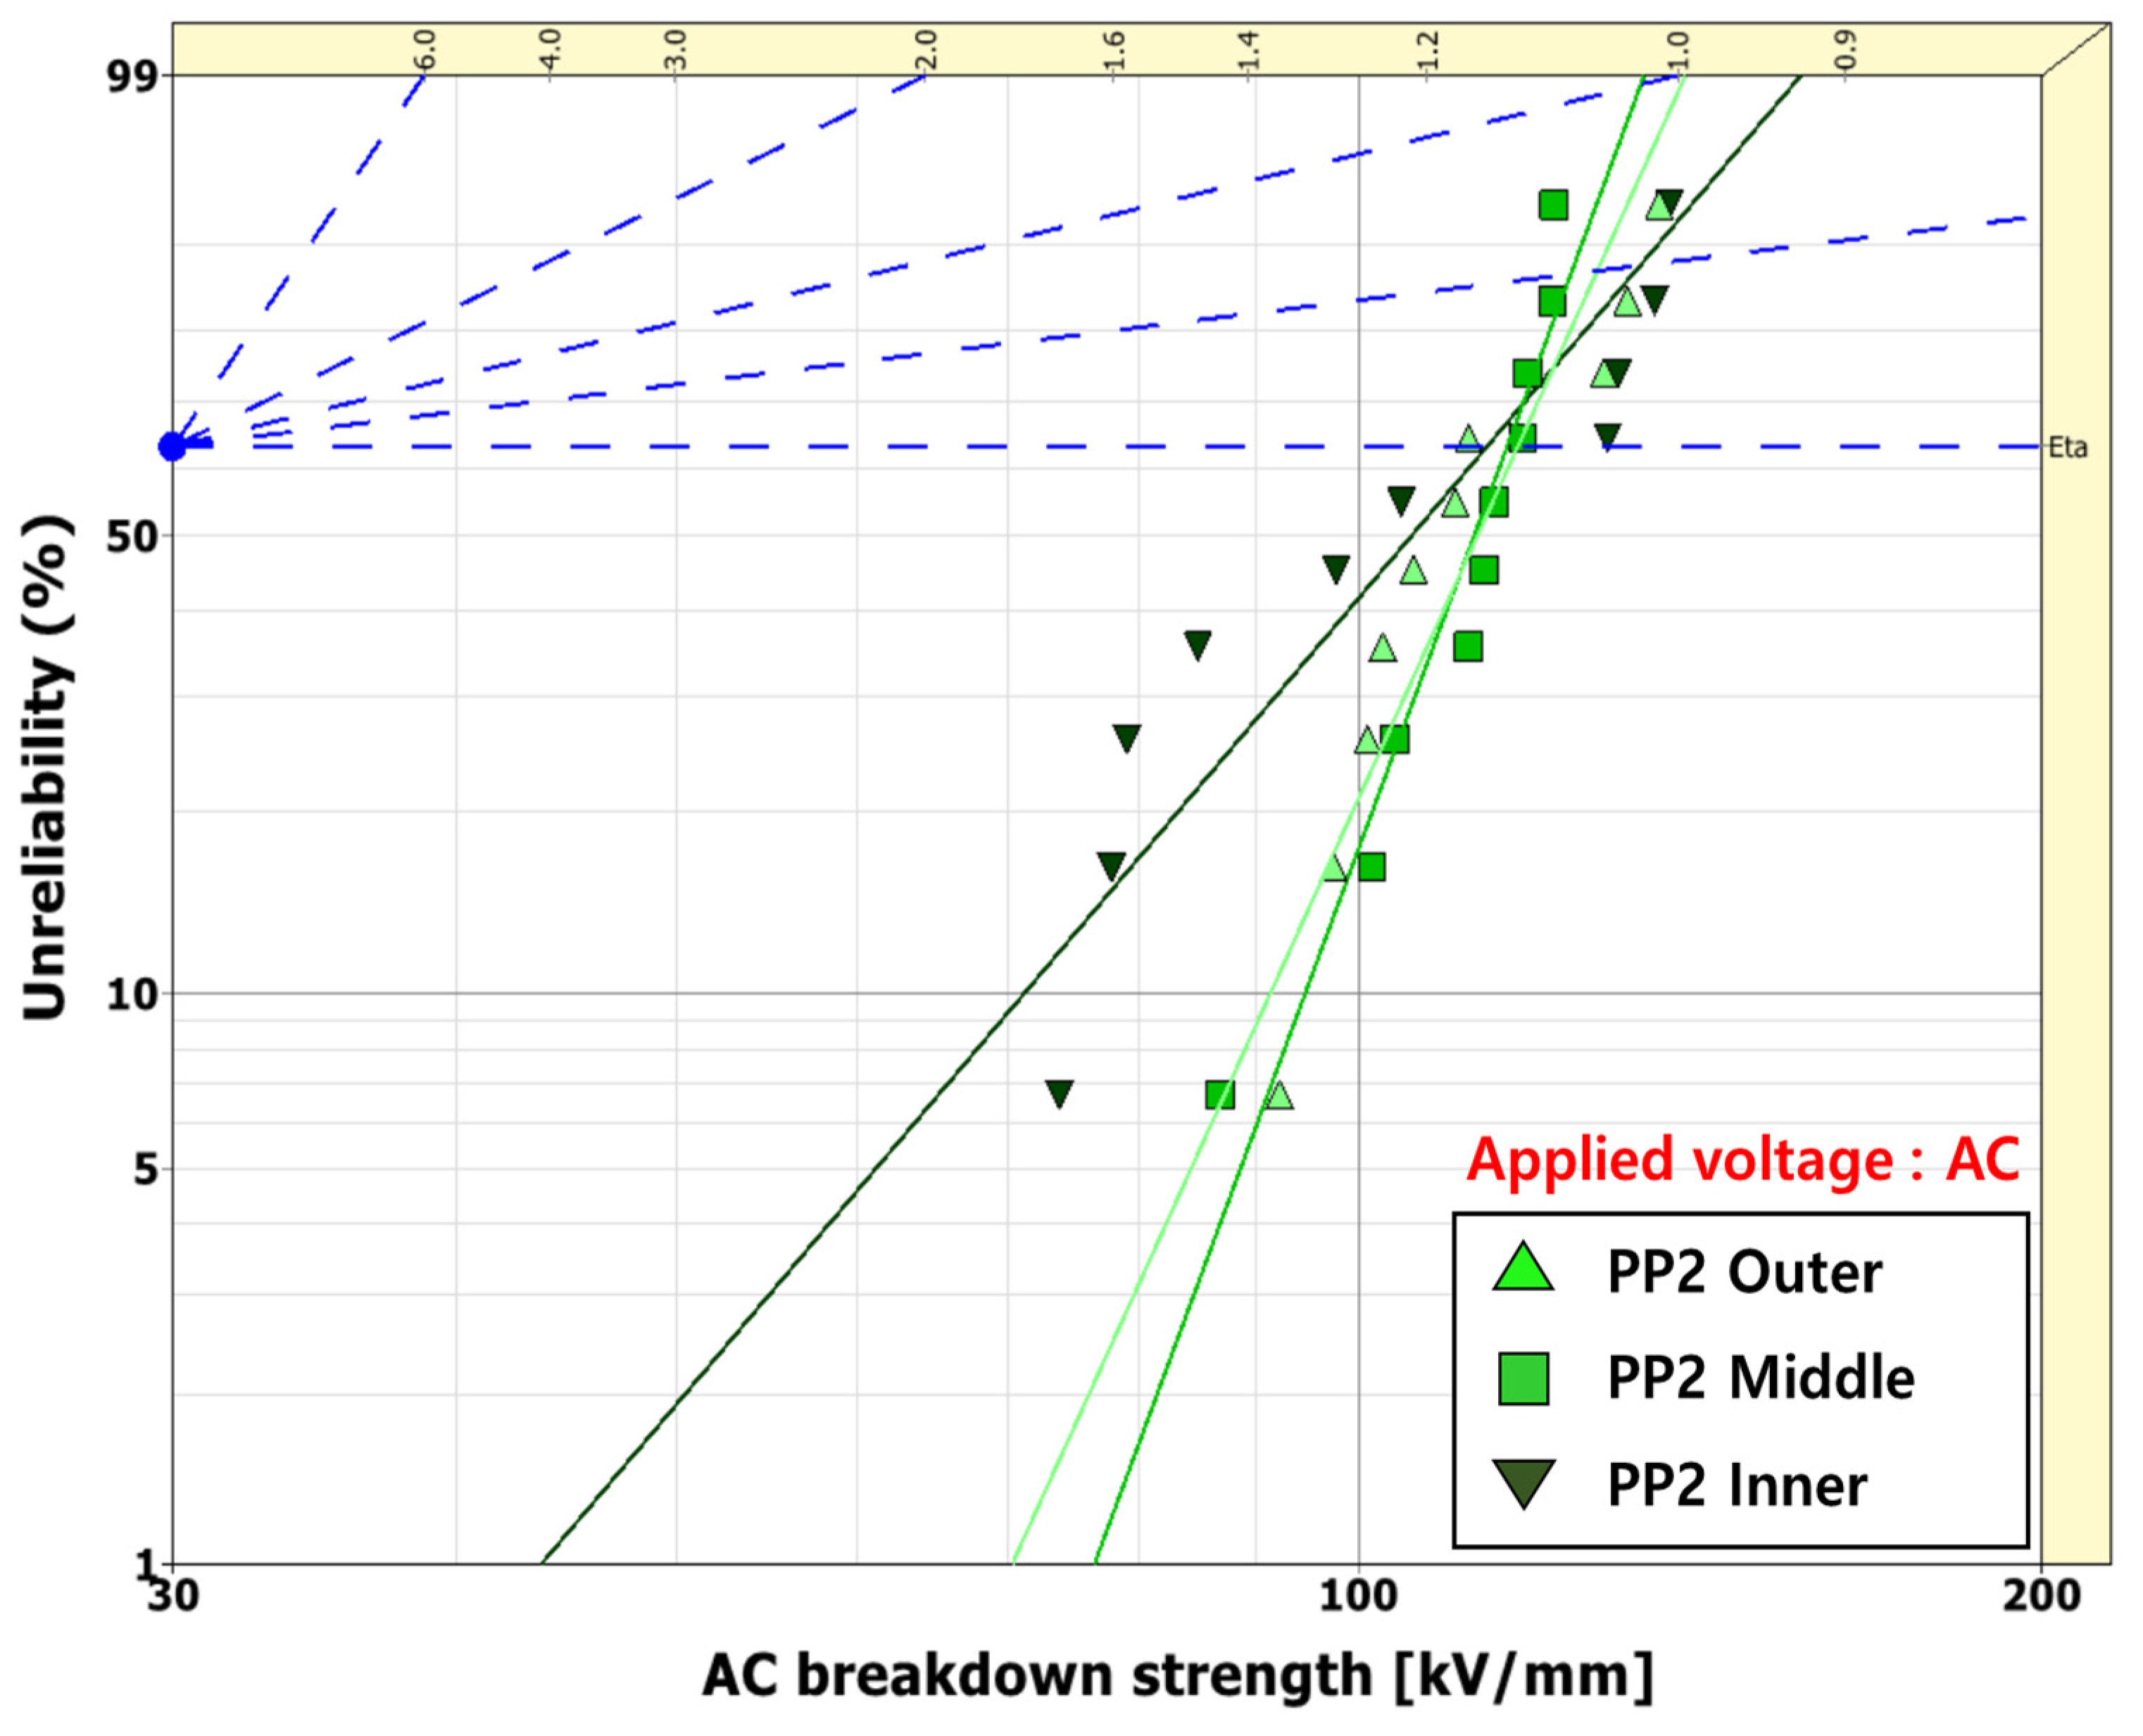
Figure 5 and
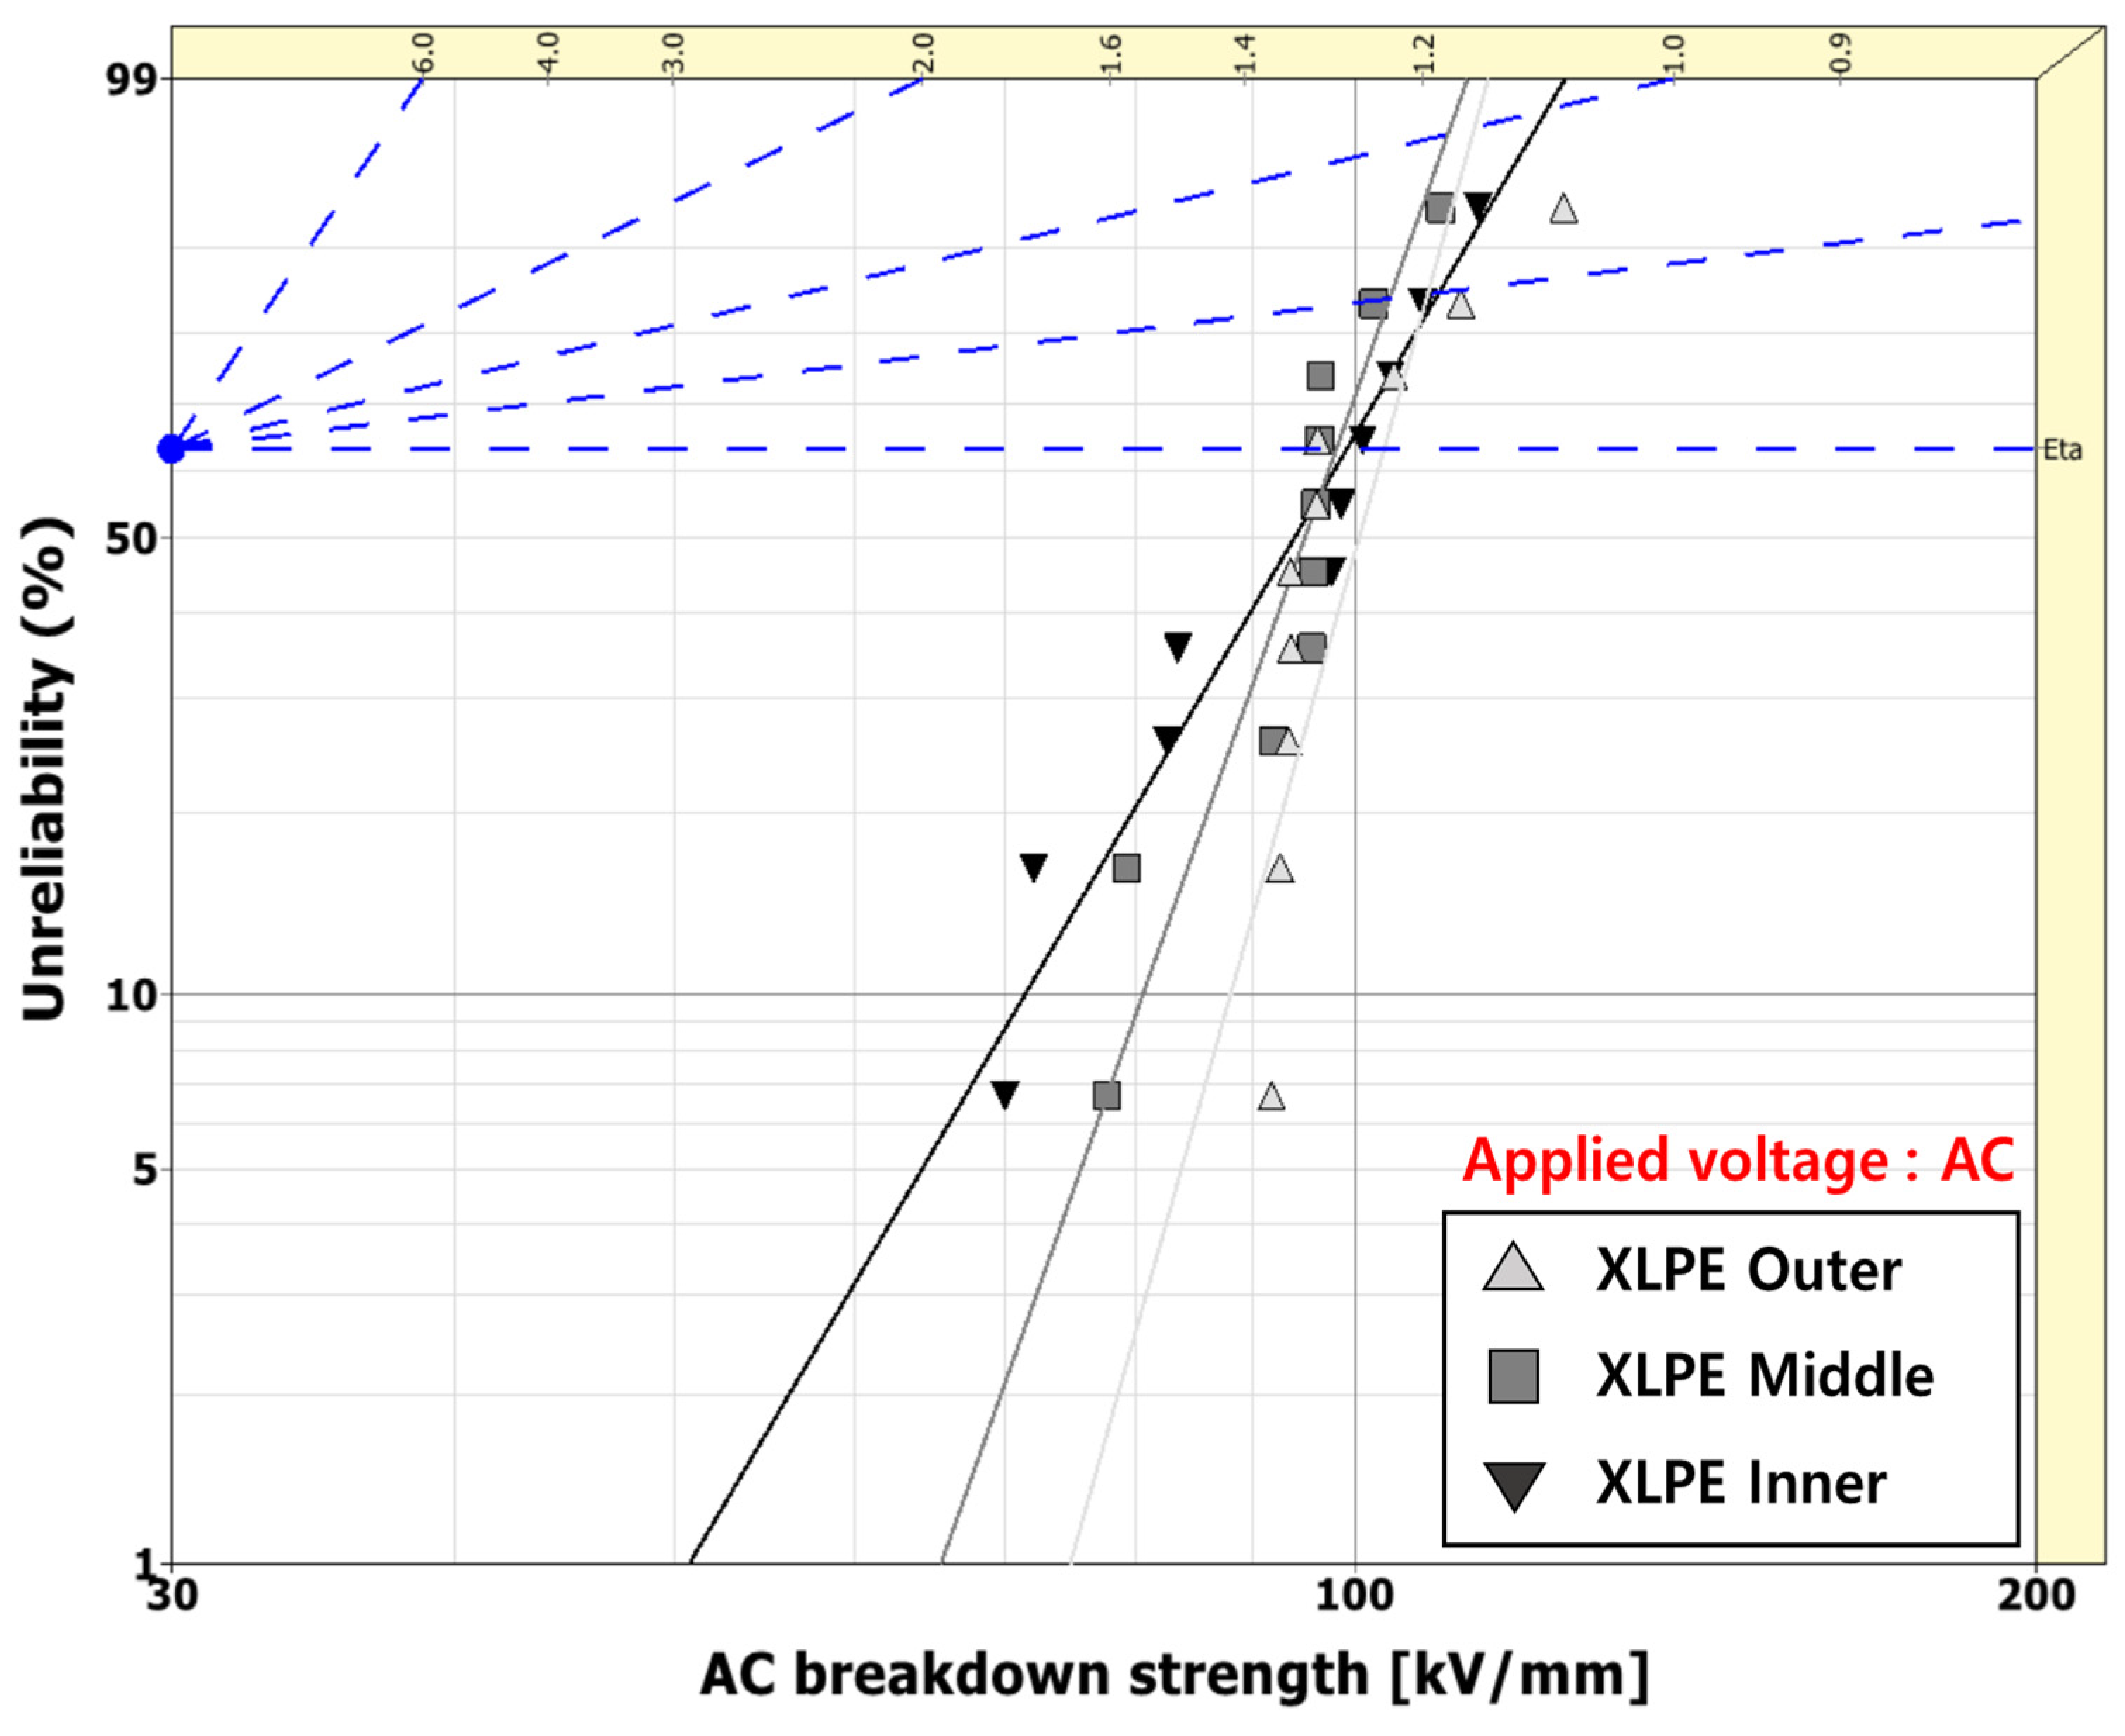
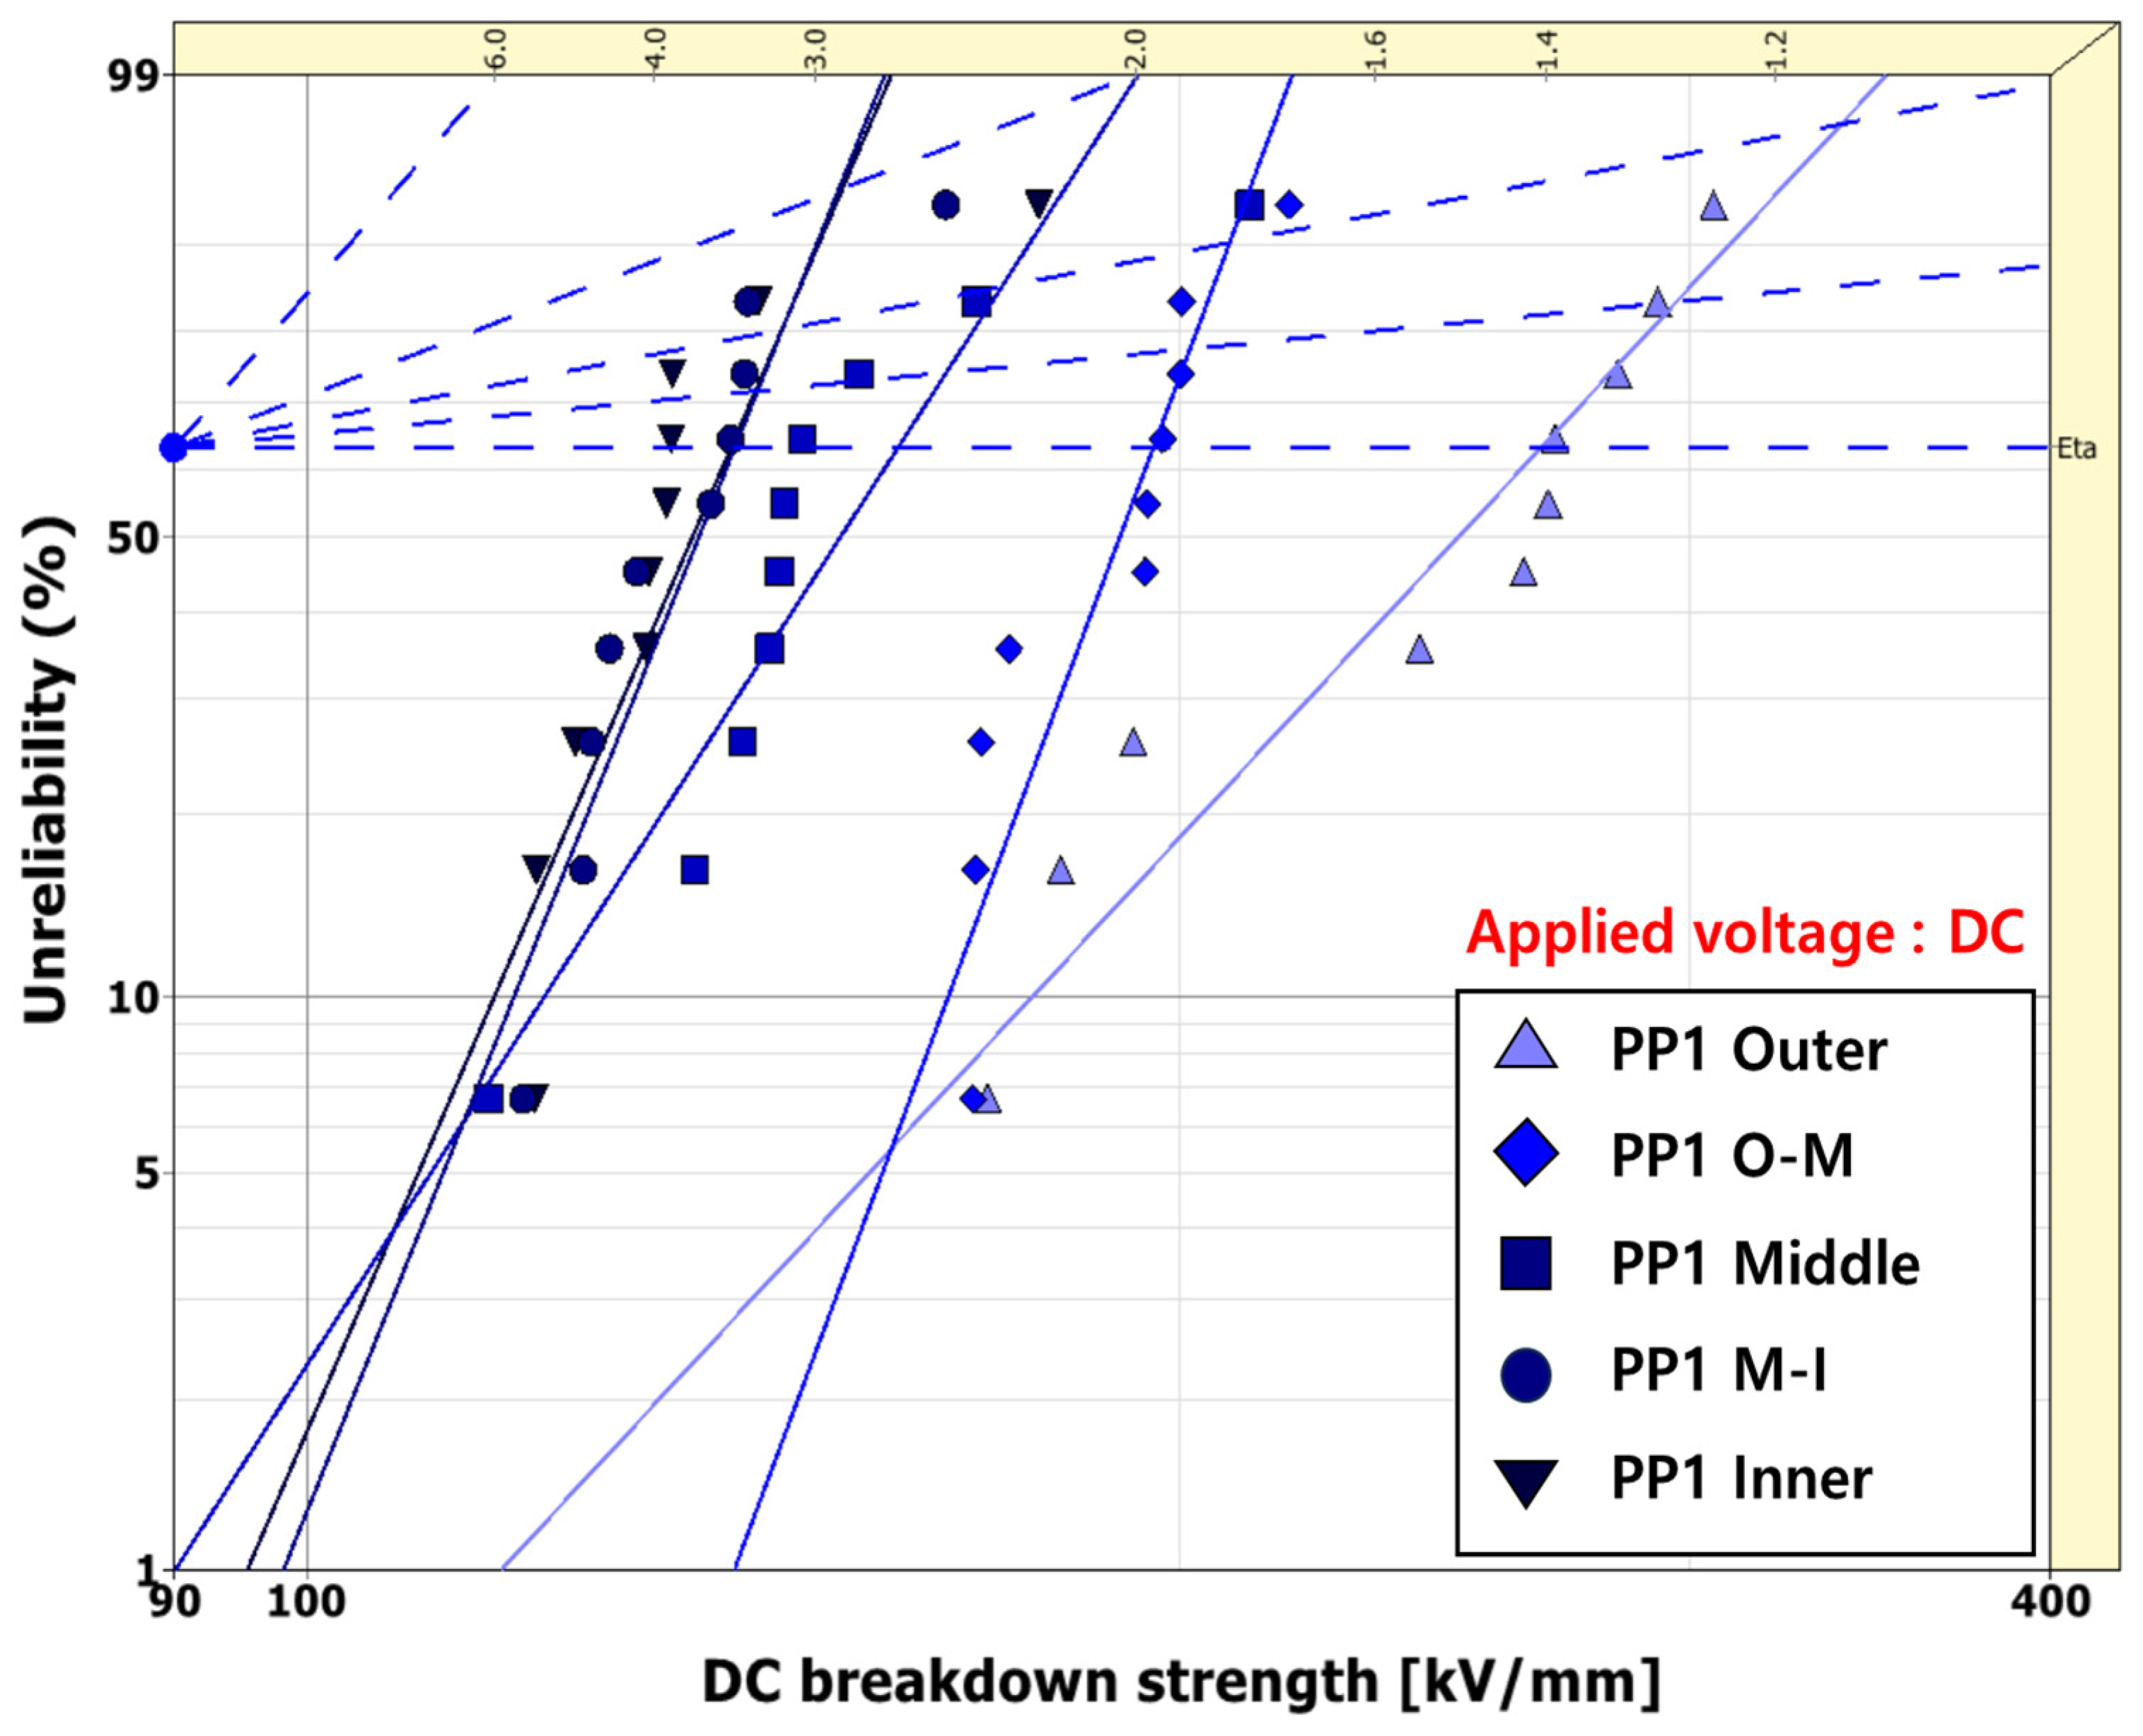
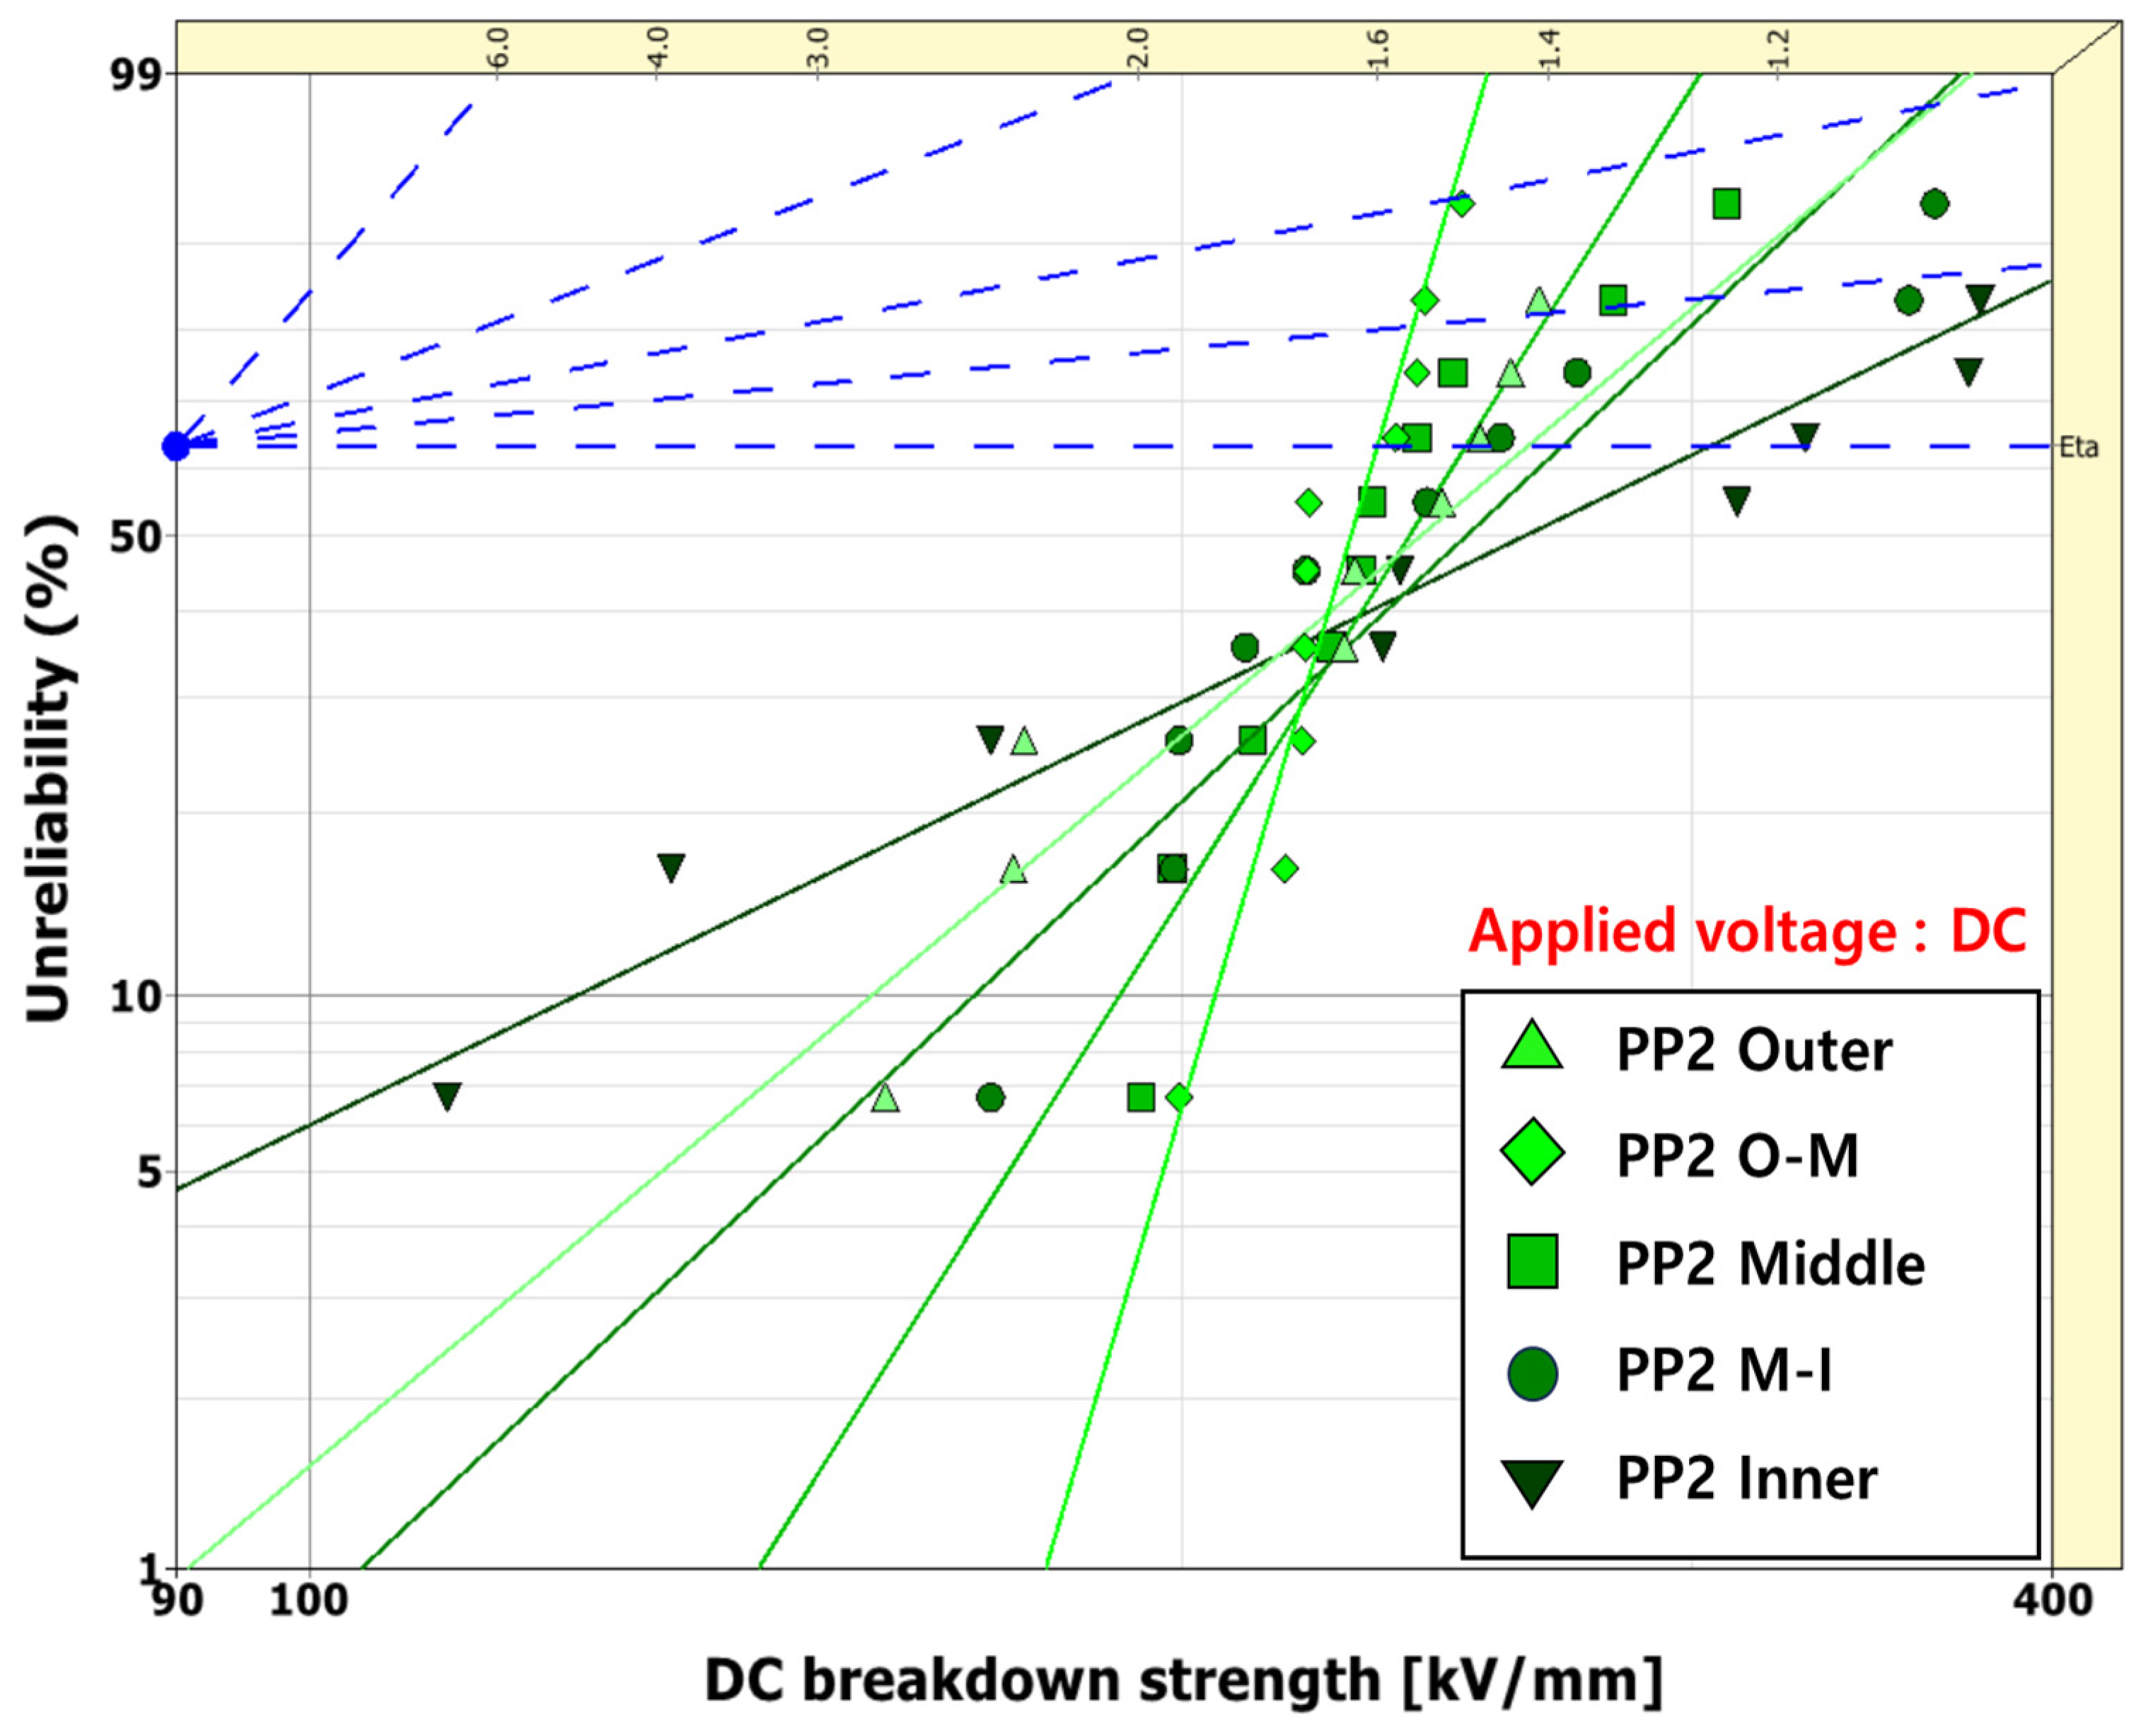
Figure 6 show the results of the AC BD test. The dotted line is an auxiliary line used to visually estimate the Weibull parameters. The horizontal parallel line indicates the 63.2% point. The point where the parallel line intersects with the trend line represents the scale parameter. The dotted line with a slope represents the estimation of shape parameters.
For PP1, there is a maximum difference of 26% in the scale parameter from outer to inner, with the inner section showing the lowest BD strength. In PP2, the maximum difference in parameter values between the outer and inner sections was 6%. The inner section had a relatively low shape parameter value, indicating higher intra-group variance. For XLPE, the maximum difference in the scale parameter values between the outer and inner sections was 3%.
The experimental results of the AC BD test showed that PP1 exhibited variations in BD strength depending on the section, with a noticeable decrease in BD strength toward the inner section. For PP2 and XLPE, the difference in the values of the scale parameter by section was negligible, with a difference of less than 10%.
Figure 7 and
Figure 8 show the results of the DC BD test for PP1 and PP2. When applying a maximum voltage of 80 kV to XLPE, no dielectric breakdown occurred, suggesting that XLPE can sufficiently withstand the maximum DC voltage. Therefore, XLPE was excluded from the statistical analysis. The evaluation of DC BD strength was conducted after the AC evaluation. The five sections were evaluated to closely examine the changes in BD strength for each section. In the evaluation of DC BD strength, the difference in BD strength by thickness was larger than in the AC evaluation. As mentioned in the standard, the DC BD strength is approximately three times higher than the AC BD strength [
19].
For PP1, the BD strength of the outer layer was the highest, decreasing by an average of 12% toward the inner section. The shape parameter remained constant from the outer-middle to the inner sections, with values ranging from 11 to 13, indicating minimal variation in BD strength within this range. These findings are similar to the results of the AC dielectric breakdown test. In the case of PP2, there was an average increase of 9% in BD strength from the outer-middle section to the inner section. The scale parameter increased by 15% from outer to inner. However, the shape parameter decreased by an average of 23%, resulting in a significant difference in BD strength within the same range.
In the case of PP2, as it progressed from the outer-middle section to the inner section, there was an average increase of 9% in BD strength. The scale parameter increased by 15% from outer to inner. However, the shape parameter decreased by an average of 23%, resulting in a significant difference in BD strength within the same range.
The results of the DC BD experiment showed that PP1 and PP2 exhibited variations in BD strength depending on the section. Both materials had a scale parameter of 260 kV/mm in the outer section. However, different trends were observed in the inner section. For PP1, there was a maximum difference of 47% in the scale parameter. In contrast, the PP2 scale parameter did not decrease, but the shape parameter in the inner section, with a value of 2.5, resulted in a minimum value of 48 kV/mm for the 1% BD value, which is relatively low and significant in terms of reliability.
4. Discussion
The results of DC BD strength based on the cooling conditions can be summarized as follows. The DC BD strengths of semicrystalline polymers such as PP and XLPE are influenced by various factors, including testing conditions, composition, morphology, and spatial charge [
20,
21]. The size of spherulites has a significant impact on the BD strength of semicrystalline polymers. Dielectric breakdown typically occurs along the boundaries of spherulites due to their weak links [
22].
The evaluation of DC BD strength was conducted under different cooling conditions, with ambient air, water cooling, and cooling press showing BD strength in descending order. The PP insulator exhibits variations in BD strength depending on cooling conditions, necessitating a review of the optimal extrusion conditions prior to cable production. The selection of the final extrusion conditions should aim to minimize the difference in BD strength from the outer to the inner sections.
The results indicate that BD strength varies with cooling conditions, particularly as insulation thickness increases, as observed in extruded cables. Since PP has low thermal conductivity, the cooling process during extrusion can affect the BD strengths of the inner and outer sections. To address this, it is necessary to evaluate the uniformity of BD strength in the insulation layer.
The results of the AC BD experiment for extruded cables indicated that the uniformity of BD strength in different sections of PP1 was lower than that of PP2 and XLPE. The low uniformity is presumed to be due to the extrusion process. The number and size of spherulites in PP are determined by the cooling rate, which in turn affects the degree of crystallinity. Furthermore, the thermal conductivity of XLPE is higher than that of PP, meaning that if the cooling rate is not controlled, a difference in cooling rate can occur between the outer and inner sections of the cable [
18,
23,
24]. The degree of crystallization, determined by the cooling rate, leads to changes in BD strength. It is expected that the BD strength properties could be improved and uniformity ensured through further research on the compression process.
The relatively low BD strength of PP2 in the DC BD experiment is presumed to be because it was not developed specifically for DC applications. Hence, applying AC insulation materials directly to DC insulation systems can potentially result in decreased reliability. To effectively use DC insulation materials, it is necessary to consider the changes in BD strength.
The evaluation of BD strength by section in the PP extruded cable should also consider stress whitening. When PP is subjected to mechanical stress above the yield point, the insulation develops white speckled marks, known as stress whitening. Stress whitening has been reported to be composed of crazes and voids, which make the product more vulnerable to the diffusion of liquids and gases and more prone to breakdown. Stress whitening can be observed visually and can decrease properties such as BD strength and tensile strength [
12,
24,
25].
5. Conclusions
This study investigated the DC BD strength of PP, an insulating material developed for application in MVDC, under different cooling conditions. Furthermore, AC and DC short-term BD experiments were conducted for extruded cable, AC and DC PP, and XLPE cables.
The development of PP insulation material in specimen form revealed that the size of spherulites varied depending on thermal history and cooling conditions, resulting in a maximum difference of 24% in DC BD strength.
The uniformity of extruded cable was evaluated by dividing the cable into five sections, from the outer to the inner section, and conducting tests. Dividing the intervals and comparing them proved to be an effective method for evaluating the uniformity of PP BD strength.
To commercialize MVDC PP cables, it is necessary to review the cooling conditions of the extrusion process and ensure the uniformity of the extruded cable. In addition, mechanical properties such as tensile strength and elongation rate should be considered when selecting the final conditions. Further research is required on this matter.
