Article

Research on the Flicker Effect in Modern Light Sources Powered by an Electrical Network

by
Romuald Masnicki
1,*,
Janusz Mindykowski
1,
Beata Palczynska
2 and
Dawid Werner
1
1
Faculty of Electrical Engineering, Gdynia Maritime University, 81-225 Gdynia, Poland
2
Faculty of Electrical and Control Engineering, Gdańsk University of Technology, 80-233 Gdansk, Poland
*
Author to whom correspondence should be addressed.
Energies 2024, 17(20), 5080; https://doi.org/10.3390/en17205080
Submission received: 31 August 2024 / Revised: 4 October 2024 / Accepted: 9 October 2024 / Published: 12 October 2024
(This article belongs to the Section F1: Electrical Power System)

Abstract

:
Disruptions in power quality have a negative impact on many energy consumers. These include lighting, where interference manifests itself, among others, in the form of light flickering. The article presents phenomena accompanying the operation of modern light sources against the background of exemplary results of studies on the flicker of conventional light sources, such as incandescent or fluorescent lamps. The flickering effect of light generated in modern lamps can occur under stable voltage conditions in the supply network. The main subjects of the conducted research were solid-state light sources—light-emitting diode (LED) lamps, currently available on the lighting market. To assess the effects of these phenomena, it is necessary to use measures other than those traditionally used. The method used allows for the measurement of flicker resulting from both power supply disturbances and the properties of modern light sources. Using the developed measurement system, it is possible to record temporal changes in flicker coefficients resulting from, for example, changing supply voltage conditions. Due to the possibility of flickering light from sources offered by different manufacturers, as shown by research, it is advisable to carry out measurements at the place of use of the lighting.

1. Introduction

Electricity is generated by converting primary sources like coal, oil, gas, solar power, and hydropower. Fossil fuels are typically burned to generate heat, which produces steam to rotate a generator to produce electricity. While this method is highly efficient, it is not renewable and has a significant environmental impact. In contrast, renewable energy sources (RES) generate electricity in various ways that do not rely on burning fuels. Currently, renewable sources like hydropower account for over 30% of the total global installed capacity and contribute about 23% of the world’s electricity production [1].
Electric light sources have been in use for about 100 years. Until the early 2000s, incandescent and fluorescent lamps were the primary types used in households, as well as industrial and public facilities. In typical applications, these lamps are powered directly from the power grid. However, voltage disturbances in the electrical network can cause fluctuations in lighting, in other words, in the temporal light modulation (TLM) [2], which significantly affect the sensory experience of people exposed to them [3,4]. These fluctuations are typically due to periodic or random changes in the voltage supplying the light source. Such disturbances cause the lamp to emit temporally modulated light, leading to several effects [5,6]. The effects related to TLM can be grouped as follows:
  • affecting visual perception;
  • neurobiological effects;
  • reduction in performance and cognitive abilities.
In reference to the human visual perception of TLM, the term temporal light artifact (TLA) is used [7]. The observer’s visual perception can be influenced by three types of TLA effects: flickers resulting from varying intensity of light (illuminance), stroboscopic effects related to a moving object observed to be frozen, or phantom array perceived as a view of the multiplied pattern. Neurobiological effects manifest themselves as eyestrain, headache, epilepsy, etc. Reduction in performance and cognitive abilities are expressed as visual and cognitive performance limitations, a bad mood, mental discomfort, etc.
Flicker is one of the phenomena associated with the operation of electric light sources, resulting from the emission of time-modulated light, and can be perceived by the user in a visible or invisible form. Depending on the frequency and amplitude of this modulation, flicker can lead to various health issues, such as nausea, headaches, or even trigger epileptic seizures [4,6].
Visible flicker refers to flicker that can be seen by the human eye and is linked to serious health risks, including seizures. It also poses safety concerns in environments like roads and parking lots. Under typical conditions, most people cannot perceive light flicker at frequencies above 70–80 Hz. A flicker below 80 Hz is usually caused by voltage disturbances in the mains supply and may occur in all types of light sources. In people with photosensitivity disorders, seizures can occur between 3 and 70 Hz, whereas photosensitivity epilepsy usually causes seizures between 15 and 20 Hz [8,9]. However, even at higher frequencies, flicker can still cause health problems.
An invisible flicker is a flicker that is not easily noticeable to the human eye but can still cause issues such as dizziness and migraines. This type of flicker practically does not occur in incandescent lamps due to their high luminous inertia resulting from the thermal inertia of the filament. The most concerning effect of flicker at frequencies above 70 Hz, even if imperceptible, is that prolonged exposure can lead to symptoms like headaches, mood disturbances, and potentially impaired vision. The causes of invisible flicker should be sought in the technology of the light source and in the properties of additional electrical circuits cooperating with the light source [6]. In the case of fluorescent lamps, this is a magnetic or electronic ballast. Fluorescent lamps with magnetic ballast produce flicker at a frequency twice that of the mains frequency, while modern compact fluorescent lamps (CFL) with electronic ballast usually refresh the light at a frequency above 1 kHz, too fast for the human eye or brain to detect. The solid-state light source, namely the light-emitting diode (LED), requires a polarized voltage to generate light. In the electrical circuit of LED lamps, electronic components are needed to rectify and smooth out the fluctuating signal from the power grid; usually, rectifier circuits or complex frequency converters are used. Rectifier circuits provide a pulsating voltage with a frequency twice the frequency of the supply network, while frequency converters (with pulse width modulation—PWM) generate an asymmetrical supply voltage with a frequency many times higher than the frequency of the power grid, usually above 1 kHz. To reduce the ripple in the rectified supply voltage of LEDs in the lamp, additional energy storage devices, usually capacitors with an appropriate capacity and permissible operating voltage, are used. The properties of this element can determine the level of flicker generated in the LED. At the power level corresponding to the tested lamps equipped with rectifier systems, the capacitor capacitance should be from several to several dozen μF, depending on the amplitude of the assumed output voltage ripples, with the minimum operating voltage above 325 V. In many cases, such a capacitor is a significant element influencing the lamp manufacturing costs. The requirements for the properties of capacitors in LED lamps with a voltage converter are much more lenient and easier to meet.
The phantom array effect occurs when a non-static observer, such as someone moving their head or driving a car, perceives a change in the shape or spatial arrangement of objects in a static environment [8]. This effect typically occurs within the frequency range of 80 Hz to 2500 Hz.
Within a similar frequency range, the stroboscopic effect can also occur. This effect involves a change in perception, where flicker frequencies interact with the movement of an object. If the flicker frequency matches the movement frequency of an object, the object may appear to be stationary to the observer. This creates a significant safety risk, as it can give the illusion that reality has stopped or slowed down, potentially endangering human health and life.
The origins of TLM and TLA effects, as well as the relevant metrics for their assessment introduced in the various standards, are discussed in more detail in [2,7].
Flicker is technically described in standards as voltage fluctuations that modulate the light amplitude or power output of a light source. The principle of determination of flickering severity has been given in IEC documents [10,11]. The method used to calculate the voltage quality index, called flicker severity (or flicker intensity), is complicated but widely used. The calculation method assumes that light flickering occurs as a result of the operation of incandescent lamps exposed to voltage fluctuations [12,13].
The flickermeter proposed in the standards represents a model of a complex system that reproduces the properties of the human brain, eye, and light bulb, which allows the flicker phenomenon to be assessed regardless of the nature of voltage fluctuations and the source of interference (Figure 1). Because of the random character of the flickering phenomenon, two statistical factors, Pst and Plt, are to be determined. Short-term flickering severity indicator Pst is determined by means of a function of a cumulative probability of obtaining instantaneous flickering values, that is, a curve of orderly probabilities that do not exceed definite values of the flickering levels in the respective time, for a recording period of the course under investigation equal to 10 min. Pst = 1 [p.u.] corresponds to the flickering visibility threshold, which must not be exceeded to avoid the psychic discomfort of the observer. Long-term flickering severity indicator Plt is determined for a 2 h time window from twelve successive values of Pst. The IEC 61000-4-15 standard [11] summarizes the research supporting the IEC 61000-3-3 standard [10] for flicker and establishes a measurement method (Figure 1). In order to check the quality of energy supplied from the electricity grid, the international standard EN-50160 [14] is used. This standard sets a limit for the Plt parameter for light flicker, which is 1 for 95% of measurements taken each week.
In [15], an analysis of voltage changes causing light flicker in the onshore power grid of the Metallurgical Works is presented. The measurements were carried out in the supply lines of an electric motor to supply the rolling mill at a rated voltage equal to 6 kV. Short-term flickering severity indicator Pst did not exceed the severity level during the experiment (Figure 2).
The flickering effect of light emitted by different lamps, caused by changes in the mains voltage, varies significantly depending on the design of the specific lamp. Therefore, various methods based on signal processing techniques have been presented in the literature for source detection [17].
The purpose of developing the IEC standards and Pst flickermeter was to create a tool for assessing voltage fluctuations in power supply to avoid visible lamp flicker and complaints from electricity consumers. Determining the Pst value is based on a 60 W light bulb. Since Pst was developed at a time when incandescent bulbs were the most common light source, modeling light fluctuations based on voltage fluctuations made sense because there was a relationship between supply voltage fluctuations and light fluctuations.
Nowadays, traditional lamps supplied by the electrical grid are being replaced with energy-saving lamps. At the beginning of the 21st century, in addition to new developments in compact fluorescent lamps, light-emitting diode lamps appeared on the lighting market. The basic quality and performance requirements for LED lamps, containing a coherent set of specifications supporting the introduction of LED lighting products to the market, addressed to organizations managing the transformation of the lighting market, as well as to manufacturers of lighting products, are included in [18]. At the same time, LED technology is developing into new applications related to the possibility of changing or tuning the light intensity or spectrum to specific application conditions, taking into account the well-being of people, plants, or animals and other benefits resulting from the use of LED lamps. The test results of sample dim-to-warm (D2W) lamps can be found in [19]. However, to estimate the flicker intensity of LED lamps, a new approach must be used. It has already been noted that the use of existing standards to assess the effects of flickering light in relation to its various sources is cumbersome and not always clear. The flicker severity index should no longer be a measure of the light flicker with those energy-efficient lamps. Instead of determining voltage fluctuation indicators, an assessment method was introduced based on measurements of the light intensity produced in the lamp. This approach is included in the technical report [8,20]. The IEC-TR-61547 standard [21] describes a flickermeter that uses changes in light as a direct input signal, unlike the original IEC flickermeter, which takes voltage as an input signal and models the light of a 60 W incandescent lamp. A new short-term flicker indicator P s t L M has been introduced, which is a measure of flicker defined in the same way as Pst, taking light intensity as the input signal.
The IEEE 1789 standard [20] introduces two other indicators used to assess flicker, flicker index Fi and flicker percent Fp illustrated in Figure 3, which take into account the effects of both voltage fluctuations and source properties, including all visual and non-visual flickering light effects. Fp determines and characterizes the relative variability of light amplitude, i.e., it is a measure of the depth of flicker modulation. Fi is a lesser-known measure that takes into account the different shapes or duty cycles that periodic lighting waveforms can have. It includes flicker percentage, waveform, and duty cycle, which refers to the percentage of time in a single cycle.
Mathematical relationships describing flicker indicators are as follows:
F p = 100 % a b a + b   [ % ] ,
F i = A A + B [ ] ,
where:
  • A—surface area for the area above the average value during one flicker cycle,
  • B—surface area for the area below the average value during one flicker cycle,
  • a—maximum voltage value recorded during the flickering cycle,
  • b—minimum voltage value recorded during the flickering cycle.
Considering the flicker frequencies fflick, the standard [20] recommends the limits of the flicker percent Fp_b defined by relations (3) and (4). Equation (3) refers to fflic frequencies below 90 Hz, while (4) is for frequencies above this threshold. Flicker percent values Fp determined for a given light source that are lower than the corresponding Fp_b values can be considered acceptable.
F p _ b = 0.25 · f f l i c k
F p _ b = 0.08 · f f l i c k
With respect to the standards [10,11], the main difference is that the Fp and Fi coefficients describe the behavior of the supply voltage together with the characteristics of the light source itself.
The newer standards [22,23,24] also cover instantaneous illuminance measurements and describe procedures for taking light waveform measurements for use in TLA calculations, provide data reporting formats, and include metrics such as stroboscopic visibility measurements (SVMs) and long-term multiple-cycle flicker measurement, which is important in cases where the waveform changes over time. A synthetic overview of the issues covered in the standards can be found in [2,7].
The article presents exemplary results of flicker tests, relating mainly to LED lamps, selected from many test specimens of various light sources: LED lamps, CFL fluorescent lamps, and halogen lamps. The influence of the distance from the light source on the intensity of flicker is also shown. Additionally, the effects resulting from various parameters of the DC power supplies used for LED lamps are presented. Measurements were performed in accordance with the recommendations of the standard [20]. The subject of the research was the flickering of light from sources powered by uninterrupted mains voltage, and their aim was to demonstrate whether the design of a modern light source itself may be the cause of the flickering effect.

2. Materials and Methods

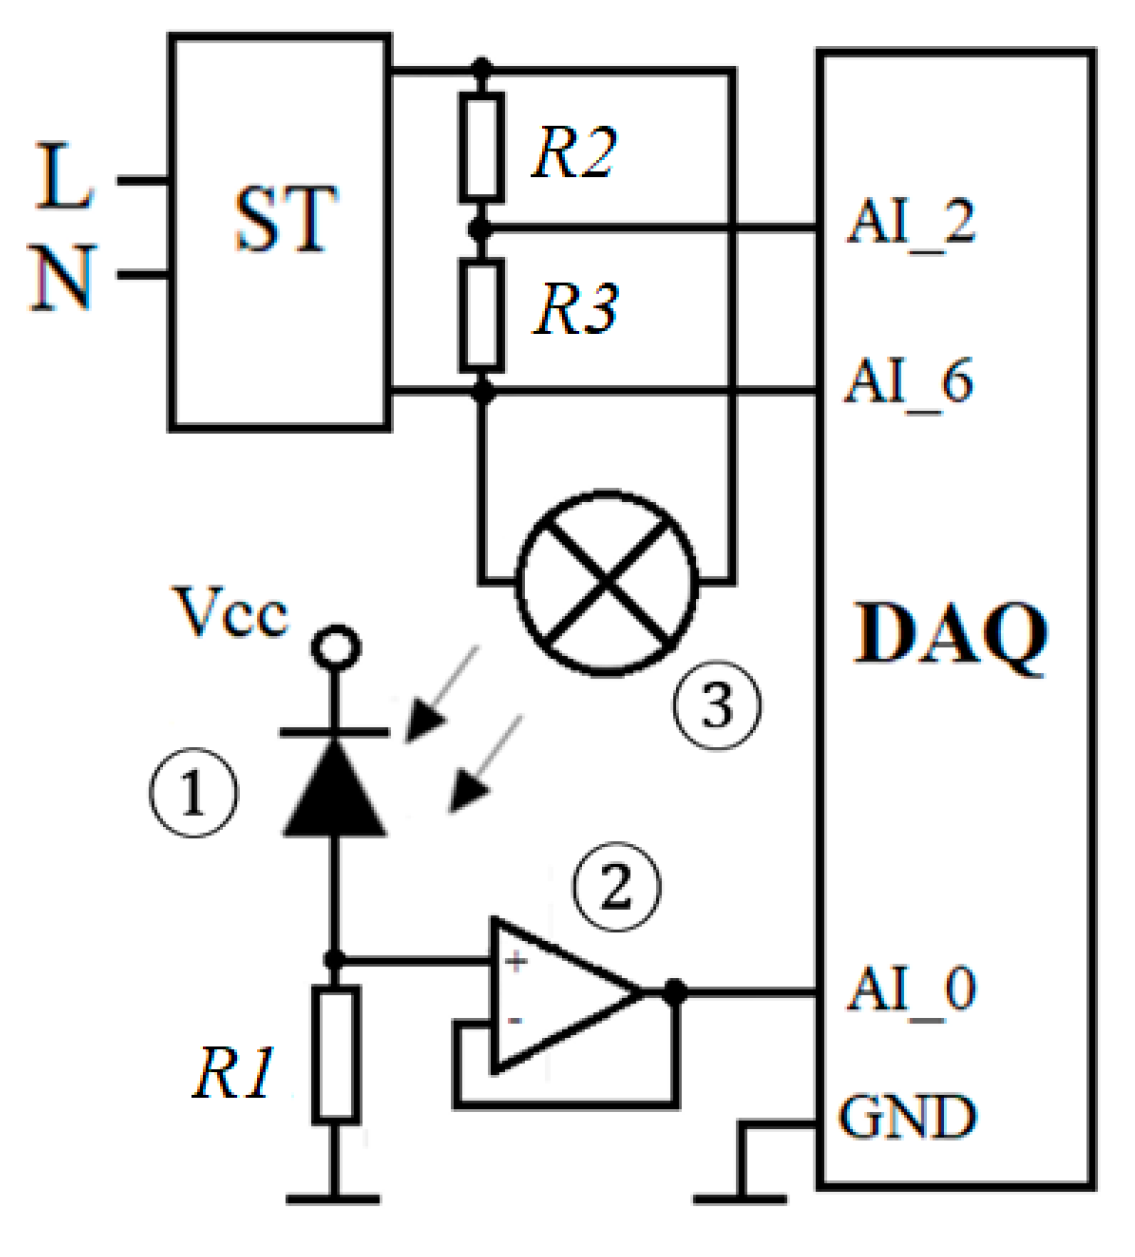
The diagram of the developed measurement system is shown in Figure 4. Using a photodiode ① type ams Osram BPW21 (ams-OSRAM AG, Premstaetten, Austria) [25] in the application system, measurements of the light produced in the tested bulbs were performed. A voltage follower ② is connected to the AI_0 input of the NI USB 6008 (Emerson, St. Louis, MO, United States) multifunction data acquisition (DAQ) device [26]. The DAQ operates under the control of a PC running a dedicated application in the NI LabVIEW environment. To obtain the best results, tests were conducted in complete darkness in a room with no other light sources. This was achieved by using a rectangular box measuring 30 cm × 30 cm × 100 cm, which was constructed in such a way as not to allow light into the interior of the housing. The photodiode ① is placed on one side of the box, and the individual light sources under test ③ are mounted on the opposite side. For safety reasons and to obtain stable power supply conditions for the tested light sources, an ST (230/230 V) isolating transformer was used. Additionally, the voltage on the light source is measured in a voltage divider circuit (resistors R2 and R3) connected to the AI_2 and AI_6 inputs of the DAQ device.
The characteristic of the conversion of light intensity E to voltage U, formed in the developed system with the participation of resistance R1, determined and recorded using a DAQ device, is shown in Figure 5. It was determined using the reference flux meter Voltcraft LX-10 (Conrad Electronic SE, Hirschau, Germany) [27]. The maximum output voltage value of 4.55 V corresponds to approximately 1000 lx. Using the voltage values measured in the developed system, the illumination intensity values can be reconstructed based on the relationship (5) as a polynomial interpolation of the inverse relationship E = f(U) to that shown in Figure 5.
E = 16.161U2 + 143.61U + 0.4401
The flicker indicators (1) and (2) for each tested bulb were determined using a dedicated program developed in the NI LabVIEW environment.
Modern, compact light sources were selected to test the flicker effect: LED lamps, fluorescent lamps, and halogen lamps. Technical data of sample bulbs can be found in online catalogs, e.g., in [28,29,30]. The largest group studied are LED lamps. It contains light sources from different manufacturers, with different properties but with similar luminous fluxes. When selecting bulbs, it was considered that they represented different price ranges, bulb shapes, and terminal types. During the measurements, the tested light sources were supplied with a voltage of 230 V/50 Hz, the parameters of which were monitored in the measurement system (Figure 4).
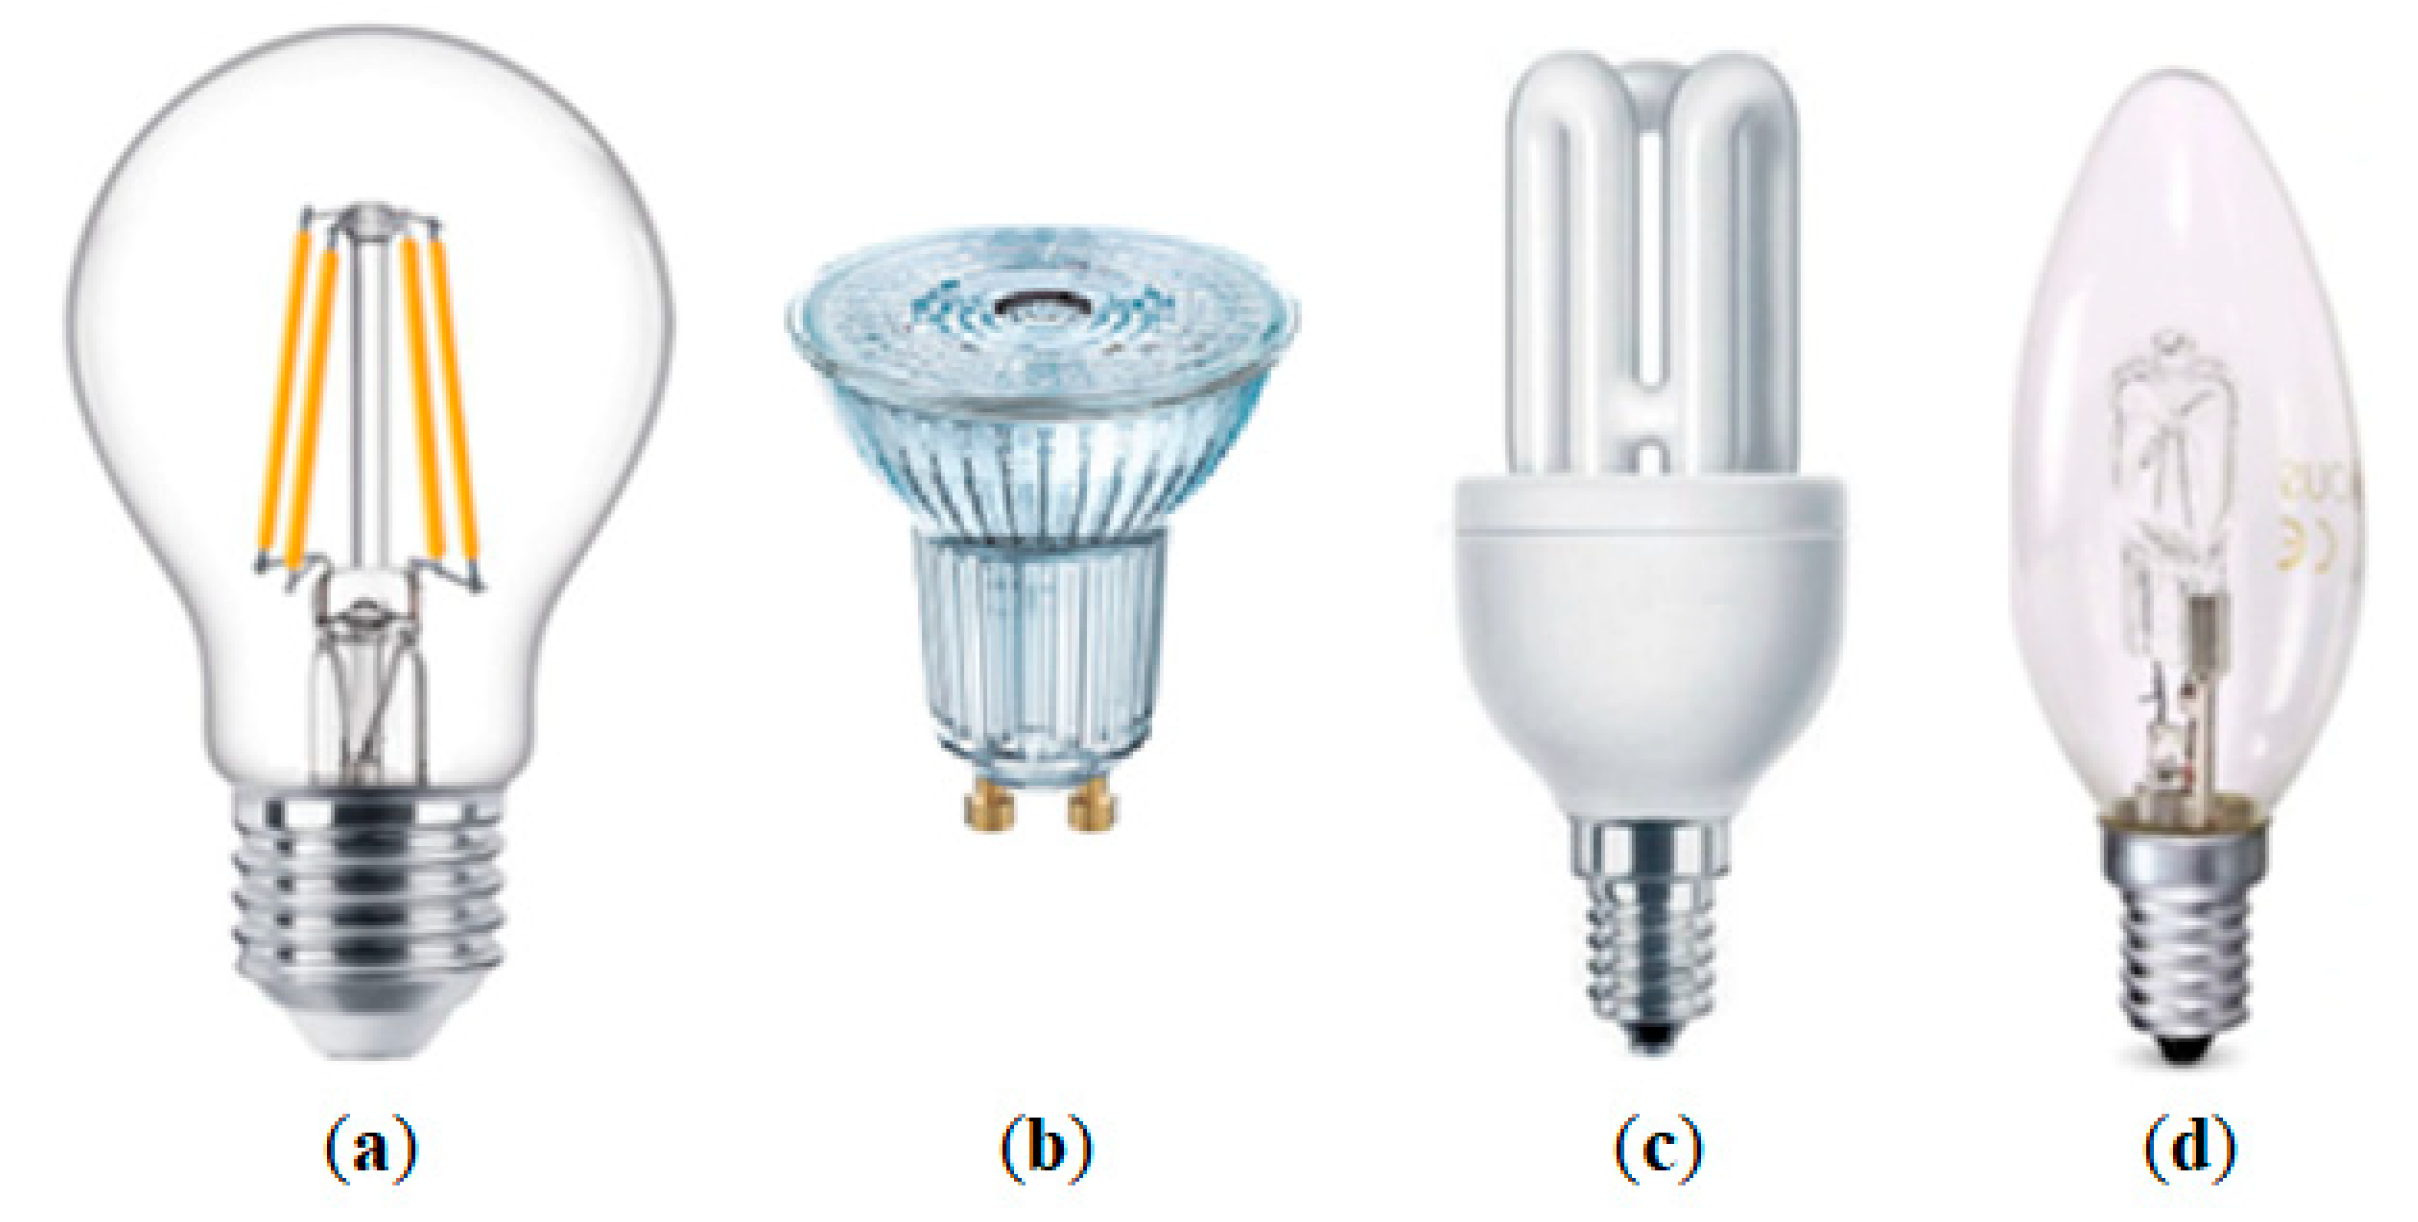
The first group of modern light sources, most represented in the research (18 items), is LED lighting (Figure 6a,b). This technology has become the most popular and rapidly advancing in recent years, as demonstrated by the fact that the luminous efficiency of standard LED sources typically ranges from 100 to 120 lm/W, with the latest LED chips achieving 180–200 lm/W. The advantage of this technology is its long operating life. The disadvantages of this group include the relatively high cost of their production in comparison to the other tested groups.
The second group of tested bulbs included two compact fluorescent lamps (CFLs) (Figure 6c). They are the first light sources that began to replace traditional bulbs. Fluorescent lamps offer a good service life, estimated at 6–8 years of use, and additionally provide luminous efficacy at an average level of 70 lm/W, with fluorescent lamp-type sources available with almost 100 lm/W efficiency. The disadvantages of this group of sources include the effect of light flicker, the emission of UV radiation (eliminated thanks to the filtering properties of the bulb glass), and the spectral distribution of light unfavorable to the human eye.
In the third type of light source, a single halogen bulb was tested (Figure 6d). Halogens offer a longer operating time than traditional light sources but much shorter than fluorescent lamps. The great advantage of this type of lighting is the potential lack of flicker and the favorable spectral distribution of the generated light, similar to sunlight, as well as the lack of UV radiation characteristic of fluorescent lamps. The disadvantage of halogens is low luminous efficiency, which is, on average, about 15 lm/W, and a high level of thermal radiation.
An additional group of tested light sources is an integrated LED module with an external constant current power supply. Regardless of the other tests, an integrated LED module with an external constant current power supply was additionally tested.
At this point, it is worth recalling that the light intensity (illuminance) E [lx] is a measure of how much light falls on a given surface, while the luminous flux Φ [lm] indicates the amount of light emitted by a light source.

3. Results

The tests were carried out in a room free from other light sources, although the measuring box was closed for each measurement to eliminate any influence of other light sources and ensure appropriate measurement accuracy. All measurements were carried out with a delay of 15–30 min in order to obtain stable temperature conditions of the tested light sources.

3.1. Flicker Studies

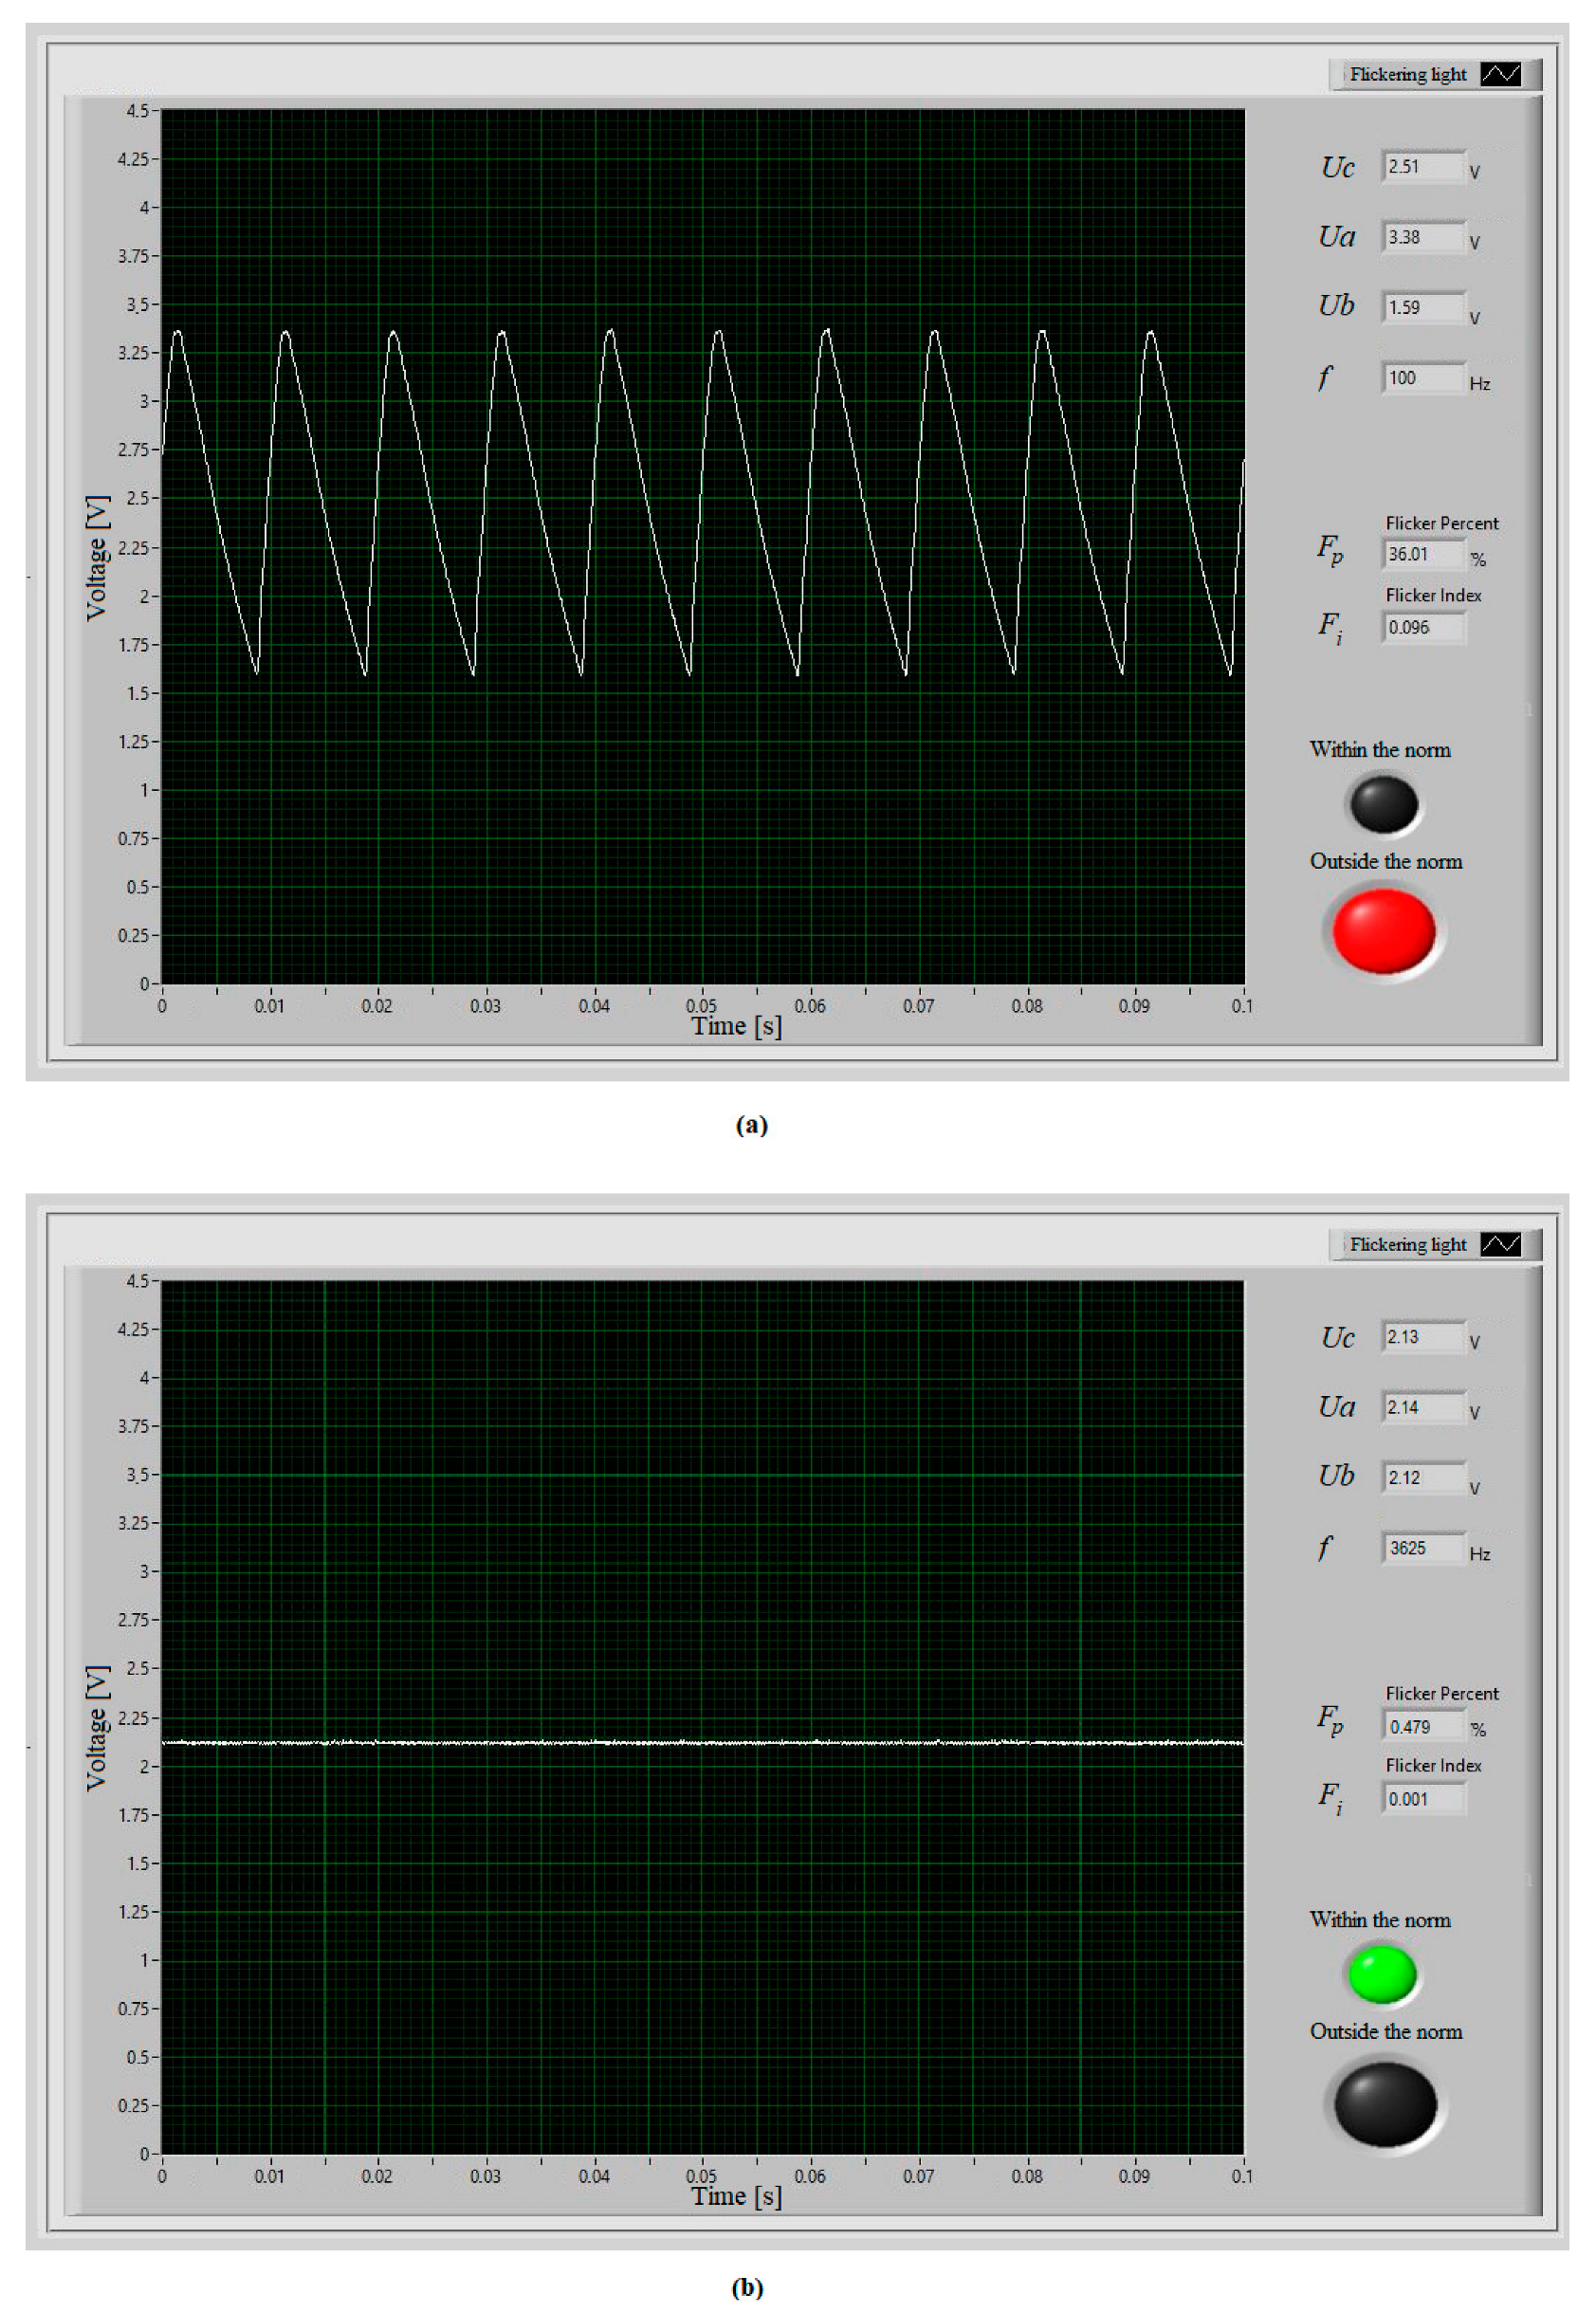
Figure 7 shows the waveforms recorded in the developed system for the light emitted by two exemplary LED light sources, along with a description of their basic properties.
Table 1 presents the basic features of the tested light sources. These are examples of lamps currently available on the market, among which LED lamps are the “first choice” of users. In addition to different LED lamps (18 initial items in Table 1), tests were carried out on two fluorescent lamps and one halogen lamp. Table 2 contains results obtained for individual tested light sources. The numbering used in Table 1 to designate individual light sources is consistent with the numbering used in Table 2. The voltage designations (Ua, Ub, and Uc—maximal, minimal, and mean voltage, respectively) correspond to indexes a, b, and c in Figure 3. The flicker frequencies fflick of all tested light sources were above 90 Hz; hence Formula (4) was used to determine the Fp_b limits. Fp values exceeding the recommended limits are marked in bold in Table 2.
The developed measurement system and the procedures for determining the flicker coefficients are also used in further tests described in the following subsections.

3.2. Study of the Influence of DC Power Supply Properties

The aim of this part of the research was to assess whether the properties of the DC power supply intended for cooperation with the LED lamp have an impact on the quality of the generated light.
The tests utilized the same recessed LED Arkos Swap S lamp (Arkoslight S.L., Velencia, Spain) (5 W, 675 lm) [30] mounted in a suspended ceiling. Tests were carried out in a dark room at a constant distance from the measuring photodiode of 100 cm. The lamp was powered successively by two different DC power supplies: a 300 mA DC power supply QH-40LP20-36x1 (Shenzhen Raiso Technology Co., Ltd, Zhongshan, China) [32] and a 350 mA DC power supply TCI Maxi Jolly (TCI Telecominicazioni Italia S.R.L., Saronno, Italy) [33]. It should be noted that the first power supply was not fully compatible with the tested lamp in terms of output voltage.
Table 3 contains the measurement results and the values of the coefficients determined in the developed measurement system.

3.3. Flicker Tests for Different Distances from the Light Source

Tests were conducted with a selected light source to determine how the distance between the measuring photodiode and the flickering light source affects the flicker level. The change in distance was achieved by moving one of the box walls, on which the photodiode was mounted, into the internal space of the box, ensuring full isolation of the reduced chamber from the environment. The study was performed using the halogen Piła Halogen E14 bulb. A very interesting relationship was observed here; although the voltage amplitude from the light measurement system was much greater at a distance of 10 cm than at 100 cm (0.48 V for 10 cm and 0.21 V for 100 cm), the flicker rates increased significantly at the distance of 100 cm (Fp = 12.58% and Fi = 0.037 for 10 cm, and Fp = 18.97% and Fi = 0.051 for 100 cm, respectively).
To explain the reasons for such results, additional tests were carried out using a LumiLED lamp (item 13 in Table 2), which showed minimal flicker. They included measurements at the same two distances of the photodiode from the light source as before. The results allowed us to determine the level of noise related to the operation of the measuring system, manifested by the scatter of instantaneous values of voltage samples carrying information about the measured light intensity. They showed an approximately 10-fold increase in the noise-to-measured voltage ratio for the increased distance. The noise introduced by the measuring system (mainly resulting from the operation of the analog-to-digital converter) had a significant impact on the values of the determined flicker indices. Therefore, in further work, it is necessary to verify the implemented measurement algorithms to determine the flicker indices.

4. Discussion

The conducted research largely confirms the current knowledge about the tested light sources. Starting with fluorescent light sources (CFL), guided by the manufacturer’s reputation, both the higher quality source (Philips Genie) and the lower quality (and cheaper) source (Polux Gold2) generated obvious classic flickering with a frequency of 100 Hz, but it is worth noting that the better quality source generates lower flickering level. The representative of the next group of light sources—halogens, also in line with expectations, generated flickering with a frequency of 100 Hz, which confirms the typical way of flickering for sources of this type.
LED light sources are the most interesting and currently the most important group of lighting devices. During the research, this group showed a whole spectrum of different results that are subject to interpretation, but after examining this group, it cannot be clearly stated that there is a clear relationship between LED technology and specific effects related to flickering. A number of the tested sources indicated the presence of flickering effects, often very intense, but a large number of the tested sources did not show any flickering.
During the study, measurements of the same light source were carried out at two different distances of the light source from the measuring photodiode to analyze the differences obtained in the results of flicker measurements. An example of a flickering light bulb was selected, and measurements were taken at distances of 10 cm and 100 cm. The measurement Table 4 shows the test results for the halogen lamp, but the measurement results for the LEDs and CFLs were similar to those of this group. At first glance, analyzing the graphical course of flickering, one could say that the flickering effect decreases with increasing distance because the flicker amplitude drops significantly, but in fact, the flickering effect intensifies, as shown by the measurement results. Both the percentage flicker index Fp and the flicker index Fi increased as the distance of the measuring photodiode from the light source increased (at a distance of 100 cm, they increased by approximately 50% compared to the value at a distance of 10 cm). There is one conclusion—the distance of the observer from the source of the flicker has a significant impact on the values of flicker indicators. However, studies have also shown that it is necessary to take into account the impact of the presence of interferences in the measurement path, which may cause additional inaccuracies in the values of the determined flicker indices.
The conducted research has shown the importance of selecting a DC power supply, supplying the light source with a voltage of appropriate quality for the generation of flickering light. Using the same light source, powered from two different DC sources, light of different quality was obtained. In the case of the QH power supply, the source generated a large flicker with the worst possible properties—high amplitude and low frequency. When using the TCI power supply, the flicker amplitude was negligible, and the frequency was very high, over 3 kHz. This example confirms that the generation of flickering can be caused not only by the light source itself or LED technology but also by the power source—the controller/power supply.

5. Conclusions

The studies that were conducted have shown that the flickering effect of light generated in modern lamps can also occur under stable voltage conditions in the supply network. Depending on the manufacturer and type of lamp, this flickering has different intensities in different frequency ranges. The methods presented in IEC standards [10,11] do not apply to the description of the flickering properties in these conditions.
The research concerned understanding the mechanism of the phenomenon of flickering light generated from various sources powered by electricity. Thanks to the construction of a stand based on optoelectronics and a modern DAQ measurement device, as well as using the measurement algorithm developed as part of the research in the NI Lab VIEW environment, observations and research on this interesting phenomenon were carried out. The most important observation may be formulated as follows:
  • The flickering effect is a common phenomenon in modern light sources. Flicker occurs in each of the studied groups of light sources. The first group tested were fluorescent lamps, which, according to the assumptions, generate constant flickering at a frequency twice as high as the frequency of the power supply. Flicker is a characteristic feature of fluorescent lamps, which has been confirmed by research. Studies of the second group of light sources, i.e., halogen sources, also confirmed the predictions. They generate light similarly to the sources from the first group, with a flicker frequency twice as high as the supply frequency. The research results of the first two groups were not very surprising due to the fact that these technologies have been known for a long time and, at the same time, their principle of operation. The most interesting tested group turned out to be LED technology sources, as some models of sources from this group did not show the flickering effect, but at the same time, a representative of this group had the worst flicker factor of all the tested sources (item 5 in Table 2). In this group, the general conclusion is ambiguous because it should be stated that LED technology may be associated with the appearance of a flickering effect, but this is not the rule. The presence of the flickering phenomenon is mainly related to the low price of the light source, but there are also exceptions to this rule. To sum up, to a greater or lesser extent, in each group, examples of light sources exhibiting the flickering effect were found;
  • Another element of the research was the differences in the intensity of flickering for close and far distances of the photodiode from the light source. At first glance, it seems that the flicker effect decreases with increasing distance, but this only decreases the flicker amplitude, which gives the false impression of less flicker. In fact, moving the photodiode further away from the source showed that flicker rates increase significantly with distance despite the smaller amplitude. This results from the method of calculating the flicker coefficients, i.e., the quotient of the amplitude and the sum of the extreme values of the light curve and the presence of noise generated in the measurement system;
  • As expected, the flickering phenomenon occurs more often in relation to sources categorized as cheap, but it does not exclude products from producers described as reputable due to their higher quality and price. Interestingly, one of the worst results, i.e., with the highest Fi and Fp coefficients, was obtained by a product from the Philips and Osram brands, a representative of premium light sources. It is also worth noting that the more expensive sources, despite the flickering effect, mostly met the IEEE recommendations [8,20], which means that reputable manufacturers usually calculate and design the production of light sources in such a way that is healthy for users. Therefore, the decision to purchase (usually wholesale) a specific type of light source should be preceded by an assessment of its properties, at least on the basis of the quality declaration provided by the manufacturer. Due to the possibility of flickering light from sources offered by different manufacturers, it is advisable to carry out measurements at the place of use of the lighting.
It should be mentioned that the indicators from the IEC 61000-3-3 standard, Plt and Pst, quoted in the work characterize the flicker effect caused only by voltage fluctuations at the source, and the coefficients used in the work to determine the level of flicker, Fi and Fp, result from both voltage fluctuations and properties of a particular light source.
In the developed measurement system, flicker coefficients are designated in time windows related to the current flicker frequency. It is an easy task to determine the coefficients for following time windows, and this way, the course of coefficients related, e.g., to the varying conditions of the supply voltage, is determined. The elaborated measurement and data processing system enables the estimation and recording of time-varying coefficients, e.g., in accordance with the procedures recommended by the IEC [10,11,24].

Author Contributions

Conceptualization, R.M. and B.P.; methodology, R.M. and D.W.; software, R.M. and D.W.; validation, J.M., B.P. and R.M.; formal analysis, J.M.; investigation, D.W. and R.M.; resources, B.P. and R.M.; data curation, R.M. and B.P.; writing—original draft preparation, R.M. and D.W.; writing—review and editing, R.M.; visualization, D.W., R.M. and B.P.; supervision, J.M.; project administration, R.M. All authors have read and agreed to the published version of the manuscript.

Funding

This research received no external funding.

Data Availability Statement

Data are contained within the article. The dataset is available on request from the authors.

Conflicts of Interest

The authors declare no conflicts of interest.

References

  1. Renewable Energy Sources (RES). Available online: https://emissions-euets.com/internal-electricity-market-glossary/1313-renewable-energy-sources-res (accessed on 10 August 2024).
  2. Miller, N.J.; Leon, F.A.; Tan, J.; Irvin, L. A review of temporal light modulation stimulus, responses, and measures. Light. Res. Technol. 2023, 55, 5–25. [Google Scholar] [CrossRef]
  3. Koponen, P.; Hansen, H.; Bollen, M. Interharmonics and Light Flicker. In Proceedings of the 23rd International Conference on Electricity Distribution, Lyon, France, 15–18 June 2015; pp. 1–5. [Google Scholar]
  4. Vučković, D.; Jovanović, D.; Stanković, V.; Cvetković, N.; Tasić, D.; Škerović, V. Light flickers and potential biological effects. Facta Univ. Work. Living Environ. Prot. 2022, 19, 137–148. [Google Scholar] [CrossRef]
  5. Blavette, A.; O’Sullivan, D.L.; Alcorn, R.; Lewis, T.W.; Egany, M.G. Impact of a Medium-Size Wave Farm on Grids of Different Strength Levels. IEEE Trans. Power Syst. 2014, 29, 917–923. [Google Scholar] [CrossRef]
  6. Batra, S.; Pandav, C.S.; Ahuja, S. Light Emitting Diode Lighting Flicker, its Impact on Health and the Need to Minimise it. J. Clin. Diagn. Res. 2019, 13, 1–5. [Google Scholar] [CrossRef]
  7. Martinsons, C.H.; Gaines, J.; Vollers, J.; Nachtrieb, R.; Wolfman, H.; Zissis, G. A Review of Contemporary Issues with Temporal Light Modulation of Lighting Systems. IEEE Trans. Ind. Appl. 2024, 60, 7902–7909. [Google Scholar] [CrossRef]
  8. Linden, J.; Dam-Hansen, C. Flicker Explained: Guide to IEC for the Lighting Industry; DTU Library: New Delhi, India, 2022; pp. 1–18. [Google Scholar]
  9. A Guide to Voltage Fluctuation and Light Flicker. Available online: https://www.caledoncontrols.co.uk/datash/voltage%20flicker.pdf (accessed on 16 June 2024).
  10. IEC 61000-3-3:2013+AMD1:2017+AMD2:2021; CSV Consolidated Version. Electromagnetic Compatibility (EMC)—Part 3-3: Limits—Limitation of Voltage Changes, Voltage Fluctuations and Flicker in Public Low-Voltage Supply Systems, for Equipment with Rated Current ≤16 A per Phase and Not Subject to Conditional Connection. IEC: Genève, Switzerland, 2013.
  11. IEC 61000-4-15:2010; Electromagnetic Compatibility (EMC)–Part 4: Testing and Measurement Techniques–Section 15: Flickermeter–Functional and Design Specifications. IEC: Genève, Switzerland, 2010.
  12. Blavette, A.; O’Sullivan, D.L.; Alcorn, R.; Egan, M.G.; Lewis, T.W. Simplified estimation of the flicker level induced by wave energy farms. IEEE Trans. Sustain. Energy 2016, 7, 1216–1223. [Google Scholar] [CrossRef]
  13. Hanzelka, Z.; Bien, A. Voltage Disturbances Flicker Measurement. 2005. Available online: https://powerquality.blog/2021/02/01/voltage-disturbances-flicker-measurement/ (accessed on 3 June 2024).
  14. Application Guide to the European Standard EN 50160 on “Voltage Characteristics of Electricity Supplied by Public Distribution Systems”; Eurelectric, Union of the Electricity Industry: Brussels, Belgium, 1995.
  15. Palczynska, B. Virtual application of flickermeter. Metrol. Meas. Syst. 2001, 8, 165–177. [Google Scholar]
  16. Pałczyńska, B. The Short-Term Flicker Severity Level Measured in the Industrial Power System Supplying the Rolling Mill Motors [Dataset]; Gdańsk University of Technology: Gdańsk, Poland, 2021. [Google Scholar] [CrossRef]
  17. Silsüpür, M.; Türkay, B.E. Flicker Source Detection Methods Based on IEC 61000-4-15 and Signal Processing Techniques—A Review. Balk. J. Electr. Comput. Eng. 2015, 3, 93–97. [Google Scholar] [CrossRef]
  18. Dim-to-Warm LED Lighting: Initial Benchmarks. Next Generation Lighting Industry Alliance LED Systems Reliability Consortium 2019. Available online: https://www.nglia.org/documents/LSRC_Dim-to-Warm_Paper_final_073019r.pdf (accessed on 15 September 2024).
  19. Dim-to-Warm LED Lighting: Stress Testing Results for Select Products. U.S. Department of Energy—Solid-State Lighting Technology Area 2020. Available online: https://www.energy.gov/sites/prod/files/2020/04/f73/ssl-d2w-led-stress-testing-2020.pdf (accessed on 15 September 2024).
  20. IEEE Std 1789-2015; IEEE Recommended Practices for Modulating Current in High-Brightness LEDs for Mitigating Risk to Viewers. Standards Committee of the IEEE Power Electronics Society: New York, NY, USA, 2015.
  21. IEC TR 61547-1; Equipment for General Lighting Purposes–EMC Immunity Requirements–Part 1: Objective Light Flickermeter and Voltage Fluctuation Immunity Test Method. IEC: Genève, Switzerland, 2014.
  22. CIE Technical Note 006:2016; Visual Aspects of Time-Modulated Lighting Systems–Definitions & Measurement Models. CIE: Mumbai, India, 2016.
  23. CIE Technical Note 012:2021; Guidance on the Measurement of Temporal Light Modulation of Light Sources and Lighting Systems. CIE: Mumbai, India, 2021.
  24. ANSI/IES LM-90-20; Approved Method: Measuring Luminous Flux Waveforms for Use in Temporal Light Artifact (TLA) Calculations. Illuminating Engineering Society: New York, NY, USA, 2020.
  25. Metal Can TO39 Ambient Light Sensor BPW 21, Silicon Photodiode for the Visible Spectral Range, ams-OSRAM AG. Available online: https://look.ams-osram.com/m/2ce36b84bdf847e/original/BPW-21.pdf (accessed on 5 May 2024).
  26. DAQ NI USB 6008. Available online: https://www.ni.com/docs/en-US/bundle/usb-6008-specs/page/specs.html (accessed on 5 May 2024).
  27. Voltcraft LX-10 LUXMETER. Available online: https://asset.conrad.com/media10/add/160267/c1/-/en/001662853DS01/datenblatt-1852512-voltcraft-vc-8314265-iso-lx-10-luxmeter-kalibriert-iso-0-199900-lx.pdf (accessed on 5 May 2024).
  28. PHILIPS Professional LED Lighting Catalogue 2024. Available online: https://www.eselo.lv/riki/katalogi/cat/philips_global_trade_catalog_2024_en.pdf (accessed on 15 September 2024).
  29. LED Luminaires, Ledvance/Osram Company. Available online: https://rajelectricals.co.in/wp-content/uploads/2023/06/Osram-Catalog.pdf (accessed on 15 September 2024).
  30. Akroslight. The 2024 Collection iCatalogue. Available online: https://www.arkoslight.com/arkoslight-interactive-catalogue/ArkoslightiCatalogueSetup1.0.0.exe (accessed on 15 September 2024).
  31. LED Lighting Products. Energy Efficient End-use Equipment (4E). International Energy Agency. SSL Annex Task 6. Available online: https://www.iea-4e.org/wp-content/uploads/2022/11/Task-6-LED-Lighting-Product-Tiers-October-2022-final.pdf (accessed on 15 September 2024).
  32. Constant Current LED Driver QH-40LP20-36X1. Available online: https://imgusr.tradekey.com/images/uploadedimages/brochures/4/9/11553848-201804240740495adedf819d681.pdf (accessed on 15 September 2024).
  33. Direct Current Electronic Driver DC MAXI JOLLY US DALI. Available online: https://win.tcisaronno.com/downloads/?IDnode=4989&field=docs&language=EN (accessed on 15 September 2024).
Figure 1. Functional diagram of the flickermeter [15].
Energies 17 05080 g001
Figure 2. The short-term flicker severity indicator measured in the industrial supply line of rolling mills [16].
Energies 17 05080 g002
Figure 3. Elements of the light intensity curve used to determine the Fi and Fp coefficients.
Energies 17 05080 g003
Figure 4. Diagram of the measurement system.
Energies 17 05080 g004
Figure 5. The characteristics of the measurement system.
Energies 17 05080 g005
Figure 6. View of tested examples of popular light sources with Edison screw (E27, E14) or Bi-pin (GU10) terminals [31]: (a,b) LED bulbs; (c) fluorescent bulb; (d) halogen bulb.
Energies 17 05080 g006
Figure 7. Examples of light waveforms recorded in the LabVIEW (ver. 20.0.1) application, generated by (a) Polux LED E27 (Sanico Electronics PL Sp. z o.o., Marki, Poland); (b) Tungsram LED E27 (Tungsram Operations Kft., Budapest, Hungary).
Energies 17 05080 g007
Table 1. Designations and basic properties of the tested bulbs.
No.Manufacturer and TypeNominal Power
P [W]
Luminous Flux
Φ [lm]
1Polux Platinum LED E27 G455.5480
2Tungsgram LED E27 G454.5470
3Philips CorePro LED luster E27 G455.5470
4Philips Master Value LED E27 A603.4470
5Philips Master LED bulb E27 A6012806
6Philips CorePro LED bulb E27 A605.5470
7Kanlux Apple LED E27 A608800
8Osram Retrofit LED E27 G1256.5806
9Philips Hue White E279806
10IKEA SOLHETTA LED bulb E14 G452.2200
11Elitecho B35G LED E14 4.8470
12Osram Parathom LED E144470
13LumiLed LED GU103270
14No name (China) LED GU101105
15Osram LED Value LED GU10 PAR164230
16Osram Parathom PRO LED GU10 PAR163.4230
17Philips Hue White Ambiance LED GU105350
18Philips Hue White LED GU105.2400
19POLUX Gold2 mini FST2 fluorescent E146315
20Philips Genie Hg fluorescent E148425
21Pila Halogen E14 P4542630
Table 2. The results of measurements of the light emitted by the tested bulbs and the values of the determined coefficients.
No.Uc
[V]
Ua
[V]
Ub
[V]
fflick
[Hz]
Fp
[%]
Fi
[-]
Fp_b
[%]
12.513.382.2110036.010.0978
22.132.141.5936350.470.001290.8
33.493.513.4735250.580.001282
41.331.351.311001.340.0028
53.413.480.00100100.000.0098
63.423.473.361001.60.0038
72.122.172.0621662.660.006173.28
82.022.221.851009.280.0248
92.492.712.2110010.100.0298
100.900.940.8469505.430.012556
111.121.131.1132740.910.002261.92
120.890.910.871002.000.0038
133.663.673.6531070.270.001248.56
142.332.530.7310065.890.1758
152.212.302.1181184.331.011649.44
163.153.193.101001.460.0038
172.113.970.71201969.790.157161.52
182.322.341.90205410.100.002164.32
191.101.200.9410011.940.0288
204.044.263.681007.350.0188
211.131.340.9110018.970.0528
Table 3. Measurement results of emitted light and values of determined coefficients for tested bulbs powered from two different DC power supplies.
DC
Power Supply
Uc
[V]
Ua
[V]
Ub
[V]
f
[Hz]
Fp
[%]
Fi
[-]
QH40LP202.403.241.7010031.340.087
TCI Maxi Jolly2.232.251.2233960.850.001
Table 4. Measurement results of emitted light and values of determined coefficients for tested bulbs at different distances from the measuring photodiode.
Distance [cm]Uc
[V]
Ua
[V]
Ub
[V]
f
[Hz]
Fp
[%]
Fi
[-]
103.844.323.3610012.580.038
1001.131.340.9110018.970.052
Disclaimer/Publisher’s Note: The statements, opinions and data contained in all publications are solely those of the individual author(s) and contributor(s) and not of MDPI and/or the editor(s). MDPI and/or the editor(s) disclaim responsibility for any injury to people or property resulting from any ideas, methods, instructions or products referred to in the content.