Abstract
The increasing uncertainty of wind power brings greater challenges to the control for mitigation of cascading failures. In order to minimize the risk of cascading failures in large-scale wind power systems at a lower economic cost, a multi-stage blocking control model is proposed based on sensitivity analysis. Firstly, the propagation mechanism of cascading failures in power systems with wind power integration is analyzed, and the propagation path of such failures is predicted. Subsequently, sensitive lines that are prone to failure are identified using the power sensitivity matrix, taking into account the effects of blocking control on the propagation path. By constraining the power flow of these sensitive lines, a multi-stage blocking control model for the predicted cascading failure path is proposed with the objective of minimizing the control cost and cascading failure probability. Based on probabilistic optimal power flow calculations, the constraints related to wind power uncertainty are transformed into opportunity constraints. To validate the effectiveness of the proposed model, the IEEE 39-node system is used as an example, and the results show that the obtained control method is able to balance economy and safety. In addition, the control costs for the same initial failure are higher as the wind power penetration rates and confidence levels increase.
1. Introduction
In recent years, global blackouts have become increasingly frequent, predominantly attributed to random failures that trigger abnormal operational states within the system, subsequently leading to cascading failures across various components [1,2,3]. Cascading failures are a serious threat to the safe operation of the power system.
According to data released by the Global Wind Energy Commission (GWEC), in 2022, the grid-connected capacity of global wind power increased by 77.6 GW, with an additional offshore installed capacity of 8 GW. The top five countries in terms of newly added wind power installations are China, the United States, Brazil, Germany, and Sweden. In China, wind power constitutes 13% of the total installed power generation capacity, providing 7.5% of the total electricity consumption. With the increasing integration of wind pow-er sources into the grid, there is heightened uncertainty in source-side output and new dynamic behavioral properties of the grid, leading to an escalated risk of cascading failures in the power grid [4]. Therefore, it is very crucial to control cascading failures under the uncertain nodal power injection of wind power.
Currently, significant progress has been achieved in researching the prevention and control of cascading failures. Modern digital systems [5], complex systems theory [6,7], and complex network theory [8,9] are employed to investigate early warning, fault situation identification, and prevention control of cascading failures. However, modern digital systems are highly dependent on data, and monitoring systems within power systems involve numerous agents with varying data structures. Complex network theory and complex system theory primarily analyze the macroscopic characteristics of the power grid. Consequently, these limitations impede the guidance for formulating control schemes to prevent power grid cascading failures. Subsequently, adopting control methods based on deterministic safety criteria becomes crucial. This involves considering safety constraints during grid operation and employing sensitivity analysis [10], mathematical programming [11,12], and other methodologies to devise optimal control schemes. The objective is to eliminate abnormal operational states of the power grid and prevent cascading failures. In a specific emergency control model proposed in [10], sensitivity analysis is used to identify power adjustment nodes and prioritize the adjustment sequence of node sets based on their impact on line power adjustment. This approach successfully addresses the cascading overload tripping problem caused by line overload through multiple rounds of system power adjustment. Meanwhile, Dvorkin et al. [11] introduced a safety-constrained optimal power flow model into cascading failure preventive control, ensuring the lowest-cost dispatch of controllable generators while adhering to all operational constraints in both pre- and post-accident states. To address the high control cost or practical infeasibility associated with preventive control alone, Zhai et al. [12] established a cascading failure defense model based on preventive-emergency coordinated control. This model optimizes the initial operating state of the system using preventive control, considers the power grid’s constraints on the tolerability of cascading failure consequences, and maximizes the dispatchable potential of generators during an accident, effectively suppressing cascading failures under economically optimal conditions. While these control models are generally effective for selected failure modes, they often overlook the influence of power grid operational status on component failure probability, leading to challenges in accurately quantifying the power grid’s safety degree and resulting in conservative control schemes. Consequently, several studies have incorporated risk assessment theory into cascading failure control, considering uncertainties in system operation to develop control schemes that balance safety and economy. For instance, Wang et al. [13] proposed a risk assessment-based preventive-blocking coordinated control model to implement control measures at the link with the highest risk in the cascading failure path. This approach simplifies the optimization objective. Rui et al. [14] established a coordinated control model with system risk and control cost as indicators, and employed a multi-objective particle swarm optimization algorithm accounting for preferences to determine the optimal control scheme.
In fact, most studies focus on fault voltage ride-through control of wind turbines, security-constrained optimal power flow considering wind power uncertainty, and prevention control of cascading failures. However, hierarchical blocking control for mitigating cascading failures is rarely addressed. The predominant focus in existing research is on power grid operation scenarios where source output is predetermined. These studies deduce the propagation path of cascading failure based on the law of power flow transfer to formulate control schemes. However, in systems incorporating wind power, the substantial uncertainty in their power output heightens the complexity of controlling cascading failures. On one hand, when the proportion of wind power integrated into the grid is substantial, the fluctuating nature of its output introduces greater uncertainty in line power flow. Consequently, the challenge of addressing line overload becomes more severe and intricate to prevent. On the other hand, the uncertainty associated with wind power output may disrupt the power balance of the system. During such instances, the number and adjustment amplitude of conventional units participating in the adjustment process increase. This inevitably alters the flow transfer dynamics and may even lead to changes in the cascading failure path, accentuating the occurrence of new failures during the control process. Hence, formulating a cascading failure control scheme that considers both safety and economy is crucial. This approach ensures the safe and stable operation of the system by accounting for the impact of wind power output uncertainty on cascading failure.
Building upon the aforementioned analysis, this study presents a multi-stage blocking control model for cascading failure that explicitly considers the impact of wind power output uncertainty on sensitive lines within the framework of power systems with wind power integration. The key contributions of this article are outlined as follows:
- (1)
- A probabilistic power flow is employed to delineate the uncertainties associated with wind power output, serving as the computational foundation for forecasting cascading failure pathways. We propose a cascading failure path prediction method tailored for power systems incorporating wind power integration.
- (2)
- We analyze the mutual influences among the uncertainty of wind power output, the propagation path of cascading failure, and the control measures implemented to mitigate these effects. We propose the utilization of a power sensitivity matrix to identify susceptible lines prone to failure due to control measures. In the control model, distinct safety constraints are established for these sensitive lines to diminish the likelihood of failure and avoid causing new line failures during the control process, particularly in the context of cascading failures.
- (3)
- Taking into account the uncertainties in control variables arising from wind power, constraints involving random variables are expressed as expected value constraints using probability optimal power flow. Additionally, the boundary constraints of output variables are portrayed as chance constraints. We construct a multi-stage blocking control model for cascading failures in wind power systems, ensuring the economic and safe implementation of the derived control scheme.
- (4)
- The efficacy of the presented control model is validated through simulation analysis. The impact of large-scale wind power on cascading failure blocking control is examined by considering the wind power penetration rate and confidence level as key factors in the analysis.
The rest of this paper is organized as follows: Section 2 introduces the propagation path of cascading failure in power systems with wind power integration; Section 3 describes the sensitive lines in power systems with wind power integration. The blocking control model of cascading failure in power systems with wind power integration is proposed in Section 4; the simulation and results on IEEE test systems are given in Section 5, and Section 6 concludes the paper.
2. Propagation Path of Cascading Failure in Power Systems with Wind Power Integration
2.1. Probabilistic Power Flow Calculation
With the ongoing development of new energy sources, the consideration of uncertainty in new energy output at the source side is becoming increasingly crucial in probabilistic power flow calculations [15]. The analytical approach, exemplified by the cumulant method, linearizes the mathematical relationship between input and output random variables. It employs simple algebraic operations between cumulant variables instead of complex convolution operations to calculate the cumulant variables of each order of output variables. The probabilistic characteristics of output variables are then derived through the level expansion method, offering the advantages of reduced computational effort and higher computational efficiency [16]. Consequently, this paper develops a probabilistic power flow model that takes into account wind power uncertainty based on the cumulant method. Uncertainties in the wind power system primarily arise from the variability in user-side load demand and the fluctuations in the active output of the wind turbine due to changes in wind speed. In this paper, we assume that the power at the load node approximately follows a normal distribution, and the power output model is expressed by Equation (1):
where is the probability density function of active power. is the probability density function of reactive power. are the expectation and variance of load active power, respectively. are the expectation and variance of the load reactive power, respectively.
In this paper, it is assumed that the wind speed follows the Weibull distribution, and its probability density function is represented by Equation (2):
where is the shape parameter of the Weibull distribution, is the scale parameter of the Weibull distribution. According to Reference [17], the relationship between wind power active output and wind speed satisfies can be described as:
where and are the rated power and rated wind speed of the wind turbine, respectively. and are the cut-in wind speed and cut-out wind speed of the wind turbine, respectively.
A probabilistic power flow model is employed in this work, which is based on t the AC power flow. In the AC power flow model, the nodal power equation is expressed in matrix form. Subsequently, a Taylor series expansion is conducted around the base run operating point, wherein higher order terms are disregarded, resulting in the following simplified expression:
where and are the node state variables (including node voltage amplitude and phase angle) and their changes. and are the branch power flow variable (including branch active power flow and reactive power flow) and its variation. The subscript 0 indicates the value at the base run point. and are the sensitivity matrix. ; ; ; is the Jacobi matrix; is the node injection power perturbation.
According to the cumulant property, the random perturbation of the injected power at the node can be mathematically represented as:
where add the -order and half invariance of the power to the node . and add the -order and half invariance of the power of the generator and the power of the load to the node , respectively.
Thus, the -order cumulant of the output variable can be obtained as:
where and are the matrices formed by the matrix and the powers of the elements in the matrix, respectively.
After applying Equations (5) and (6) to calculate the cumulant of the output variable, the probability distribution function of the output variable, specifically the node voltage and the line power flow, can be derived using the Gram–Charlier progression expansion method.
2.2. Prediction of Cascading Failure
Cascading failure is a phenomenon characterized by the simultaneous occurrence of multiple factors, a short propagation time, and severe consequences. According to the literature [18], it is noted that the primary driving factor behind cascading failure in new energy power systems is still predominantly overload. Therefore, the present study aims to analyze and mitigate the occurrence of overload-dominated cascading failure. Overload-dominated cascading failure is a phenomenon in which a system experiences a failure that alters the optimal power flow transmission path. This leads to a redistribution of power flow from the faulty line to the non-faulty line, causing the non-faulty line to become overloaded. As a result, protection measures are triggered to remove the non-faulty line, leading to a chain reaction that ultimately results in the collapse of the entire system [19]. The probability of line tripping due to overload is commonly represented using a piecewise function [20].
where is the protection recessive fault probability, which is 0.01. is the active power on the line . and are the rated power and limit transmission power of the line , respectively.
When the proportion of wind power is high, the fluctuating nature of its power output results in line power flow that exhibits uncertain characteristics. The probabilistic power flow model can be employed to determine the probability distribution state of power flow in power systems that incorporate wind power. However, the power flow along the line is no longer considered a constant value, but rather a probability density function. As a result, it is not possible to directly substitute this function into Equation (7) in order to determine the line outage probability. Therefore, Equation (8) combines the probability density function of the line power flow and the line outage probability to determine the line outage probability in power systems with wind power integration.
where is the probability density function of line active power. is the probability of line tripping due to overload.
In the context of cascading failure propagation, the subsequent faulty lines are primarily impacted by the disconnection of the line in the previous stage if no mitigation measures are implemented. Therefore, the prediction of the propagation path of cascading failures in power systems with wind power integration can be achieved by continuously selecting the line with a higher probability of outage as the subsequent faulty line, as determined by Equation (8).
3. Sensitive Lines in Power Systems with Wind Power Integration
3.1. Impact of Blocking Control on the Propagation of Cascading Failure
Blocking control refers to the application of control measures in the early stages of the projected propagation trajectory of cascading failure, with the objective of hindering the further amplification of the failure. The control strategy for mitigating overload-dominated cascading failure primarily focuses on altering the power flow distribution state of the system by making adjustments to generator output and reducing the load. This measure is implemented in order to reduce the impact of excessive line load and prevent the occurrence of cascading failures. The redistribution of power flow within a system can result in alterations to the load rate of additional transmission lines and the outage probability of lines. This, in turn, has the potential to induce overload occurrences and trigger subsequent cascading reactions through the tripping of overloaded lines. Figure 1 depicts the dynamic relationship between the uncertainty of wind power output, the propagation of cascading failures, and the implementation of blocking control measures in power systems that incorporate the integration of wind power. The equilibrium of the system is disrupted due to the modification in wind power generation and the tripped lines caused by overload. The redistribution of power flow on tripped lines has a prominent influence on the optimal control measures. Currently, there is a rise in both the quantity and magnitude of conventional units participating in the process of adjustment. This increase can potentially exert a substantial influence on the operational status, resulting in a modification of the propagation path of cascading failures. Therefore, subsequent to the implementation of control measures, the propagation trajectory of cascading failure is influenced by both line disconnection and injection power alteration. The outcome will inevitably deviate from the initial predicted result, resulting in the failure of the original blocking control and hastening the malignant propagation of failure. In actuality, when there is a significant change in the power output of the generator, only a portion of the transmission lines are significantly affected and experience overloading. If the specific lines responsible for the cascading failure can be identified and appropriate defensive measures are implemented during the design of a blocking control scheme, it can effectively prevent the control measure from modifying the transmission path of the cascading failure. This ensures that the blocking control measure successfully achieves the intended outcome.
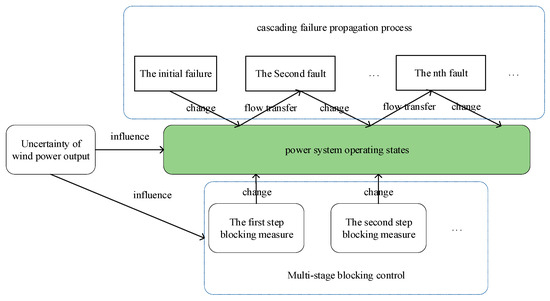
Figure 1.
Interactive impact diagram of wind power, control measures, and cascading failure propagation process.
3.2. Determination of Sensitive Lines Based on Power Sensitivity Matrix
Based on the provided power grid topology and parameters, as well as the current correlation coefficient matrix, it is possible to derive a power sensitivity matrix that represents the relationship between the injected power variable of a node and the power variable of the line. From this, it can be concluded that the power sensitivity between the power flow variables of the branch in the power grid and the injected power variables of the node is:
where is the current correlation coefficient between the current phasor of branch and the injection current phasor of node ; and are the first terminal voltage modulus and phase angle of branch , respectively; and are the voltage mode values and phase angles of node , respectively.
Considering that the voltage amplitude and phase angle of each node in the power flow calculation of the transmission network are not significantly different, and can be approximately equal to 1. Therefore, Equation (9) can be equivalent to:
The current correlation coefficient can be calculated by Equation (11):
where, for a power grid with nodes and branches, is its current correlation coefficient matrix, is its branch admittance matrix, is its node incidence matrix, is the node admittance matrix.
From Equation (10), it is evident that power sensitivity is solely dependent on the parameters and topology of the power grid, and remains unaffected by the operational state of the system. The influence of node injection power change on the flow power on the branch is directly proportional to the power sensitivity between each line and node.
The blocking control of cascading failure is primarily accomplished through the adjustment of the generator’s output. Hence, the power sensitivity matrix for each controllable generator node and all lines is computed using Equation (10) prior to implementing the blocking control strategy. The lines that experience significant changes in their adjustment are identified as sensitive lines based on the magnitude of their power sensitivity. When implementing control measures, it is advisable to prioritize the prevention and control of these factors. This approach not only reduces the likelihood of new failures caused by control blockages, but also mitigates the issue of high control costs.
4. Blocking Control Model of Cascading Failure in Power Systems with Wind Power Integration
Based on the aforementioned analysis, it is evident that the incorporation of control constraints is crucial in order to effectively manage the power flow in sensitive transmission lines. This measure is imperative in order to guarantee that the implementation of blocking control measures does not modify the propagation path of cascading failure following the integration of wind power. After the integration of wind power, the control variables, such as node injection power adjustment, and the output state variables, including power flow and voltage, may exhibit uncertain behavior. Traditional control models that rely on deterministic optimal power flow are no longer applicable for blocking cascading failures. The application of probability optimal power flow with opportunity constraints and the integration of probability information of random variables have gained popularity in the optimization of new energy power systems. This approach entails the manipulation of different system parameters to account for the potential scenario in which the formulated scheme may not meet the constraint conditions with a certain level of confidence. Hence, the objective of this study is to mitigate the control cost associated with each link in the transmission path of cascading failure. This can be achieved through the adjustment of output from conventional units, discontinuation of wind power, and load reduction. The aforementioned objective is accomplished by employing the calculation of probabilistic optimal power flow. Constraints involving stochastic control variables are commonly formulated as expected value constraints, while boundary constraints on output state variables are expressed as opportunity constraints. The proposed multi-stage blocking control model aims to effectively mitigate the occurrence and propagation of cascading failure.
4.1. Objective Function
Considering that the purpose of cascading failure blocking control is to reduce the probability of cascading failure in the system with the most economical control cost possible, the objective function is:
where the superscript “—” indicates the expected value of the control variable. is the number of links passed by the cascading failure propagation paths. and are the upward and downward power adjustment of the link adjustable generator node . is the downward power adjustment of the link wind turbine node . is the load reduction amount of the first link load node . , and are the cost coefficients of adjusting generator output, wind abandonment penalty and load shedding; considering that grid dispatchers do not want to lose load on the grid, they will adjust generator output first and then consider wind abandonment afterwards, so the cost of load shedding is much higher than the generator dispatching cost and wind abandonment penalty [21]. , and are the adjustable generators, the number of wind turbine nodes and the number of load nodes, respectively.
4.2. Expectation Constraints
The expectation constraints of the cascading failure blocking control model, which is based on probabilistic optimal power flow, primarily encompass the power balance and generator output range constraints.
- (1)
- Power balance constraint:
- (2)
- Upper and lower bound constraints on control variables:
4.3. Chance Constraints
In the context of cascading failure blocking control, the active power of the transmission lines and the amplitude of node voltages are crucial output state variables. The uncertainty associated with wind power introduces a probability distribution for these state variables. However, imposing strict security constraints to ensure compliance can result in high control costs that may not align with the practical scenario. Therefore, an alternative approach is to express these constraints as opportunity constraints, allowing for a certain level of violation of the security constraints with a specified confidence level. Furthermore, it is imperative to implement essential measures for preventing and controlling failures of sensitive lines, particularly those greatly affected by adjustments in generator output. The limitations on setting output state variables are as follows:
where is the probability that the inequality constraint is established. is the preset confidence level. and are the active power flow on the line and the voltage amplitude of the node , respectively. is the artificially set control coefficient, is a sensitive line set.
The approach used in this paper to handle chance constraints is based on the deterministic transformation method proposed in the literature [22,23]. Equations (18) and (19) can be expressed uniformly as follows.
where and generalize the upper and lower limits of the variable taken. From the probabilistic power flow calculation, the probability distribution state of the output variable can be obtained, and then the probability density function and quantile function of the random variable can be fitted. Suppose that the quantile of the random variable at the confidence level is , then Equation (20) can be transformed into:
The chance constraint is consequently converted into a deterministic inequality constraint, and the probabilistic power flow calculation, which relies on the chance constraint, is resolved through the subsequent steps.
First, without considering the uncertainty, is transformed into a deterministic optimal power flow problem to solve the optimal control scheme.
Subsequently, the control scheme is utilized to solve the probabilistic power flow, taking into account the uncertainty in wind power output. This analysis yields the probability distribution and quantile function of line power flow and node voltages.
Finally, the quantile of the output variable is compared with the boundary of the variable using Equation (21) at a specified confidence level for the chance constraint. The success of the solution is determined by the satisfaction of the constraint. However, in the event that the constraint is breached, the computational boundary of the variable is modified to rectify the deterministic optimal trend. The boundary adjustment strategy is denoted by Equation (22).
where is the adjustment parameter to prevent unreasonable adjustment of the upper and lower limits of the random variables; 5% is desirable, and if , then the upper limit of the calculation is adjusted. If , the lower limit of the calculation is adjusted.
Furthermore, Equation (18) demonstrates that altering the control coefficient has an impact on the permissible power flow limit. A higher value of the control coefficient indicates a lower level of control effort, which in turn increases the likelihood of a line failure. However, this reduction in control effort is accompanied by a corresponding decrease in control costs. The objective of implementing cascading failure blocking control is to mitigate the likelihood of cascading failure while minimizing the associated control expenses. During the initial phases of cascading failure, the system exhibits a robust resistance to interference, which allows for the possibility of adjusting the control coefficient of non-sensitive lines. This adjustment permits a slight increase in power flow beyond the limit, thereby reducing control costs. However, it is crucial to prevent the occurrence of cascading failure before the system collapses.
4.4. Model Solution
The development of the proposed cascading failure blocking control model is based on the probabilistic optimal power flow, which involves solving a nonlinear programming problem using AC power flow. The direct solution to this problem is computationally intensive, and ensuring convergence is challenging. Hence, this study employs the concept of linearizing the AC power flow in order to estimate the nonlinear component of the constraints through the utilization of the Taylor series expansion method [24]. This approach transforms the problem into a linear programming problem. The proposed model and the optimization program are constructed using MATLAB programming tools, and the CPLEX solver is employed for solving. The flowchart of the proposed method is shown in Figure 2.
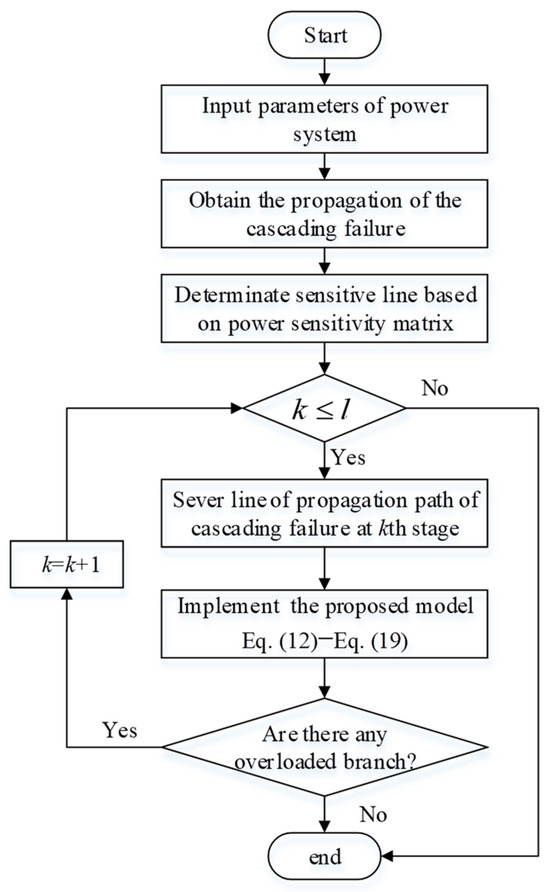
Figure 2.
Flowchart of the proposed method.
5. Simulation and Results
In this paper, the IEEE 39-node system is used as a test arithmetic example; it contains 10 generators, 39 nodes and 46 lines with a total load of 6254.23 MW. The system section line diagram is shown in Figure 3. Among them, the generators on node 33 and node 37 are replaced by wind farms with installed capacities of 630 MW and 540 MW, respectively, where the total wind power penetration rate is about 20%. Assuming that the local wind speed approximately obeys the Weibull distribution and the wind farm active output is only related to the wind speed, the shape parameter and scale parameter of the Weibull distribution are 4 and 10.35, respectively, and the wind turbine models installed in the wind farm are WD5000 units, whose cut-in wind speed is 3 m/s, cut-out wind speed is 25 m/s, and rated wind speed is 11.3 m/s. , and will be taken as USD $1/MW, $10/MW and $100/MW, respectively. is 1.2 in the link of the cascading failure propagation path, and 1 in the link. The generator adjustment parameters are shown in Table 1. The data, shown in Figure 3 and Table 1, come from the MATPOWER package in MATLAB.
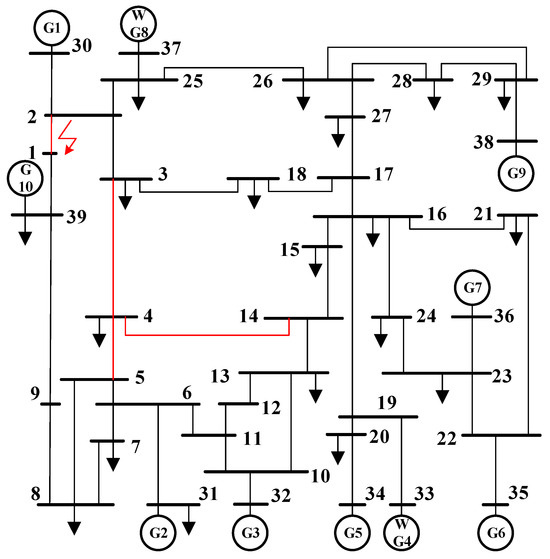
Figure 3.
Diagram of IEEE 39 system.

Table 1.
Generator adjustment parameters.
5.1. Propagation Path of Cascading Failure
Line 1–2 disconnection is considered as a random initial fault, as shown by the red arrow in Figure 3. The first step is to utilize probability power flow to determine the probability distribution of power flow in each branch after the failure. Figure 4 illustrates the probability distribution curve of power flow through Line 4–5 after Line 1–2 is disconnected. Subsequently, Equation (2) is employed to calculate the probability of overload in other lines and the probability of failure. The largest probability of outage for each link is then selected to generate a cascading failure path, as presented in Table 2. This path is used as an example for blocking control.
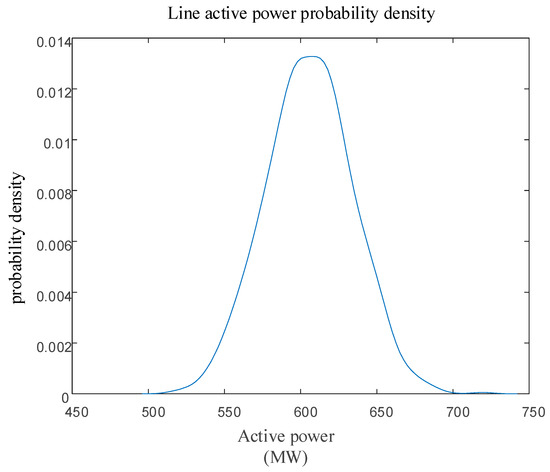
Figure 4.
Probability distribution of power flow on line 4–14.
Table 2.
Propagation path of cascading failure without blocking control.
As evident in Table 2, Line 1–2 can be interpreted as representing the initial fault with a probability of failure set at 1. After the disconnection of Line 1–2, a significant shift in tides occurs in a large area, resulting in successive trips of Line 4–5 and Line 4–14 due to overload. Until the disconnection of Line 3–4 occurs, leading to system decoupling, there is a resultant load loss of approximately 500 MW.
5.2. Sensitive Line Set
According to power sensitivity analysis, it is possible to identify the lines that exhibit higher sensitivity to changes in generator output, as illustrated in Figure 5.
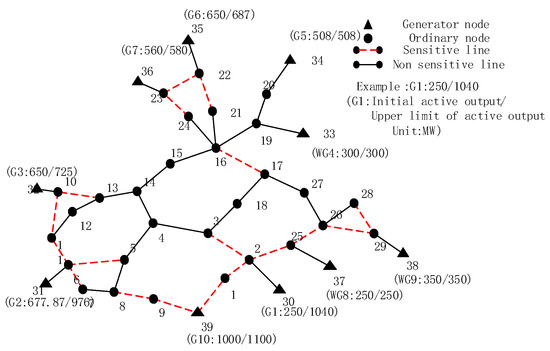
Figure 5.
Sensitive lines of IEEE 39 system.
According to the findings presented in Figure 5, it is evident that making significant adjustments to the generator output results in notable fluctuations in power flow. However, these fluctuations primarily affect a limited number of sensitive transmission lines located in close proximity to the generator outlet. Consequently, these lines are more susceptible to experiencing overload conditions. After the generator G3 at node 32 experiences a substantial increase in its output, it has the potential to result in overload failure in the sensitive Line1–10 and Line10–13. Considering the varying adjustable capacities of each generator, it is expected that generators with smaller adjustable capacities, such as G7, will not cause significant fluctuations in the power flow of the corresponding sensitive line. Hence, to minimize control expenses and enhance solution efficiency, this study exclusively concentrates on the prevention and management of sensitive line failures associated with higher adjustable capacity and wind turbines.
5.3. Control Effect Analysis
Taking the propagation path of cascading failure in Section 5.1 as an example, the control model established in this article is used for blocking control:
Model 1: without considering multi-stage blocking control of sensitive lines.
Model 2: considering multi-stage blocking control of sensitive lines.
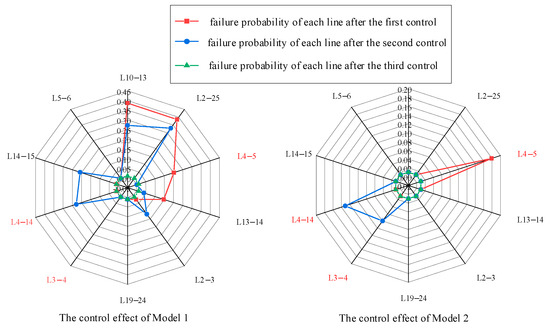
Figure 6.
Control effect of Model 1 and Model 2.
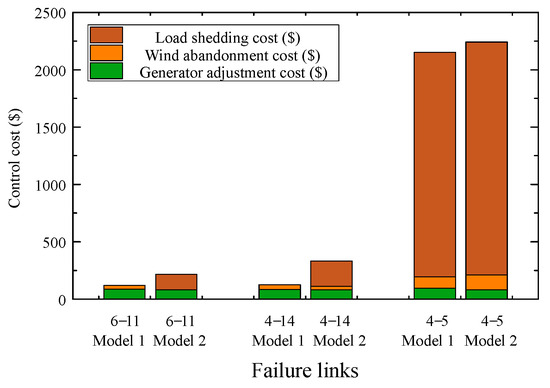
Figure 7.
Control cost of Model 1 and Model 2.
From the analysis of Figure 6, it is evident that both models exhibit a significant reduction in the probability of failure at each stage when compared to the failure link without blocking control, as indicated in Table 2. However, Model 1 does not take into account the impact of blocking control measures. Upon implementing control measures for Line 1–2, the failure probability of the subsequent Line 4–5 decreased from 0.39 to 0.20. Nevertheless, as a result of the unpredictability of wind power generation and its consequential effects, a significant number of instances of active power shortages were observed subsequent to the occurrence of failures. The likelihood of failure in Line 2–25, located near the wind farm, and Line 10–13, situated near the generator with significant output adjustment, is greater compared to that of Line 4–5. Therefore, the subsequent propagation of cascading failure may deviate from the anticipated trajectory, resulting in the failure of the initial control scheme. Similarly, the occurrence of new line failures may also arise with the implementation of subsequent control measures. Model 2 effectively mitigates the deviation of the propagation path of cascading failure from the predicted outcomes through the proactive implementation of preventive control measures on vulnerable transmission lines. This ensures the effectiveness of control measures for each individual link.
From Figure 7, it is evident that during the initial phase of cascading failure, the implemented control measures involve modifying the generator output and implementing a limited amount of wind power abandonment. These measures aim to decrease the likelihood of subsequent failures. When the cascading failure extends to the point where Line 4–14 becomes disconnected, the two subnets within the system are only linked by Line 3–4. In order to avoid system disconnection, it is no longer feasible to restore the system to a safe operating state by solely making adjustments to conventional units and abandoning wind power. Therefore, the implementation of load shedding is necessary in order to regulate the power flow within the entire network line, ensuring that it remains below the rated value. In contrast to Model 1, Model 2 requires a slight reduction in load during the initial stages of cascading failure when generator adjustment is limited. This is necessary to maintain the power flow constraints of vulnerable transmission lines and ensure that the propagation path of cascading failure remains unchanged under limited generator adjustment conditions. Therefore, the initial control cost of Model 2 is comparatively high.
If multi-stage blocking control measures are not implemented, the enforcement of stringent control measures will be necessary during the initial stages of cascading failure. Specifically, the control coefficient will be consistently set to 1, while the other parameters will remain unaltered, as denoted by Model 3. The cost and effectiveness of control measures in Model 3 are outlined in Table 3.
Table 3.
Model 3 control cost and control effectiveness.
Based on the findings outlined in Table 3, it is apparent that disconnecting Line 1–2 leads to the successful mitigation of all potential line failures and greatly diminishes the probability of cascading failure. The achievement of this outcome is facilitated through the implementation of the single-stage control in model 3. Despite its advantages, the system requires a substantial amount of load shedding and adjustment of generator output, resulting in increased control costs and impeding the economic efficiency of the system.
5.4. Influence of Wind Power on Blocking Control
Then, the impact of wind power penetration rates or confidence levels on control measures is analyzed. Under the condition of maintaining a confidence level of 90% and keeping other parameter settings unchanged, the wind power penetration rate was increased to 30% by replacing generator G5 with a wind farm having an installed capacity of 500 MW. Subsequently, generator G9 was replaced by a wind farm with an installed capacity of 830 MW to achieve a wind power penetration rate of 40%. The cascading failure was successfully blocked and controlled under both operating conditions. The resulting control cost is presented in Figure 8.
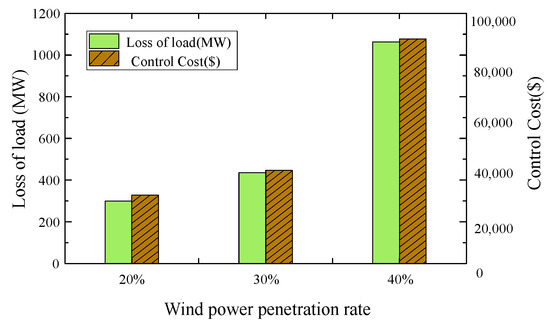
Figure 8.
Control costs under different wind power penetration rates.
From the analysis presented in Figure 8, it is evident that the augmentation of wind power penetration leads to an exponential rise in control costs. When wind farms constitute a larger proportion of the power system and blocking control is implemented, there is a need to compensate for the active power deficit caused by insufficient wind power output. However, this compensation is constrained by the upper limit of the adjustable power generation capacity of conventional units. Consequently, significant load reduction is required to ensure the safety and stability of the system.
Furthermore, when applying the deterministic control method, it is necessary to ensure that the system state variables strictly adhere to the imposed constraints during the control process. This implies that the confidence levels of the variable constraints should all be 100%. However, this approach may lead to the issue of increased control costs. In this paper, the confidence levels of 90%, 95%, and 100% are employed for the comparison test. The remaining parameters are kept consistent with Model 1. The resulting control cost is presented in Figure 9.
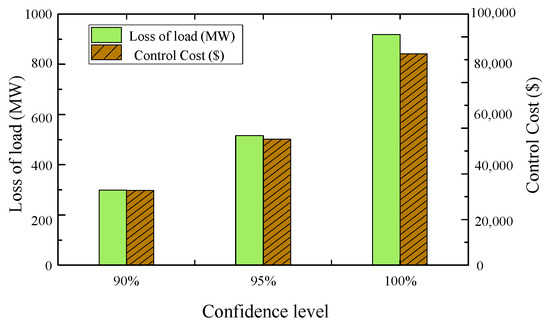
Figure 9.
Control costs under different confidence levels.
From the analysis of Figure 9, it is evident that the control scheme is influenced by the uncertainty of wind power output. The confidence level plays a significant role in determining the level of conservatism in the control scheme. As the confidence level increases, the control scheme becomes more conservative. Consequently, there is an increase in both the amount of load shedding and control cost. Without the inclusion of a chance constraint, the control scheme will lead to a substantial amount of load shedding, even when the confidence level is set at 100%. However, the confidence level does not show a significant improvement in this scenario. Hence, the control model presented in this paper compromises a certain level of confidence in order to develop a scheme that may not fully satisfy the constraint with a low probability but significantly minimizes the control cost.
In conclusion, as the scale of wind power increases, it is important to consider the impact of uncertain wind power output and the limited adjustable power generation capacity of conventional units. In the event of a cascading failure in the system, various load shedding methods will be implemented to ensure the system operates within safe operating state constraints. However, these measures also result in increased control costs.
6. Conclusions
This article presents a novel approach to constructing a propagation path prediction model for cascading failure in power systems with wind power integration. The model is based on probabilistic power flow analysis. Based on the anticipated outcome, an analysis is conducted on the importance of incorporating sensitive lines into blocking control. Subsequently, a multi-stage blocking control model that takes into account sensitive lines is developed using probability optimal power flow. Through conducting simulation analysis on the IEEE 39-node system, several conclusions can be derived.
- (1)
- The obtained blocking control measures can effectively reduce the risks of cascading failure. Sensitivity analysis is employed to reduce the solving dimension of the model by identifying the lines that exert a substantial influence on the control measures.
- (2)
- The proposed control method can offer a viable solution for mitigating the impact of wind power while simultaneously minimizing control costs. This approach enables the development of a control scheme that effectively balances the objectives of safety and economy.
- (3)
- The escalation of wind power penetration rate and confidence level will result in an increase in the expenses associated with cascading failure blocking control.
This paper exclusively focuses on the impact of cascading failure caused by overload, which is a steady-state problem. However, the outage of transmission lines may trigger transient issues, including voltage disturbances and frequency disturbances. These can lead to power system protection actions, including the disconnection of wind turbines from the grid. Furthermore, this paper does not address the subsequent effects of these disturbances on the propagation of cascading failures after the disconnection. Therefore, future work should focus on the transient cascading effects.
Author Contributions
L.C. and Y.W. formulated the conceptual framework presented in this work. L.C. authored the manuscript with the support of Y.W. and T.W. Z.G. and N.J. executed the simulations and conducted the data analysis. T.W. provided supervision for the project. All authors contributed critical insights, offered constructive feedback, and played integral roles in refining the research, analysis, and manuscript. All authors have read and agreed to the published version of the manuscript.
Funding
This research received no external funding.
Data Availability Statement
The data presented in this study are available on request from the corresponding author. The data are not publicly available due to commercial sensitivity.
Conflicts of Interest
Authors Lun Cheng, Zeming Gao and Ning Ji were employed by the company State Grid Hebei Electric Co., Ltd. The remaining authors declare that the research was conducted in the absence of any commercial or financial relationships that could be construed as a potential conflict of interest.
References
- Choi, E.; Song, J. Cost-effective retrofits of power grids based on critical cascading failure scenarios identified by multi-group non-dominated sorting genetic algorithm. Int. J. Disaster Risk Reduct. 2020, 49, 101640. [Google Scholar] [CrossRef]
- Busby, J.W.; Baker, K.; Bazilian, M.D.; Gilbert, A.Q.; Grubert, E.; Rai, V.; Rhodes, J.D.; Shidore, S.; Smith, C.A.; Webber, M.E. Cascading risks: Understanding the 2021 winter blackout in Texas. Energy Res. Soc. Sci. 2021, 77, 102106. [Google Scholar] [CrossRef]
- Hines, P.; Apt, J.; Talukdar, S. Large blackouts in North America: Historical trends and policy implications. Energy Policy 2009, 37, 5249–5259. [Google Scholar] [CrossRef]
- Athari, M.H.; Wang, Z. Impacts of Wind Power Uncertainty on Grid Vulnerability to Cascading Overload Failures. IEEE Trans. Sustain. Energy 2018, 9, 128–137. [Google Scholar] [CrossRef]
- Yin, Y.K.; Chen, H.H.; Meng, X.P. Digital twin-driven identification of fault situation in distribution networks connected to distributed wind power. Int. J. Electr. Power Energy Syst. 2024, 155, 109415. [Google Scholar] [CrossRef]
- Kendal, W.S. Self-organized criticality attributed to a central limit-like convergence effect. Phys. A Stat. Mech. Its Appl. 2015, 421, 141–150. [Google Scholar] [CrossRef]
- Zhu, Z.Q.; Wu, L.J.; Xia, Z.P. An accurate subdomain model for magnetic field computation in slotted surface- mounted permanent-magnet machines. IEEE Trans. Magn. 2010, 46, 1100–1115. [Google Scholar] [CrossRef]
- Zhou, B.; Meng, X.; Stanley, H.E. Power-law distribution of degree-degree distance: A better representation of the scale-free property of complex networks. Proc. Natl. Acad. Sci. USA 2020, 117, 14812–14818. [Google Scholar] [CrossRef] [PubMed]
- Ju, Z.C.; Ma, J.L.; Xie, J.J.; Wang, Y.P.; Cui, H.M.; Duan, C.W. Cascading failure model for the mitigating edge failure of scale-free networks. Pramana J. Phys. 2019, 92, 62. [Google Scholar] [CrossRef]
- Monteiro Pereira, R.M.; Machado Ferreira, C.M.; Maciel Barbosa, F.P. Influence of load shedding in the voltage stability of an electric power system using trajectory sensitivity analysis. In Proceedings of the 45th International Universities Power Engineering Conference, Cardiff, UK, 31 August–3 September 2010; pp. 1–6. [Google Scholar]
- Dvorkin, Y.; Henneaux, P.; Kirschen, D.S.; Pandzic, H. Optimizing Primary response in preventive security-constrained optimal power flow. IEEE Syst. J. 2018, 12, 414–423. [Google Scholar] [CrossRef]
- Zhai, C.; Zhang, H.; Xiao, G.; Pan, T.-C. A model predictive approach to protect power systems against cascading blackouts. Int. J. Electr. Power Energy Syst. 2019, 113, 310–321. [Google Scholar] [CrossRef]
- Yingying, W.; Feng, L.; Jun, X. Prevention control of blackouts in power system based on fault chain and risk theory. In Proceedings of the 2014 International Conference on Power System Technology (POWERCON), Chengdu, China, 20–22 October 2014; IEEE: Piscataway, NJ, USA, 2014. [Google Scholar]
- Yao, R.; Zhang, X.; Huang, S.; Mei, S.; Zhang, Z.; Li, X.; Zhu, Q. Cascading outage preventive control for large-scale AC-DC interconnected power grid. In Proceedings of the IEEE Power and Energy Society General Meeting, National Harbor, MA, USA, 27–31 July 2014; pp. 1–5. [Google Scholar]
- Usaola, J. Probabilistic load flow with correlated wind power injections. Electr. Power Syst. Res. 2010, 80, 528–536. [Google Scholar] [CrossRef]
- Zhang, P.; Lee, S.T. Probabilistic load flow computation using the method of combined cumulants and Gram-Charlie expansion. IEEE Trans. Power Syst. 2004, 19, 676–682. [Google Scholar] [CrossRef]
- Yan, X.W.; Xu, Y.; Li, R.J. Multi-Time scale reactive power optimization of distribution grid based on model predictive control and including RDG regulation. Trans. China Electrotech. Soc. 2019, 34, 2022–2037. [Google Scholar]
- Lu, Y.; Wang, Y.; Yong, P.; Zhang, N.; Kang, C.; Lu, D. Fast Power System Cascading Failure Path Searching with High Wind Power Penetration. IEEE Trans. Sustain. Energy 2020, 11, 2274–2283. [Google Scholar] [CrossRef]
- Kirschen, D.; Allan, R.; Strbac, G. Contributions of individual generators to loads and flow. IEEE Trans. Power Syst. 1997, 12, 52–60. [Google Scholar] [CrossRef] [PubMed]
- Zima, M.; Andersson, G. On security criteria in power systems operation. In Proceedings of the IEEE Power Engineering Society General Meeting, San Francisco, CA, USA, 16 June 2005; pp. 3089–3093. [Google Scholar]
- Carreras, B.A.; Lynch, V.E.; Sachtjen, M.L.; Dobson, I.; Newman, D.E. Modeling blackout dynamics in power transmission networks with simple structure. In Proceedings of the 34th IEEE Hawaii International Conference on System Sciences, Maui, HI, USA, 3–6 January 2001; pp. 719–727. [Google Scholar]
- Yu, H.; Chung, C.Y.; Wong, K.P.; Zhang, J.H. A chance constrained transmission network expansion planning method with consideration of load and wind farm uncertainties. IEEE Trans. Power Syst. 2009, 24, 1568–1576. [Google Scholar] [CrossRef]
- Zou, B.; Xiao, Q. Solving probabilistic optimal power flow problem using quasi-Monte Carlo method and ninth-order polynomial normal transformation. IEEE Trans. Power Syst. 2014, 29, 300–307. [Google Scholar] [CrossRef]
- Li, G.; Zhang, X.P. Stochastic optimal power flow approach considering correlated probabilistic load and wind farm generation. In Proceedings of the IET Conference on Reliability of Transmission and Distribution Networks, London, UK, 22–24 November 2011; pp. 1–7. [Google Scholar]
Disclaimer/Publisher’s Note: The statements, opinions and data contained in all publications are solely those of the individual author(s) and contributor(s) and not of MDPI and/or the editor(s). MDPI and/or the editor(s) disclaim responsibility for any injury to people or property resulting from any ideas, methods, instructions or products referred to in the content. |
© 2024 by the authors. Licensee MDPI, Basel, Switzerland. This article is an open access article distributed under the terms and conditions of the Creative Commons Attribution (CC BY) license (https://creativecommons.org/licenses/by/4.0/).