Article

Analysis of the Sand Erosion Effect and Wear Mechanism of Wind Turbine Blade Coating

College of Mechanical and Electrical Engineering, Inner Mongolia Agricultural University, Hohhot 010018, China
*
Authors to whom correspondence should be addressed.
Energies 2024, 17(2), 413; https://doi.org/10.3390/en17020413
Submission received: 4 December 2023 / Revised: 3 January 2024 / Accepted: 8 January 2024 / Published: 15 January 2024
(This article belongs to the Section A3: Wind, Wave and Tidal Energy)

Abstract

:
The wind–sand climate prevalent in the central and western regions of Inner Mongolia results in significant damage to wind turbine blade coatings due to sand erosion. This not only leads to a decline in power generation but also poses safety risks. This study replicated the wind–sand environment of Alashan and numerically simulated the erosion and wear process of the blade coatings of a 1.5 MW horizontal axis wind turbine under rotational conditions using the DPM model. Additionally, erosion tests were conducted on the operating wind rotor in a wind tunnel. The simulation results demonstrate that sand particle trajectories in the rotating domain are influenced by vortex, incoming wind speed, and sand particle size. For small-sized sand particles, variations in wind speed do not substantially alter the number of particles in contact with the wind turbine blades. However, alterations in the momentum of these particles lead to changes in the impact force on the coating surface. Conversely, the change of wind speed will not only alter the number of large-size sand particles in contact with the wind rotor but also modify the impact force on the coating surface. Furthermore, after impacting the blade, small sand particles continue to move along an approximate helical trajectory with the airflow, while large-size sand particles swiftly rebound. Through statistical analysis of erosion pits on the blade surface after the erosion experiments, it was observed that, in comparison among the leading edge, windward side, trailing edge, and leeward side, the leading edge presents the greatest number of erosion pits, whereas the leeward side has the fewest. Along the spanwise direction, the 0.7R-blade tip segment exhibits the highest count, while the blade root-0.3R section displays the fewest number of pits. The wear morphology of the blade coating was observed from the blade root to tip. The leading edge coating exhibits a range from shallow pits to coating flaking and deeper gouge pits. On the windward side, the coating displays wear patterns varying from tiny cutting pits to cutting marks, and then to gouge pits and coating flaking. Erosion morphology of the trailing edge evolves from only minor scratches to spalling pits, further deepening and enlarging. These research findings provide a basis for the study of zoning-adapted coating materials for wind turbine blades in wind–sand environments.

1. Introduction

Blades constitute a critical component of wind turbines, accounting for 15–20% of the total cost. In order to enhance wind energy capture efficiency, the size of the blades is gradually increasing, posing new challenges for maintenance and repair.
Inner Mongolia is rich in wind energy resources, accounting for 50% of the country’s exploitable energy resources [1]. By the end of 2022, the installed wind power capacity in Inner Mongolia had reached 45.683,4 GW [2]. These wind farms are mainly located in desert, plateau, and grassland areas, including regions prone to frequent sand and dust storm, such as the Alashan Plateau, Hetao Plain, and Ordos Plateau [3]. Consequently, wind turbine blade coatings are subjected to erosion caused by the wind and sand, resulting in damage such as sand holes, cracks, and coating spalling [4,5], as shown in Figure 1.
Blade coating erosion has become a significant safety concern in wind farms, leading to a decrease in power generation output [6]. According to a numerical study [7], the power production can decrease by approximately 12.5% in case of blade erosion. In recent years, scholars in relevant fields have conducted numerous numerical simulations and experiments on composite samples of wind turbine blades to study erosion wear characteristics.
Kang et al. [8] utilized Fluent 12.1 software to investigate the erosion wear rate of wind turbine blade materials under varying wind speeds and grain sizes. The results indicated that the erosion rate initially increased and then decreased with the increase in particle size. Additionally, the study predicted the maximum theoretical erosion rate. Cen et al. [9] employed finite element analysis software to investigate the surface stress distribution and erosion of polyurethane coating on wind turbine blades when subjected to sand particles at different speeds and angles. The findings revealed that higher impact velocities resulted in higher equivalent stress. Furthermore, the surface failure of the coating material was predominantly influenced by cutting wear under small impact angles, while deformation wear dominated the coating surface failure under large impact angles. Zhen et al. [10] conducted numerical simulations on 100 W wind turbine blades to investigate the erosion characteristics under static conditions, considering various sand grain sizes, wind speeds, and attack angles. The results demonstrated that as both wind speed and sand particle size increase, so does the wear rate on the blades. Gao et al. [11] analyzed the surface velocity of the blade based on the DPM (Discrete Phase Model) model. It was concluded from the velocity vector diagram that the leading edge of the blade experienced primarily the normal impact force of the sand particles, while the blade tip was subjected to both tangential and normal impact forces. This observation aligns with the erosion morphology observed through electron microscopy. Li et al. [12] conducted a numerical analysis to investigate the erosive wear characteristics of a two-bladed horizontal axis wind rotor with a diameter of 500 mm, considering different particle sizes and concentrations. The study revealed that the leading edge of the blade experienced the most severe wear. Moreover, as the particle diameter increased, the wear region area and the wear rate also increased, and then stabilized. Zhou et al. [13] investigated the erosion wear characteristics caused by the interaction of wind–sand two-phase flow on wind turbine blades with a diameter of 52 m. The findings revealed that the erosion rate grows with the rise in wind speed and erosion angle, and the blade tip was identified as the area most susceptible to erosion. Dai et al. [14] integrated the three-dimensional flow field of a wind rotor with the particle motion characteristics to simulate the erosion rate distribution on the surface of a 2 MW blade under various operating conditions. This study identified that the middle and root parts of the blade at the leading edge were the most vulnerable region to erosion.
Li et al. [15] conducted erosion and wear tests on a 10 cm × 10 cm flat plate specimen cut from a blade, utilizing an erosion test bench. They investigated the effects of impact speeds, impact angles, and effective cross-sectional mass flow rates on the erosion characteristics of the blade surface. Their results revealed that, for a specific effective particle mass flow rate, the maximum wear occurred at an impact angle of approximately 30°. Wang et al. [16] fabricated a scaled-down 1.5 MW wind turbine blade and investigated the erosion process of a specific section of the blade using an erosion and wear test bench. Their findings revealed that the process could be divided into three periods: the wear incubation period, rapid wear period, and slow wear period. These periods were characterized by pitting, erosion pits, combined erosion pits, small pieces of coating flaking, and large areas of coating flaking, in that order. Alajmi et al. [17] used silica sand (SiO2) abrasives with an average diameter of 206 μm, a 1.2 m long Aeosol 1 kW horizontal axis wind turbine blade. This study identified that high impact velocity and long exposure to sandstorms had the highest effect on the leading-edge erosion behavior of wind turbine blades. Hassanian et al. [18] applied the Lagrangian particle tracking technique to track the movement of sand particles eroding the leading edge of the blades. Their results showed that both sand particle size and gravity are important factors affecting erosion.
The aforementioned studies have elucidated the effects of sand grain size, wind speed, and erosion angle on the erosion rate through numerical simulation. However, the majority of the studies focused on small-scale wind turbine blades, and only references [11,12,13] were conducted under conditions of wind turbine rotation. The erosion wear tests conducted on an erosion test bench have the capability to replicate wind–sand environments by selecting different sizes of sand particles and adjusting the inlet velocity and sand mass flow rate. Nevertheless, this method is limited to specific targets such as flat plate specimens or a small section of the blade, and it does not allow for the comprehensive observation of blade erosion wear, which is detrimental to the analysis of the wear mechanism.
This study focuses on the investigation of a 1.5 MW horizontal axis wind turbine, employing the ANSYS Fluent DPM model to numerically simulate the erosion and wear process of wind turbine blade coatings subjected to wind–sand flow. Through the emulation of the wind–sand environment in the Alashan region of Inner Mongolia within a wind tunnel, the research analyzes the wear characteristics of blade coatings under rotating conditions. By integrating the results of both a simulation and an experiment, this paper explores the wear rate and wear morphology of the blade coating in different parts of the blade, including the leading edge, windward side, trailing edge, leeward side, blade tip, and blade root, with the ultimate objective of elucidating the wear mechanisms.

2. Numerical Simulation

2.1. Parameters of the Wind–Sand Environment

2.1.1. Wind Speed

Alashan is rich in wind energy resources, with a wind period of 5 to 6 months, rendering it an ideal location for the construction of wind power facilities [19]. Situated in the hinterland of the Asian continent, Alashan features a typical continental climate characterized by dryness, strong winds, and sandy conditions. Meteorological statistics demonstrate the potential for dust storms from January to August, with floating dust and blowing sand occurring throughout the year [20].
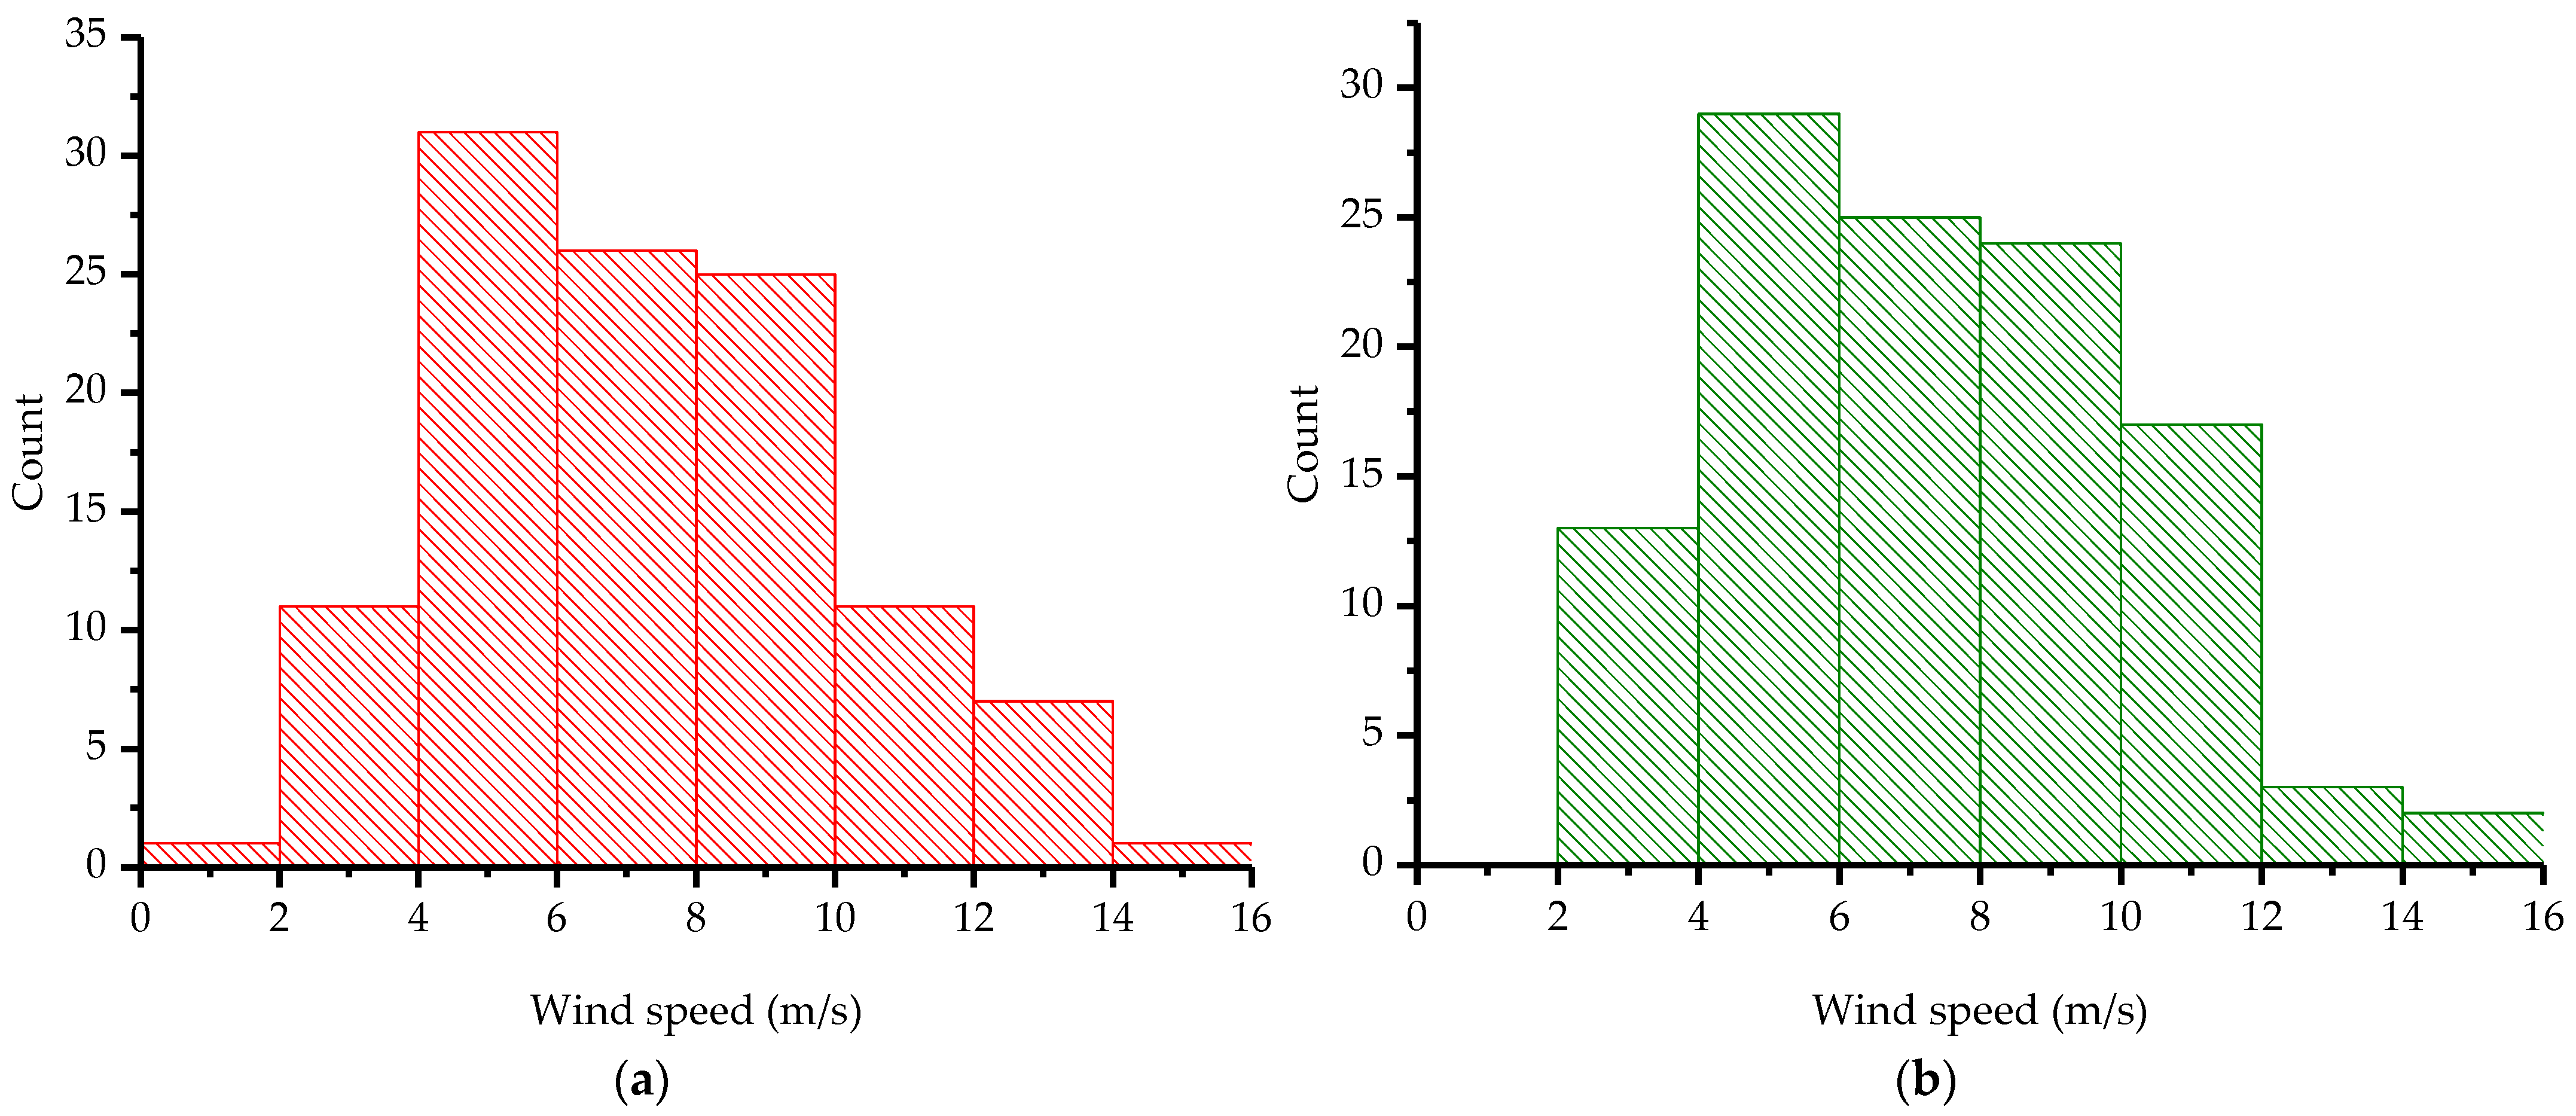
The wind speed statistics from a wind farm in Alashan for the months of February to May are depicted in Figure 2. The average wind speeds for Phase I and Phase II were 7.36 m/s and 7.31 m/s, respectively. According to Chinese Standard Classification of Dust and Weather GB-T-20480:2017 [21], wind speeds exceeding 10.8 m/s are indicative of blowing sand conditions, and the maximum wind speed achievable in a wind tunnel is 18 m/s. Consequently, our study encompasses wind speeds of 12 m/s, 15 m/s, and 18 m/s.

2.1.2. Sand Particle Size and Sand Mass Flow Rate

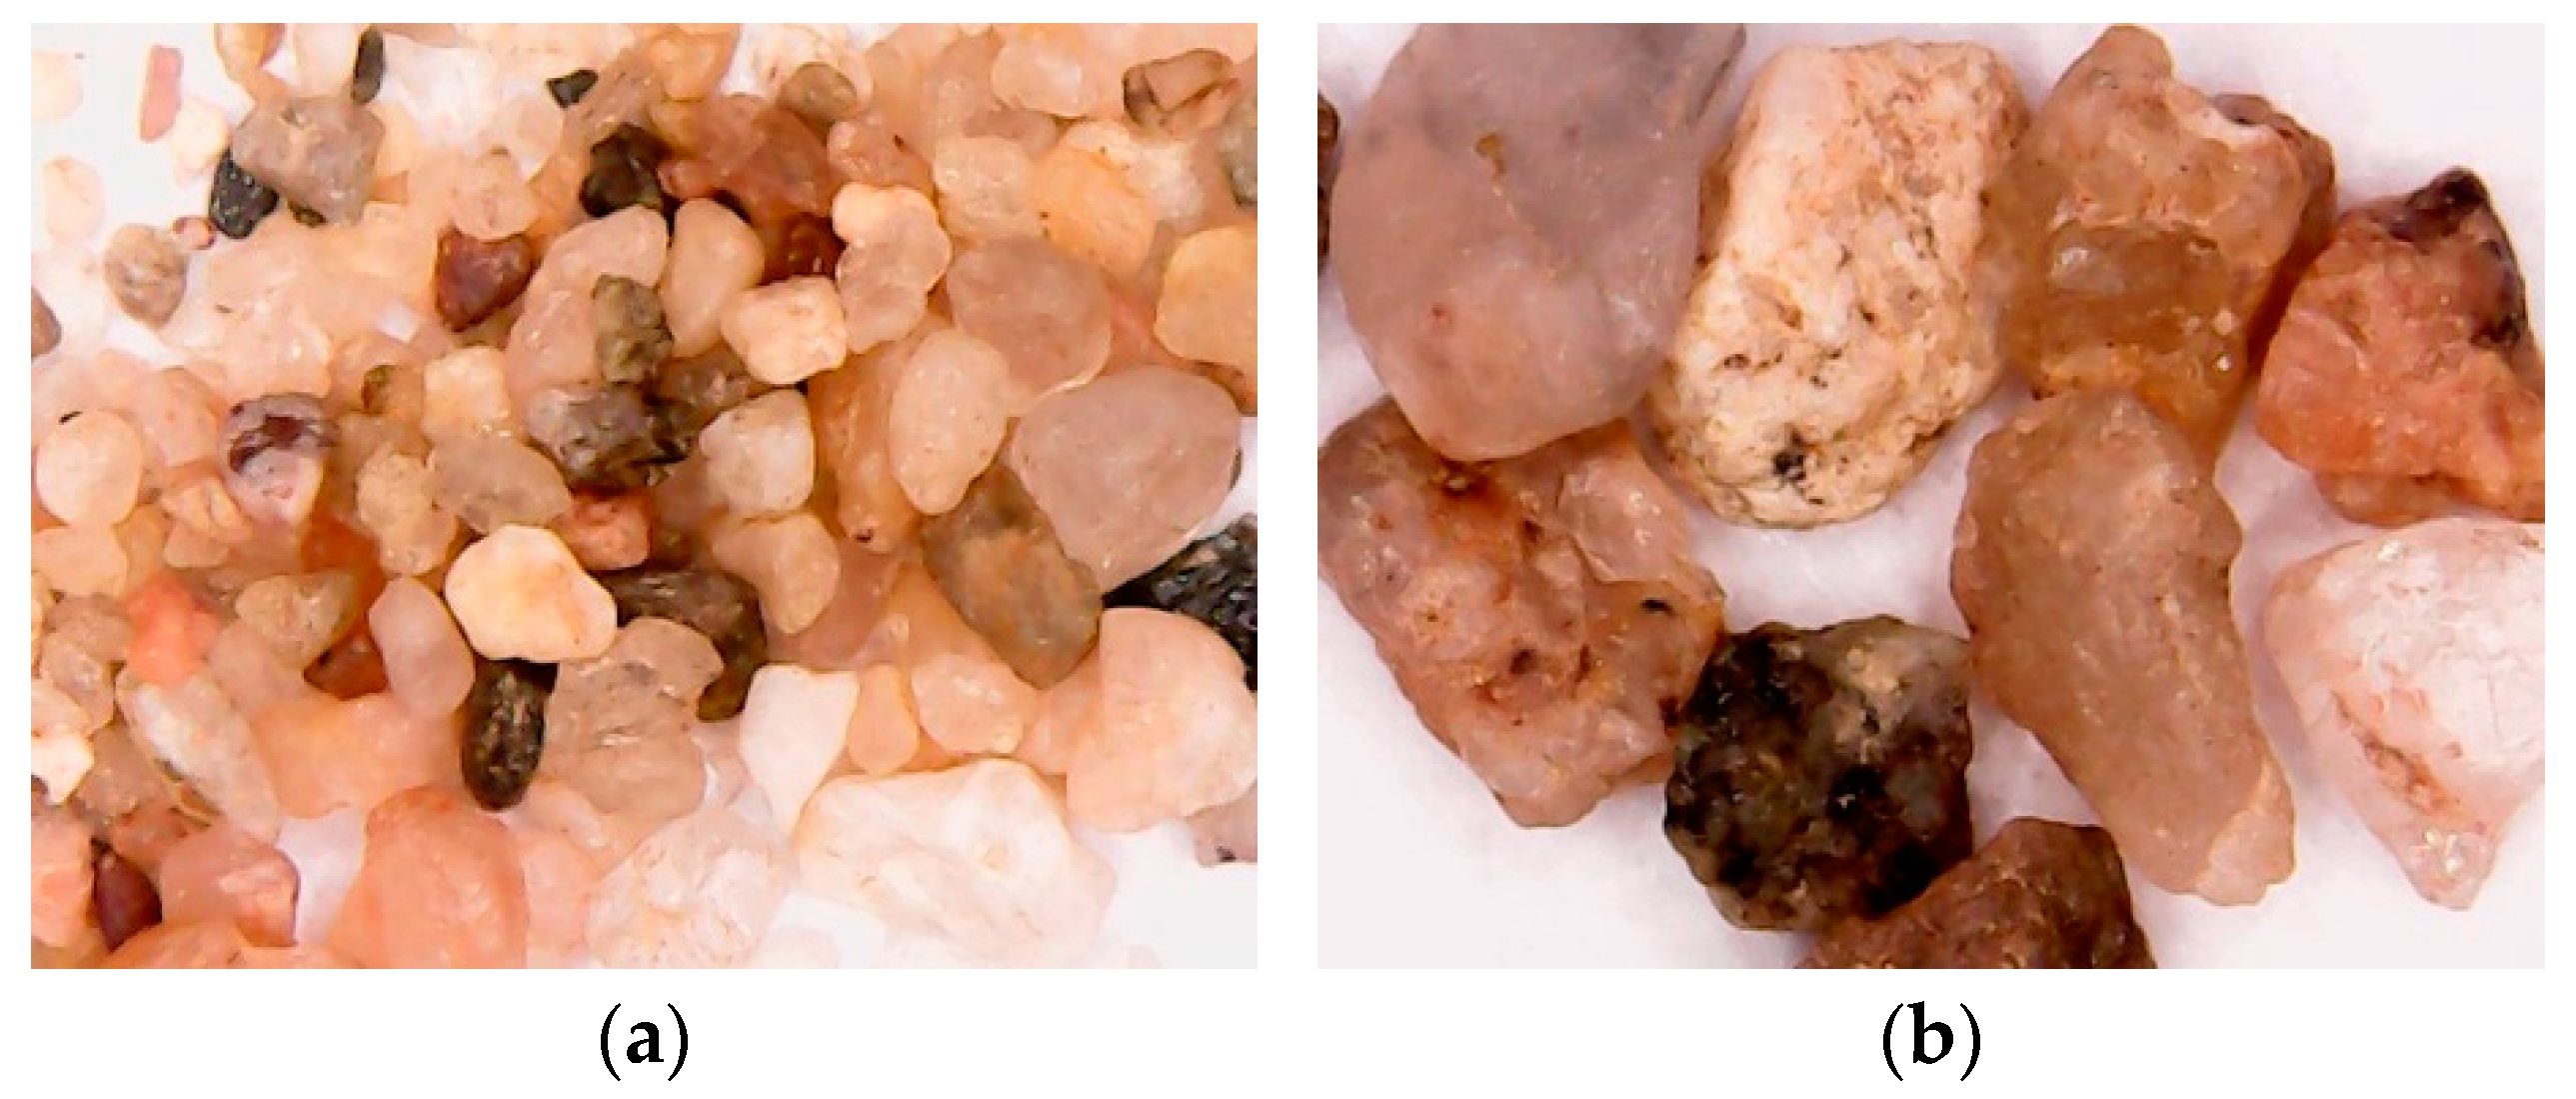
The sand particles were collected from the vicinity of the wind farm, air-dried, and subsequently analyzed using the screening method. The investigation revealed that the sand particle sizes predominantly ranged between 0.13 and 1.73 mm. Consequently, sand particles with sizes less than 1 mm and between 1–2 mm were selected for blade erosion, but not all particles with diameters less than 2 mm were included; the shapes are shown in Figure 3. A significant portion of these particles exhibited sharp edges and an irregular oval shape. The presence of sharp edges on these particles increases the likelihood of collision with wind turbine blades, thereby potentially causing damage to the surface coating.
Based on the correlation between dust weather types and sand concentration in published literature [22], a sand concentration of 106 μg/m3 was considered as a strong sandstorm. In this context, the wind–sand flow is treated as a continuous medium, and the sand mass flow rate for the wind tunnel conveyor was determined by applying the hydrodynamic definition of flow rate Q = Av and the equation for sand concentration S = M/Q [23]. Here, Q represents the volume of wind carrying sand in m3/s, A is the cross-sectional area of the sand-carrying airflow through the wind tunnel’s working section, set at 1.2 m2, v denotes the velocity of the wind–sand flow in m/s, S signifies the sand concentration, and M stands for the sand mass flow rate in g/min. To facilitate adjustments, the sand mass flow rates were set at 900 g/min, 1000 g/min, and 1100 g/min for wind speeds of 12 m/s, 15 m/s, and 18 m/s, respectively.

2.1.3. Erosion Angle and Erosion Time

In both numerical simulations and experiments, the wind–sand flow was directed vertically towards the plane of the wind rotor, with the erosion angle set at 90°. In a preliminary experiment [16], coating flaking appeared on the blade surface at 10 min under conditions of an erosion angle of 90°, wind speed of 16 m/s, and sand flow rate of 180 g/min. Therefore, the erosion time was set to 30 min.

2.2. Model Establishment

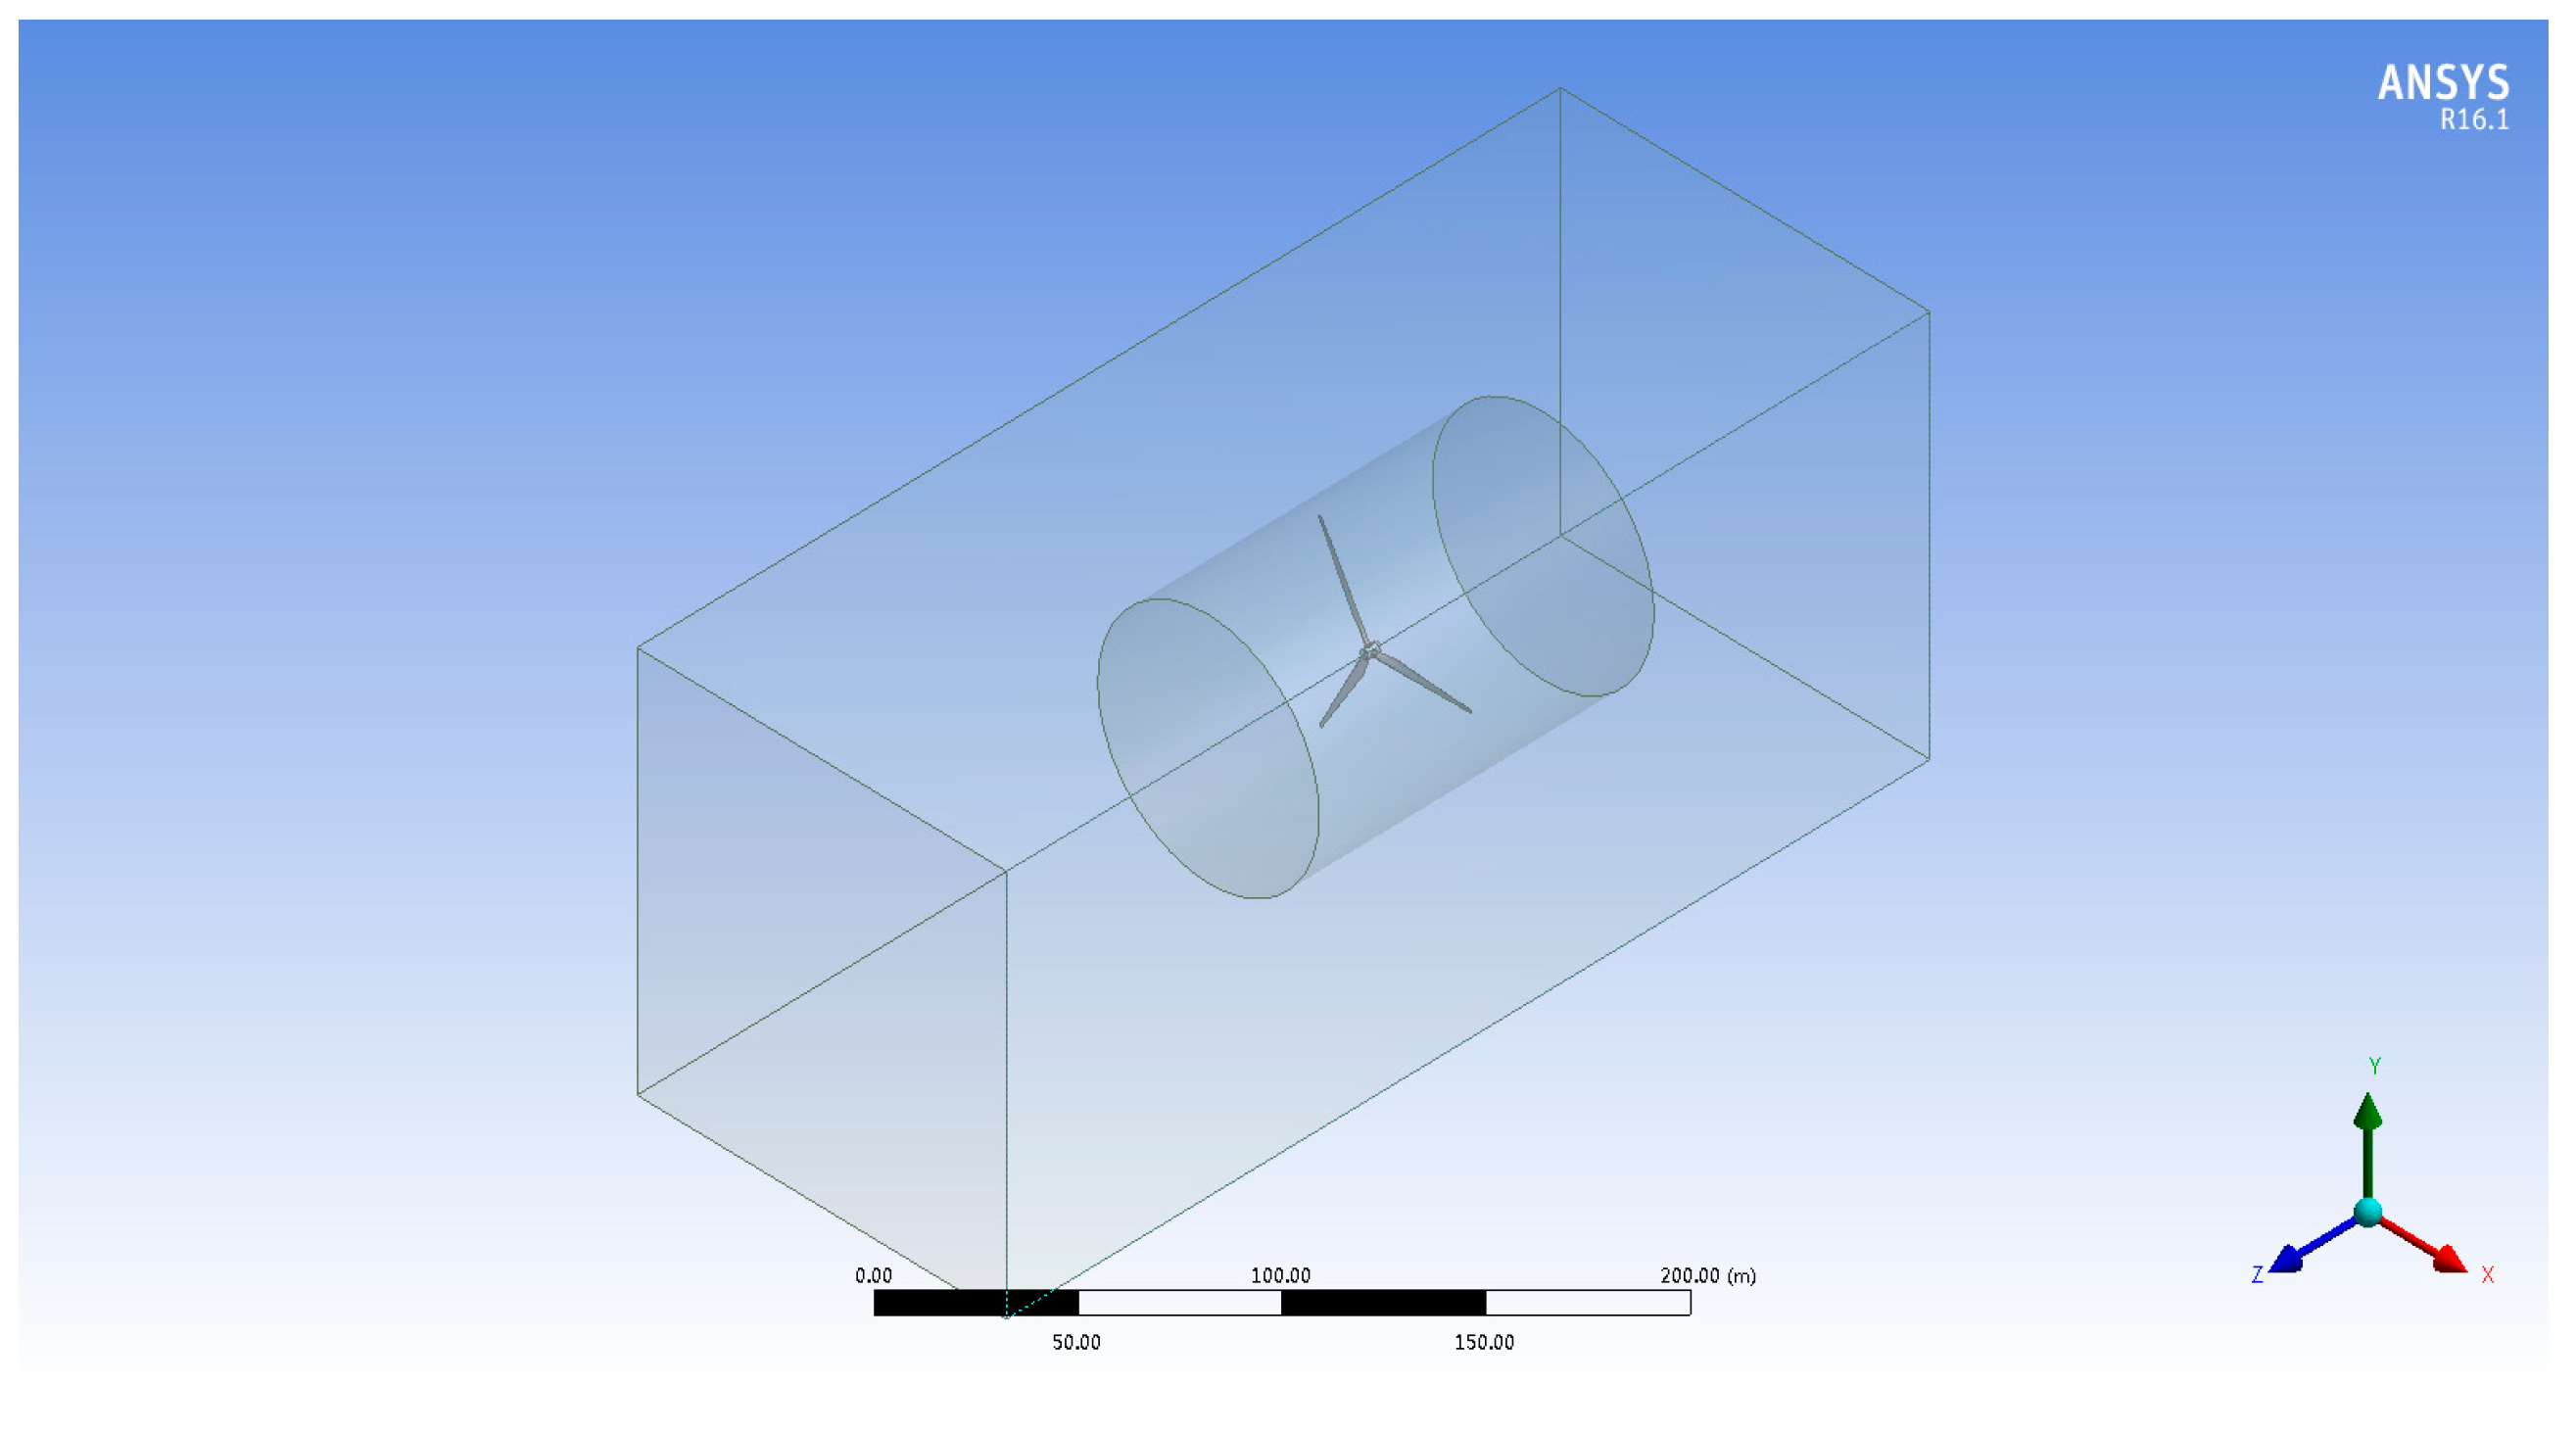
The blade model of a 1.5 MW horizontal axis wind turbine was created using SOLIDWORKS 2017 software, and the hub was integrated to assemble the complete wind rotor model. This model was then imported into ANSYS Workbench, where a rectangular computational domain was established to encompass the entire wind turbine flow field, as illustrated in Figure 4. The computational domain was further subdivided into the cylindrical rotational region and the external static domain. The width and length of the computational domain were set at 2 times and 10 times the blade length, respectively. The radius of the cylindrical rotational domain was 1.2 times the blade length, while its length extended to 3 times the blade length. The negative Z-axis direction denotes the inlet direction of the incoming flow.
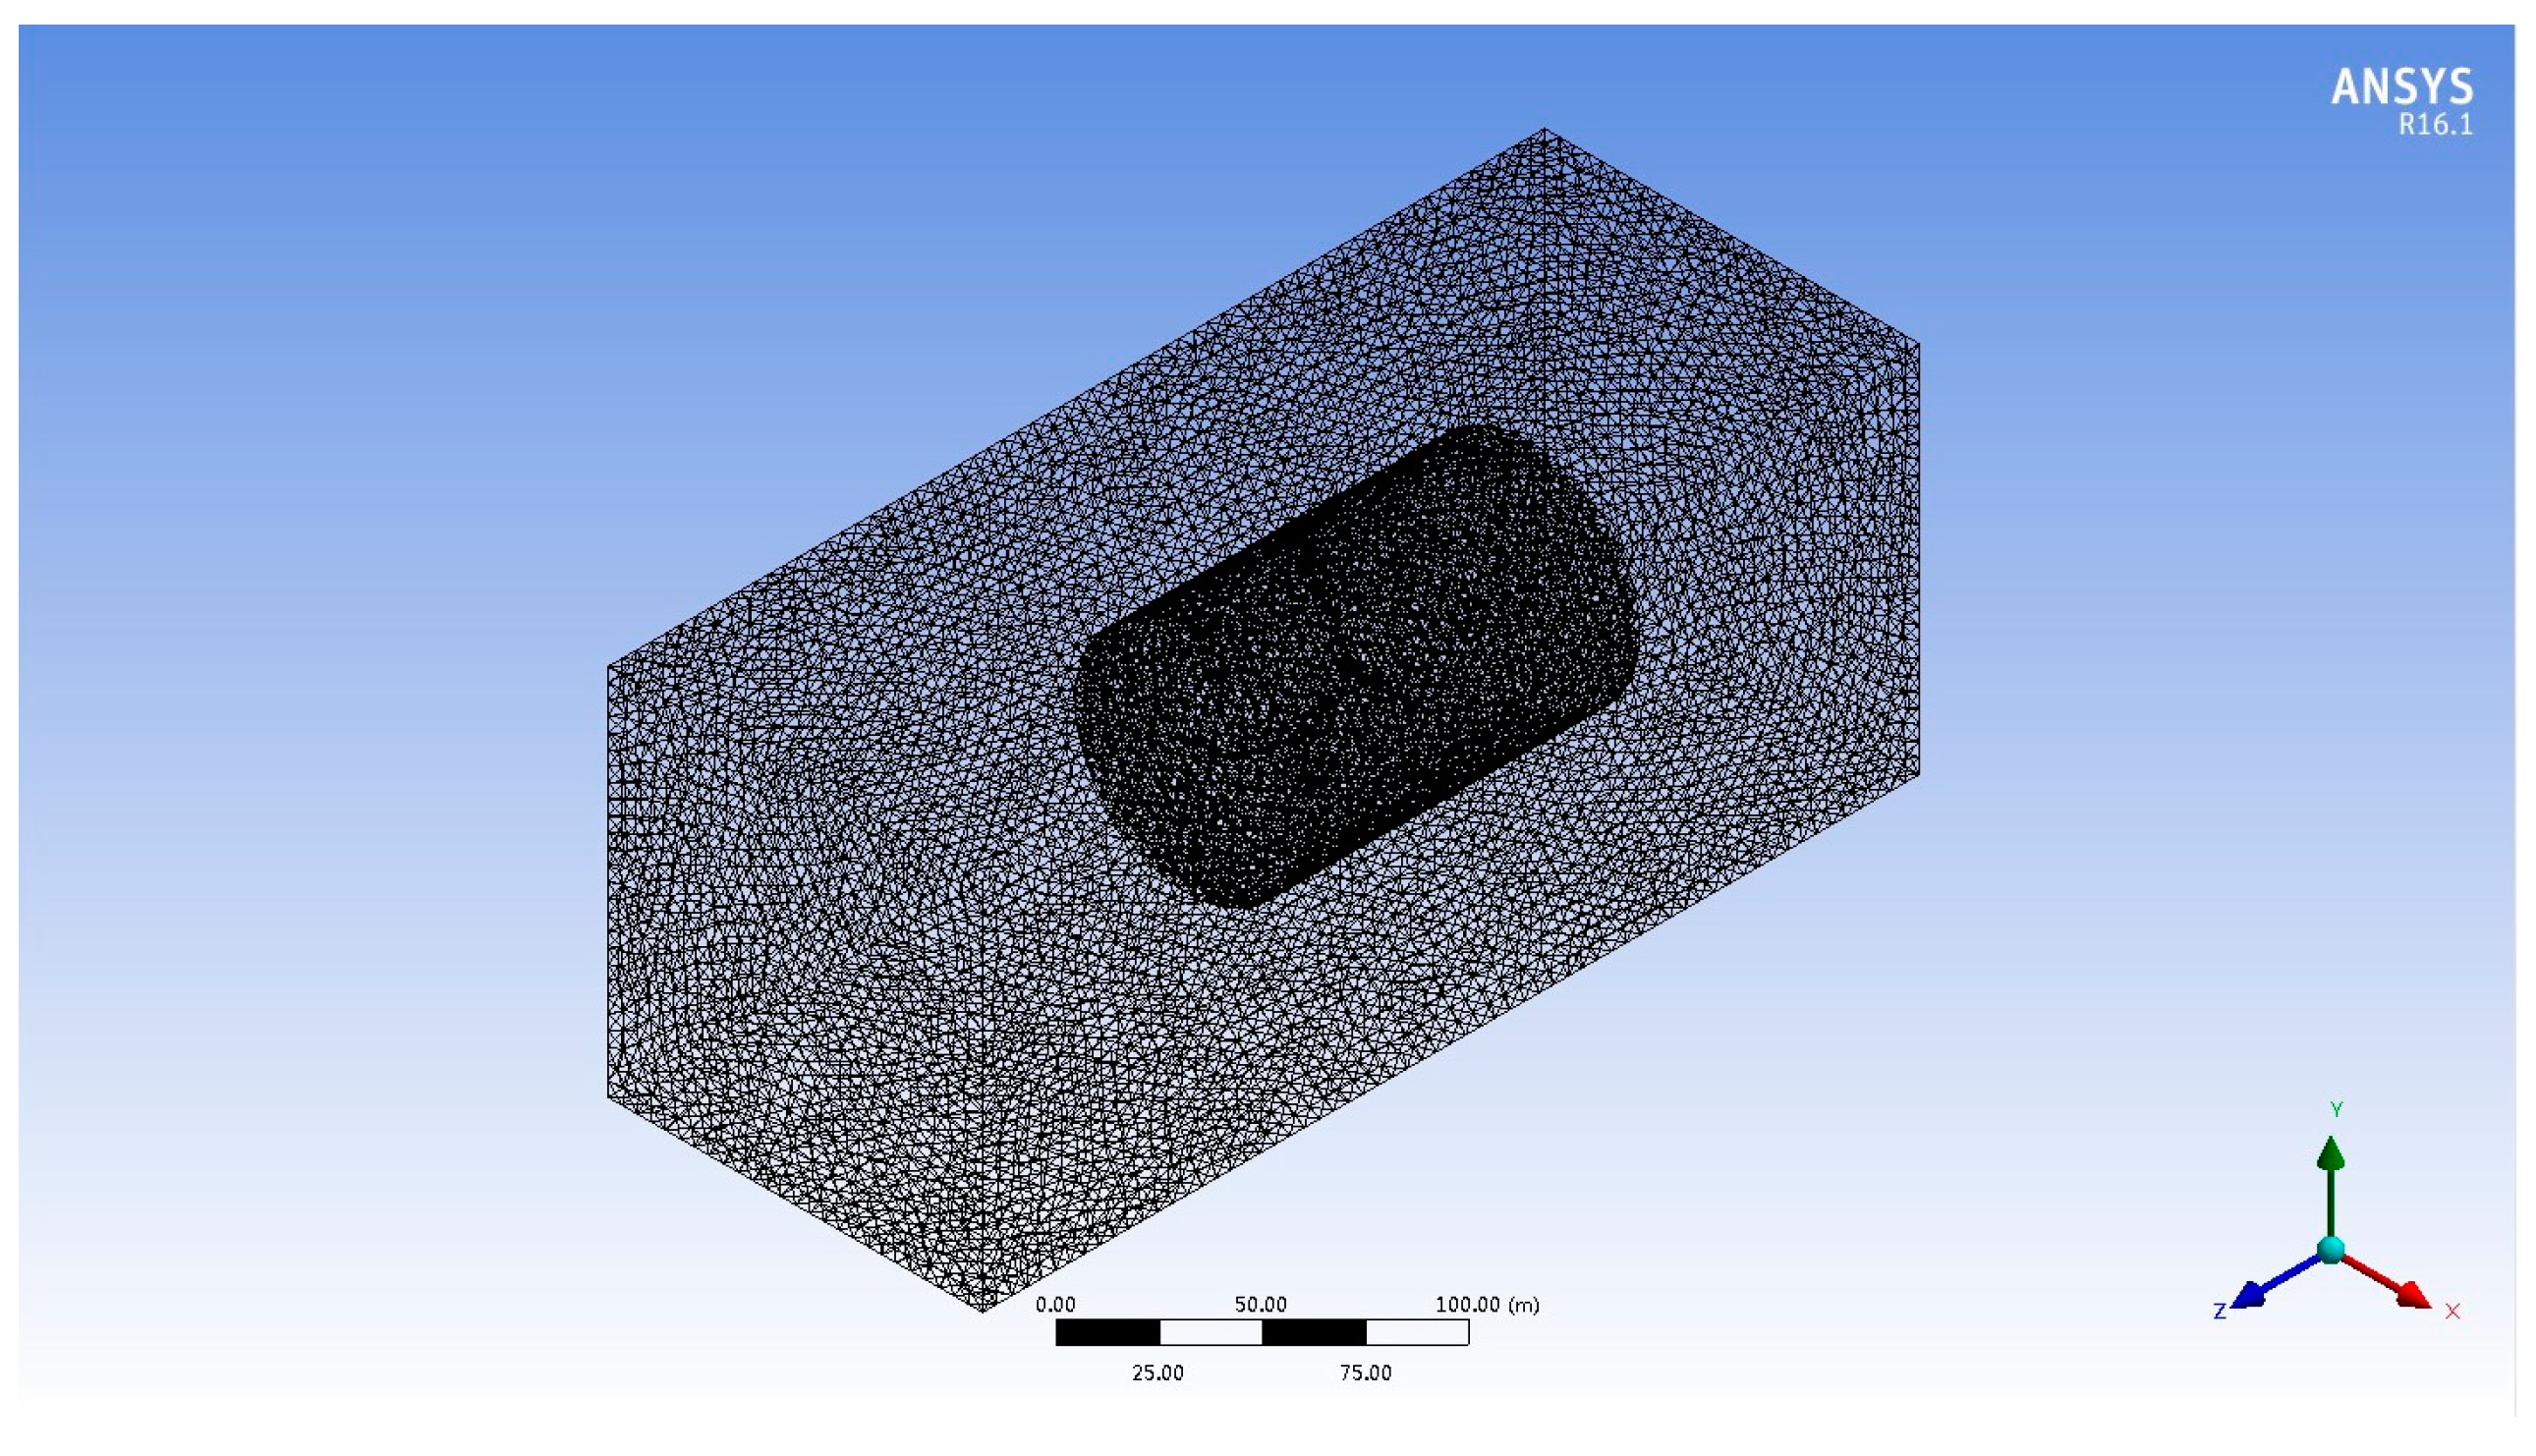
In mesh generation, the mesh quality requirement for the stationary domain is relatively low, whereas a high mesh quality standard is imposed for the rotating region and the regions proximate to the blade surfaces, necessitating localized refinement, as depicted in Figure 5.
The gas-solid two-phase flow in the wind–sand environment was resolved using the DPM model, disregarding interactions among sand particles. The turbulence model utilizes the standard k-ε model, and the pressure–velocity coupling algorithm adopted the SIMPLE algorithm. Additionally, all discrete formats employed the second-order upwind scheme. The Eulerian method was applied to solve the continuous phase, while the Lagrangian method was used to address the discrete phase, with sand particles distributed within the continuous phase. The equation for calculating the trajectory of sand particles in the discrete phase is as follows:
d u p d t = F D ( u u p ) + g ( ρ p ρ ) ρ p + F
where, u p is the velocity of discrete-phase particles, F D is the coefficient of resistance for particle movement in the air flow, u is fluid velocity, ρ is fluid density, ρ p is the density of discrete-phase particles, g is gravitational acceleration, and F is other forces.
The wear rate is used to measure the wear of the blade, and the calculation formula can be expressed as:
E r = 1 N p [ m p A f C ( d p ) f ( α ) v b ( v ) ]
where E r is the abrasion rate per unit area of material, A f is the erosion area, N p is the number of particles colliding on the erosion area, m p is the particle mass, C ( d p ) is the particle diameter function, α is the impact angle, f ( α ) is the function of the impact angle, v is the relative impact velocity, and b ( v ) is the relative velocity function.
Two particle sources were established, with a density of 2650 kg/m3 and particle sizes of 0.5 mm and 2 mm. The sand particle concentration was set to 106 μg/m3, and the mass flow rate of sand at the inlet was set to 100 g/s. The rotational speed of the wind rotor was set to 15 r/min according to the rated speed of the prototype wind turbine blade. The incoming wind speeds were configured as 12 m/s, 15 m/s, and 18 m/s. The wind rotor was configured as a “moving wall”, while the six intersecting surfaces between the rotating region and the stationary external flow field were treated with “interface”, with the remaining surfaces designated as “wall”.

2.3. Simulation Results and Analysis

2.3.1. The Trajectory of Sand Particles

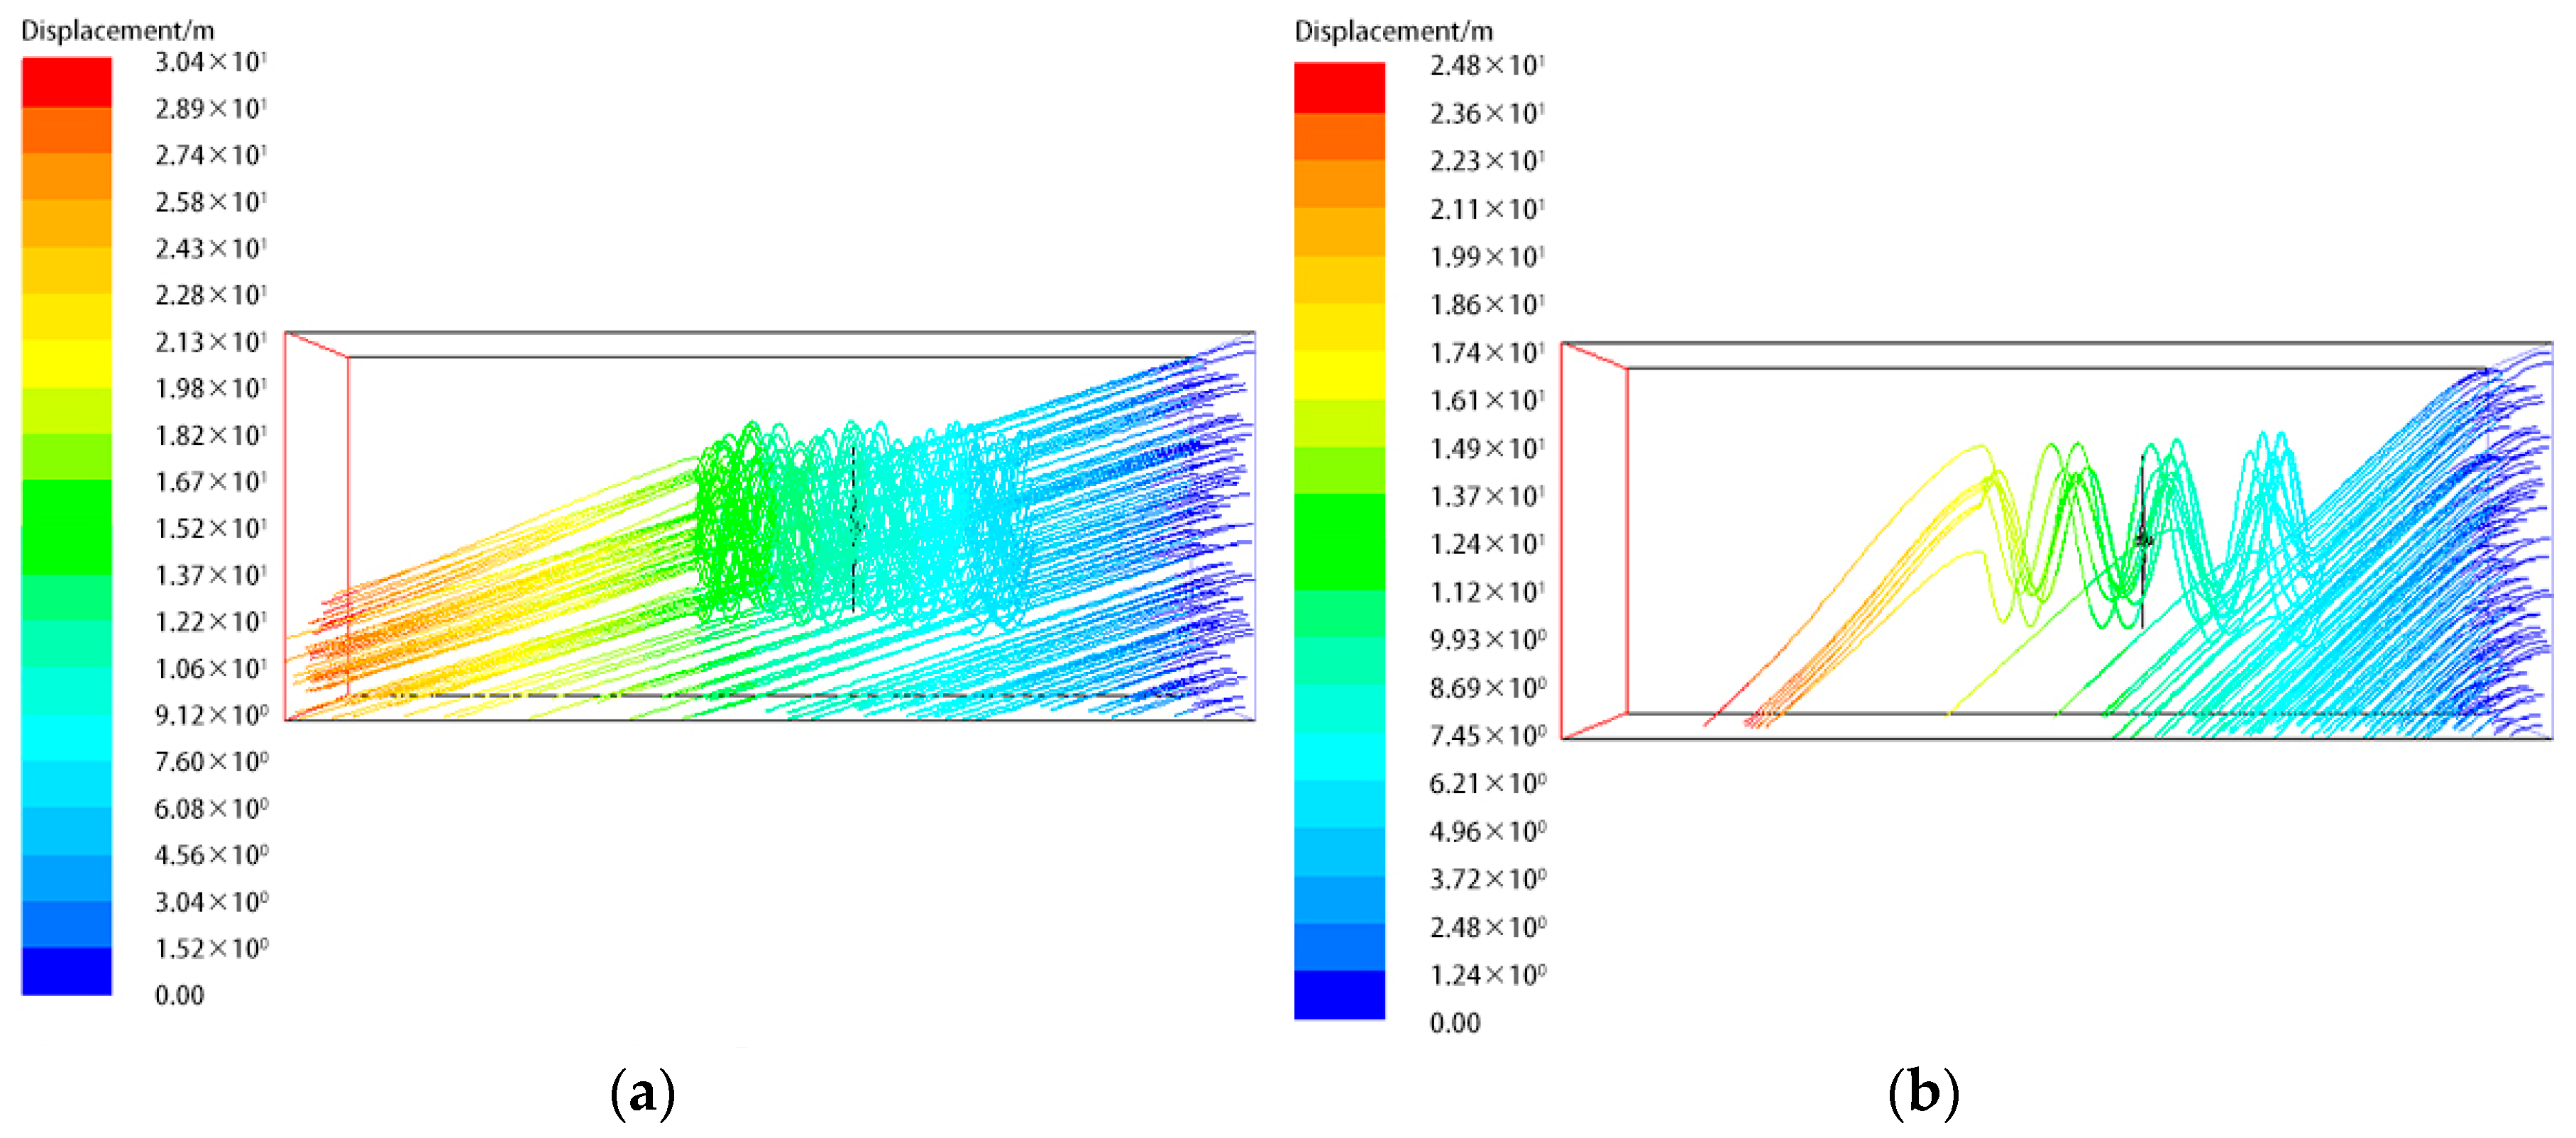
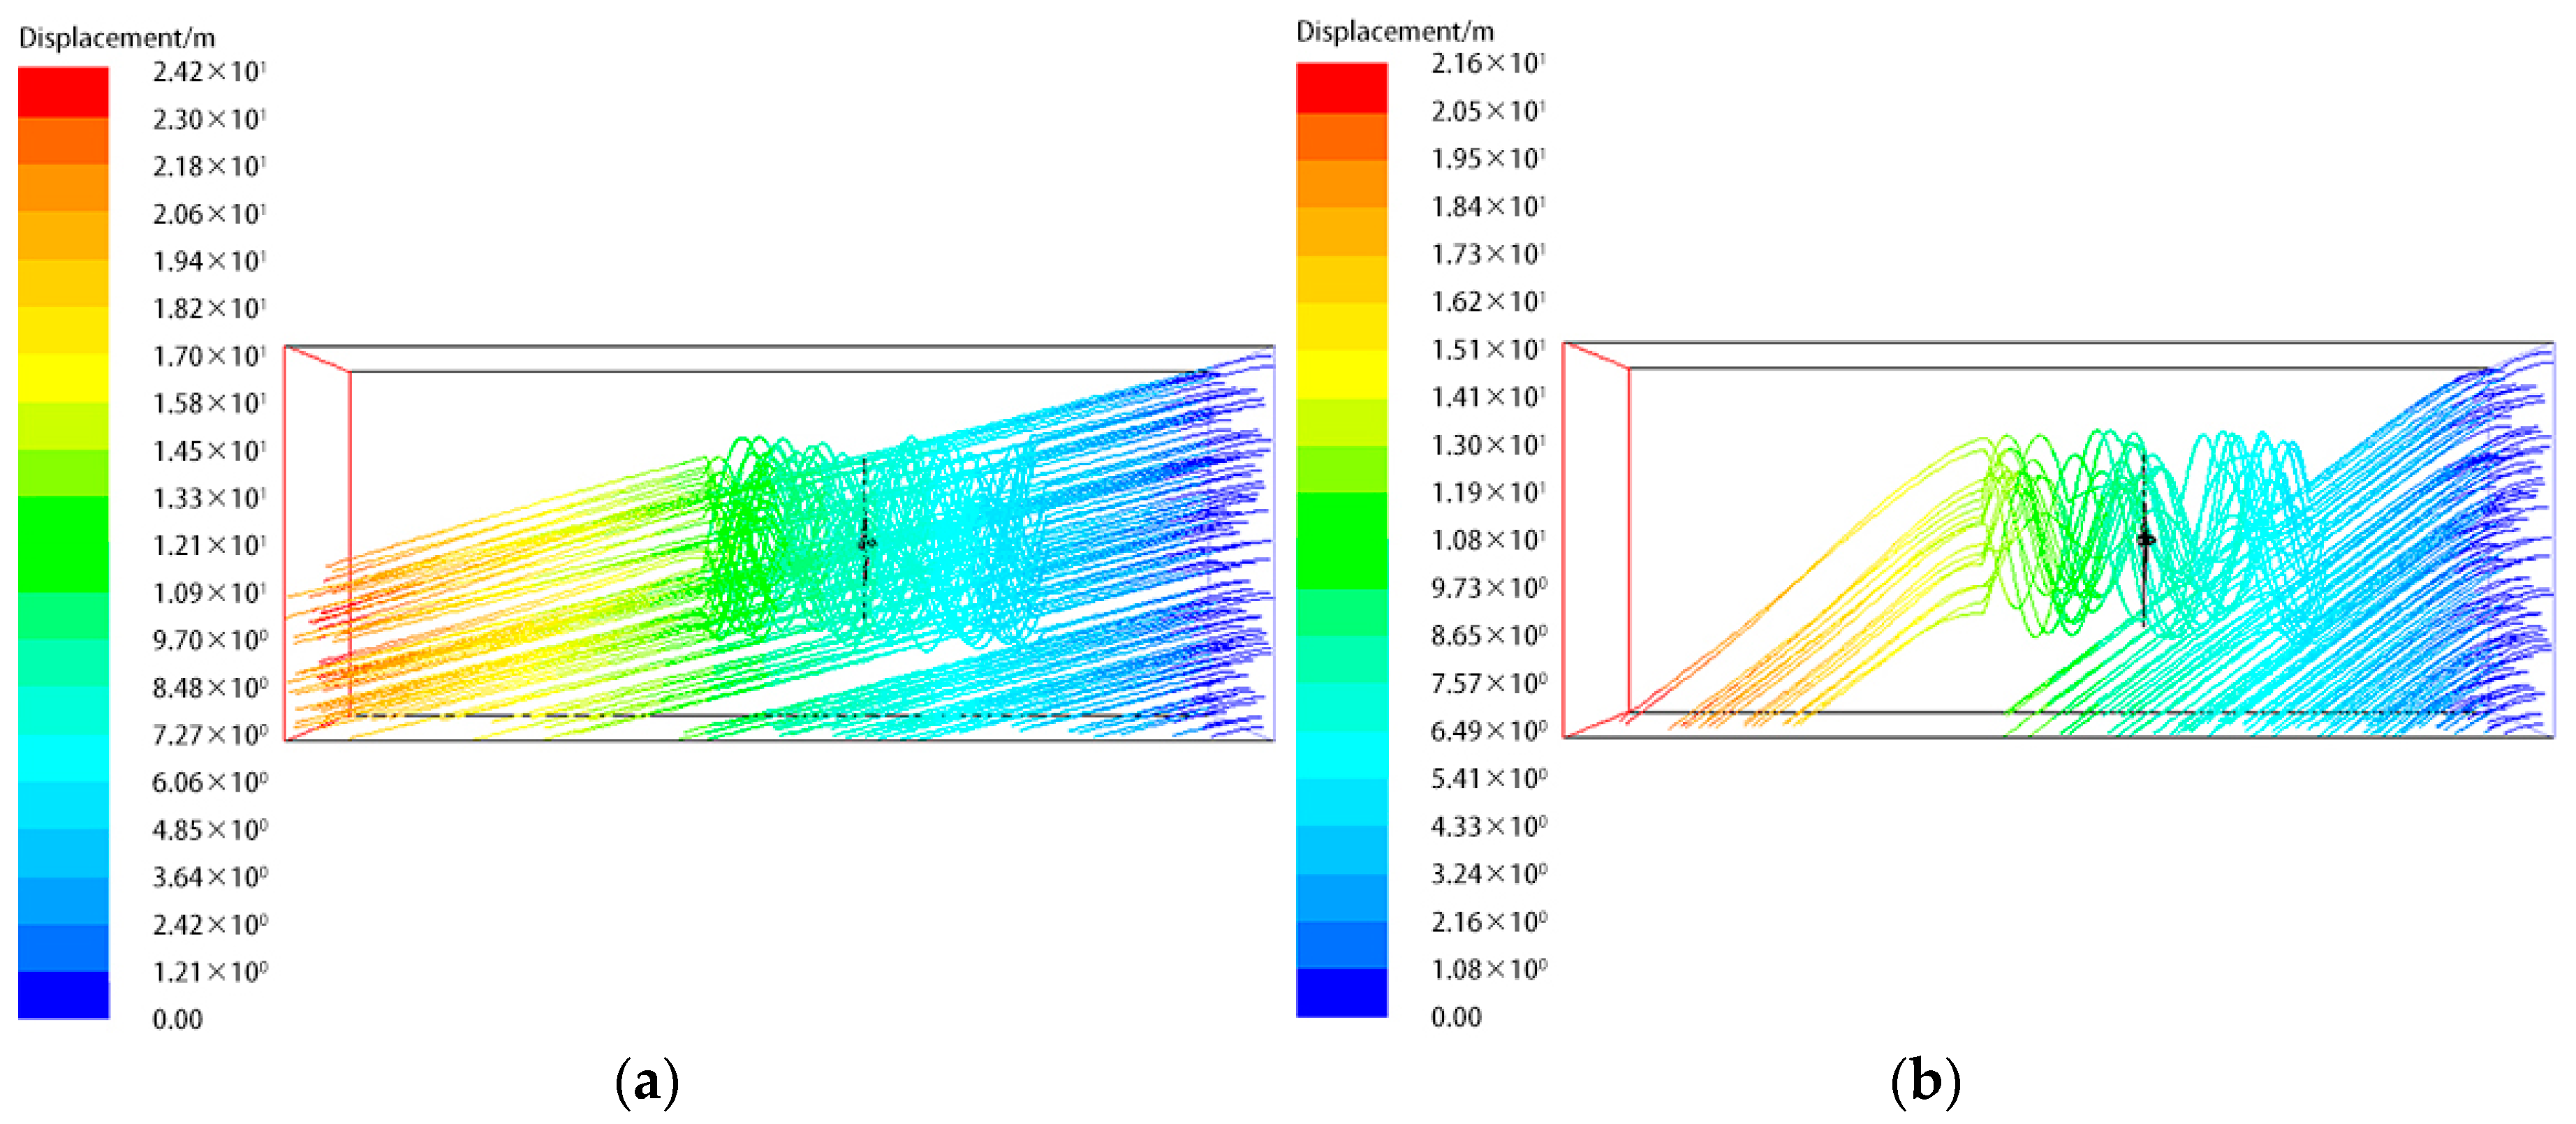
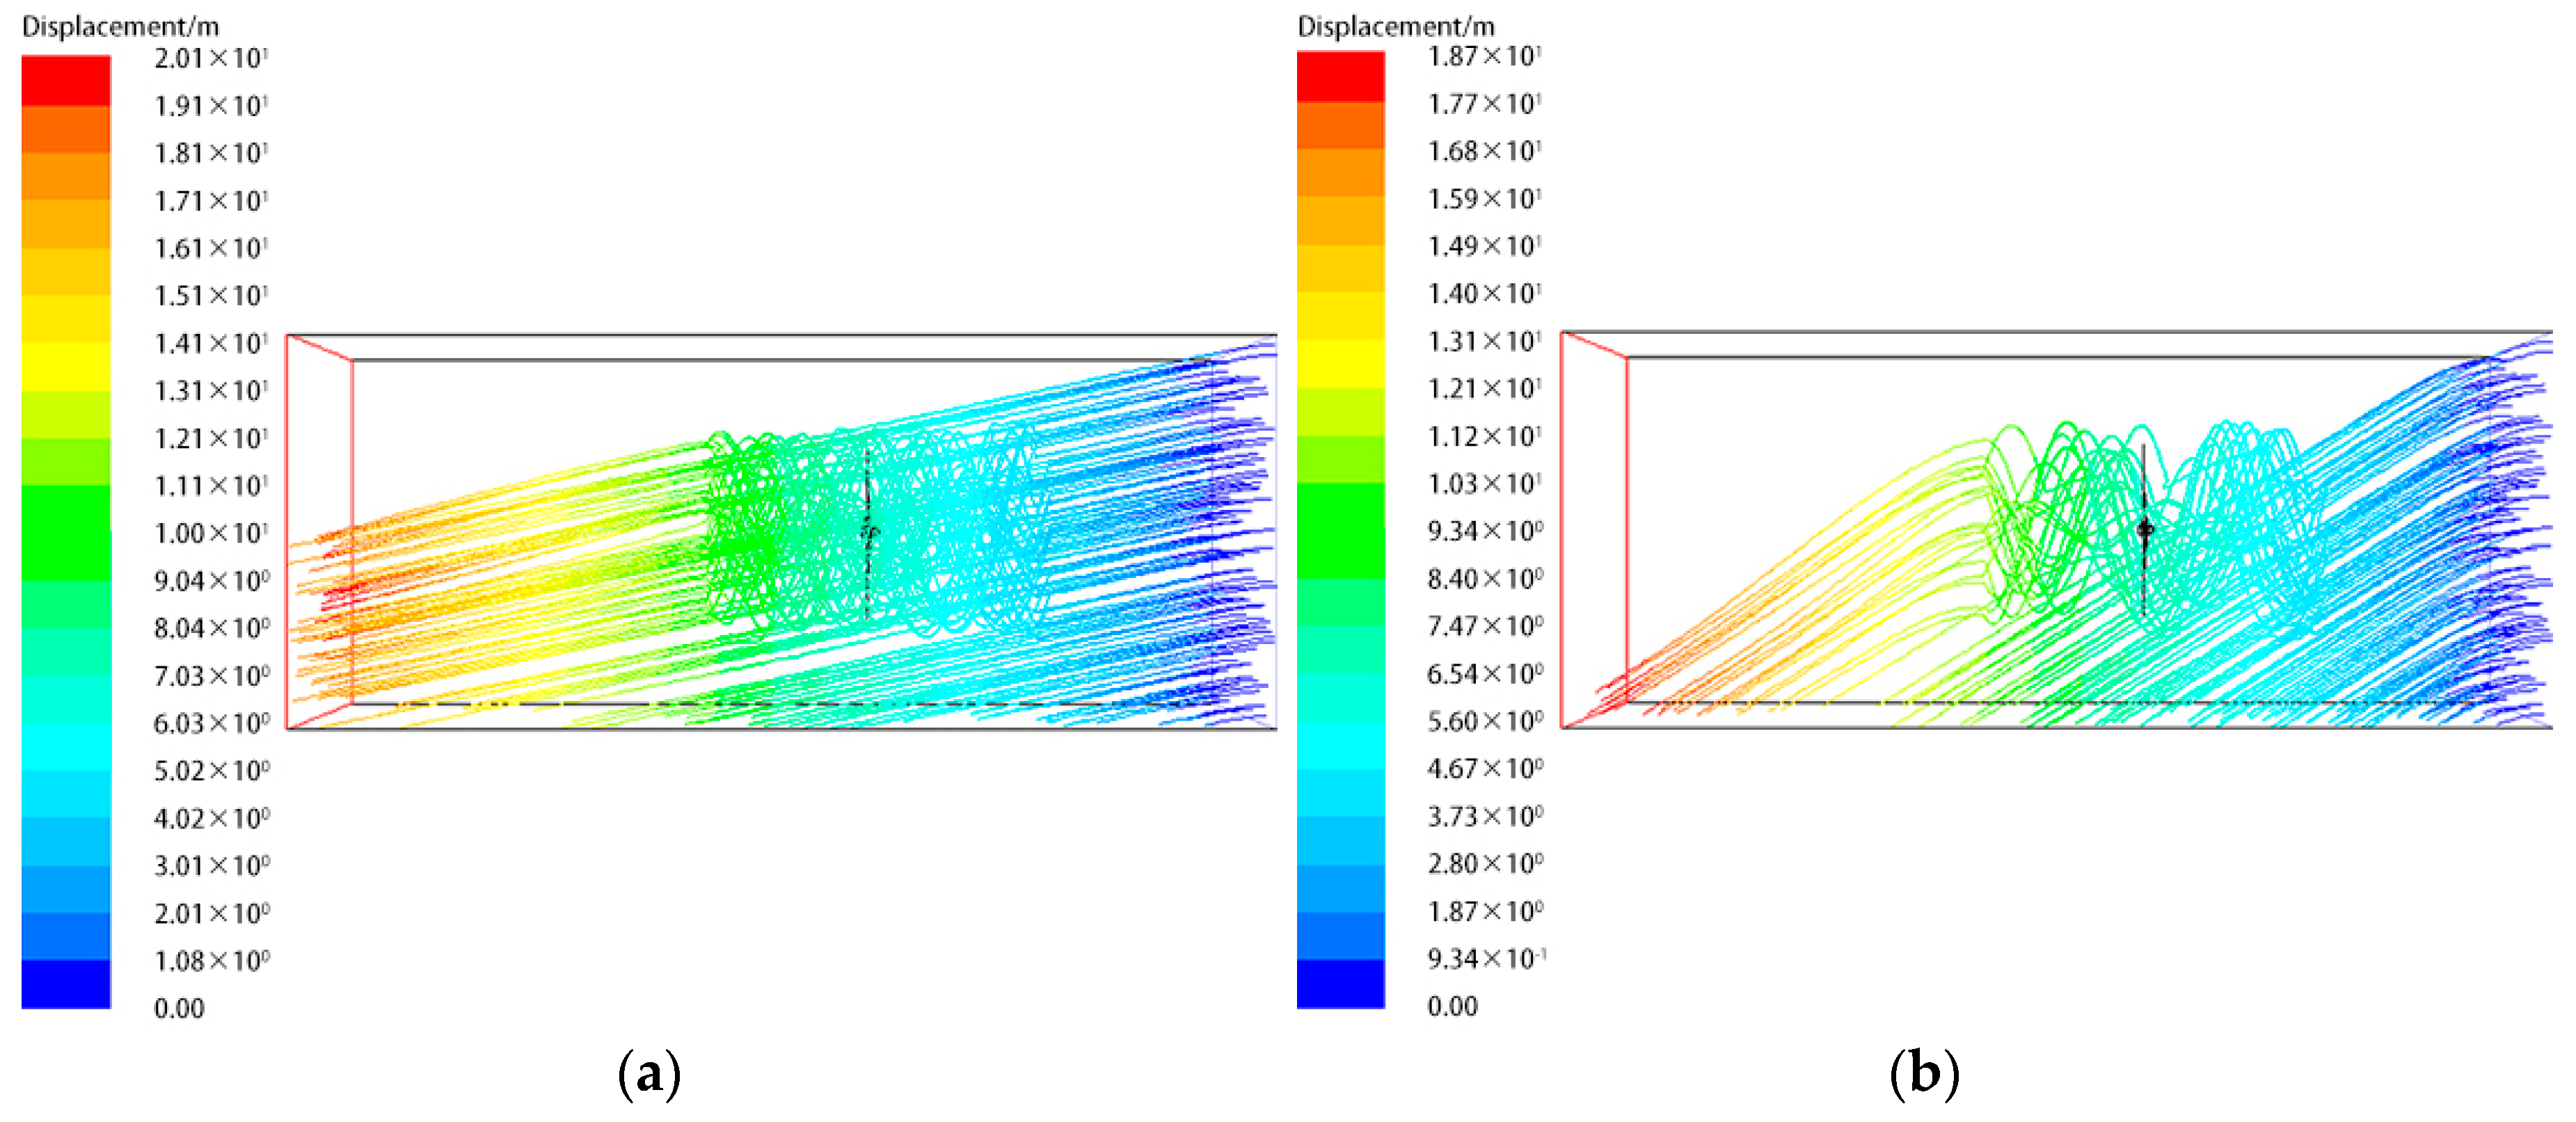
Under the influence of sand-carrying winds, the primary factor contributing to coating wear is the impact of sand particles, and the erosion effect is determined by the trajectory and behavior of these particles. Figure 6, Figure 7 and Figure 8 depict the trajectory lines of sand particles with sizes of 0.5 mm and 2 mm, tracked under the same sand mass flow rate but different wind speeds. Analyzing the sand particle trajectories reveals that within the stationary domain, sand particles move diagonally and maintain a consistent direction due to gravity and inertia. In the rotating domain, the rotational speed gradient from blade tip to root creates a significant pressure difference, resulting in vortex formation during blade rotation. Sand particles are simultaneously affected by these vortices, incoming wind speeds, and particle sizes, resulting in relatively complex trajectories. When small sand particles enter the rotational domain, the motion state undergoes significant changes. As the wind speed increases, there is a greater influx of new sand particles into the rotating domain, but most of them flow directly out of the flow field without changing their motion state. The impact force on the coating surface intensifies for those sand particles in contact with the blades due to the increased speed. Conversely, larger-sized sand particles exhibit a relatively gradual change in motion state. As wind speed rises, more sand particles are transported by the airflow into the rotational domain, thereby heightening the likelihood of impact with the blades, along with an escalation in impact force.
The kinetic energy of sand particles is entirely derived from the action of wind speed, hence differences in wind speed will directly impact the movement behavior of sand particles within the flow field. Taking Figure 6a, Figure 7a and Figure 8a as an example, it can be observed that sand particles within low-speed flow fields experience a greater descent in the vertical direction due to the influence of gravity. Under the combined effect of the internal rotating flow field and gravity, low-velocity sand particles tend to concentrate more in the lower half region as they exit the flow field at the outlet position.
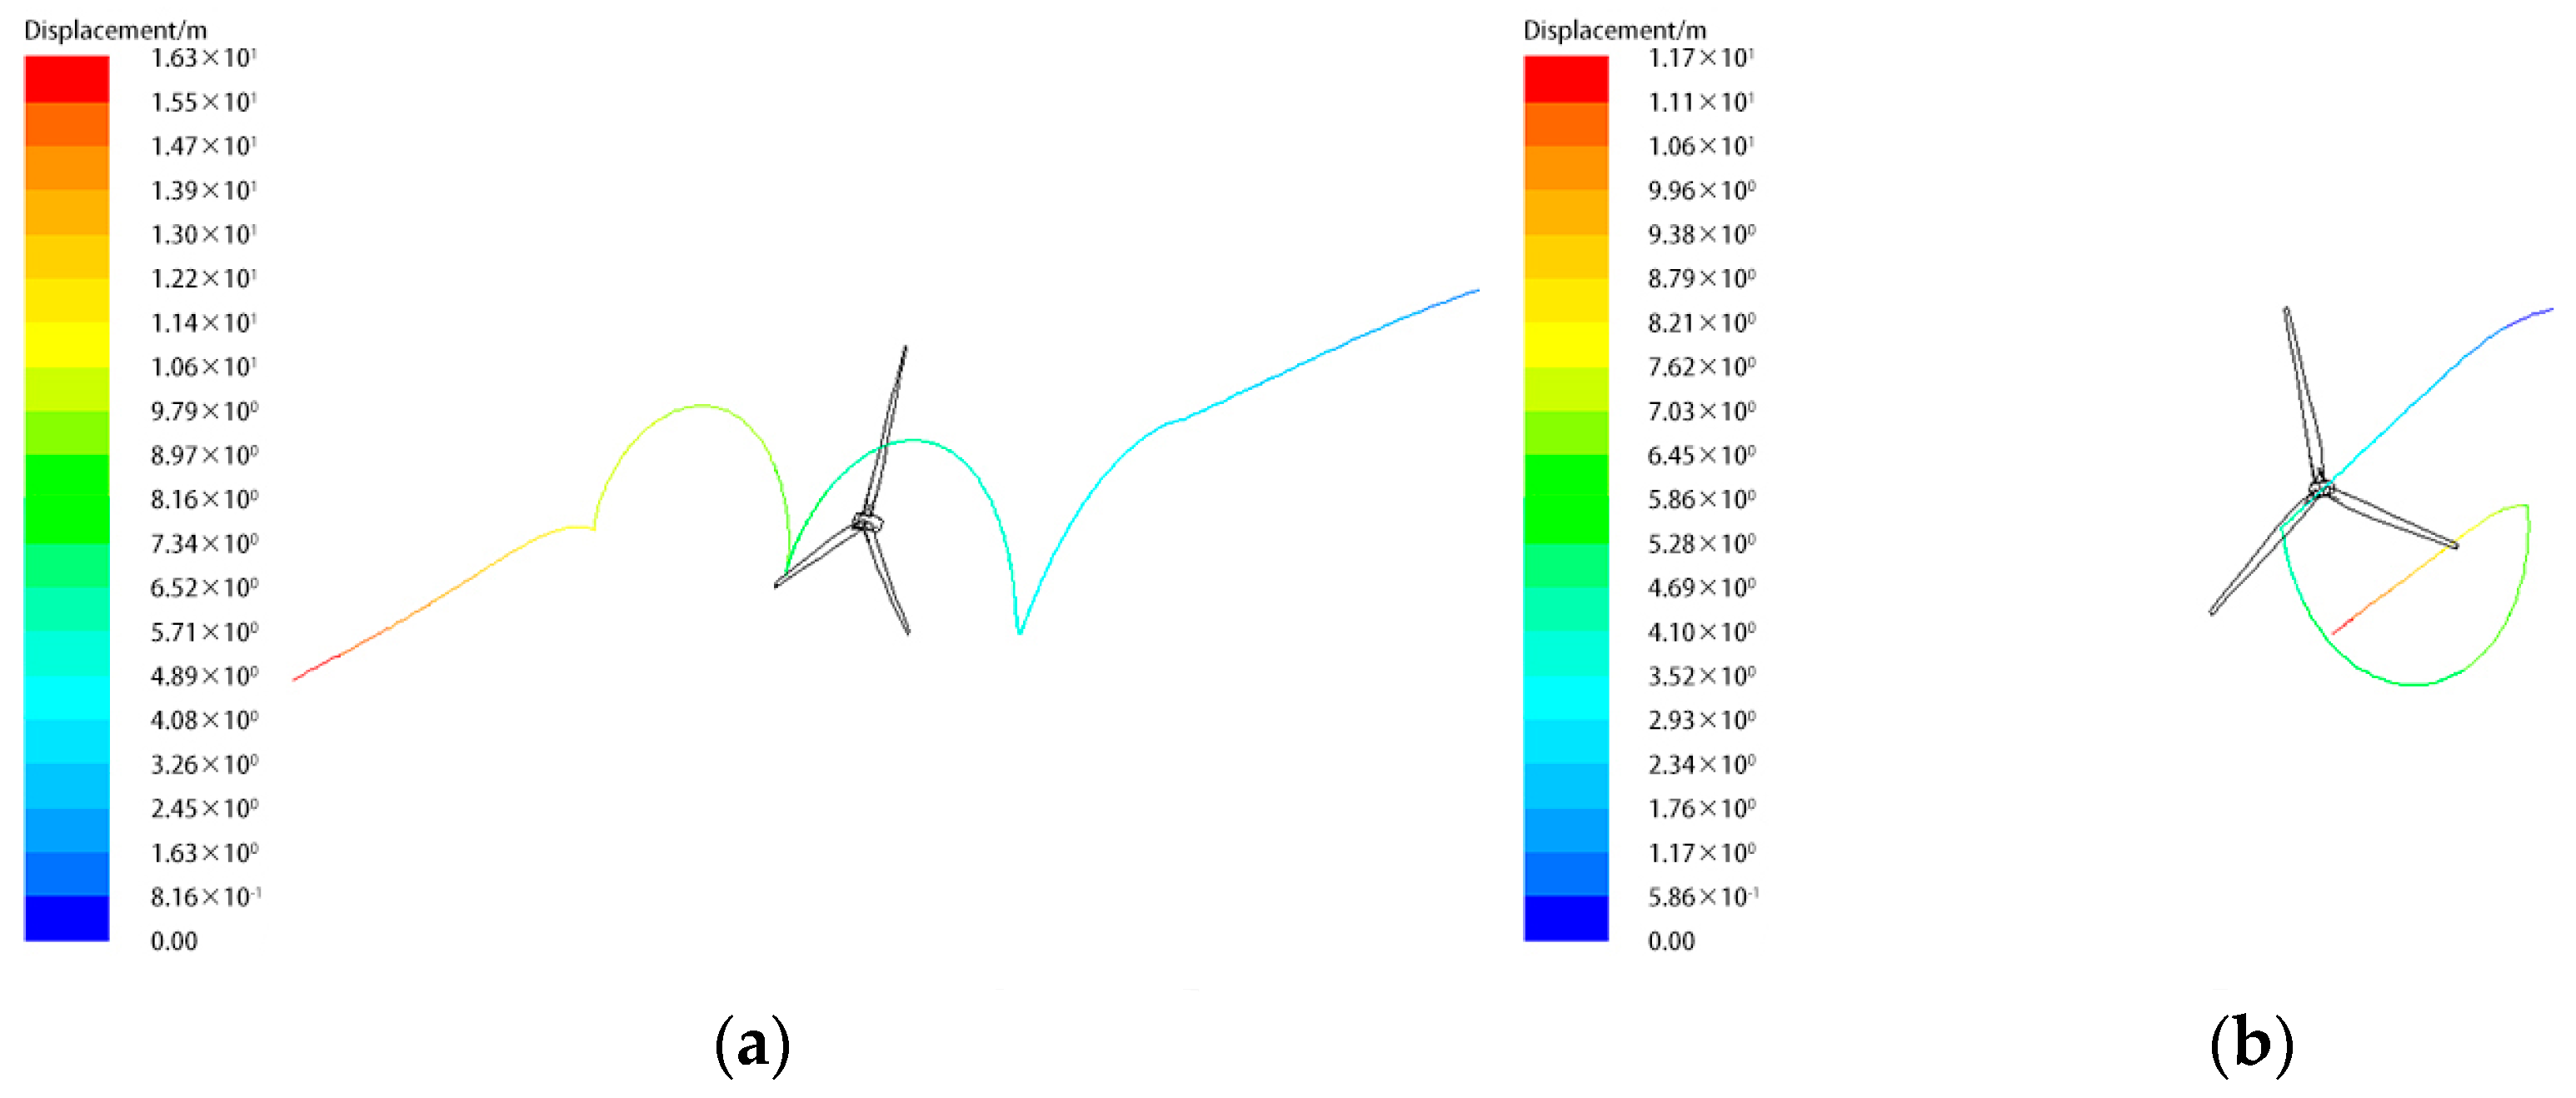
When small sand particles impact the blade, the direction and speed of movement are influenced by the airflow, causing them to continue moving along with the airflow. The trajectory approximates a helical movement, as depicted in Figure 9a. Conversely, larger-sized sand particles exhibit poorer aerodynamic mobility and rapidly rebound upon impact with the blade, as shown in Figure 9b. Consequently, smaller-sized sand particles tend to obliquely graze the blade surface, while larger-sized particles mostly undergo direct impact.

2.3.2. The Distribution of Wear Rate

The quantity and trajectory of sand particles impacting different parts of the blade determine the distribution of impact points and the severity of wear on the coating surface. Figure 10 illustrates the distribution of the coating erosion wear rate on the windward side of the blade for the same sand mass flow rate at wind speeds of 12 m/s, 15 m/s, and 18 m/s. The wear rate distribution differs among the three blades due to the rotational imbalance of the wind rotor caused by the wear of the blade surface. From the blades with the most severe wear, it is evident that the color of the section from the blade root to 0.3R is darker, indicating a lower wear rate and fewer sand impact points. The section from 0.3R to 0.7R gradually lightens in color, signifying an increasing wear rate and a growing number of sand impact points. The color of the section from 0.7R to the blade tip gradually changes from yellow to red, representing the highest wear rate. As the wind speed increases, the wear rate initially increases and then decreases, yet the wear parts remain relatively unchanged.

3. Erosion Experiment

3.1. Experimental Blade

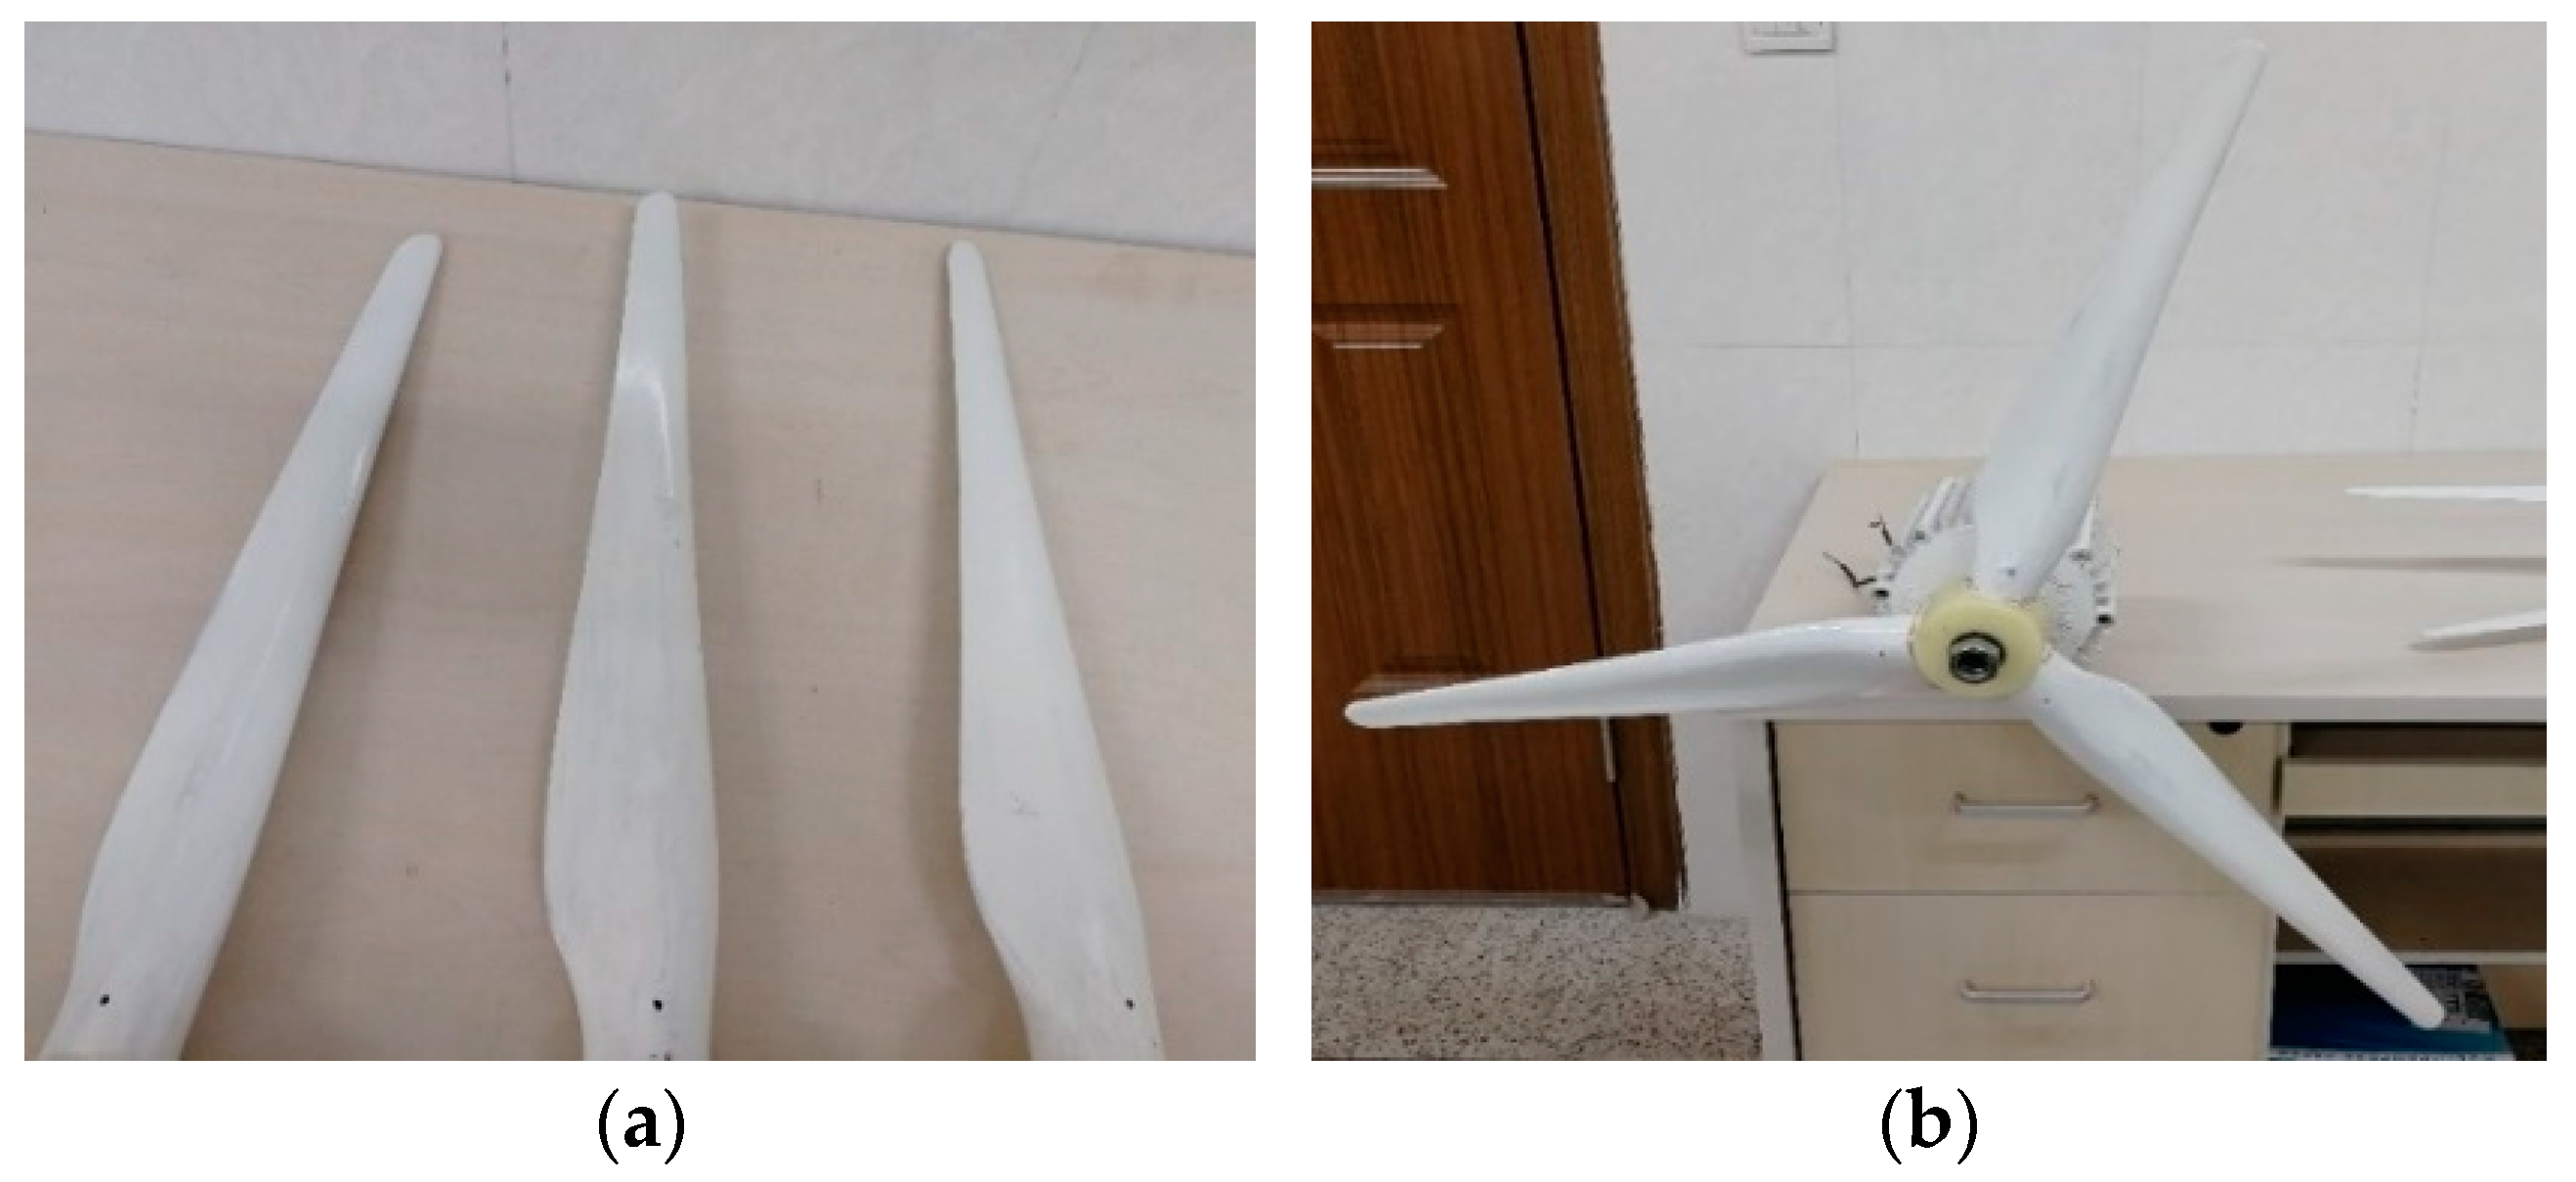
A micro blade model of a 1.5 MW horizontal axis wind turbine prototype blade was designed based on the principles of geometric similarity, kinematic similarity, and dynamic similarity [24,25]. Considering the wind tunnel dimensions, a scale factor of 1/80 was chosen, which was applied to adjust the blade length, blade element radius, geometric chord of airfoil, and airfoil thickness proportionally. The prototype blade has a length of 32 m, the Reynolds number is 2.6 × 10⁷, the rated wind speed is 12 m/s and the rotational speed is 15 r/min. The miniature blade, with a length of 0.4 m, is made of a wooden core covered with a layer of fiberglass. The coating consists of polyurethane primer and topcoat. The wind rotor diameter is 1 m, as illustrated in Figure 11.

3.2. Experimental Equipment and Erosion Process

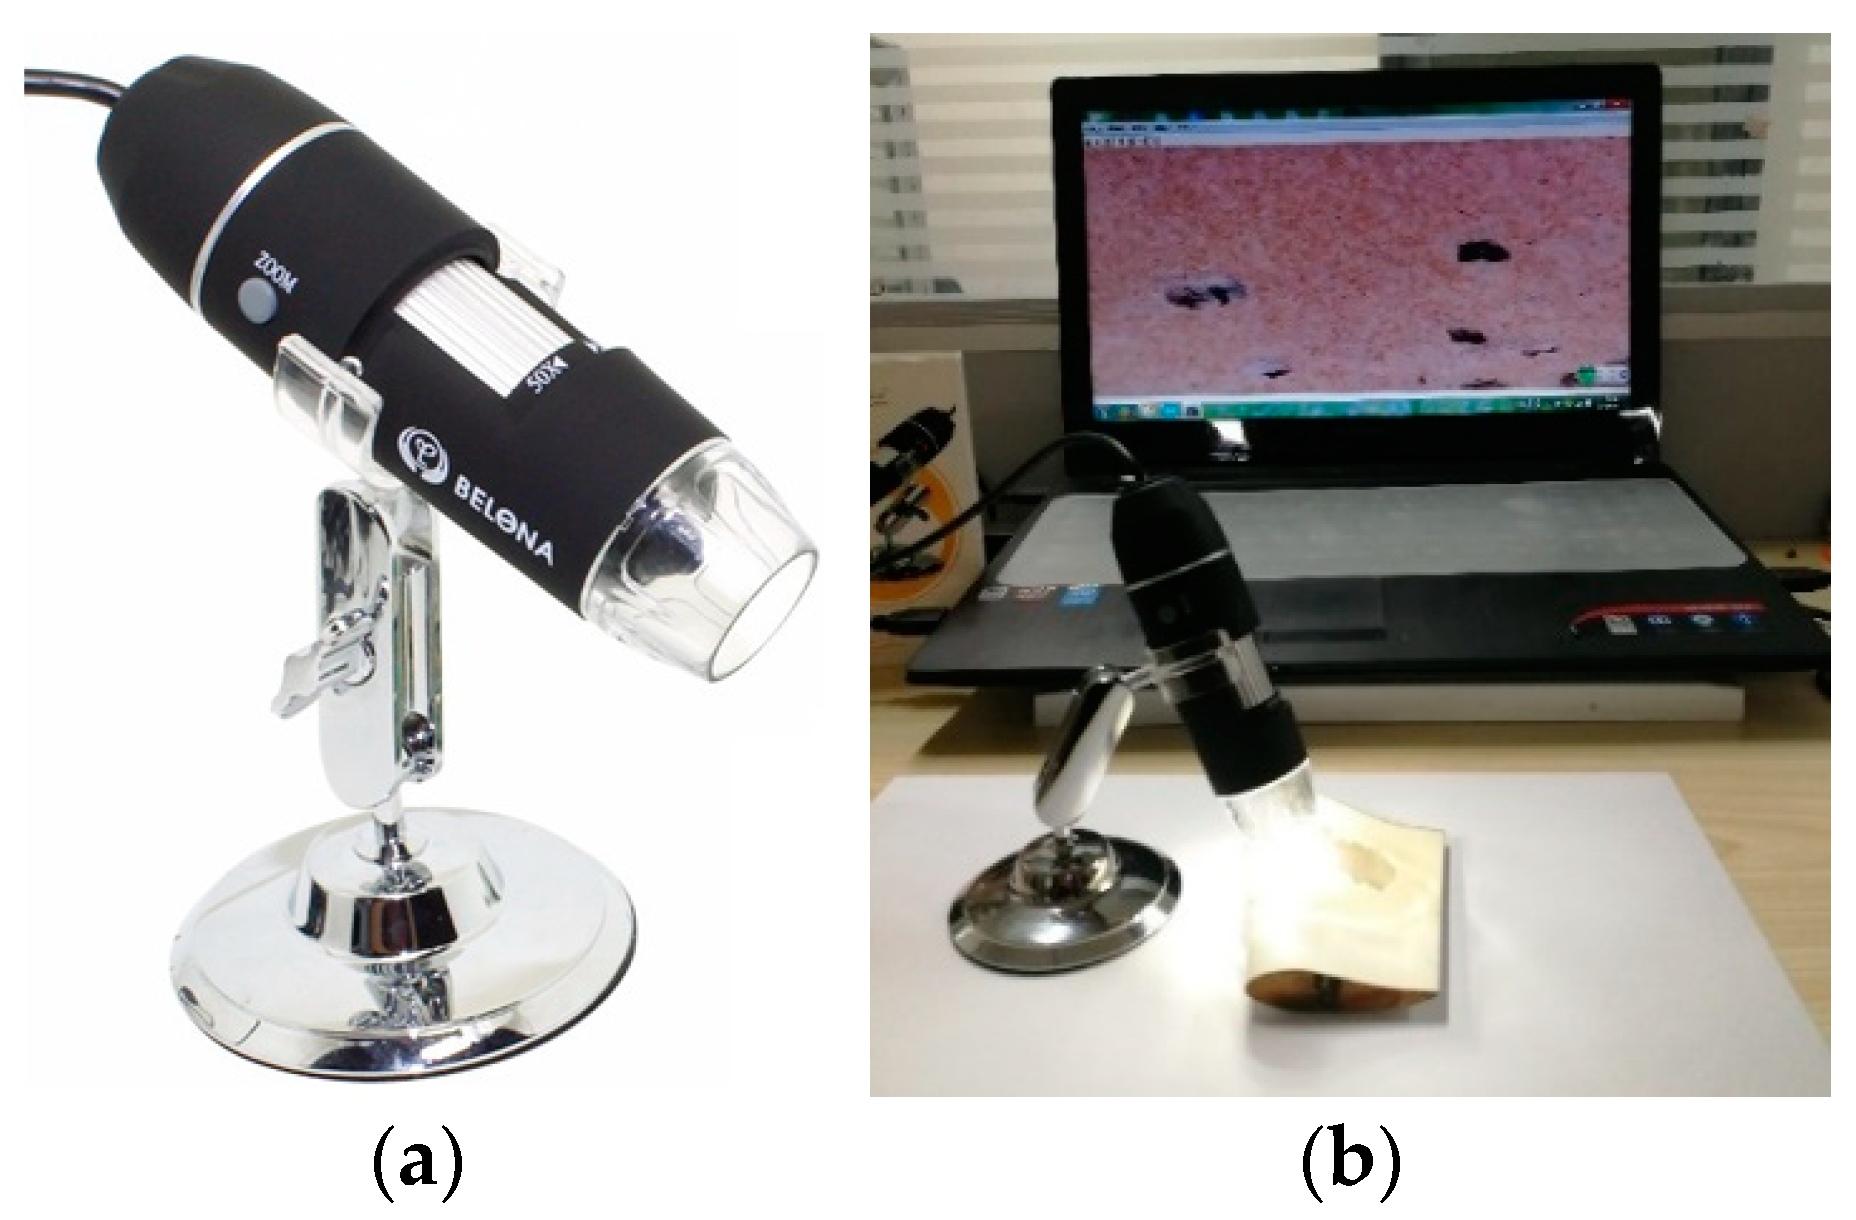
A wind tunnel, type 0FDY-1.2, depicted in Figure 12, was utilized to replicate the wind–sand environment in Alashan, Inner Mongolia, with its performance parameters outlined in Table 1 [26]. The erosion and wear tests were conducted on 1.5 MW micro wind rotor. The erosion morphology of the blade coating was observed through a digital microscope, as shown in Figure 13.
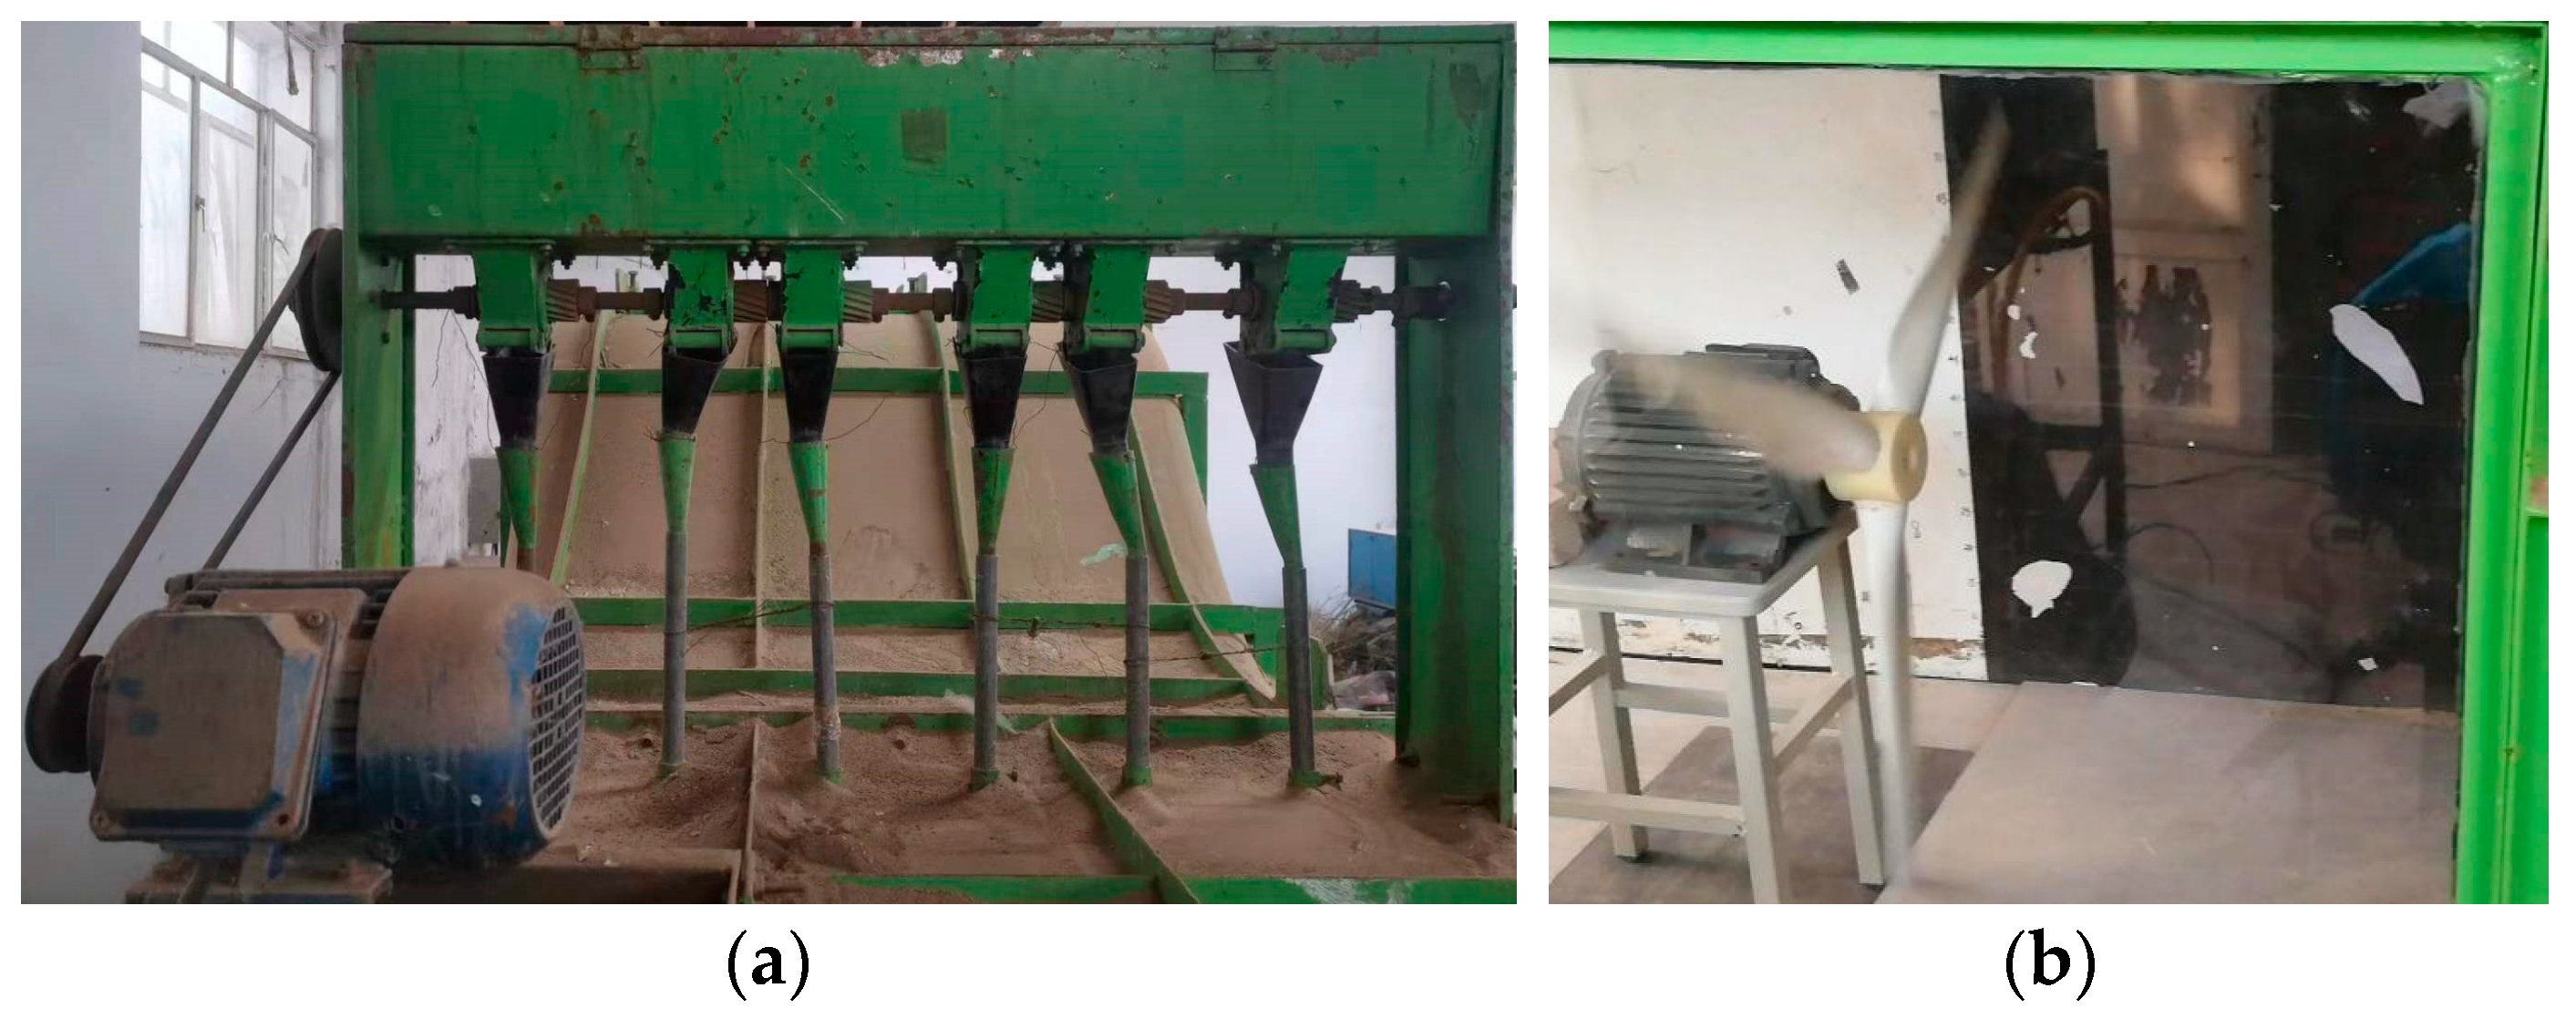
A schematic diagram of the wind tunnel is shown in Figure 14, which comprises the fan section, rectification section, diffusion section (including porous plate and honeycomb), contraction section (including damping grids and parallel bar grid), and experimental section,. The wind tunnel had a total length of 11.8 m and employed a 1.4 m diameter axial flow fan powered by a 40 kW generator. The experimental section was designed with a rectangular bottomless cross-section. The wind speed was continuously adjustable within 0–18 m/s. The sand-carrying wind was simulated by the sand conveyor of the wind tunnel, which was controlled by a frequency converter, and the minimum amount of sand discharged was 0.53 g/s. The sand particles used for the experiment were loaded into the conveyor. Subsequently, the wind tunnel was initiated, and the wind speed was adjusted according to experimental requirements. Once the wind speed stabilized, the conveyor was activated, and the mass flow of sand particles was adjusted. The sand particles were mixed with the airflow, forming a sand-carrying wind, which eroded the rotating turbine blades, as shown in Figure 15.

3.3. Results and Analysis

3.3.1. Distribution of Erosion Pits

The wear characteristics of the blade coating at different stages include three main types: sand holes, small pits, and coating peeling. The sizes of these characteristics were defined by 3M (St Paul, MN, USA), as shown in Table 2 [27]. The most severe erosion pits on the blade coating in this experiment do not exceed 3.8 mm in diameter, and the length of the cutting marks is no more than 4 mm. Therefore, all of them are classified as small pits.
Figure 16a,b illustrates the number of erosion pits on the leading edge, windward side, leeward side, and trailing edge for particle sizes of 0–1 mm and 1–2 mm, respectively. The leading edge exhibits the highest number of erosion pits, followed by the windward side, trailing edge, and leeward side. This is due to the fact that when the wind turbine blade is in operation, the leading edge forms a 90° angle to the wind–sand flow, resulting in direct impact of sand particles on the coating surface and, consequently, a higher number of erosion pits. The windward side, with a smaller angle to the airflow, experiences fewer erosion pits, primarily manifesting scratches along the direction of the airflow. The trailing edge and leeward side have the smallest number of erosion pits, as the sand particles bypass the trailing edge and have minimal contact with the leeward side.
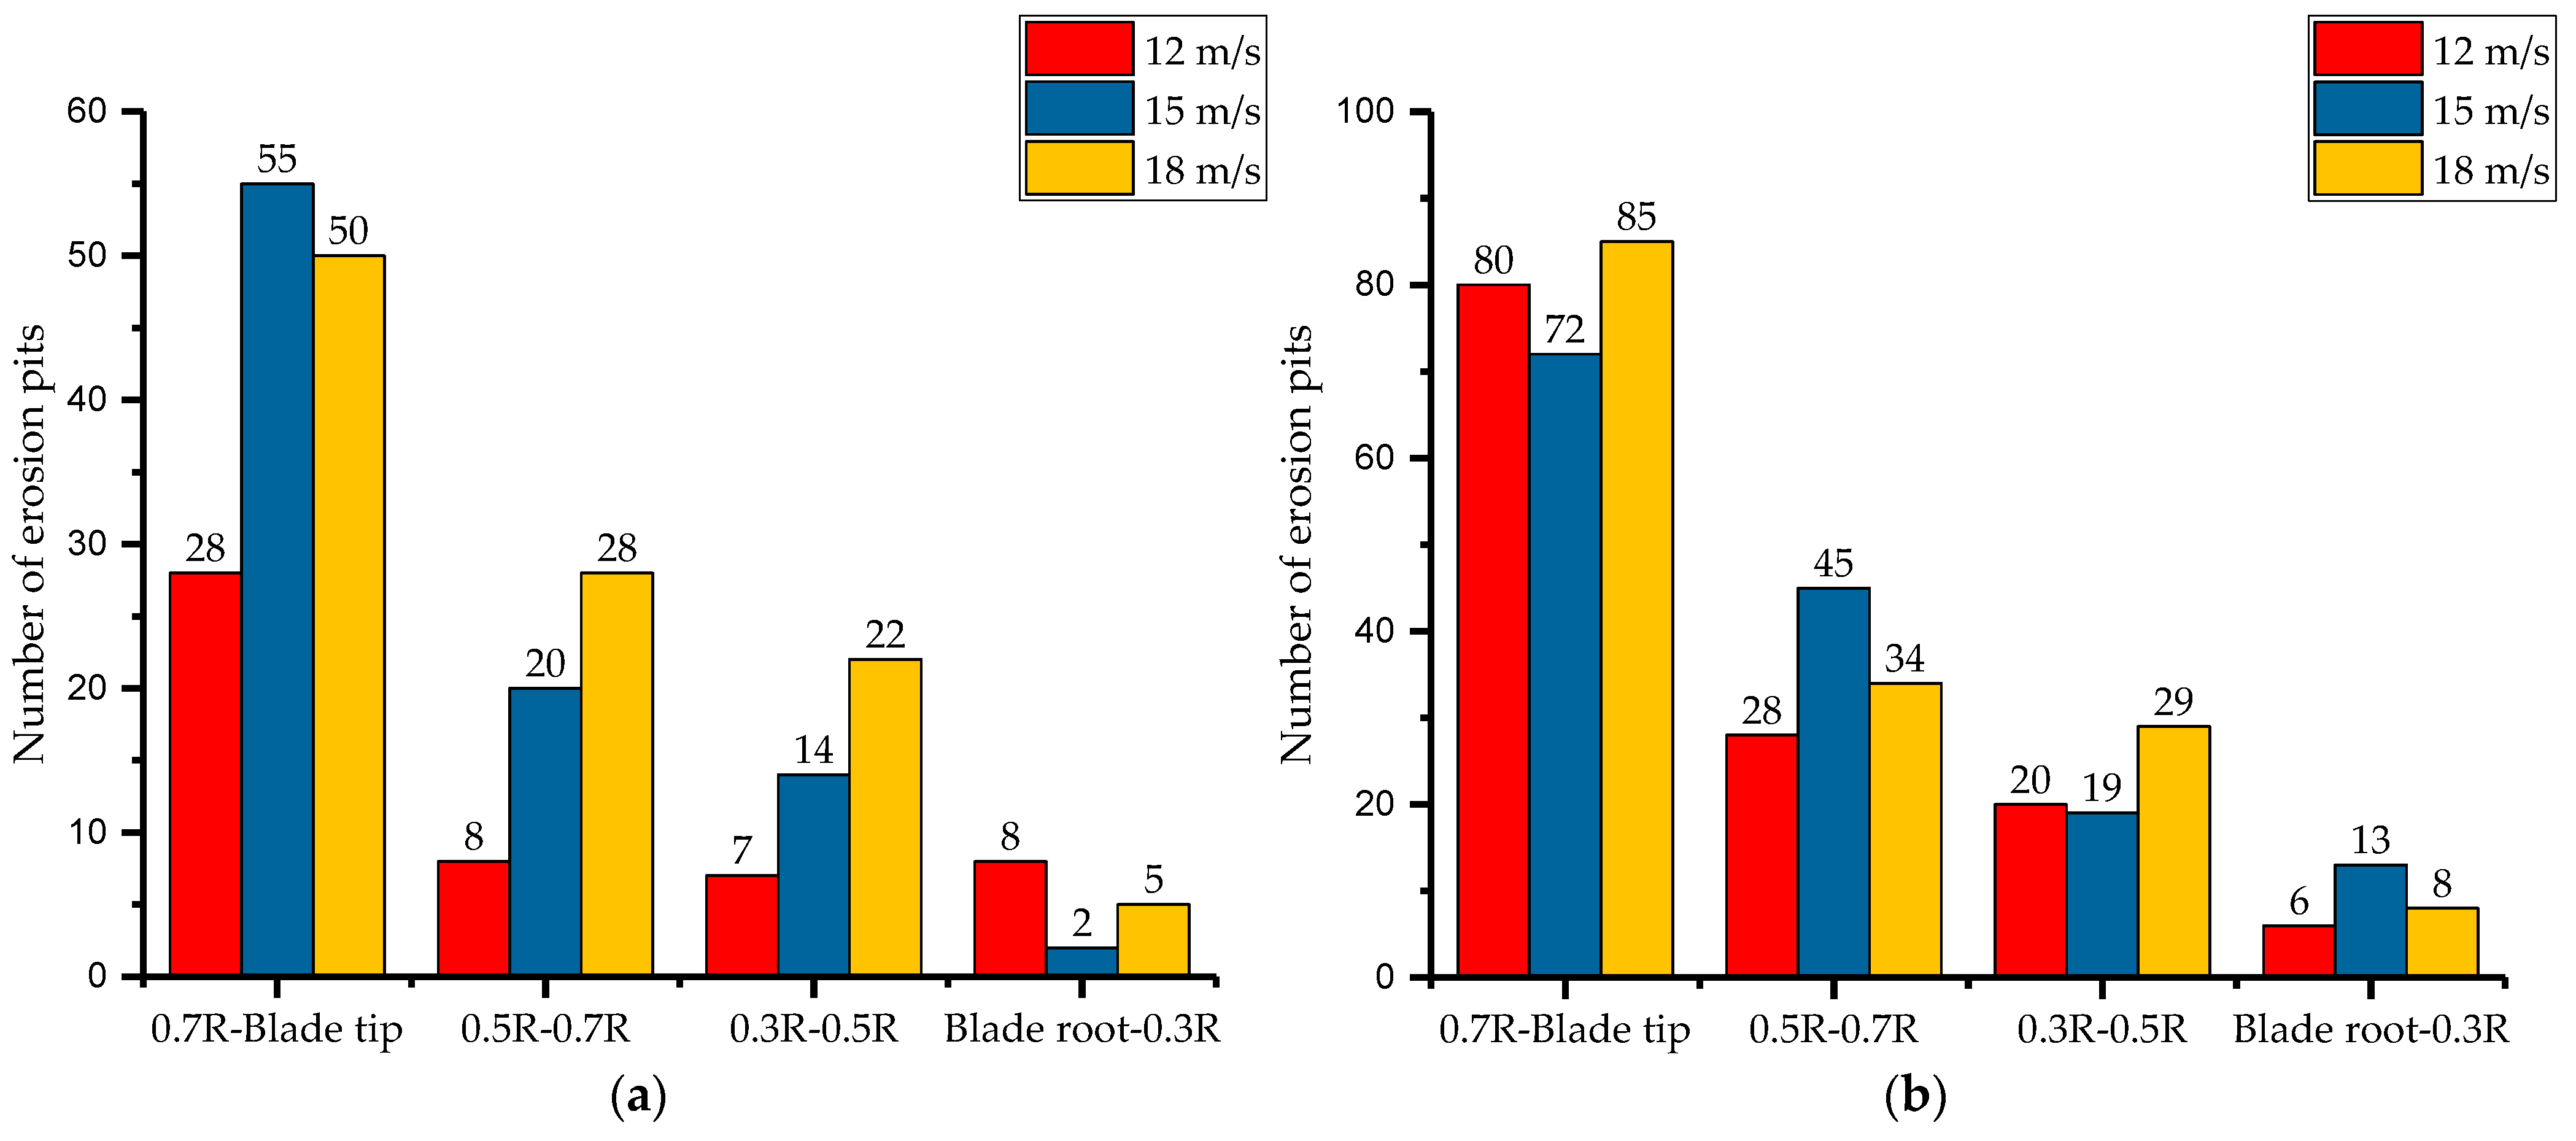
As the velocity decreases sequentially from the blade tip to the root, a significant pressure difference is formed between them, resulting in vortex generation when the blade is rotating. Consequently, the number of erosion pits from the root to 0.3R is the lowest, resulting in a lower wear rate. In contrast, the number of erosion pits from 0.7R to the blade tip is the highest, leading to the largest wear rate, as shown in Figure 17a,b. These experimental findings align with the wear rate distribution obtained from the numerical simulations.
When comparing the number of erosion pits caused by different particle sizes, it is observed that the number of erosion pits for sand particles with a size of 1–2 mm exceeds that for sand particles with a size of 0–1 mm. This is attributed to the larger mass and momentum of sand grains with larger grain sizes, which makes it difficult for their trajectory to change with the airflow.

3.3.2. Erosion Morphology and Wear Mechanism

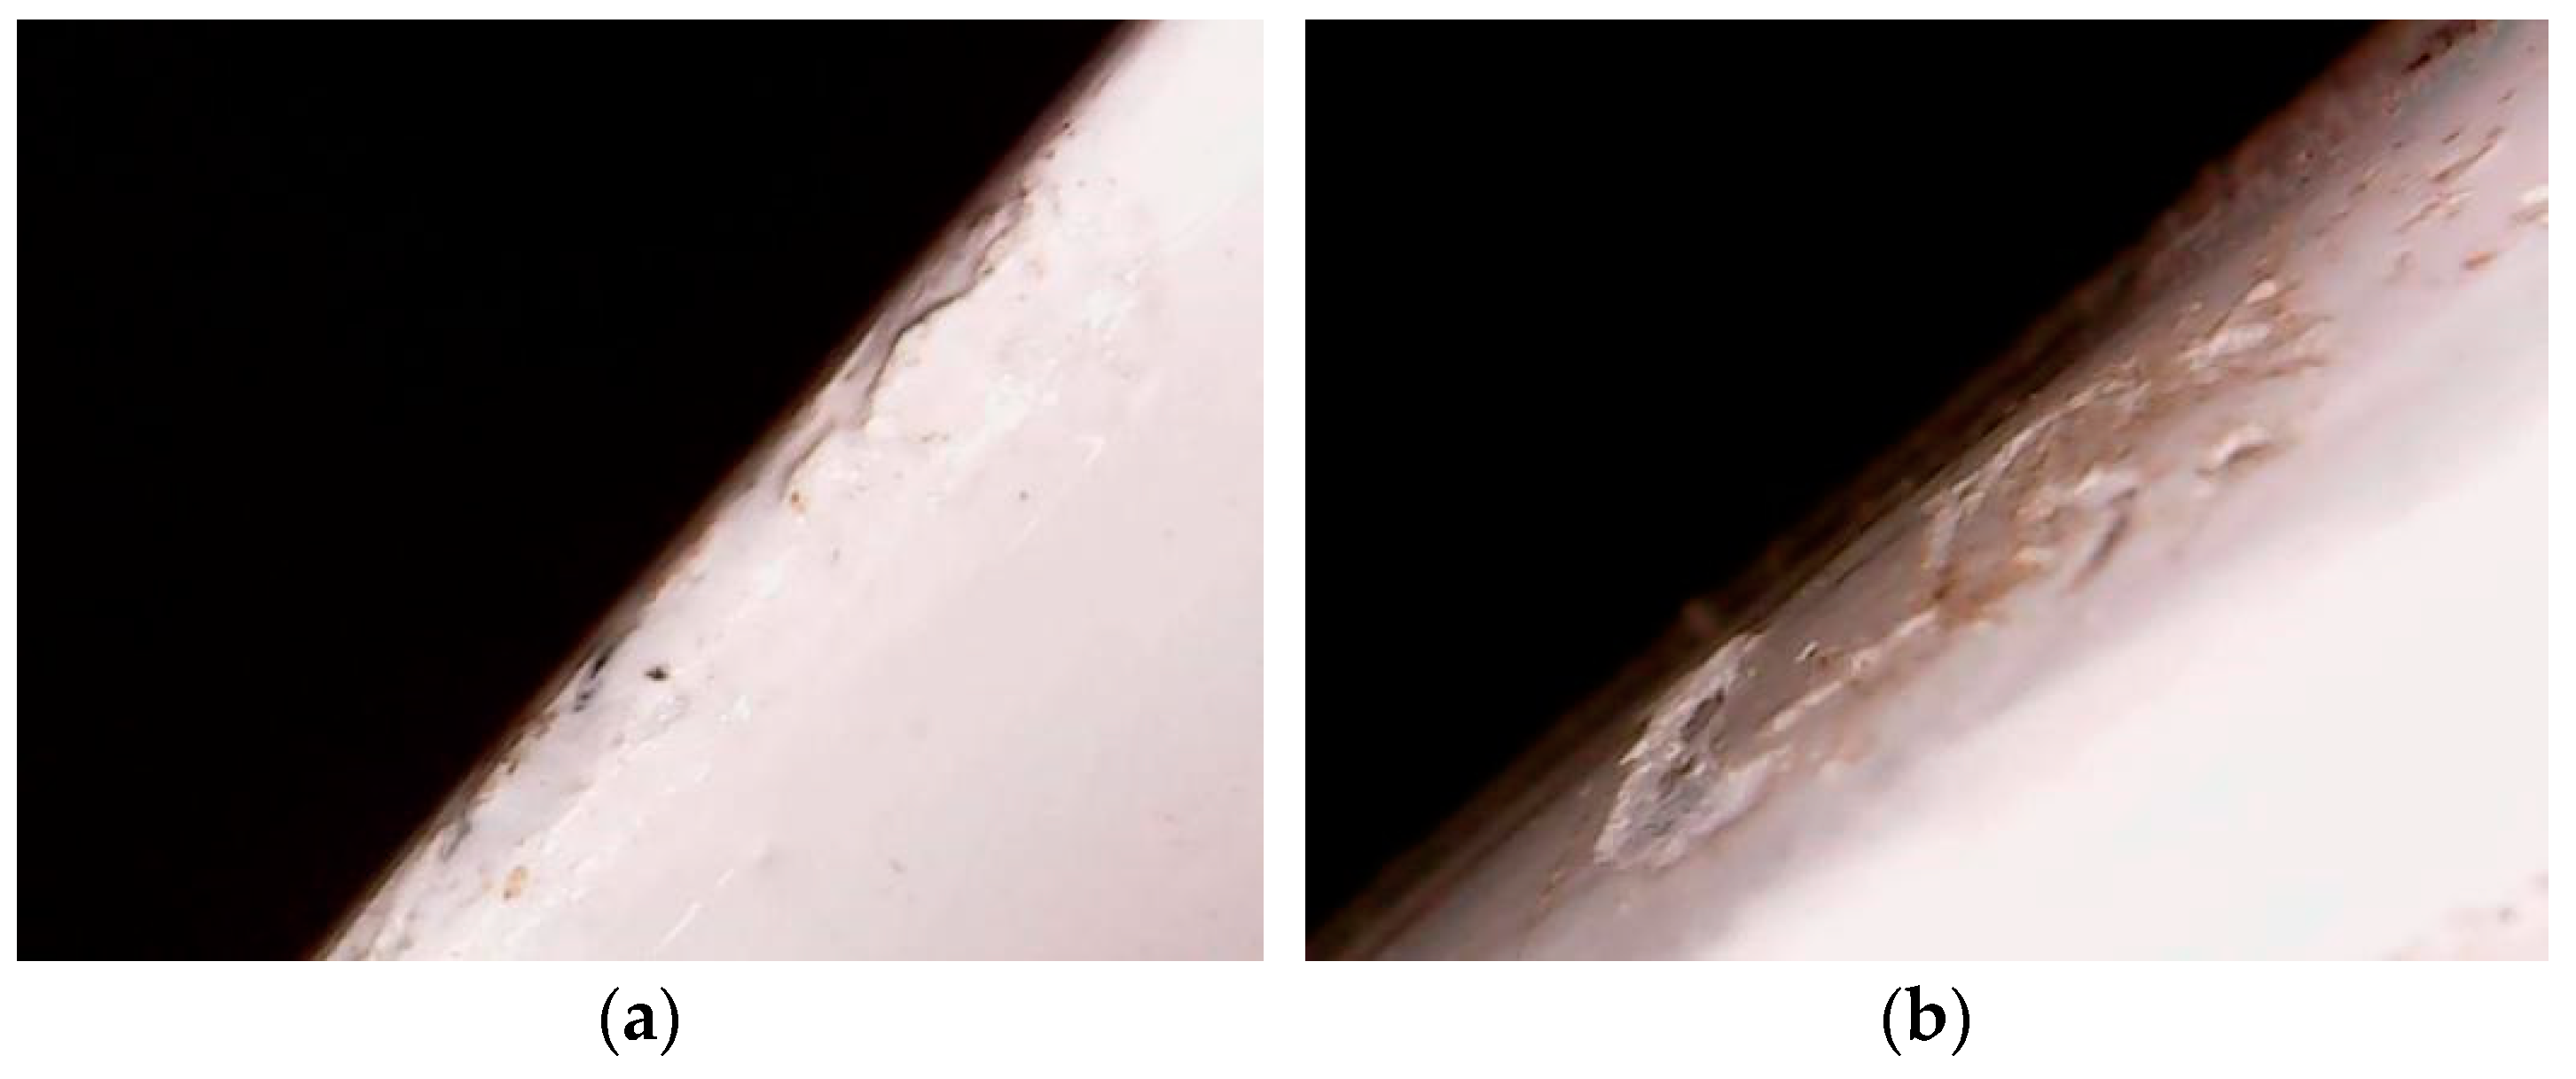
A digital microscope with a 100× magnification was employed to scrutinize the wear morphology of the blade coating after erosion. Figure 18, Figure 19 and Figure 20 depict the erosion morphology characteristics of the leading edge under conditions of a wind speed of 18 m/s, a sand mass flow rate of 1100 g/min, an erosion time of 30 min, and sand grain sizes of 0–1 mm and 1–2 mm.
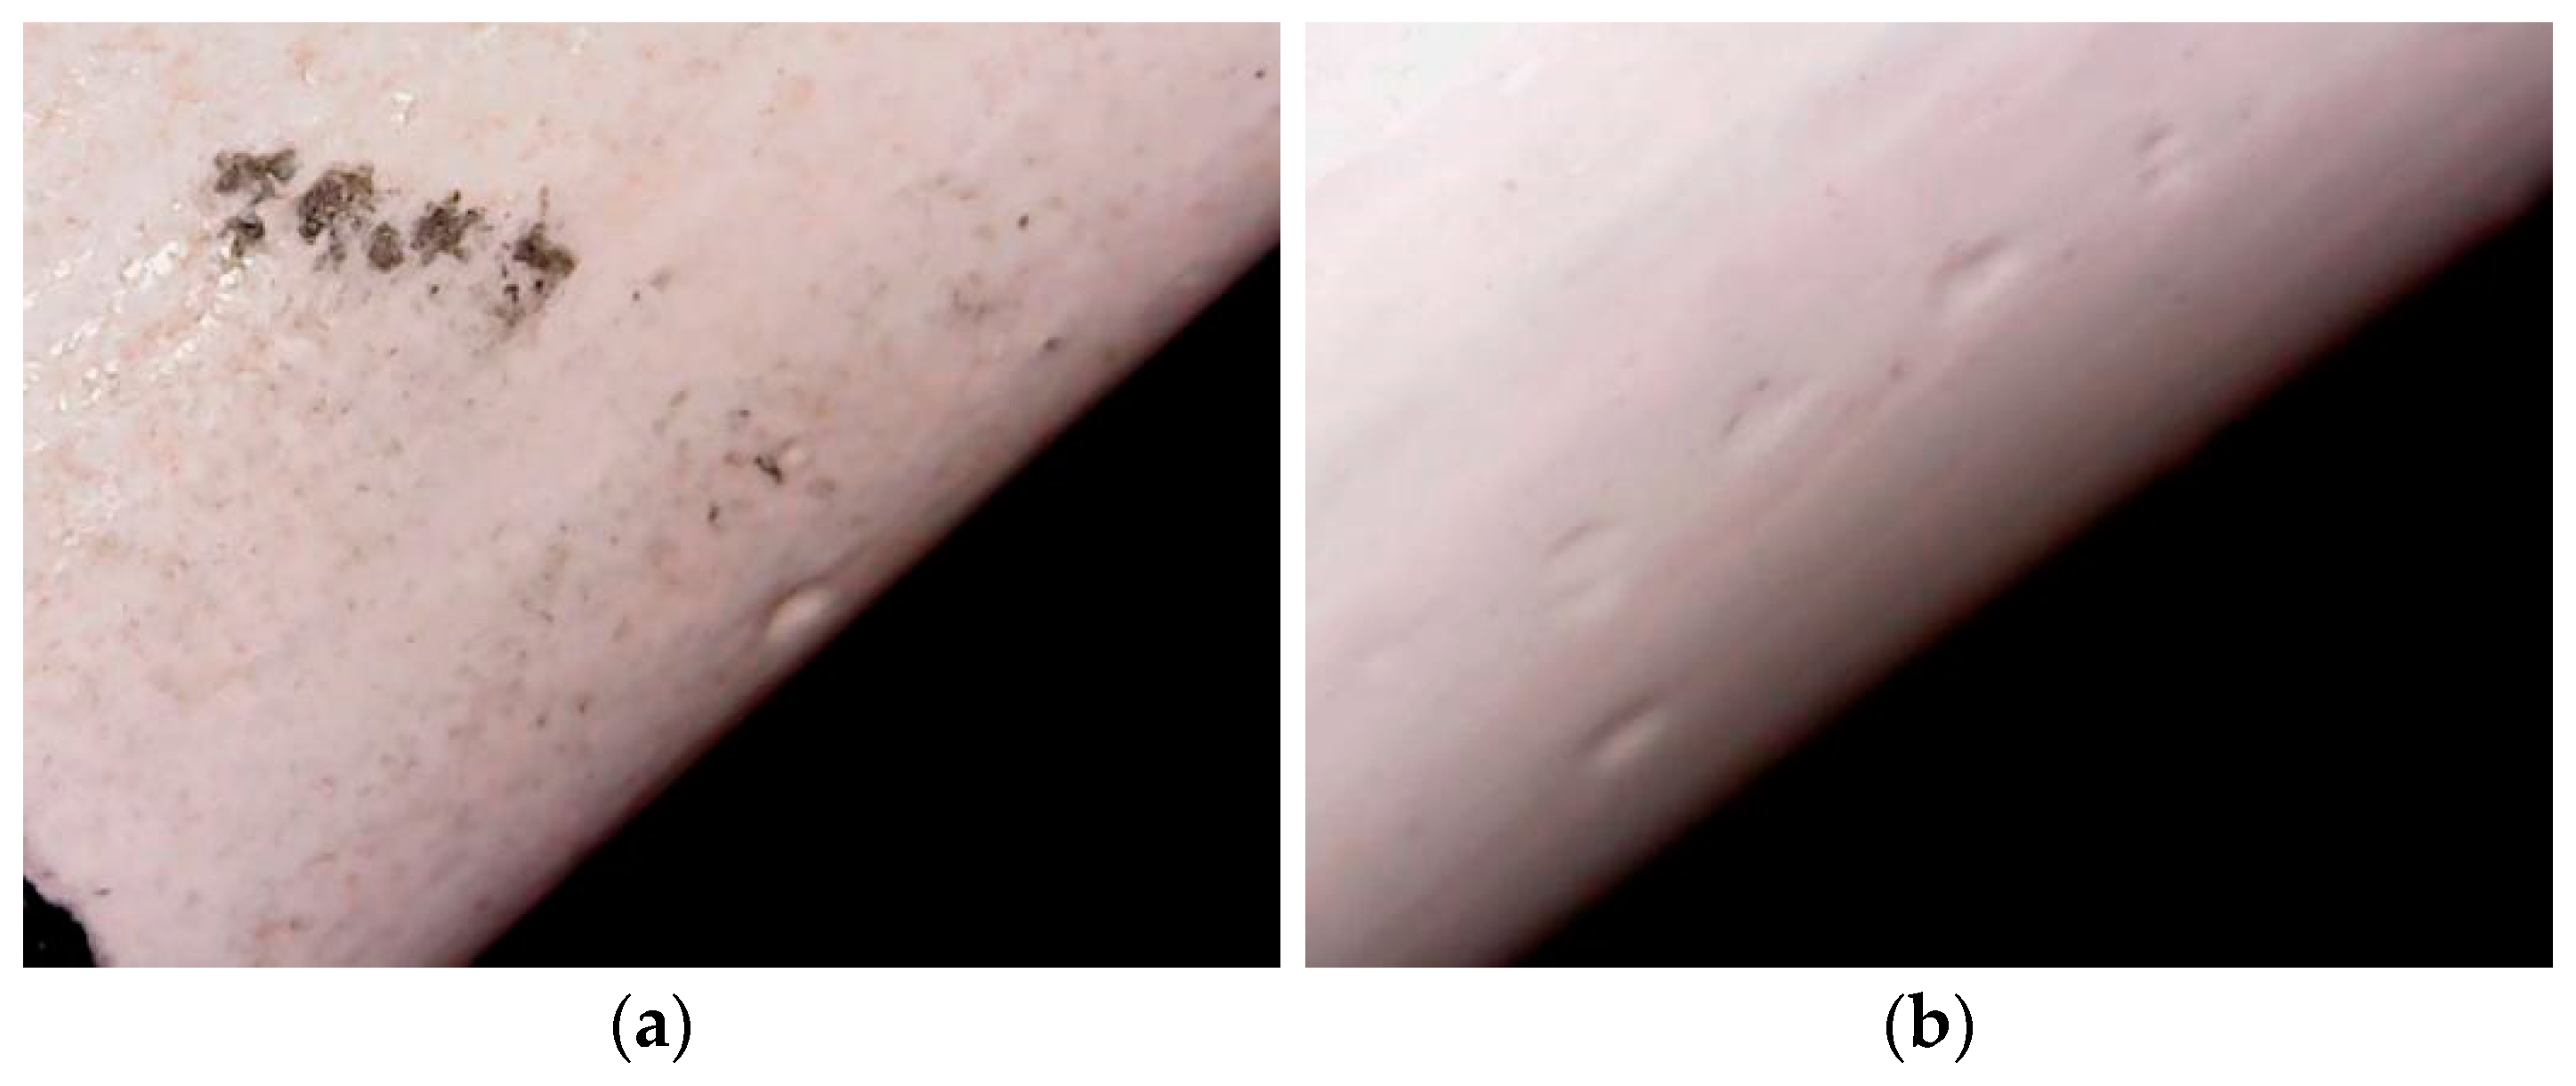
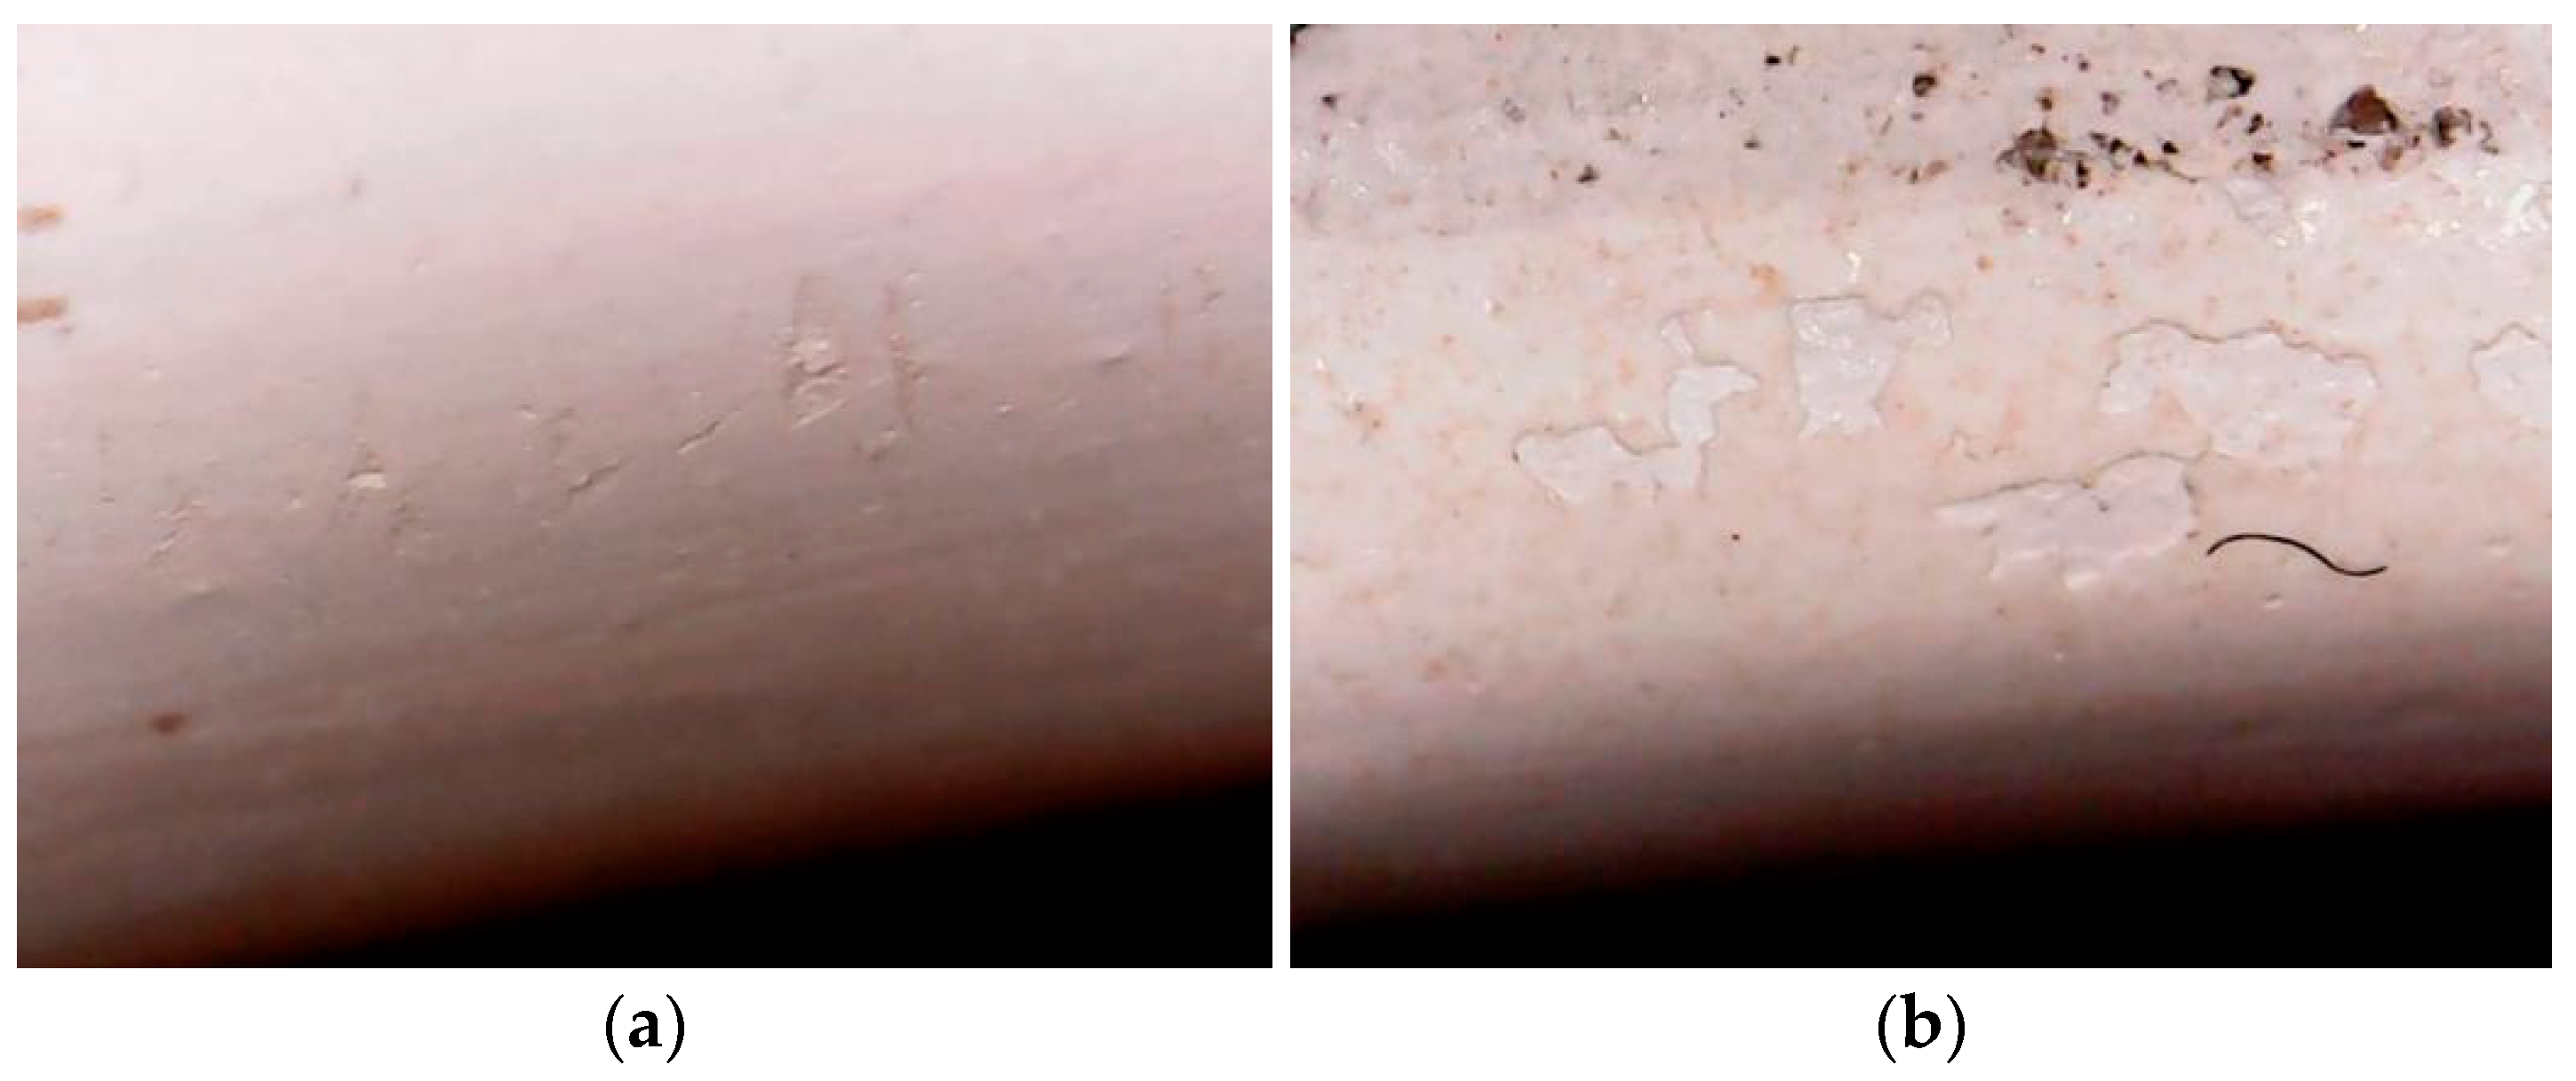
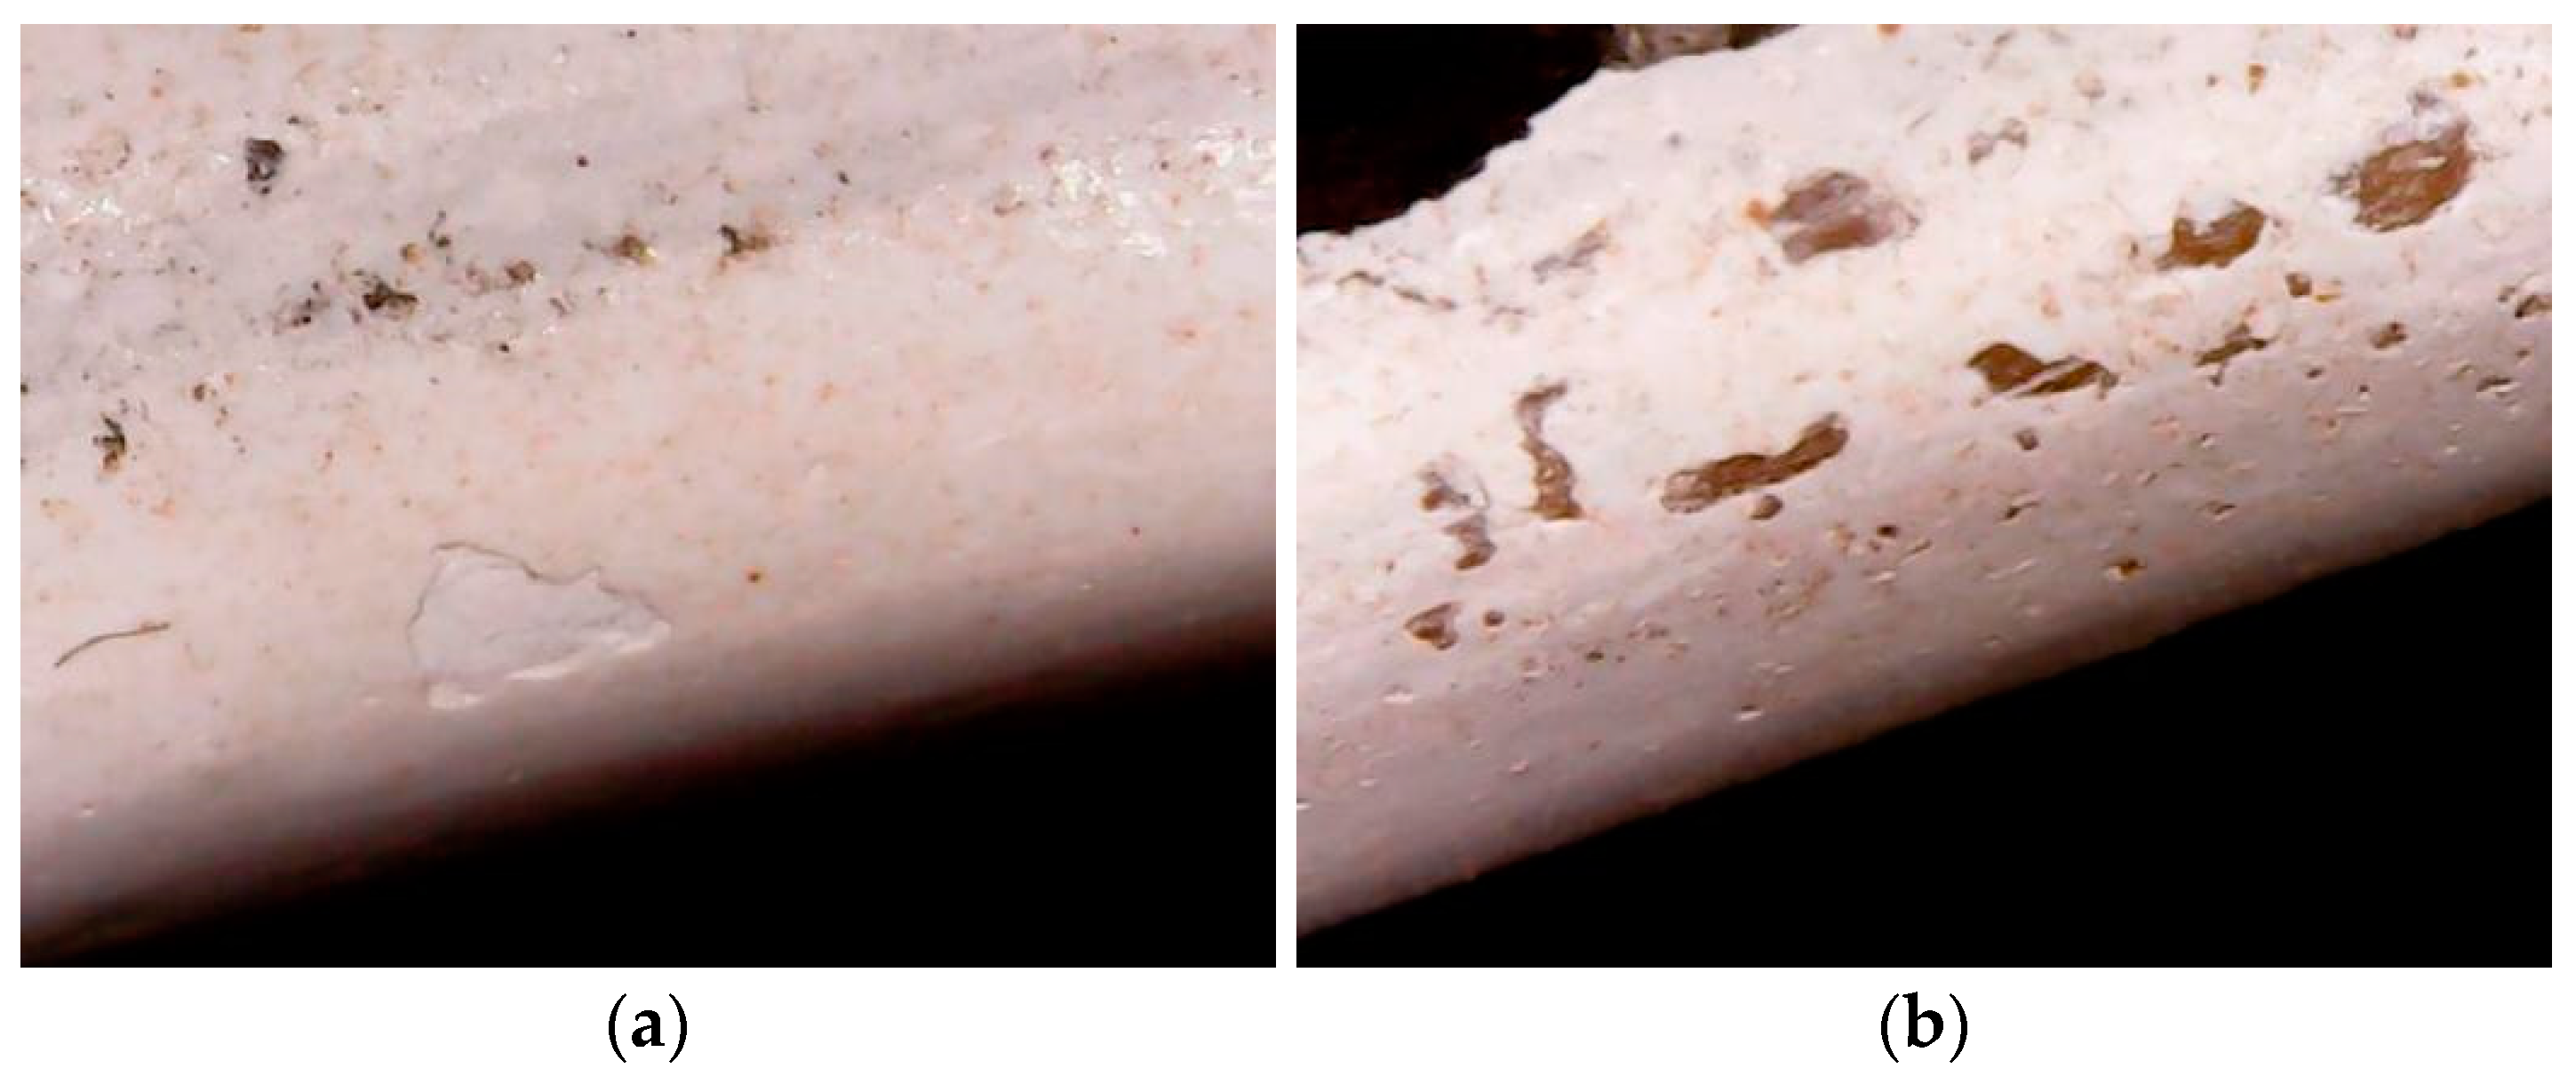
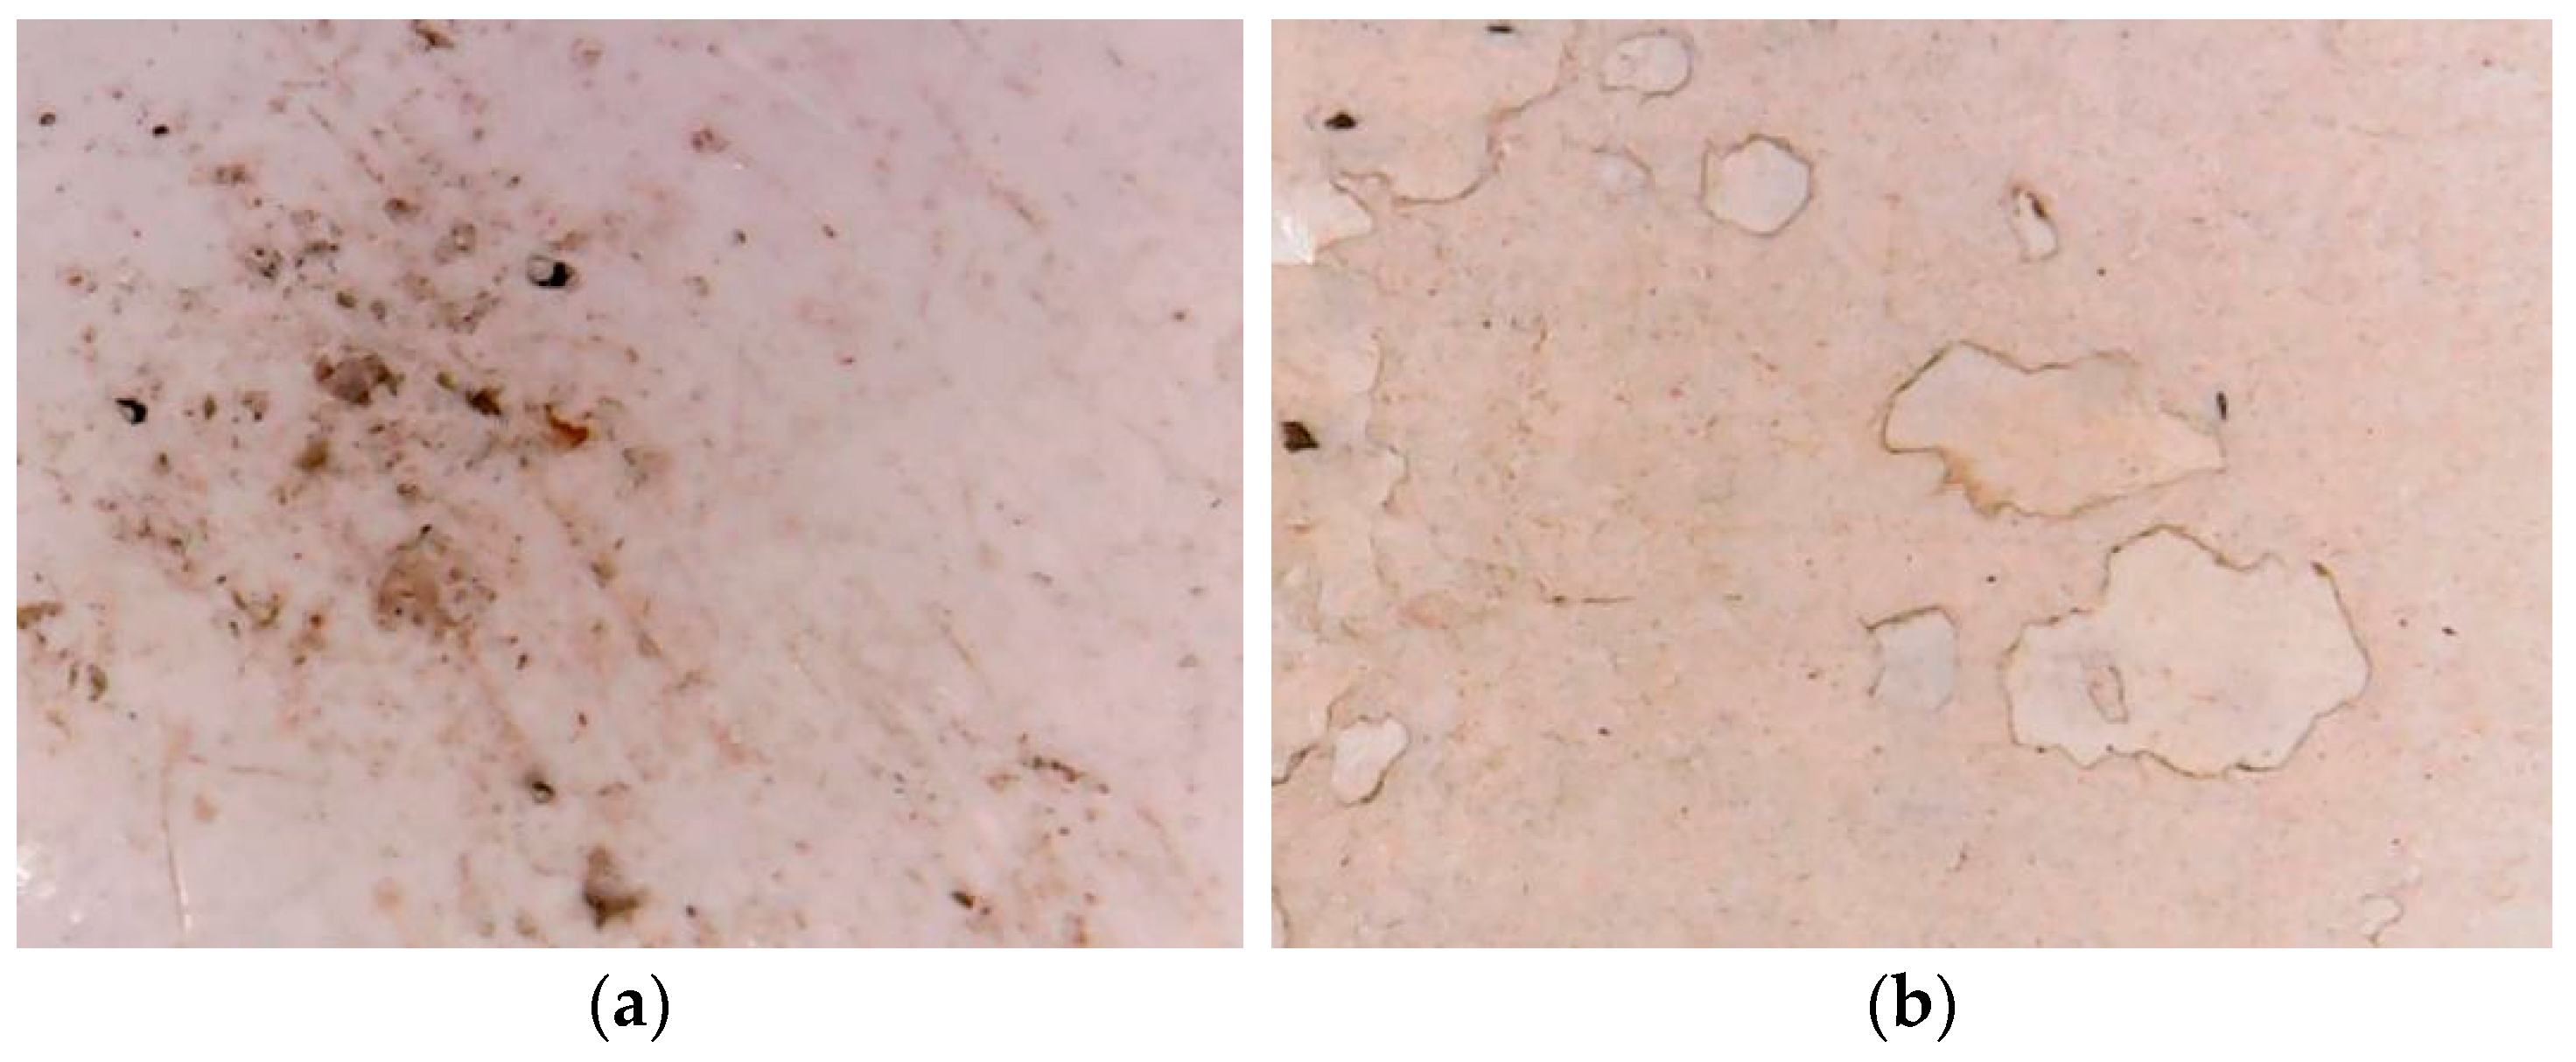
Figure 18 reveals that the erosion morphology of the coating on the blade root-0.3R section predominantly features pits. The larger the sand particles, the greater the number of pits, and the larger the area. The 0.3R–0.7R section predominantly displays gouge marks and coating spalling, as shown in Figure 19. Smaller sand particles result in chisel marks, while larger sand particles lead to coating spalling. Figure 20 shows the erosion morphology of the 0.7R-blade tip. Sand particles of 0–1 mm exhibit larger areas of coating flaking, while 1–2 mm sand particles create more gouge pits, which are deep and result in both the primer and topcoat flaking.
The erosion morphology on the leading edge indicates that the surface coating experiences progressively severe wear from the blade root to the tip. The erosion characteristics evolve from initial shallow pits to coating flaking and eventually to deeper gouge pits.
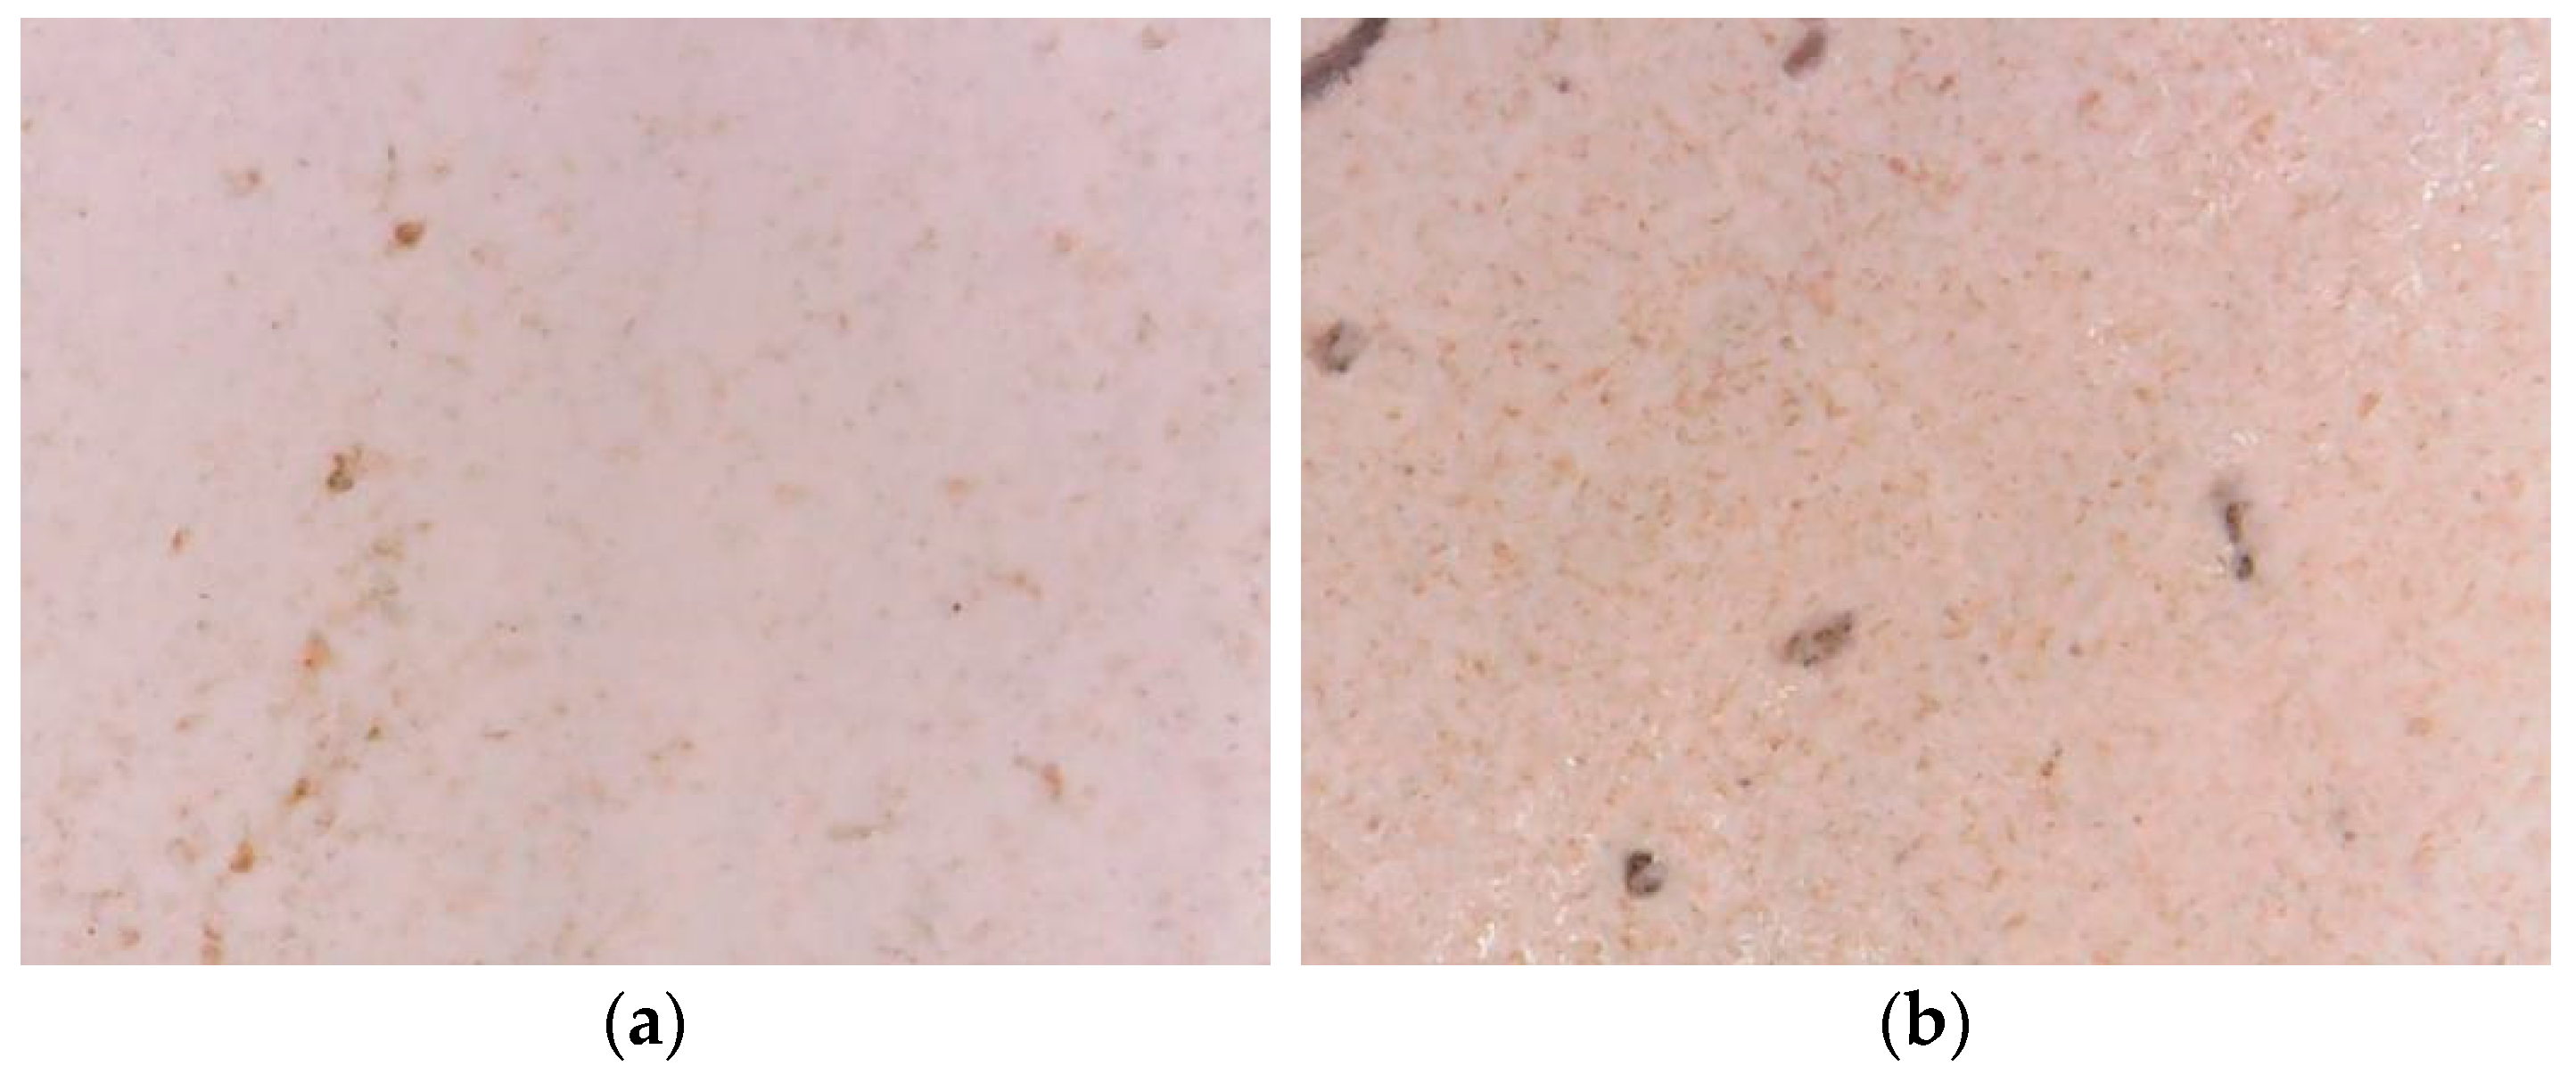
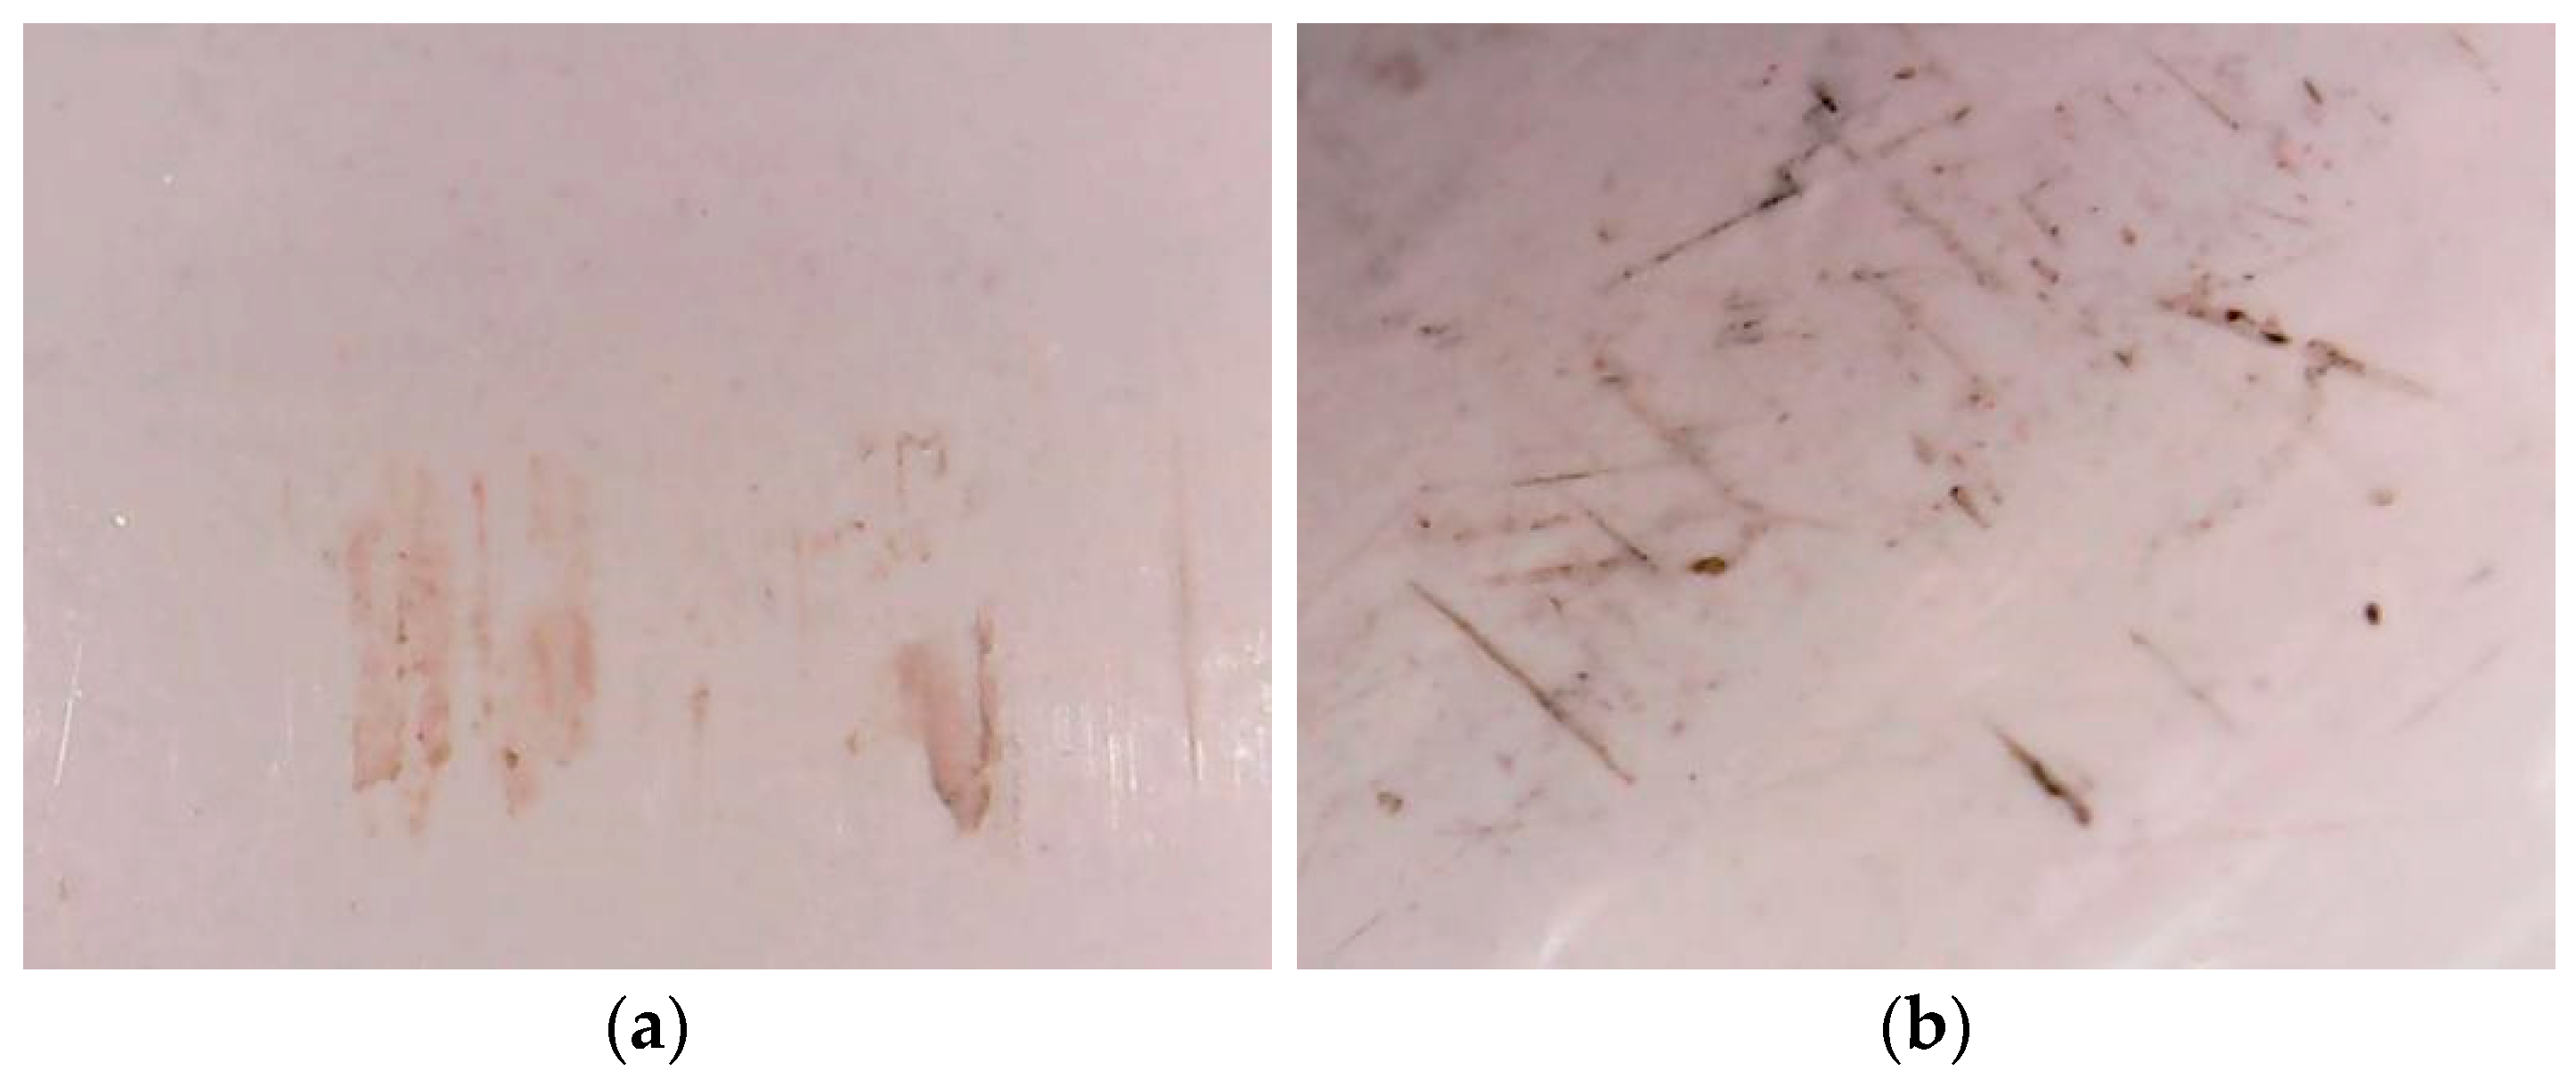
The erosion morphology characteristics of the windward side under the same erosion conditions are depicted in in Figure 21, Figure 22 and Figure 23. Figure 21 displays the erosion morphology of the blade root-0.3R section, primarily featuring tiny cutting pits. The wear characteristics generated by erosion from 1–2 mm sand particles are more severe than those from 0–1 mm particles. As shown in Figure 22, the 0.3R–0.7R section shows mostly cutting marks on the coating surface, with larger sand particles resulting in longer and more pronounced marks. Figure 23 exhibits the erosion morphology of the 0.7R-blade tip section, where 0–1 mm sand particles can create longer chiseling pits, while 1–2 mm sand particles cause the coating to peel off.
As the erosion angle of the windward side is less than 80° and the polyurethane coating material is highly ductile, the erosion morphology primarily arises from the cutting action of sand particles on the coating. Moreover, with the gradual increase of the erosion angle from the blade root to the tip, the cutting effect of sand particles weakens on the coating, while the chiseling effect becomes more prominent. This transition leads to a gradual shift in the wear morphology from cutting pits to coating peeling. In terms of the severity of wear from the root to the tip of the blade, there is good consistency between the numerical simulation results of the wear rate distribution on the windward side.
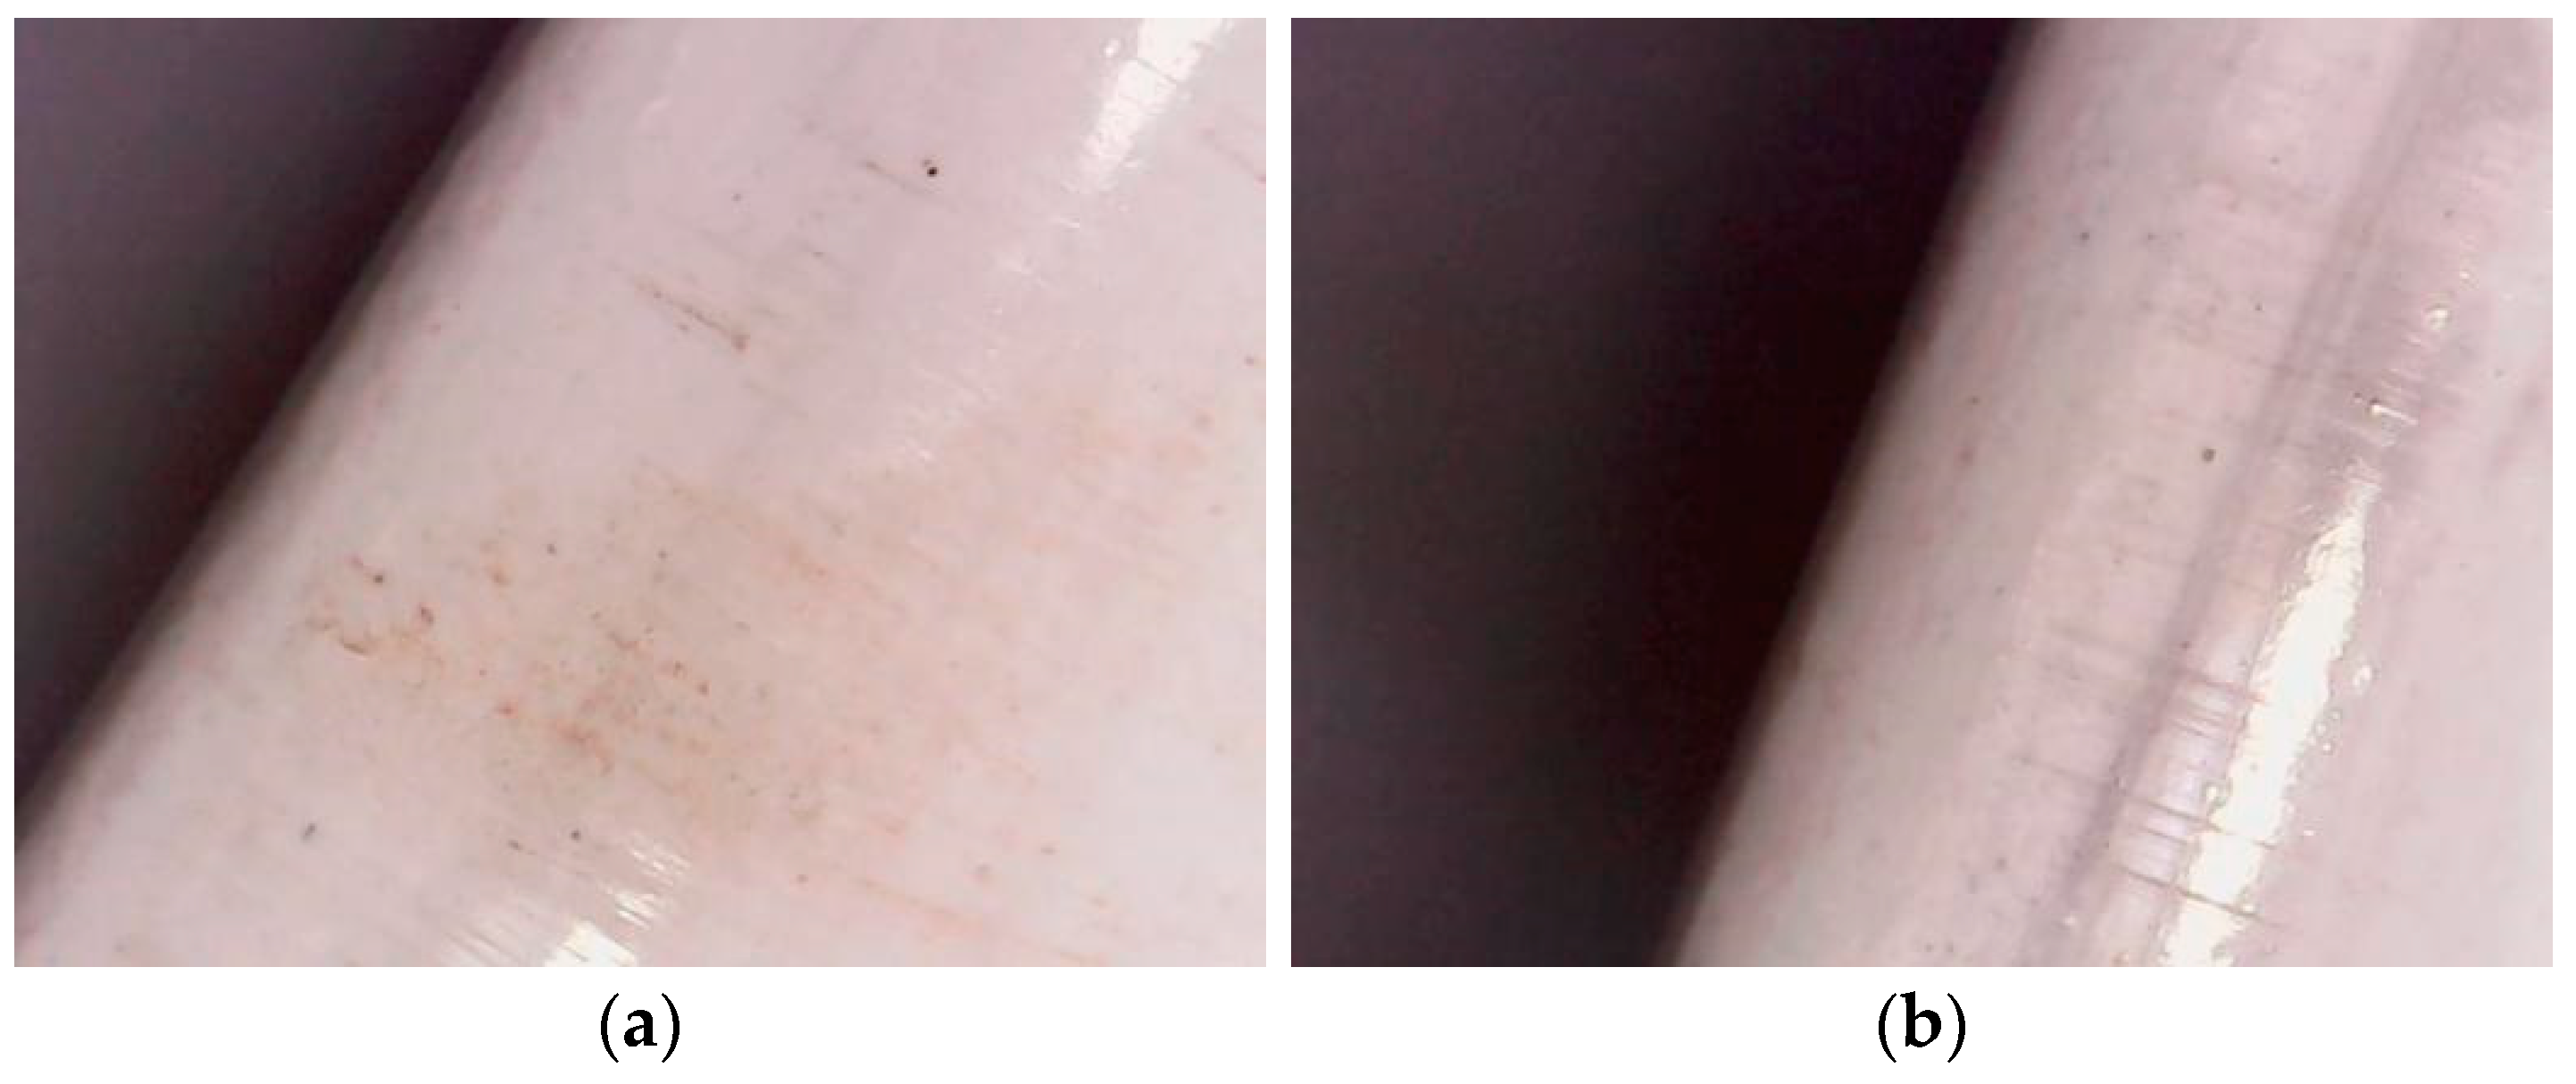
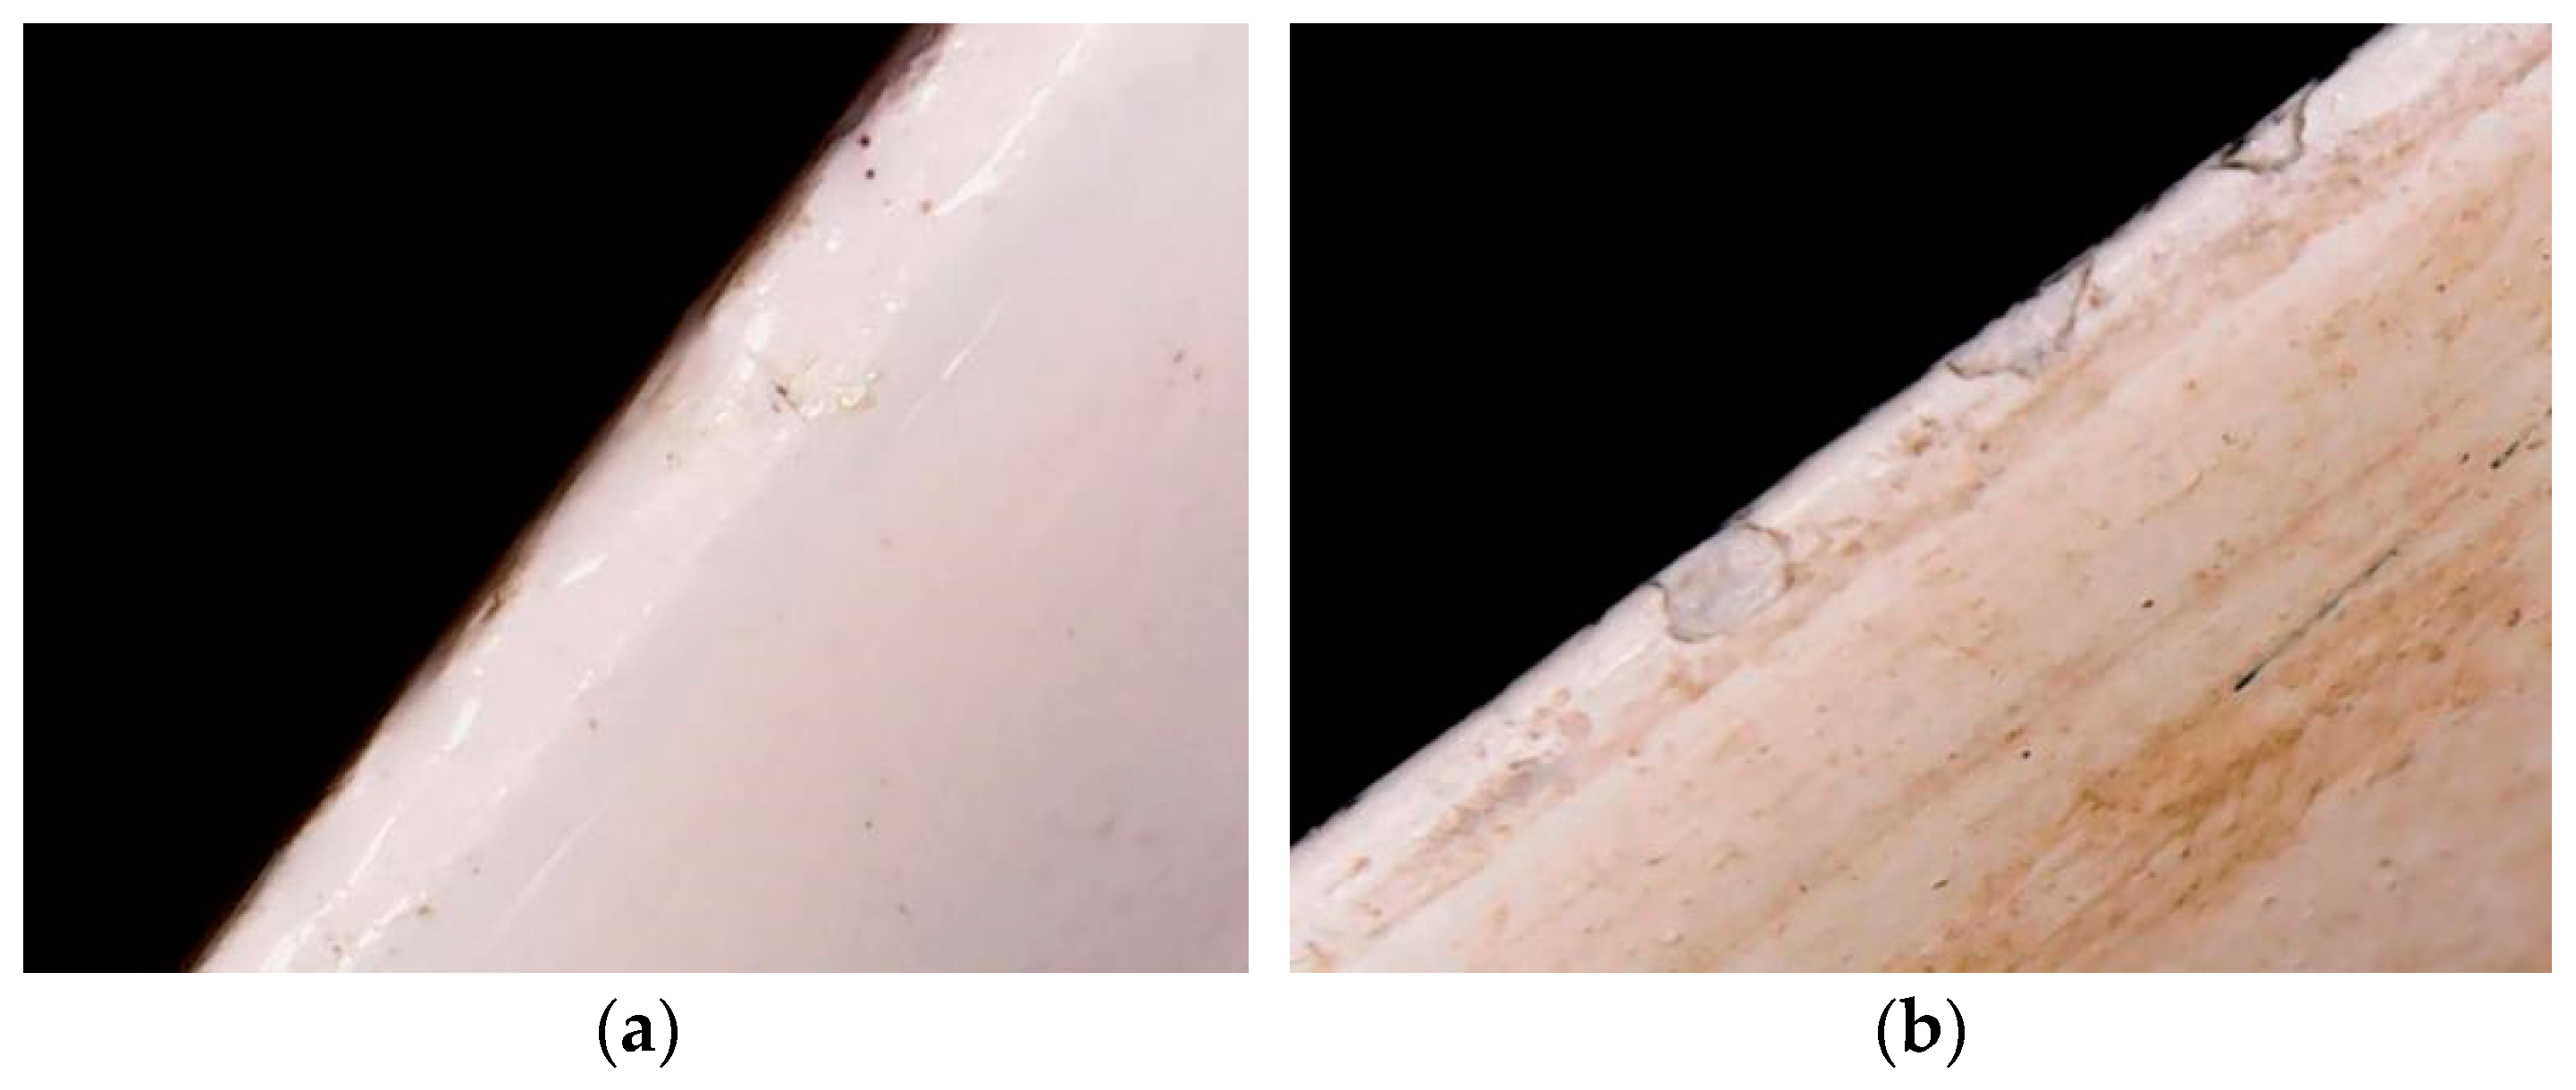
The erosion morphology characteristics of the trailing edge under the same erosion conditions are illustrated in Figure 24, Figure 25 and Figure 26. The coating on the blade root-0.3R section exhibits only minor scratches and virtually no wear, as seen in Figure 24. Figure 25 indicates that the predominant erosion morphology of the 0.3R–0.7R section is spalling pits, and the depth and area of these spalling pits increase with the larger sand particle sizes. Figure 26 displays the erosion morphology of the 0.7R-blade tip, where larger gouge pits are observed in the coating after erosion by 0–1 mm sand grains, while 1–2 mm sand grains result in more and deeper gouge pits. This is attributed to the formation of vortices at the blade tip when the wind–sand flow erodes the blade, resulting in a small amount of sand particles impacting the trailing edge with the airflow, which produces a crushing and chiseling effect, causing the formation of chiseling pits.
The erosion morphology described above was generated at a lower wind turbine speed. At lower speeds, the impact of the vortex between the blade tip and the root on sand particles diminishes. This results in a small amount of sand particles not being carried to the middle and tip of the blade but colliding directly with the coating at the blade root on the leading edge.
According to the erosion wear rate, wear morphology characteristics, and wear mechanism of the coatings on different parts of the blade, the wear area can be categorized into three regions: the chiseling region, cutting region, and stagnation region. The chiseling region comprises the entire leading edge, the windward side of the 0.7R-blade tip, and the trailing edge of the 0.7R-blade tip. The coating in this region is subjected to both 90° vertical impact and tangential chipping force. The cutting region includes the windward side of the 0.3R–0.7R section and the trailing edge of the 0.3R–0.7R section, where the coating is mainly exposed to the cutting action of the erosion angle less than 80°. The stagnation region encompasses the leeward side, the windward side of the blade root-0.3R section, and the trailing edge of the blade root-0.3R section. Sand particles rarely come into contact with the coating in this region, resulting in minimal wear.

4. Conclusions

The erosion process of a 1.5 MW horizontal axis wind turbine in a wind–sand environment was numerically simulated using the DPM model to analyze the trajectory and behavior of the sand particles. Additionally, an erosion experiment with a rotating wind rotor was conducted in a wind tunnel to investigate the macroscopic wear morphological characteristics of the blade coating. Several conclusions are summarized as follows.
Firstly, when sand particles enter the rotational domain with the airflow, they are simultaneously influenced by vortexes, incoming wind speed, and sand particle size, resulting in relatively complex motion trajectories. Small sand particles have better airflow following characteristics. With an increase in wind speed, the number of sand particles in contact with the turbine rotor does not increase significantly, but the impact force on the blade does increase due to the increased momentum of the sand particles. The sand particles do not change the motion state and continue to move in an approximate helical trajectory with the airflow after impacting the blades. Conversely, larger sand particles, will not only increase the quantity of particles in contact with the wind rotor but also intensify the impact on the coating surface as wind speed increases. However, larger sand particles exhibit poor aerodynamic mobility and swiftly rebound away after hitting the blade. As the wind speed increases, the wear rate initially increases and then decreases, yet the spatial distribution of wear locations remains relatively consistent, showing good agreement with published studies [10,12,13,14].
Secondly, in the wind tunnel experiments, the highest number of erosion pits were observed on the leading edge, followed by the windward side and trailing edge, and the fewest on the leeward side. Based on the statistics of erosion pits on the blade along the spanwise direction, the greatest number of pits were observed in the position of 0.7R-blade tip section, where the erosion pits were more dense compared with the blade root and blade middle, followed by the 0.5R–0.7R and 0.3R–0.5R sections; the blade root-0.3R section presented the fewest pits.
Thirdly, through observation of the blade coating wear morphology, a gradual increase in wear on the leading edge surface coating from the blade root to the tip was noticed. The erosion morphology ranged from initial shallow pits to coating flaking and then to deeper gouge pits. The wear characteristics on the windward side transitioned from tiny cutting pits in the blade root-0.3R section, to cutting marks in the 0.3R–0.7R section, and further to gouge pits and coating flaking in the 0.7R-blade tip section. The erosion morphology of the trailing edge coating surface evolved from minor scratches in the blade root-0.3R section to flaking pits in the 0.3R–0.7R section, with the flaking pits further deepening and enlarging in the 0.7R-blade tip.
To enhance the wind–sand erosion resistance of wind turbine blade coatings, it is recommended to apply a zonal coating strategy. In the chiseling wear region, materials with higher impact toughness and hardness are advised. A cellulose-reinforced polyurethane coating is considered a good choice and believed to be the most effective coating in resisting solid particle erosion [28]. For the cutting wear region, materials with high impact toughness are recommended. The alternating copolymer coating material of trifluoroethylene and alkyl vinyl ether exhibits good toughness and can be applied in this area to enhance protective effects [29]. In the stagnant wear region, it is advisable to use coatings with a general wear resistance and better weather durability. A polyurethane coating material is sufficient.
This study did not take into account the effects of erosion angle, sand particle mass flow rate, or wind rotor speed on the erosion of wind turbine blade coatings. These factors, considered as crucial parameters in controlling erosion, will be a primary focus in future research.

Author Contributions

Conceptual model and numerical simulation, J.W. and J.G.; methodology, J.W. and Y.Z.; validation, J.W. and J.G.; formal analysis, J.W., Y.Z. and H.C.; visualization, J.G.; writing—original draft preparation, J.W.; writing—review and editing, Y.Z. and H.C.; project administration, Y.Z.; funding acquisition, J.W. and Y.Z. All authors have read and agreed to the published version of the manuscript.

Funding

This work was supported by Natural Science Foundation of Inner Mongolia Autonomous Region of china (Grant No. 2023ZD12, 2023MS05043), and by Research Program of science and technology at Universities of Inner Mongolia Autonomous Region (Grant No. NJZZ23031).

Data Availability Statement

Data are contained within the article.

Conflicts of Interest

The authors declare no conflicts of interest.

References

  1. Cai, H.; Peng, Z.Y.; Wu, C.; Qi, W.C.; Xie, Z.J.; Xu, Z. Study on reactive control of flexible DC method reactive power in offshore wind farms. Power Capacit. React. Power Compens. 2019, 40, 153–157. [Google Scholar]
  2. Solar Photovoltaic Network of Beijixing. Available online: https://guangfu.bjx.com.cn/news/20230222/1290425.shtml (accessed on 20 June 2023).
  3. Yuan, G.B. Characteristics and cause of sandstorm in Inner Mongolia in 2001–2015. J. Desert Res. 2017, 37, 1204–1209. [Google Scholar]
  4. Zhang, Y.; Huang, C.; Liu, Z.; Liu, C.X.; Yang, L.J.; Gao, X. Research on properties of wind turbine blade coating under the wind-carrying action. Mater. Rev. 2016, 30, 95–99. [Google Scholar]
  5. Yang, X.Y.; Zhang, Y.F.; Lv, W.; Wang, D. Image recognition of wind turbine blade damage based on a deep learning model with transfer learning and an ensemble learning classifier. Renew. Energy 2021, 163, 386–397. [Google Scholar] [CrossRef]
  6. Matthias, S.; Hamid, R.; Bernhard, S.; Kim, T. The influence of eroded blades on wind turbine performance using numerical simulations. Energies 2017, 10, 1420. [Google Scholar]
  7. Malecha, Z.; Sierpowski, K. Numerical studies of the impact of erosion and dirt of turbine blades on the operation of wind turbine. Instal 2023, 7–8, 7–13. [Google Scholar]
  8. Kang, S.Y.; Li, X.M. Numerical simulation study on erosion wear of wind turbine blade materials. Renew. Energy Resour. 2015, 33, 656–661. [Google Scholar]
  9. Cen, H.T.; Tian, W.L.; Li, P.W.; Wei, R.T.; Na, R.S. Simulation analysis on polyurethane coating of wind turbine. J. Shanghai Jiaotong Univ. (Sci.) 2019, 24, 496–499. [Google Scholar] [CrossRef]
  10. Zhen, Q.; Chen, S.L.; Wan, D.Q.; Yan, C.X.; Sun, K.; Li, D.L. Numerical research on erosion and wear of wind turbine blades in sand-carrying wind. Acta Energiae Solaris Sin. 2022, 43, 257–263. [Google Scholar]
  11. Gao, J.; Zhang, Y.; Wang, J.; Su, L.D.; Wu, G.J.; Qi, G.Q. Study on coatings erosion of blades under sand-carrying wind. Acta Energiae Solaris Sin. 2020, 41, 367–371. [Google Scholar]
  12. Li, D.S.; Wang, C.Z.; Li, Y.R.; Li, R.N.; Ma, R.J. Numerical simulation of wind turbine blade erosion in sandy environment. Acta Energiae Solaris Sin. 2018, 39, 627–632. [Google Scholar]
  13. Zhou, R.Y.; Duan, H.B.; Ye, H.; Wang, T.; Zhou, H.X.; Yao, Y.; Liang, X.Y. Experimental and Numerical Study of Erosion Wear of Fan Blades in Microgrid. J. Phys. 2021, 2005, 012039. [Google Scholar] [CrossRef]
  14. Dai, L.P.; Yao, S.G.; Wang, X.D.; Kang, S. Numerical investigation of wind turbine blades erosion characteristics impacted by air flow containing sand particles. Acta Energiae Solaris Sin. 2018, 39, 247–252. [Google Scholar]
  15. Li, D.S.; Liang, E.P.; Li, Y.R.; Zhao, Y.; Xu, M.F.; Yu, M.Y. Wind tunnel experimental study on erosion and wear characteristics fo wind turbine blade coating. Acta Energiae Solaris Sin. 2022, 43, 196–203. [Google Scholar]
  16. Wang, J.; Du, G.Z.; Zhang, Y.; Wu, Z.; Gao, J.; Su, L.D. Research on sand erosion wear of wind turbine blade coating in operation state. Mater. Rep. 2021, 35, 04177–04180. [Google Scholar]
  17. Alajmi, A.; Ramulu, M. Investigation of the leading-edge erosion of wind turbine blades using multivariant analysis method. In Proceedings of the ASME 2022 International Mechanical Engineering Congress and Exposition, Columbus, OH, USA, 30 October–3 November 2022. [Google Scholar] [CrossRef]
  18. Hassanian, R.; Riede, M. Leading-edge erosion and floating particles: Stagnation point simulation in particle-laden turbulent flow via Lagrangian particle tracking. Machines 2023, 11, 556. [Google Scholar] [CrossRef]
  19. Li, Y.H.; Zhang, Y.; Yuan, B. Current situation and construction measures of ecological environment in Alashan League. Mod. Agric. Sci. Technol. 2021, 4, 185–187. [Google Scholar]
  20. Wan, W.; Yan, C.Z. Research progress of eco-environmental degradation in Alashan Plateau. J. Earth Environ. 2018, 9, 109–122. [Google Scholar]
  21. GB-T-20480:2017; Classification of sand and dust weather. Standards press of China: Beijing, China, 2017.
  22. Jiang, M.Y.; Zhao, L.N.; Lu, J.J.; Wang, C. Research and application of quantitative classification method of sand and dust weather. Clim. Environ. Res. 2007, 12, 350–357. [Google Scholar]
  23. Duan, G.L. Experimental Research on Erosion Wear of Steel-Structure Coating in Sandstorm; Inner Mongolia Agricultural University Press: Hohhot, China, 2014. [Google Scholar]
  24. Li, M.; Tian, D.; Wang, H.K.; Han, Q.L.; Ma, G.X. Load test experiment of variable pitch wind turbine rotor blade model. Acta Energiae Solaris Sin. 2013, 34, 1574–1578. [Google Scholar]
  25. Li, D.S.; Wang, C.Z.; Li, Y.R.; Li, R.N.; Ma, R.J. Aerodynamic characteristics analysis of wind turbine based on similarity theory. Acta Energiae Solaris Sin. 2015, 36, 2917–2921. [Google Scholar]
  26. Song, T.; Chen, Z.; Ma, Q.; Si, Z.M.; Liu, H.Y.; Xuan, C.Z. Design and performance experiment of shunt-hedging sand sampler. Trans. Chin. Soc. Agric. Mach. 2015, 46, 173–177. [Google Scholar]
  27. Sareen, A.; Sapre, C.A.; Selig, M.S. Effects of leading edge erosion on wind turbine blade performance. Wind Energy 2014, 17, 1531–1542. [Google Scholar] [CrossRef]
  28. Pathak, S.; Kumar, V.; Bonu, V.; Mishnaevsky, L.; Lakshmi, R.; Bera, P.; Barshilia, H. Development of cellulose-reinforced polyurethane coatings: A novel eco-friendly approach for wind turbine blade protection. Energies 2023, 16, 1730. [Google Scholar] [CrossRef]
  29. Zheng, J.; Zhang, Q.H.; Luo, Z.H.; Zeng, W.R.; Zhan, X.L.; Chen, F.Q. Progress on the protective coating layer materials of wind turbine blades. Polym. Mater. Sci. Eng. 2012, 28, 182–186. [Google Scholar]
Figure 1. Erosion characteristics of blade coating: (a) Sand holes; (b) Cracks; (c) Coating peeling.
Energies 17 00413 g001
Figure 2. Wind speed statistics of a wind farm in Alashan from February to May: (a) Phase I; (b) Phase II.
Energies 17 00413 g002
Figure 3. Sand shape amplified 100 times by digital microscope: (a) 0–1 mm; (b) 1–2 mm.
Energies 17 00413 g003
Figure 4. The wind rotor model and computational domain.
Energies 17 00413 g004
Figure 5. Grid division of computational domain.
Energies 17 00413 g005
Figure 6. The trajectory of sand particles at a wind speed of 12 m/s: (a) 0.5 mm; (b) 2 mm.
Energies 17 00413 g006
Figure 7. The trajectory of sand particles at a wind speed of 15 m/s: (a) 0.5 mm; (b) 2 mm.
Energies 17 00413 g007
Figure 8. The trajectory of sand particles at a wind speed of 18 m/s: (a) 0.5 mm; (b) 2 mm.
Energies 17 00413 g008
Figure 9. The trajectory of sand particles after impacting the blade: (a) 0.5 mm; (b) 2 mm.
Energies 17 00413 g009
Figure 10. Distribution of blade erosion wear rate: (a) 12 m/s; (b) 15 m/s; (c) 18 m/s.
Energies 17 00413 g010
Figure 11. The miniature model of 1.5 MW horizontal axis wind turbine: (a) Blade; (b) Wind rotor.
Energies 17 00413 g011
Figure 12. 0FDY-1.2 wind tunnel.
Energies 17 00413 g012
Figure 13. Acquisition of erosion morphology: (a) Digital microscope; (b) Acquisition process.
Energies 17 00413 g013
Figure 14. Schematic diagram of the 0FDY-1.2 wind tunnel. 1 Fan section; 2 Rectification section; 3 Diffusion section; 4 Contraction section; 5 Sand conveyor; 6 Experimental section; 7 Porous plate; 8 Honeycomb; 9 Damping grids; 10 Parallel bar grid.
Energies 17 00413 g014
Figure 15. Wind–sand erosion test on wind turbine blades: (a) Sand conveyor; (b) Rotating wind rotor.
Energies 17 00413 g015
Figure 16. The number of erosion pits on the leading edge, windward side, trailing edge, and leeward side under the different sand particle sizes: (a) 0–1 mm; (b) 1–2 mm.
Energies 17 00413 g016
Figure 17. The number of erosion pits on the blade along the spanwise direction under different sand particle sizes: (a) 0–1 mm; (b) 1–2 mm.
Energies 17 00413 g017
Figure 18. Erosion topography on leading edge of the blade root-0.3R: (a) Particle size of 0–1 mm; (b) Particle size of 1–2 mm.
Energies 17 00413 g018
Figure 19. Erosion topography on leading edge of the blade 0.3R–0.7R: (a) Particle size of 0–1 mm; (b) Particle size of 1–2 mm.
Energies 17 00413 g019
Figure 20. Erosion topography on leading edge of the 0.7R-blade tip: (a) Particle size of 0–1 mm; (b) Particle size of 1–2 mm.
Energies 17 00413 g020
Figure 21. Erosion topography on windward side of the blade root-0.3R: (a) Particle size of 0–1 mm; (b) Particle size of 1–2 mm.
Energies 17 00413 g021
Figure 22. Erosion topography on windward side of the blade 0.3R–0.7R: (a) Particle size of 0–1 mm; (b) Particle size of 1–2 mm.
Energies 17 00413 g022
Figure 23. Erosion topography on windward side of the 0.7R-blade tip: (a) Particle size of 0–1 mm; (b) Particle size of 1–2 mm.
Energies 17 00413 g023
Figure 24. Erosion topography on trailing edge of the blade root-0.3R: (a) Particle size of 0–1 mm; (b) Particle size of 1–2 mm.
Energies 17 00413 g024
Figure 25. Erosion topography on trailing edge of the blade 0.3R–0.7R: (a) Particle size of 0–1 mm; (b) Particle size of 1–2 mm.
Energies 17 00413 g025
Figure 26. Erosion topography on trailing edge of the 0.7R-blade tip: (a) Particle size of 0–1 mm; (b) Particle size of 1–2 mm.
Energies 17 00413 g026
Table 1. The main parameters of the 0FDY-1.2 wind tunnel.
Wind SpeedWidth × Height × Length
(Experimental Section)
Cross-Sectional TurbulenceAirflow Velocity UniformityAirflow Stability
0–18 m/s1 m × 1.2 m × 7.2 m≤1%<1%≤3%
Table 2. Sizes of different erosion characteristics.
Erosion CharacteristicsDiameter/Depth (mm)
Sand Hole0.51
Small Pit2.54
Coating Peeling3.81
Disclaimer/Publisher’s Note: The statements, opinions and data contained in all publications are solely those of the individual author(s) and contributor(s) and not of MDPI and/or the editor(s). MDPI and/or the editor(s) disclaim responsibility for any injury to people or property resulting from any ideas, methods, instructions or products referred to in the content.