Article

Energy Efficiency in Petroleum Supply Chain Optimization: Push Segment Coordination

1
Faculty of Logistics, Molde University College—Specialized University in Logistics, 6410 Molde, Norway
2
Faculty of Humanities, National University of Oil and Gas «Gubkin University», Moscow 119991, Russia
*
Author to whom correspondence should be addressed.
Energies 2024, 17(2), 388; https://doi.org/10.3390/en17020388
Submission received: 15 December 2023 / Revised: 6 January 2024 / Accepted: 11 January 2024 / Published: 12 January 2024

Abstract

:
Today, the world is transitioning from traditional energy to clean, renewable sources. The petroleum sector is to play a role in this transition by supporting material and energy needs related to developing new energy systems. It is, therefore, vital that in upcoming years, the petroleum sector runs in a smart and efficient way, which can be achieved by coordination and the meaningful integration of decision-making issues in petroleum supply chains (PSCs). The existing literature on PSC optimization reveals a research gap; specifically, there is an insufficient level of technological detail considered while planning capacities of new infrastructures and its impact on the efficiency of further operations, specifically in the push segment of the PSC. This paper proposes a mixed-integer nonlinear programming model for planning capacities and coordinating activities within the mentioned PSC segment. The infrastructure capacity planning model covers technological details such as hydraulics and pump systems’ operational efficiency. The results reveal that the proposed model and its technological decision-making criterion of minimizing energy consumption drive infrastructural choices and operational modes to achieve machinery performance close to the best efficiency point. Also, the computational results demonstrate how traditional (minimum-cost) approaches lead to inefficient energy use while producing and transporting hydrocarbons. The proposed framework aims to facilitate the preliminary design stage of projects undertaken by engineering contractors in the energy sector.

1. Introduction

The petroleum sector is significant in many ways and involves substantial economic activity [1]. This industry is considered one of the largest worldwide in terms of production capacity and technological complexity [2], which is why this sector is known to have contributed considerably to the development of modern-day solutions such as Industry 4.0, intelligent automation, smart manufacturing, and others [3]. Despite environmental concerns about petroleum being a fossil fuel (which is gradually being dealt with [4]), as well as the volatility of oil prices, it is reported in [5] that the consumption of this resource has been steadily increasing over the past few decades across all sectors. This growth is attributed to the growing global population, urbanization, and global economic growth, which are tied to energy-intensive activities such as construction, manufacturing, transportation, etc., and finally, to the fact that viable alternatives for both primary and secondary energy resources are still yet to be developed to an appropriately large scale [6].
Modern-day society, political forces, and academia are united in their support for transitioning from traditional fossil fuel energy to clean renewable energy sources. While this transition is taking place, the oil and gas sector is contributing by providing raw materials to be further transformed into polymers used in new renewable-based solutions, and also, to some extent covering energy needs related to manufacturing new systems [7]. Many analysts emphasize the need (for the time being) to continue investments and sustain capital flow into the petroleum sector because it is needed to ensure energy security while society is transitioning to new decarbonized and renewable-based solutions. Analysts stress that a lack of investment into traditional fuels before the energy transition is completed may lead to a highly volatile energy market and slow down the transition [7]. Current trends show that energy companies understand that a “binary stance” (either traditional energy or renewables) may lead to high economic and societal risks, and most prefer to take a rather nuanced stance. For example, [8] shows that while growth in investments into renewables has been about 16% in recent years, there has still been growth, albeit a smaller one, of 13% in the oil and gas sector. It is important that these investments into petroleum in upcoming years are used to ensure that the sector carries out its tasks in the smartest and most efficient way possible. One approach to handling environmental concerns is carbon capture and storage (CCS), which has received a considerable boost since approx. mid-2022 in Europe and the United States due to an increase in pollution pricing and newly introduced legislation. It is now cheaper to use CCS than to pay the carbon tax, and this is why the European Union is in the process of building new infrastructures for CO2 transportation and storage [8]. Another approach addresses concerns about the energy efficiency of the sector’s operations. This is considered “low-hanging fruit”, yet it has not received enough attention in the literature (which is demonstrated later), and also, the industry’s attention to energy efficiency could benefit from being more definitive. This matter of energy efficiency is explored further in this paper in the context of strategic planning issues, that is, developing facilities and infrastructures (for new solutions or retrofitting/expanding existing ones) in a way that ensures the best possible efficiency for long-term operations.
There are multiple approaches to increasing energy efficiency in the petroleum sector. Some are related to technological solutions, such as waste heat recovery in the form of combined heat and power cycles [9], and combined cycles based on introducing an organic Rankine cycle [10]. Others are related to the electrification of remotely located facilities such as offshore platforms [11]. These mentioned solutions are “add-ons”, employed in addition to the core processes that the industry runs. Another direction is to examine the sector’s own infrastructures, facilities, and processes, specifically through the lens of strategic-level trade-offs between capital investments into capacities of infrastructures and the efficiency of further operations within these infrastructures. Logistical aspects of investing in new infrastructures and optimizing these operations are intrinsically rather complex problems, which is why, traditionally, they are approached separately [12]. However, if investment-phase decisions are made without meaningful consideration of certain aspects of future operations (e.g., hydraulics and equipment performance under different operating rates), then the efficiency of these operations may be seriously restricted, leading to energy consumption over the entire lifecycle of the solution.
The purpose of this research is twofold. First, an analysis of the petroleum supply chain (PSC) and the literature on PSC optimization is conducted in Section 2. The purpose of this analysis (the first purpose of this research) is to identify the segments in which activities could be coordinated and optimized jointly to achieve efficient supply chain performance. Also, Section 2 reviews and analyzes PSC optimization problems in the existing literature from the viewpoint of efficient energy use. Based on this analysis and the revealed research gap, the second (and ultimate) research purpose is formulated as follows: to develop a decision-making framework to coordinate the actors of the PSC’s push segment and support planning at the strategic level while exploring a trade-off between infrastructural decisions and energy consumption during eventual operations. The decision-making framework is presented in Section 3. The proposed optimization model is a mixed-integer nonlinear program (MINLP) that covers technological details like hydraulics (the relationship between pipeline diameters, pressures, flow rates, and pipe lengths) and also pump systems’ operational efficiency. The results of the computational study presented in Section 4 show that the technological decision-making criterion of minimizing energy consumption drives infrastructural choices and operational modes to achieve performance close to the machinery’s best efficiency point. The results also show that the presented approach allows for considerable flexibility in operational flow rates through the PSC, unlike the traditional approach of step-by-step planning of investments and operations. Finally, Section 5 and Section 6 present the discussion of the results and conclusions.

2. Overview of the Research Area

This section presents an overview and an analysis of petroleum supply chains and intends to point out processes and activities which could benefit from joint planning and coordination. Further, the seminal literature on planning across various segments of the PSC is presented and summarized. Ultimately, research gaps are identified and a plan to address them is outlined.

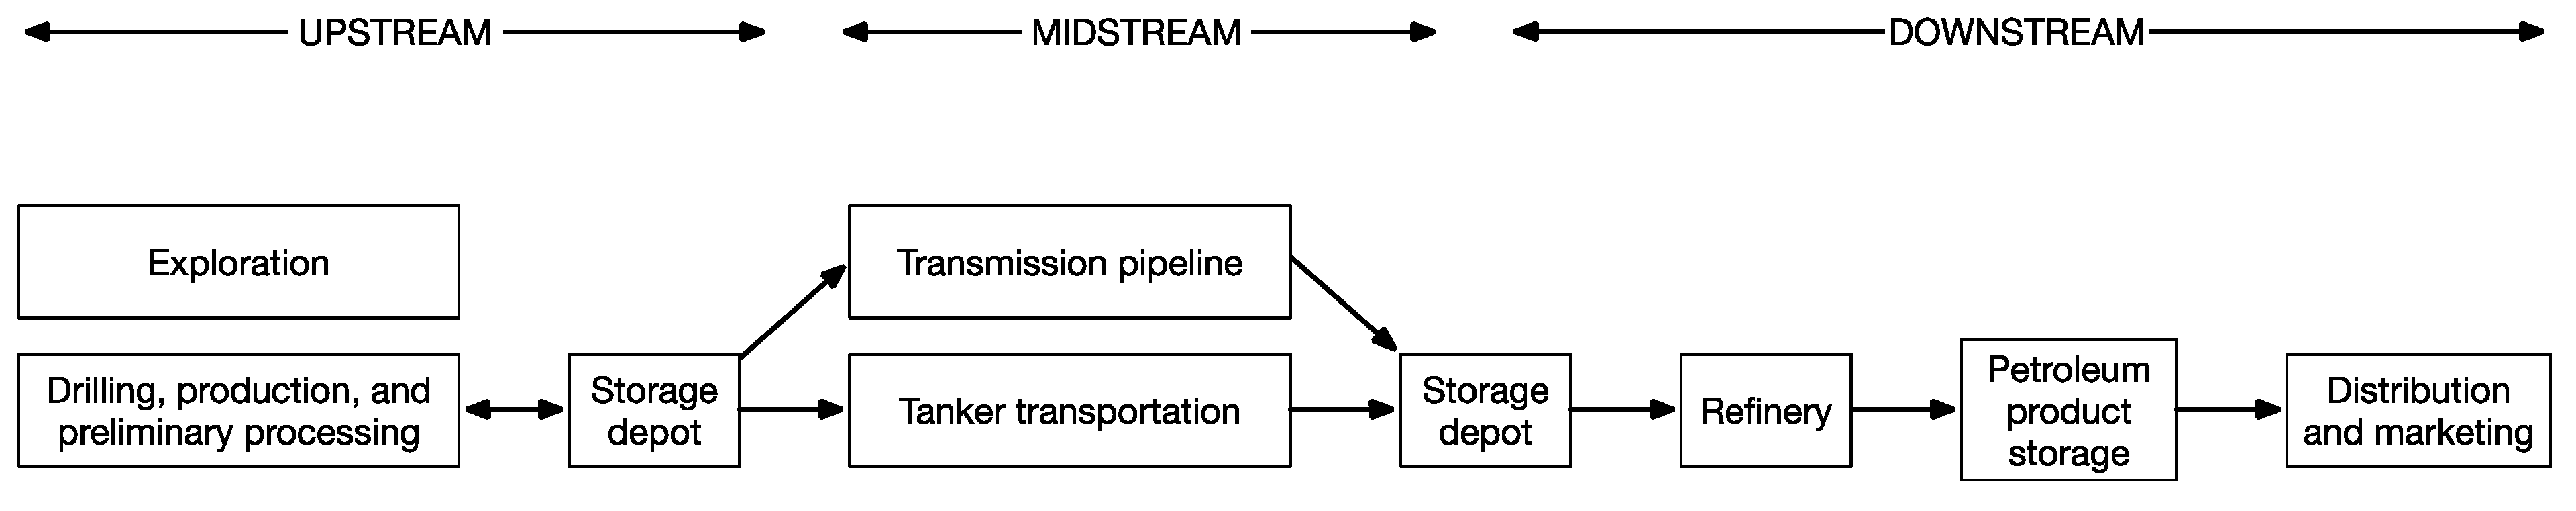
2.1. Petroleum Supply Chain Segments

The value chain of the petroleum industry is commonly divided into three segments [13], namely, upstream, midstream, and downstream (refer to Figure 1). The upstream segment accounts for the processes of the exploration, extraction, and transportation of crude petroleum from wells located in remote areas to nearby terminals. The midstream segment deals with the long-distance transportation of export-quality crude oil to refineries, as well as possible storage along the way. Finally, the downstream segment comprises refining (transformation of crudes to end-use products such as fuels and lubricants), as well as the distribution and marketing of the end products [13]. The petroleum supply chain is a complex and interconnected network of activities, processes, and units run by a variety of actors. Some specifics of the relations between these actors will be described shortly.
The coordination of supply chain actors is a significant challenge for modern-day industries, and it has to be met so that businesses can be productive and competitive [15]. With global societal changes and modern technological advances, the business environment, including the energy sector, operates in an increasingly competitive environment. Thus, jointly planning aspects like purchasing, production, inventory, and transportation between the cooperating actors promotes efficiency and reduces risks [16]. The weakness of the “traditional” behavior of each individual actor is that they may tend to prioritize maximizing their own profit over considering the impact this attitude may have on the entire chain. Namely, this may lead to inefficiencies in lead times, labor, equipment, and inventories, resulting in the loss of opportunities for satisfying end customers [17]. Therefore, collaboration among supply chain actors, that is, behaving somewhat like departments within the same company, is vital in achieving greater objectives.
The companies who run the primary operations in the oil and gas (such as BP, ExxonMobil, Shell, TotalEnergies, Equinor, Petrobras, etc.) sector have long considered supply chain coordination and performance to be highly correlated, and thus, they have for a long time been employing the approach of vertical integration, that is, engaging in most stages in the supply chain, from reserve exploration to retail [18]. In this setting, the actors responsible for the key processes in the value chain are normally subsidiaries of a large company, usually referred to as an exploration and production (E&P) operator. Thus, the E&P operator establishes a network of suppliers, producers, transportation and distribution actors, as well as retailers, who are the operator’s subsidiaries and who are coordinated and controlled by the operator to harmonize the processes within the value chain, avoid problems, and reduce risks of supply–demand gaps. Of course, the actors within the petroleum supply chain are not limited to the E&P operator’s network of subsidiaries. A large number of engineering, design, maintenance, and goods/personnel transport contractors are also engaged in this sector [19]. Contractors provide specialized expertise and services, allowing the E&P operator to focus on their core mission of planning and coordinating processes and activities in the best possible way, given the set goals.
There are different ways to categorize strategies in supply chain management (SCM); however, some of the broadest classifications are the categories of “push” and “pull”. These two approaches are related to perspectives on supply chain design specifics. Following the push strategy, a manager speculates about future customer demand (e.g., by means of forecasting) and then schedules supplies, production, quantities, transportation, and other logistical activities. Since this approach is based on predictions made in advance, the adaptability to changes in actual market conditions is limited. On the contrary, the pull strategy is a reactive approach, by which the manager responds to actual (that is, known and confirmed) customer orders. The information on the orders is transmitted throughout the chain, and this mobilizes the production and transportation processes to meet the demand accurately. Adequate knowledge of customer demand allows actors to minimize inventory levels and lead times. In reality, to manage a supply chain effectively, a manager must apply a combination of push and pull strategies rather than rely solely on one [20]. In a real supply chain, the upstream segment primarily operates in a push style, that is, utilizing forecasts, and then at some point the strategy switches to the pull style, normally for the downstream segments [21]. The interface between these two strategies is called the decoupling point, push–pull boundary, or order penetration point. Determining its position is a crucial issue of SCM design for any given sector [22], as oversupply may lead to excessive inventory, while undersupply may result in missed sales opportunities [23].
The petroleum supply chain is very complex. Production activities are possible only in certain regions of the world, whereas the demand for the end products is global. Crude oil travels long distances through various transport modes (pipelines, tankers, railway cars) before reaching refineries. Afterward, the end products (gasoline, jet fuel, diesel) also move through various storage depots and distribution systems to ultimately arrive at the end customer. Overall, this results in considerably long lead times of several weeks. As a result, transportation and inventory costs are often high [24]. The petroleum sector is considered an example of an inflexible supply chain. Product purchases are normally agreed on six to twelve months beforehand; the transport and storage network has to be fixed to existing facilities (pipelines, tankers, storage depots, etc.) with little to no opportunity to increase capacity in the short term, and thus, the design of these networks as well as the meaningful utilization of their capacities must be carefully considered [25].
Thus, the process starts with the production of export-quality crude oil that is “pushed” from production sites [26] through a transportation and storage network to refineries whose operations (that is, which specific end products to produce and in what amounts) are “pulled” by the end-customer demand for these products [27]. This way, a hybrid push/pull system is considered with the decoupling point placed at the crude oil storage depot at the refinery inlet, that is, right before the downstream segment of the value chain [28]. The key reason for identifying the decoupling point before the refinery is that refining is the stage where the raw material, that is, crude oil, is transformed into the end products, that is, fuels, chemicals, lubricants, etc. Therefore, in a vertically integrated supply chain, it makes sense for the planners to “push” the crude oil to the refinery with minimum costs and then plan the production processes at the refinery based on the actual demands and product prices, thus maximizing profit in the pull-based segment. The amount of crude oil available at the inlet to the refinery is based on the forecast of the end-product demand, and sets limits on the refinery’s production output [29]. Figure 2 illustrates the position of the decoupling point within the petroleum supply chain.
The following subsections discuss the existing literature on integrating key logistical decisions for coordinating various segments of the petroleum supply chain.

2.2. Literature on Inventory-Routing Problems

This class of problems refers to coordinating petroleum production with transportation and storage at the local depot. Often, such problems need to be considered for offshore contexts because the petroleum sector in recent decades has faced a shift toward offshore and deep-water locations. Also, in this context (unlike onshore production), there is a need to coordinate inventory levels at both the production site (an offshore platform) and the intermediate (onshore) storage site. The inventory-routing context usually refers to scheduling the routes of shuttle tankers and operations for offloading petroleum from offshore platform storages and transporting it to onshore storage locations. Normally, inventory routing must ensure that the produced amounts meet a certain demand estimate while maintaining sufficient inventory levels at storage depots to avoid disruptions in production and long-distance transportation.
One study [30] introduces a mixed-integer linear programming (MILP) model for operational planning/scheduling dynamically positioned shuttle tankers transporting crude oil from offshore platforms to onshore storage depots. To address a similar problem setting, [31] also employs a MILP model that considers varying travel times between platforms and onshore storage depots. An application of an inventory-routing solution to a real-life case within the Brazilian upstream sector is demonstrated in [32], where the authors show an increase in transportation efficiency and cost reduction of about 20%. In addition, the research examines real-life scenarios of production rates, berth unavailability, and changes in onshore storage depot capacity. Another study [33] explores the uncertainties relevant to the maritime inventory-routing context, such as weather conditions, vessel reliability, and congestion at storage depots, to ultimately develop robust schedules. Considering the petroleum inventory-routing context, [34] takes into account the different properties of the petroleum produced at different locations and the nonlinear effect on these properties when different crudes are blended. The authors develop a mixed-integer nonlinear programming (MINLP) model, which is solved by means of a decomposition algorithm. Further research [35] addresses a cluster-first route-second approach for shuttle tanker scheduling with additional considerations of the nonlinear effect of blending on the properties of the resulting mixtures. Again, the approach developed by the authors is an MINLP model. One of the recent works in the area of inventory routing is [36], in which the authors develop a MILP model addressing multi-visit multi-voyage shuttle tanker scheduling with a heterogeneous tanker fleet. An example of a multi-objective decision-making problem may be found in [37], where the authors consider the reliability of shuttle tanker operational schedules in addition to the traditional cost minimization objective.

2.3. Literature on Coordinating Multiple Segments: Production, Transportation, and Refining

In this subsection, the reviewed research presents a combination of decision-making aspects pertaining either to the entire value chain from upstream to downstream, or from midstream to downstream.
Reference [38] addresses the connection between the midstream segment (long-distance transportation of oil by tankers) and the start of the downstream segment (petroleum distillation towers). The developed MILP model covers tanker scheduling and offloading, crude oil transfer to and between storage units, and finally, transfer to the distillation unit. Elaborating on the mentioned research, several papers develop a more realistic decision-making framework for a similar setting. First, reference [39] presents nonlinear production planning problems at a refinery with multiple processing units. A later paper [40] models the details of port-to-refinery infrastructure, including multiple piers, multiple storage points, and blending units with a complex pipeline network, resulting in a large-scale MILP model. Ultimately, reference [41] presents a large-scale MINLP model integrating petroleum delivery schedules, storage tank inventories, and pipeline deliveries of crude oil to and between various production and processing units at refineries, and finally, scheduling end-product deliveries to distribution centers.
Reference [42] aims to integrate decision making across the entire value chain from upstream to downstream. The developed MILP model addresses the scheduling of offloading petroleum from offshore platforms, inventory planning at the intermediate storage units, the allocation of crude oils to refineries, and to some extent, even the selection of refinery distillation units’ operating modes. A later study [43] explores the same problem, however, its authors develop an efficient heuristic algorithm allowing to solve large instances in a timely manner.
Reference [44] also attempts to integrate midstream and downstream decision making. The authors develop a modeling framework consisting of several steps: first, they cover transportation, offloading, storage, and blending as a MILP model, and then the refinery processes in the form of a nonlinear model.
Among the most recent publications in this area, one may highlight references [45,46,47], which attempt to integrate multiple activities from upstream to downstream within large-scale MINLP models. These decision-making models cover such aspects as uncertainties in shuttle tanker schedules, the nonlinear blending of crudes, and the nonlinear performance of distillation units at refineries.
Thus, one may observe that there have been multiple attempts in the literature to integrate relevant logistical aspects found in petroleum supply chains into a larger decision-making framework to find an appropriate trade-off between these aspects to achieve cost reduction, profit maximization, or efficiency improvement. In the existing literature, two sub-directions become apparent: the first one concerns integrating decisions for the upstream and midstream segments, while the second one integrates the very end of the midstream with a detailed view of the downstream segment. This natural division in the literature corresponds to how the decoupling point has been identified in the petroleum supply chain. One may also observe that nearly all the problems presented here and in the previous subsection are operational-level, or in other words, short-term planning models. The drawback of these models is that they assume that an infrastructure (that is, pipelines of certain diameters and throughputs, depots of certain capacities, vessel fleets of a certain size) has already been established, and what needs to be planned are the operational modes of the processes and scheduling of activities. As the petroleum sector is still growing, new facilities are being established, old ones are being renovated, and capacities may be expanded. In these circumstances, it makes sense to explore a strategic-level trade-off, that is, the one between investments into new capacities and operational efficiency, which is something that has not been sufficiently explored in the literature on petroleum supply chain coordination.

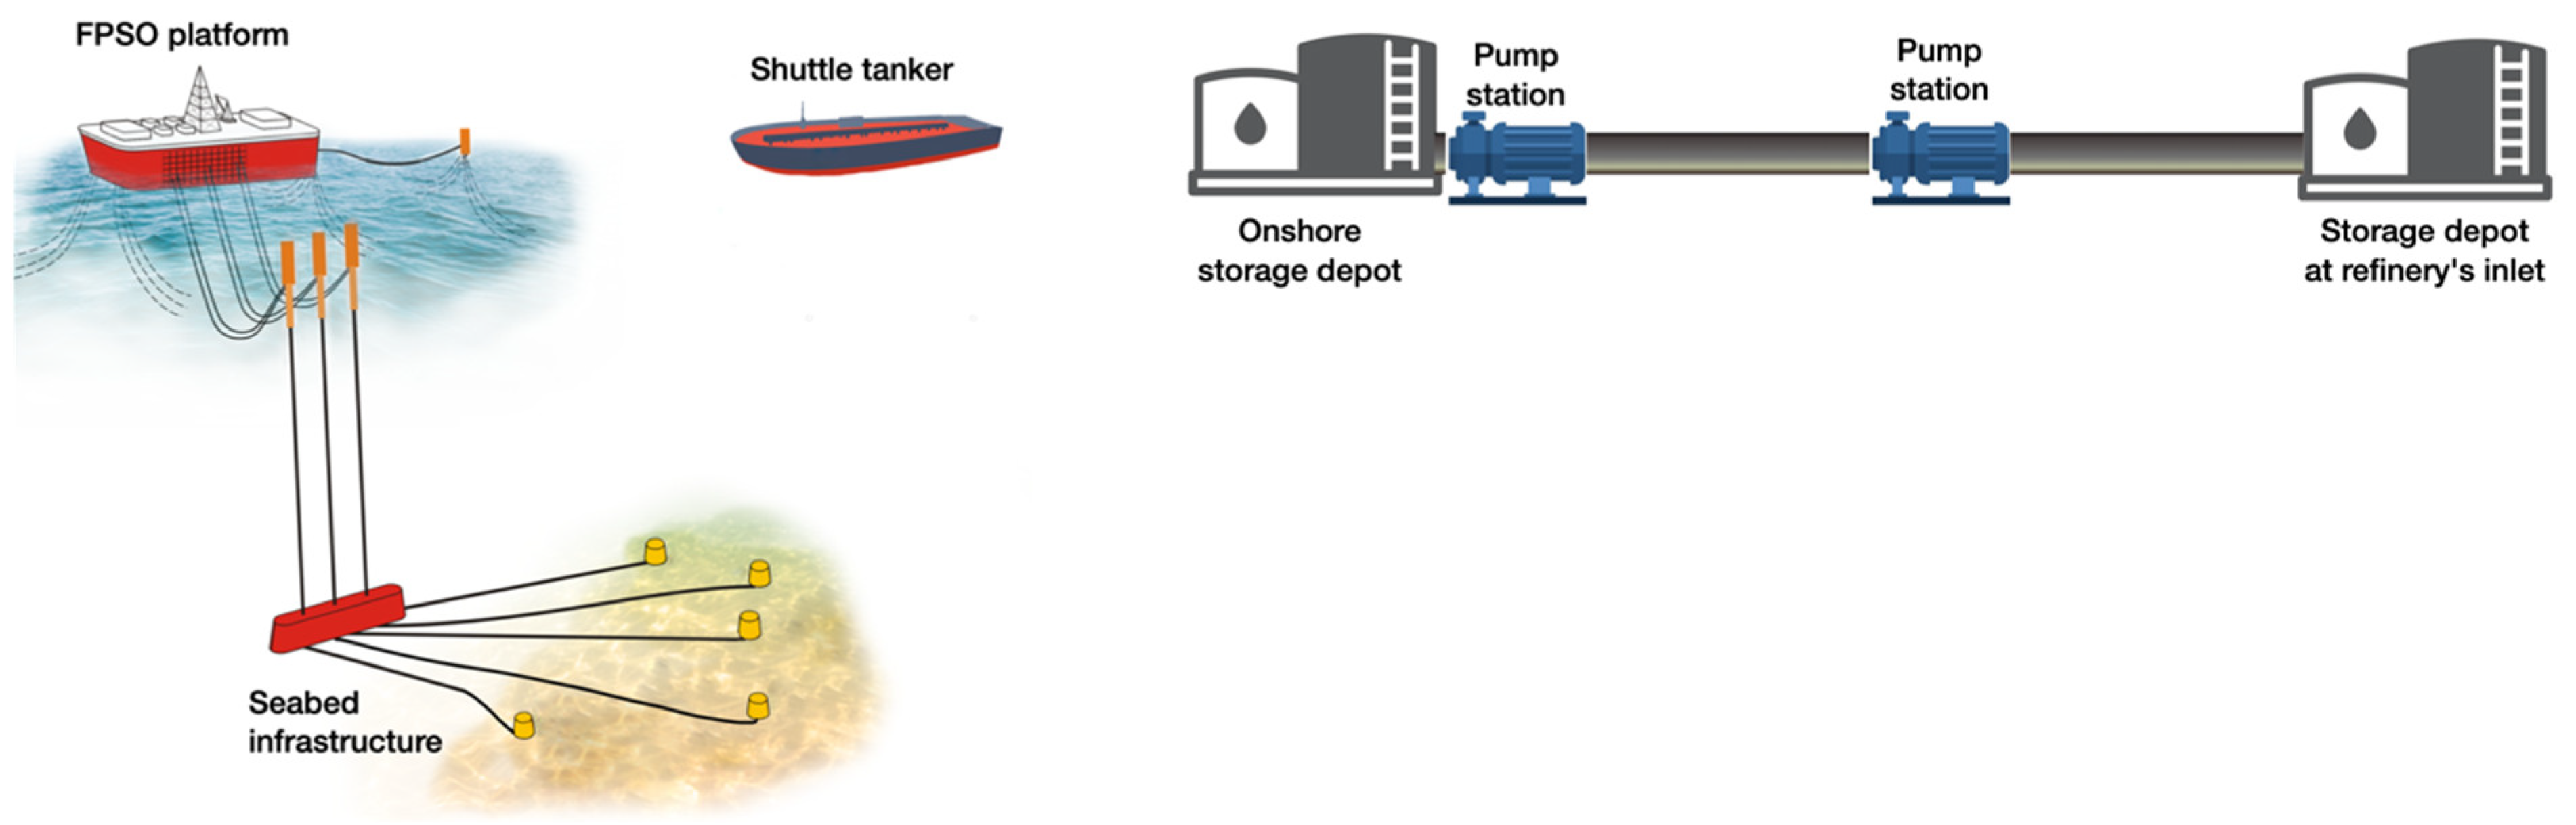
2.4. Literature on Infrastructures for Petroleum Production and Processing

The problem of decarbonizing industries is vital to the modern-day agenda, and logistical aspects, or in other words, infrastructural aspects such as network design and process operations in these networks, are expected to play a considerable role in this agenda [48]. Over recent decades, many researchers have developed decision-making models for designing and mobilizing infrastructures for the oil and gas sector. Among the most recent works, one may find references [49,50,51]. These papers present a variety of infrastructural issues, such as network layout intricacies [49], processing units’ performance details [50], economic performance [51], and others. A reader interested in how the details of infrastructure design models and solution algorithms have evolved over the years is encouraged to turn to the detailed descriptions reported in the introduction and review sections in the mentioned papers.
The mentioned papers [49,50,51], and all research on infrastructure planning in the oil and gas sector over the past two to three decades, have utilized large-scale MILP and MINLP models, capturing various complex real-life aspects to ensure adequate decision-making. Still, the matter of efficient energy use while running the processes within these infrastructures has yet to receive the attention it deserves. The way to approach this issue is directly related to the already-mentioned logistical trade-off between capital investments into the capacities of new infrastructures and the efficiency of further operations within these infrastructures. Pipeline infrastructures with pumps pushing fluid through them play an important role in all segments of the petroleum value chain. The energy consumed by the pumps (e.g., electrical submersible pumps used for lifting fluid from oil-bearing underground reservoirs) is more than half of the overall energy spent in the upstream processes [52], and an even greater portion for long-distance transportation pipeline systems [53]. Reference [12] highlights the importance of choosing an appropriate throughput for pipeline networks, that is, selecting the right diameters for pipeline segments due to the complex nonlinear dependency between the pressure in the pipes and their internal diameters. If the problem of establishing pipeline infrastructures is addressed without considering future operations, then the least costly solution with the smallest throughput will be chosen, thus restricting the operational efficiency of the pumps and leading to higher electricity consumption by the pumps. Finding the appropriate balance between infrastructural decisions and the operational modes of the pumps may lead to considerable energy savings during operation. This is especially important to the push segment of the supply chain (corresponding to the upstream and midstream segments of the value chain), which is on the receiving end of the overwhelming majority of new investments into the industry [7]; new oil- and gas-producing fields are discovered fairly often, and investments are directed towards building new production, processing, and transportation infrastructures for delivering crudes to existing refineries and distribution systems.

2.5. Research Gaps and Outline for Further Analysis

From the brief literature review provided in this section, one may conclude that the research on organizing downstream (i.e., the push segment) operations is rather well developed. It reflects the specifics of the segment and utilizes adequate process descriptions and decision-making models. On the other hand, the research pertaining to the push segment of the PSC could benefit from a better focus on the technological details tied to operational efficiency and energy use. First, the overwhelming majority of the research on PSC optimization in the push segment assumes that infrastructures are already in place and, therefore, focuses on tactical and operational issues such as scheduling. When excluding the matter of establishing infrastructures with certain selected capacities from consideration, efficiency and energy use during operation are not balanced against investment into infrastructure. The pool of research specifically focusing on infrastructure planning addresses the matter of capacity planning in an oversimplified manner, that is, by assigning a fixed value to cost per unit of length, capacity, or transported volume; however, the true values of cost or energy use are derived from the complex nonlinear relationship between many technological parameters. This is why it is important to include a sufficient level of technological detail when planning capacities with consideration for future operations.
The decision-making model developed in this research is largely based on the models in [12,35,44], as well as the technical literature on machinery performance, such as [52]. Following the large pool of literature on PSC optimization, the methodology for this research is mixed-integer nonlinear programming (MINLP).

3. Methodology

This section presents a mathematical formulation for the problem of producing petroleum at an offshore field and transporting the petroleum to an onshore storage depot, from which it is transferred further (to storage at a refinery) by means of a long-distance transmission pipeline. The model presented here has been simplified to reflect the main trade-off expressed in the research purpose statement. Elaborations suitable for more realistic examples will be discussed further.

3.1. Problem Setting for Modeling

The problem here is related to producing oil from an underground reservoir in a deep-water offshore environment. The bottomhole parts of the wells penetrate the reservoir, and the fluid from it is delivered to the wellheads through the production tubing inside the wells. The wellheads are all connected to a gathering unit from which the fluid is delivered to a floating production, storage, and offloading (FPSO) unit, which is a type of offshore platform (Figure 3). At this platform, the fluid is processed; petroleum is separated from water and impurities, and then stored. Further, the petroleum from the FPSO storage unit is transported to an onshore storage base by shuttle tankers, which make regular visits to the production site. From this onshore storage depot, the petroleum is pumped through a long-distance transmission pipeline system that has several pump stations along the line. The end point of this chain (the decoupling point) is a storage depot that collects the petroleum for further processing at a refinery. To conduct these further processes successfully, a certain target flow rate from the field to the refinery’s storage depot must be ensured.
The technological details that are incorporated into the decision-making context pertain to balancing capacities and the operational aspects of their utilization, that is, pressures, flow rates, and pipeline diameters. To lift the petroleum from an underground reservoir and also to transport the petroleum over long distances by means of the pipeline, necessary pressures must be created, and for this, pump systems are used. For the production wells, electrical submersible pumps (ESPs) are assumed in this research. ESPs are quite a common solution for deep-water petroleum production. One advantage of ESPs is the reliability of models that are developed for deep-water environments: the pumps can operate for many years without failure or the need for maintenance, which helps avoid costly interventions. Another advantage of ESPs is their flexibility in terms of using machinery in the most efficient way. ESPs, just like any other artificial lift type, have a best efficiency point, that is, an operational mode (i.e., the pressure it is developing for the given flow rate) which corresponds to the highest energy conversion efficiency, that is, the highest output (in terms of developed pressure) relative to the electrical power consumed by the pump. ESP systems allow shifting the best efficiency point by means of changing the frequency of the alternating current (AC) powering the pump drive, which is often referred to as the variable frequency drive (VFD). Note that the maximal achievable efficiency of the pump does not change with a change in AC frequency; however, it is possible to ensure that the pump system operates at (or close to) the best efficiency point for the needed “pressure—flow rate” conditions.
While the ESP systems installed inside the production wells ensure the hydraulic lift power to deliver the fluid from the reservoir to the processing platform, the onshore pipeline transportation also employs pump systems. However, these pumps are larger in size, as are the pipeline diameters, compared to those at the production side. The goal of these pumps is to boost the pressure at certain points of a long-distance pipeline to maintain the necessary flow through that pipeline. The pressure boost is required because of the frictional pressure losses which take place in any kind of pipe. The energy consumption and efficiency of these pump systems are described similarly to ESPs, and the best efficiency point can also be adjusted by the VFD for the needed “pressure—flow rate” conditions.
When it comes to the issue of energy consumption, there are also several key processes at an FPSO that consume energy in the form of electricity and heating. First and foremost, desalters/dehydrators, also known as electrostatic coalescers, consume electrical energy to remove water and salt content from fluid. There are also fired heaters used to warm the petroleum to remove potentially dissolved gaseous hydrocarbon fractions (such as propane and butane), and of course, there are pumps maintaining the flow of the fluid between the processing units. In addition, the process of transporting export-quality petroleum between an FPSO storage unit and an onshore depot conducted by regular shuttle tanker visits is associated with fuel consumption. The frequency of these visits is determined by petroleum production rates, as well as the storage capacity at the FPSO platform.

3.2. Mixed-Integer Nonlinear Programming Model

The decision-making problem presented in this section aims to facilitate strategic planning, that is, the main set of decisions in the problem is related to the choice of the capacity of the gathering infrastructure and the long-distance transmission infrastructure. To make appropriate decisions on these issues, technological details of the operational efficiency of pump systems are included in the model, together with certain descriptions of hydraulics, that is, the relationships between pipeline diameters, pressures, flow rates, and pipe lengths. The technological decision-making criterion of minimizing the energy consumption in the push segment of the supply chain should drive the infrastructural choices and operational modes to achieve the machinery performance at or near the best efficiency point. The modeling notations are presented in Table 1.
The objective function of the optimization problem is to minimize the energy consumption within the push segment of the petroleum supply chain over a certain interval of time. The expression provided in (1) reflects the electrical energy consumption by the ESP systems ensuring the appropriate hydraulic lift of the produced fluid; the energy consumed by the fluid-processing units, including electrostatic dehydrators, heaters, and pumps functioning at the FPSO platform; energy consumed by shuttle tankers during regular visits for collecting the processed petroleum; and finally, the electricity consumed by the pump systems within the long-distance transportation pipeline.
Min Z = Δ · i = 1 N W N i H L η i E S P + Δ · N P U + H f · Δ Q F P S O · q o i l + Δ · j = 1 N P N j L D η j P S
The pressure difference for each well is described in (2), and is attributed to the well’s hydrostatic pressure, the friction losses in the production tubing, and the pressure developed by the ESP system. Pressure losses due to friction are approximated by the Hazen–Williams formula in (3), where q, D, and L are abstract values of any flow rate, diameter, or length of a pipeline segment.
p i B H p i W H ρ · g · H i + p f r q i , T D i , H i p i T D ,   i 1 N W
p f r q , D , L = 7.68 × 10 9 · ρ · g · q C 1.85 · L D 4.89
Expression (4) demonstrates how the total developed pressure in the ESP systems is calculated by employing the “total developed head” function, which characterizes the pump’s performance. Constraint (5) presents a nonlinear function of each pump’s efficiency. Expression (6) limits the AC frequency controlling the pumps’ VFD. Constraint (7) describes the required hydraulic lift power (in kW) required to lift the fluid from the reservoir to the FPSO platform. The two nonlinear functions in (4) and (5) are presented in (8) and (9) as approximations of the pump characteristics and their changes under the changing AC frequency.
p i T D = ρ · g · F i T D H q i , f i E S P ,   i 1 . . . N W
η i E S P = F i e f f q i , f i E S P ,   i 1 N W
f i E S P f m a x ,   i 1 . . . N W
N i H L 10 3 · q i 24 × 60 × 60 · ρ · g · H i + H s p i B H ,   i 1 . . . N W
F T D H q , f = a 2 · q · f 0 f 2 + a 1 · q · f 0 f + a 0 · f 0 f 2
F e f f q , f = η m a x 2 · f 0 q m a x · f 2 · q · q m a x · f f 0 q
The relationship between the seabed infrastructure pipelines’ diameters and lengths, as well as flow rates and pressures in the pipes, are described by expression (10), where the nonlinear function has already been expanded in (3). Constraint (11) corresponds to the choice of pipeline diameters out of the available options.
p i W H p G U p f r q i , d i P S , L i ,   i 1 . . . N W
d i P S = l = 1 N P C y i , l · D l S B , i 1 . . . N W
Constraint (12) represents the calculation of power (in kW) which corresponds to pushing the petroleum through a segment of the long-distance transmission pipeline. Expression (13) shows the developed pressure at each pump station. Constraint (14) presents the function of each pump’s efficiency. Expression (15) limits the AC frequency controlling the pumps’ VFD. Constraint (16) follows the pressures along the segments of the transmission pipeline. Constraint (17) demonstrates the choice of the transmission pipeline diameter out of the available options. Constraint (18) calculates the flow rate of the oil from the entire field, and this total flow rate is precisely that of the transmission pipeline. Constraint (19) sets the target flow rate that is required from the oilfield to the refinery’s storage depot. Finally, the expressions in (20) present the domains for the decision variables.
N j L D 10 3 · q o i l 24 × 60 × 60 · p f r q o i l , P D , L j P S ,   j 1 . . . N P
p j P S = ρ · g · F T D H q o i l , f j P S ,   j 1 . . . N P
η j P S = F e f f q o i l , f j P S ,   j 1 . . . N P
f j P S f m a x ,   j 1 . . . N P
p j L D p j 1 L D = p f r q o i l , P D , L j + p j P S ,   j 2 . . . N P
P D = l = 1 N D C z l · D l L D
q o i l = i = 1 N W q i · o c
q o i l q t a r g e t
q i ,   f i E S P ,   p i B H ,   p i W H ,   p i T D , η i E S P , N i H L d i P S 0 , i 1 . . . N W ,       p j P S ,   f j P S ,   η j P S ,   p j L D 0 , j 1 . . . N P ;       q o i l , P D 0 , y i , l   b i n a r y ,   i 1 . . . N W , l 1 . . . N P C ;       z l   b i n a r y ,   l 1 . . N T C .

4. Results

4.1. Computational Experiment Setup

The computational experiment here was conducted as a simplified study example. Nevertheless, the data for the example come from several real-life projects conducted by an engineering contractor company for one of the largest petroleum-producing (E&P) companies in the world. Additionally, certain principles and issues pertaining to establishing and operating pipeline infrastructures have been based on the work in [53]. Finally, details of the mathematical descriptions of pump system performance characteristics are based on high-quality monographs [54,55,56].
To solve the mixed-integer nonlinear programming model described in the previous section, the Artleys Knitro (short for “Nonlinear Interior point Trust Region Optimization”, plus a silent K at the start) solver implementing the outer approximation (OA) decomposition algorithm has been used within the AMPL (short for “A Mathematical Programming Language”) environment. The idea of the algorithm is to segregate the optimization model into two subproblems, namely, one linear subproblem with binary and continuous variables and one nonlinear subproblem with only continuous variables. In the linear (master) subproblem, all the nonlinear mathematical expressions are linearized (in other words, approximated) by means of the Taylor series. The algorithm solves the two subproblems in a loop, and its iterations produce updated solutions further supplied to the next subproblem until the solutions of the two subproblems converge. An interested reader may find detailed information on this decomposition approach in [57] and [58]. This algorithm is known to produce optimal solutions for convex nonlinear problems. The model presented in this research does not meet this requirement, if only due to the decision-making objective, and thus this solution approach should be considered heuristic for this particular case. Nevertheless, the solution should be considered reasonable and plausible.
The following steps are taken to produce the solution in the AMPL environment. All the sets, parameters, and variables from Table 1 are defined; the objective function (1) and all the constraints (2)–(20) are programmed; and finally, the Knitro solver is selected with the option for the OA decomposition procedure.
The computational experiment is run for the example of a small oil field with 12 wells. The seabed infrastructure includes a variety of pipeline diameters ranging from 101.6 mm (4″) to 406.4 mm (16″). The transmission pipeline is considered relatively short, with only one pump station needed to deliver the petroleum along it. Capacity options for the transmission pipeline are considered, ranging from 609.6 mm (24″) to 1219.2 mm (48″). With regard to the reservoir and the geophysical conditions, the production wells’ productivity index is assumed to be quite high, with values around 15 m3/d/MPa, and the reservoir pressure is assumed to be 50 MPa, while bottomhole pressure is allowed to be as low as 20 MPa. The time horizon of the model is one year.

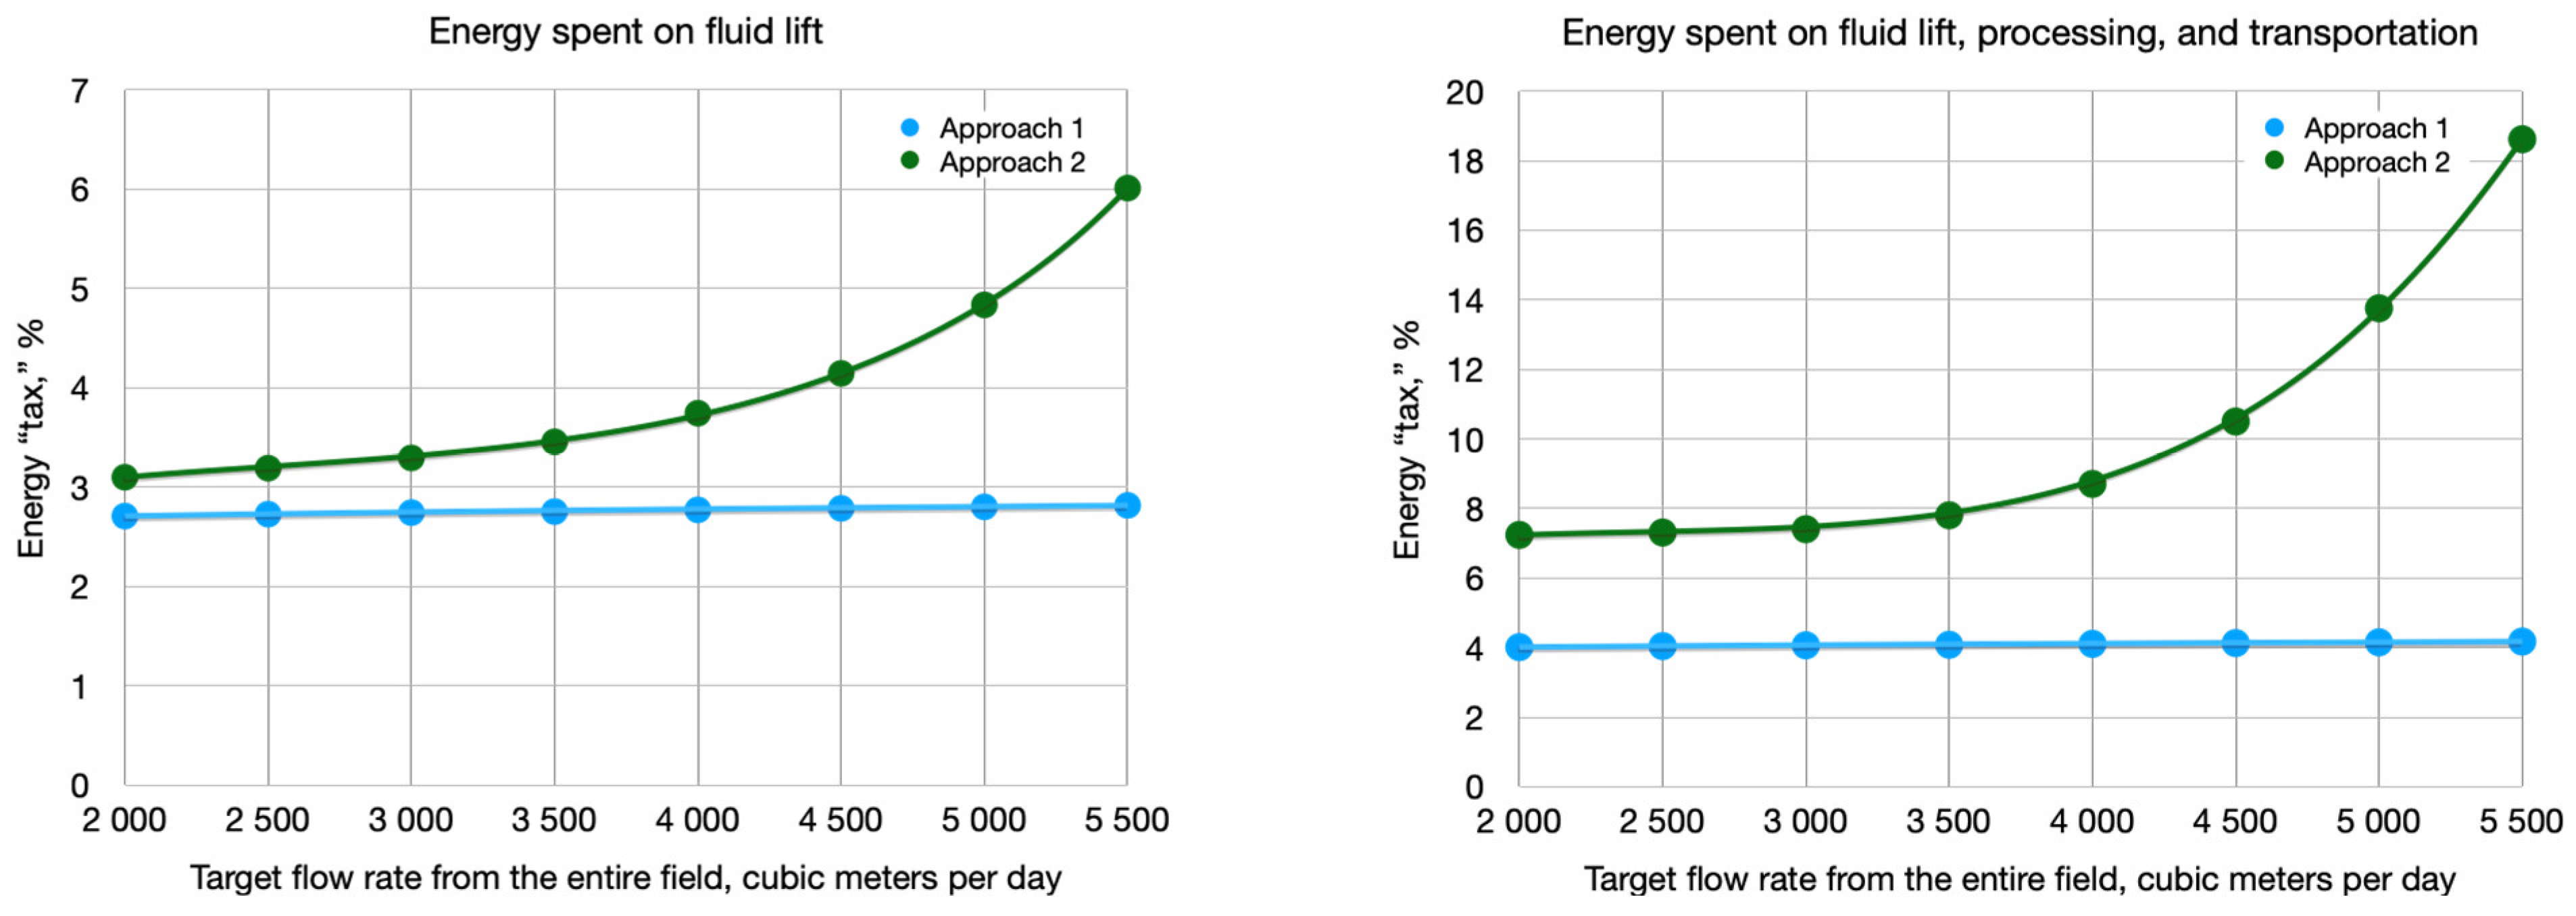
4.2. Computational Results

Table 2 demonstrates the infrastructural choices and the operational efficiency of the pumps for two experiments. The first experiment (Approach 1) is based on the decision-making framework presented earlier, while the second experiment (Approach 2) models the situation when the minimal-cost infrastructures are chosen. This latter approach reflects a somewhat conservative approach to decision making, that is, when the decisions for the capital investment phase (minimizing capital expenditures) and the operational phase (e.g., maximizing profit or efficiency) are made separately.
Further analysis assesses how much energy is used to produce a unit of energy in the form of crude oil. For the sake of this discussion, this measure is referred to as the energy “tax” to highlight the fact that the energy produced requires a certain energy expenditure. To calculate this energy “tax”, it is necessary to have an estimate of energy for a volumetric unit (m3) of petroleum, the energy necessary for the hydraulic lift of the fluid, as well as the energy efficiency of the pump systems and the power-generating units producing electricity supplied to the pumps. All the necessary conversions and approximations have been performed based on the data from the Norwegian Petroleum Conversion Calculator [59]. For Approach 1, where systems work closely to the maximal efficiency, this energy “tax” is about 2.78% if one only counts the energy required for the fluid lift, while for Approach 2, the value is 4.13%. If one counts the fluid lift energy together with processing and long-distance transportation energy needs, then the energy tax is about 4.15% for Approach 1 and 10.50% for Approach 2.
One may note that, in principle, the concept of energy “tax” could be seen as an inverse value of the energy returned on energy invested (EROEI), whose values for the given computational example are approx. 37:1 for Approach 1 and 24:1 for Approach 2 if one only counts the energy needed for the fluid lift, and approx. 21:1 and 10:1 if one counts the overall energy consumption. Given these values, it is evident that rather favorable geophysical and technical conditions are considered in this experiment, which generally reflect the environment of conventional petroleum production on the Norwegian Continental Shelf. One may note that these values are derived from data based on existing projects that are already in operation. When new fields with traditional (that is, not highly viscous) oil resources are discovered, these ratios can be even higher, namely, 100:1 or even 200:1. Similarly, higher EROEI ratios could be found in countries and regions where petroleum is produced in conventional (inland) environments, unlike in offshore deep water, or the Arctic environments of the Norwegian Continental Shelf.
Further, computations have been performed for the analysis of the sensitivity of the produced solution toward the target flow rate. This parameter is arguably the most interesting from the sensitivity perspective, if only due to petroleum companies’ willingness to adjust flow rates from their oilfields to market (and also, often, governmental) conditions and demands. Also, the remaining parameters may be considered less interesting from the sensitivity perspective, as they mostly describe the geophysical environment of a given oilfield or certain technical characteristics of the machinery and units, which are different for different contexts, and decision makers cannot influence them during operation. Also, changes in flow rate are a particularly important issue with regard to a field’s aging/depletion over time. This aspect is not addressed in this research; however, it is suggested that it may be included in further research, which is discussed in the next section of this paper. Analyses of the sensitivity of the overall energy spent within the push segment (the objective function), as well as the energy “tax” (as a proxy for energy efficiency), were conducted with respect to the required target flow rate, and their results are reflected in Figure 4 and Figure 5, respectively. The experiments were run for the range of the total flow rate between 2000 and 5500 m3/d with an interval of 500 m3/d. In Figure 4, the heights of the two respective areas indicate the contribution of a given set of activities to the overall energy consumption, while the overall height of the colored area corresponds to the total energy consumption (that is, the objective function value). The two charts in Figure 4 correspond to the two decision-making approaches. Figure 5 reflects the energy “tax” for cases accounting for only fluid lift and overall energy consumption.

5. Discussion

Due to the technological nature of the decision-making criterion, both approaches aim to optimize the performance of pump systems by ensuring that they work as closely as possible to their maximum efficiency. Still, the results presented in Table 2 differ substantially. Approach 1, which balances infrastructural choices with operational decisions, succeeds in ensuring that pump system efficiencies are close to 45%, which is the maximum-achievable value. On the other hand, following the conservative Approach 2, investment-phase decisions are made without the consideration of future operations, and thereby could considerably restrict the efficiency of these operations. Thus, Approach 2 imposes infrastructural restrictions which result in pumps being driven to build up larger pressure boosts to maintain the necessary pressures in the gathering systems and to overcome large pressure losses due to friction. The maximal pump system efficiency achieved in Approach 2 is about 30%. Therefore, one may observe that by integrating appropriate decisions (i.e., infrastructural and operational decisions, and also accounting for hydraulic performance) into one framework that allows them to be balanced, it is possible to achieve a considerable reduction in energy consumption. It should be clear that the developed model, first and foremost, aims to facilitate strategic decision making, as the most important decisions are the infrastructural ones.
The values of the energy “tax” (2.78% for Approach 1 and 4.13% for Approach 2) demonstrate that to produce a unit of energy (in other words, a unit of crude oil), there is a need to use approx. 1.5 times more energy if one follows Approach 2 compared to Approach 1, and this is due to the second approach’s capacity restrictions and the resulting limitations on the efficiency of pump operations. Similar reasoning applies to the computations of CO2 emissions if one assumes that the electrical energy at a remote offshore production site is generated by a unit based on burning fossil fuels (e.g., a diesel generator at a processing platform), or in the case of platform electrification, from an onshore fossil-based power plant (e.g., a coal-based power plant with a Rankine cycle). In these scenarios, Approach 2 will result in 1.5-times larger emissions (and, respectively, a larger carbon tax paid to the authorities) compared to Approach 1.
The results of the sensitivity analysis in Figure 4 demonstrate that the solution produced by Approach 1 is fairly stable across the spectrum of target flow rates. The energy consumption from production and processing the fluid range is from 445 to 463 mln kW·h, and for long-distance transportation it is in the range between 228 and 237 mln kW·h. Thus, total energy consumption ranges from approx. 673 to 700 mln kW·h. At the same time, conservative Approach 2 solutions show a nonlinear/exponential growth in energy consumption both in the upstream and midstream segments, and significantly larger energy consumption values. In this solution, the midstream segment (the green area) starts to play a much more considerable role in overall energy consumption, and it also demonstrates a faster growth as the target flow rate is increased. From the sensitivity analysis, one may observe that the solution developed in Approach 1 allows for considerable flexibility in flow rate while maintaining a fairly stable energy “tax” value of around 2.71…2.81% (Figure 5, diagram on the left). The plot shows minor fluctuations, which could be attributed to the heuristic (i.e., inexact) nature of the produced solutions. Still, the plot is nearly flat, which proves the ability of the pump systems and their VFDs to adapt to changing requirements for target flow rates while maintaining the values of the system’s performance efficiency close to the best efficiency point of approx. 45%. This flexibility is attributed to the selection of considerably high capacities (larger diameters) for the pipeline segments. The solution developed in Approach 2 demonstrates reasonably good (i.e., low) energy “tax” values in the lower range of flow rates; however, the inefficiencies grow exponentially with the growth of the required flow rates. This is attributed to the considerable pipeline throughput limitations imposed by Approach 2, which lead to larger pressure boosts developed by pumps to overcome large pressure losses due to friction in small-diameter pipes. The diagram on the right side of Figure 5 demonstrates similar results to the one on the left; however, the former accounts for the entire push segment of the PSC, unlike the latter which only accounts for the upstream segment.
At this point, the authors would like to acknowledge the limitations of the presented research and suggest directions on how this research could be continued. First and foremost, it has already been stated that the decision-support model presented here has been simplified with the aim of highlighting the main trade-off, that is, between investment-phase infrastructural choices and further operational efficiency. Although the model facilitates strategic decision making, it is presented as a static problem with limited account for long-term time intervals. This research has in part followed an earlier paper [46] which highlights drawbacks (namely, the lack of appropriate hydraulic and geophysical models) in logistics research for the petroleum sector, specifically in the area of infrastructure design. Thus, our suggestion is to apply the lifecycle modeling approach, that is, a dynamic model which would account for changes in the properties of produced petroleum (e.g., how oil cut decreases over time). The lifecycle model will also account for and balance many more aspects, such as the scheduling of oilfield development and production, scheduling processing activities at the FPSO, and scheduling further transportation by shuttle tankers and transmission pipelines. If all these aspects were to be considered together, an economic decision-making criterion (e.g., net present value) would be suitable. Also, employing an economic objective may allow us to address energy consumption from various primary energy sources (e.g., electricity produced from fossil fuels versus that from renewables), and thus, a proper account for carbon taxes could be included in the overall calculations of costs and revenues. Another benefit of the lifecycle approach is that it allows us to directly consider how to balance both investments (or capital expenditures) and operational expenditures.
Another limitation of the presented model is that it does not consider a full spectrum of detail for planning an offshore gathering infrastructure. There are different ways of organizing clusters of wells and laying down connecting pipeline segments. The same also applies to the transmission pipeline structure; instead of considering pump stations at pre-determined locations, this aspect would better be included in the decision variables, which may allow the production of a more economical and energy-efficient solution. In addition, the choice of pumps, given their characteristics, could also be added to the model as a decision variable.
In addition, a somewhat vaster view of the push segment of the petroleum value chain could be addressed. The problem in this study has considered just one small oilfield, one onshore storage unit, and one transmission system. In reality, there are usually several oilfields that could be supplying the midstream segment, and thus oil from various fields gets delivered to the storage depot at the inlet of a refinery. With this in mind, the problem could be extended to include the blending of oil from different fields, as well as, perhaps, scheduling the transportation of different kinds of crude oil to refineries separately.

6. Conclusions

The efficiency of production operations is a crucial factor for engineering departments involved in planning field facilities and infrastructures, as well as for the E&P operators who are ultimately in charge of the operations. This paper has presented a pilot study with the aim of highlighting the need to explore the trade-off between capacity selection and operational efficiency.
The novelty of the presented research and its contribution to both academia and engineering practice lies in directly combining and balancing the issues of infrastructural/capacity choices, operational efficiency, and fairly detailed descriptions of hydraulics (including nonlinear relationships within these infrastructures, i.e., relationships between pipeline diameters, pressures, flow rates, and pipeline segments’ lengths) within one decision-making framework so that appropriate trade-offs can be explored. These issues are traditionally addressed separately, and the appropriate aggregation of these inter-related decision-making aspects has not received enough attention in the literature. The presented research also highlights the need for integrating decision-making within the push segment of the petroleum supply chain, given that this segment is the most dynamic, as new resources and fields are continuously discovered. The theoretical implications of the pilot study presented in this paper relate to existing tendencies of attempting to integrate and balance various aspects of PSC performance within the pool of PSC optimization research. This study, however, aims to incite researchers in engineering logistics to address a sufficient level of technological detail so that the issue of energy efficiency and smart energy use in energy-intensive industries can be the focus for strategic-level decision support.
The use of this model in real-life projects may require including additional specifics for concrete projects, and consequently, there may be a need to elaborate the model to reflect these needed specifics. Among the issues in the push segment of the petroleum supply chain, one may name the need for representing fluid processing capacity, as well as the possibility for the gathering and/or processing capacity expansion; evaluating scheduling options for shuttle tankers and the efficiency of their fuel use; and finally, considering long-distance transmission scheduling. Of course, to address these aspects, additional variables and constraints must be introduced in the decision-making model.
Petroleum is still crucial for the economic and social development of the world, and long-term planning plays a significant role in the push segment of the petroleum supply chain. Therefore, strategic planning, lifecycle assessment, and balancing key logistical/infrastructural and operational issues are essential for any modern energy project. Setting appropriate long-term goals for energy projects is a significant step toward achieving sustainability in the energy sector. The practical implications of this pilot study relate to how logistical trade-offs should be explored and how energy efficiency should be accounted for from the very first steps in any real-life engineering project. At the conceptual design phase for developing a new deposit, or building a transportation system for the delivery of hydrocarbons to a refinery, the achievable efficiency of equipment performance could be explored, and perhaps certain requirements for efficient energy use could be formulated to be followed during the following project phases.
Finally, the contribution of this research is relevant not only to the modern-day petroleum sector, but also to the decarbonized energy systems of the future. Similar issues, technical solutions, and energy efficiency principles are highly relevant to future systems for carbon capture and storage, as well as hydrogen pipeline transportation, which are expected to be widespread and perhaps even take over some existing oil and gas infrastructures.

Author Contributions

Conceptualization, Y.R.; methodology, Y.R.; software, Y.R.; validation, Y.R. and M.B.; formal analysis, Y.R.; investigation, Y.R.; resources, Y.R. and M.B.; data curation, Y.R. and M.B.; writing—original draft preparation, Y.R.; writing—review and editing, Y.R.; visualization, Y.R.; supervision, Y.R. All authors have read and agreed to the published version of the manuscript.

Funding

This research received no external funding.

Data Availability Statement

Data are contained within the article.

Conflicts of Interest

The authors declare no conflict of interest.

References

  1. Santos Manzano, F. Supply Chain Practices in the Petroleum Downstream. Ph.D. Thesis, Massachusetts Institute of Technology, Cambridge, MA, USA, 2005. [Google Scholar]
  2. International Labour Organization. The Future of Work in the Oil and Gas Industry. Opportunities and Challenges for a Just Transition to a Future of Work that Contributes to Sustainable Development; ILO Publishing: Geneva, Switzerland, 2022. [Google Scholar]
  3. Redutskiy, Y. Conceptualization of smart solutions in oil and gas industry. Procedia Comput. Sci. 2017, 109, 745–753. [Google Scholar] [CrossRef]
  4. Rystad (Rystad Energy AS). Decarbonization of Power. In “Energy Transition Solution” Research and Analysis; Rystad Energy Client Portal: Oslo, Norway, 2022. [Google Scholar]
  5. British Petroleum (BP). Statistical Review of World Energy; British Petroleum: London, UK, 2022. [Google Scholar]
  6. Rystad (Rystad Energy AS). Batteries and Storage: What’s in Store for Batteries? In “Battery Solution” Research and Analysis; Rystad Energy Client Portal: Oslo, Norway, 2022. [Google Scholar]
  7. Rystad (Rystad Energy AS). Capital markets and the role of government intervention. In “CCUS Solution” Research and Analysis; Rystad Energy Client Portal: Oslo, Norway, 2023. [Google Scholar]
  8. Rystad (Rystad Energy AS). Decarbonization of the E&P industry—Roadmaps to get there and are they delivering? In “CCUS Solution” Research and Analysis; Rystad Energy Client Portal: Oslo, Norway, 2023. [Google Scholar]
  9. Zhang, A.; Zhang, H.; Qadrdan, M.; Yang, W.; Jin, X.; Wu, J. Optimal planning of integrated energy systems for offshore oil extraction and processing platforms. Energies 2019, 12, 756. [Google Scholar] [CrossRef]
  10. Koh, Q.Y.; Rajoo, S.; Wong, K.Y. Prospects of Energy Recovery in Offshore Oil and Gas Operations. In Proceedings of the 2nd Energy Security and Chemical Engineering Congress; Springer: Malaysia, Singapore, 2022; pp. 1–8. [Google Scholar]
  11. Roussanaly, S.; Aasen, A.; Anantharaman, R.; Danielsen, B.; Jakobsen, J.; Heme-De-Lacotte, L.; Neji, G.; Sødal, A.; Wahl, P.E.; Vrana, T.K.; et al. Offshore power generation with carbon capture and storage to decarbonize mainland electricity and offshore oil and gas installations: A techno-economic analysis. Appl. Energy 2019, 233, 478–494. [Google Scholar] [CrossRef]
  12. Redutskiy, Y. Integration of oilfield planning problems: Infrastructure design, development planning and production scheduling. J. Pet. Sci. Eng. 2017, 158, 585–602. [Google Scholar] [CrossRef]
  13. Devold, H. Oil and Gas Production Handbook. An Introduction to Oil and Gas Production, Transport, Refining and Petrochemical Industry; ABB: Oslo, Norway, 2013. [Google Scholar]
  14. British Petroleum (BP). Technology: Fuelling the Future of Energy; British Petroleum: London, UK, 2016. [Google Scholar]
  15. Sahebi, H.; Nickel, S.; Ashayeri, J. Strategic and tactical mathematical programming models within the crude oil supply chain context—A review. Comput. Chem. Eng. 2014, 68, 56–77. [Google Scholar] [CrossRef]
  16. Chan, S.; Weitz, N.; Persson, Å.; Trimmer, C. SDG 12: Responsible Consumption and Production. A Review of Research Needs. Technical Annex to the Formas Report Research for Agenda 2030; Formas Research Council: Stockholm, Sweden, 2018. [Google Scholar]
  17. Chopra, S.; Meindl, P. Supply Chain Management: Strategy, Planning, and Operation; Edinburgh Gate, Pearson Education Limited: London, UK, 2016. [Google Scholar]
  18. Barrera-Rey, F. The Effects of Vertical Integration on Oil Company Performance; Oxford Institute for Energy Studies: Oxford, UK, 1995. [Google Scholar]
  19. Ahmad, N.K.W.; de Brito, M.P.; Rezaei, J.; Tavasszy, L.A. An integrative framework for sustainable supply chain management practices in the oil and gas industry. J. Environ. Plan. Manag. 2017, 60, 577–601. [Google Scholar] [CrossRef]
  20. Ramachandran, K.; Whitman, L.; Ramachandran, A.B. Criteria for determining the push–pull boundary. In Proceedings of the Industrial Engineering Research Conference, Orlando, FL, USA,, 19–21 May 2002. [Google Scholar]
  21. Hirakawa, Y. Performance of a multistage hybrid push/pull production control system. Int. J. Prod. Econ. 1996, 44, 129–135. [Google Scholar] [CrossRef]
  22. Jeong, I.J. A dynamic model for the optimization of decoupling point and production planning in a supply chain. Int. J. Prod. Econ. 2011, 131, 561–567. [Google Scholar] [CrossRef]
  23. Cachon, G.P. The allocation of inventory risk in a supply chain: Push, pull, and advance-purchase discount contracts. Manag. Sci. 2004, 50, 222–238. [Google Scholar] [CrossRef]
  24. Hussain, R.; Assavapokee, T.; Khumawala, B. Supply chain management in the petroleum industry: Challenges and opportunities. Int. J. Glob. Logist. Supply Chain Manag. 2006, 1, 90–97. [Google Scholar]
  25. Jenkins, G.P.; Wright, D.S. Managing inflexible supply chains. Int. J. Logist. Manag. 1998, 9, 83–90. [Google Scholar] [CrossRef]
  26. Hull, B. A structure for supply-chain information flows and its application to the Alaskan crude oil supply chain. Logist. Inf. Manag. 2002, 15, 8–23. [Google Scholar] [CrossRef]
  27. Gainsborough, M. Building world-class supply chain capability in the downstream oil business. In Business Briefing: Oil and Gas Processing Review; Touch Briefings: Manchester, UK, 2006; pp. 29–32. ISBN 1-905052-47-2. [Google Scholar]
  28. Kunt, T.; Grupa, M.; Varvarezos, D.K. Integrating refinery production planning with primary and secondary distribution network optimization. In Proceedings of the 5th International Conference on Foundations of Computer-Aided Process Operations (FOCAPO2008), Boston, MA, USA, 29 June–2 July 2008. [Google Scholar]
  29. Bredström, D.; Rönnqvist, M. Coordination of Refinery Production and Sales Planning; SNF Report No. 26/08 for Project No. 7985 “Collaboration StatoilHydro”; Samfunns-og Næringslivsforskning (SNF): Oslo, Norway, 2008. [Google Scholar]
  30. Camponogara, E.; Plucenio, A. Scheduling dynamically positioned tankers for offshore oil offloading. Int. J. Prod. Res. 2014, 524, 7251–7261. [Google Scholar] [CrossRef]
  31. Assis, L.S.; Camponogara, E. A MILP model for planning the trips of dynamic positioned tankers with variable travel time. Transp. Res. E Logist. Transp. Rev. 2016, 93, 372–388. [Google Scholar] [CrossRef]
  32. Diz, G.S.D.S.; Oliveira, F.; Hamacher, S. Improving maritime inventory routing: Application to a Brazilian petroleum case. Marit. Policy Manag. 2017, 44, 42–61. [Google Scholar] [CrossRef]
  33. Diz, G.S.D.S.; Hamacher, S.; Oliveira, F. A robust optimization model for the maritime inventory routing problem. Flex. Serv. Manuf. J. 2019, 31, 675–701. [Google Scholar] [CrossRef]
  34. Assis, L.S.; Camponogara, E.; Menezes, B.C.; Grossmann, I.E. An MINLP formulation for integrating the operational management of crude oil supply. Comput. Chem. Eng. 2019, 123, 110–125. [Google Scholar] [CrossRef]
  35. Assis, L.S.; Camponogara, E.; Grossmann, I.E. A MILP-based clustering strategy for integrating the operational management of crude oil supply. Comput. Chem. Eng. 2021, 145, 107161. [Google Scholar] [CrossRef]
  36. Li, H.; Huang, W.; Li, R.; Yu, M.; Tai, N.; Zhou, S. The multi-visit-multi-voyage scheduling of the heterogeneous shuttle tanker fleet via inventory-oriented joint planning. Appl. Energy 2023, 334, 120354. [Google Scholar] [CrossRef]
  37. Yang, A.; Wang, R.; Sun, Y.; Chen, K.; Chen, Z. Coastal shuttle tanker scheduling model considering inventory cost and system reliability. IEEE Access 2020, 8, 193935–193954. [Google Scholar] [CrossRef]
  38. Lee, H.; Pinto, J.M.; Grossmann, I.E.; Park, S. Mixed-integer linear programming model for refinery short-term scheduling of crude oil unloading with inventory management. Ind. Eng. Chem. Res. 1996, 35, 1630–1641. [Google Scholar] [CrossRef]
  39. Pinto, J.M.; Moro, L.F.L. A planning model for petroleum refineries. Braz. J. Chem. Eng. 2000, 17, 575–586. [Google Scholar] [CrossRef]
  40. Más, R.; Pinto, J.M. A mixed-integer optimization strategy for oil supply in distribution complexes. Optim. Eng. 2003, 4, 23–64. [Google Scholar] [CrossRef]
  41. Neiro, S.M.; Pinto, J.M. A general modeling framework for the operational planning of petroleum supply chains. Comput. Chem. Eng. 2004, 28, 871–896. [Google Scholar] [CrossRef]
  42. Aires, M.; Lucena, A.; Rocha, R.; Santiago, C.; Simonetti, L. Optimizing the petroleum supply chain at Petrobras. Comput. Aided Chem. Eng. 2004, 18, 871–876. [Google Scholar]
  43. Rocha, R.; Grossmann, I.E.; de Aragão, M.V.P. Petroleum allocation at Petrobras: Mathematical model and a solution algorithm. Comput. Chem. Eng. 2009, 332, 2123–2133. [Google Scholar] [CrossRef]
  44. Robertson, G.; Palazoglu, A.; Romagnoli, J.A. A multi-level simulation approach for the crude oil loading/unloading scheduling problem. Comput. Chem. Eng. 2011, 35, 817–827. [Google Scholar] [CrossRef]
  45. Yang, Y.; He, R.; Yu, G.; Du, W.; Yang, M.; Du, W. Efficient rolling horizon approach to a crude oil scheduling problem for marine-access refineries. Comput. Chem. Eng. 2023, 170, 108121. [Google Scholar] [CrossRef]
  46. Garcia-Verdier, T.G.; Gutierrez, G.; Méndez, C.A.; Palacín, C.G.; de Prada, C. Optimization of crude oil operations scheduling by applying a two-stage stochastic programming approach with risk management. J. Process Control 2024, 133, 103142. [Google Scholar] [CrossRef]
  47. Garcia-Verdier, T.G.; Gutierrez, G.; Mendez, C.; de Prada, C. Optimizing the monthly scheduling of crudes in a terminal-refinery system. IFAC-PapersOnLine 2023, 56, 7414–7419. [Google Scholar] [CrossRef]
  48. Punte, S.; Tavasszy, L.; Baeyens, A.; Liesa, F. Roadmap towards Zero Emissions Logistics 2050; The European Technology Platform (ETP)—Alliance for Logistics Innovation through Collaboration in Europe (ALICE): Brussels, Belgium, 2019; Available online: https://www.etp-logistics.eu/wp-content/uploads/2019/12/Alice-Zero-Emissions-Logistics-2050-Roadmap-WEB.pdf (accessed on 1 December 2023).
  49. Hong, B.; Li, X.; Di, G.; Song, S.; Yu, W.; Chen, S.; Li, Y.; Gong, J. An integrated MILP model for optimal planning of multi-period onshore gas field gathering pipeline system. Comput. Chem. Eng. 2020, 146, 106479. [Google Scholar] [CrossRef]
  50. Hong, C.; Wang, Y.; Estefen, S.F. A MINLP model for the layout design of subsea oil gathering-transportation system in deep water oil field considering avoidance of subsea obstacles and pipe intersections. Ocean Eng. 2023, 277, 114278. [Google Scholar] [CrossRef]
  51. Hong, C.; Estefen, S.F.; Wang, Y.; Lourenco, M.I. Mixed-integer nonlinear programming model for layout design of subsea satellite well system in deep water oil field. Autom. Constr. 2021, 123, 103524. [Google Scholar] [CrossRef]
  52. Takács, G. Electrical Submersible Pumps Manual: Design, Operations, and Maintenance; Gulf Professional Publishing: Houston, TX, USA, 2009. [Google Scholar]
  53. Khakimyanov, M.; Shafikov, I.; Khusainov, F. Electric submersible pumps in oil production and their efficiency analysis. In Proceedings of the International Conference on Applied Innovation in IT at Anhalt University of Applied Sciences, Koethen, Germany, 10 March 2016; Volume 4, pp. 35–38. [Google Scholar]
  54. Worrell, E.; Galitsky, C. Energy Efficiency Improvement and Cost Saving Opportunities for Petroleum Refineries; Energy Star—U.S. Environmental Protection Agency: Washington, DC, USA, 2005. [Google Scholar]
  55. Guo, B.; Song, S.; Ghalambor, A. Offshore Pipelines: Design, Installation, and Maintenance; Gulf Professional Publishing: Houston, TX, USA, 2013. [Google Scholar]
  56. Lurie, M.V. Pipeline Transportation of Oil and Gas; Oil and Gas: Moscow, Russia, 2021; ISBN 978-5-91961-357-2. [Google Scholar]
  57. Duran, M.A.; Grossmann, I.E. An outer-approximation algorithm for a class of mixed-integer nonlinear programs. Math. Program. 1986, 36, 307–339. [Google Scholar] [CrossRef]
  58. Floudas, C.A. Nonlinear and Mixed-Integer Optimization: Fundamentals and Applications; Oxford University Press: Oxford, UK, 1995. [Google Scholar]
  59. The Norwegian Petroleum Directorate. Conversion: Energy Calculator; The Norwegian Petroleum Directorate: Oslo, Norway, 2023; Available online: https://www.norskpetroleum.no/en/calculator/about-energy-calculator (accessed on 1 December 2023).
Figure 1. Typical segments of the petroleum value chain. Based on [14].
Energies 17 00388 g001
Figure 2. Decoupling point within the petroleum value chain.
Energies 17 00388 g002
Figure 3. Push segment of the petroleum supply chain.
Energies 17 00388 g003
Figure 4. Sensitivity analysis: overall energy consumption vs. target flow rate for the two decision-making approaches.
Energies 17 00388 g004
Figure 5. Sensitivity analysis: energy “tax” vs. target flow rate.
Energies 17 00388 g005
Table 1. Notations for the decision-making model.
NotationDescription
Indices
i Petroleum-producing wells, i 1 . . . N W
j Segments of the long-distance transmission pipeline, j 1 . . . N P
l Pipeline capacity/diameter options, l 1 . . . N P C or l 1 . . . N T C
Parameters
N W Number of wells
N P Number of long-distance transmission pipeline segments
N P C Number of pipeline capacities for the seabed infrastructure
N T C Number of pipeline capacities for the long-distance transmission infrastructure
H i Depth of well i , m
H S Depth of the seabed, m
T D i Production tubing diameter of well i , m
D l S B Diameter of option l of the pipes for the seabed structures, m
D l L D Diameter of option l of the pipes for the long-distance transmission, m
L i Length of the pipeline segment connecting well i with gathering unit, m
L j P S Length of the transmission pipeline segment j , m
Δ Duration of the considered period (one year) expressed in hours, h
N P U Power of the processing units (pumps, dehydrators, heaters) at the platform, kW
H f Energy consumed by a shuttle tanker over one trip expressed in kW·h
Q F P S O Storage capacity of the FPSO platform, m3
ρ Density of the produced fluid, kg/m3
g Standard acceleration due to gravity, m/s2
C Dimensionless pipe age factor (120 for new pipes and 94…100 for old pipes)
f m a x The highest allowed alternating current frequency, Hz
f 0 Base frequency of the AC, that is, 60 Hz
η m a x Maximal achievable efficiency of the ESP system, fraction
q m a x Maximal flow rate from one production well, m3/d
o c Oil cut, i.e., portion of oil in the produced fluid, fraction
q t a r g e t Target total oil flow rate, m3/d
a 0 , a 1 , a 2 Coefficients for approximating pump systems’ performance characteristics
Variables
q i Production rate from well i , m3/d
f i E S P Frequency of the AC powering ESP in well i , Hz
p i B H Bottomhole pressure in well i , Pa
p i W H Wellhead pressure in well i , Pa
p i T D Total developed pressure by ESP in well i , Pa
η i E S P Efficiency of ESP system in well i , fraction
N i H L Hydraulic lift power required of ESP system in well i , kW
N j L D Power required to push the petroleum through segment j of the long-distance pipeline, kW
p G U Pressure at the gathering unit, Pa
d i P S Pipeline diameter connecting well i to the gathering system, m
q o i l Oil flow rate from the entire field, m3/d
P D Long-distance transmission pipeline diameter, m
p j P S Total developed pressure by the pump station j , Pa
f j P S Frequency of the AC powering the pump at pump station j , Hz
η j P S Efficiency of the pump station j , fraction
p j L D Pressure at the start of the long-distance pipeline’s segment j , Pa
y i , l Binary: 1, if well i is connected to the gathering system with pipeline capacity option l 1 . . N P C ; 0, otherwise.
z l Binary: 1, if long-distance pipeline diameter option l 1 . . . N T C is chosen; 0, otherwise.
Table 2. Modeling results for the example of well #1.
ValueApproach 1Approach 2
q 1 396.54 m3/d392.70 m3/d
f 1 E S P 67.70 Hz97.55 Hz
p 1 T D 13.75 MPa17.12 MPa
η 1 E S P 44.51%29.51%
d 1 P S 304.8 mm (12″)101.6 mm (4″)
q o i l 4500 m3/d4500 m3/d
p P S 5.59 MPa10.05 MPa
η P S 44.64%32.77%
P D 1219.2 mm (48″)609.6 mm (24″)
ValueApproach 1Approach 2
Disclaimer/Publisher’s Note: The statements, opinions and data contained in all publications are solely those of the individual author(s) and contributor(s) and not of MDPI and/or the editor(s). MDPI and/or the editor(s) disclaim responsibility for any injury to people or property resulting from any ideas, methods, instructions or products referred to in the content.

