Abstract
In the future, the development of a zero-carbon economy will require large-scale hydrogen storage. This article addresses hydrogen storage capacities, a critical issue for large-scale hydrogen storage in geological structures. The aim of this paper is to present a methodology to evaluate the potential for hydrogen storage in depleted natural gas reservoirs and estimate the capacity and energy of stored hydrogen. The estimates took into account the recoverable reserves of the reservoirs, hydrogen parameters under reservoir conditions, and reservoir parameters of selected natural gas reservoirs. The theoretical and practical storage capacities were assessed in the depleted natural gas fields of N and NW Poland. Estimates based on the proposed methodology indicate that the average hydrogen storage potential for the studied natural gas fields ranges from 0.01 to 42.4 TWh of the hydrogen energy equivalent. Four groups of reservoirs were distinguished, which differed in recovery factor and technical hydrogen storage capacity. The issues presented in the article are of interest to countries considering large-scale hydrogen storage, geological research organizations, and companies generating electricity from renewable energy sources.
1. Introduction
Climate change is currently observed, and its effects are experienced on all continents. Recent IPCC reports confirm that it is caused by human anthropogenic interferences with respect to the climate system. Combating climate change is a global challenge. Reducing the emission of gases responsible for the greenhouse effect, which results in negative changes in the Earth’s climate, is a challenge humanity faces. The effective reduction in greenhouse gas emissions is supported by international regulations established by the Framework Convention (1992), the Kyoto Protocol (1997), and the Paris Agreement (2015).
The European Union and its member states are leading efforts to significantly reduce anthropogenic CO2 emissions (the gas with the greatest impact on climate change). The first step towards a zero-carbon economy was the introduction of the EU Emissions Trading Scheme (EU ETS) in 2005. New regulations and policy initiatives are being developed to guide member states towards a green transition by significantly reducing CO2 emissions, such as the “Green Deal” [1], “Fit for 55”, or European climate law. In the European Climate Law published in 2021, member states committed to reducing net greenhouse gas emissions in the EU by at least 55% by 2030 compared to 1990 levels. As part of the “Fit for 55” package, an amendment to the directive on renewable energy sources can increase the share of renewable energy sources in the overall energy mix from 32% to at least 40% by 2030. The “Fit for 55” package also includes a gas and hydrogen package, which proposes changes to existing and new regulations aimed at the transition from natural gas to renewable and low-emission gases and their deployment in the EU by 2030 and beyond [2].
It is assumed that a reduction in CO2 emissions in the EU member states will be possible by replacing fossil fuels with clean energy sources. Shifting the economy to renewable energy sources involves the implementation of a hydrogen economy. Hydrogen is now considered a key to achieving the goals of the European Green Deal, as well as the clean energy transition of the EU member states. In the 2020s, the European Commission (EC) announced the Hydrogen Strategy for a Climate Neutral Europe [3]. The strategy indicates that low-carbon hydrogen (a priority in the short to medium term) and renewable hydrogen (a priority in the 2050 horizon) have the potential to reduce greenhouse gas emissions before 2030. This is because the use of hydrogen can allow the substitution of fossil fuels in sectors where decarbonization is difficult. It is estimated that the share of hydrogen in the European energy mix could increase from its current level of less than 2% to 13–14% by 2050 [3].
In Poland, strategic documents related to issues of the hydrogen economy have also been published. The document “Energy Policy of Poland until 2040” includes the following objectives: increasing the security of energy and fuel supplies, increasing the use of renewable energy, and reducing the environmental impact of energy production [4]. A strategic document entitled “Polish Hydrogen Strategy until 2030 with Perspectives until 2040” was adopted in 2021. This document indicates the objectives and actions that must be taken to achieve the intended effects. The most important objective set out in the Polish Hydrogen Strategy is to build and develop a national hydrogen economy in order to achieve climate neutrality and maintain a competitive Polish economy [5].
Hydrogen can be produced from renewable energy via electrolysis (“green hydrogen”), natural gas, or coal with CO2 capture (“blue hydrogen”). Future energy is expected to come mainly from renewable sources (wind and solar power plants) [6].
The introduction of a hydrogen economy will allow an increased share of renewable energy in the total energy balance because of the possibility of storing multi-megawatt power energy, e.g., by conversion to hydrogen. Hydrogen can be stored in a variety of ways in metal tanks on and below the ground, in gas networks as a mixture of H2 with natural gas, in materials, or underground in deep geological structures. The underground storage of hydrogen in geological structures is considered to be the most promising form of hydrogen storage. Underground storage has numerous advantages over other storage options, and the ability to store large volumes of gas and the safety of storage are among the most important [7].
1.1. Hydrogen Storage in Natural Gas Deposits
Currently, underground hydrogen storage is being considered in salt caverns, depleted natural gas and oil deposits, and aquifers. To date, experience with underground hydrogen storage on an industrial scale is limited to salt caverns [8,9,10]. Hydrogen storage in porous rocks has so far been in the research and testing phase. The first test facilities have been commissioned in depleted gas fields in Austria and Argentina [9,11].
The rock formations for hydrogen storage must have adequate porosity and permeability, and the overburden rocks must guarantee the integrity of storage sites [12,13]. These conditions are met via depleted natural gas deposits [14,15], which occur in traps shaped by geological factors and processes, resulting in gas reservoirs [16]. The construction of hydrogen storage facilities in natural gas fields also has the advantage that geological and reservoir parameters are well recognised, and existing wells and surface equipment can be (at least partially) reused [13,17].
Natural gas deposits are often converted to gas storage facilities after they have been depleted. Depleted natural gas reservoirs are saturated with gas and, to varying degrees, reservoir water [13,18].
In a hydrogen storage site, as in any underground gas storage, working gas and cushion gas are present [19,20]. Working gas (hydrogen) is injected and then withdrawn from the storage facility at the time of demand, while cushion gas remains in a reservoir and is designed to maintain pressure during storage operations [21,22]. In addition to methane and hydrogen, various cushion gases are being considered, for example, carbon dioxide or nitrogen [17,18]. The use of other cushion gases is considered for environmental reasons (CO2 as a means of reducing emissions) [23] or economic reasons (nitrogen or methane) [24]. In the case of natural gas reservoirs, the remaining methane in the trap can reduce the amount of cushion gas, but due to the processes that take place during storage, gas mixing can occur, resulting in the contamination of hydrogen withdrawal [25]. However, the use of a buffer gas other than hydrogen may adversely affect the purity of the injected H2 [8]. The degree of mixing of cushion gas and injected gas and the interactions between gas and liquid phases in storage sites are not known. Experiments with natural gas storage have shown limited mixing between these gases [19], but in the case of hydrogen, these processes have not been fully recognised [18,26]. The amount of cushion gas in underground facilities in natural gas deposits is approximately 50–60% of the working gas, while in aquifers, it is 80% [13,27]. In the case of hydrogen storage in natural gas deposits, the phase balance between methane and hydrogen will also be an important aspect. As research shows, in order to maintain hydrogen in a single vapor phase during transport and storage, maintaining appropriate pressure and temperature is necessary [28]. Phase equilibrium calculations for the production of natural hydrogen in various geological conditions can be used for underground hydrogen storage and carbon dioxide storage [29].
When developing underground hydrogen storage in depleted gas fields, it is important to stop gas production as soon as possible. This makes it possible to build a storage facility within a shorter period of time and at lower costs. Typically, newly constructed underground gas storage facilities reach their intended performance in about five years [21]. In the case of depleted gas reservoirs, the maximum underground gas pressure is often higher than the original reservoir pressure; thus, more gas can be stored than was initially in the reservoir [11].
1.2. Assessment of Hydrogen Storage Capacity in Geological Structures
Geological structures in aquifers have the highest hydrogen storage capacity. The storage capacity of exploited hydrocarbon deposits is determined by the size of the reservoir. The storage capacity of salt caverns depends on the amount of leached salt and the thickness of the salt bed [30].
Hydrogen storage capacities in different geological structures have been estimated by many authors. Most assessments have been country or area specific. Caglayan et al. presented an assessment of storage capacity in salt deposits on a European scale [31]. Estimates of the potential for hydrogen storage from salt deposits have been developed on a country scale for Poland [30,32], the Netherlands [33], Australia [34], and the United Kingdom [14]. The potential for H2 storage in salt deposits in the Intermountain West Region of the USA [14] and onshore salt deposits in Australia [33] and Southern Ontario, Canada [35] has also been evaluated.
Attempts have also been made to assess the hydrogen storage capacity of porous rocks (aquifers and hydrocarbon reservoirs). The HyUSPRe project analysed the potential for hydrogen storage in aquifers and hydrocarbon reservoirs (including operating gas storage sites) [36]. Hydrogen storage capacities in aquifers and oil and gas reservoirs have also been estimated for some countries, e.g., Italy [37], Germany [38], Ireland [39], and Australia [40]. Capacity assessments have also been carried out for depleted natural gas fields in Northern California [41] or gas storage sites in the US [42]; aquifers and gas fields of the UK continental shelf [43] and Norway [44]; and natural gas fields in Argentina [45]. Qiu et al. analysed depleted hydrocarbon fields and salt caverns in an integrated energy system based on potential UHS scenarios in different regions of China [46].
Hydrogen storage capacities were assessed using methods depending on the type of geological structure. In salt rocks, hydrogen storage capacities can be determined based on the geological and mining conditions present in salt deposits [47] or in the form of maps showing the amount of energy that can be stored in an analysed area [30]. Estimates of the hydrogen storage capacity in porous rocks were carried out using static or dynamic methods. Static assessments are based on the determination of the volume of pore space that can be filled with stored hydrogen [38]. Static storage capacities can be assessed at the regional scale or for individual geological structures [36], while dynamic storage capacities are most often determined at the scale of structures via hydrodynamic modelling methods [48,49].
Hydrogen storage capacities in natural gas reservoirs are evaluated on the basis of the size of the pore space potentially available for the storage of this gas (e.g., [25,43,44,45]) or on the basis of the size of the recoverable reserves of gas (e.g., [44,50,51]). The hydrogen storage potential is defined as the mass of gas or the amount of energy that can be stored as hydrogen.
1.3. Purpose of Research
The shift to zero-carbon economies in EU Member States requires an increase in the share of renewables in the energy mix and the implementation of a hydrogen economy. The implementation of these solutions requires an assessment of the potential for the underground storage of this gas. In view of the envisaged future underground storage of surplus production from renewable sources in the form of hydrogen, the energy sector and other industries are awaiting information on the possibilities in this regard.
Currently, there is no uniform selection methodology for assessing the hydrogen storage potential in natural gas deposits. The article proposes an assessment of hydrogen storage capacity based on a pyramid (capacity: theoretical, practical, and adjusted). The method of estimating theoretical and practical capacities proposed in the article is based on the assessment of the size of the pore space of the gas deposit. Due to the small amount of data required to assess storage capacities, the proposed methodology can be used for the initial assessment of the possibility of storing H2 in gas deposits. The methodology is universal and can be used in various geological regions.
Using the proposed methodology, a preliminary assessment of the possibilities of underground hydrogen storage in natural gas deposits in the Polish Lowlands was carried out. So far, no comprehensive assessment of the hydrogen storage potential in natural gas deposits in Poland has been performed. Estimates of the static hydrogen storage capacity were made (the HyUSPRe and Hystories projects) with respect to several natural gas deposits. The article analyses gas deposits accumulated in the most important gas-bearing formations in Poland (Lower and Upper Permian formations). This research study aims to identify prospective deposits for this purpose and assesses the potential for storing hydrogen there. Clustering helped identify a group of deposits that can be used to store hydrogen first.
2. Materials and Methods
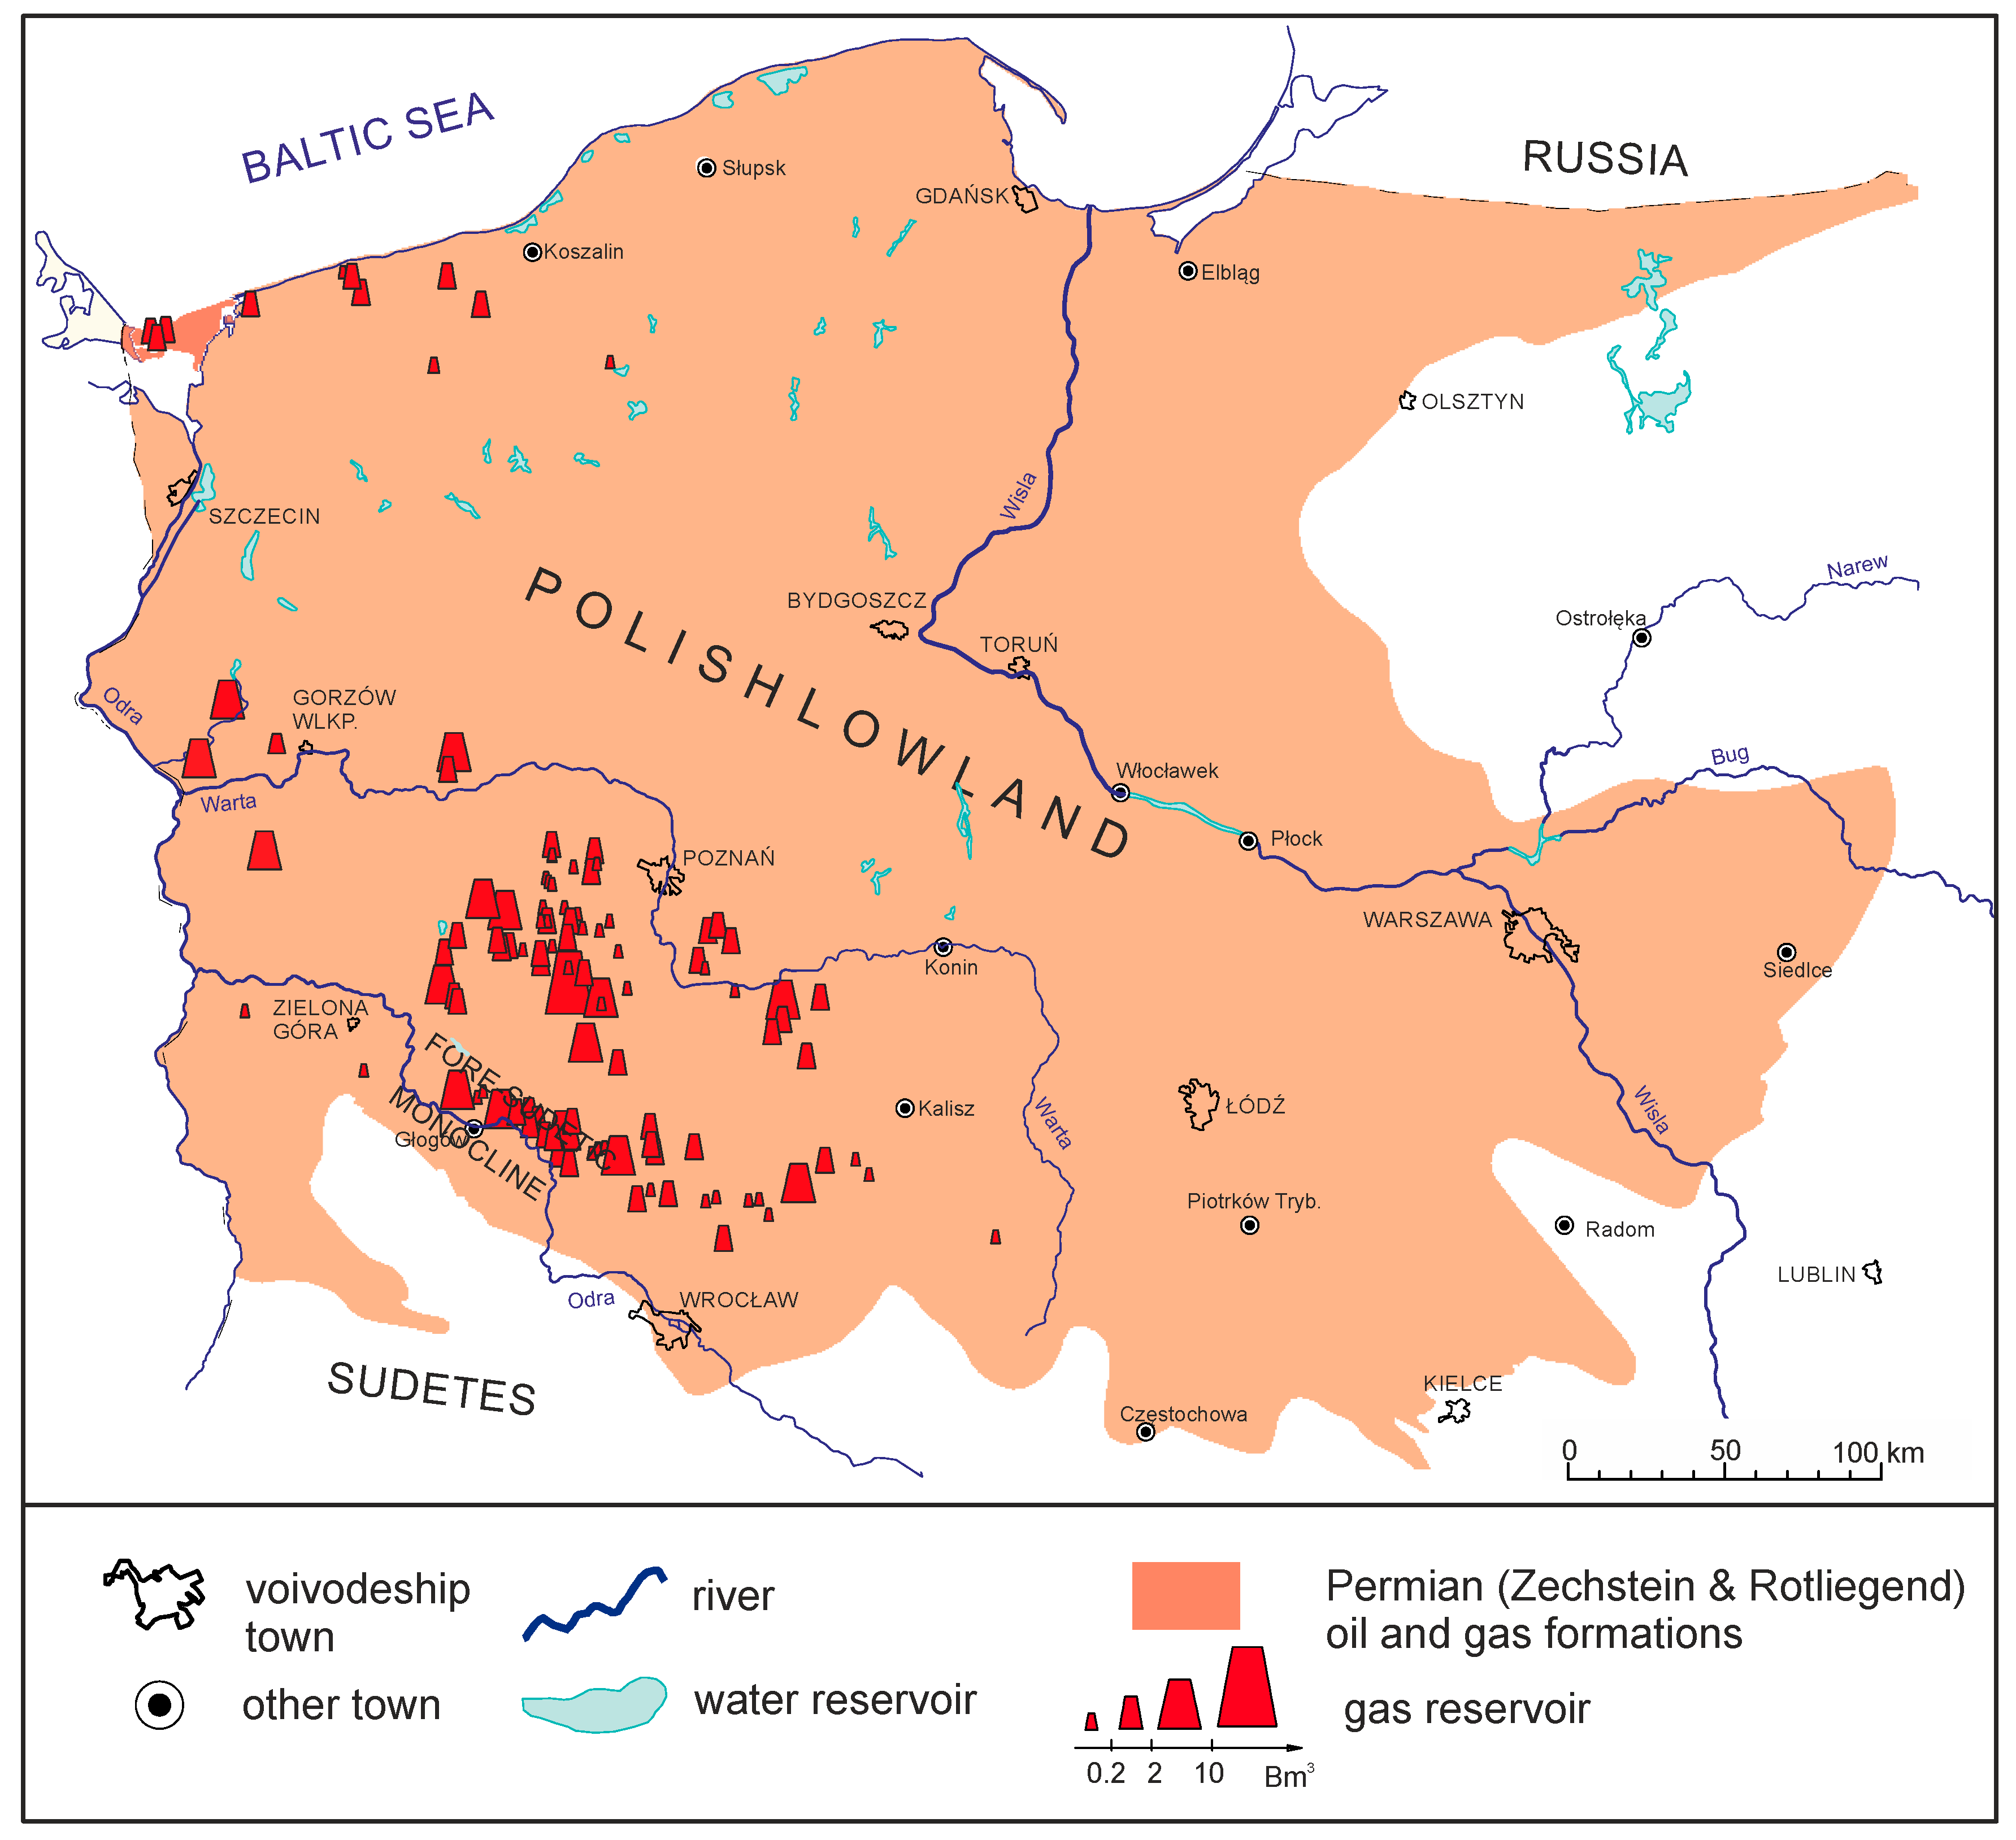
An analysis of hydrogen storage capacities was performed for natural gas deposits located in the Polish Lowlands (western and north-western Poland) (Figure 1). In this area, gas is accumulated in Permian formations (Rotliegend and Zechstein limestone). Natural gas deposits in the Rotliegend occur in sandstones of aeolian origins and to a lesser extent in sandstones of fluvial origins. The discovered and exploited conventional gas deposits in the Polish Rotliegend Basin occur in stratigraphic and structural traps at average depths from 1000 to 4000 m below sea level. A total of 89 natural gas deposits have been documented in the Upper Rotliegend Basin [52]. In the analysed area, natural gas deposits also occur in the carbonate formations of Zechstein limestone, in which 21 deposits of 22,365.79 mln m3 have been documented [53].
An analysis of 114 natural gas deposits included in the annually published Mineral Resources of Poland [54] was carried out. Data on geological and reservoir parameters, as well as resources, were obtained from the MIDAS database [55].
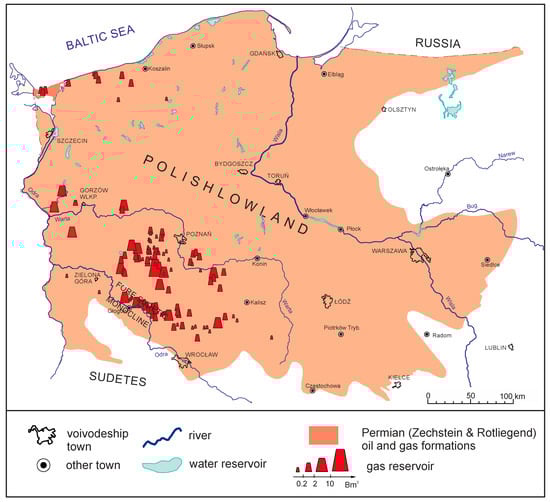
Figure 1.
Natural gas deposits in Permian formations in the Polish Lowlands (based on [56]).
Figure 1.
Natural gas deposits in Permian formations in the Polish Lowlands (based on [56]).
The capacity was estimated for natural gas deposits selected for underground hydrogen storage based on the following criteria adopted from the literature: type of mineral, depth, temperature, and reservoir pressure [41]. The analysis did not cover oil–gas and condensate reservoirs with reserves of less than 1 million m3 of gas, reservoirs at a depth of more than 3000 m, and reservoirs where the pressure gradient is greater than 0.1.
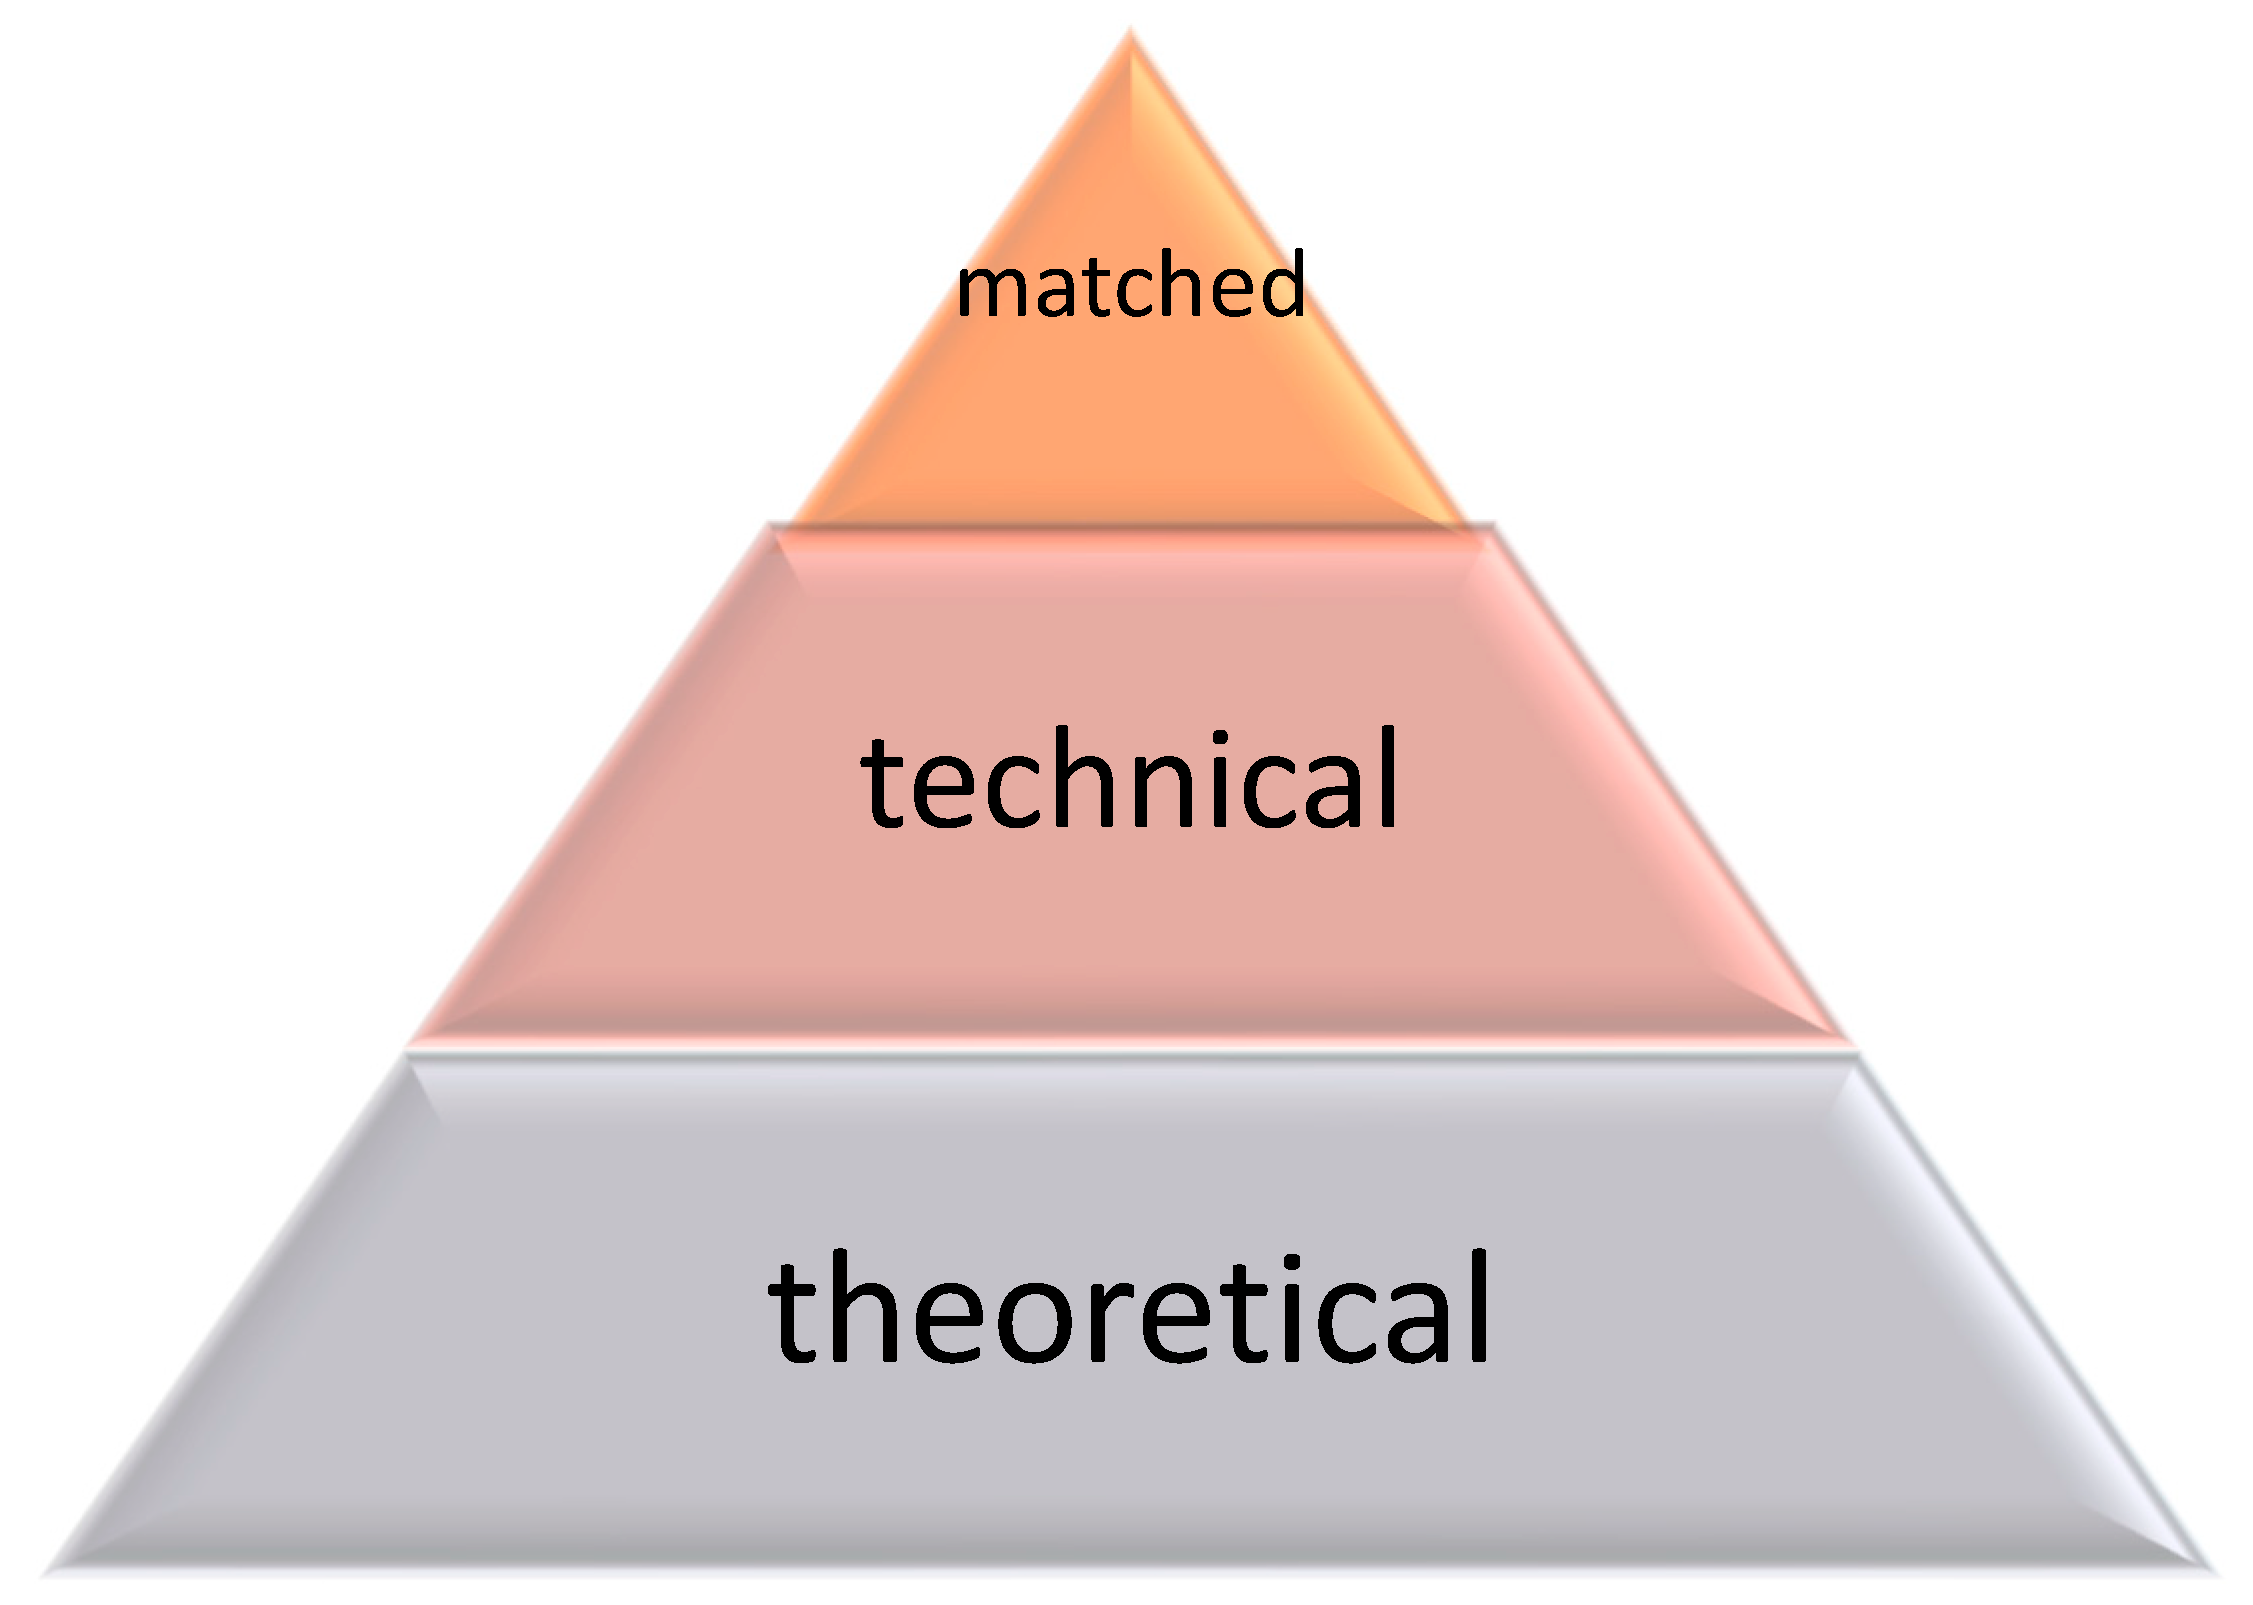
The potential for hydrogen storage in natural gas reservoirs in the Polish Lowlands was estimated for the capacity categories as delineated in the storage capacity pyramid. The use of capacity categories from the modified pyramid of CO2 storage capacities was proposed [57]. The distinction between theoretical, technical, and adjusted capacities in the pyramid was proposed (Figure 2).
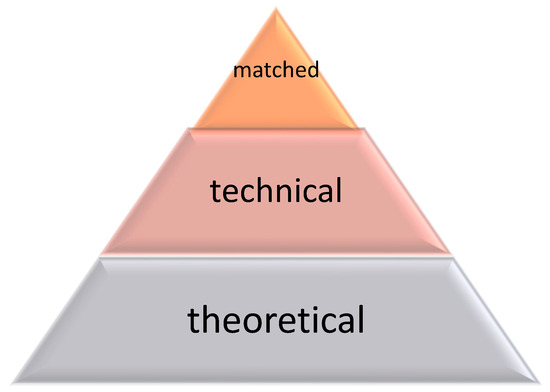
Figure 2.
Pyramid of hydrogen storage capacities.
The theoretical storage capacity is the maximum total amount of hydrogen that a geological structure can store. It is assumed that the entire pore volume is available for storage. The technical storage capacity is part of the theoretical capacity. This is the capacity that may be available for storage, taking into account the technical criteria resulting from the adopted storage technology. The adjusted capacity is part of the technical capacity, and it is obtained by comparing storage needs with the capacity of the storage site.
As part of the evaluation of the H2 storage potential, the following were calculated: theoretical and technical hydrogen storage capacities. The maximum (theoretical) hydrogen storage capacity in natural gas deposits was calculated based on the primary recoverable resource (RG), which is the volume of gas that can be extracted from a deposit, taking into account the gas expansion factor (GEF) and hydrogen density under reservoir conditions (ρH2) [44]:
where denotes the theoretical hydrogen storage capacity (Mt);
- RG denotes the original exploitable resources (mld m3);
- GEF denotes the gas expansion factor;
- denotes hydrogen density in the reservoir condition (kg/m3).
Due to the lack of gas expansion factor data, an estimate was made based on GEF values for natural gas fields located in Permian formations in Germany [58]. The GEF value for each deposit was calculated based on the following equation:
where p denotes reservoir pressure (MPa).
The hydrogen density was calculated as mass using the Nobel–Abel equation of states [59]:
where: denotes density;
- P denotes pressure;
- R denotes the gas constant 4160 J/kg·K for hydrogen [60];
- T denotes temperature;
- b denotes the covolume 15.84 cm3/mol for hydrogen [61].
The technical hydrogen storage capacity was estimated as the part of the reservoir volume that can be used as a working gas [38,43,51]. A formula was used to estimate this capacity [51]:
Here, UG denotes the fraction of the storage volume that can be used for working gas.
Moulin Castilio et al. proposed that the UG value should be in the range of 0.5 to 0.8 [51]. The first value (0.5) was adopted based on the results of the analysis of the possibility of converting the gas storage facility in the Rough gas field (UK) to hydrogen storage, where the UG value was found to range from 0.55 to 0.45 [25]. The second value takes into account the limitation resulting from the fact that in the case of hydrogen storage in a gas reservoir, part of the buffer gas is not a recycle gas (natural gas). In this case, the working gas (hydrogen) must constitute at least 20% of the buffer gas. This limitation is taken into account by the 0.8 factor in the equation. In the calculations, UG was assumed to be 0.5 if the bed depletion factor exceeded 60% and 0.8 if the depletion factor was less than 60% [51].
The hydrogen mass was converted to a hydrogen energy equivalent using a higher heating value (HHV) for hydrogen—39.41 kWh/kg [62].
3. Results and Discussion
The quantity of hydrogen that can be stored in gas fields in western and north-western Poland was estimated for 114 fields. The analysed fields have very different primary resources ranging from about 8.75 million m3 up to 61,922.5 million m3 (Table 1). The deposits are also located at various depths, from about 1000 to 4000 m below sea level, which translates into differential pressures and reservoir temperatures.

Table 1.
Descriptive statistics of geological and reservoir parameters of natural gas fields in the Polish Lowlands.
The parameters of the analysed natural gas reservoirs, such as resources, depth, pressure, and recovery factor, are characterised by high variability, while the temperature characteristic has less variability (Table 1). The kurtosis values for depth, pressure, temperature, and recovery factor indicate a weak concentration of values around the averages. Due to the high value of the cluster factor, there is a higher concentration of trait values around the mean only for resources. The analysed parameters are also characterised by an asymmetrical distribution. The values for resources and pressure have a right-skewed distribution (the right arm of the distribution is elongated). On the contrary, the other parameters have a left-skewed distribution (the left arm of the distribution is elongated).
The high variability of the size of primary resources of the analysed deposits is reflected in the results of calculations of the amount of hydrogen that can be stored in the analysed deposits (Table 2). The H2 storage capacity and H2 energy equivalent are characterised by high variability. For most deposits, the values of the analysed parameters are higher than average (left asymmetry), and a concentration of values of these parameters around the average is observed.
Table 2.
Descriptive statistics of the hydrogen storage capacity in natural gas fields in the Polish Lowlands.
The parameters of the analysed natural gas reservoirs, such as resources, depth, pressure, and recovery factor, are characterised by high variability, while the temperature characteristic has less variability (Table 1). The kurtosis values for depth, pressure, temperature, and recovery factor indicate a weak concentration of values around the averages. Due to the high cluster factor value, there is a higher concentration of trait values around the mean only for resources. The analysed parameters are also characterised by an asymmetrical distribution. The values for resources and pressure have a right-skewed distribution (the right arm of the distribution is elongated). On the contrary, the other parameters have a left-skewed distribution (the left arm of the distribution is elongated).
The high variability of the size of primary resources of the analysed deposits is reflected in the results of the calculations of the amount of hydrogen that can be stored in the analysed deposits (Table 2). The H2 storage capacity and H2 energy equivalent are characterised by high variability. For most deposits, the values of the analysed parameters are higher than average (left asymmetry), and a concentration of values of these parameters around the average is observed.
Hydrogen storage capacities in natural gas fields were analysed in groups created from cluster analysis. The purpose of cluster analysis itself is to find similarities between objects in a certain set. Similarity between objects can be found using distance measures (e.g., city distance, Euclidean distance, and Chebyshev distance) or similarity measures. The resulting clusters are ensembles of objects in the series under study that are more similar to each other than to other objects (between groups).
Cluster analysis was performed on variables selected on the basis of correlation analysis between features and the elimination of strongly related variables. Clustering was performed on the degree of the depletion of the reservoir and technical hydrogen storage capacity.
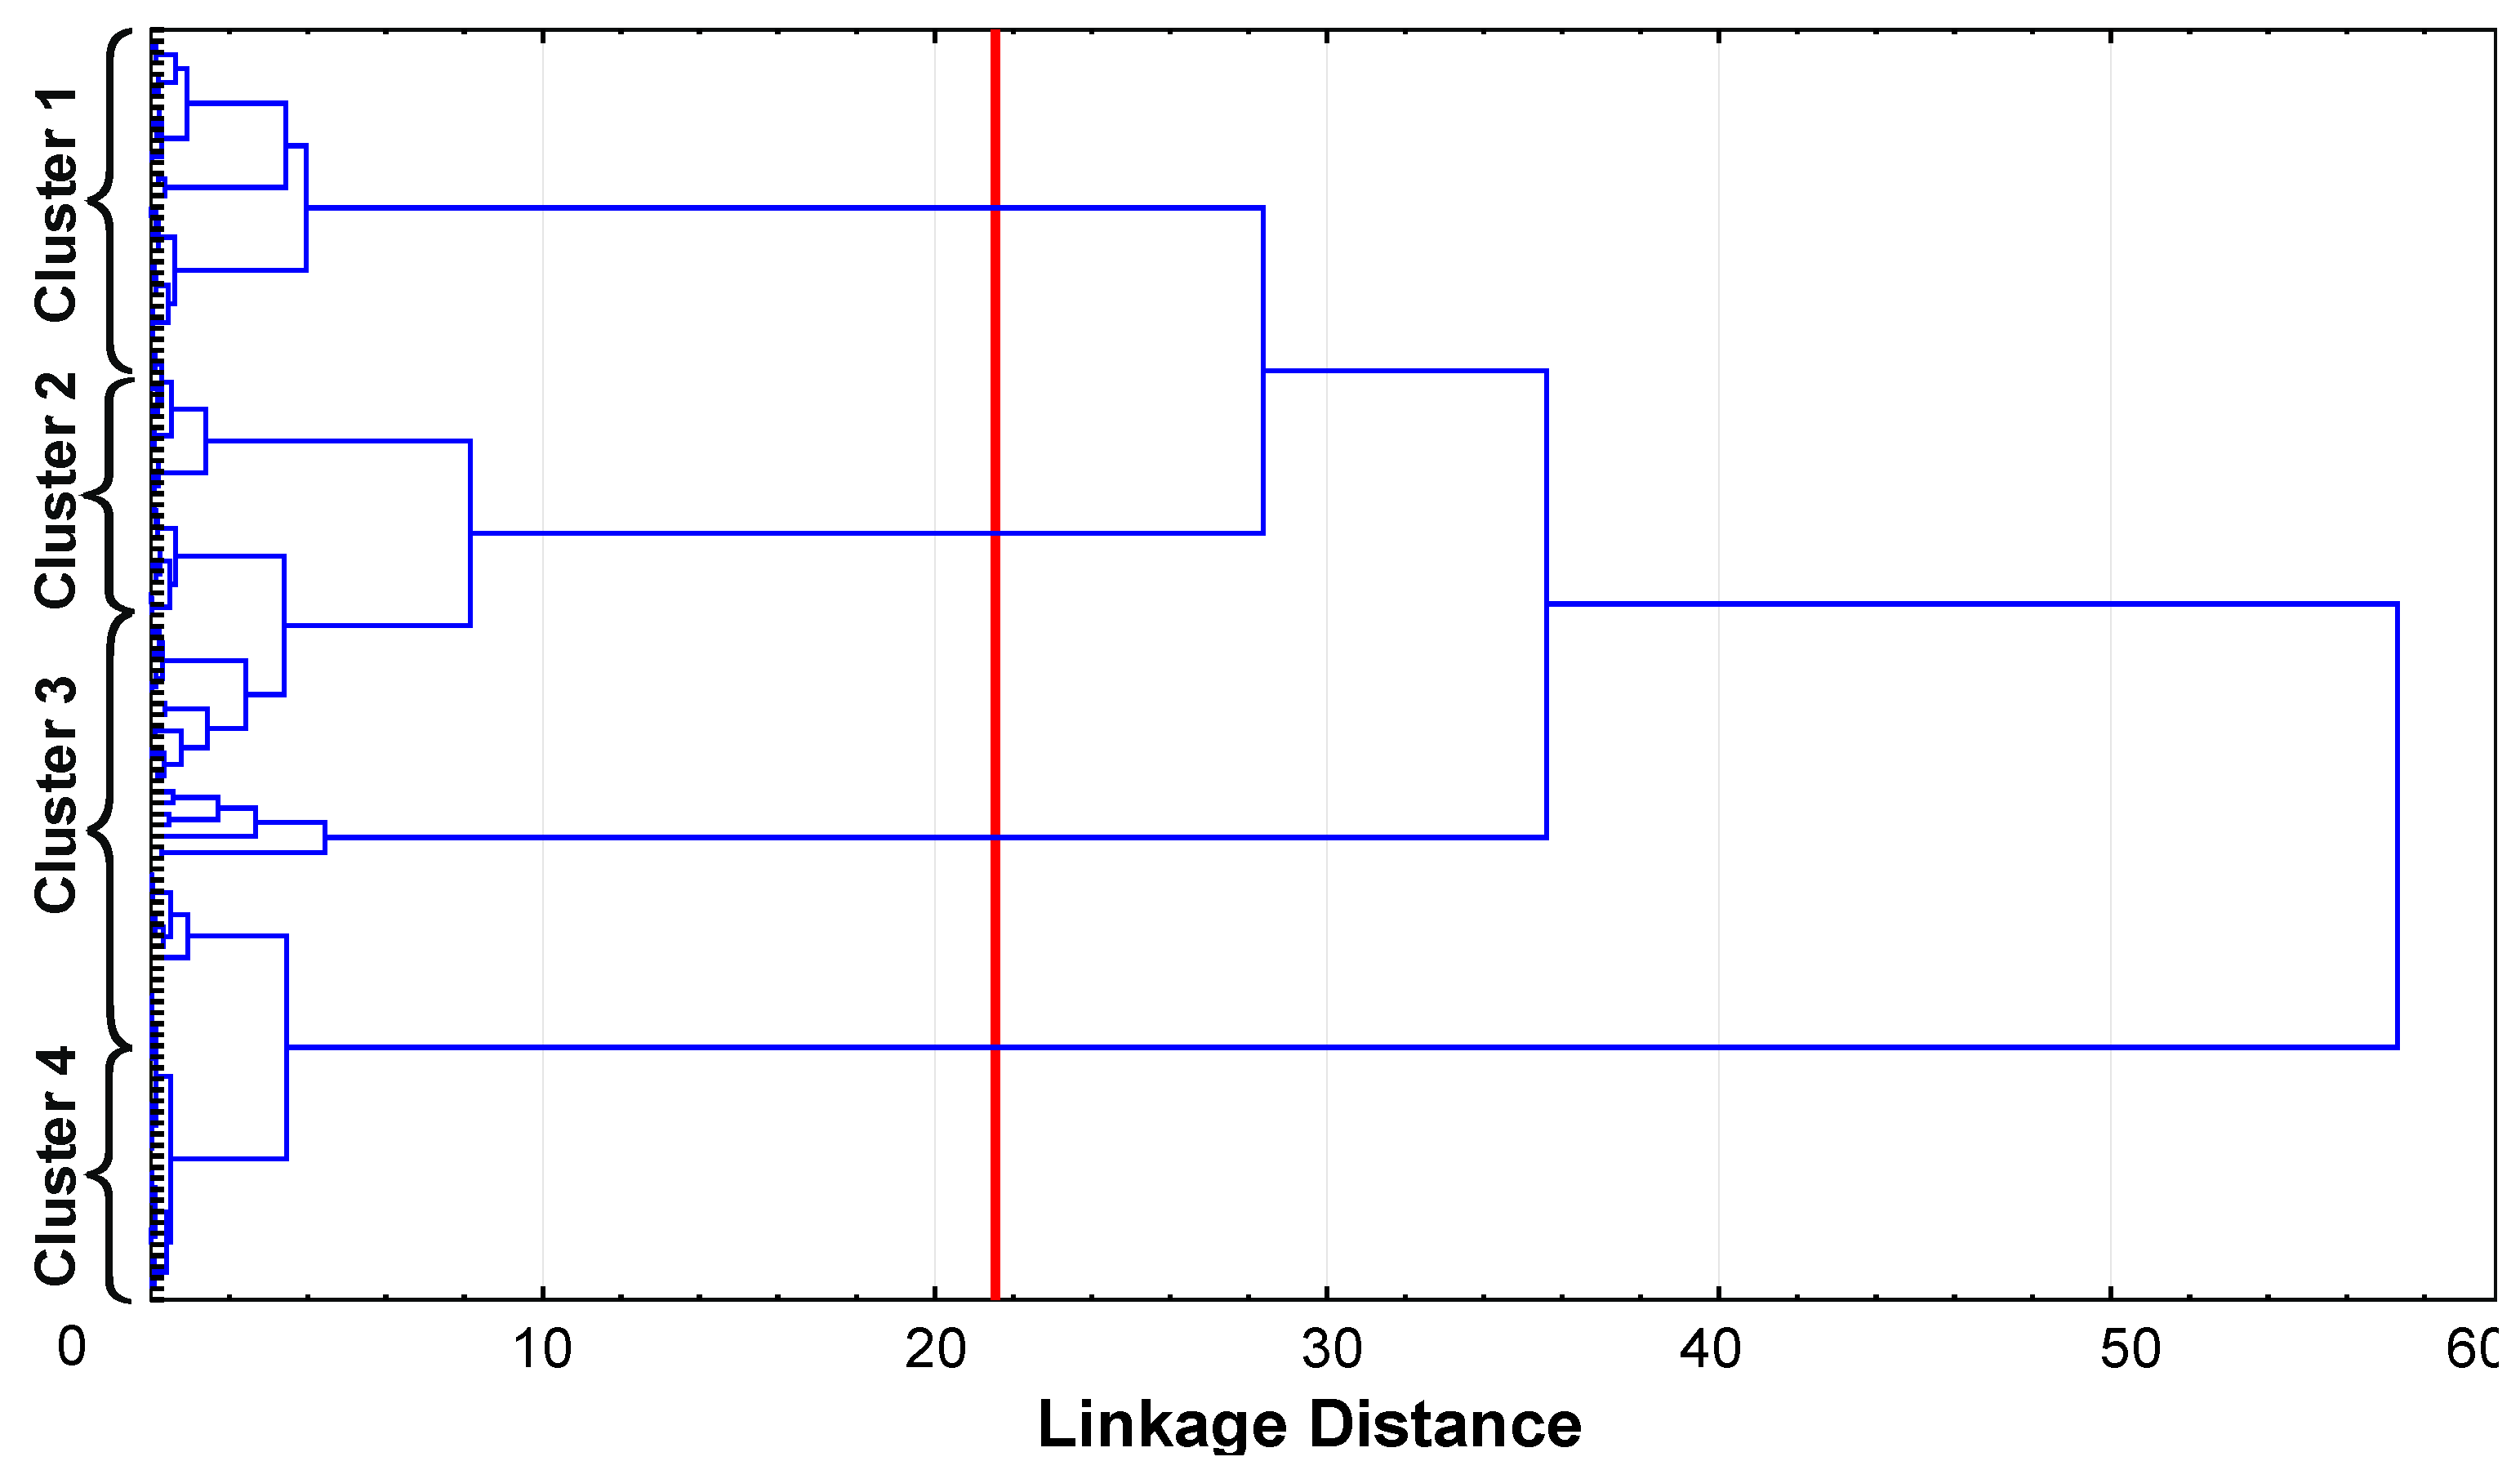
Data were standardised for comparability (measurements using the same units). Standardisation resulted in all characteristics having a mean equal to 0 and a standard deviation equal to 1. Cluster analysis was carried out using the hierarchical agglomerative method, resulting in hierarchically ordered clusters, which were presented in the form of a dendrogram (Figure 3).
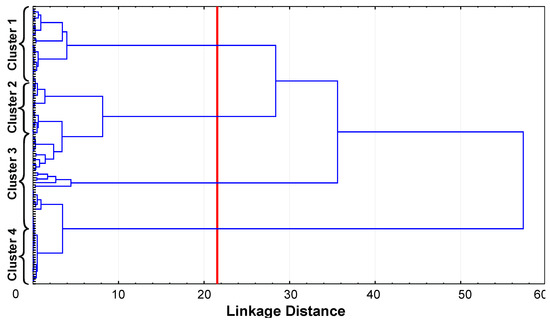
Figure 3.
Dendrogram for cluster analysis of hydrogen storage capacity for 114 gas fields. Ward’s method was used. Euclidean distances were used for measurements.
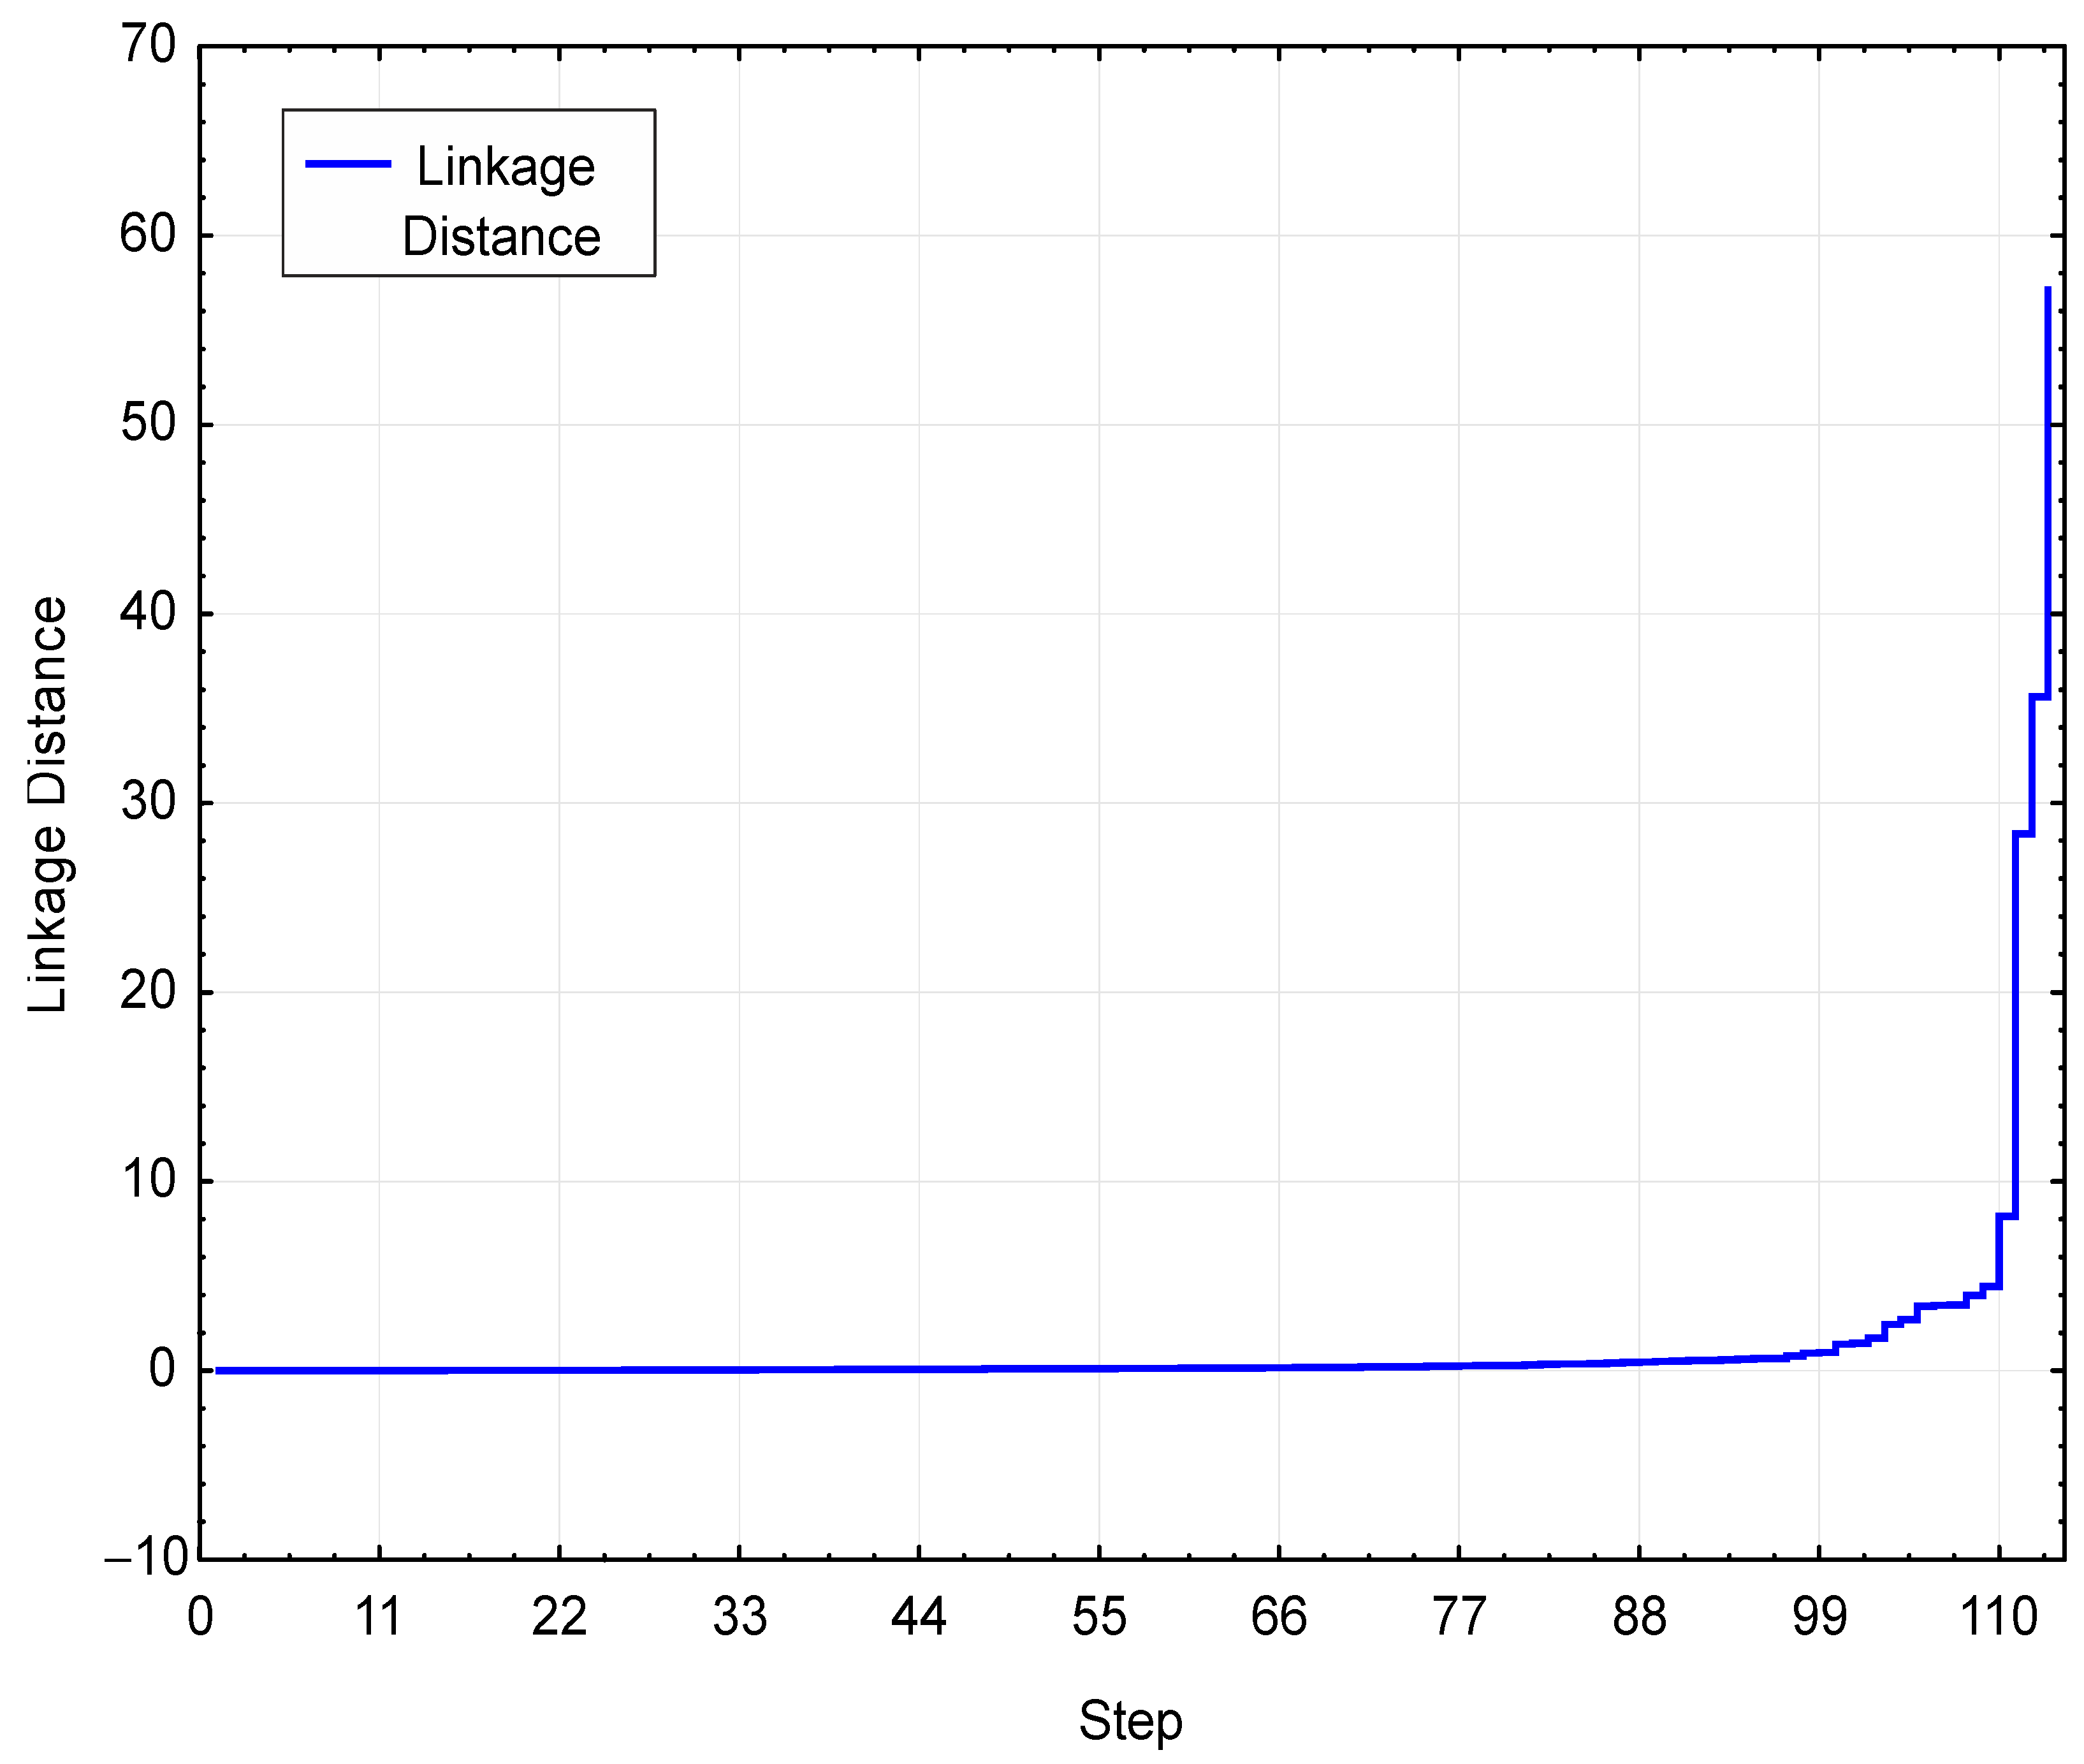
The dendrogram presents the distances between the grouped objects. Ward’s method was used for agglomeration, which sequentially links objects with increasing distances. Distances were calculated using the Euclidean distance measure. The selection of the number of clusters was carried out by intersecting the dendrogram at the height (21.55) determined from the agglomeration run diagram (Figure 4).
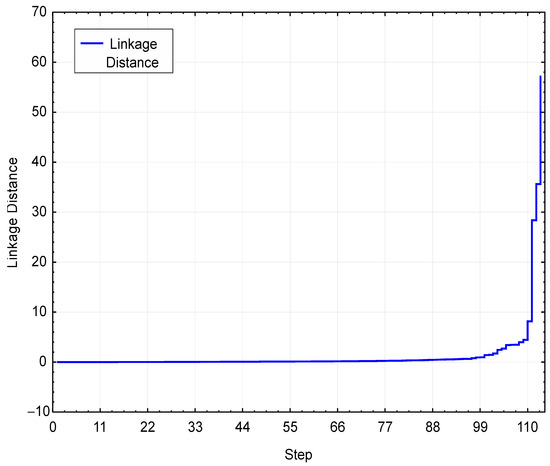
Figure 4.
The plot of linkage distances across steps in the hydrogen storage capacity cluster analysis.
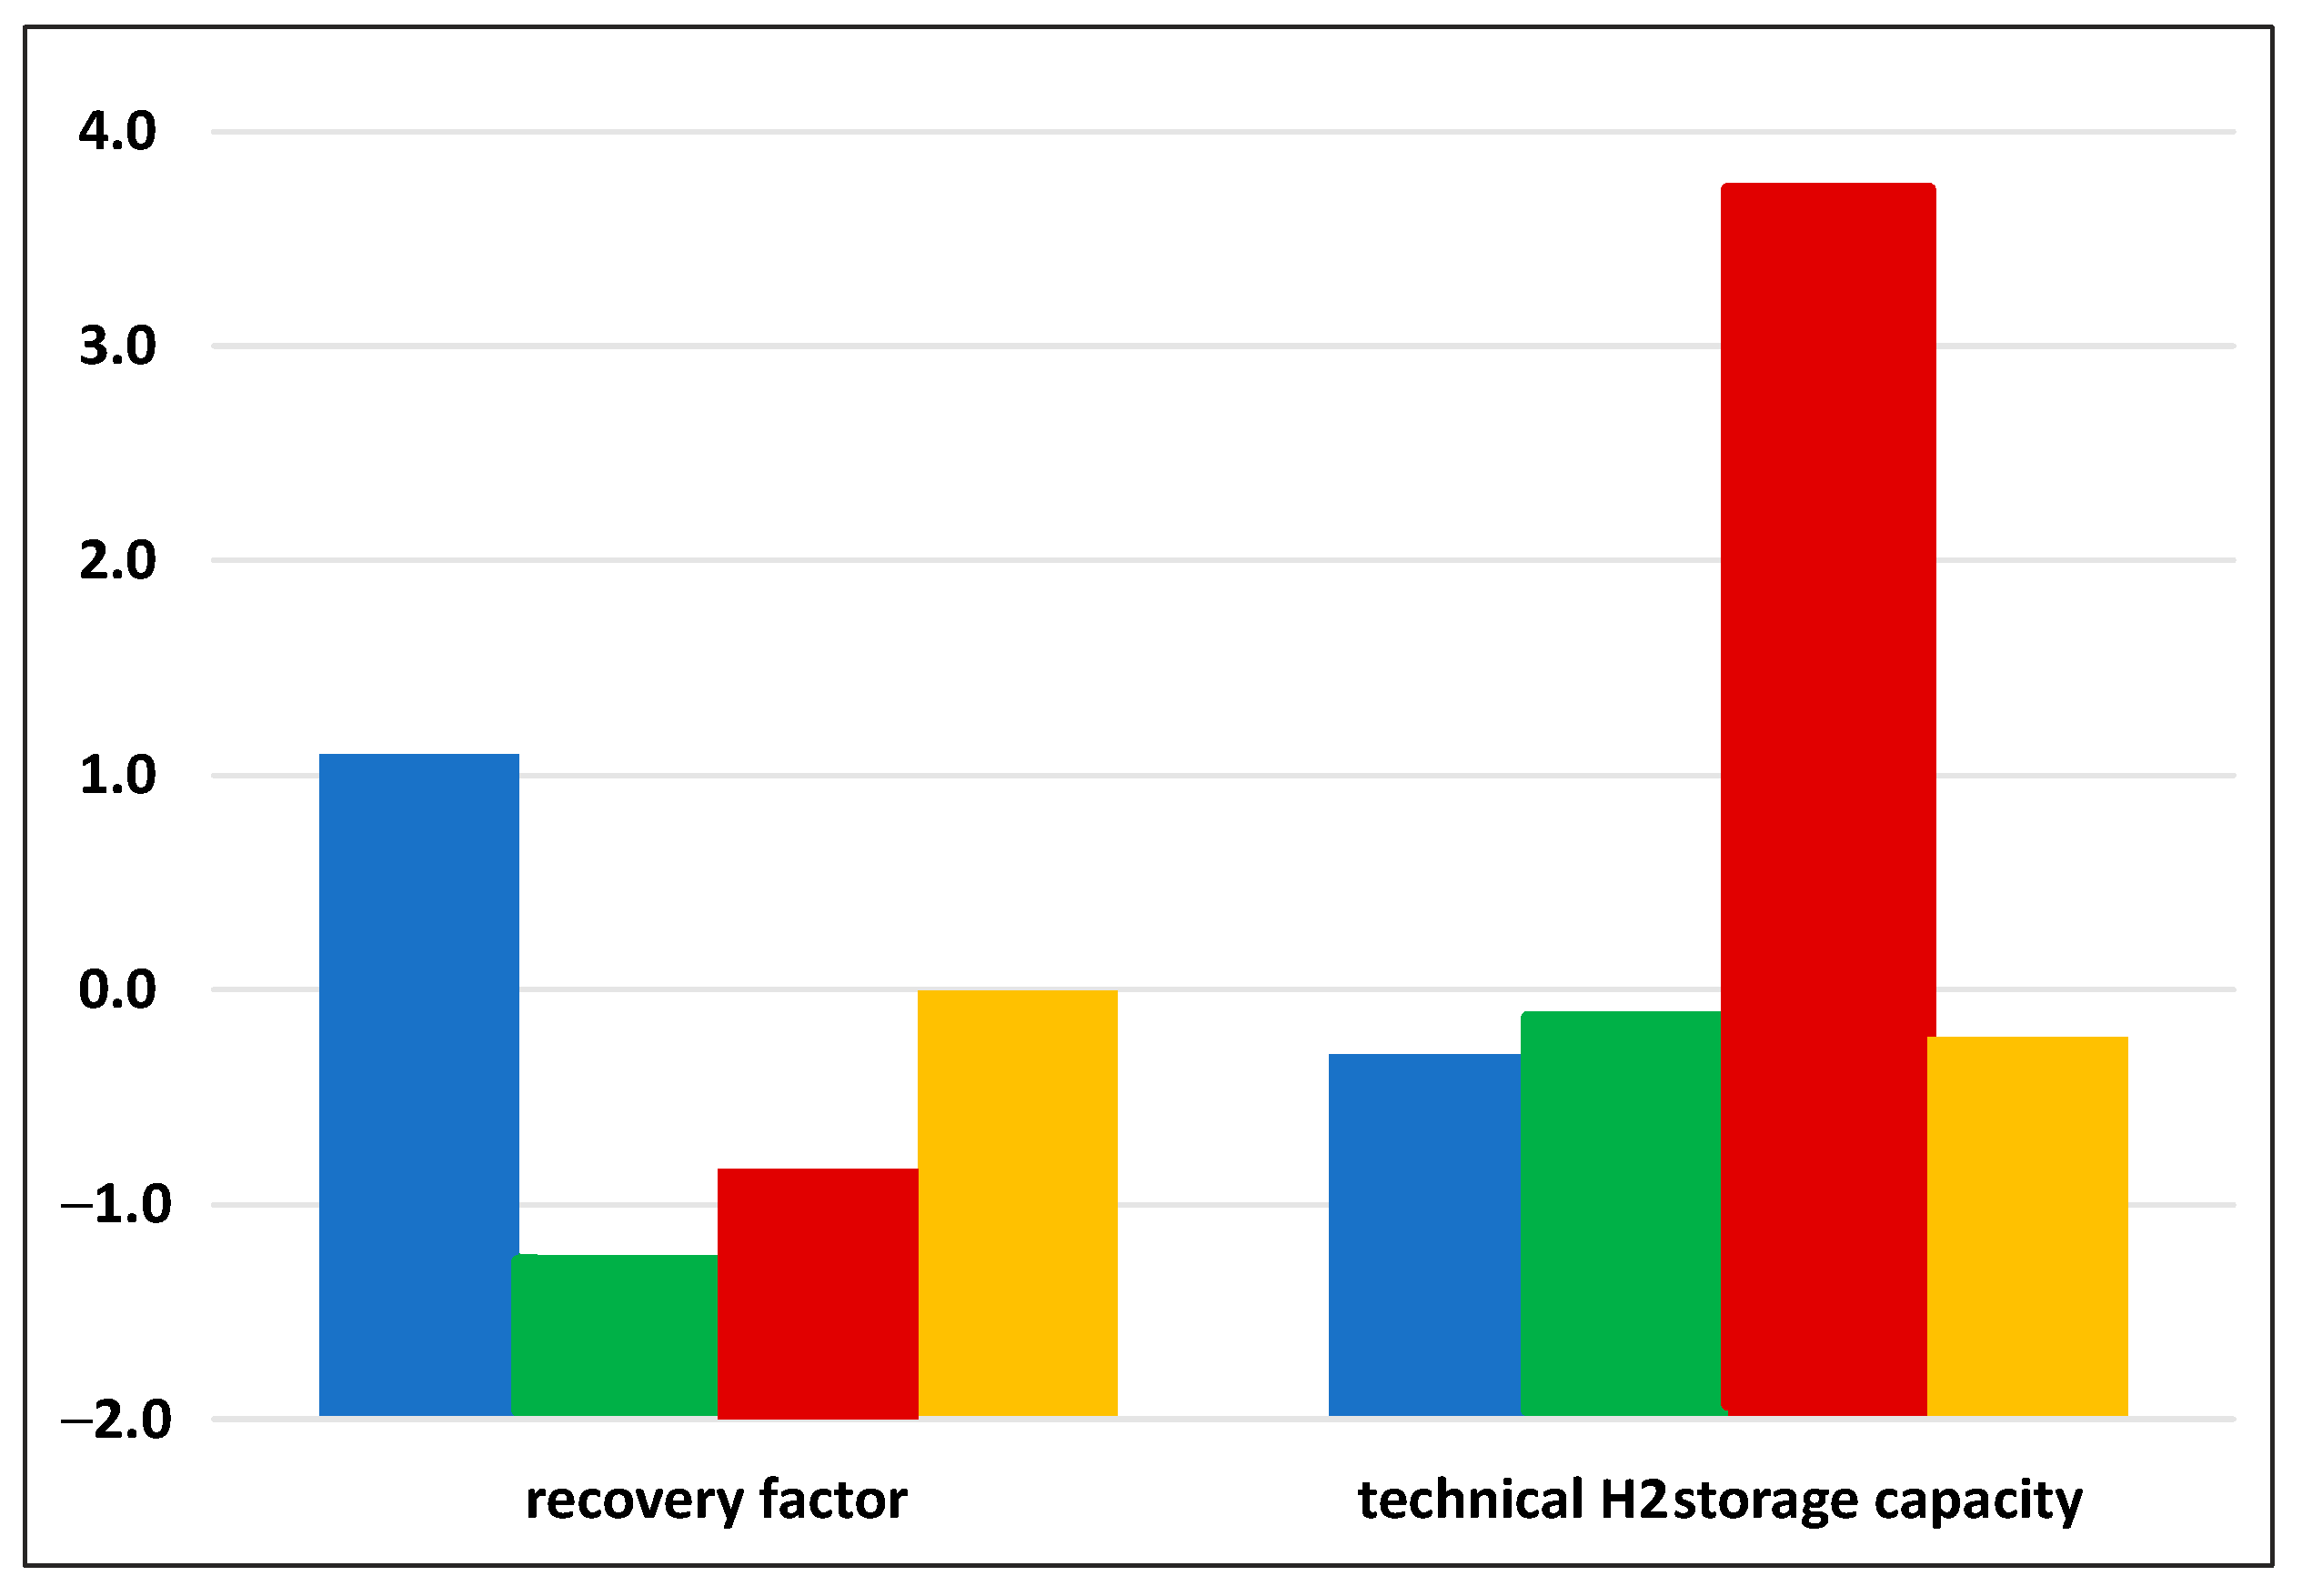
The clustering performed on the basis of two criteria, the recovery factor and the technical hydrogen storage capacity, made separating four groups of seven to 40 deposits possible (Figure 5). For the first cluster that contains 39 gas fields, the group average for the recovery factor is higher than the average of the overall average, while the group average for technical storage capacities is comparable to the overall average. In the second group with 28 gas fields, the group average for the recovery factor is much lower than the overall average, while the group for the technical H2 storage capacity is comparable to the overall average. For the third cluster with seven gas fields (the smallest cluster), we can read that the group average for the recovery factor is lower than the overall average, whereas the group average for the technical storage capacity is much higher than the overall average. In terms of the characteristics of the technical H2 storage capacity, this group appears to be the strongest. In the fourth cluster, we have 40 gas fields; the group averages for the recovery factor and technical H2 storage capacity are comparable to the overall averages. The recovery factor attributed to cluster 1 is characterised by high values (deposits extracted to a significant extent), which means that, in terms of this attribute, the deposits in this group are practically ready to store H2. For clusters 2 and 3, we have relatively low recovery factor characteristic values—these are deposits in the initial phase of exploitation. The best in terms of the technical characteristic of the H2 storage capacity is cluster 3 (highest capacities). The values for the other three clusters are “average”.

Figure 5.
Average values of recovery factor and technical H2 storage capacity in the clusters. Exposed values are standardized; cluster 1—blue colour; cluster 2—green colour; cluster 3—red colour; cluster 4—yellow colour.
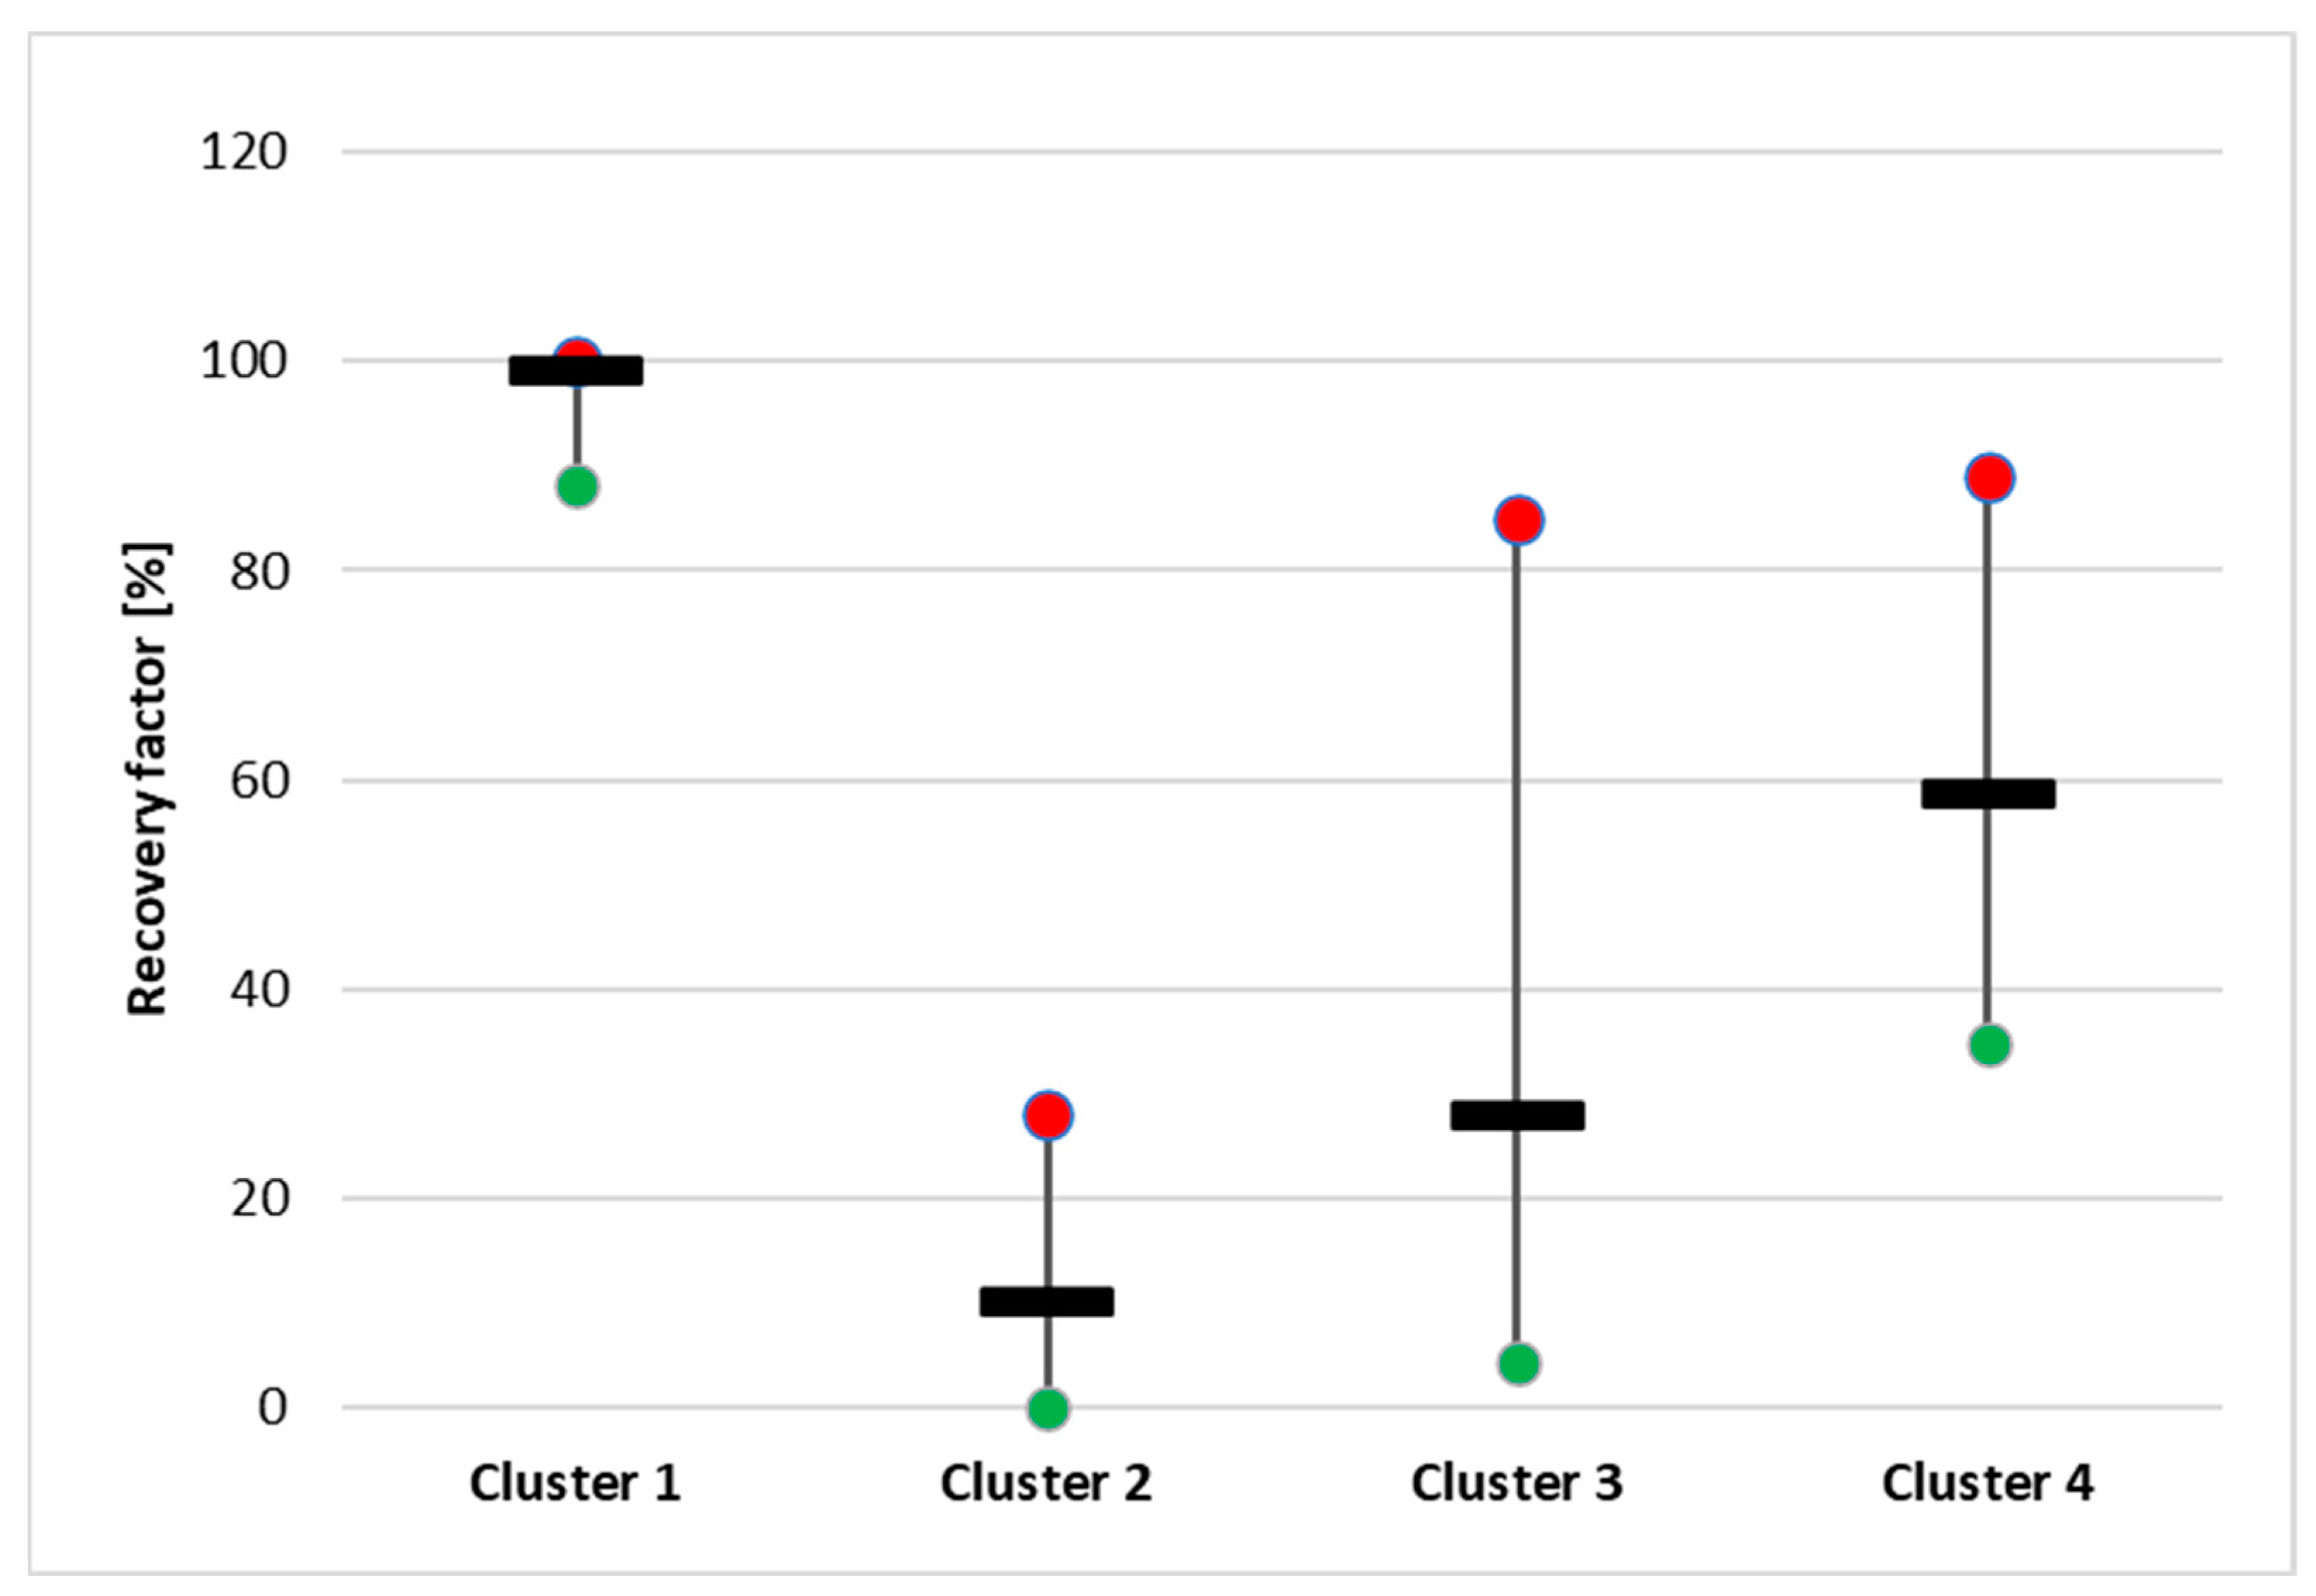
Deposits in cluster 1 have the highest depletion rates of all groups from 88 to 100%, with an average of around 99% (Figure 6). In this respect, cluster 1 is the best, as these are saturated fields that can be developed into storage. Cluster 2 includes natural gas fields with a low depletion rate of about 1 to 28% and an average of about 10%. In cluster 3, the fields are at varying degrees of exploitation, having produced between 4.4 and 85% of the recoverable primary natural gas reserves, with the average oscillating more towards the minimum value at around 28%. The depletion rate of gas fields in cluster 4 also varies quite a bit between 35 and 89%, with an average of 58%.

Figure 6.
Maximum (red colour), average (black colour), and minimum (green colour) values of the recovery factor in clusters.
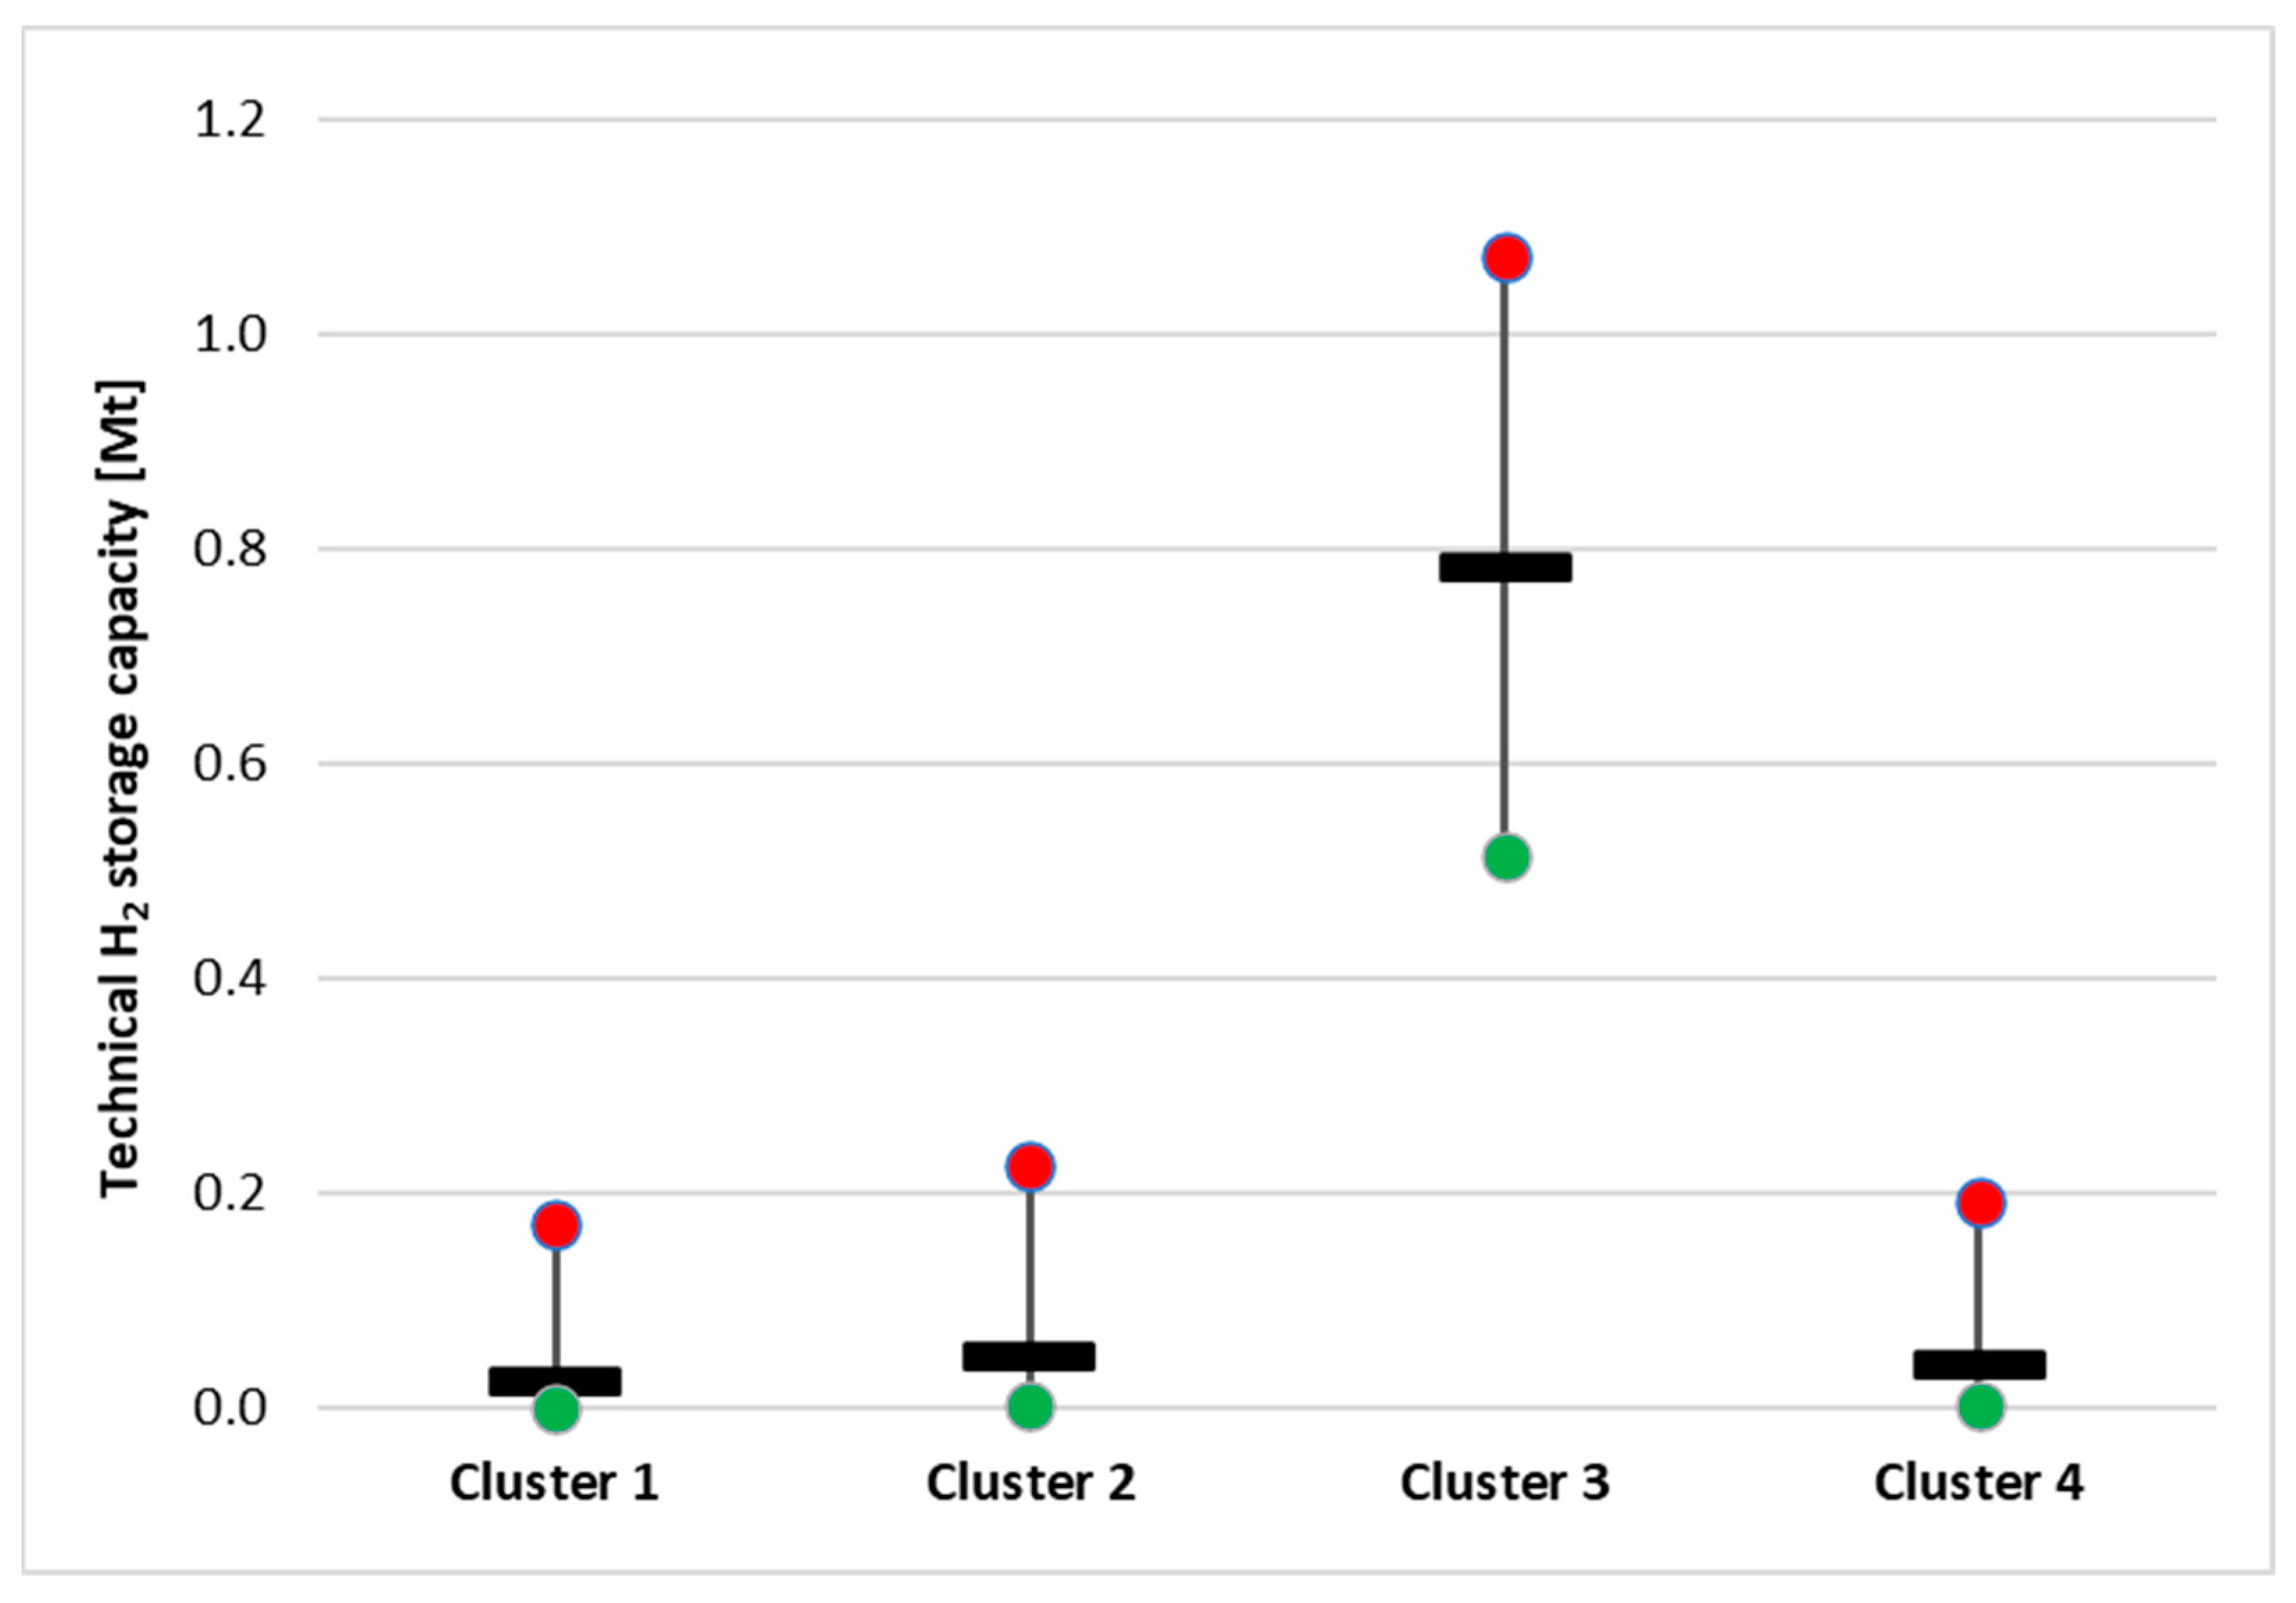
The deposits in clusters 1, 2, and 4 have comparable ranges with respect to technical hydrogen storage capacity (Figure 7). In cluster 1, a range from 0.0002 to 0.17 Mt is observed, which averages 0.024 Mt. For cluster 2, the range is from 0.0019 to 0.23 Mt, which averages 0.045 Mt. Cluster 4, on the other hand, exhibits a range from 0.0014 to 0.192 Mt, which averages 0.040 Mt. Cluster 3 is the best in this respect, as the deposits within it significantly outperform the others in terms of technical H2 storage capacity (ranging from 0.516 to 1.073 Mt, which averages 0.782 Mt).
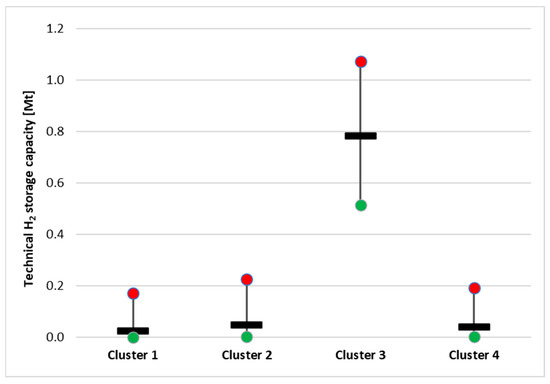
Figure 7.
Maximum (red colour), average (black colour), and minimum (green colour) values of the technical H2 storage capacity in clusters.
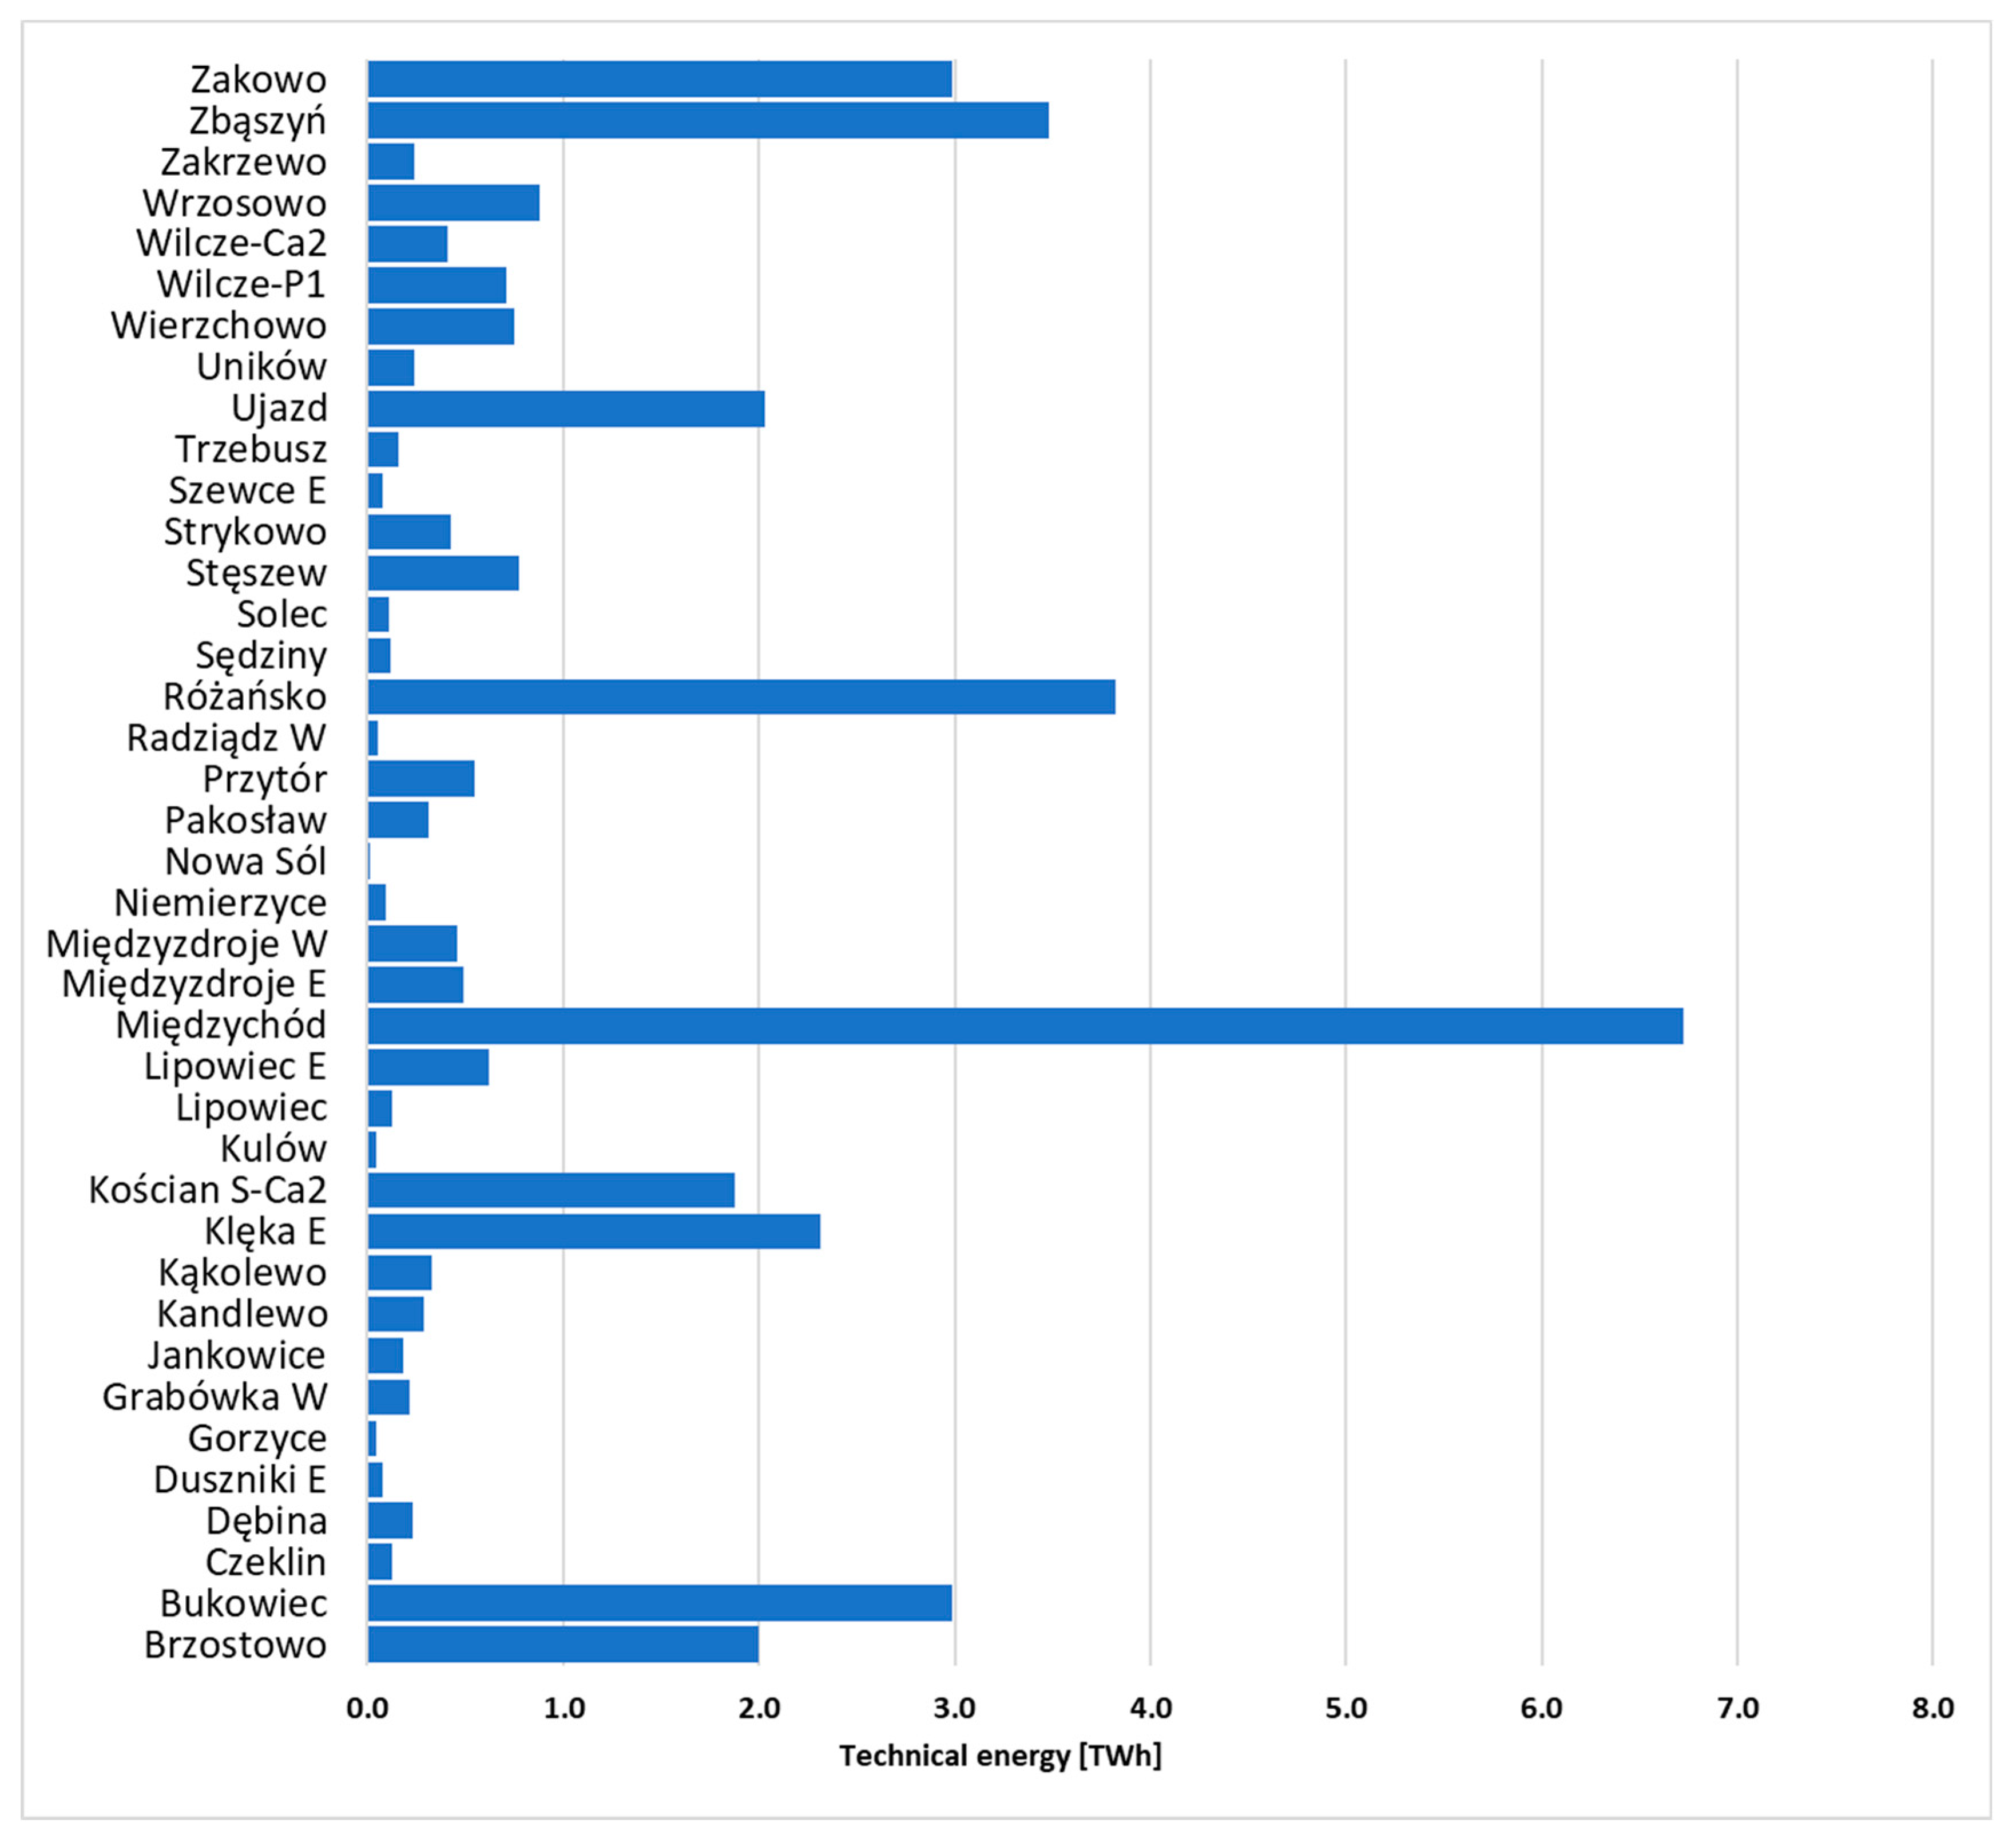
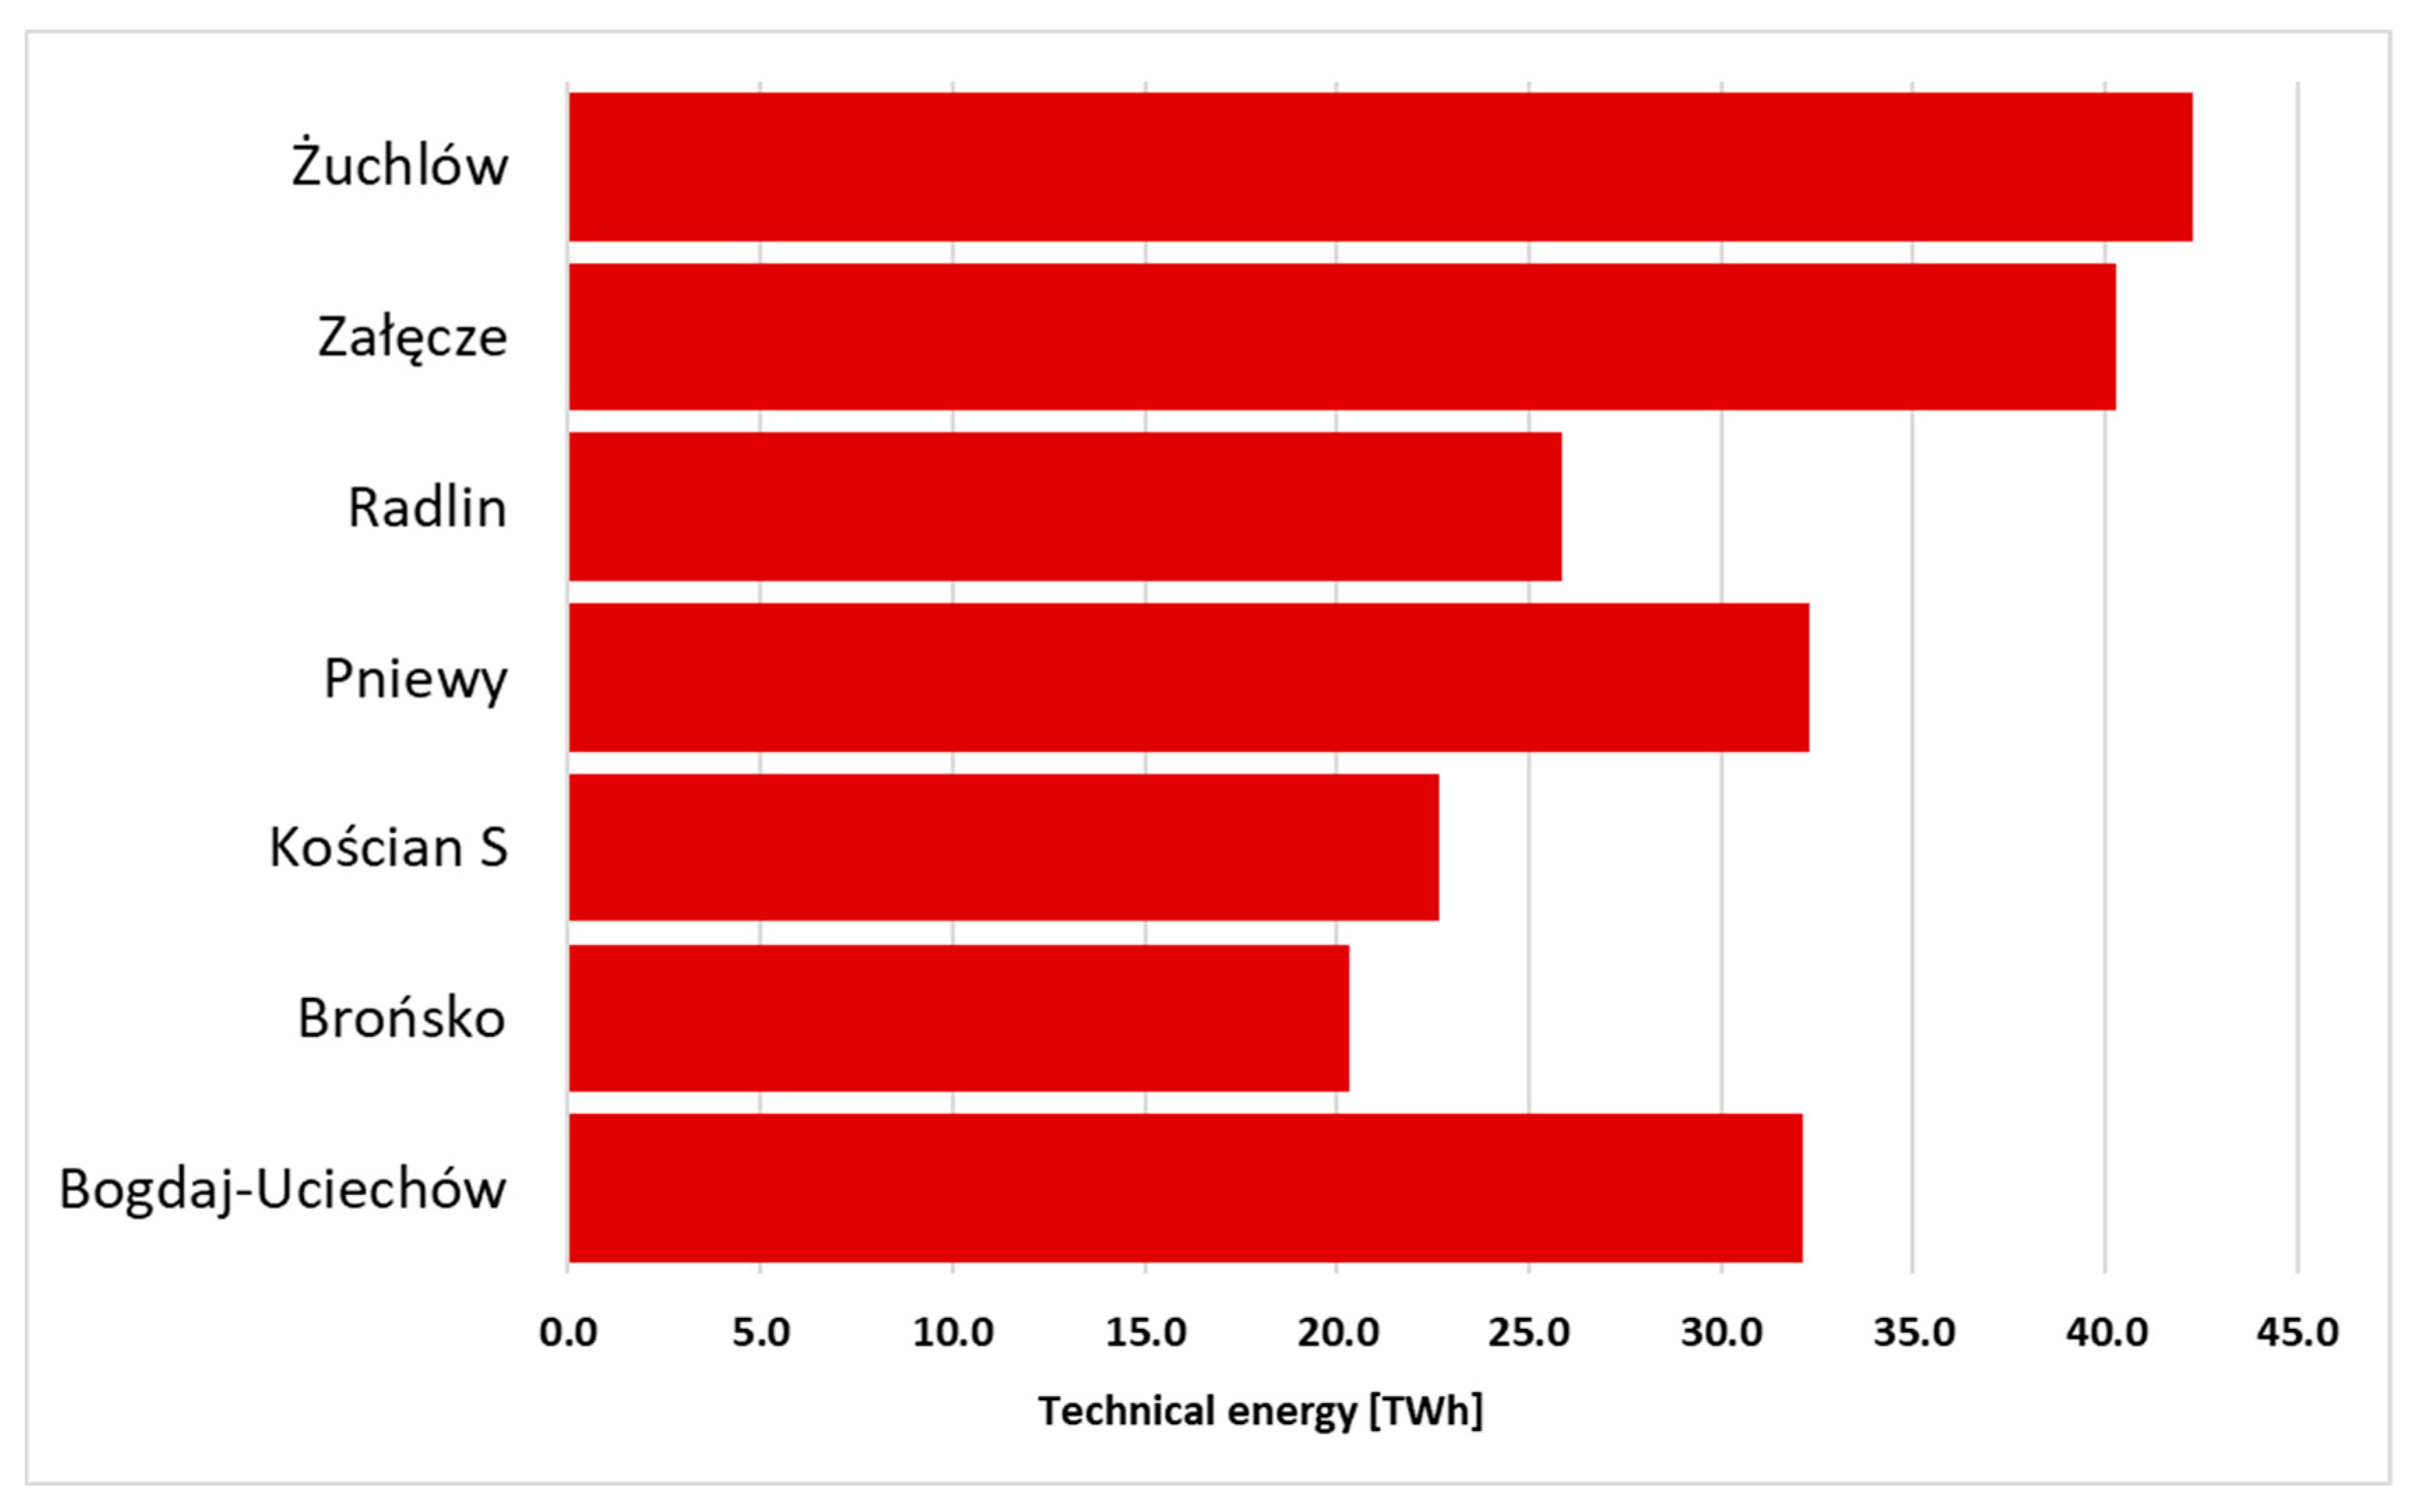
Clusters 1, 2, and 4 have concentrated natural gas fields with very different technical H2 energy equivalents within each cluster. The fields of cluster 1 (Figure 8) are fields with varying technical energy stored as hydrogen from 0.08 to 6.73 TWh. The technical energy stored as hydrogen in the deposits in cluster 2 (Figure 9) varies from 0.07 to 8.92 TWh. Cluster 3 (Figure 10) includes the fields with the highest technical hydrogen storage capacity, which translates into the largest technical energy stored as hydrogen from 20.32 to 42.26 TWh. In cluster 4 (Figure 11), technical energy stored as hydrogen is in the order of 0.1 d0 7.56 TWh.
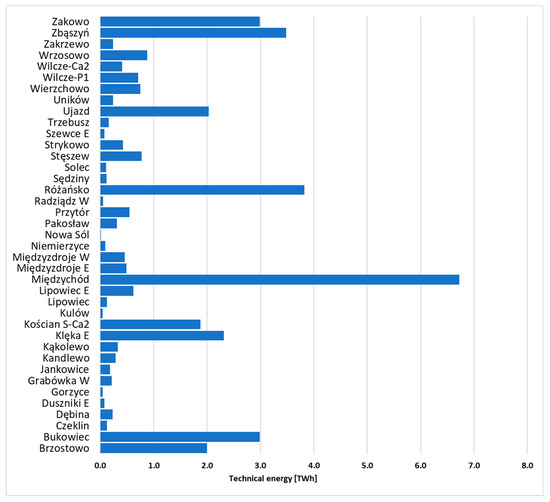
Figure 8.
Technical H2 energy equivalent—cluster 1.
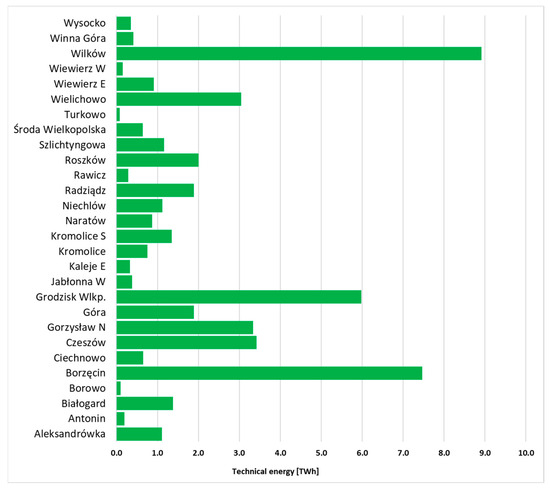
Figure 9.
Technical H2 energy equivalent—cluster 2.

Figure 10.
Technical H2 energy equivalent—cluster 3.
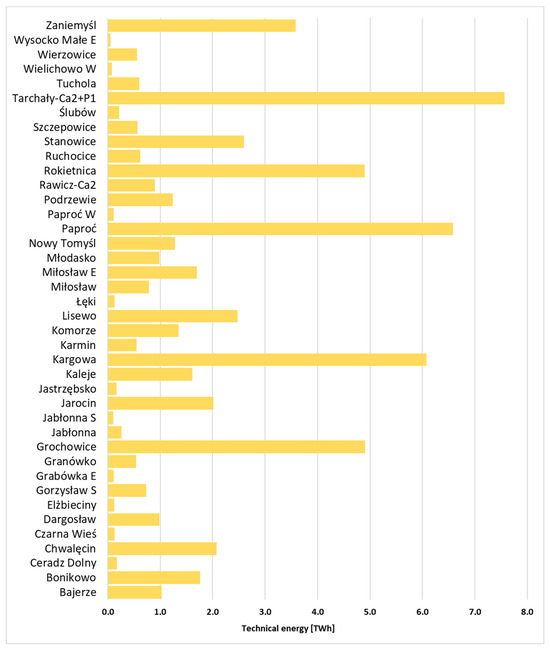
Figure 11.
Technical H2 energy equivalent—cluster 4.
No comprehensive assessment of the potential for hydrogen storage in depleted natural gas fields has yet been carried out for Poland. The HyUSPRe project analysed the potential for hydrogen storage in aquifers and depleted natural gas fields in Europe. Ten potential underground hydrogen storage facilities were identified in Poland, three in salt caverns, and seven in depleted gas fields. The total hydrogen energy equivalent of these storage facilities was estimated at 14 TWh. Three fields located in western and northern Poland currently used for natural gas storage were selected as potential hydrogen storage facilities: Wierzchowice, Bonikowo, and Daszewo. Other deposits are located in the southern part of the country: Strachocina, Husów, Swarzów, and Brzeźnica. The Bonikowo, Daszewo, Swarzów, and Brzeźnica deposits are small, and their capacity does not exceed 2.5 TWh. The others have hydrogen energy equivalents within the range of 4.1–14.7 TWh. The Wierzchowice field, with a capacity of 14.7 TWh, accounts for half of the country’s porous reservoirs [36]. The technical hydrogen energy equivalents estimated for depleted natural gas fields in western and northwest Poland vary over a wide range: from 0.008 to 157 TWh. The average practical hydrogen energy equivalent is about 4.6 TWh, well below the European average of 9 TWh (estimated by the HyUSPRe project).
The storage capacity of hydrogen in aquifers and hydrocarbon reservoirs in the EU member states and the United Kingdom, Norway, and Turkey was also analysed by the Hystories project. The storage potential of 800 traps located onshore and offshore was estimated in the range of 13,190, 19,110, and 28,420 TWh (with 90%, 50%, and 10% probability, respectively). The estimates presented in the project were produced for a selection of 42 natural gas fields located throughout Poland [63]. The values presented on the project’s website are several times or even an order of magnitude higher for most deposits than the values presented in the HyUSPRe project’s report and those estimated in this paper. For example, the amount of energy that can be stored as hydrogen in the Daszewo field in the HyUSPRe project was estimated at 0.35 TWh, while in the Hystories project, it was estimated at 7 and 11 TWh (P10 and P90, respectively). The differences in the results of hydrogen storage capacity in natural gas deposits result from different assessment methodologies used by individual research teams.
4. Conclusions
The methodology used in the paper, based on capacity categories from a modified pyramid of CO2 storage capacities, takes into account the gas reserves stored in the reservoir, the properties of hydrogen under reservoir conditions, and the degree of depletion of the reservoir. The theoretical and technical hydrogen storage capacities were estimated in this study. The theoretical storage capacity proposed in the paper is the maximum total amount of hydrogen that the geological structure can hold. This is the potential of hydrogen storage in a particular structure. Taking into account technical criteria such as the degree of depletion of the reservoir, the technical storage capacity was distinguished as part of the theoretical capacity.
Estimates of the storage capacity in depleted natural gas fields in western and northwest Poland, made on the basis of the proposed methodology, indicate a wide variation with respect to the potential of investigated fields resulting from different resources. The potential for hydrogen storage in depleted reservoirs is consistent with the results of capacity assessments provided in the HyUSPRe project’s report and is an order of magnitude lower than the results presented in the Hystories project.
The clustering allowed us to separate groups of deposits with different recovery factors and technical hydrogen storage capacities. From among four clusters, deposits with the highest degree of depletion and the largest resources, e.g., Różańsko or Międzychód, could be proposed first for conversion to hydrogen storage.
Theoretical and practical assessments of the storage capacity of natural gas de-posits presented in the article were performed during the screening stage of hydrogen storage sites. The capacity estimation methodology proposed in the publication allows for the se-lection of natural gas deposits that can potentially be converted into underground hydro-gen storage. The amounts of energy that can be stored in depleted natural gas deposits corresponds to the theoretical and technical storage potential. The capacity assessment carried out only takes into account geological and deposit conditions. The actual storage capacity in depleted gas deposits may be lower due to technological conditions and the demand for storage capacity. Nevertheless, the methodology used allows the obtainment of reliable information for the initial determination of the hydrogen storage potential with a relatively small amount of data.
Author Contributions
Conceptualization, B.U.-M. and J.L.-Ś.; methodology, B.U.-M., J.L.-Ś. and R.M.; writing—original draft preparation, J.L.-Ś. and R.M.; writing—review and editing, B.U.-M. and J.L.-Ś. All authors have read and agreed to the published version of the manuscript.
Funding
This research was funded by the “Doskonała Nauka” (“Excellent Science”) programme of the Ministry of Education and Science, Republic of Poland, grant No DNK/SP/547981/2022.
Data Availability Statement
The data presented in this study are available on request from the corresponding author (accurately indicate status).
Conflicts of Interest
The authors declare no conflicts of interest.
References
- COM/2019/640. Communication from the Commission—The European Green Deal. 2019. Available online: https://eur-lex.europa.eu/legal-content/EN/TXT/?uri=COM%3A2019%3A640%3AFIN (accessed on 1 December 2023).
- Council of the EU and the European Council Fit for 55—The EU’s Plan for a Green Transition—Consilium. Available online: https://www.consilium.europa.eu/en/policies/green-deal/fit-for-55-the-eu-plan-for-a-green-transition/ (accessed on 13 November 2023).
- COM/2020/301. Communication from the Commission to the European Parliament, the Council, the European Economic and Social Committee and the Committee of the Regions: A Hydrogen Strategy for a Climate-Neutral Europe. 2020. Available online: https://eur-lex.europa.eu/legal-content/EN/TXT/?uri=CELEX%3A52020DC0301 (accessed on 1 December 2023).
- Energy policy of Poland. In Energy Policy of Poland until 2040; Ministry of Climate and Environment: Warsaw, Poland, 2021.
- PHE. Polish Hydrogen Strategy until 2030 with an Outlook until 2040; PHE: Warsaw, Poland, 2021.
- Uliasz-Misiak, B.; Lewandowska-Śmierzchalska, J.; Matuła, R.; Tarkowski, R. Prospects for the Implementation of Underground Hydrogen Storage in the EU. Energies 2022, 15, 9535. [Google Scholar] [CrossRef]
- Tarkowski, R.; Uliasz-Misiak, B. Towards Underground Hydrogen Storage: A Review of Barriers. Renew. Sustain. Energy Rev. 2022, 162, 112451. [Google Scholar] [CrossRef]
- Kruck, O.; Crotogino, F.; Prelicz, R.; Rudolph, T. A Overview on All Known Underground Storage Technologies for Hydrogen. 2013. Available online: https://hyunder.eu/wp-content/uploads/2016/01/D3.1_Overview-of-all-known-underground-storage-technologies.pdf (accessed on 1 December 2023).
- Panfilov, M. Underground and Pipeline Hydrogen Storage. In Compendium of Hydrogen Energy; Elsevier: Amsterdam, The Netherlands, 2016; Volume 2, pp. 91–115. [Google Scholar]
- Ponomarev-Stepnoy, N.N.; Stolyarevsky, A.Y. Major Aspects of Strategy of Hydrogen-Base Power Development with Nuclear Energy Sources. In Proceedings of the International Conference on Fifty Years of Nuclear Power—The Next Fifty Years; International Atomic Energy Agency: Vienna, Austria, 2004. [Google Scholar]
- Zivar, D.; Kumar, S.; Foroozesh, J. Underground Hydrogen Storage: A Comprehensive Review. Int. J. Hydrogen Energy 2021, 46, 23436–23462. [Google Scholar] [CrossRef]
- Khilyuk, L.F.; Chilingar, G.V.; Robertson, J.O.; Endres, B. Hazards of Gas Storage Fields. Gas Migr. 2000, 290–305. [Google Scholar] [CrossRef]
- Wallace, R.L.; Cai, Z.; Zhang, H.; Zhang, K.; Guo, C. Utility-Scale Subsurface Hydrogen Storage: UK Perspectives and Technology. Int. J. Hydrogen Energy 2021, 49, 25137–25159. [Google Scholar] [CrossRef]
- Chen, F.; Ma, Z.; Nasrabadi, H.; Chen, B.; Saad Mehana, M.Z.; Van Wijk, J. Capacity Assessment and Cost Analysis of Geologic Storage of Hydrogen: A Case Study in Intermountain-West Region USA. Int. J. Hydrogen Energy 2023, 48, 9008–9022. [Google Scholar] [CrossRef]
- Wei, L.; Jie, C.; Deyi, J.; Xilin, S.; Yinping, L.; Daemen, J.J.K.; Chunhe, Y. Tightness and Suitability Evaluation of Abandoned Salt Caverns Served as Hydrocarbon Energies Storage under Adverse Geological Conditions (AGC). Appl. Energy 2016, 178, 703–720. [Google Scholar] [CrossRef]
- Lord, A.S. Overview of Geologic Storage of Natural Gas with an Emphasis on Assessing the Feasibility of Storing Hydrogen; Albuquerque, NM, USA, 2009. Available online: https://www.osti.gov/servlets/purl/975258 (accessed on 1 December 2023).
- Lysyy, M.; Fernø, M.; Ersland, G. Seasonal Hydrogen Storage in a Depleted Oil and Gas Field. Int. J. Hydrogen Energy 2021, 49, 25160–25174. [Google Scholar] [CrossRef]
- Muhammed, N.S.; Haq, B.; Abdullah, D.; Shehri, A.; Al-Ahmed, A.; Rahman, M.M.; Zaman, E.; Iglauer, S. Hydrogen Storage in Depleted Gas Reservoirs: A Comprehensive Review. Fuel 2022, 337, 127032. [Google Scholar] [CrossRef]
- Hollis, A.P. Some Petroleum Engineering Considerations in the Changeover of the Rough Gas Field to the Storage Mode. J. Pet. Technol. 1984, 36, 797–804. [Google Scholar] [CrossRef]
- Feldmann, F.; Hagemann, B.; Ganzer, L.; Panfilov, M. Numerical Simulation of Hydrodynamic and Gas Mixing Processes in Underground Hydrogen Storages. Environ. Earth Sci. 2016, 75, 1165. [Google Scholar] [CrossRef]
- Muhammed, N.S.; Haq, B.; Al Shehri, D.; Al-Ahmed, A.; Rahman, M.M.; Zaman, E. A Review on Underground Hydrogen Storage: Insight into Geological Sites, Influencing Factors and Future Outlook. Energy Rep. 2022, 8, 461–499. [Google Scholar] [CrossRef]
- Katz, D.L.; Tek, M.R. Overview on Underground Storage of Natural Gas. J. Pet. Technol. 1981, 33, 943–951. [Google Scholar] [CrossRef]
- Luboń, K.; Tarkowski, R. Numerical Simulation of Hydrogen Injection and Withdrawal to and from a Deep Aquifer in NW Poland. Int. J. Hydrogen Energy 2020, 45, 2068–2083. [Google Scholar] [CrossRef]
- Sainz-Garcia, A.; Abarca, E.; Rubi, V.; Grandia, F. Assessment of Feasible Strategies for Seasonal Underground Hydrogen Storage in a Saline Aquifer. Int. J. Hydrogen Energy 2017, 42, 16657–16666. [Google Scholar] [CrossRef]
- Amid, A.; Mignard, D.; Wilkinson, M. Seasonal Storage of Hydrogen in a Depleted Natural Gas Reservoir. Int. J. Hydrogen Energy 2016, 41, 5549–5558. [Google Scholar] [CrossRef]
- Kanaani, M.; Sedaee, B.; Asadian-Pakfar, M. Role of Cushion Gas on Underground Hydrogen Storage in Depleted Oil Reservoirs. J. Energy Storage 2022, 45, 103783. [Google Scholar] [CrossRef]
- Lord, A.S.; Kobos, P.H.; Borns, D.J. Geologic Storage of Hydrogen: Scaling up to Meet City Transportation Demands. Int. J. Hydrogen Energy 2014, 39, 15570–15582. [Google Scholar] [CrossRef]
- Zhang, T.; Zhang, Y.; Katterbauer, K.; Al Shehri, A.; Sun, S.; Hoteit, I. Phase Equilibrium in the Hydrogen Energy Chain. Fuel 2022, 328, 125324. [Google Scholar] [CrossRef]
- Zhang, T.; Zhang, Y.; Katterbauer, K.; Al Shehri, A.; Sun, S.; Hoteit, I. Deep Learning–Assisted Phase Equilibrium Analysis for Producing Natural Hydrogen. Int. J. Hydrogen Energy 2024, 50, 473–486. [Google Scholar] [CrossRef]
- Lankof, L.; Tarkowski, R. Assessment of the Potential for Underground Hydrogen Storage in Bedded Salt Formation. Int. J. Hydrogen Energy 2020, 45, 19479–19492. [Google Scholar] [CrossRef]
- Caglayan, D.G.; Weber, N.; Heinrichs, H.U.; Linßen, J.; Robinius, M.; Kukla, P.A.; Stolten, D. Technical Potential of Salt Caverns for Hydrogen Storage in Europe. Int. J. Hydrogen Energy 2020, 45, 6793–6805. [Google Scholar] [CrossRef]
- Lankof, L.; Urbańczyk, K.; Tarkowski, R. Assessment of the Potential for Underground Hydrogen Storage in Salt Domes. Renew. Sustain. Energy Rev. 2022, 160, 112309. [Google Scholar] [CrossRef]
- Aftab, A.; Hassanpouryouzband, A.; Naderi, H.; Xie, Q.; Sarmadivaleh, M. Quantifying Onshore Salt Deposits and Their Potential for Hydrogen Energy Storage in Australia. J. Energy Storage 2023, 65, 107252. [Google Scholar] [CrossRef]
- Bradshaw, M.; Rees, S.; Wang, L.; Szczepaniak, M.; Cook, W.; Voegeli, S.; Boreham, C.; Wainman, C.; Wong, S.; Southby, C.; et al. Australian Salt Basins—Options for Underground Hydrogen Storage. APPEA J. 2023, 63, 285–304. [Google Scholar] [CrossRef]
- Hui, S.; Yin, S.; Pang, X.; Chen, Z.; Shi, K. Potential of Salt Caverns for Hydrogen Storage in Southern Ontario, Canada. Mining 2023, 3, 399–408. [Google Scholar] [CrossRef]
- Cavanagh, A.J.; Yousefi, S.H.; Wilkinson, M.; Groenenberg, R.M. Hydrogen Storage Potential of Existing European Gas Storage Sites in Depleted Gas Fields and Aquifers; HyUSPRe: Los Angeles, CA, USA, 2022. [Google Scholar]
- Barison, E.; Donda, F.; Merson, B.; Le Gallo, Y.; Réveillère, A. An Insight into Underground Hydrogen Storage in Italy. Sustainability 2023, 15, 6886. [Google Scholar] [CrossRef]
- Alms, K.; Ahrens, B.; Graf, M.; Nehler, M. Linking Geological and Infrastructural Requirements for Large-Scale Underground Hydrogen Storage in Germany. Front. Energy Res. 2023, 11, 1172003. [Google Scholar] [CrossRef]
- English, J.M.; English, K.L. Overview of Hydrogen and Geostorage Potential in Ireland. First Break 2023, 41, 41–49. [Google Scholar] [CrossRef]
- RISC. Hydrogen Storage Potential of Depleted Oil and Gas Fields in Western Australia Literature Review and Scoping Study; Geological Survey of Western Australia: Cascade, Australia, 2021.
- Okoroafor, E.R.; Kim, T.W.; Nazari, N.; Watkins, H.Y.; Saltzer, S.D.; Kovscek, A.R. Assessing the Underground Hydrogen Storage Potential of Depleted Gas Fields in Northern California. In Proceedings of the SPE Annual Technical Conference and Exhibition, Houston, TX, USA, 3–5 October 2022. [Google Scholar] [CrossRef]
- Lackey, G.; Freeman, G.M.; Buscheck, T.A.; Haeri, F.; White, J.A.; Huerta, N.; Goodman, A. Characterizing Hydrogen Storage Potential in U.S. Underground Gas Storage Facilities. Geophys. Res. Lett. 2023, 50, e2022GL101420. [Google Scholar] [CrossRef]
- Scafidi, J.; Wilkinson, M.; Gilfillan, S.M.V.; Heinemann, N.; Haszeldine, R.S. A Quantitative Assessment of the Hydrogen Storage Capacity of the UK Continental Shelf. Int. J. Hydrogen Energy 2021, 46, 8629–8639. [Google Scholar] [CrossRef]
- Emmel, B.; Bjørkvik, B.; Frøyen, T.L.; Cerasi, P.; Stroisz, A. Evaluating the Hydrogen Storage Potential of Shut down Oil and Gas Fields along the Norwegian Continental Shelf. Int. J. Hydrogen Energy 2023, 48, 24385–24400. [Google Scholar] [CrossRef]
- Ventisky, E.; Gilfillan, S.M.V. Assessment of the Onshore Storage Capacity of Hydrogen in Natural Gas Fields in Argentina. Geoenergy 2023, 18, 2023. [Google Scholar] [CrossRef]
- Qiu, Y.; Zhou, S.; Wang, J.; Chou, J.; Fang, Y.; Pan, G.; Gu, W. Feasibility Analysis of Utilising Underground Hydrogen Storage Facilities in Integrated Energy System: Case Studies in China. Appl. Energy 2020, 269, 115140. [Google Scholar] [CrossRef]
- Ślizowski, J.; Urbańczyk, K.; Łaciak, M.; Lankof, L.; Serbin, K. Effectiveness of Natural Gas and Hydrogen Storage in Salt Caverns. Przemysł Chem. 2017, 96, 60–64. [Google Scholar] [CrossRef]
- Luboń, K.T.; Tarkowski, R. Numerical Simulation of Hydrogen Storage in the Konary Deep Saline Aquifer Trap. Gospod. Surowcami Miner. 2023, 39, 103–124. [Google Scholar] [CrossRef]
- Bouteldja, M.; Le Gallo, Y. From Hydrogen Storage Potential to Hydrogen Capacities in Underground Hydrogen Storages; European Association of Geoscientists & Engineers: Utrecht, The Netherlands, 2023; Volume 2023, pp. 1–5. [Google Scholar] [CrossRef]
- Hassanpouryouzband, A.; Joonaki, E.; Edlmann, K.; Haszeldine, R.S. Offshore Geological Storage of Hydrogen: Is This Our Best Option to Achieve Net-Zero? ACS Energy Lett. 2021, 6, 2181–2186. [Google Scholar] [CrossRef]
- Mouli-Castillo, J.; Heinemann, N.; Edlmann, K. Mapping Geological Hydrogen Storage Capacity and Regional Heating Demands: An Applied UK Case Study. Appl. Energy 2021, 283, 116348. [Google Scholar] [CrossRef]
- Szamałek, K.; Szuflicki, M.; Mizerski, W. (Eds.) Bilans Perspektywicznych Zasobów Kopalin Polski; Państwowy Instytut Geologiczny—PIB: Warsaw, Poland, 2020.
- Wójcik, K.; Zacharski, J.; Łojek, M.; Wróblewska, S.; Kiersnowski, H.; Wa’skiewiczwa’skiewicz, K.; Wójcicki, A.; Laskowicz, R.; Sobié, K.; Peryt, T.; et al. New Opportunities for Oil and Gas Exploration in Poland-A Review. Energies 2022, 15, 1739. [Google Scholar] [CrossRef]
- Mazurek, S.; Tymiński, M.; Malon, A.; Szuflicki, M. (Eds.) Mineral Resources of Poland, 6th ed.; Polish Geological Institute—National Research Institute: Warsaw, Poland, 2022.
- MIDAS PIG-PIB. Available online: http://geoportal.pgi.gov.pl/portal/page/portal/midas (accessed on 13 November 2023).
- Jurga, B.; Kiersnowski, H.; Sidorczuk, M.; Pachytel, R. Crude Oil, Natural Gas—Mineral Resources of Poland as Seen by Polish Geological Survey; Polish Geological Institute: Warsaw, Poland, 2020.
- Uliasz-Misiak, B. CO2 Storage Capacity Classification and Site Selection Criteria. Gospod. Surowcami Miner. Miner. Resour. Manag. 2009, 25, 97–108. [Google Scholar]
- Holloway, S.; Rochelle, C.; Bateman, K.; Pearce, J.; Baily, H.; Metcalfe, R. The Underground Disposal of Carbon Dioxide: Final Report; Holloway, S., Ed.; British Geological Survey: Nottingham, UK, 1996.
- Johnston, I.A. The Noble-Abel Equation of State: Thermodynamic Derivations for Ballistics Modelling; Defence Science and Technology Organisation Edinburgh (Australia) Weapons Systems Div: Edinburgh, Australia, 2005.
- Bolton, W. Engineering Science, 7th ed.; Routledge: London, UK, 2020; ISBN 9780367554453. [Google Scholar]
- San Marchi, C.; Somerday, B.P. Thermodynamics of Gaseous Hydrogen and Hydrogen Transport in Metals. In Proceedings of the MRS Online Proceedings Library (OPL), Volume 1098: Symposium HH—The Hydrogen Economy; Cambridge University Press: Cambridge, UK, 2008; Volume 1098. [Google Scholar]
- H2data.de. H2data.de—Hydrogen Fact Sheet. Available online: http://www.h2data.de/ (accessed on 10 November 2023).
- Hystories Hydrogen Storage Resource for Depleted Fields and Aquifers in Europe. Available online: https://hystories.eu/hydrogen-storage-resource-for-depleted-fields-and-aquifers-in-europe/ (accessed on 10 November 2023).


Disclaimer/Publisher’s Note: The statements, opinions and data contained in all publications are solely those of the individual author(s) and contributor(s) and not of MDPI and/or the editor(s). MDPI and/or the editor(s) disclaim responsibility for any injury to people or property resulting from any ideas, methods, instructions or products referred to in the content. |
© 2024 by the authors. Licensee MDPI, Basel, Switzerland. This article is an open access article distributed under the terms and conditions of the Creative Commons Attribution (CC BY) license (https://creativecommons.org/licenses/by/4.0/).