Article

Integration of Well Logging and Seismic Data for the Prognosis of Reservoir Properties of Carbonates

by
Weronika Kaczmarczyk-Kuszpit
* and
Krzysztof Sowiżdżał
Oil and Gas Institute—National Research Institute, 25A Lubicz Str., 31-503 Kraków, Poland
*
Author to whom correspondence should be addressed.
Energies 2024, 17(2), 355; https://doi.org/10.3390/en17020355
Submission received: 12 December 2023 / Revised: 5 January 2024 / Accepted: 8 January 2024 / Published: 10 January 2024
(This article belongs to the Special Issue Carbonate Reservoirs, Geothermal Resources and Well Logging)

Abstract

:
Due to the complex nature of the pore system and the diversity of pore types, carbonate rocks pose a challenge in terms of their spatial characterization. Unlike sandstones, permeability in carbonates is often not correlated conclusively with porosity. A methodology for preliminary qualitative spatial characterization of reservoirs in carbonate rocks is presented in this article, with a focus on interparametric relationships. It endeavors to apply this methodology to a reservoir situated within the Main Dolomite formation in the Polish Lowlands. Fundamental analyses rely on data plotted within rock physics templates (RPT), specifically, cross-plots of acoustic impedance as a function of the product of compressional and shear wave velocities in well log profiles. The analysis of interparametric relationships was conducted on well log profiles and subsequently integrated with seismic data using neural network techniques. Areas with the greatest potential for hydrocarbon accumulation and areas potentially exhibiting enhanced reservoir properties were identified based on the outcomes of the well log profile analysis and parametric models. The qualitative assessment of the reservoir, rooted in interparametric dependencies encompassing lithofacies characteristics and elastic and petrophysical parameters, together with reservoir fluid saturation, forms the basis for further, more detailed reservoir analysis, potentially focusing on fracture modeling.

1. Introduction

Due to the complex nature of the pore system and the variety of pore space types, carbonate rocks present a challenge in terms of their characterization. Carbonate rocks exhibit diverse pore types that form as a result of both primary porosity during sedimentation and secondary porosity generated by diagenetic processes [1,2,3]. Primary porosity in clastic rocks and certain carbonates (such as ooids) depends on grain size, packing, shape, sorting, and intergranular matrix quantity and cementation. In carbonate rocks, fluid flow occurs within the rock structure (primary porosity), where permeability is characterized by low values (ranging from 0.1 to 1 mD [1,2]), and within fractures (secondary porosity) [4,5,6,7]. The complexity of pore systems influences permeability variability at constant porosity, which can be significantly high, reaching up to three to five orders of magnitude [1]. An important aspect in characterizing carbonate rocks is the analysis of the relationship between porosity and permeability, as well as the petrophysical characteristics of the fracture systems [2]. A connected pore system ensures fluid flow into the wellbores; thus, to limit the risk of new areas for effective exploitation, the pore–fracture system must be supported by sophisticated analysis. However, in carbonate reservoirs, predicting permeability from porosity alone is often difficult due to complex pore systems, which are due to poor porosity–permeability relationships [1]. On the other hand, permeability in fractured reservoirs can be estimated based on the ‘cubic law’, providing a simple relationship between the hydraulic aperture of a fracture and its permeability [2,4]. Nevertheless, achieving a precise understanding of the porosity–permeability relationship demands the utilization of suitable techniques that describe these associations. Within a single reservoir and varying sedimentation environments of carbonate rocks, the pore space system may be so diverse that dolomitization processes (increasing pore space volume) and calcitization (filling free spaces) can create isolating barriers in areas of high permeability, hindering the movement of hydrocarbons to production wells. This article analyzes such a reservoir with a complex pore space system, for which a generalized qualitative interdisciplinary characterization has been developed, considering microfacial variations, petrophysical and elastic parameters, as well as fluid saturation. For this purpose, a rock physics template was used, which serves to characterize hydrocarbon reservoirs by defining the ranges of values for various parameters characterizing hydrocarbon-saturated zones from water-saturated zones. The rock physics template is based on the relationship between elastic properties (velocity, impedance, and Vp/Vs ratio) and reservoir properties (water saturation, porosity, and density). This technique was proposed by Odegaard and Avseth [8] based on Dvorkin and Nur’s theory [9], which suggests that mineral and fluid content in reservoir rocks can be predicted based on a cross-plot of the Vp/Vs ratio and AI. This method is mainly applied in granular rocks, yielding more predictable results [10]. While in sandstone rocks, the templates differentiate zones with increased porosity and fluid saturation quite distinctly, in carbonate rocks, due to the complex pore system and diverse pore geometry, the application of this method has limitations primarily due to the scattering of the relationship between porosity and P-wave velocity [10]. This work attempts to investigate the relationship between various parameters of rock physics templates and apply the observed dependencies in three-dimensional parametric models. The research is based on data derived from borehole profiles and seismic data. This study utilized Petrel software version 2021.3, specialized in spatial reservoir characterization. The analyzed reservoir, accumulated within carbonate formations, is distinguished by inferior reservoir properties and belongs to a group of deposits located in this area. The outcome in the form of spatial models incorporating parametric relationships serves as a starting point for more detailed quantitative analyses that go beyond observed dependencies.

Geological Settings

The geological formations constituting the analyzed area are composed of three structural units: the Variscan, Permian-Mesozoic, and Cenozoic. Within the analyzed area, the Zechstein complex has been thoroughly examined through numerous boreholes. It consists of four cyclothems, characterized by variable thickness and facies, primarily sedimentary in nature, determined by the relief of the Zechstein Sea surface. The Main Dolomite units play a pivotal role in hydrocarbon accumulation. Within the broader context of the analyzed area, the profiles of the Main Dolomite represent distinct paleogeographic zones: the base of the carbonate platform slope, the barrier, and the platform plain [11]. Petrographic analysis of the examined Main Dolomite profiles indicated that diagenetic alterations and the development of pore space occurred through multiple stages. During deposition, these units diversified into sediments with varying reservoir properties, contingent upon facies and paleogeographic zones [12]. Diagenetic processes significantly impacted these formations. Some led to deteriorating reservoir properties (compaction, cementation, and neomorphism), while others enhanced them (grain dissolution and fracturing). The entirety of the analyzed area lies within the platform plain. The transgression of the Main Dolomite encountered a morphologically diverse surface in this part of the platform, significantly influencing the formation of carbonate units. A detailed examination of these sediments (via sedimentological and petrographic observations) revealed significant microfacial diversification stemming from bathymetric differences. These variances affected sedimentation regimes, contributing to the creation of high- and low-energy zones within the platform plain [11]. Core analysis, supported by detailed microscopic observations, facilitated the identification of diverse microfacial divisions represented by bandstones, mudstones, wackestones, packstones, grainstones, and floatstones—constructed in varied proportions with ooids, oncoids, intraclasts, peloids, and bioclasts. Identified microbial formations manifest in structures (stromatolites), microbial mats, and thin biolaminations stabilizing carbonate sediments [13]. Additionally, occurrences of microbial colonies were observed. Such a diversified formation signifies variable sedimentation conditions within different carbonate deposition subenvironments in the analyzed area. The additional challenge in characterizing this reservoir is the presence of mixed wettability and its impact on reservoir properties [14]. This variation is attributed to the diversified paleorelief of the sulfate platform, where the sedimentation of the Main Dolomite did not occur concurrently. Substantial variability within a single lithological interval hinders the determination of reservoir properties, thus posing challenges in attempting to reconstruct spatial distributions of the analyzed parameters.
Numerous researchers have investigated the properties of carbonate formations within wellbore profiles in this region [11,15,16,17,18,19]. Additionally, several publications have addressed their spatial characteristics [20,21,22,23,24,25]. The methodology outlined in [19] integrates various data sources, including laboratory tests, standard well logging measurements, and XRMI imager data interpretation, enabling the determination of porosity and permeability in the fracture system of carbonate rock within wellbore profiles. The outcomes of this approach can be combined with the procedure outlined in this article, focusing on a detailed qualitative spatial characterization of the fractured reservoir, presenting three types of fractures, micro, mezzo, and macrofractures, as described in the aforementioned article. Nevertheless, the procedure outlined in this article represents an initial qualitative characterization of the reservoir preceding more detailed analyses within well profiles.

2. Methods

The proposed methodology in this study differs from the widely used approaches in spatial reservoir characterization using 3D models. Instead, it focuses on a classification analysis of elastic parameters in relation to petrophysical parameters, reservoir fluid saturation, and lithofacies characteristics for the preliminary characterization of a carbonate reservoir. Similar analyses concerned the classification based on the interparametric relationship applied in wellbore profile analyses, e.g., [10,26], utilized in seismic data analysis e.g., [27,28,29], or facies modeling in 3D grids, e.g., [30]. The underlying concept of this approach is to capture the interparametric relationships, which will be reflected in subsequent, more detailed stages of reservoir characterization. The outcome of employing such an approach holds potential applications across various disciplines such as spatial sedimentological analysis, petrophysics, geomechanics, and reservoir engineering.
The sequence of procedures proposed in this study expands upon the standard methodologies by incorporating several stages, constituting the initial spatial characterization of the reservoir. These stages further facilitate quantitative reservoir understanding through petrophysical modeling. They include the following:
-
Classification analyses of interparameters on cross-plots based on well data (determining petroelastic facies/lithofacies and characterizing other parameters relevant to specific objectives, e.g., identifying zones with enhanced reservoir properties).
-
Integration of the obtained results with seismic data (seismic inversion).
-
Based on the above, subsequent parametric modeling along with conventional geostatistical data analysis.
Formally, this work is divided into two main parts: analyses of well log profiles and the application of the results of these analyses in spatial characterization.
Analyses of well log profiles:
  • Lithological/Lithofacial Analyses—According to the proposed methodology, the foundation for the spatial characterization of the reservoir lies in defining lithological/lithofacial classes with diversified ranges of both elastic and petrophysical parameter values. This is the most crucial step, as its outcome determines the results of subsequent stages of reservoir characterization.
  • Characterization of Well Data—Within the identified lithological/lithofacial classes from the earlier stage, an analysis of the parametric variability in significant parameters (acoustic impedance AI, compressional wave velocity and shear wave velocity ratio VpVs, porosity PHI, Young modulus YM, Poisson ratio PR, and Stoneley wave velocity Vstoneley) is conducted. Their ranges of values are determined and applied in the geostatistical modeling stage. In the case of carbonate reservoirs, it is crucial to characterize the occurrence of intervals susceptible to mechanical damage (potential occurrence of fractures).
  • Determination of Fluid Saturation Classes and Zones with Enhanced Reservoir Properties—Cross-plot analyses characterize the variability in fluid saturation in well log profiles. They identify classes of hydrocarbon saturation and determine intervals with the highest potential for fracture occurrence. The results from this stage will ultimately support the spatial identification of key areas.
The application of well log analysis results in the spatial characterization of the area:
The integration of well and seismic data occurs within a 3D interpolation grid, defining the top and base of the model. The optimization of seismic data usage involves seeking the most effective method to integrate well data with extracted seismic data from well profiles. Establishing a sufficiently high correlation between these data groups enables the tracking of the spatial variability in selected seismic parameters and the leveraging of these correlations in geostatistical data analysis [31].
4.
Seismic Inversion—The procedure of inverting three fundamental parameters: AI, Vp, and VpVs are undertaken. The results of this stage are constituted by secondary data aiding in determining trends in the distribution of interdependent well data parameters. Examining the relationship between seismic volume amplitudes and averaged compressional wave velocities in well profiles at vertical grid resolution revealed a correlation value of 0.3, which was insufficient to justify direct utilization of the amplitude volume as a controlling parameter for the spatial distribution of Vp and other parameters with similarly low correlation levels. Consequently, a seismic inversion procedure was conducted. Subsequently, a simultaneous inversion of several parameters (PHI, RHOB, Vp, Vs, AI, Vp/Vs, Young’s modulus, Poisson’s ratio, and Stoneley wave velocities) was performed, basing the inversion on well logs; structural surfaces (top and base of Main Dolomite); and seismic data (amplitude volume)—guiding the spatial distribution of inversion parameters.
5.
Lithological/Lithofacial Modeling—The outcomes of the initial analyses in well profiles undergo spatial distribution using geostatistical tools and the results of seismic inversion. Individual subsequent analyses are conducted within the scope of the occurrence of distinct lithologies/lithofacies.
6.
Parametric Modeling (AI, VpVs, PHI, YM, PR, and VStoneley)—Spatial parametric modeling is independently performed within each defined class based on the interpretations of well geophysical curves and inversion results. The relationship derived from the second stage of analyses in well profiles is reproduced, and the application of geostatistical tools ensures the physical nature of the final modeling outcome.
7.
Classification Model of Fluid Saturation and Zones with Enhanced Reservoir Properties—Ultimately, within the developed parametric model, a qualitative model of fluid saturation is reconstructed, reflecting the classification results of this parameter in well profiles. Sequentially, a spatial distribution of zones indicating potentially increased occurrence of fractures is similarly reproduced.

3. Results and Discussion

3.1. Analyses in Well Log Profiles

(1)
Microfacies analysis
In the analyzed interval of the Main Dolomite, four microfacies types were distinguished: mud-rich, grain-rich, biogenic, and anhydrite. Microfacies are differentiated based on the variability in sedimentary textures observed under microscopic examination. Microfacial interpretation was available in four out of ten boreholes. Comparing porosity, AI, and VpVs logs with microfacies types, due to the textural nature of observations, only the anhydrite units can be distinguished as a cluster of points characterized by low porosity and high AI (points in purple color on Figure 1). The remaining types blend with each other, although grain-rich units seem to dominate (marked in yellow). On the adjacent cross-plot, the degree of water saturation within the reservoir is visualized, indicating that both anhydrite units and those with acoustic impedance exceeding 15 [Pa·s/m] and porosity below 15% are associated with reservoir water saturation.
The input data from a sample well profile of available data are presented in Figure 1 together with cross-plots showing the relationships between VpVs, AI, and PHI parameters in all analyzed wells concerning the division of microfacies (1—mudstones, 2—grainstones, 3—biogenic sediments, and 4—anhydrite) and formation of water saturation. Meanwhile, for the construction of the microfacial model, only the anhydrite units were isolated, which will not be involved in identifying hydrocarbon accumulation zones due to the complete water saturation of these formations, visible in Figure 1 (the points assigned to anhydrites—coded as 4 in Figure 1A—correlate with total water saturation in Figure 1B). The remaining units (grainstones, mudstones, and biogenic sediments) were considered as potential hydrocarbon reservoirs. A significant portion of the grainstones (marked as code 2, represented by yellow points in Figure 1A) are saturated with hydrocarbons (highlighted points in red and yellow where water saturation is below 0.3). Certain points assigned to grainstones, similar to anhydrites, show water saturation, especially those where the VpVs and AI values exceed 1.7 and 16.5 [kPa s/m], respectively. Observed relationships were reconstructed within a spatial relational model in the final stage.
(2)
Characterization of Well Data
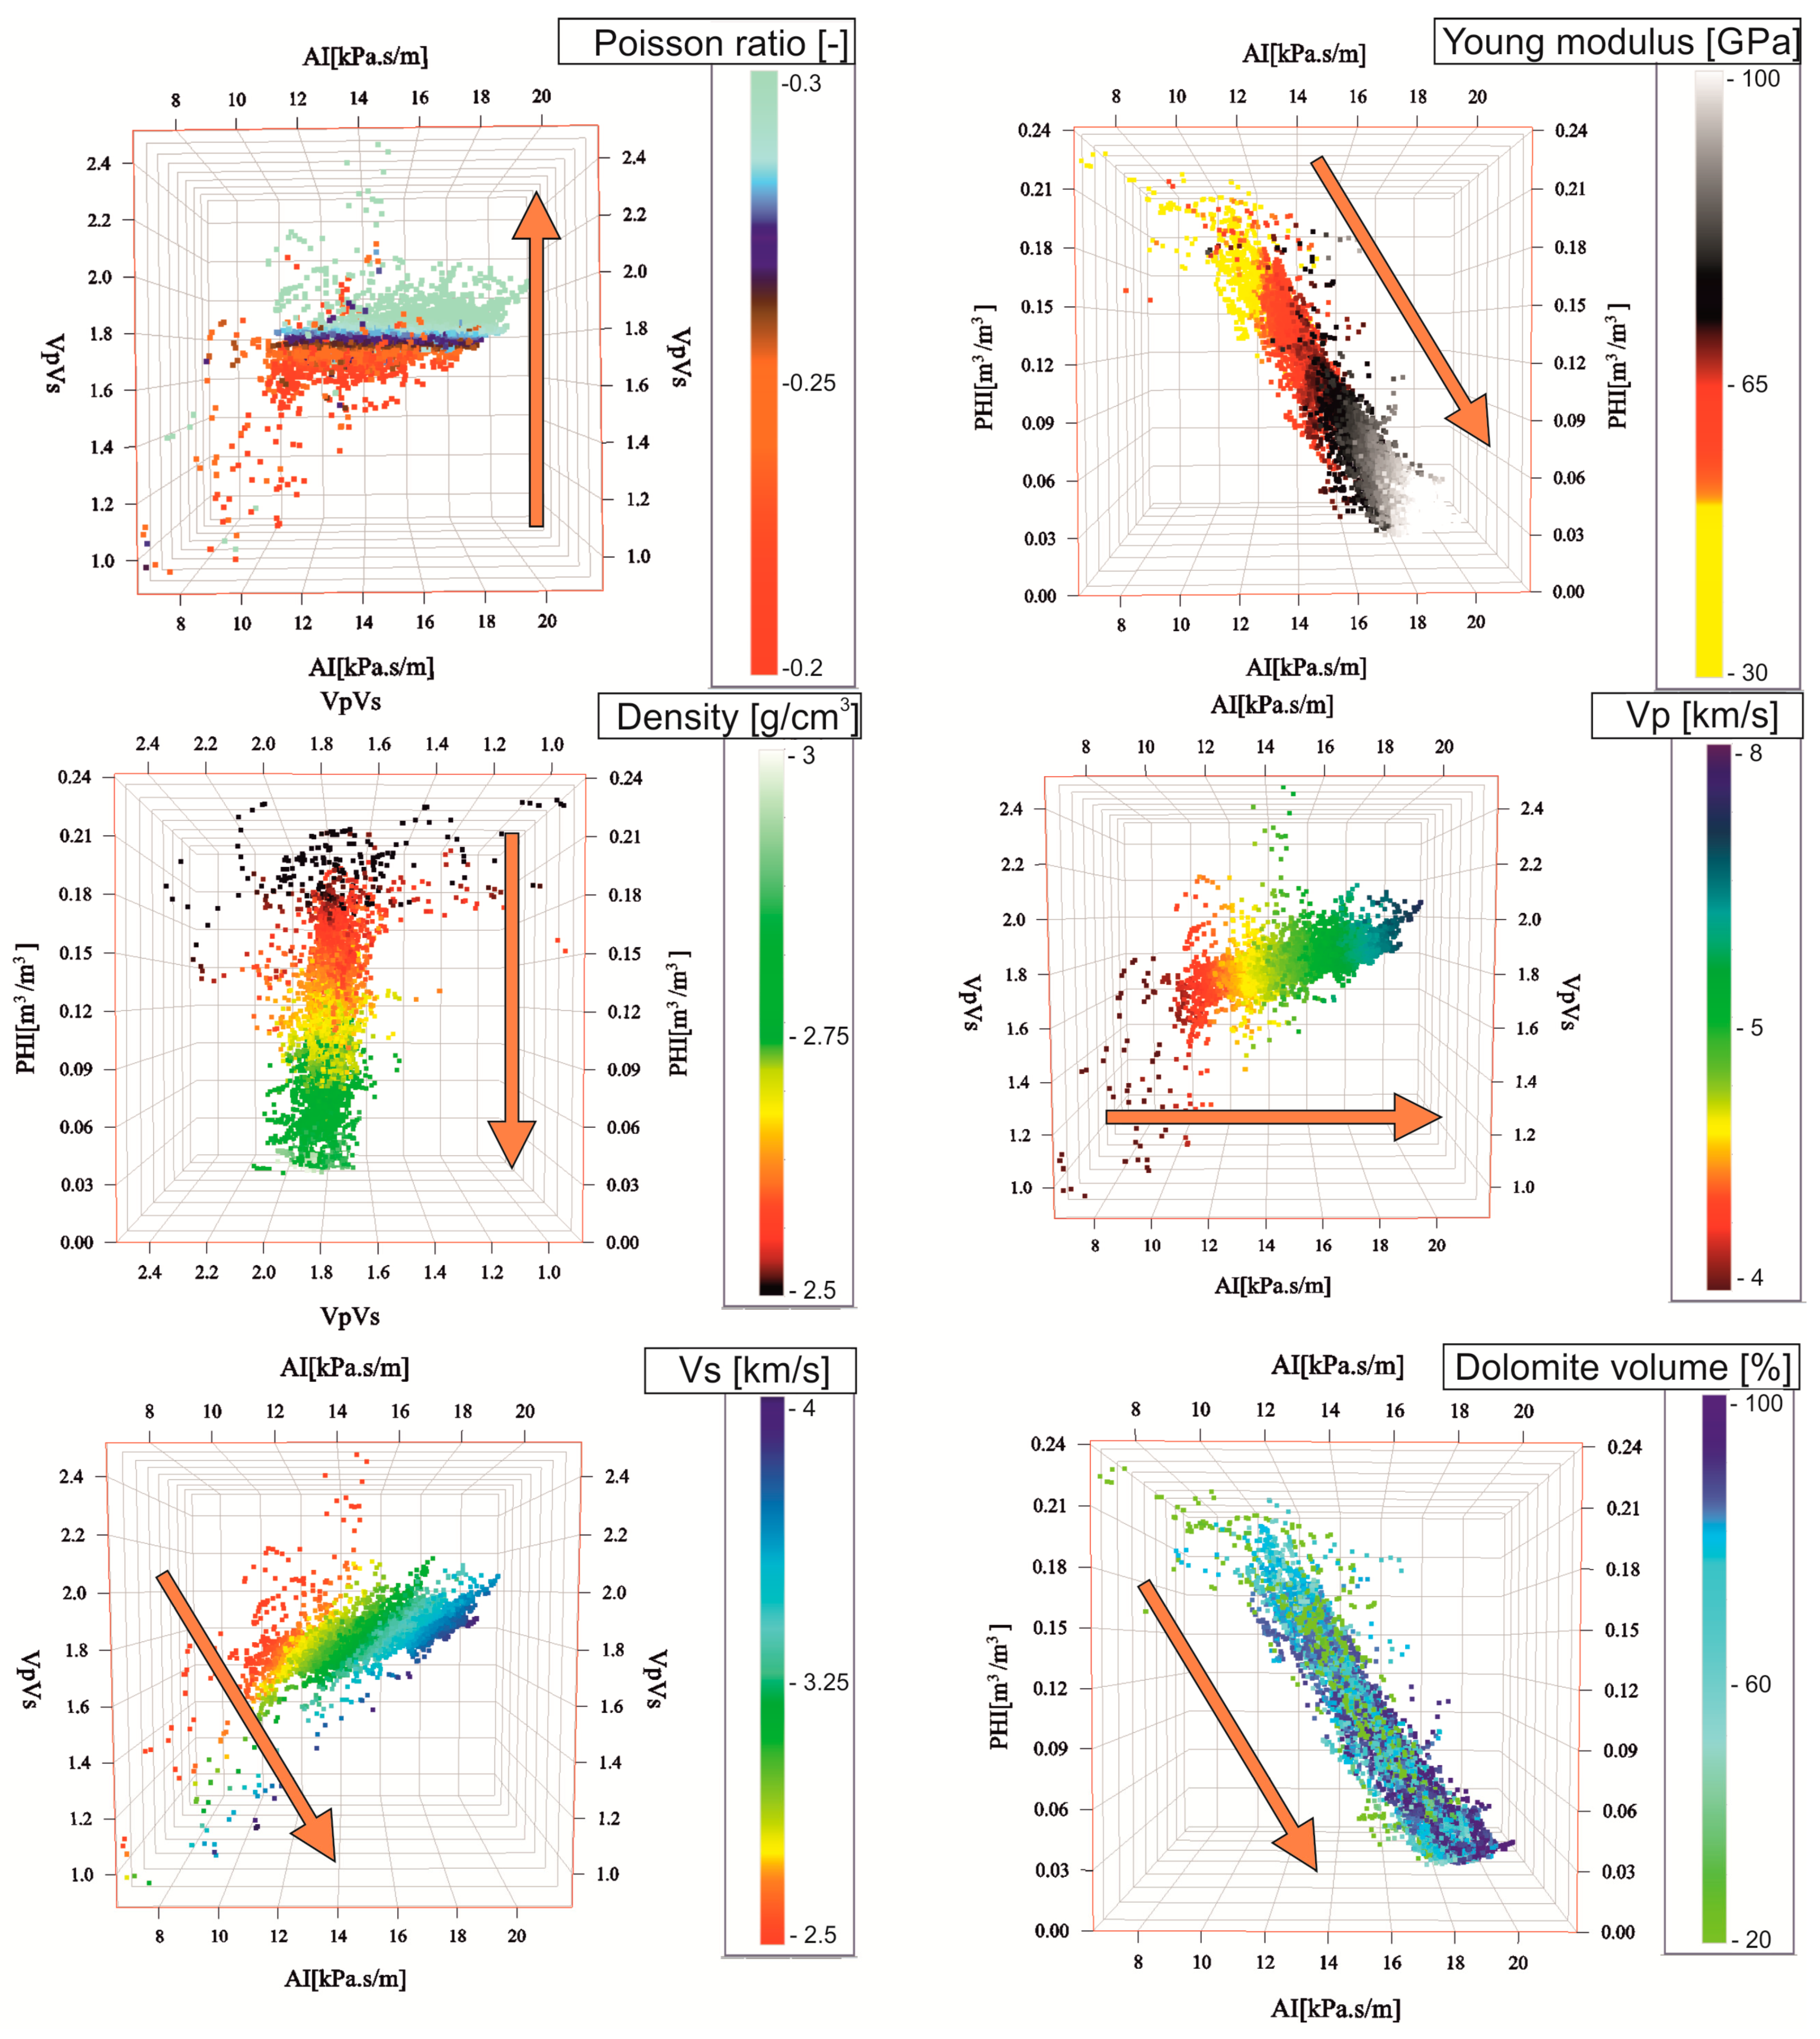
In the subsequent step, the same cross-plot of porosity vs. acoustic impedance vs. VpVs ratio was presented as a function of other parameters such as the Poisson’s ratio, Young’s modulus, density, Vp, Vs, and dolomite content, all of which were available in all 10 wells located within the analyzed reservoir area (Figure 2). The directional trends of parameter values, constituting the fourth variable on the plot, were also indicated. These dependencies can be applied during the stage of reconstructing parametric spatial distributions. Within the scope of the case study analyzed in this article, some of these dependencies will be considered in the final phase of defining hydrocarbon-saturated zones (Poisson’s ratio) and areas susceptible to mechanical damage (Young’s modulus).
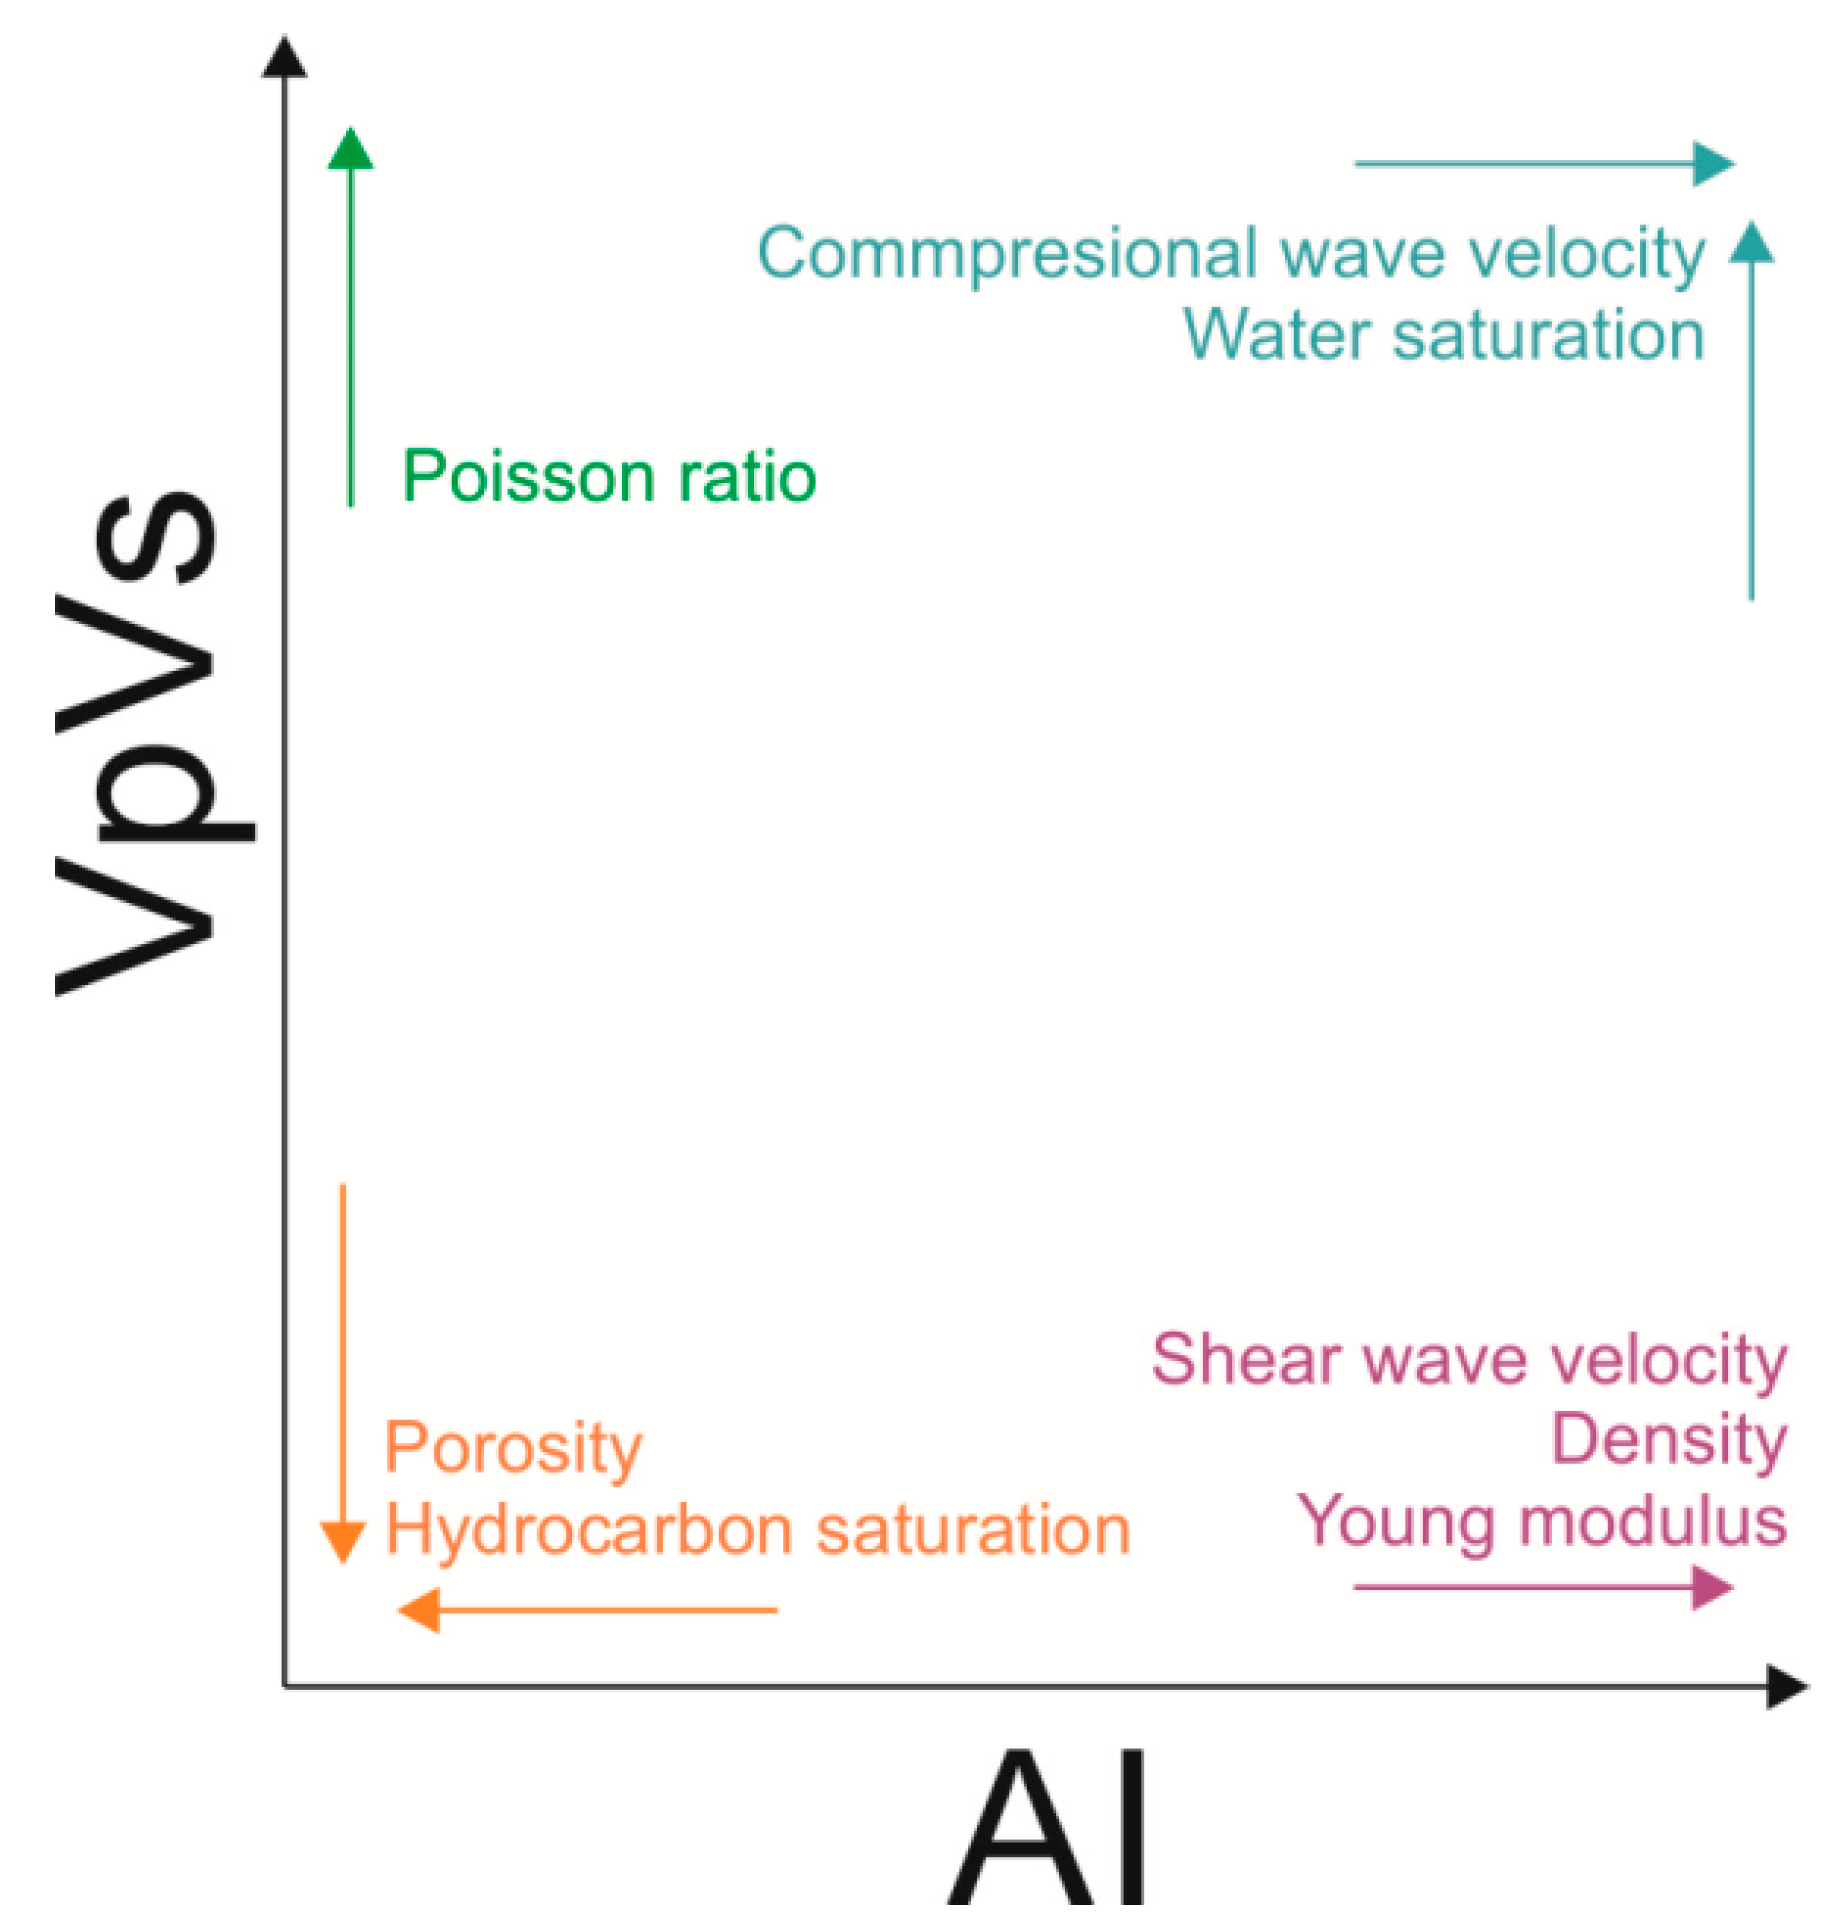
Based on the aforementioned information, a chart (Figure 3) was constructed delineating the relationships between data profiles in wells concerning the VpVs and AI parameters.
(3)
Determining classes of fluid saturation within the reservoir and intervals exhibiting enhanced reservoir properties
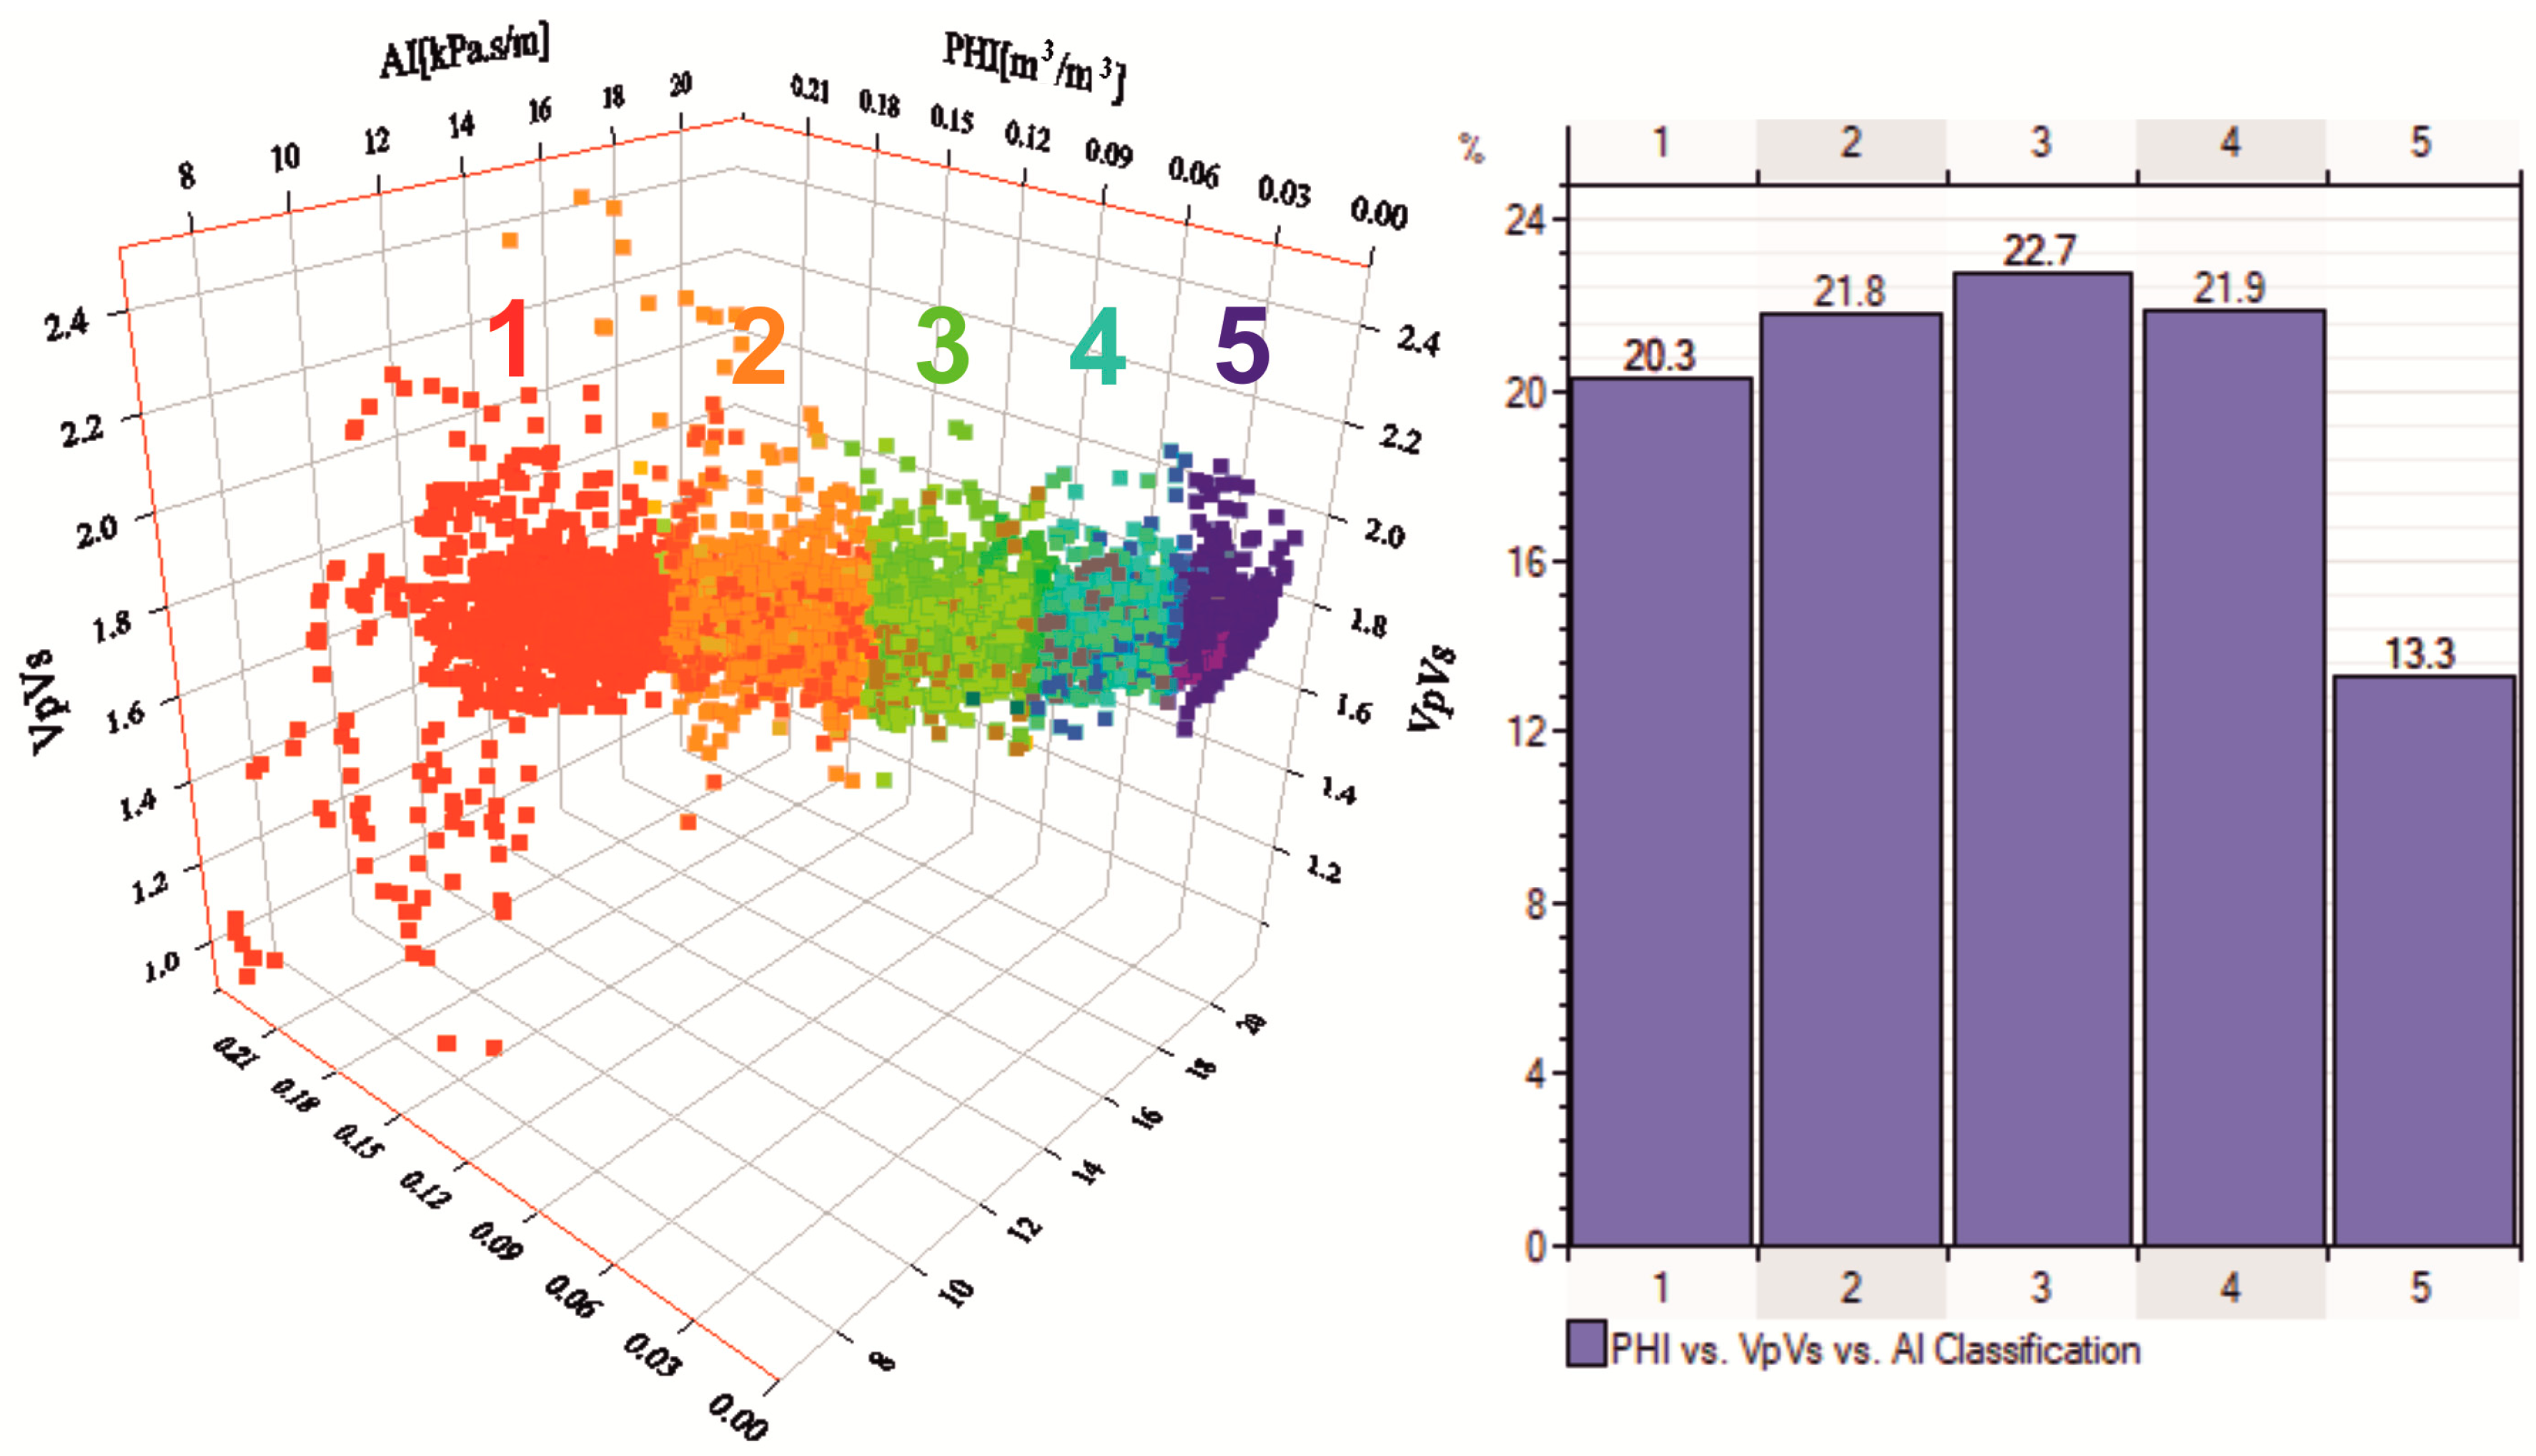
In the third step, based on observed relationships, five saturation classes were arbitrarily delineated, guided by saturation levels defined by the 1-Sw coefficient. Class 1 defines the lowest acoustic impedance values and consequently the highest porosity values, indicating hydrocarbon saturation, while class 5 is represented by the highest AI values and the lowest PHI values. The percentage distribution of each class is depicted in the histogram below (Figure 4).
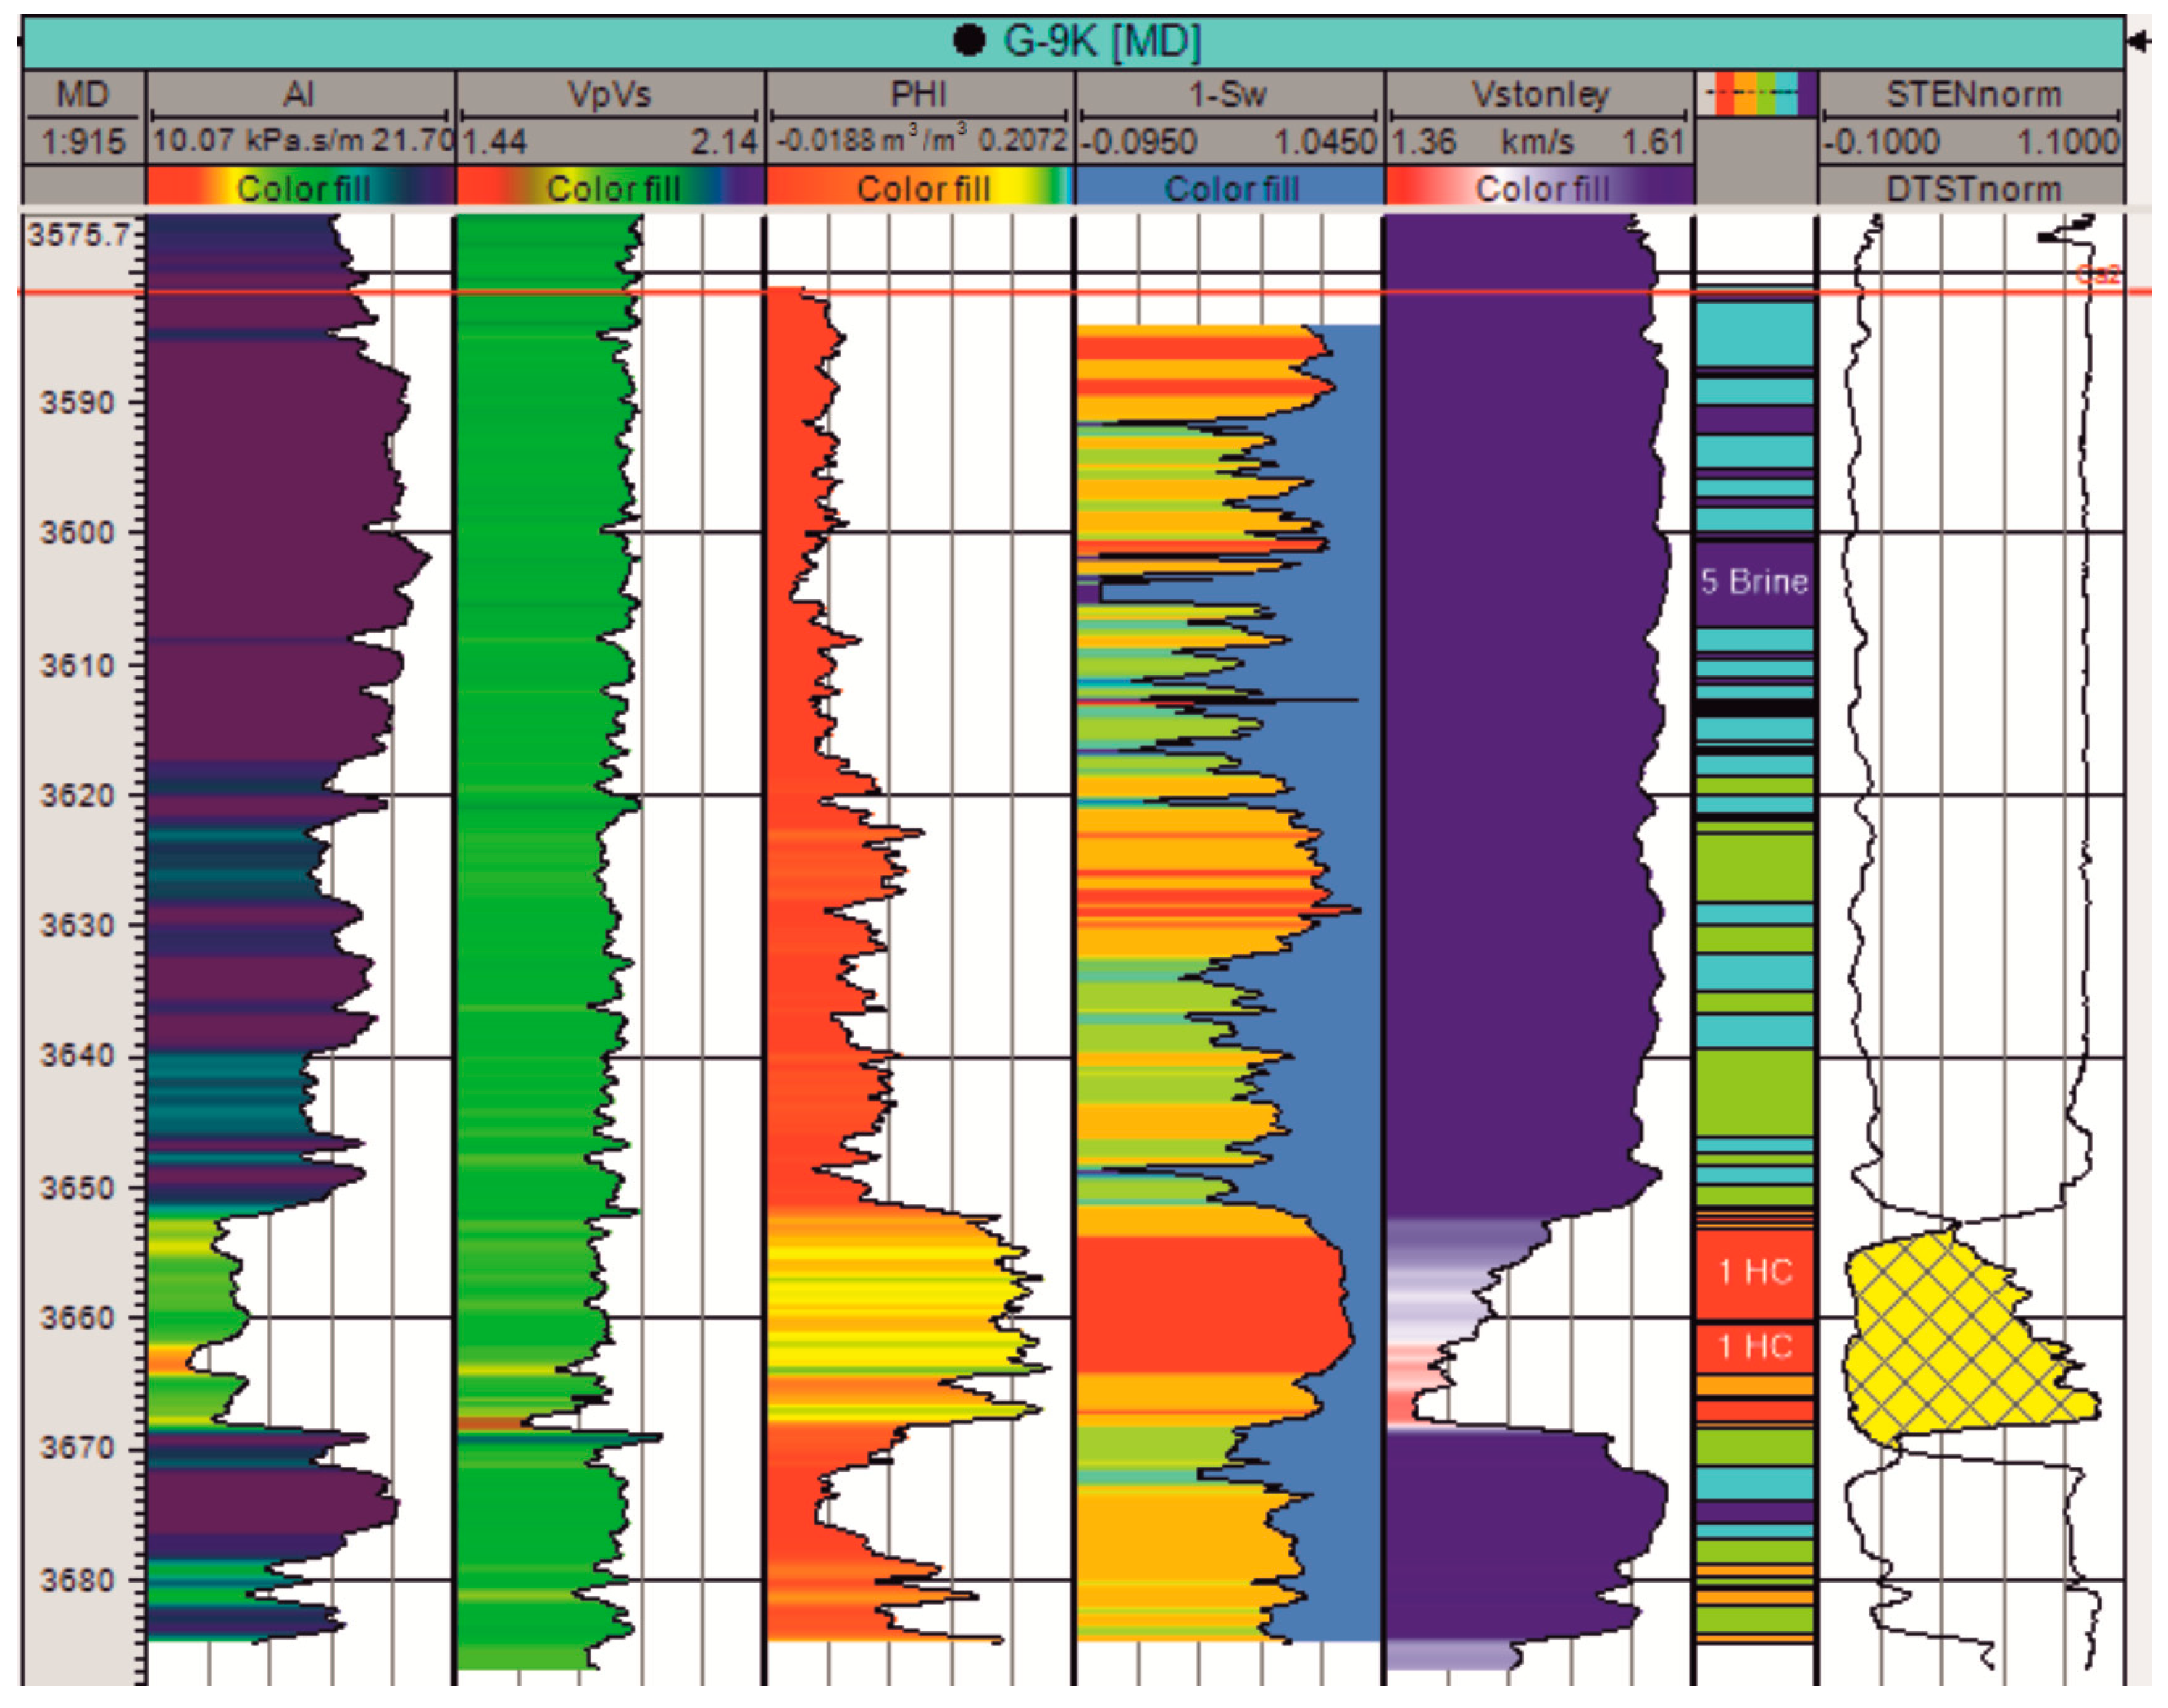
The aforementioned classification was applied in the form of discrete logs within well profiles where data were available for analysis on the cross-plot. Below (Figure 5), a set of well log curves along with the classification outcome is presented, illustrating an example from one of the analyzed wells (G-9K). Alongside the set of parameter curves considered in the previous analysis, the Stoneley wave velocity is also showcased, potentially indicating zones with enhanced reservoir properties due to their low values. Finally, on the last track, the Stoneley wave interval time curves are juxtaposed with the calculated wave energy, indicating a divergence that suggests a zone with good permeability.

3.2. The Application of Well Analysis Results in Spatially Characterizing the Area

(4)
Seismic inversion
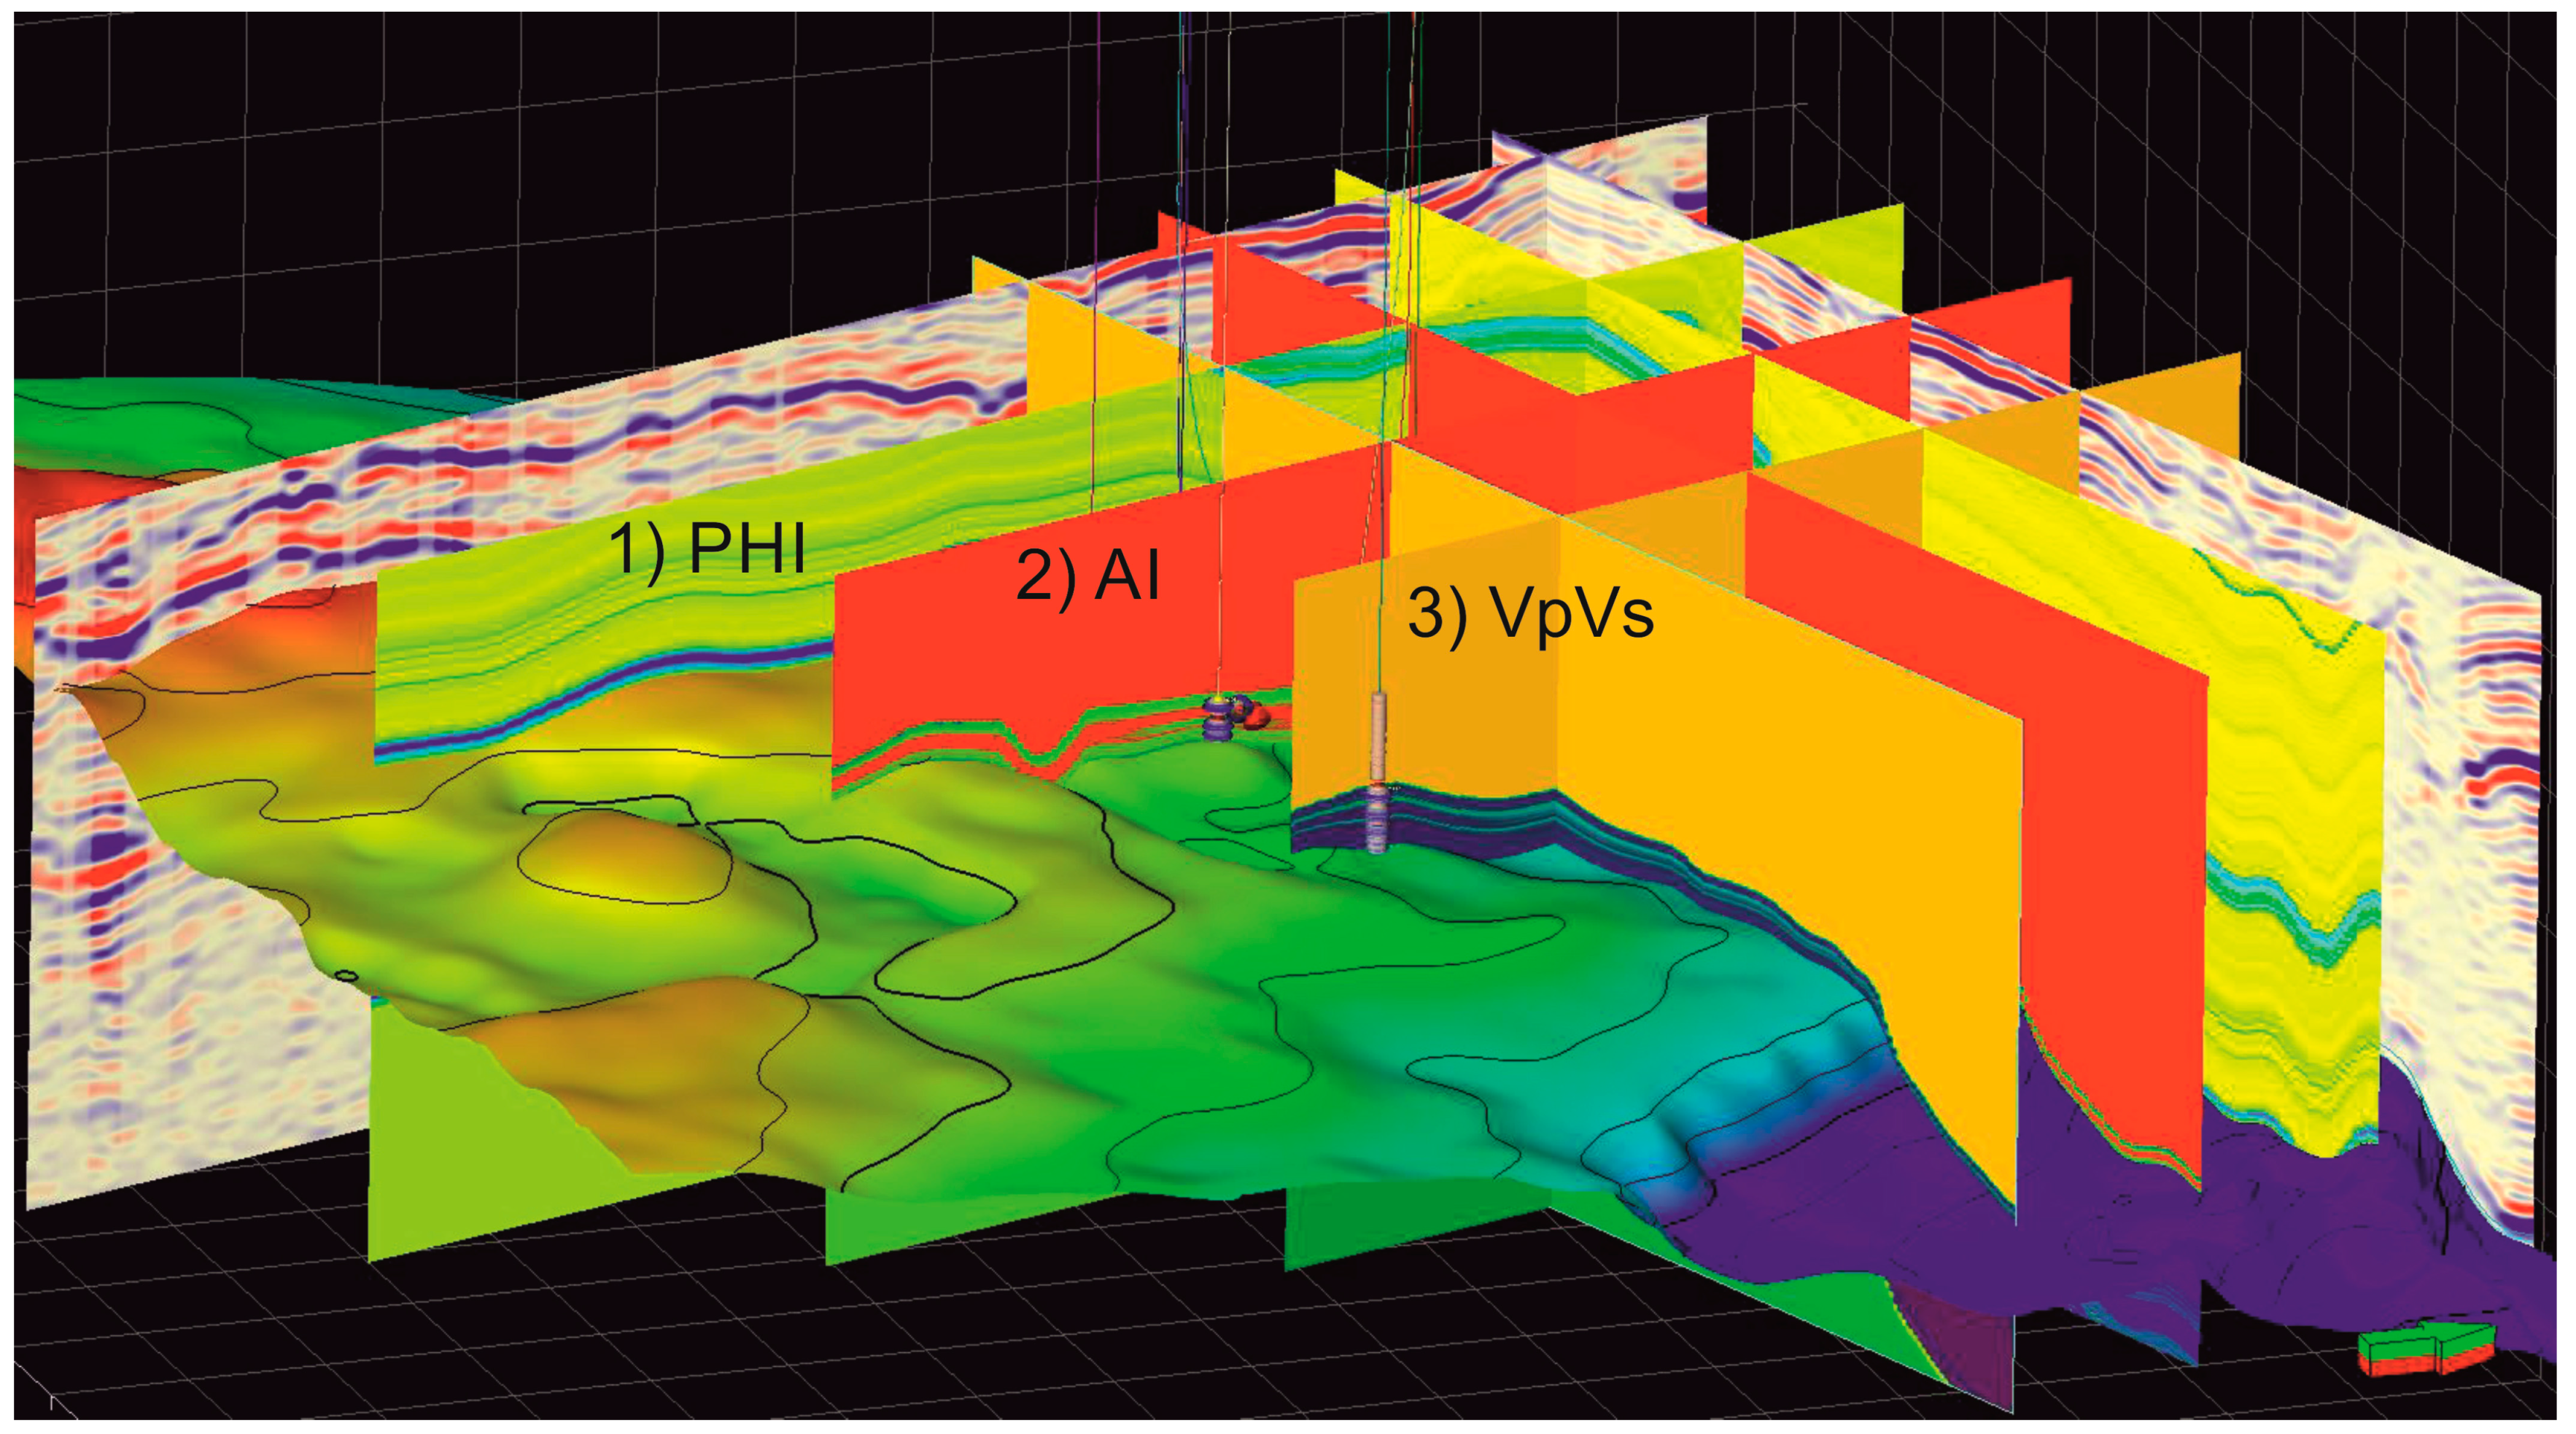
A simultaneous inversion of multiple parameters (PHI, RHOB, Vp, Vs, AI, Vp/Vs, Young’s modulus, Poisson’s ratio, and Stoneley wave velocities) was conducted, utilizing well logs, structural surfaces, and seismic data for the inversion process (Figure 6).
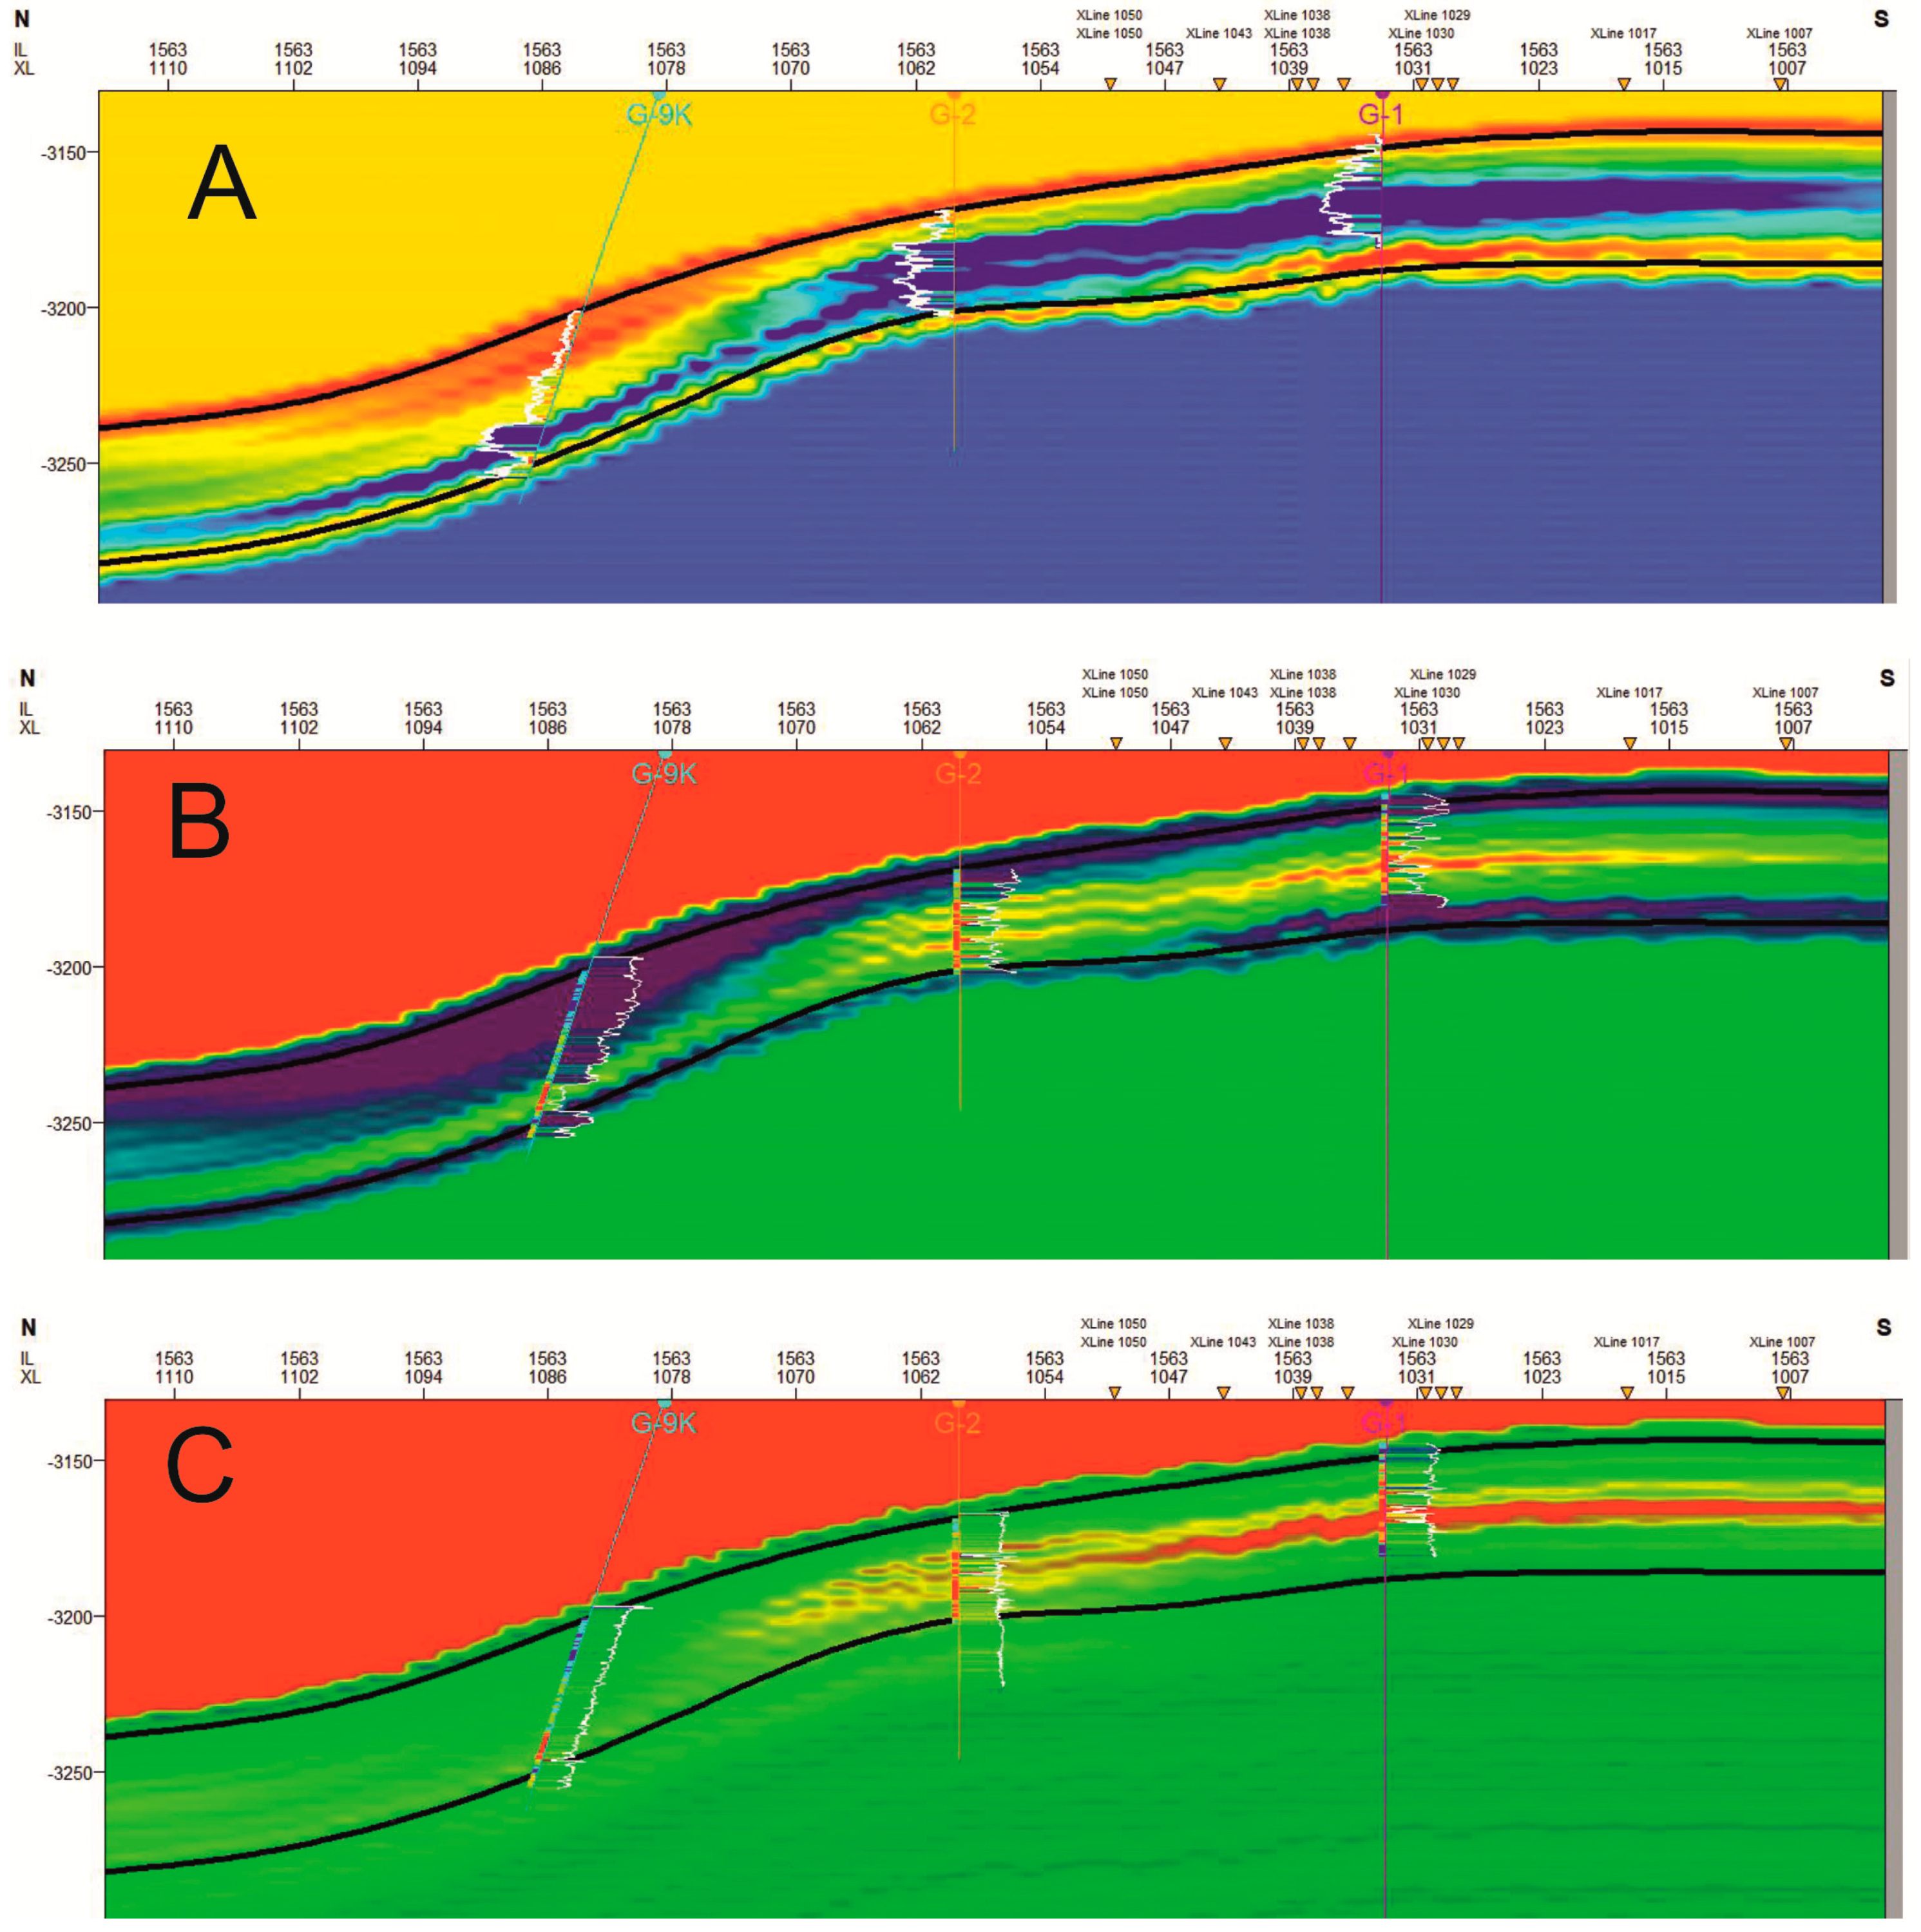
The obtained results, primarily stemming from well data interpolation and thus not identifying significant exploration-related anomalies, provide a basis for further analysis (with a higher correlation coefficient of 0.8), illustrating the concept presented in this article. The cross-sections (Figure 7) depict the results of parametric inversion along with curves representing this outcome in the profiles of three well profiles.
(5)
Parametrical modeling
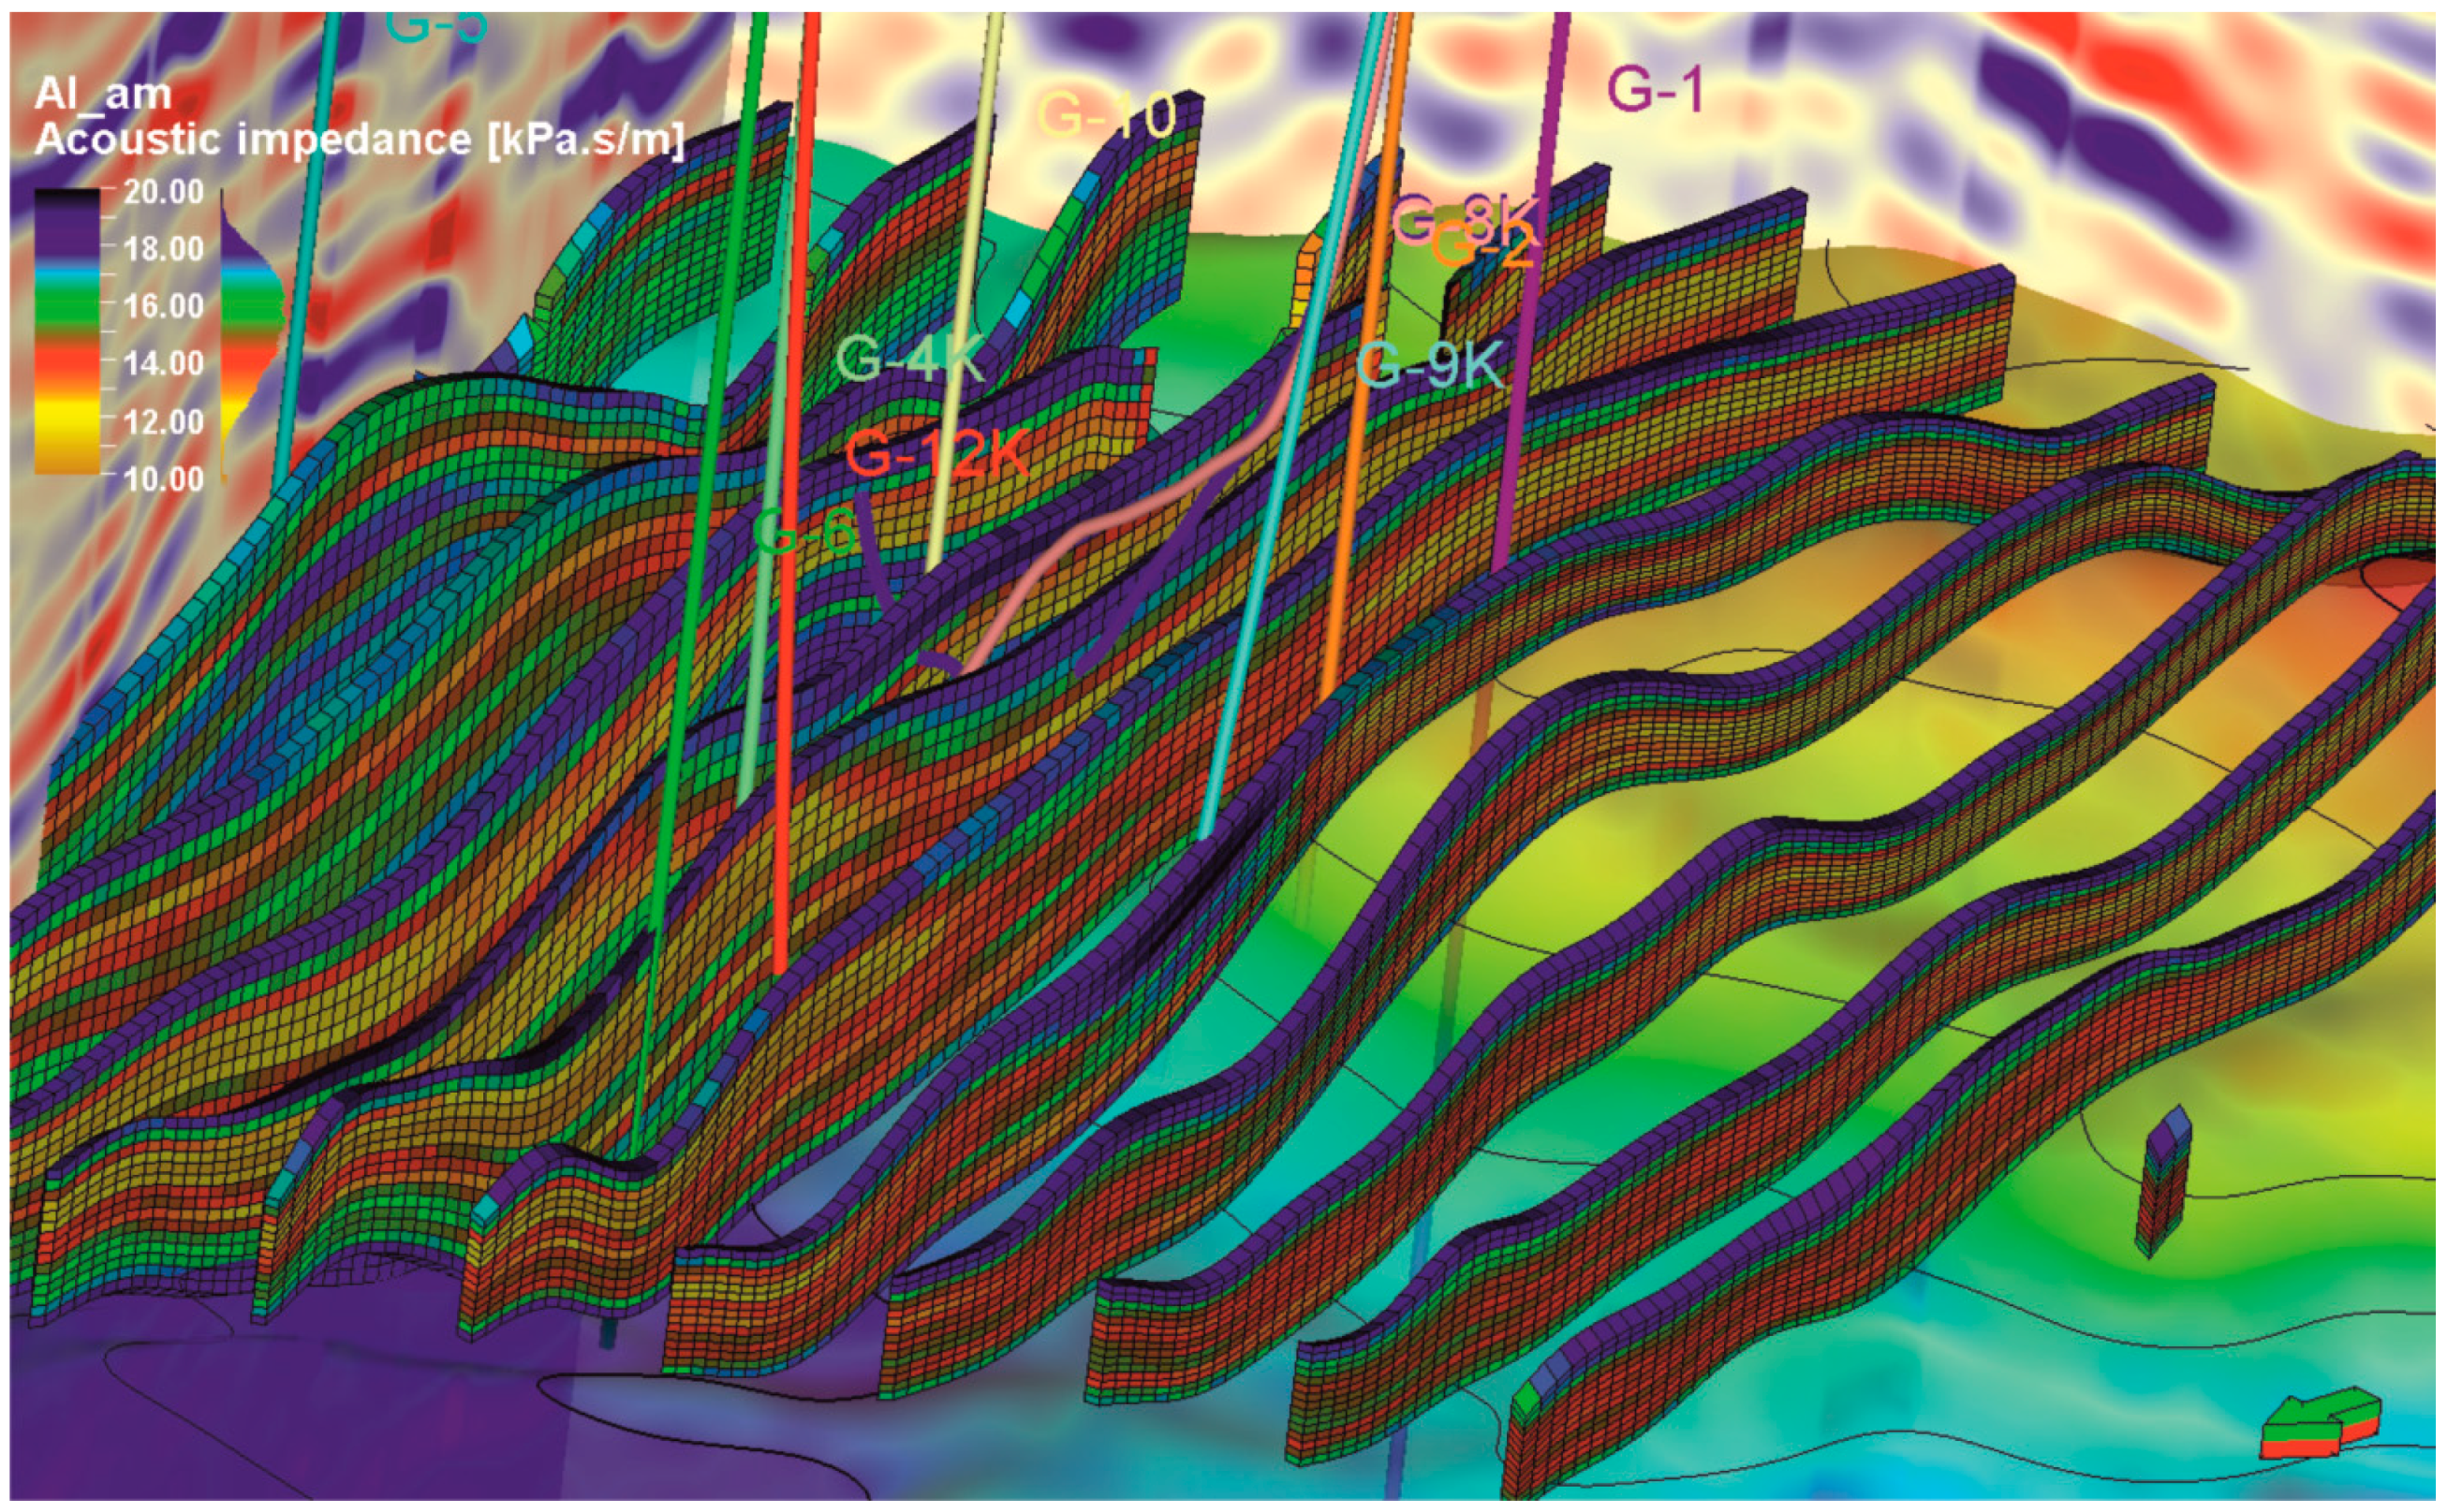
During the modeling process, uniform standard procedures for parametric spatial distribution reconstruction were employed across all parameters. These procedures involved defining value ranges, distribution curves, semivariogram extents, and significantly, incorporating seismic inversion outcomes in establishing distribution trends. Spatial models were generated for AI, VpVs, PHI, Young’s modulus, Poisson’s ratio, and Stoneley wave velocity. Presented below is the outcome of the acoustic impedance modeling (Figure 8).
Based on an independent model depicting the spatial distribution of acoustic impedance, it is possible to initially delineate the reservoir concerning variations in reservoir fluid saturation. Low values of this parameter suggest potential hydrocarbon saturation, while its increase indicates a rising involvement of water saturation. The lowest AI values, observed in the dataset within Figure 5, also align with increased porosities and a plausible fracture zone.
(6)
The classification model of fluid saturation
The final stage involved applying the observed relationships in well profiles within the 3D model, based on the spatial models of individual parameters (AI, VpVs, PHI, YM, PR, and Vstoneley) created in the previous step. This stage aimed to delineate zones with high hydrocarbon saturation potential, within which the subsequent analysis of susceptibility to mechanical damage would be conducted. A model was constructed based on defined saturation classes, parametric models, and a neural network approach. Using a training dataset, a function was determined to approximate the relationship between input data (in this case, parametric models) and the supervisory parameter, which were the identified saturation classes in the well profiles. Figure 9 presents correlation coefficient values between saturation classes and the set of parametric models.
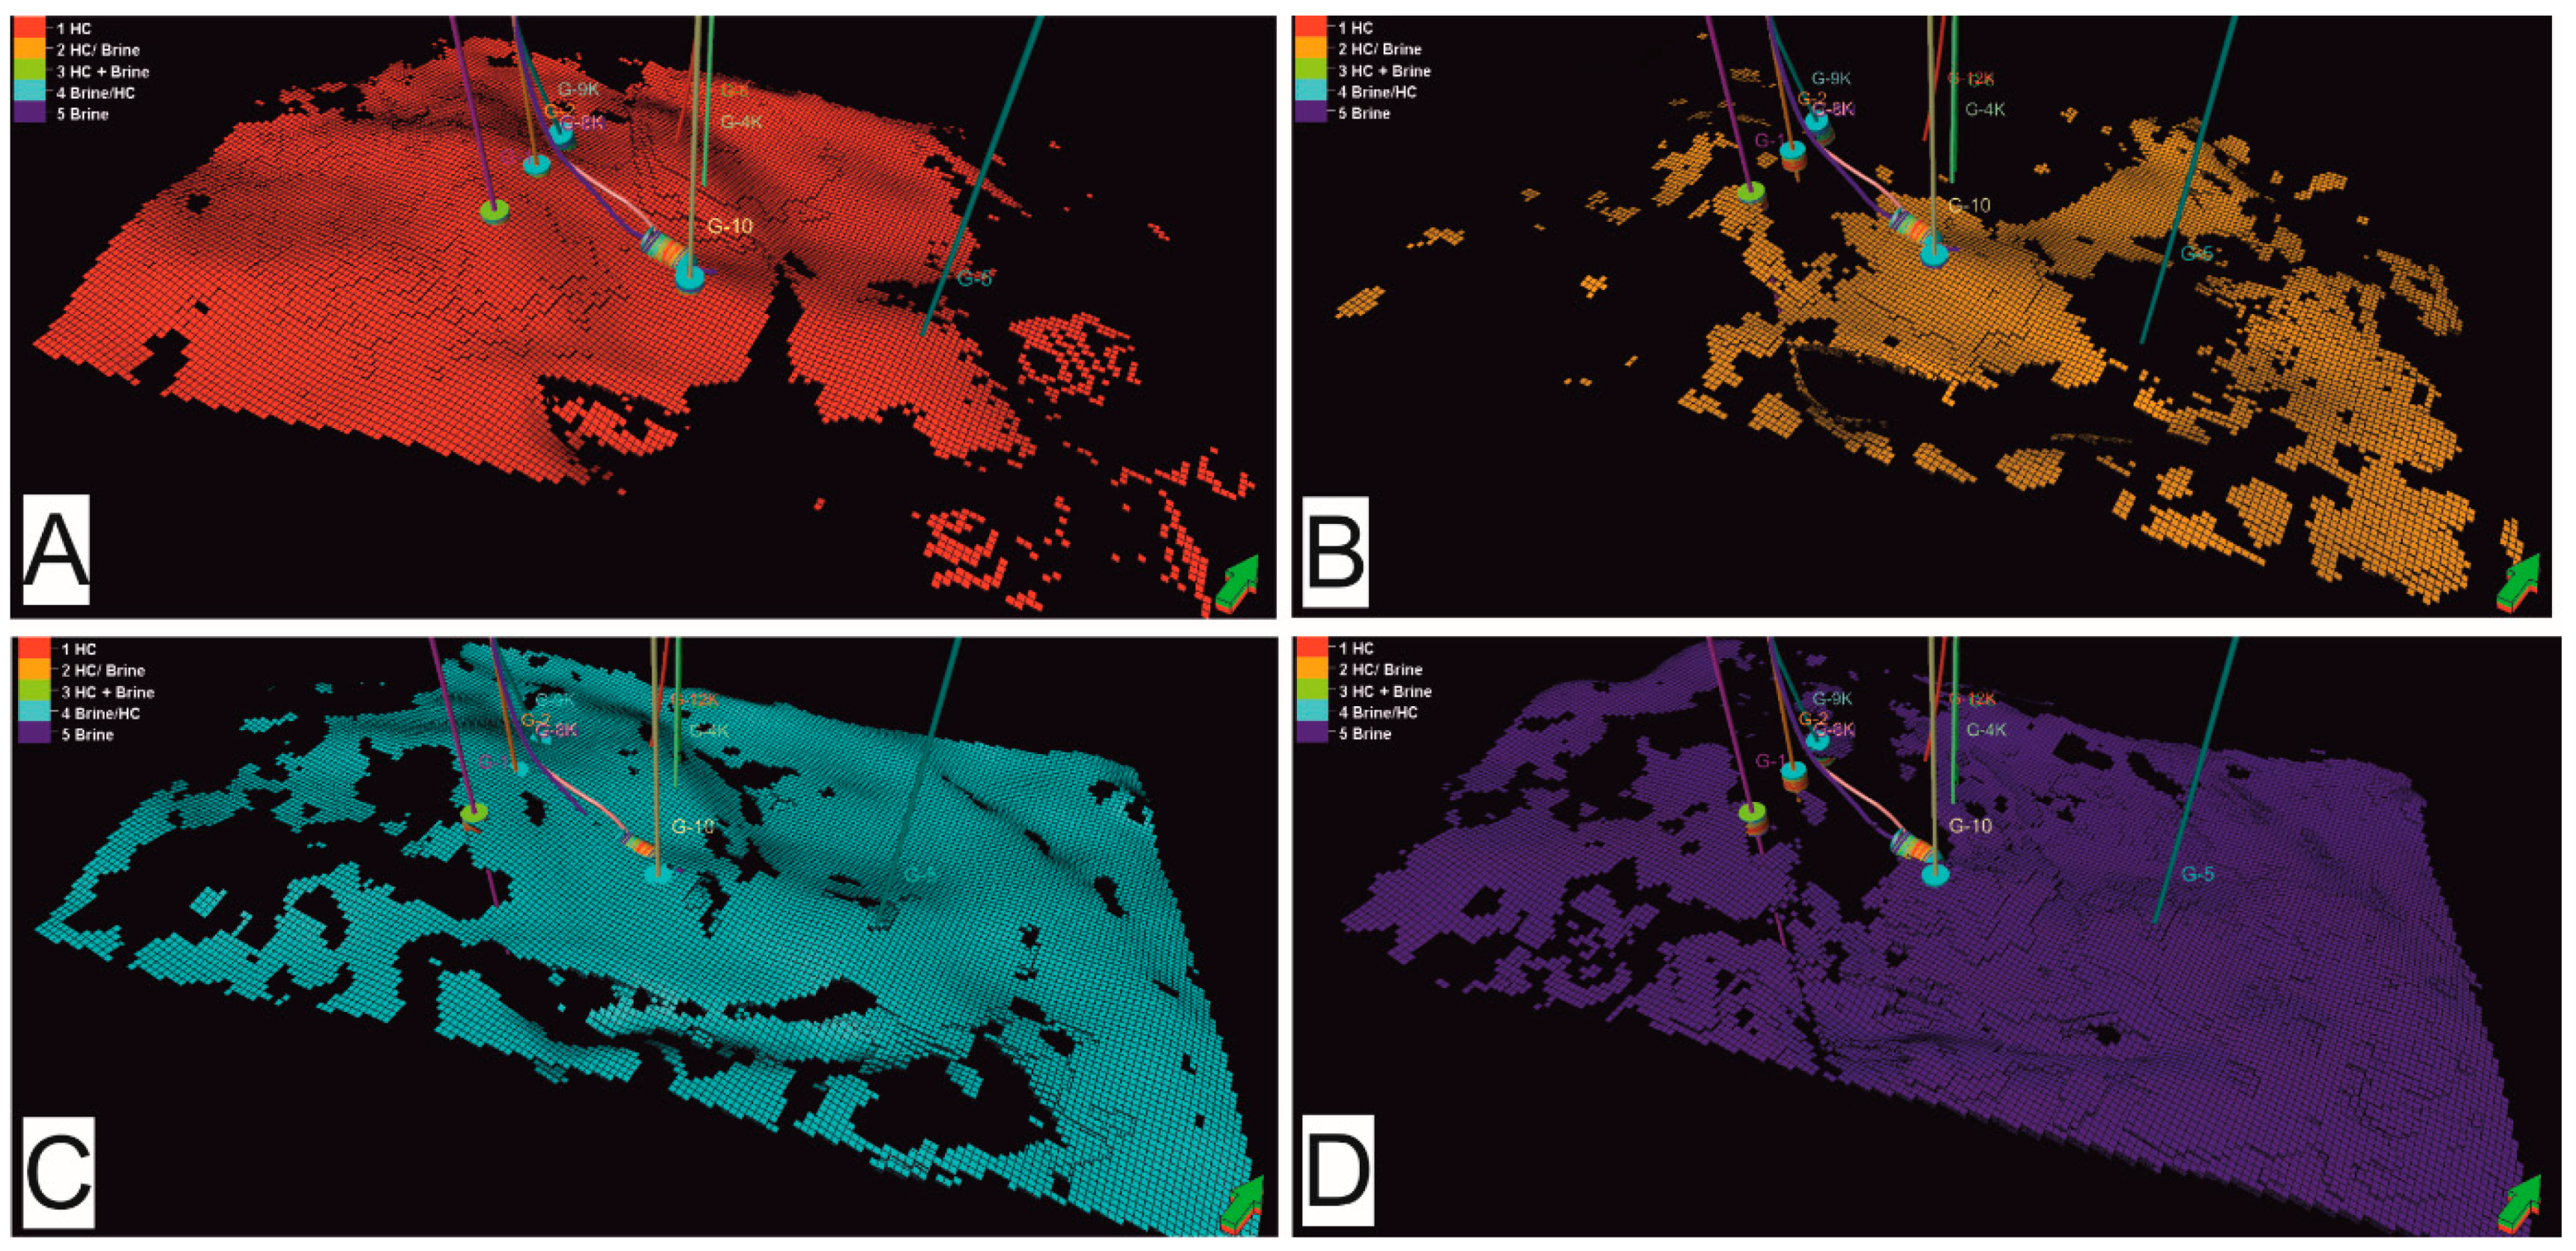
The defined parameters and network algorithm most accurately identified class 1 (characterized by the highest likelihood of hydrocarbon saturation) and class 5 (characterized by the highest likelihood of water saturation), while performing weakest for class 3, with a correlation coefficient value of 0.2. The cumulative correlation coefficient between the amplitude value from the seismic volume (AmpSEISMIC), PHI, AI, and VpVs with the zone showing the highest hydrocarbon potential (class 1) is 0.62. In this context, the weakest influence is observed in the AmpSeismic parameter (0.34), while the strongest coefficient pertains to VpVs (0.59). Below (Figure 10), the spatial results of individual saturation classes presented as 3D models (excluding class 3) are visualized.

4. Discussion

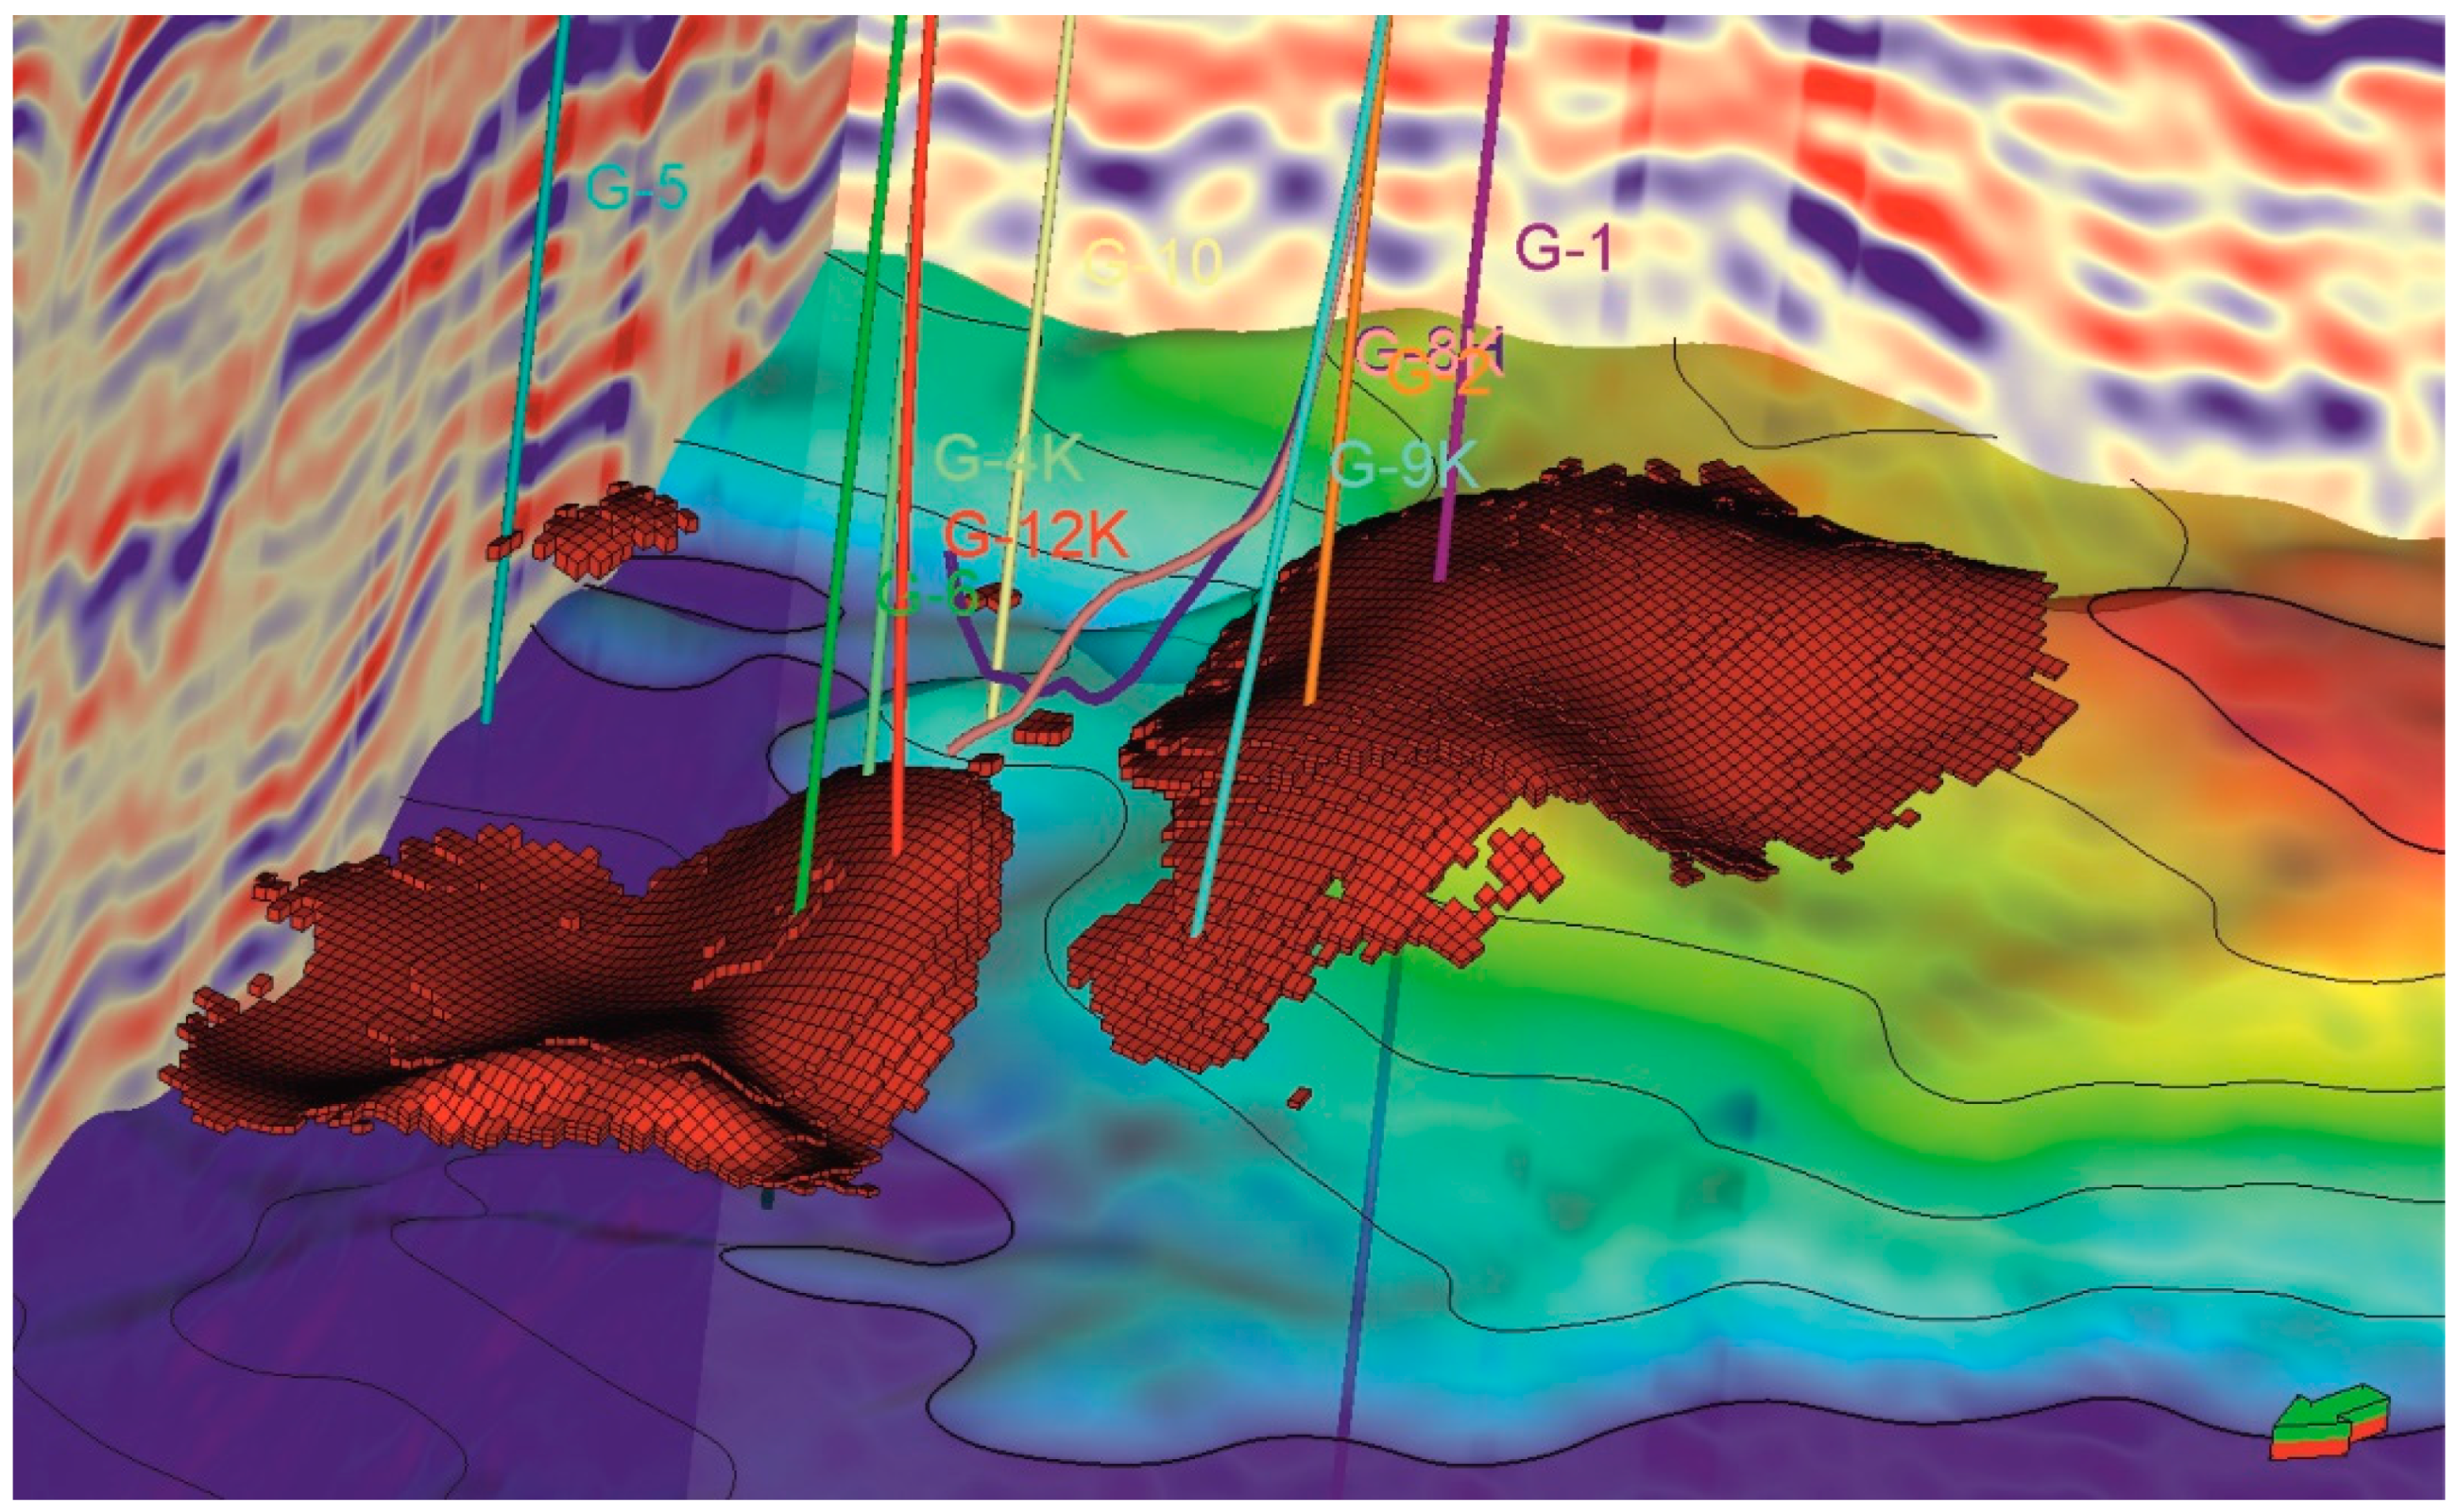
Modeling rock physics allows for the linking of rock properties such as porosity, lithology, and fluid saturation to elastic characteristics like wave propagation velocity and impedance. Integrated data from well logs and seismic observations, incorporating observed interparameter dependencies, can be applied in spatial parametric models, as presented in this article. These prepared models enable a rapid visualization of qualitative reservoir features, such as pinpointing zones with the highest or lowest hydrocarbon accumulation potential (Figure 11) or areas potentially exhibiting superior reservoir properties (Figure 12).

4.1. Identification of Zones with the Highest Hydrocarbon Accumulation Potential

To identify zones with the highest potential for hydrocarbon accumulation for class 1 in the saturation model, the Poisson’s ratio values ranging from 0.2 to 0.25 were applied. Within this range, intervals with the highest hydrocarbon saturation were identified in well log profiles. The outcome represents the spatial distribution of model cells corresponding to Poisson’s ratio values within the defined range (Figure 11).
In the case of continuing work on identifying zones with the highest hydrocarbon accumulation potential, in order to perform a quantitative characterization, it is necessary to refine the analyses related to pore space capacity and the net to gross parameter (usually derived from porosity and permeability). Both aspects require detailed characterization based on laboratory core measurements and borehole datasets. The results of multidimensional analysis, as has been previously conducted within this area [19], utilizing various methods (including XRMI log, microscopic techniques, MICP, and Micro-CT imaging) could serve as substantial inputs for subsequent exploration. Moreover, such an analysis would facilitate the validation of the findings outlined in the manuscript and would expand upon them, particularly in terms of classifying the reservoir into zones with differing filtration capabilities. The resulting characterization will enable a more detailed refinement of the classifications, forming the basis for constructing the relational model (presented in this article).

4.2. Identification of Intervals Susceptible to Mechanical Damage

To identify zones susceptible to mechanical damage and potentially exhibiting improved reservoir properties, the parameter of Young’s modulus was utilized. Its lower values characterize more brittle zones, confirmed in well log profiles by decreased Stoneley wave velocities. Figure 12, the presented results depict the classification model of fluid saturation (all classes), confined to cells corresponding to Young’s modulus values above 40 GPa.
In this case, the continuation of work would require a more detailed identification of the prevailing stress regime within the deposit and its surroundings, along with a comprehensive characterization of the properties of fractures and cracks. Within this context, laboratory results from geomechanical tests are essential for determining both elastic properties (including Young’s modulus and Poisson’s ratio) and strength properties (such as uniaxial compressive strength, tensile strength, and friction angle). Regarding the characteristics of fractures and cracks, it involves detailed identification of their geometry (aperture, length, and width) as well as spatial orientation. These characteristics would augment the foundational assumptions of the relational model, further specifying the relationships between the fundamental parameters presented in this article and the deposit’s potential susceptibility to mechanical damage. This insight could prove valuable for purposes such as designing the trajectory of the drill hole and executing secondary hydraulic fracturing.
The outcomes resulting from the proposed procedure, while offering a generalized characterization of the analyzed reservoir, can serve as a starting point for various tasks related to spatial modeling. Subsequent stages will necessitate more detailed analyses, particularly in reservoirs requiring multidimensional characterization, such as those accumulated from carbonate formations.

Author Contributions

Conceptualization, W.K.-K. and K.S.; data curation, W.K.-K.; formal analysis, W.K.-K.; investigation, W.K.-K.; methodology, W.K.-K.; project administration, W.K.-K.; resources, W.K.-K.; software, W.K.-K.; supervision, W.K.-K. and K.S.; validation, W.K.-K.; visualization, W.K.-K.; writing—original draft, W.K.-K.; writing—review and editing, W.K.-K. All authors have read and agreed to the published version of the manuscript.

Funding

This research was funded by the Ministry of Science and Higher Education; order no.: 0032/SG/20, archive no.: DK-4100-/32/20.

Data Availability Statement

Third Party Data. Restrictions apply to the availability of these data. Data were obtained from PKN ORLEN PGNiG Exploration and Production Division and are available from the authors with the permission of PKN ORLEN PGNiG Exploration and Production Division.

Acknowledgments

The authors thank PKN ORLEN PGNiG Exploration and Production Division for indicating the areas of investigation and all necessary data for modeling.

Conflicts of Interest

The authors declare no conflicts of interest.

References

  1. Dernaika, M.R.; Sinclair, G.G. Resolving the Link between Porosity and Permeability in Carbonate Pore Systems. In Proceedings of the International Symposium of the Society of Core Analysts, Vienna, Austria, 7 August–1 September 2017. Paper SCA2017-77. [Google Scholar]
  2. Stadtműller, M.; Jarzyna, J.A. Estimation of Petrophysical Parameters of Carbonates Based on Well Logs and Laboratory Measurements, a Review. Energies 2023, 16, 4215. [Google Scholar] [CrossRef]
  3. Dasgupta, T.; Mukherjee, S. Sediment Compaction and Applications in Petroleum Geoscience, Advances in Oil and Gas Exploration & Production; Springer Nature AG: Cham, Switzerland, 2020. [Google Scholar] [CrossRef]
  4. Ranjith, P.G.; Viete, D.R. Applicability of the ‘cubic law’ for non-Darcian fracture flow. J. Pet. Sci. Eng. 2011, 78, 321–327. [Google Scholar] [CrossRef]
  5. Radwan, A.E.; Trippetta, F.; Kassem, A.A.; Kania, M. Multi-Scale Characterization of an Unconventional Tight Carbonate 367 Reservoir: Insights from the October Oil Field, Gulf of Suez Rift Basin, Egypt. J. Pet. Sci. Eng. 2021, 368, 107968. [Google Scholar] [CrossRef]
  6. Rashid, F.; Hussein, D.; Lawrence, J.A.; Khanaqa, P. Characterization and Impact on Reservoir Quality of Fractures in 370 the Cretaceous Qamchuqa Formation, Zagros Folded Belt. Mar. Pet. Geol. 2020, 113, 104117. [Google Scholar] [CrossRef]
  7. Shehata, A.A.; Kassem, A.A.; Brooks, H.L.; Zuchuat, V.; Radwan, A.E. Facies Analysis and Sequence-Stratigraphic Con-372 trol on Reservoir Architecture: Example from Mixed Carbonate/Siliciclastic Sediments of the Raha Formation, Gulf of Suez, 373 Egypt. Mar. Pet. Geol. 2021, 131, 105160. [Google Scholar] [CrossRef]
  8. Ødegaard, E.; Avseth, P. Interpretation of Elastic Inversion Results Using Rock Physics Templates. In Proceedings of the 65th EAGE Conference & Exhibition, Stavanger, Norway, 2–5 June 2003. [Google Scholar] [CrossRef]
  9. Dvorkin, J.; Nur, A. Elasticity of High-Porosity Sandstones: Theory for Two North Sea Data Sets. Geophysics 1996, 61, 1363–1370. [Google Scholar] [CrossRef]
  10. Hilman, J.; Winardhi, I.S. Rock Physics Template Application on Carbonate Reservoir. IOP Conf. Ser. Earth Environ. Sci. 2019, 318, 012006. [Google Scholar] [CrossRef]
  11. Jaworowski, K.; Mikolajewski, Z. Oil- and Gas-Bearing Sediments of the Main Dolomite (Ca2) in the Miedzychód 342 Region: A Depositional Model and the Problem of the Boundary between the Second and Third Depositional Sequences in the 343 Polish Zechstein Basin. Prz. Geol. 2007, 55, 1017–1024. [Google Scholar]
  12. Mikołajewski, Z.; Wróbel, M. Petrography and Diagenesis of the Cretaceous Main Dolomite (Ca2) in the Lubiatów Oil 354 Field Area (Western Poland). Prz. Geol. 2005, 53, 335–336. [Google Scholar]
  13. Mikołajewski, Z.; Słowakiewicz, M. Microfacies and diagenesis of the Main Dolomite (Ca2) strata in the Międzychód 356 barrier area (Grotów Peninsula, Western Poland). Biul. Państw. Inst. Geol. 2008, 429, 191–198. [Google Scholar]
  14. Matyasik, I.; Leśniak, G.; Such, P.; Mikołajewski, Z. Mixed wetted carbonate reservoir: Origins of mixed wettability and 352 affecting reservoir properties. Ann. Soc. Geol. Pol. 2010, 80, 115–122. [Google Scholar]
  15. Kotarba, M.; Wagner, R. Generation potential of the Zechstein Main Dolomite (Ca2) carbonates in the Gorzów Wielko-348 polski-Midzychód-Lubiatów area: Geological and geochemical approach to microbial-algal source rock. Prz. Geol. 2007, 55, 1025–1036. [Google Scholar]
  16. Pikulski, L. Analiza paleogeograficzna utworów dolomitu głównego (Ca2) w rejonie Lubiatów-Międzychód-Grotów w 365 aspekcie poszukiwania złóż. Nafta-Gaz 2004, 60, 397–405. [Google Scholar]
  17. Skupio, R.; Kubik, B.; Drabik, K.; Przelaskowska, A. Kompleksowa interpretacja profilu otworu obejmującego skały 375 anhydrytowe, węglanowe i mułowcowe wykonana na podstawie badań rdzeni wiertniczych z zastosowaniem metod 376 nieniszczących. Nafta-Gaz 2022, 78, 641–653. [Google Scholar] [CrossRef]
  18. Urbaniec, A.; Drabik, K.; Dohnalik, M.; Zagórska, U.; Kowalska, S. Możliwości Rozpoznania Wybranych Cech Skał 387 Węglanowych na Podstawie Obrazu Tomografii Komputerowej (CT) Oraz Skanera Mikroopornościowego (XRMI); The Oil and Gas Institute-National Research Institute: Kraków, Poland, 2019. [Google Scholar] [CrossRef]
  19. Stadtműller, M.; Krakowska-Madejska, P.I.; Leśniak, G.; Jarzyna, J.A. Characterization of the Carbonate Formation Fracture System Based on Well Logging Data and Results of Laboratory Measurements. Energies 2021, 14, 6034. [Google Scholar] [CrossRef]
  20. Kaczmarczyk-Kuszpit, W.; Brodzicki, A. The use of artificial neural network techniques to predict selected parameters 345 as a supplement to the input data set in the construction of 3D parametric models. Nafta-Gaz 2021, 77, 429–445. [Google Scholar] [CrossRef]
  21. Niepsuj, M.; Krakowska-Madejska, P. Analysis and modeling of petrophysical parameters of the Main Dolomite for-358 mation on the basis of well logging and seismic data. Geol. Geophys. Environ. 2012, 38, 317. [Google Scholar] [CrossRef]
  22. Papiernik, B.; Machowski, G.; Słupczynski, K.; Semyrka, R. Geological model of the Lubiatów-Międzychód-Grotów 363 (LMG) oil-gas accumulation area. Geologia 2009, 35, 175–182. [Google Scholar]
  23. Smalera, N. Attribute analysis as a tool for determining the areas of the late diagenetic Main Dolomite deposits and 378 assessing the stability of the seismic signal parameters. Geol. Geophys. Environ. 2022, 48, 111–132. [Google Scholar] [CrossRef]
  24. Solarski, T. Porównanie porowatości utworów dolomitu głównego wyznaczonych przy pomocy różnych metod inwersji 381 sejsmicznej. In Prace Instytutu Nafty i Gazu nr 170; Instytut Nafty i Gazu-Państwowy Instytut Badawczy: Kraków, Poland, 2010; pp. 503–507. [Google Scholar]
  25. Topór, T.; Sowiżdżał, K. An advanced ensemble modeling approach for predicting carbonate reservoir porosity from 385 seismic attributes. Geol. Geophys. Environ. 2023, 49, 245–260. [Google Scholar] [CrossRef]
  26. Wawrzyniak-Guz, K. Rock physics modelling for determination of effective elastic properties of the lower Paleozoic shale formation, North Poland. Acta Geophys. 2019, 67, 1967–1989. [Google Scholar] [CrossRef]
  27. Avseth, P.; Jørstad, A.; van Wijngaarden, A.J.; Mavko, G. Rock physics estimation of cement volume, sorting, and net-to-gross in North Sea sandstones. Lead. Edge 2009, 28, 98–108. [Google Scholar] [CrossRef]
  28. Azevedo, L.; Grana, D.; Amaro, C. Geostatistical rock physics AVA inversion. Geophys. J. Int. 2019, 216, 1728–1739. [Google Scholar] [CrossRef]
  29. Durrani, M.Z.A.; Talib, M.; Sarosh, B. Rock physics-driven quantitative seismic reservoir characterization of a tight gas reservoir: A case study from the Lower Indus Basin in Pakistan. First Break 2020, 38, 43–53. [Google Scholar] [CrossRef]
  30. Roncarolo, F.; Grana, D. Improved Reservoir Characterization Integrating Seismic Inversion, Rock Physics Model, and Petroelastic Log Facies Classification: A Real Case Application. In Proceedings of the SPE Annual Technical Conference and Exhibition, Florence, Italy, 20–22 September 2010. [Google Scholar] [CrossRef]
  31. Sowiżdżał, K. Geological 3D modeling of hydrocarbon reservoirs—Methodological aspects and case studies. In Prace 383 Naukowe Instytutu Nafty i Gazu No. 192; Instytut Nafty i Gazu-Państwowy Instytut Badawczy: Kraków, Poland, 2013; pp. 1–217. [Google Scholar]
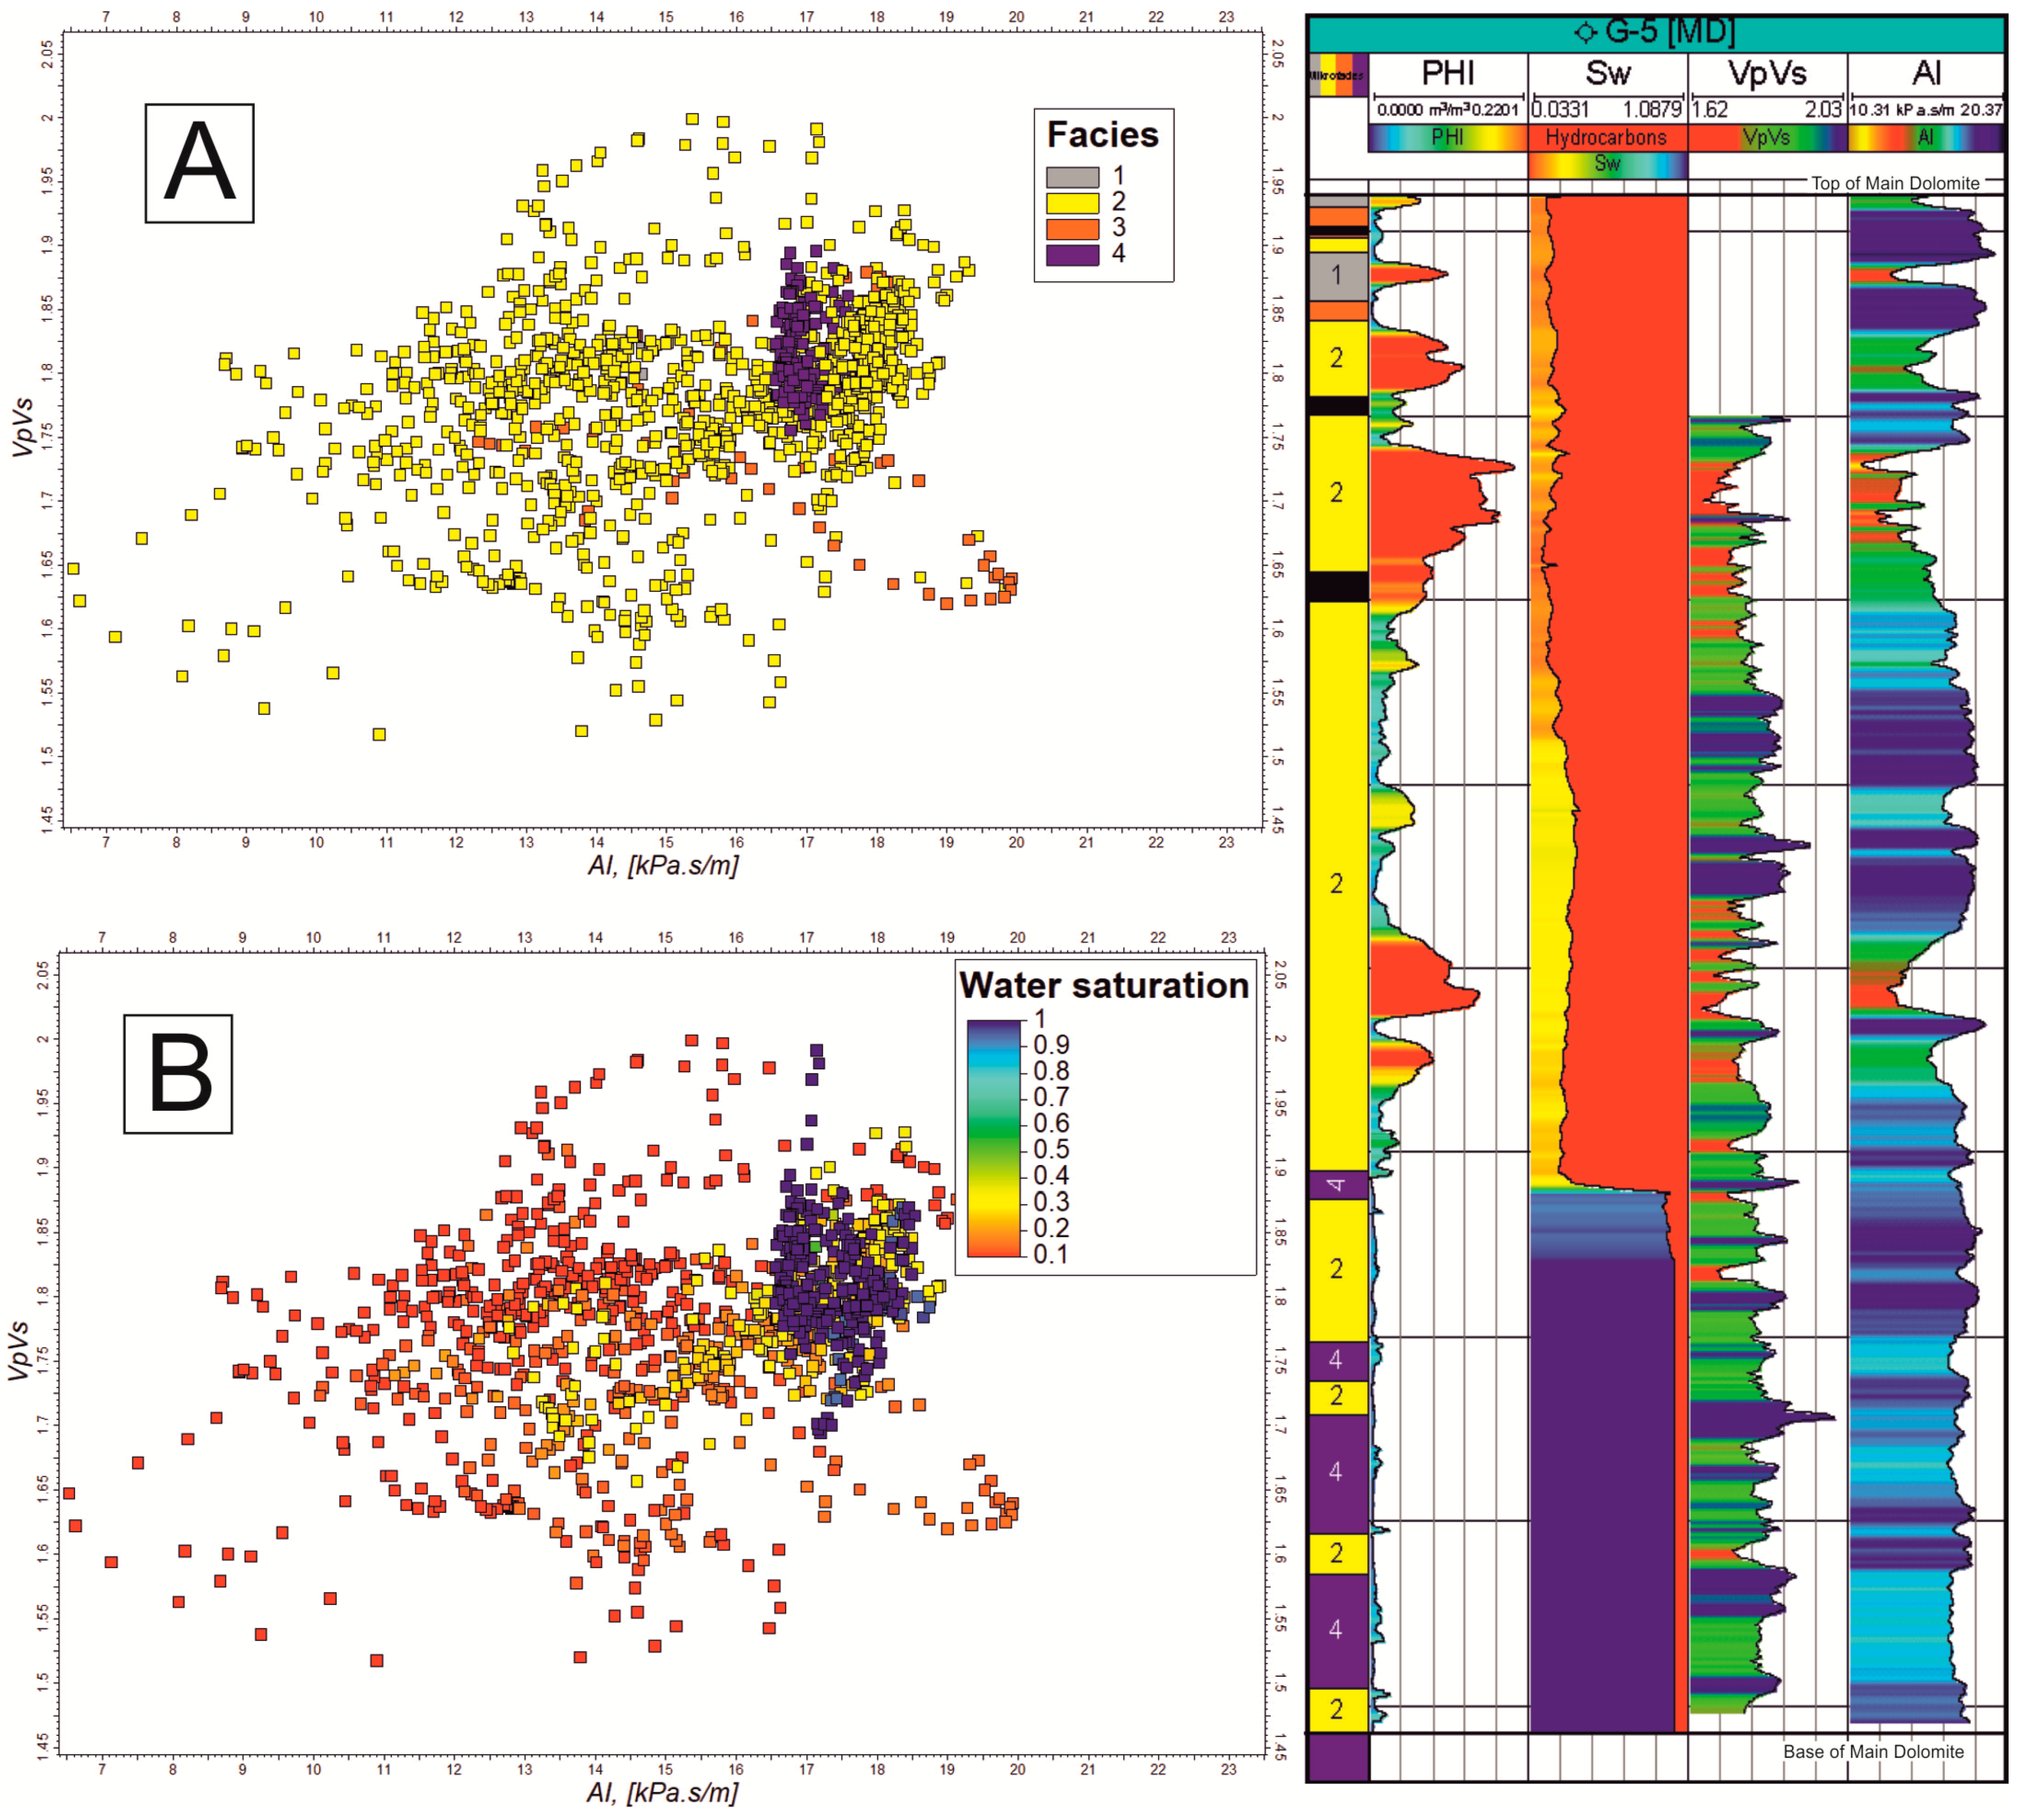
Figure 1. Relationships between VpVs, AI, and PHI parameters in all analyzed wells concerning the division of (A) microfacies and (B) The relationships between VpVs, AI, and PHI parameters in all analyzed wells concerning the division of (A) microfacies and (B) water saturation depicted on spatial cross-plots, alongside input data from one of the analyzed wells.
Energies 17 00355 g001
Figure 2. Cross-plots of porosity versus acoustic impedance versus VpVs ratio concerning various parameters, along with their direction of value increase (orange arrows).
Energies 17 00355 g002
Figure 3. Directions of value increase for individual parameters concerning the relationship between VpVs and AI.
Energies 17 00355 g003
Figure 4. Fluid saturation classes (1–5) and a histogram illustrating the percentage distribution of each class.
Energies 17 00355 g004
Figure 5. A set of well log curves alongside a discrete saturation class log.
Energies 17 00355 g005
Figure 6. Part of the results of the conducted deterministic seismic inversion within the interval of the Main Dolomite formation.
Energies 17 00355 g006
Figure 7. The inversion results for (A) porosity, (B) acoustic impedance, and (C) the ratio of compressional to shear wave velocity presented on cross-sections.
Energies 17 00355 g007
Figure 8. The AI model created through the integration of well and seismic data aimed to identify hydrocarbon accumulation zones and areas with enhanced reservoir properties.
Energies 17 00355 g008
Figure 9. A correlation table displaying the relationships between the training data (AmpSEISMIC, PHI, AI, and VpVs) and the outcomes of relationships encompassing all classes simultaneously (PHI vs. VpVs vs. AI classification) and separately for each individual class (0—undefined cells, 1,2,3,4,5—saturation classes). Cells color represents values of correlation coefficient (cc): red 0.8 ≤ cc < 1; orange 0.6 ≤ cc < 0.8; yellow 0.4 ≤ cc 0.6; green 0.2 ≤ cc < 0.4; blue < 0.2.
Energies 17 00355 g009
Figure 10. The individual saturation classes resulting from the proposed procedure applied in the study ((A)—1st class, (B)—2nd class, (C)—3rd class, and (D)—4th class).
Energies 17 00355 g010
Figure 11. The spatial distribution of saturation classes with filtered cells from the Young’s modulus parameter model, with values above 40 GPa indicative of high susceptibility to mechanical damage.
Energies 17 00355 g011
Figure 12. The cells of class 1 in the classification model constrained by Poisson’s ratio values ranging from 0.2 to 0.25.
Energies 17 00355 g012
Disclaimer/Publisher’s Note: The statements, opinions and data contained in all publications are solely those of the individual author(s) and contributor(s) and not of MDPI and/or the editor(s). MDPI and/or the editor(s) disclaim responsibility for any injury to people or property resulting from any ideas, methods, instructions or products referred to in the content.