Abstract
The core of harmonic detection is the recognition and extraction of each order harmonic in the signal. The current detection methods are seriously affected by the fence effect and spectrum aliasing, which brings great challenges to the detection of each order harmonic in the signal. This paper proposes an efficient harmonic detection neural network based on all-phase processing. It is based on three crucial designs. First, a harmonic signal-processing module is developed to ensure phase invariance and establish the foundation for subsequent modules. Then, we constructed the backbone network and utilized the feature-extraction module to extract deep abstract harmonic features of the target. Furthermore, a channel attention mechanism is also introduced in the weight-selection module to enhance the energy of the residual convolution stable spectrum feature, which facilitates the accurate and subtle expression of intrinsic characteristics of the target. We evaluate our method based on frequency, phase, and amplitude in two environments with and without noise. Experimental results demonstrate that the proposed EhdNet method can achieve 94% accuracy, which is higher than the compared methods. In comparison experiments with actual data, the RMSE of EhdNet is also lower than that of other recent methods. Moreover, the proposed method outperforms ResNet, BP, and other neural network approaches in data processing across diverse working conditions due to its incorporation of a channel attention mechanism.
1. Introduction
Harmonic detection is necessary in harmonic processing. Because whether it is a thorough control of harmonics in the system or a harmonic isolation purification of key equipment, it is necessary to understand the specific data of harmonics in the system, so as to accurately analyze the harmonic isolation purification effect or the precise cost price of harmonic control equipment. The harmonic/resonance problem has undergone profound changes and has become an essential factor that affects the safe and reliable operation of power grids [1]. Harmonics cause distortions in voltage waveforms and resonance phenomena, reduce power quality, and exert adverse effects on electrical equipment, automatic devices, measuring instruments, and communication systems [2,3]. They are considered public hazards. Accurate detection of harmonic signals can effectively improve the security of power grids and prevent the occurrence of the aforementioned problems.
Many harmonic detection methods based on the characteristics of the harmonic signal are available. The harmonic detection instrument using wavelet transform [4] has been widely used in actual power-system detection and fault detection. They can measure and analyze the harmonics of nonstationary time-varying signals but are critically affected by complex environments. Harmonic detectors cannot detect harmonics in a power grid at any time [5]. In addition to this, it can only provide the time–frequency characteristic curve of a signal at different frequency bands and cannot accurately detect the frequency and amplitude of the signal [6]. Moreover, the algorithm is complex, and the operation speed is moderate. Zhou et al. [7] improved a neural network by applying the advantage of wavelet transform and enhanced its detection performance in terms of amplitude and frequency; however, the precision of the harmonic phase measurement was still poor.
Different harmonic detection algorithms have been proposed by scholars for different complex environments, and these algorithms can be broadly divided into two categories: time and frequency-domain analysis. The instantaneous reactive power algorithm [8] is representative of the time-domain analyses method, but it only measures the sum of all harmonics and cannot obtain the amplitude and phase information of each harmonic separately. The frequency-domain analysis method is the most widely used method at present, and typical applications include algorithms based on analog filters, neural networks [9,10], and Fourier transform. Algorithms based on analog filters mainly use frequency-selection features with excellent bandpass/band resistance to detect harmonics. But, their real-time performance and reliability are poor, and their detection accuracy is low; moreover, only the fundamental wave and harmonics can be separated, and each harmonic cannot be separated [11]. Neural networks have strong adaptability and learning ability and can effectively reduce the interference of noneffective components [12], such as noise, in signal sources. Moreover, they have the advantages of minimal calculation, high measurement accuracy, good real-time performance, and strong anti-interference ability [13], but their harmonic phase detection performance is poor [14]. Neural networks also experience difficulties in network initialization [15]. The size of the chosen network structure directly influences the training effect of the neural network, resulting in accidental detection results [10]. Harmonic measurement based on rapid Fourier transform [16] is the most widely used harmonic detection method in completed projects. However, the use of this method produces spectrum aliases and fence effects [17], which make the calculated harmonic parameters (frequency, amplitude, and phase) inaccurate and unable to meet the high precision requirement of harmonic detection. Olsson et al. [18] proposed a calculation method that initially performs all-phase data preprocessing and then implements traditional fast Fourier transform (FFT); that is, the phase measurement does not require correction measures. It has excellent phase invariance in the full frequency domain, and it is known as an all-phase fast Fourier transform (APFFT) [19]. APFFT has excellent detection performance in the harmonic phase due to its initial phase invariance, but its intensified fence effect [17] considerably weakens its ability to detect harmonic amplitude and frequency [20]. Specifically, when noise interference is present in the signal, the detection error of frequency and amplitude is large. However, FFT has other obvious problems. When synchronous sampling is performed, the phase measurement is inaccurate, and the identification of the detuning elements produces a large error. Su et al. [21] proposed a method to detect the harmonics and interharmonics of renewable energy power on the basis of the Nuttall double-window all-phase FFT algorithm by considering that APFFT [22] has phase invariance and does not need to correct phase information [19]. In our previous work [23], we proposed a harmonic detection algorithm based on Nuttall convolution window all-phase FFT interpolation. A new convolutional window function called NNMCW was constructed. A low peak sidelobe level and a high decay rate were obtained by the mutual convolution operation of the two convolution windows, so the energy was concentrated in the main lobe, and spectral leakage was effectively suppressed. In addition, we are also committed to the application of neural networks [24,25] in other fields.
The equations for the estimation of harmonic parameters are derived by polynomial fitting of four spectral line interpolation methods [17]. The fence effect caused by the dispersion in the frequency domain can be removed via spectral line interpolation. However, improvements can still be made. In summary, the neural network method has a strong antinoise interference ability and high-frequency amplitude detection accuracy, but its harmonic phase detection ability is insufficient. APFFT has phase invariance [26] and outstanding harmonic phase detection performance, but its harmonic frequency and amplitude detection accuracies are insufficient.
Time developed in recent years. Numerous scholars have proposed a combined prediction model that utilizes signal-decomposition methods to delve deeply into the features of time-series data, while also employing swarm-intelligence optimization algorithms to optimize the parameters of the machine-learning model, thereby addressing the challenge of hyperparameter search for single machine-learning optimization [27,28,29]. In reference [30], wind-speed data were decomposed using wavelet transform (WT) and fed into an LSTM network to extract time-series characteristics. Reference [31] decomposed the time series into multiple subseries using variational mode decomposition (VMD) and then inputted these new subseries into a gated recurrent units (GRU) network after filtering and reconstructing each series with sample entropy, resulting in improved prediction performance. Prior to inputting, historical data needs to undergo preprocessing for standardization. However, reference [32] only screened external factors from the input data without constructing similar day sets based on historical data, leading to the inclusion of irrelevant data that interfered with prediction accuracy. Moreover, reference [33] solely considered time-series factors when constructing similar day sets for holiday forecasts and failed to account for key factors, such as weather conditions and temperature. Although reference [34] employed an enhanced grey relational analysis (GRA) method for constructing a similar day set, it did not consider clustering selection of secondary similar days and, thus, compromised the accuracy of the final set that was obtained. Consequently, insufficient cleaning and removal of anomalous data from input resulted in decreased prediction accuracy.
Harmonics are categorized as time series, and it has been demonstrated that deep-learning methods yield accurate and coherent forecast results when applied to time-series data [35]. In the context of forecast reconciliation, adjustments are made to ensure coherence across the hierarchy. Deep-learning techniques have been employed for estimating the amplitude and phase of harmonics [36], as well as for classifying power-quality disturbances [37]. Convolutional neural networks (CNNs), which employ convolutional and pooling operations, serve as key discriminative models capable of capturing coherent structures in power-system measurements. In reference [38], harmonic detection is carried out in this way, but the effect can still be improved.
In this study, we propose a joint optimization algorithm for harmonic and interharmonic measurements based on all-phase preprocessing and the EhdNet fusion channel attention mechanism. The main contributions of this study are as follows:
- (i)
- A harmonic detection network called EhdNet is built. The algorithm is constructed by combining all-phase preprocessing and the EhdNet fusion channel attention mechanism. The detailed components of each harmonic are obtained to address the picket-fence effect and spectral aliasing;
- (ii)
- Phase invariance is achieved through all-phase preprocessing and accurate frequencies; amplitudes are derived by the deep-network-building capability of EhdNet. The channel attention mechanism is introduced to make the results more accurate;
- (iii)
- In different environments with and without noise, EhdNet’s accuracy in harmonic frequency, amplitude, and phase detection is higher than that of the artificial neural network (ANN and BP), APFFT, wavelet transform (WT), and other algorithms. In addition, the internal module of EhdNet is tested to verify the superiority and irreplaceability of the improvement.
The remainder of this paper is organized as follows. Section 2 introduces the preliminary knowledge about harmonic processing and the fence effect. Section 3 presents the proposed EhdNet method, which consists of three modules. In Section 4, simulated signals and measurements are presented, and the effectiveness of the proposed EhdNet is validated by ablation and comparison experiments. The conclusions are also presented.
2. Related Work
2.1. Harmonic Control
With the development of science and technology and the increase in industrial production levels and people’s living standards, a large number of nonlinear electrical devices have been put into operation in power grids, resulting in an increasing proportion of harmonic components in the power grid. This situation not only increases the power-supply loss of power grids but also interferes with the normal operation of the protection and automation devices of power grids. It also causes the migration and exclusion of these devices, which directly threaten the safe operation of power grids.
In an AC power-supply system, a power supply containing a large number of harmonics can be equivalent to a linear load and a series of harmonic current sources. A nonlinear load connected to an AC power supply draws fundamental current from the AC power supply and feeds back harmonic currents of various frequencies to the AC power supply. The higher the value of harmonic current is and the higher the internal resistance of the power supply is, the greater the distortion is in the voltage waveform caused by the harmonic wave and the greater the damage it produces.
The general idea of harmonic governance is as follows: the governance of harmonics should consider harmonic prevention, control of the source of harmonics, and minimization of the harmonics generated in the system to determine whether to implement further governance or not. Hence, harmonic reduction should be regarded as an influential condition during the selection of equipment and building systems. AC and DC are two types of communication power equipment. Under similar alternative conditions, the UPS system should prefer 12-pulse or delta conversion equipment. The DC system should preferentially select products with good rectifier circuits and perfect filtering measures [27]. Aside from prevention, remedial measures must be considered. In particular, for existing low-voltage systems with users, the harmonic problem can only be controlled by installing reactors, filters, and other remedial measures, since the system structure is fundamentally fixed. The basis of all this is the main theme of this study: harmonic detection.
2.2. Picket-Fence Effect and Spectrum Aliasing
In harmonic detection, the Fourier transform is essential regardless of the method used. However, the Fourier transform has inevitable drawbacks: the fence effect and spectral aliasing. Given that the spectrum computed by density functional theory (DFT) is limited to integer multiples of the fundamental frequency, the spectrum cannot be treated as a continuous function, hence the fence effect. The fence effect indicates that, when the entire spectrum is calculated with DFT [39], the process is like looking at a painting through a fence. The true graph can only be viewed at discrete points. In this study, sampling frequency N is increased in the frequency domain, and some zeros are added at the end of the time-domain data without changing the data so that the spectral lines are dense. This process reduces the fence effect and allows previously unseen spectral components to be observed. Notably, this method increases N by serving, at which the time-sampling frequency increases in direct proportion, because frequency resolution .
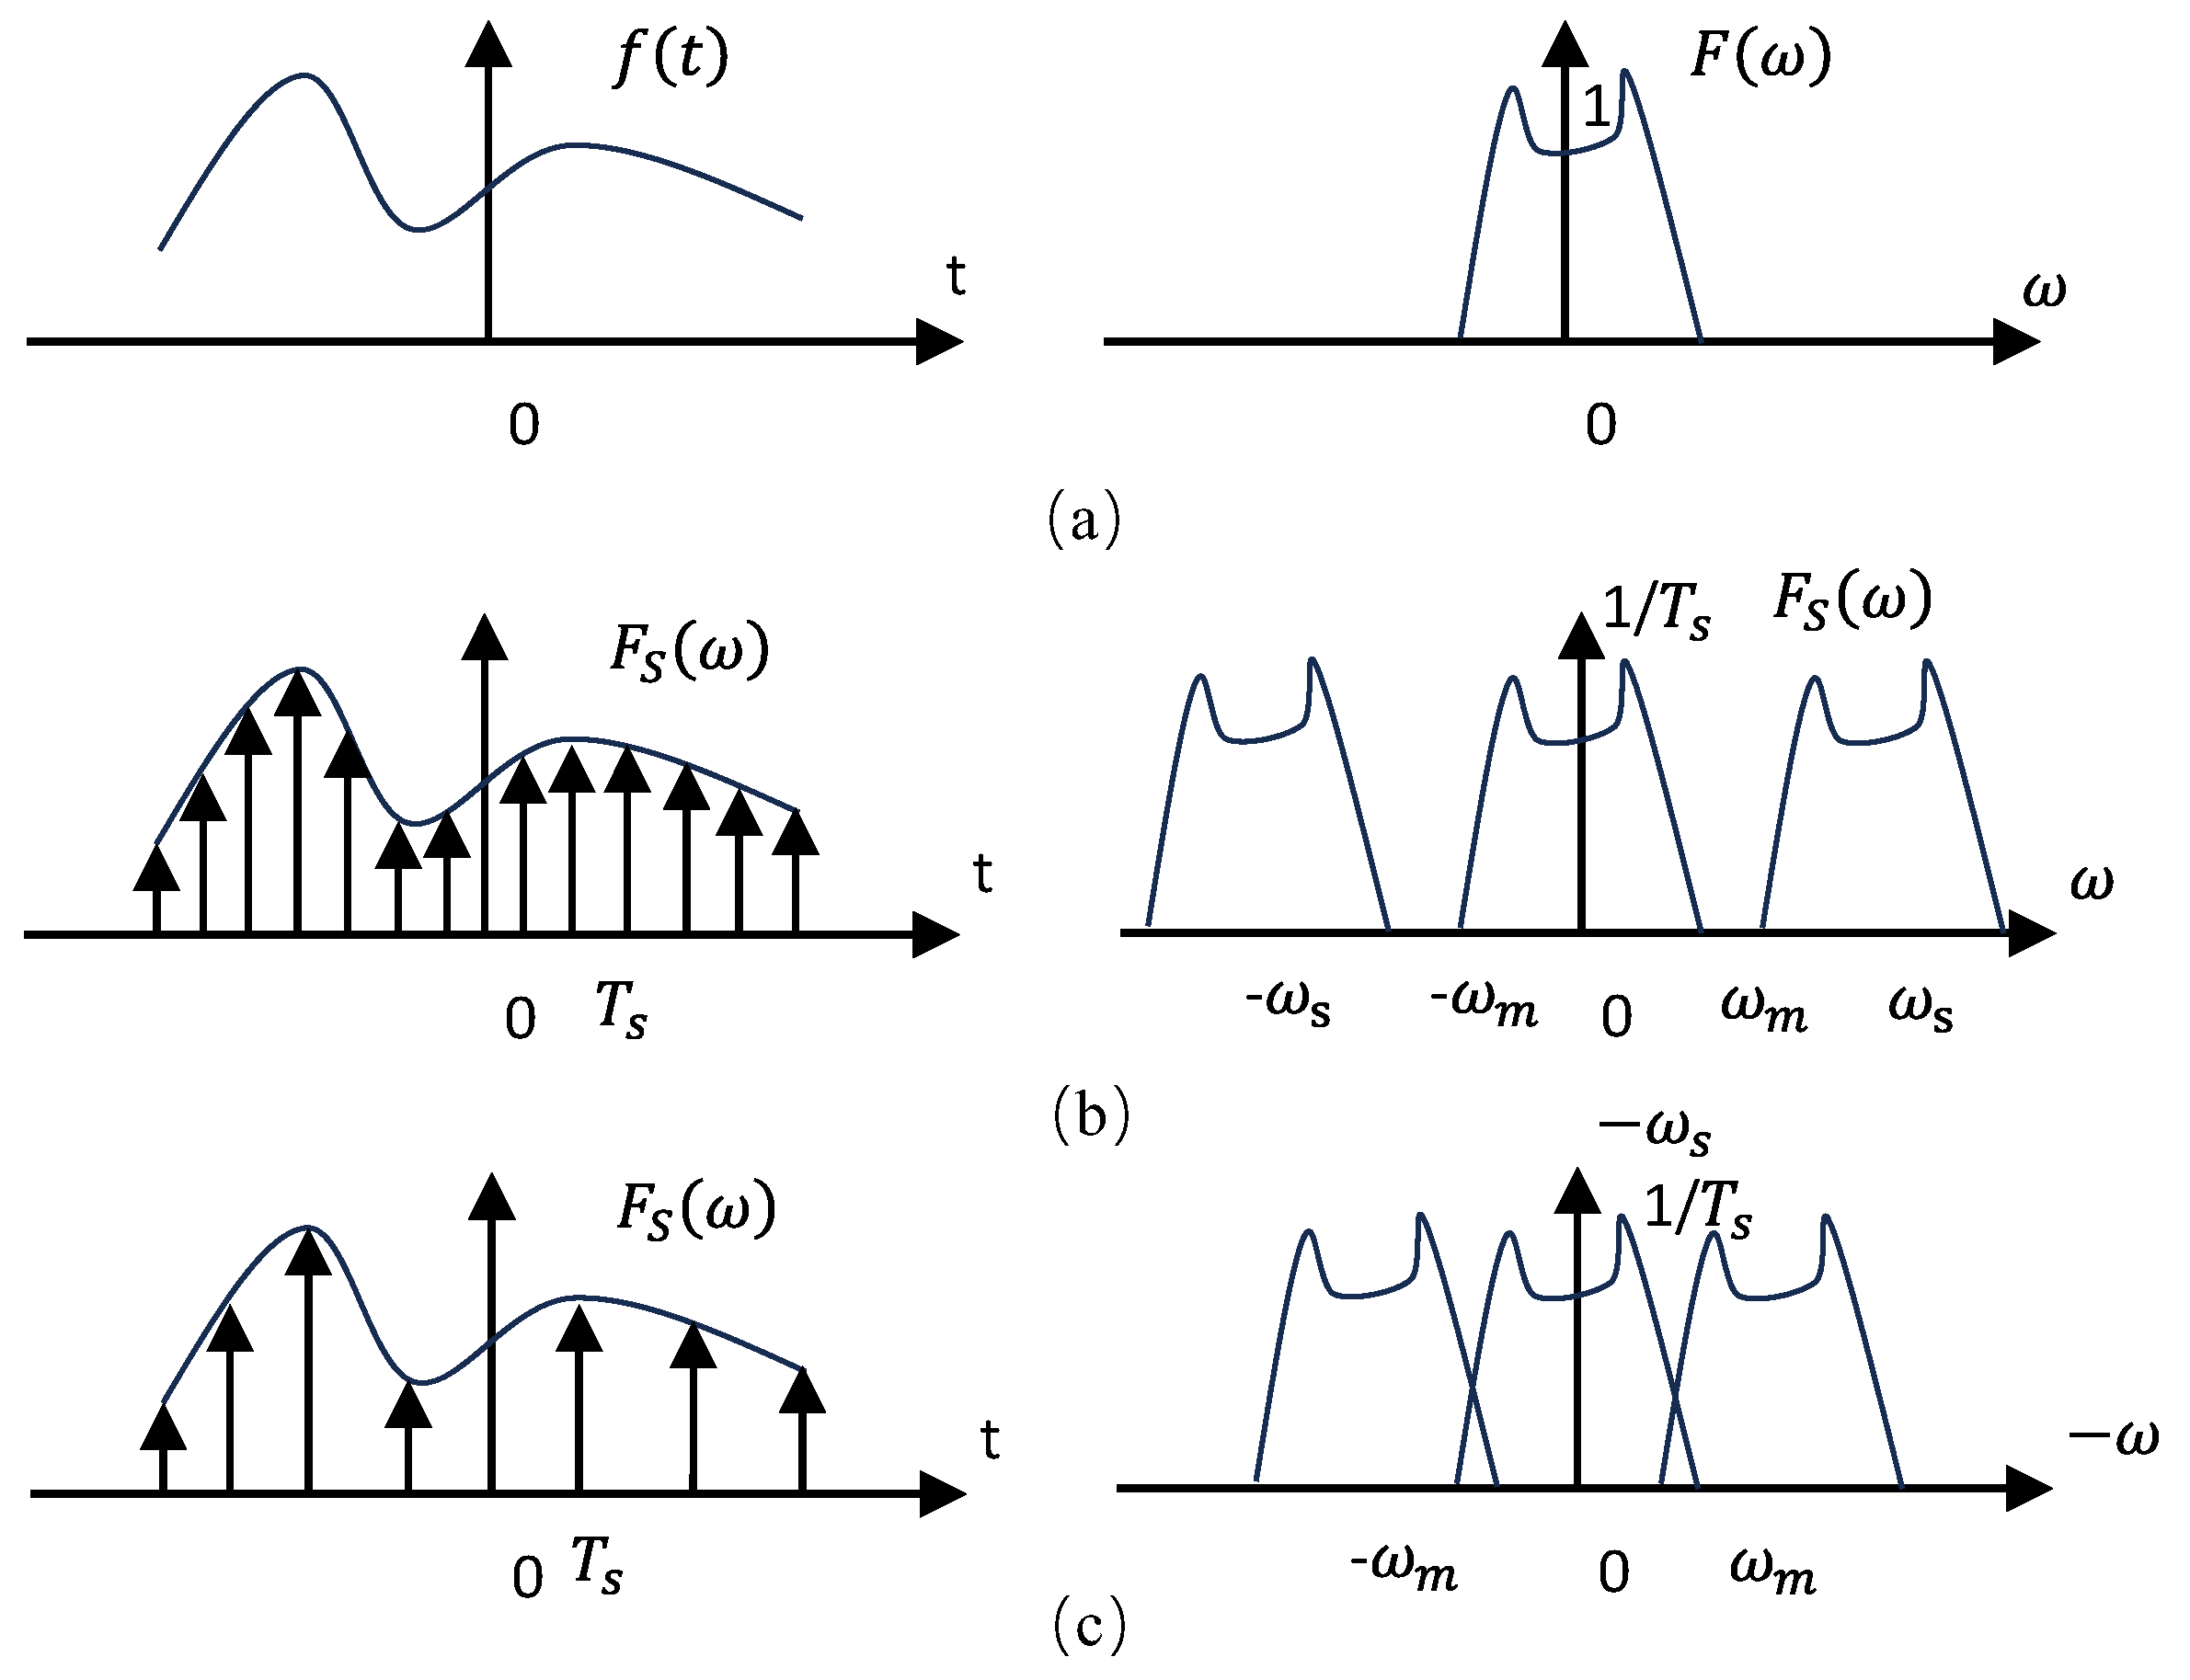
The frequency resolution does not change. The frequency spectrum is aliased because sampling frequency does not satisfy the Nyquist sampling theorem when the time-domain signal is discretized [40]. When analog-to-digital conversion is performed, sampling frequency fc allows the appropriate signal to be extracted, and the collected discrete signal can be well recovered from the original signal either in the time or frequency domain. Figure 1 presents a brief description of spectral aliasing.
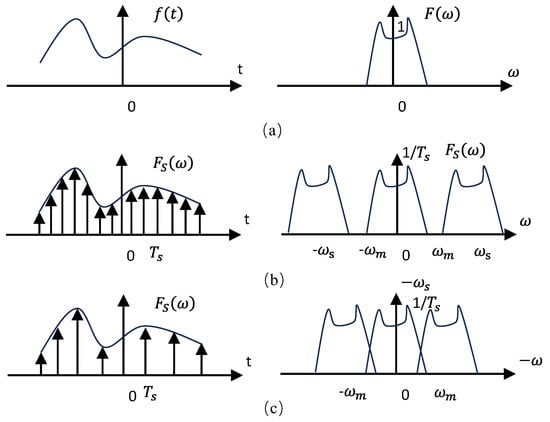
Figure 1.
Spectrum aliasing: (a) continuous signal, (b) sampled signal when the sampling theorem is satisfied, and (c) sampled signal when the sampling theorem is not satisfied; that is, aliasing occurs.
3. Proposed EhdNet Model
3.1. Overview of EhdNet
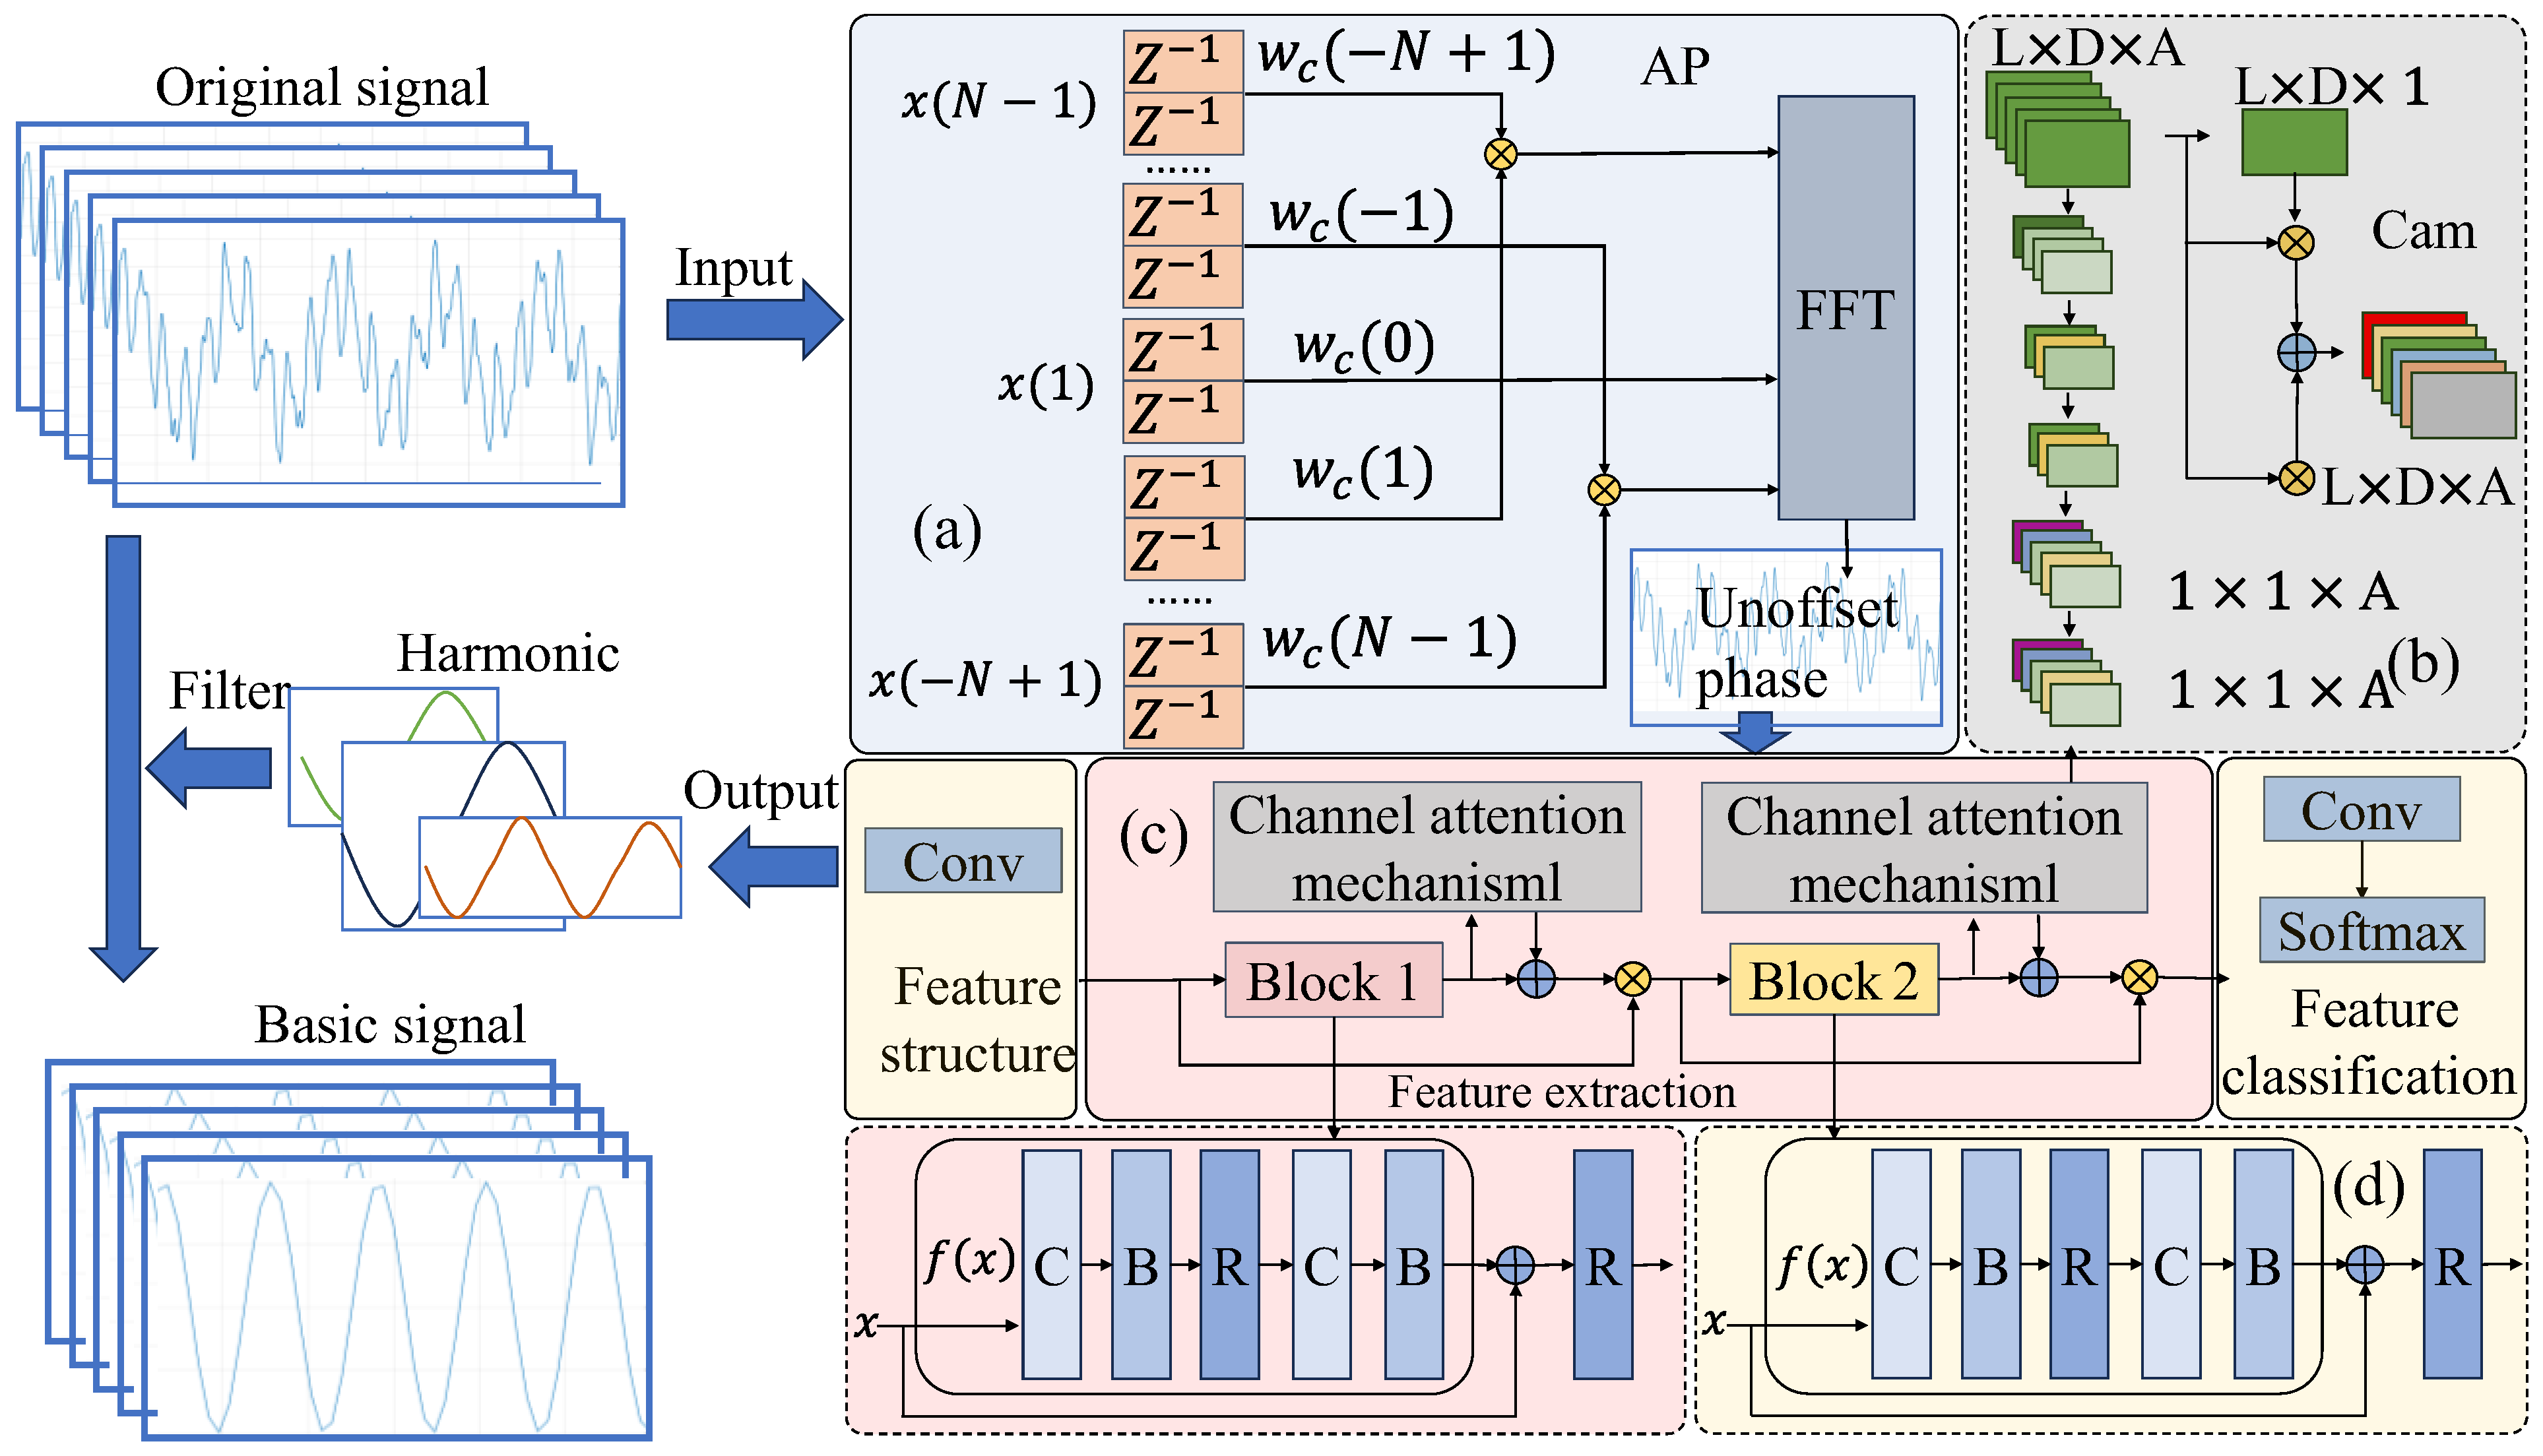
The architecture of EhdNet is illustrated in Figure 2. The harmonic signal-processing module enables superior phase-detection capability, extracting harmonic phase information and serving as the basis for neural network initialization at the peak of the fraction line. To expedite the convergence speed and enhance accuracy, we introduce a channel attention mechanism in the weight-selection module. By leveraging EhdNet’s profound network-building capability, we acquire comprehensive harmonic frequency and amplitude information, thereby accomplishing the entire process of harmonic detection.
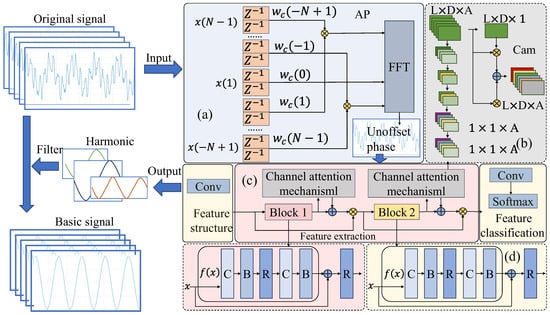
Figure 2.
EhdNet network-structure diagram. The harmonic signal-processing module, weight-selection module, backbone network, and feature-extraction module of EhdNet are arranged from (a–d).
3.2. Harmonic Signal-Processing Module of EhdNet
Details make it difficult to complete the established synchronization sample and capture the intercepts of the collected data through conventional harmonic detection methods for dynamical systems. When traditional methods are performed by sampling-data truncation and other tasks, the picket-fence effect and spectrum aliasing become inevitable. Therefore, two aspects, namely, spectral leakage and the fence effect, are mainly suppressed to reduce the short-range leakage error and improve the detection accuracy. Spectral leakage is typically suppressed through an appropriate window function, and the fence effect is performed by interpolation correction.
This situation can be visualized by analyzing the principle of the APFFT phase-measurement method. This approach does not require frequency estimation or correction measures.
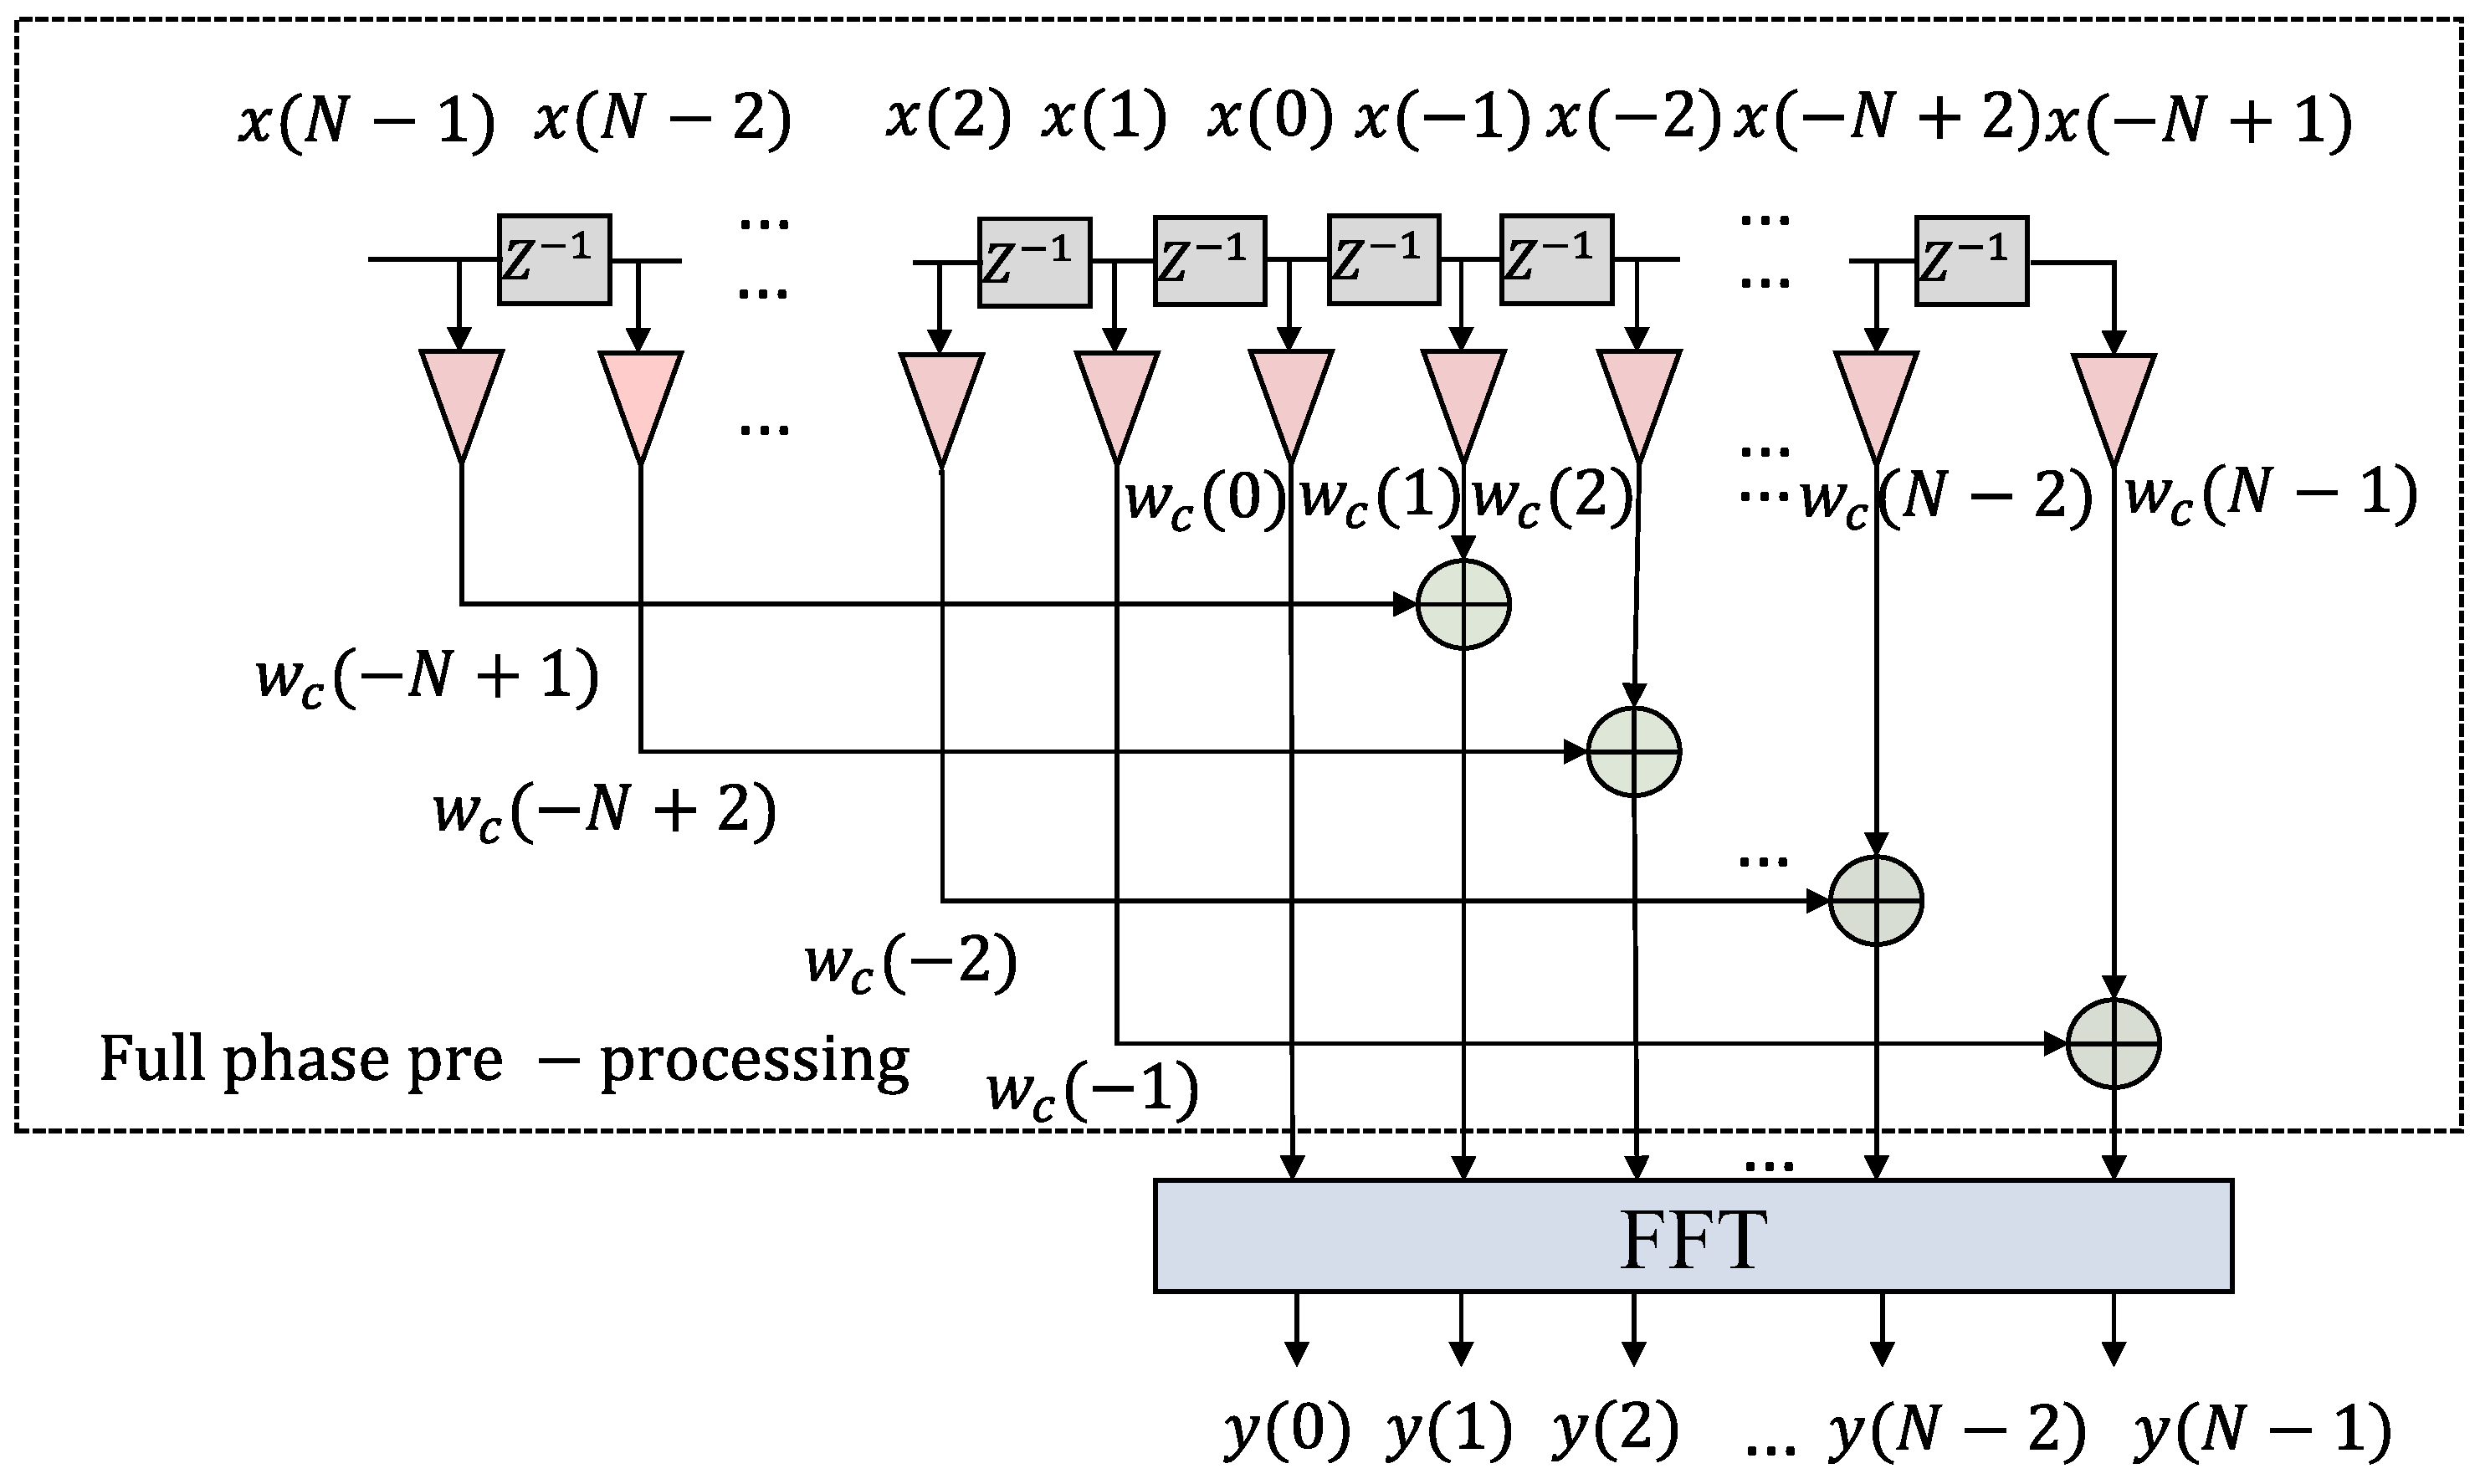
As a result, the harmonic signal-processing module of EhdNet is selected to import all-phase preprocessing. Frequency estimation does not affect the accuracy of phase measurements. The accuracy of the results obtained with the harmonic signal-processing module is high, but the amplitude and frequency value errors obtained with it should be higher than those obtained with the bimodal spectral interpolation algorithm. The harmonic signal-processing module algorithm mainly improves detection accuracy and reduces the detection error of the traditional FFT algorithm. The detection phase is corrected by all-phase preprocessing to reduce the harmonic phase-measurement error. Figure 3 shows the harmonic signal-processing module spectrum-analysis process.
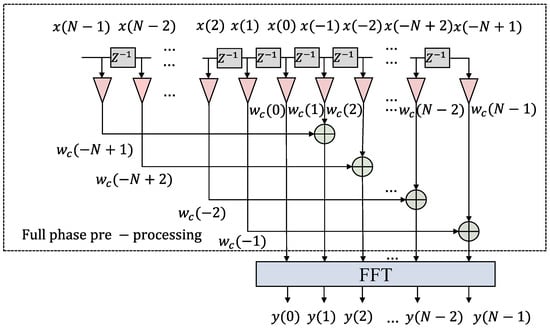
Figure 3.
Harmonic signal-processing module spectrum-analysis process.
A primitive harmonic signal can be defined as follows:
In the equation, , where refers to the base wave frequency; is the number of harmonic orders; is the sampling time; is the resolution of the harmonic orders ( is 1 during the whole harmonic detection); and are the amplitude and phase of the corresponding -order harmonic component, respectively; and is the highest number of harmonic order.
All-phase preprocessing of the original harmonic signal is performed, and the original harmonic data sequence is set as:
All subdata that contain the starting point of the sequence are listed, and an dimensional column vector containing the point is formed.
The circle is shifted, the of each column vector in the last equation is moved to the first place, and a new -dimensional vector is derived as follows:
where is the result obtained after is moved to the first place in , and the same applies to , , etc. In particular, is equal to .
is added as the center, and data with a length of input vector are obtained as
where is the discrete Fourier transform, and is the discrete Fourier transformation between and in Equation (3).
In accordance with the average value of meter (4), we obtain the output of APFFT as:
In Equation (7), the phase value of spectrum is the theoretical phase value of the center of sample point , which has nothing to do with frequency deviation value , thus proving that it has phase unity. Hence, the APFFT algorithm can be used as a high-precision phase analyzer. The phase value of or the phase value obtained by this method is the theoretical phase value of . Regardless of how much the value of frequency m deviates from that of , the phase measured at the peak spectrum line is always correct. The amplitude of the APFFT spectrum is the norm of Equation (8):
When the value of frequency deviates from that of , the harmonic amplitude measured in all-phase preprocessing spectra exhibits deviation. Support is therefore obtained from the neural network to correctly analyze the number and frequency of the intermediate frequency component of the harmonic signal. Assume that the distribution range of frequency bands is , where and are the minimum and maximum harmonic orders in the all-phase preprocessing spectrum, respectively.
3.3. Backbone Network of EhdNet
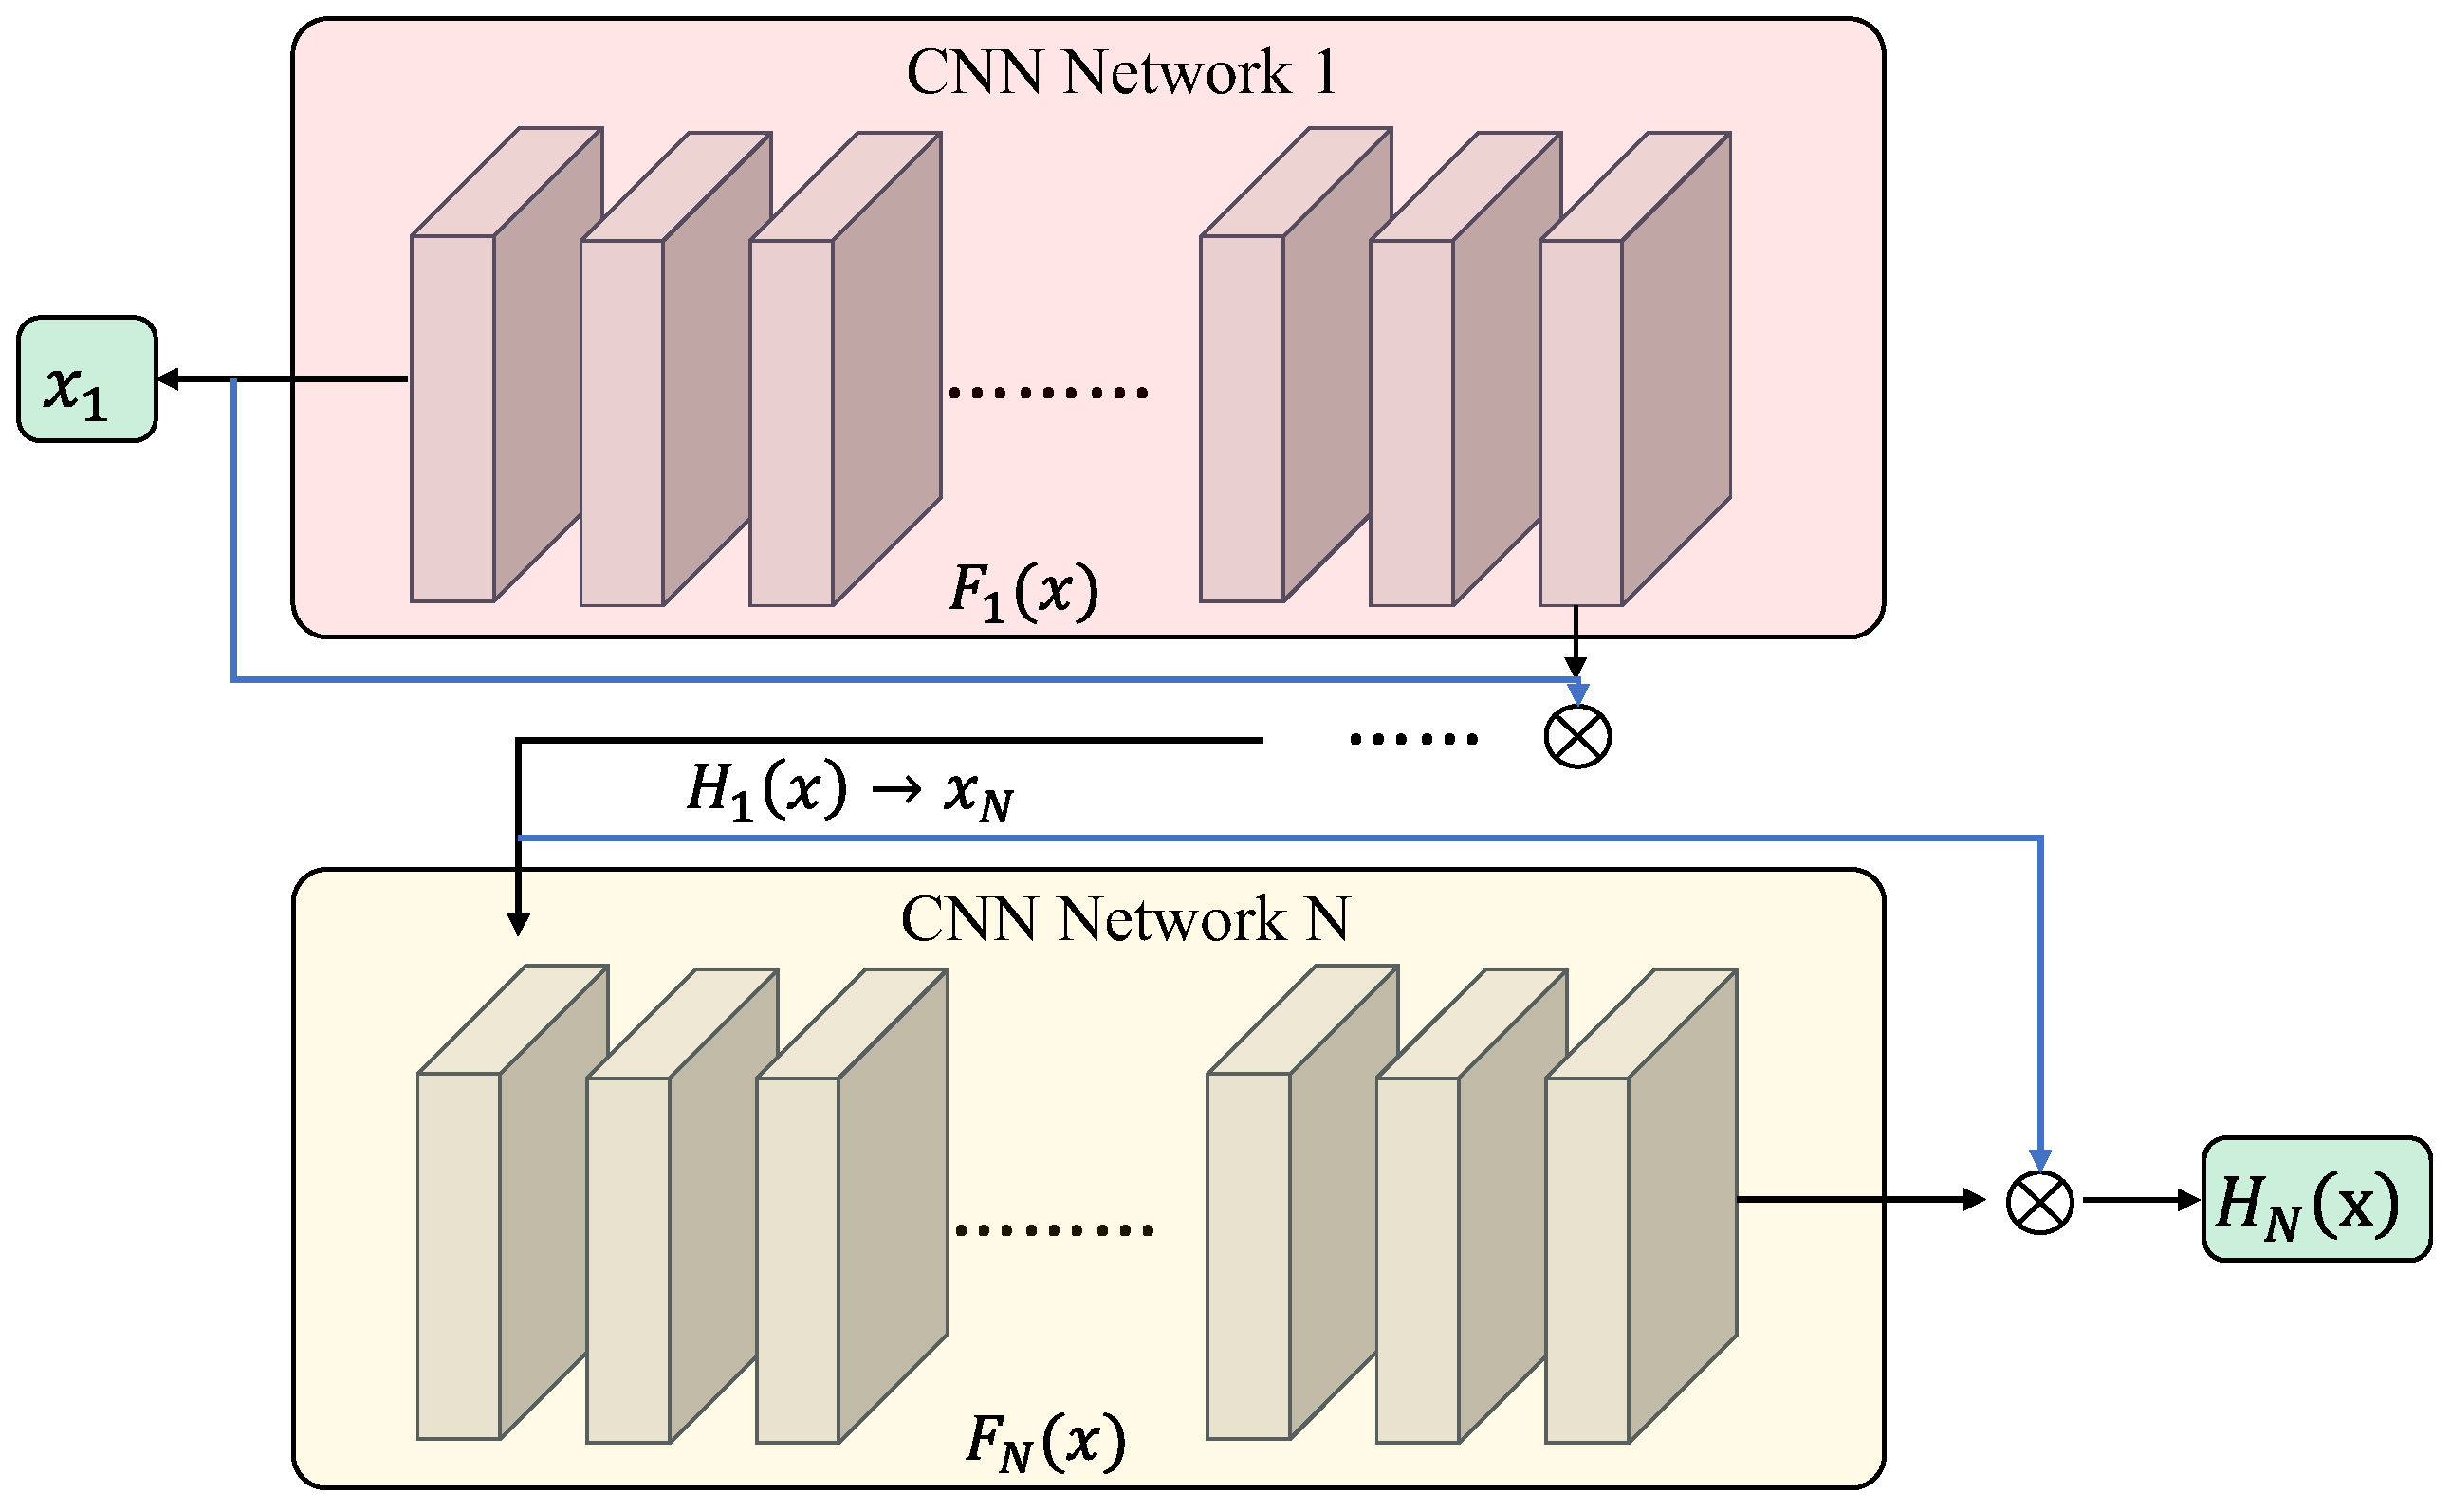
EhdNet chose the residual network as the backbone network. The residual model can be decomposed into multiple residual modules, and the output of the convolutional structure after stacking multiple layers is the learned feature represented by . However, when the network layers are stacked too deeply, it becomes challenging to further optimize the features through reverse gradient propagation like BP neural networks. This necessitates another function for optimizing the output: the residual function , expressed as . Therefore, the output of each residual module is a complex characteristic equation , which can be understood simply as the sum of the network-learned residual function and the original signal. Simultaneously, this serves as an input for subsequent residual modules. Figure 4 below illustrates the backbone network of the EhdNet structure, with representing a residual network.
where in the equation is the weight of each module, and the can be expressed as
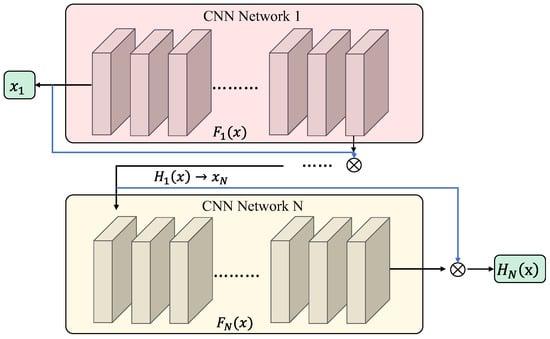
Figure 4.
Structure diagram of the backbone network.
The second half of the above formula is divided into the gradient value of the weight function with respect to , and because the whole formula consists of 1 and a fraction, the whole formula never approaches 0.
3.4. Feature-Extraction Module of EhdNet
The potential of convolutional networks to extract high-dimensional abstract features is not fully harnessed when dealing with low-dimensional harmonic signals. Therefore, this paper proposes the employment of a set of one-dimensional convolutions as deep convolution filters to disassemble the AP preprocessed harmonic signal into fundamental signals, thereby generating high-dimensional input data. The deep-convolution filter is composed of distinct convolution kernels, with each convolution layer housing a two-dimensional kernel. To accomplish this, 16 one-dimensional convolution layers are necessary to yield 16 sets of signals in the output-feature module.
where is the -th input sample, and is the convolution kernel, bias function, and channel-output value of the -th output channel of the -th sample, respectively. The final result is that the output-feature group of i-th layer is , formed by ReLU function .
The phase, amplitude, and frequency of the spectrum serve as the fundamental elements for harmonic detection and recognition in the signal. The spectral energy that varies with the distance between the target and the hydrophone is referred to as the instability spectrum. After the AP preprocessing, the phase detection of the signal exhibits high accuracy, while the ResNet model fusion channel attention mechanism can extract the phase stability spectrum of the processed waveform as a distinctive feature. Its schematic diagram can be expressed as Figure 5.

Figure 5.
Overview of the feature-extraction module.
This stability spectrum encompasses harmonic signals from multiple orders, where the original signal represents the fundamental frequency, and its relationship with the harmonic groups acts as a multiplier factor. For waveforms preprocessed by AP, let the signal period be T; we select group pulses from the time-domain signal whose -th Fourier transform is denoted as . The power spectral density formula of the stochastic process is:
where is the expected value, is the angular frequency of the Fourier graph , and is:
The nonoffset phase and other information obtained after AP preprocessing of the original signal are taken as the original information and represented by . This serves as the input for the feature-extraction module, which comprises two ResNet models equipped with a channel-attention mechanism. To ensure both high harmonic detection accuracy and computational efficiency, we determine a convolution kernel size of 1 × 64. The first layer of the residual network consists of two convolutions, each mapping 16 sets of basic signals to another 16 sets while extracting deep features from these signals. In total, there are 16 one-dimensional convolution layers within this operation, each containing different filters . Therefore, let the degree of convolution be n: 16 × 16 one-dimensional convolution layers are required for this purpose:
Finally, the convolutional outputs of layer are aggregated by summation to produce the final output of layer , resulting in an enhanced representation of harmonic characteristics in more intricate scenarios. To achieve this, the second convolution is performed using the same methodology as the first one, while incorporating a channel-attention mechanism in each individual residual network. This mechanism enhances the stability of spectral features and further optimizes the network’s ability to extract harmonic signal characteristics.
3.5. Weight-Selection Module of EheNet
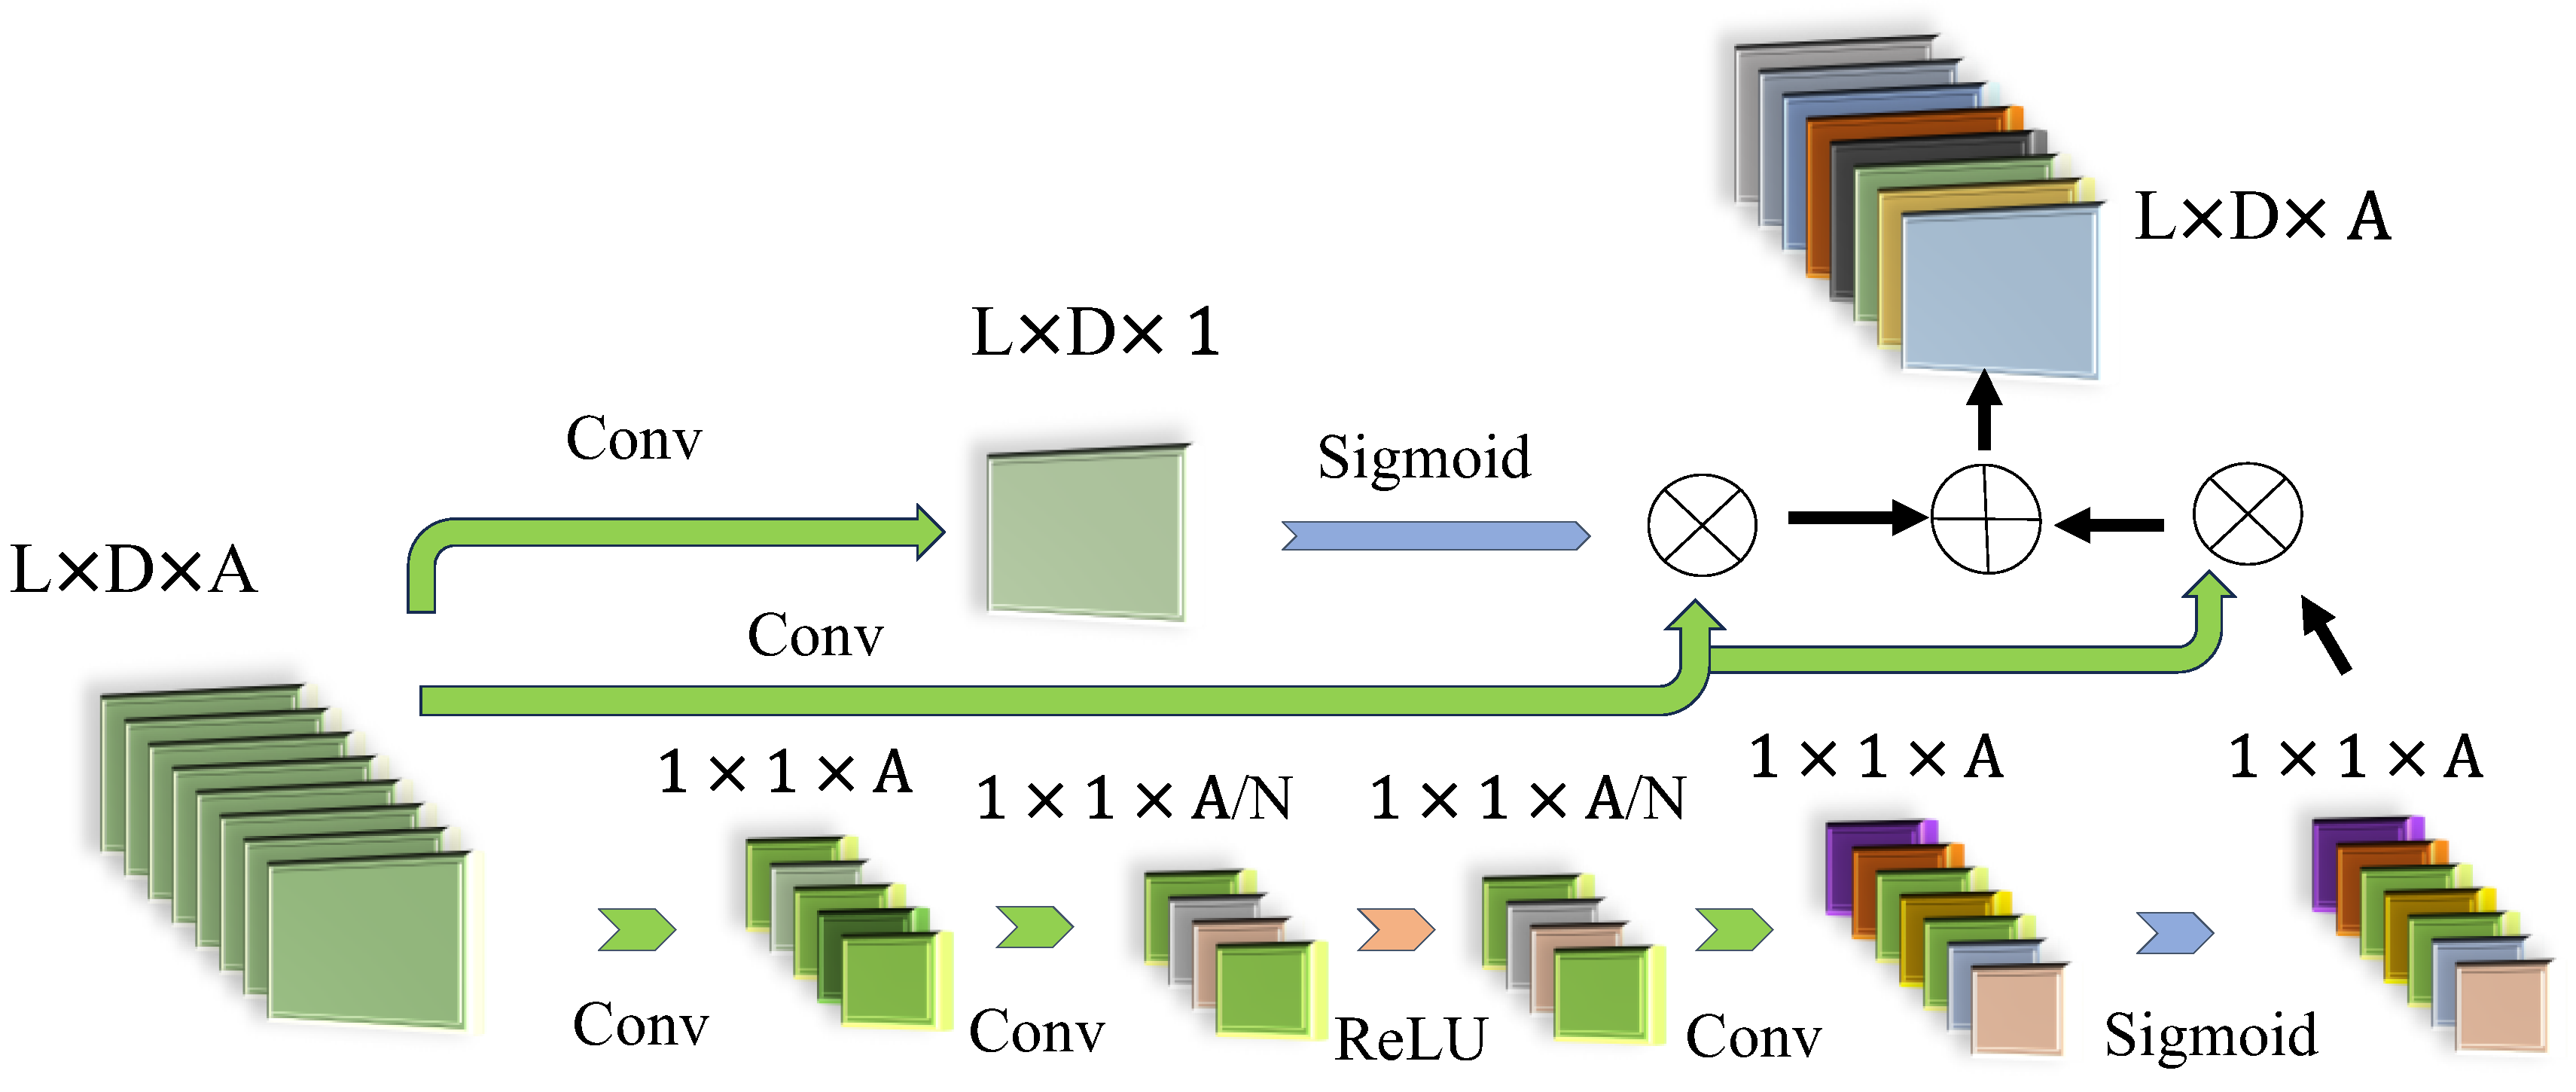
The prevalent approaches to harmonic detection often yield the fence effect and phase deviation. This study presents a novel technique that harnesses the phase invariance of the harmonic signal-processing module to feed the processed original signal into the ensuing network. Furthermore, the weight-selection module of EheNet incorporates a channel-attention mechanism to extract reliable spectrum features, accentuate valuable features through learning, and downplay less pertinent features for harmonic detection.
This method automatically captures crucial information in each feature channel by assigning higher weights to channels with abundant information. By extracting information from each channel and incorporating lightweight gating systems to optimize channel information and output channel weights, the proposed channel-attention mechanism enhances model performance. The mechanism is divided into two components. Figure 6 illustrates the primary component, which assigns weights to each channel, while the auxiliary component involves low-level extraction, obtaining another set of channel information after transposing existing information.
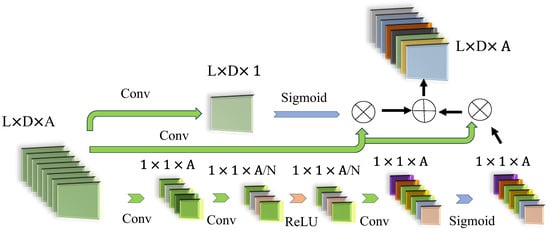
Figure 6.
Weights select module detail diagram.
The waveform characteristics of each channel are first analyzed. The specific steps are as follows. First, the data undergo convolutional processing using a kernel size of and a step size of . This transforms the shape from to , where represents the length of the input data, and represents the width of the input data. The specific formula is,
In the input information of the channel-attention mechanism module, represents the data of the i-th channel, while and denote the weight and bias of said i-th channel in k-th layer convolution respectively. Additionally, signifies ’s output value after one convolution.
This paper also employs a gating system with an activation function, which can be expressed as,
where is the global feature of size , and are the weights of the network mapping. is the ReLU activation function and is the sigmoid activation function.
The signal features obtained in each channel are subsequently standardized and integrated. Data are processed using a 1 × 64 convolution kernel with a step size of 1, transforming the shape from to . While multilayer convolutional networks have demonstrated excellent feature-extraction capabilities, not all outputs from the network represent stable signals. Therefore, extracting one-dimensional data of equal dimensions from the network output as channel weights for the original signal can effectively enhance the spectral energy contained within each channel.
The weight-selection module of EhdNet originates from two directions and captures signal features from diverse perspectives. Subsequently, the weighted information is integrated and harmonized to yield the ultimate output of the channel-attention mechanism.
4. Experiment Results and Discussion
4.1. General Setting
The data sets used in several experiments in this paper are from the following four parts, among which one and two are data used in the existing literature, and three and four are data sets simulated by ourselves. Their details are as follows.
(1) The test signal is selected from Ref. [41]. As shown in Table 1, the fundamental frequency, the sampling frequency, and the sampling length are set as f0 = 50.5 Hz, fs = 2520.6 Hz, and N = 512, respectively;

Table 1.
Harmonic amplitude parameters of the measured signal.
(2) The test signals are selected from the signals used in [21], as shown in Table 2. The fundamental frequency, sampling frequency, and sampling length are set as f0 = 50.2 Hz, fs = 1152 Hz, and N = 512, respectively;

Table 2.
Parameters of each harmonic component of the measured signal.
(3) In Table 3, the experimental harmonic signals are shown with the following parameter setting: fundamental frequency of f0 = 50 Hz, sampling frequency of fs = 3200 Hz, and sampling length of N = 1024;

Table 3.
Primitive signal harmonic component distribution.
(4) In Table 4, the experimental harmonic signals are shown with the following parameter setting: fundamental frequency of f0 = 50.04 Hz, sampling frequency of fs = 3200 Hz, and sampling length of N = 1024.

Table 4.
Simulation data signal harmonic component distribution.
The evaluation index used in the experiment is the relative error of frequency, amplitude, and phase, and the collective calculation is the error ratio between the calculation result and the set signal.
4.2. Waveform Recovery
Experiments are designed to verify the advancement and accuracy of the proposed algorithm. Several harmonics with different frequencies, aspects, and steps are randomly added. FFT, ANN, and EhdNet are then used for harmonic detection, and the harmonic content measured by each method is utilized to restore the harmonic content measured by each method. The wave-component distribution is given in Table 5.

Table 5.
Experimental data signal harmonic component distribution.
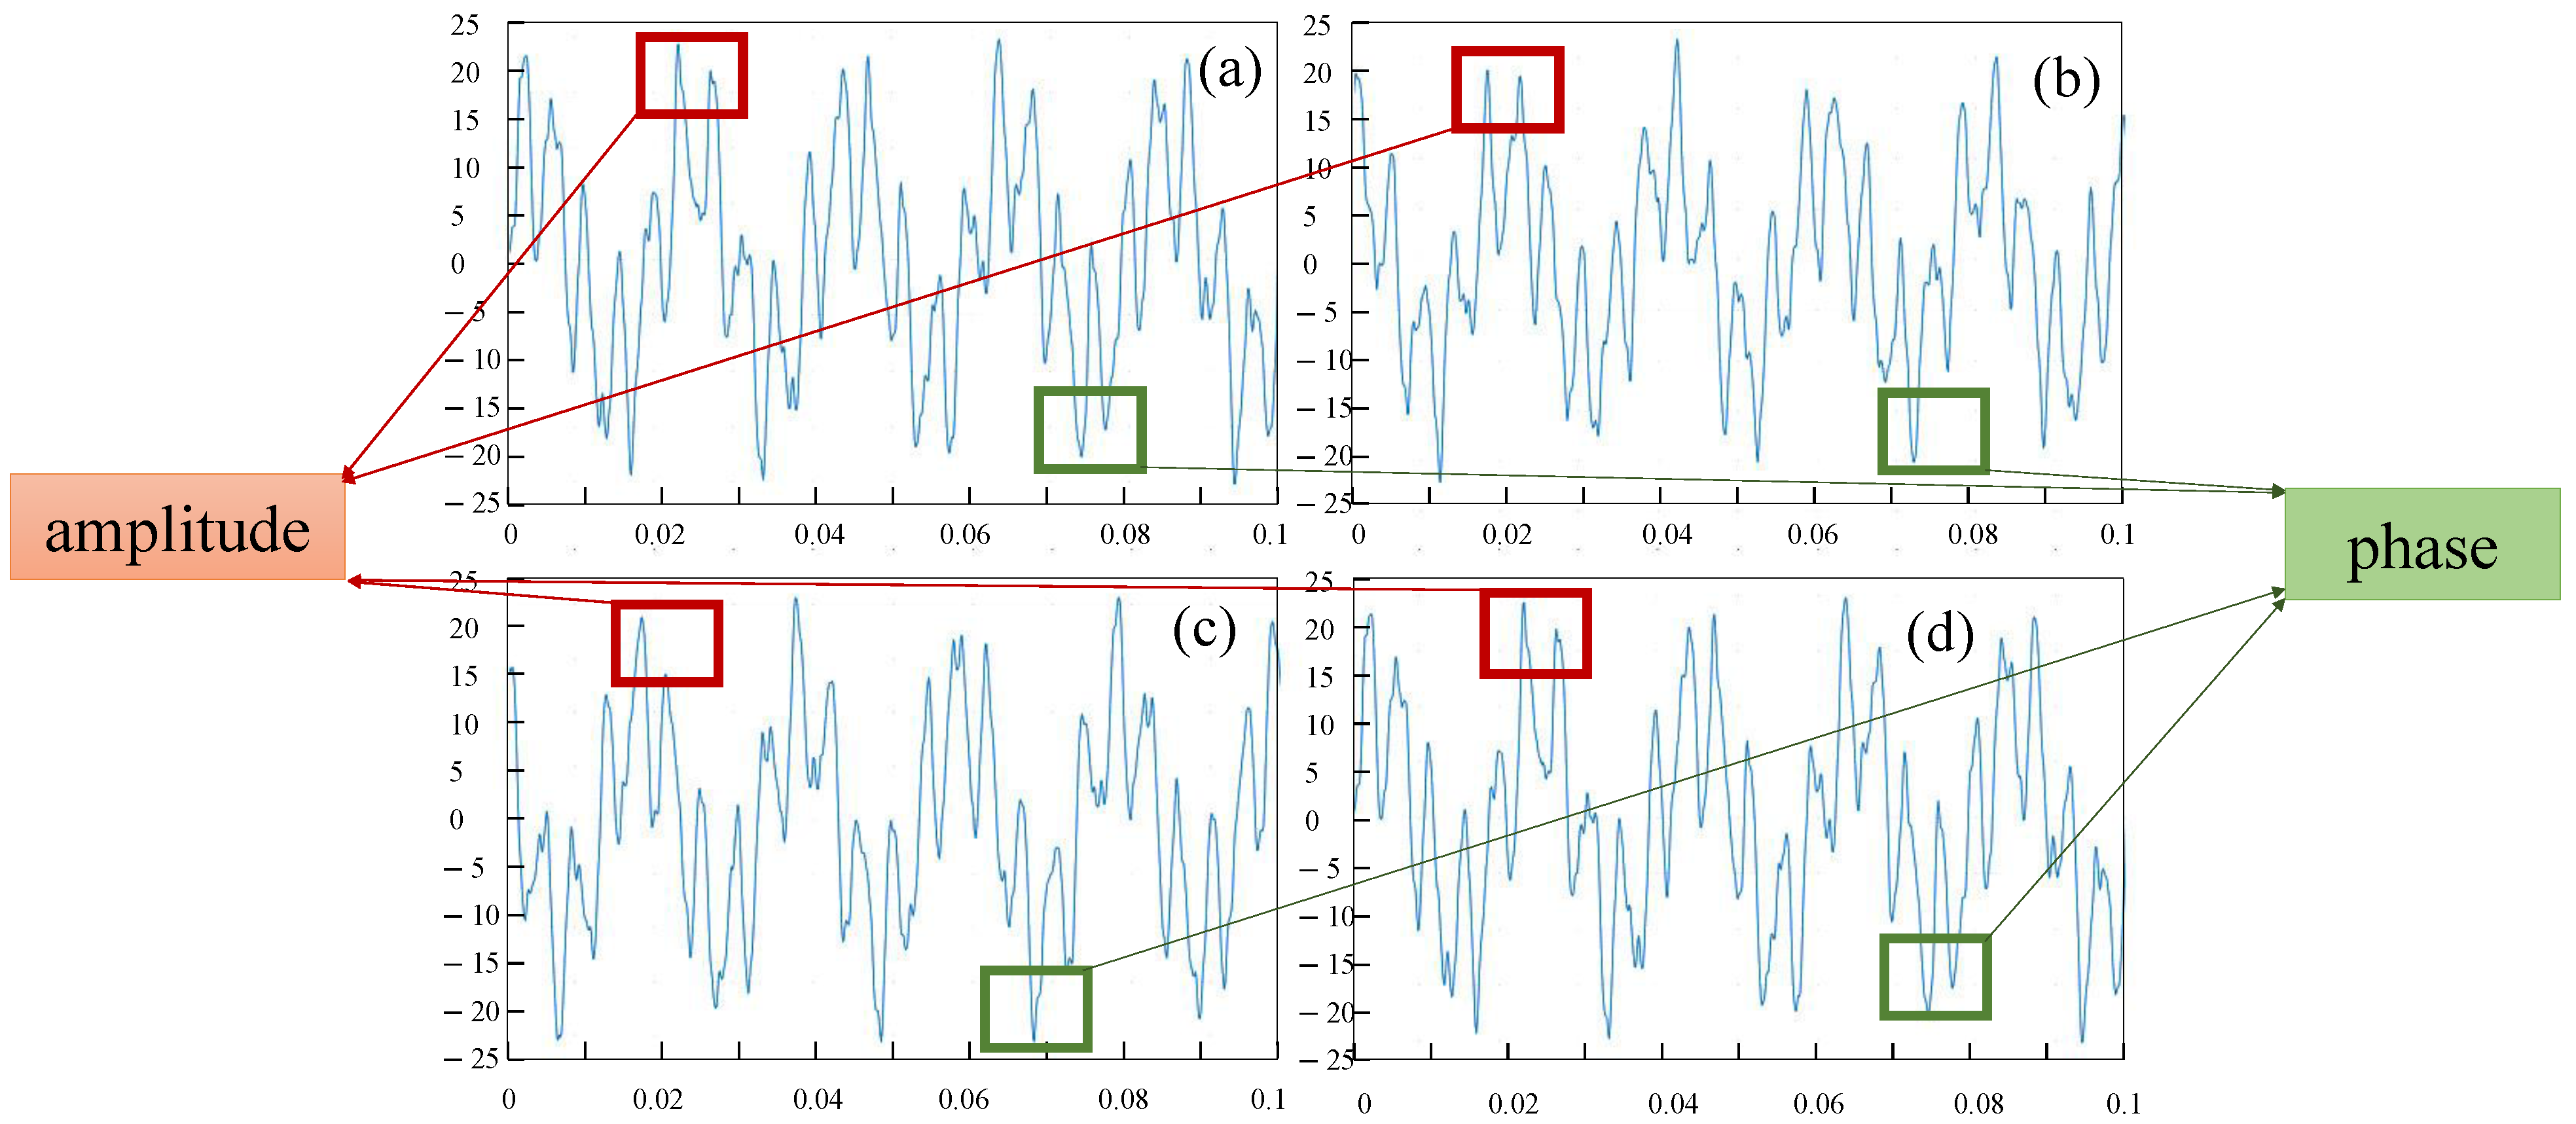
The experimental results are shown in Figure 7.
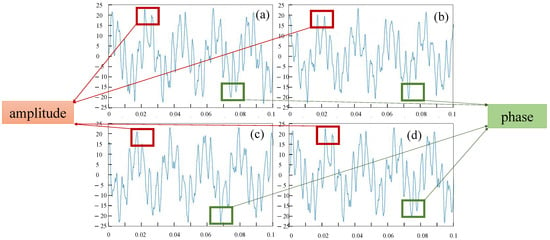
Figure 7.
Comparison of the detection methods’ restoration results. From (a–d) are the original waveform (a), the waveform restored by ANN (b), the waveform restored by FFT (c), and the waveform restored by the algorithm (d) in this study. The horizontal axis of the waveform corresponds to time, and the vertical axis corresponds to amplitude.
As shown by the experimental results in Figure 7, the ANN-based harmonic detection algorithm can accurately detect the frequency values of each harmonic and interharmonic component in the broadband signal with high-frequency resolution.
Moreover, its performance in amplitude detection is extremely superior, with the relative error remaining at an extremely low level. However, the ANN-based harmonic detection algorithm suffers from large errors in detecting phases and has poor phase-detection capacity. The performance of the harmonic detection algorithm based on harmonic phase detection is much better than that of the ANN-based harmonic detection algorithm. However, because its algorithmic foundation is still Fourier transform, a gap still exists between spectrum aliasing and the picket-fence effect. The detection is poor for the broadband harmonic frequency and amplitude values of the broadband domain. The algorithm in this study combines the advantages of the two aforementioned methods and has better recovery results than the two in terms of frequency and amplitude.
4.3. Comparison of the Harmonic Detection Effect in a Noiseless Environment
The original signal is preprocessed by all-phase preprocessing to obtain the number of harmonic components in the signal; the accurate phase information of the base waves and the rough amplitude and frequency information; the number of the neural network’s input-, hidden- and output-layer neurons; and the initial values of adjustable parameters.
The results of the all-phase preprocessing spectrum analyses are shown in Table 6. The signal contains a total of 10 frequency components, including the base wave, and the rough range of frequency distribution is 0–2500 Hz. In accordance with Equations (9) and (10), the input-layer node is set to 1000, the node of the hidden and output layers is set to 500, the initial value of authority is based on the results of the all-phase preprocessing spectrum analysis, and the phase is based on the initial phase detected by the all-phase preprocessing. The setting rate is 0 = 0.9, the momentum factor λ = 0.01, and the maximum number of iterations D = 100.

Table 6.
Harmonic signal-processing module results.
Four algorithms, namely, APFFT, WT, BPNet, and EhdNet, are used to perform MATLAB simulation experiments on the harmonic signals in Table 1 without adding noise. Their results are compared with those of the proposed algorithm in Figure 8. The results obtained from the simulations with all-phase preprocessing are frequency biased. The harmonic frequencies detected by BPNet and the proposed algorithm are more accurate than those detected by the other methods. However, BPNet has poor performance in phase detection, and EhdNet, after omnidirectional bit pretreatment, demonstrates good performance. The WT algorithm has a poor detection effect in all aspects. Its simulation results are far from those of the initial phase. The phase errors obtained by APFFT and the proposed algorithm are two orders of magnitude smaller than those obtained by the ANNs. In summary, the proposed algorithm fully integrates the advantages of the two algorithms and can accurately measure the frequency, amplitude, and phase of the harmonics and interharmonics. The long-term accuracy performance of the proposed algorithm is demonstrated. The signal harmonic frequencies in Table 1 are distributed in the range of 0–50 and are both harmonic and interharmonic with a wide range of features. Table 7, Table 8 and Table 9 show the relative errors of the three methods in terms of the signal-recovery frequency error and the error of the proposed method.

Figure 8.
Accuracy of APFFT, WT, traditional neural network (BP), PSO-sa, BLS-RAME, and EhdNet; (a–c) are the accuracy of frequency, amplitude, and phase, in order. It can be clearly seen that EhdNet has the highest accuracy in all aspects.

Table 7.
Frequency accuracy rate of the six methods.

Table 8.
Amplitude accuracy rate of the six methods.

Table 9.
Phase accuracy rate of the six methods.
It can be seen that the effect of BLS-RAME and EhdNet is very good in the phase accuracy index, and the accuracy of EhdNet is higher in the overall comparison.
4.4. Harmony-Detection Performance in Different Noise Environments
The noise resistance of the proposed algorithm is also tested. The signal in Table 1 is composed of noise, and the signal-in-sign signal ratio of Gaussian white noise is 10, 20, 40, and 80 dB. Different noise conditions are set based on the content of each harmonic component to examine the effect of different noise amounts on the harmonic measurement method. The results are shown in Figure 9.

Figure 9.
Relative errors of harmonic detection in different noise environments, and (a,b) are the relative errors of amplitude and phase.
As the proportion of noise increases, the error of the harmonic measurement also increases. Under the influence of different noise conditions, the amplitude and phase detection results for each strange harmonic are high. Even under 10 dB, the relative error of harmonic amplitude detection remains below 2%. This finding proves that the proposed algorithm has a strong anti-interference ability.
The following is a comparison of the accuracy of the phase and amplitude of several methods in different noise environments at the base frequency of 50.04 Hz, Due to the length, this experiment did not compare WT, APFFT, and the other methods with poor effect. The experimental results are shown in Table 10 and Table 11.

Table 10.
Phase accuracy rate of the four methods under different circumstances.

Table 11.
Amplitude accuracy rate of the four methods under different circumstances.
As can be seen from the table, with the complexity of the environment, although the accuracy has decreased, EhdNet still has a high accuracy.
4.5. RMSE Comparison of Various Methods
In this section, we selected the following evaluation indicator for comparative experiments: root mean square error (RMSE).
where is the number of data points, is the observed values, and are the predicted values. RMSE measures the model error in predicting quantitative data and determines the standard deviation of the model prediction-model errors and, thus, assists in the assessment of how the error data are concentrated around the line of best fit.
In addition, the amplitude and phase modulation associated with the impact of typical sources of interference in low-voltage networks are very important. At present, Piotr Kuwałek [44,45] and his team have done a better job in this aspect, so this paper adopts their method to modulate the test signal and carry out a new experiment. The modulation process is roughly as follows:
where is the test signal used for the subsequent experiment. is the initial simulation signal adding complex noise, and the modulating signal in (7) is a signal associated with the resultant operation of N disturbing loads. The specific modulation signal settings refer to the literature [45].
Due to the improvement of the relevant data set, we updated the original corresponding experimental data. The experimental results are shown in Table 12.

Table 12.
Comparison of real experimental data.
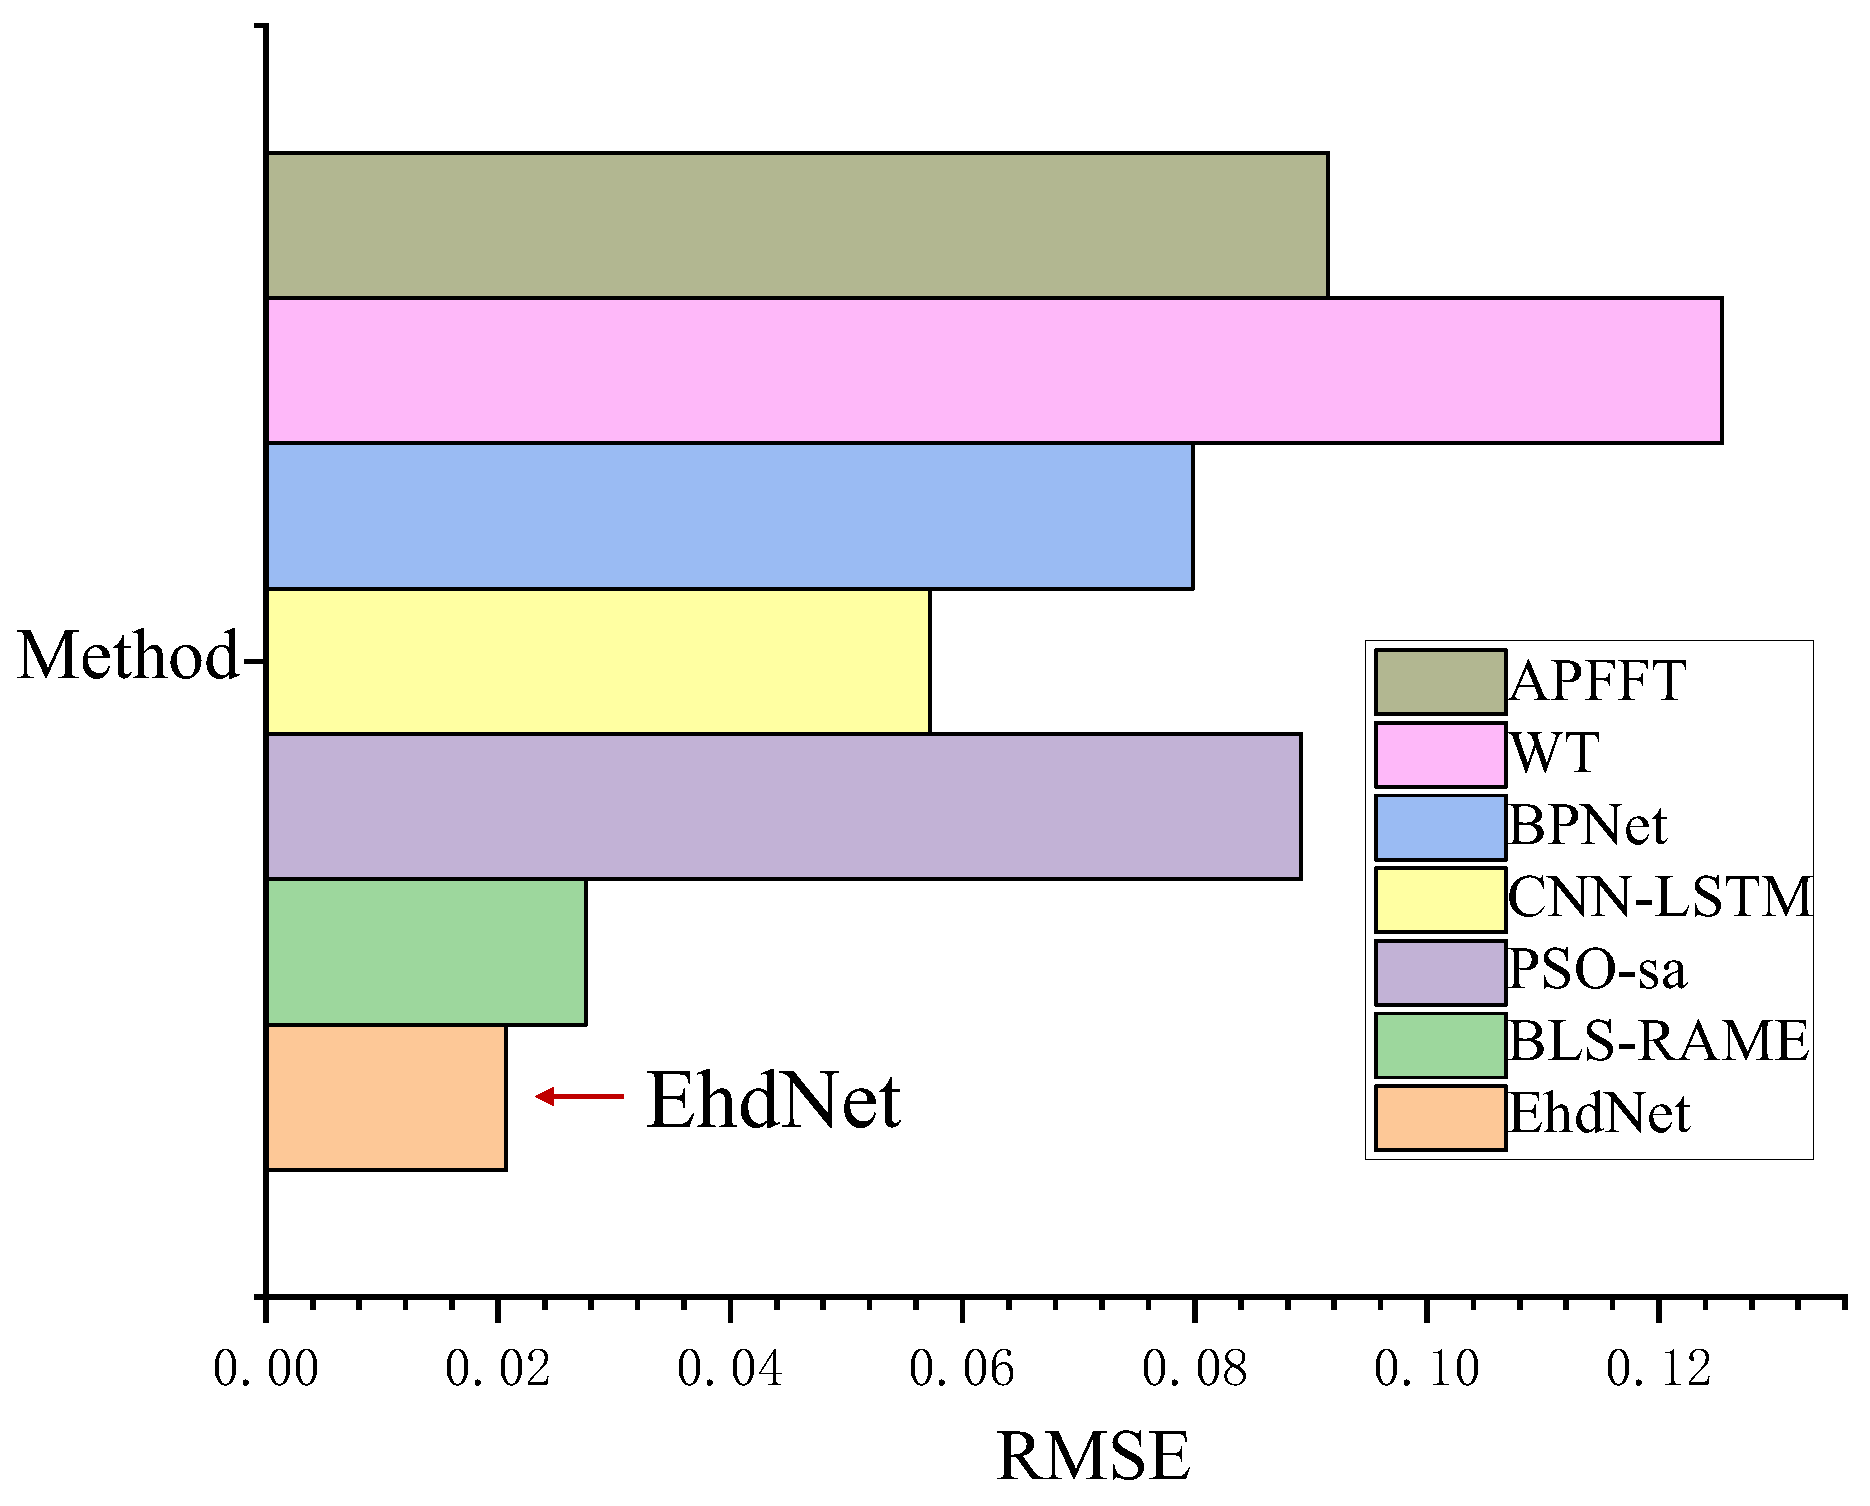
It can be seen in Figure 10 that the proposed hybrid deep-learning EhdNet model outperforms the other models. and the RMSE of EhdNet is the smallest, indicating that its result is the closest to the real situation, and the fitting effect is the best. The performance indicators are compared in the Table 12. The estimated results of the PSO-sa, CNN-LSTM, BLS-RAME, EhdNet method, and actual data are compared by ANOVA in Table. ANOVA is a statistical test that is used to analyze the difference between means of more than two groups of data. It uses the F-test to determine statistical significance.
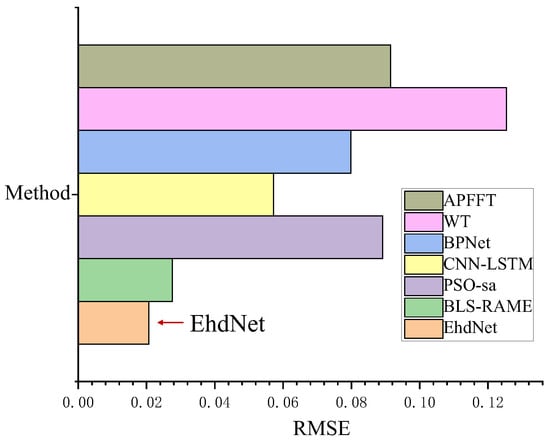
Figure 10.
RMSE comparison diagram of each method. The lower the RMSE value, the better the fitting effect and the more accurate the harmonic detection.
4.6. Network Convergence Speed Simulation Comparison
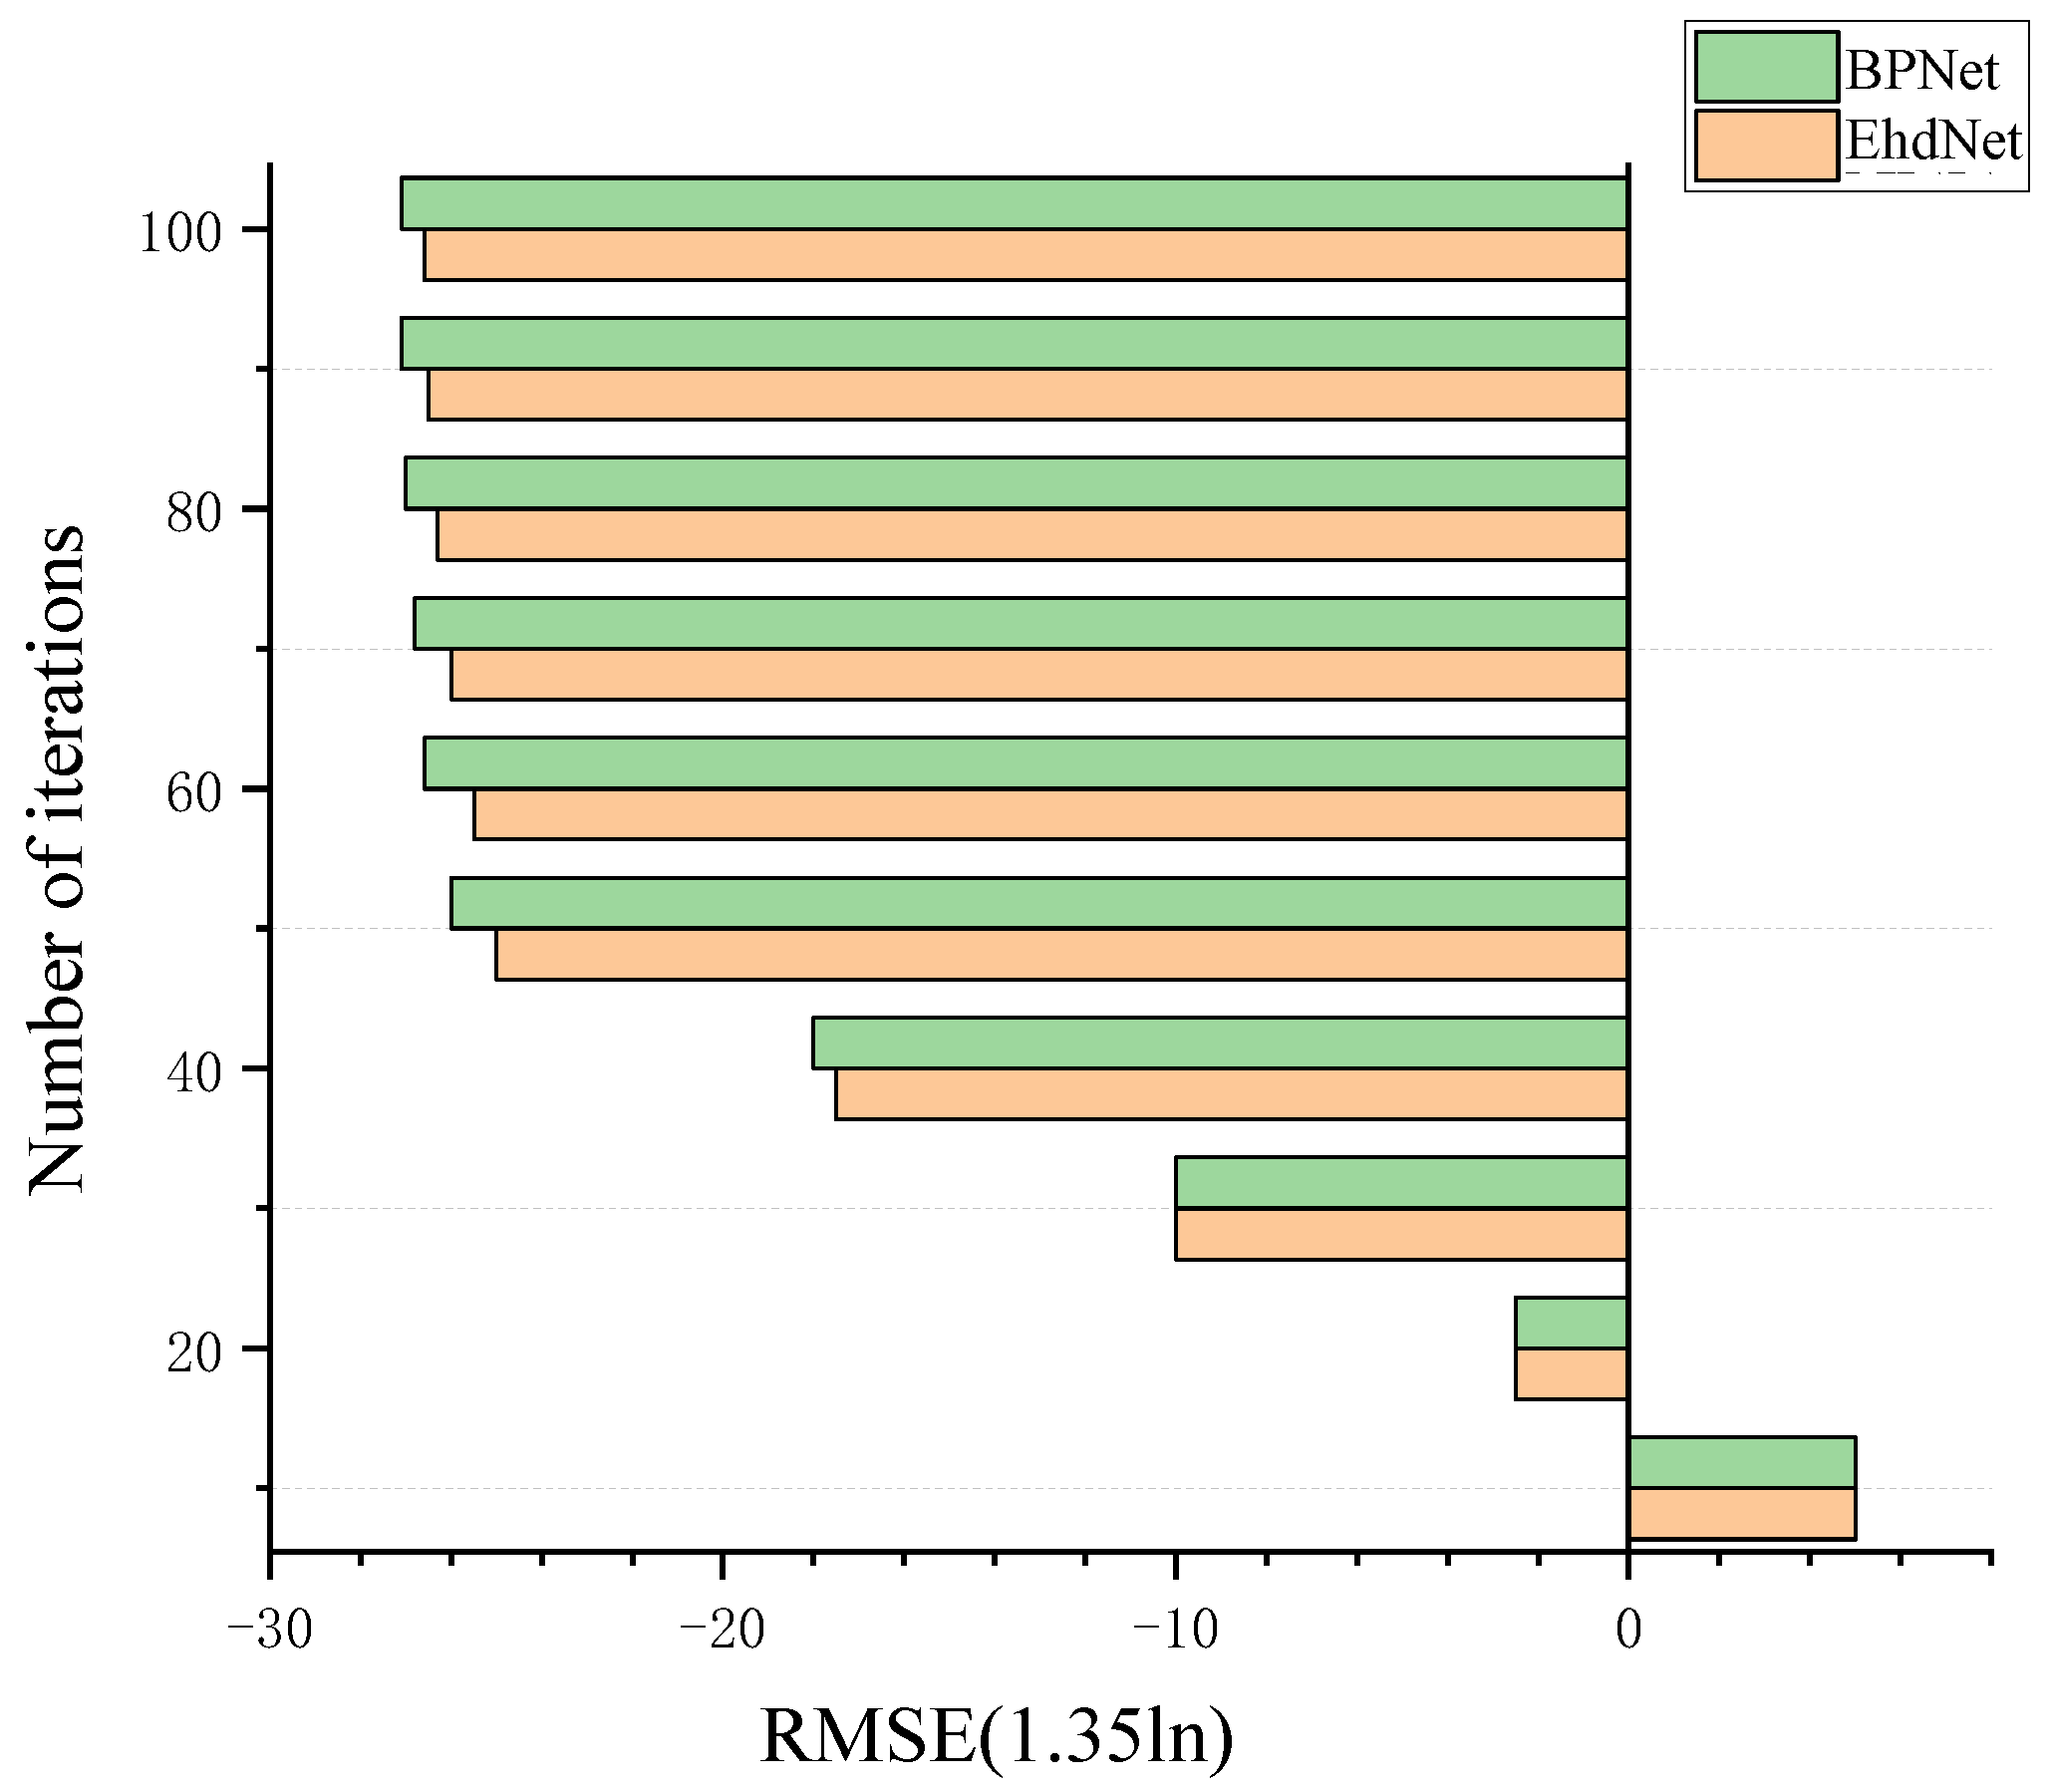
The BP network algorithm and the algorithm in this study are used to simulate the harmonic signals in Table 1 to verify the convergence speed of the neural network. The obtained network-error integrated curve is shown in Figure 11.
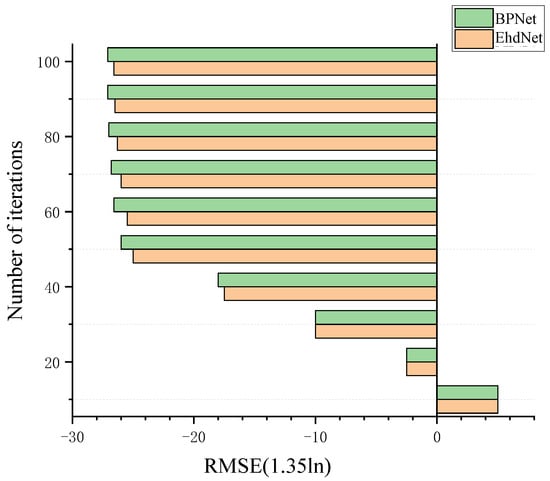
Figure 11.
Error-fitting comparison.
As indicated in Figure 11, 1.35 × 10⁻²⁷ is the error convergence result obtained after 74 iterations of the algorithm. After 98 iterations, the output error of each stage of BP preprocessing converges at 1.34 × 10⁻²⁷, and the number of iterations is considerably reduced. The simulation results show that, because the improved algorithm in this study has a higher calculation speed and better overall situation search capability than the other compared algorithms, it can effectively avoid falling into the local extreme value and has fewer iteration times and faster convergence.
4.7. Internal Module Effect Comparison
Experiments are also performed to verify the effectiveness of the internal modules of the proposed algorithm. Three modules in EhdNet are removed: the harmonic signal-processing module, feature-extraction module, and weight-selection module. The losses in frequency, phase, amplitude, and calculation speed are calculated, and the results are shown in Table 7. Notably, after removing the network, the iteration speed is not considered. The experimental results are shown in Table 13.

Table 13.
Accuracy after removing EhdNet internal modules.
As indicated in Table 7, each module of the proposed EhdNet has strong irreplaceability, and the effect on harmonic detection is efficient. In particular, AP preprocessing results in an obvious improvement in phase detection.
Through experiments, it can be found that the detection accuracy of the proposed EhdNet is better than that of APFFT, WT, and other common neural network methods in terms of frequency, amplitude, and phase under both noise and no noise environments. In comparison experiments with actual data, the RMSE of EhdNet is also lower than that of other recent methods. In comparison experiments with actual data, the RMSE of EhdNet is also lower than that of other recent methods. Because of the introduction of the channel-attention mechanism, the iteration speed of the network is also improved. So, we can draw conclusions.
5. Conclusions
We propose a modern neural network EhdNet with efficient harmonic detection capability. First, all-phase preprocessing without phase compression is adopted to correct the detection parameters. The compression operation is avoided because phase ambiguity is overcome, and the amount of calculation is reduced. Second, the channel-attention mechanism is introduced to improve the precision and speed of detection. Last, due to the deep-network-building capability property of EhdNet, the frequency and amplitude of each detuning element and the anharmonicity in the harmonic signal can be accurately detected by iteratively training the neural network. The experimental results demonstrate that the proposed method can eliminate spectral leakage and estimate low-harmonic parameters. In the future, we will continue to study harmonic detection and attempt to perform accurate harmonic detection in complex and realistic scenarios. And we will use some of the more advanced neural networks [46,47,48] as the backbone.
Author Contributions
Conceptualization, Y.D. and L.W.; Data curation, Y.D. and Y.L.; Methodology, H.L., Y.L. and L.W.; Software, L.W.; Writing-original draft, H.L. and H.L.; Visualization, L.W. and Y.W.; Formal analysis, Y.L. and L.W.; Resources, Y.D and H.L.; Writing—review & editing, Y.W.; Supervision, Y.W.; Project administration, Y.L. All authors have read and agreed to the published version of the manuscript.
Funding
This paper is supported by the school fund project of Wuhan Textile University under the project name “Application research of 5G technology in power harmonic table” (226058) and was supported in part by the National Natural Science Foundation of Hubei Province, China under Grant (No. 2022CFB971), the Shenzhen Science and Technology Program under Grant (No. JCYJ20230807152900001), and the Jiangxi Provincial Natural Science Foundation under Grant (No. 20232BAB212026).
Data Availability Statement
The data presented in this study are available in reference number [21,41].
Conflicts of Interest
The authors declare no conflict of interest.
References
- Cai, G.; Wang, L.; Yang, D.; Sun, Z.; Wang, B. Harmonic detection for power grids using adaptive variational mode decomposition. Energies 2019, 12, 232. [Google Scholar] [CrossRef]
- Lou, Z.; Li, P.; Ma, K.; Teng, F. Harmonics and Interharmonics Detection Based on Synchrosqueezing Adaptive S-Trans form. Energies 2022, 15, 4539. [Google Scholar] [CrossRef]
- Li, Z.; Hu, T.; Abu-Siada, A. A minimum side-lobe optimization window function and its application in harmonic detection of an electricity gird. Energies 2019, 12, 2619. [Google Scholar] [CrossRef]
- Hmida, M.A.; Braham, A. Fault detection of VFD-fed induction motor under transient conditions using harmonic wavelet trans form. IEEE Trans. Instrum. Meas. 2020, 69, 8207–8215. [Google Scholar]
- Wang, G.; Wang, X.; Zhao, C. An iterative hybrid harmonics detection method based on discrete wavelet transform and bartlett–hann window. Appl. Sci. 2020, 10, 3922. [Google Scholar] [CrossRef]
- Khatua, P.; Ray, K.C. A low computational complexity modified complex harmonic wavelet transform. Circuits Syst. Signal Process. 2022, 41, 6462–6483. [Google Scholar] [CrossRef]
- Zhou, X.; Chan, W.S.; Sharma, T.; Xia, J.; Chen, S.; Feng, W. A Doherty power amplifier with extended high-efficiency range using three-port harmonic injection network. IEEE Trans. Circuits Syst. I Regul. Pap. 2022, 69, 2756–2766. [Google Scholar] [CrossRef]
- Huang, S.; Bi, Z.; Sun, Z.; Aggarwal, A.; Huang, X.; Wu, L.; Niu, F. Detection of stator winding faults in PMSMs based on second harmonics of phase instantaneous reactive powers. Energies 2022, 15, 3248. [Google Scholar] [CrossRef]
- He, Y.; Chen, J.; Zhou, X.; Huang, S. In-situ fault diagnosis for the harmonic reducer of industrial robots via multi-scale mixed convolutional neural networks. J. Manuf. Syst. 2023, 66, 233–247. [Google Scholar] [CrossRef]
- Alghamdi, T.A.; Abdusalam, O.T.; Anayi, F.; Packianather, M. An artificial neural network based harmonic distortions estimator for grid-connected power converter-based applications. Ain Shams Eng. J. 2023, 14, 101916. [Google Scholar] [CrossRef]
- Chen, D.; Xiao, L.; Yan, W.; Li, Y.; Guo, Y. A harmonics detection method based on triangle orthogonal principle for shunt active power filter. Energy Rep. 2021, 7, 98–104. [Google Scholar] [CrossRef]
- Liu, H.; Zhang, C.; Deng, Y.; Liu, T.; Zhang, Z.; Li, Y. Orientation Cues-Aware Facial Relationship Representation for Head Pose Estimation via Transformer. IEEE Trans. Image Process. 2023, 32, 6289–6302. [Google Scholar] [CrossRef] [PubMed]
- Liu, T.; Wang, J.; Yang, B.; Wang, X. NGDNet: Nonuniform Gaussian-label distribution learning for infrared head pose estimation and on-task behavior understanding in the classroom. Neurocomputing 2021, 436, 210–220. [Google Scholar] [CrossRef]
- Liu, H.; Nie, H.; Zhang, Z.; Li, Y.-F. Anisotropic angle distribution learning for head pose estimation and attention understanding in human-computer interaction. Neurocomputing 2021, 433, 310–322. [Google Scholar] [CrossRef]
- Kim, K.H.; Bertelè, M.; Bottasso, C.L. Wind inflow observation from load harmonics via neural networks: A simulation and field study. Renew. Energy 2023, 204, 300–312. [Google Scholar] [CrossRef]
- Gierden, C.; Kochmann, J.; Waimann, J.; Svendsen, B.; Reese, S. A review of FE-FFT-based two-scale methods for computational modeling of microstructure evolution and macroscopic material behavior. Arch. Comput. Methods Eng. 2022, 29, 4115–4135. [Google Scholar] [CrossRef]
- Zhang, S.; Tian, B.; Liang, J.; Cheng, Y. Detection of Harmonic Components using the FFT and Instantaneous Reactive Power Theory. J. Phys. Conf. Ser. 2022, 2242, 012034. [Google Scholar] [CrossRef]
- Olsson, J.; Linderholt, A.; Jarnerö, K.; Hongisto, V. Incremental use of FFT as a solution for low BT-product reverberation time measurements. Appl. Acoust. 2023, 203, 109191. [Google Scholar] [CrossRef]
- Li, R.; Liu, T.; Liu, X. Research on Harmonic Detection Algorithm Based on apFFT. J. Phys. Conf. Ser. 2022, 2401, 012091. [Google Scholar] [CrossRef]
- Xia, P.; Zhou, H.; Sun, H.; Sun, Q.; Griffiths, R. Research on a Fiber Optic Oxygen Sensor Based on All-Phase Fast Fourier Trans form (apFFT) Phase Detection. Sensors 2022, 22, 6753. [Google Scholar] [CrossRef]
- Su, T.; Yang, M.; Jin, T.; Flesch, R.C.C. Power harmonic and inter harmonic detection method in renewable power based on Nuttall double-window all-phase FFT algorithm. IET Renew. Power Gener. 2018, 12, 953–961. [Google Scholar] [CrossRef]
- Ropalkar, O.S.; Yadav, O.P.; Zambare, C.; Vyas, N.S. Improved estimation of rail–wheel contact forces from instrumented wheel-set data through higher harmonic cancellation and a back-propagation neural network scheme. Eng. Appl. Artif. Intell. 2023, 119, 105811. [Google Scholar] [CrossRef]
- Deng, Y.; Zhao, G.; Zhu, K.; Zhou, T.; Xu, Z. NCAFI: Nuttall convolution window all-phase FFT interpolation-based harmonic detection algorithm for infrared imaging detection. Infrared Phys. Technol. 2022, 125, 104310. [Google Scholar] [CrossRef]
- Liu, H.; Liu, T.; Zhang, Z.; Sangaiah, A.K.; Yang, B.; Li, Y. ARHPE: Asymmetric Relation-Aware Representation Learning for Head Pose Estimation in Industrial Human-Computer Interaction. IEEE Trans. Ind. Inf. 2022, 18, 7107–7117. [Google Scholar] [CrossRef]
- Liu, H.; Fang, S.; Zhang, Z.; Li, D.; Lin, K.; Wang, J. MFDNet: Collaborative Poses Perception and Matrix Fisher Distribution for Head Pose Estimation. IEEE Trans. Multimed. 2022, 24, 2449–2460. [Google Scholar] [CrossRef]
- Mao, S.; Zhou, J.; Hao, M.; Ding, A.; Li, X.; Wu, W.; Shi, L. BP neural network to predict shelf life of channel catfish fillets based on near infrared transmittance (NIT) spectroscopy. Food Packag. Shelf Life 2023, 35, 101025. [Google Scholar] [CrossRef]
- Chen, K.J.; Chen, K.L.; Wang, Q.; He, Z.Y.; He, J.L. Short-term load forecasting with deep residual networks. IEEE Trans. Smart Grid 2019, 10, 3943–3952. [Google Scholar] [CrossRef]
- Farsi, B.; Amayri, M.; Bouguila, N.; Eicker, U. On short-term power load forecasting using machine learning techniques and a novel parallel deep LSTM-CNN approach. IEEE Access 2021, 9, 31191–31212. [Google Scholar] [CrossRef]
- Pham, M.H.; Nguyen, M.N.; Wu, Y.K. A novel short-term power load forecasting method by combining the deep learning with singular spectrum analysis. IEEE Access 2021, 9, 73736–73746. [Google Scholar] [CrossRef]
- Tang, Z.H.; Zhao, G.N.; Cao, S.X. Very short-term wind direction prediction via self-tuning wavelet long-short term memory neural network. Proc. CSEE 2019, 39, 4459–4467. [Google Scholar]
- Xiang, L.; Li, J.X.; Wang, P.H. Wind speed multistep interval forecasting based on VMD-FIG and parameter-optimized GRU. Acta Energiae Solaris Sin. 2021, 42, 237–242. [Google Scholar]
- Zhu, L.J.; Xun, Z.H.; Wang, Y.X.; Cui, Q.; Chen, W.Y.; Lou, J.C. Short-term power load forecasting based on CNN-BiLSTM. Power Syst. Technol. 2021, 45, 4532–4539. [Google Scholar]
- Zhao, P.; Dai, Y.M. Power load forecasting of SVM based on real-time price and weighted grey relational projection algorithm. Power Syst. Technol. 2020, 44, 1325–1332. [Google Scholar]
- Wu, Y.; Lei, J.W.; Bao, L.S. Short-term load forecasting based on improved grey relational analysis and neural network optimized by bat algorithm. Autom. Electr. Power Syst. 2018, 42, 67–72. [Google Scholar]
- Mancuso, P.; Antonio, V.P.; Sudoso, M. A Machine Learning Approach for Forecasting Hierarchical Time Series Expert Systems with Applications; Elsevier: Amsterdam, The Netherlands, 2021. [Google Scholar]
- Nagihan, O.; Severoglu, S. Amplitude and phase estimations of power system harmonics using deep learning framework. IET Gener. Transm. Distrib. 2020, 14, 4089–4096. [Google Scholar]
- Rodrigues, W.L., Jr.; Silva Borges, F.A.; Lira Rabelo, R.d.A.; de Lima, B.V.A.; Almeida de Alencar, J.E. Classification of power quality disturbances using convolutional network and long short-term memory network. Int. Jt. Conf. Neural Netw. 2019, 20300, 1–6. [Google Scholar]
- Kuyumani, E.M.; Hasan, A.N.; Shongwe, T. A Hybrid Model Based on CNN-LSTM to Detect and Forecast Harmonics: A Case Study of an Eskom Substation in South Africa. Electr. Power Compon. Syst. 2023, 51, 746–760. [Google Scholar] [CrossRef]
- Cloete, J.B.; Stander, T.; Wilke, D.N. Parametric Circuit Fault Diagnosis Through Oscillation Based Testing in Analogue Circuits: Statistical and Deep Learning Approaches. IEEE Access 2022, 10, 15671–15680. [Google Scholar] [CrossRef]
- Li, Z.; Wang, L.; Wang, Y.; Li, G. Harmonic detection method based on adaptive noise cancellation and its application in photo voltaic-active power filter system. Electr. Power Syst. Res. 2022, 184, 106308. [Google Scholar] [CrossRef]
- Qing, B.Y.; Teng, Z.S.; Gao, Y.P.; Wen, H. An approach for electrical harmonic analysis based on Nuttall window double-spectrum-line interpolation FFT. Proc. CSEE 2008, 28, 153–158. [Google Scholar]
- Wang, T.; Song, J. Harmonic Detection Method Based on Particle Swarm Optimization and Simulated Annealing Algorithm of Electrohydraulic Servo System. J. Robot. 2022, 2022, 7483427. [Google Scholar] [CrossRef]
- Li, C.; Sun, C.; Chen, Z.; Zhang, Y. Broad Learning System Using Rectified Adaptive Moment Estimation for Harmonic Detection and Analysis. IEEE Trans. Ind. Electron. 2023, 99, 1–10. [Google Scholar] [CrossRef]
- Kuwałek, P.; Wiczyński, G. Problem of Total Harmonic Distortion Measurement Performed by Smart Energy. Meters Meas. Sci. Rev. 2022, 22, 1–10. [Google Scholar] [CrossRef]
- Kuwałek, P. Decomposition by Approximation with Pulse Waves Allowing Further Research on Sources of Voltage Fluctuations. IEEE Trans. Ind. Electron. 2024, 71, 5263–5273. [Google Scholar] [CrossRef]
- Liu, H.; Wang, X.; Zhang, W.; Zhang, Z.; Li, Y.-F. Infrared head pose estimation with multi-scales feature fusion on the IRHP database for human attention recognition. Neurocomputing 2020, 411, 510–520. [Google Scholar] [CrossRef]
- Liu, H.; Liu, T.; Chen, Y.; Zhang, Z.; Li, Y. EHPE: Skeleton Cues-based Gaussian Coordinate Encoding for Efficient Human Pose Estimation. IEEE Trans. Multimed. 2022, 1–10. [Google Scholar] [CrossRef]
- Liu, T.; Liu, H.; Yang, B.; Zhang, Z. LDCNet: Limb Direction Cues-aware Network for Flexible Human Pose Estimation in Industrial Behavioral Biometrics Systems. IEEE Trans. Ind. Inf. 2023, 1–11. [Google Scholar] [CrossRef]
Disclaimer/Publisher’s Note: The statements, opinions and data contained in all publications are solely those of the individual author(s) and contributor(s) and not of MDPI and/or the editor(s). MDPI and/or the editor(s) disclaim responsibility for any injury to people or property resulting from any ideas, methods, instructions or products referred to in the content. |
© 2024 by the authors. Licensee MDPI, Basel, Switzerland. This article is an open access article distributed under the terms and conditions of the Creative Commons Attribution (CC BY) license (https://creativecommons.org/licenses/by/4.0/).

