Article

Numerical Investigations of the Cooling Performance of an R410A Closed-Loop Spray Cooling System

State Key Laboratory of Multiphase Flow in Power Engineering, Xi’an Jiaotong University, Xi’an 710049, China
*
Author to whom correspondence should be addressed.
Energies 2024, 17(2), 339; https://doi.org/10.3390/en17020339
Submission received: 29 November 2023 / Revised: 23 December 2023 / Accepted: 8 January 2024 / Published: 9 January 2024
(This article belongs to the Section J: Thermal Management)

Abstract

:
To investigate the spray cooling characteristics and the impact of spray parameters such as chamber pressure, spray height, and spray tilt angle on heat transfer efficiency, a mathematical model based on the Eulerian–Lagrangian frame was established for an R410A closed-loop spray cooling system. The results revealed that the spray pattern is conical, with the center velocity significantly higher than the edge velocity. The temperature distribution of the cooling surface and liquid film height both exhibit a “W” shape, and the surface temperature is lower where the liquid film is thin. There is an optimal liquid film height of approximately 5 μm, at which the cooling surface temperature is the lowest. The surface temperature increases with an increase in the spray chamber pressure. Considering average cooling surface temperature, the optimal tilt angle is 40° with an average surface temperature of 330.1 K. When considering wall temperature and wall heat transfer coefficient uniformity, however, the optimal tilt angle is 10°, leading to the average surface temperature of 332.6 K. When increasing the optimal spray height to 70 mm, the average surface temperature is 313.4 K.

1. Introduction

Currently, more and more compact size results in a high power density in electronic devices. Ten years ago, the heat flux density of electronic chips had reached up to 100 W/cm2 [1,2], and it is expected to achieve over 1000 W/cm2 [3,4,5] in the near future. Thermal management technologies like micro-channels, heat pipes, and spray cooling have great potential, among which spray cooling technology stands out due to its high heat dissipation capacity, low surface temperatures, system stability, and cost-effectiveness, attracting widespread attention from researchers [6].
Up to now, different cooling agents have been tested for spray cooling including distilled water, anhydrous ethanol, liquid ammonia, and various refrigerants like FC-77, R134a, R22, R32, R410A, etc. Water has a high latent heat of vaporization (2489.65 kJ/kg) [7], but its boiling point at atmospheric pressure is 100 °C, which is higher than the fault temperature of electronic chips such as CPU (75 °C). The surface tension of ethanol is small, which leads to a larger spreading area of droplets, so as to obtain higher heat transfer performance [8]. However, anhydrous ethanol is flammable, yielding significant safety concerns in experiments. Liquid ammonia can achieve a high critical heat flux (750 W/cm2) because of its low boiling point (−33 °C) and high latent heat of vaporization (1200 kJ/kg) [9], but its toxic and flammable characteristics hinder its implementation. Refrigerants like FC-77, R134a, R22, and R32 with boiling points of 97 °C, −26.1 °C, −40.8 °C, and −51.7 °C show better heat dissipation capacity, but FC-77 has the drawback of high wall superheat, R134a is susceptible to moisture absorption [10], R22 is destructive to the ozone layer (ODP:0.055) [11], and R32 is prone to flammability [12]. In comparison, R410A offers advantages such as high latent heat of vaporization (256.7 kJ/kg), low boiling point (−51.4 °C), non-toxicity, non-flammability, and ODP of 0 [13], which make it a promising candidate for heat dissipation in relation to electric chips.
Some researchers have conducted experimental research on spray cooling with R410A, seeking its optimal heat transfer performance through the investigation of experimental parameters. Zhou et al. [14] constructed a closed spray cooling experimental system using R410A as the cooling medium. Together with the tetrahedral structure to enhance heat transfer, a critical heat flux (CHF) of 411.2 W/cm2 was achieved. Wang et al. [15] increased the CHF to as high as 522.1 W/cm2 with a working temperature < 55.6 °C, which is enhanced by 73.4% on surfaces with fins of 3 × 0.5 mm. Longo et al. [16] used R410A as the cooling medium and conducted a comparative analysis of the condensation process between microfin tubes and smooth tubes, and it was found that the heat transfer capacity of the microfin tube was 3.5–3.6 times that of a smooth tube with a mass velocity of 200 kg/(m2·s). However, the parameters such as liquid film velocity and liquid film height cannot be quantitatively analyzed only through experiments.
Compared to experiments, numerical simulations can reveal the cooling mechanism of sprays with a low cost [17]. Cai et al. [18] established a mathematical model of the spray cooling system from the single-phase region to nucleate boiling via water and ethanol-water mixed cooling media. They found that the liquid film in the nucleate boiling region is thinner than in the single-phase region, and the heat transfer coefficient decreases with increasing spray height and increases with increasing spray pressure. Tian et al. [19] used a one-dimensional homogeneous flow model to simulate refrigerant gas–liquid two-phase flow inside the nozzle, and a discrete phase model (DPM) to simulate spray atomization, droplet evaporation, and fragmentation. They found that in the high-concentration spray region near the nozzle (Z ≤ 50 mm), the droplet temperature exhibited a “W” distribution radially. Away from the nozzle region (Z > 70 mm), the “W” distribution of droplet temperature completely disappeared, and a relatively flat low-temperature zone appeared. However, R410A is rarely used as the refrigerant to analyze the heat transfer performance of spray cooling in the current numerical calculation of spray cooling.
Besides the limited experimental research on closed-loop spray cooling systems employing R410A [20], theoretical research is far behind, which necessitates the investigation of the relationship between the cooling preformation and spray characteristics. At present, there are few studies on the systematic quantitative description of liquid film velocity and height, and the cooling surface temperature distribution. In this sense, the numerical simulation for an R410A closed-loop spray cooling system was conducted, allowing for the calculation of phenomena that cannot be directly observed in spray cooling experiments, such as liquid film velocity and height, and the cooling surface temperature distribution as well. Through the investigations of the impact of different spray parameters on heat transfer performance, this study will provide guidance for future applications of spray cooling.

2. Physical and Mathematical Model
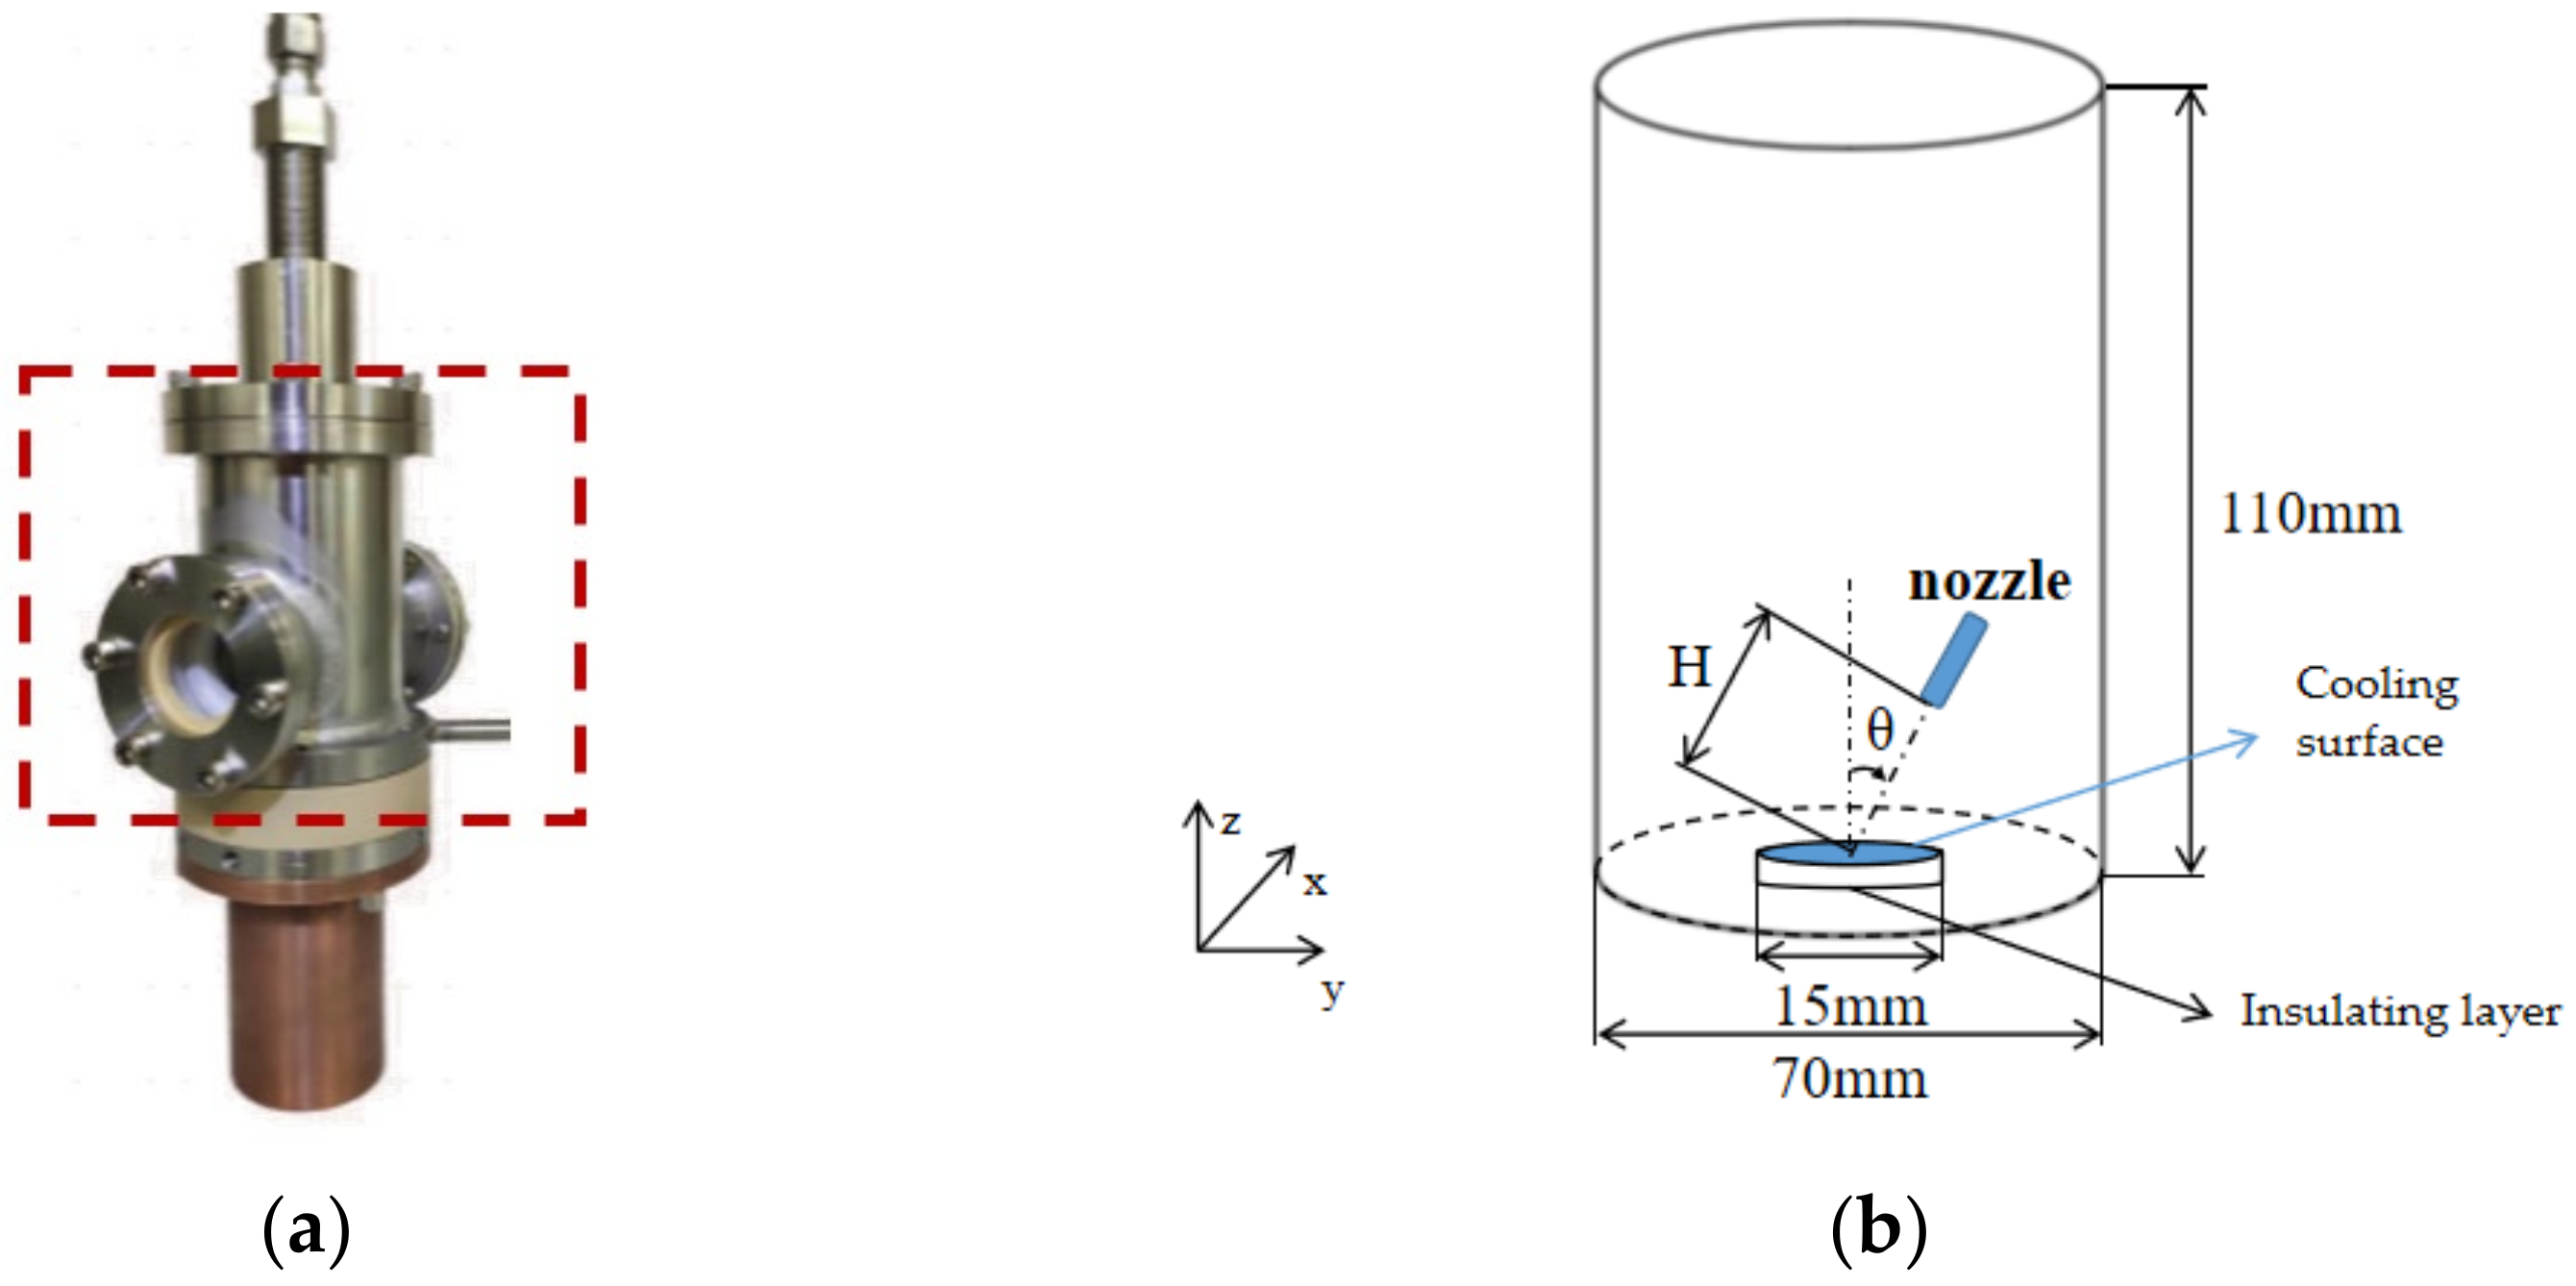
2.1. Physical Model

To simulate the experimental condition of the R410A closed spray cooling system [13], the spray chamber shown in Figure 1a is simplified into a cylindrical computation domain with a diameter of 70 mm and a height of 110 mm (Figure 1b). At the bottom of the spray chamber, there is a protrusion along the z-axis, with a height of 1 mm and a diameter of 15 mm, made of polyether ether ketone (PEEK). This protrusion serves to reduce liquid submersion and act as thermal insulation. A circular heating surface with a diameter of 15 mm is placed in the middle of the protrusion, represented in blue in Figure 1b. A solid conical nozzle is employed to investigate the influence of spray inclination angle θ between the nozzle and the z-axis on heat transfer performance, with a constant distance H (25 mm) from the nozzle outlet to the center of the cooling surface.

2.2. Mathematical Model

The spray cooling process is extremely complex, involving interactions between droplets with the circumambient air and liquid film on the cooling surface. In this study, a Eulerian–Lagrangian approach is employed to establish a mathematical model, with liquid R410A as the cooling medium. The model utilizes a discrete phase model for the liquid phase and a continuous phase model for the spray environment, which consists of gaseous R410A.

2.2.1. Continuous Phase Model

For the liquid film and gas in the computational domain, a continuous phase model is constructed, including equations for mass, energy, momentum conservations, as well as component transport. These equations are represented by Equations (1)–(4) [21] as follows:
(1) ρ t + div ρ u = S m (2) t ( ρ E ) + d i v [ u ( ρ E + P ) ] = d i v ( λ g r a d T ) + S E (3) ( ρ u ) t + · ( ρ u u ) = p + · [ μ ( u + u T ) ] + ρ g + u (4) ρ Y i t + d i v ρ u Y i = d i v J i + S i
where ρ is the density of the continuous phase fluid, t is time, u is the velocity of the continuous phase fluid, T is thermodynamic temperature, p is pressure, g is gravitational acceleration, λ is fluid thermal conductivity, μ is viscosity, S m is the mass of the continuous phase gas due to the evaporation of droplets, E is the internal energy of the continuous phase fluid, and u is the change in continuous momentum due to droplets.
The Realizable k-ε turbulence model is selected for its capability to provide more accurate predictions of the spreading rate of plane and round jets compared to the Standard k-ε model, as shown in Equations (5) and (6) [22]:
(5) t ( ρ k ) + x j ρ k u j = x j μ + μ t σ k k x j + G k + G b ρ ε Y M (6) t ( ρ ε ) + x j ρ ε u j = x j μ + μ t σ ε ε x j + ρ C 1 S ε ρ C 2 ε 2 k + v ε + C 1 ε ε k C 3 ε G b
where μ t is the turbulent viscosity, G k is the turbulent kinetic energy generated by mean velocity gradients, G b is the turbulent kinetic energy generated by buoyancy forces, in numerical calculations, C 2 ,   C 1 ε ,   C 3 ε are model constants, and their values are typically set to 1.9, 1.44, and 1.0 [23], respectively.

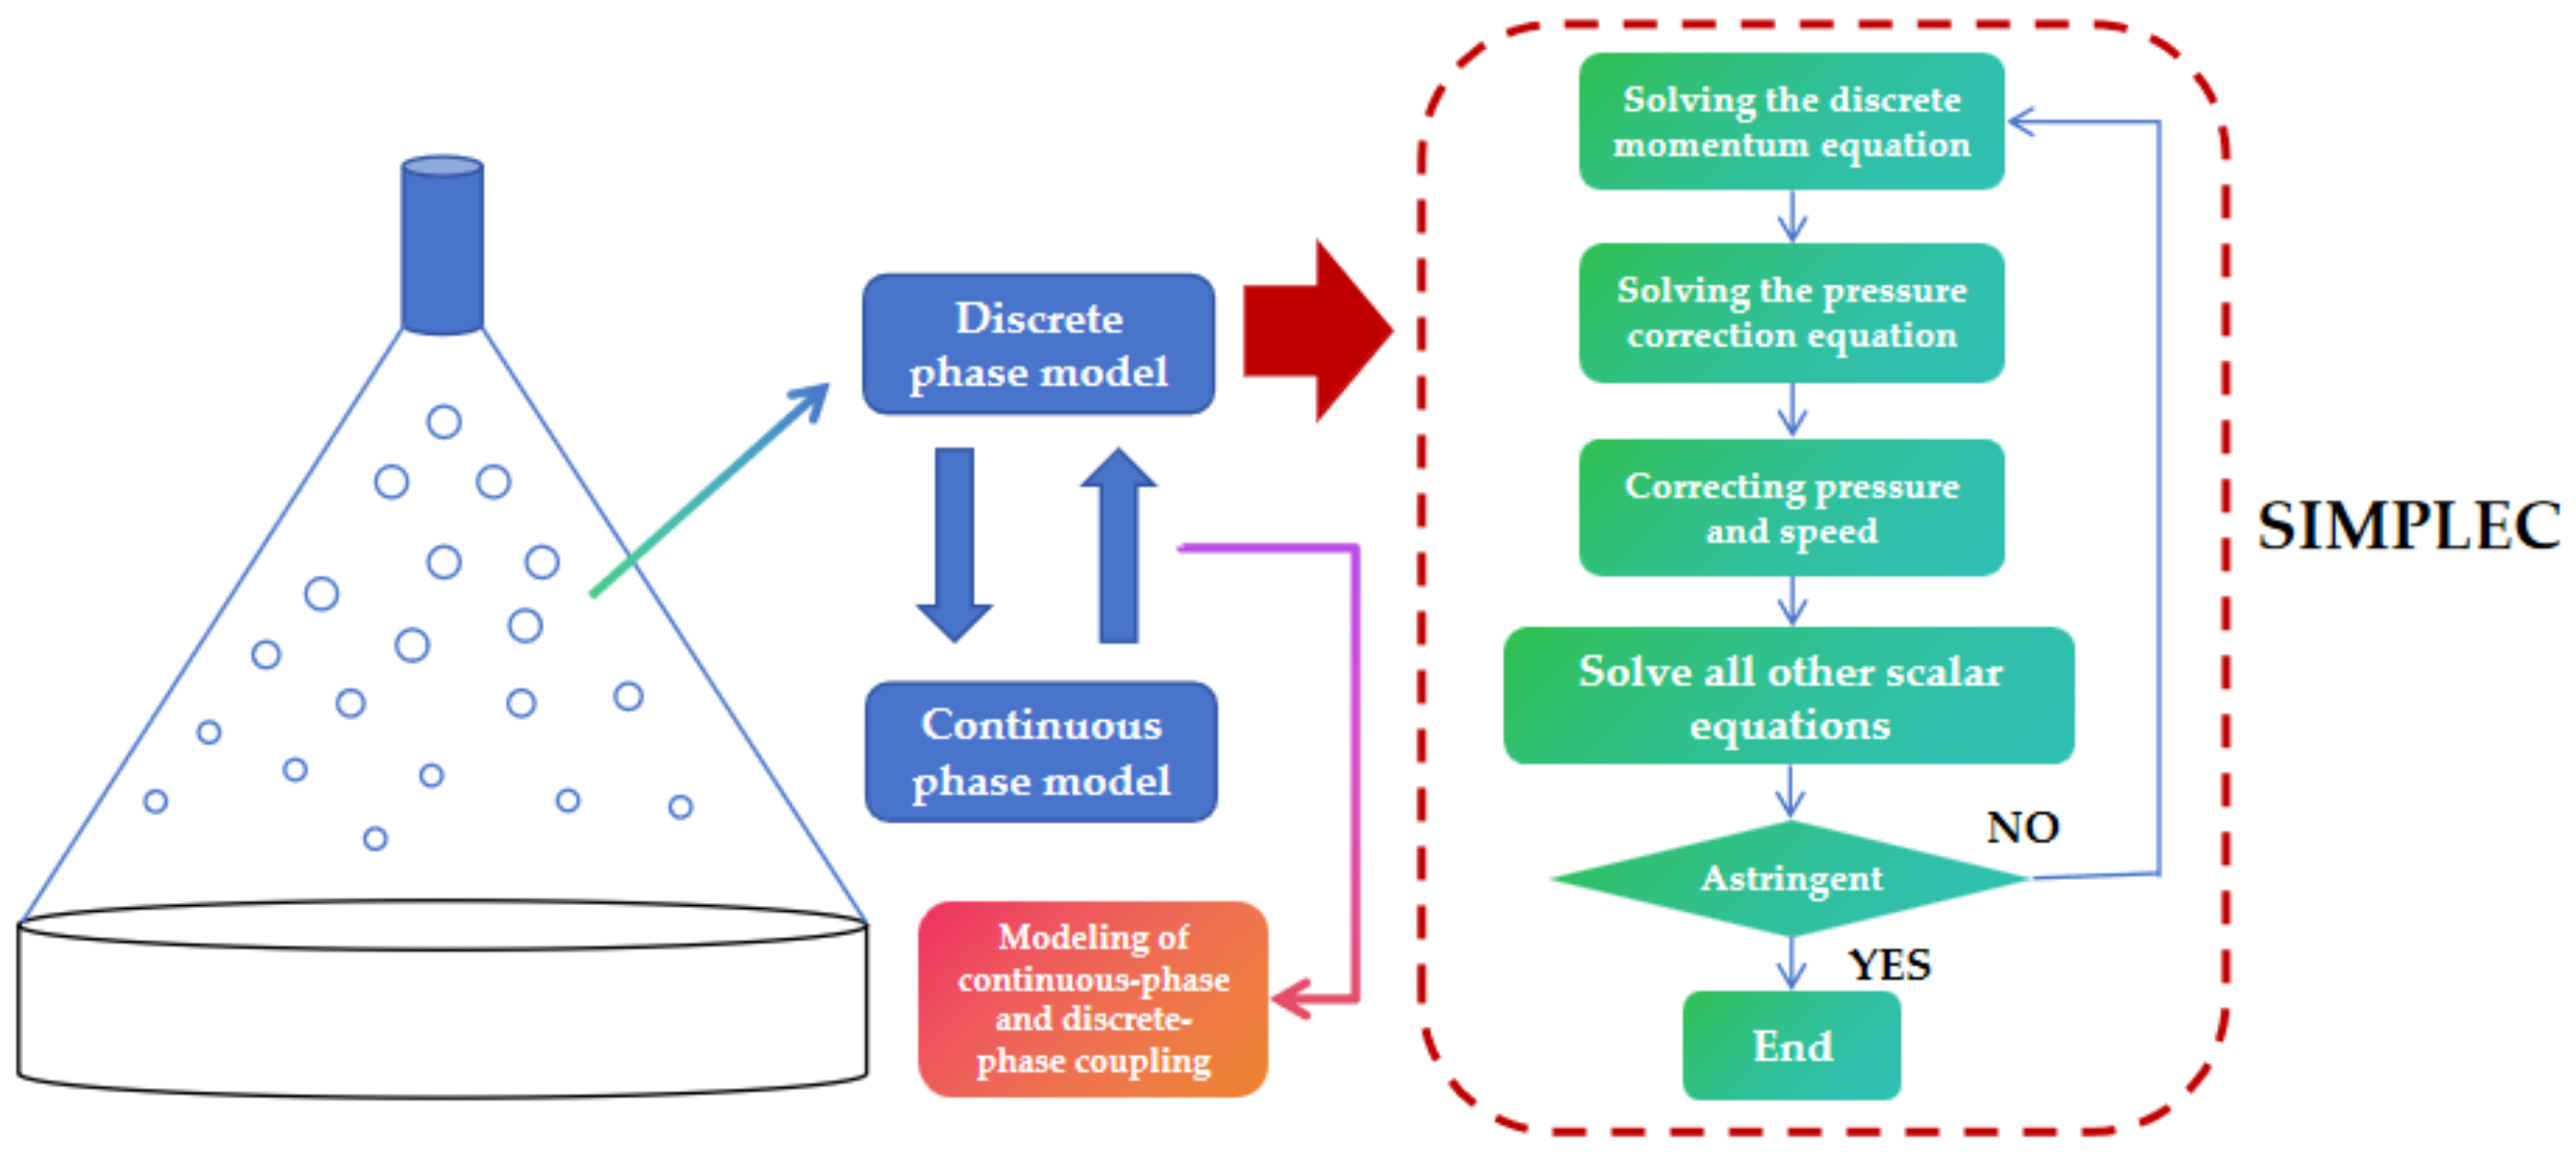
2.2.2. Discrete Phase Model

Cryogen droplets are subjected to various forces, such as drag force, gravity, and lift, during their motion within a fluid. In the discrete phase model, one can employ Newton’s second law to establish the motion equation of droplets in a Lagrangian frame. Since the environmental temperature changes little and the lateral velocity gradient is small for droplets of micro size, the thermophoretic force, Brownian motion, and Saffman lift can be neglected. Only drag force is taken into account, as shown in Equations (7)–(11):
(7) d u d d t = ( u u d ) τ r + g ( ρ d ρ ) ρ d (8) τ r = ρ d d d 2 μ 4 R e C d (9) C d = C d , s ( 1 + 2.632 y ) (10) C d , s = 0.424 24 R e 1 + 1 6 R e 2 / 3     R e > 1000     R e 1000 (11) R e = ρ d d | u d u | μ
where u d is the velocity vector of the droplet, ρ d is the droplet density, ( u u d ) / τ r is the drag force per unit mass, d d is the droplet diameter, C d is the drag coefficient for the droplet, C d , s is the drag coefficient for a spherical droplet, R e is the relative Reynolds number, y is the shape correction factor for the droplet: when the droplet is disk-shaped, y = 1, and when the droplet is spherical, y = 0.

2.2.3. Coupling between the Continuous and Discrete Phase Models

When calculating the trajectories of discrete-phase particles, a two-way coupling approach is used to consider the interaction between the continuous phase and the discrete phase. The exchange of momentum, heat, and mass between the continuous phase and the discrete phase is described by Equations (12)–(14):
(12) F = 18 μ C D R e ρ p d p 2 24 u p u Δ t (13) Q = m ˙ p , 0 m p , 0 m p in   m p out   H lat   ref   m p out   T ref   T p out   c p p d T + m p in   T ref   T p in     c p p d T (14) M = Δ m p m p , 0 m ˙ p , 0
where Δ t is the time step, m ˙ p , 0 is the initial mass flow rate of liquid droplets, m p , 0 is the initial mass of the droplet, m p in   is the mass of the droplet as it enters the continuous phase grid, m p out   is the mass of the droplet as it leaves the continuous phase grid, c p p is the specific heat of the particle, T p in   is the temperature of the liquid droplet upon entering the continuous phase grid, T p out   is the temperature of the liquid droplet upon leaving the continuous phase grid, T ref   is the reference temperature for enthalpy (300 K), and H lat   ref   is the latent heat of vaporization under reference conditions.

2.2.4. Thermal Properties and Boundary Conditions
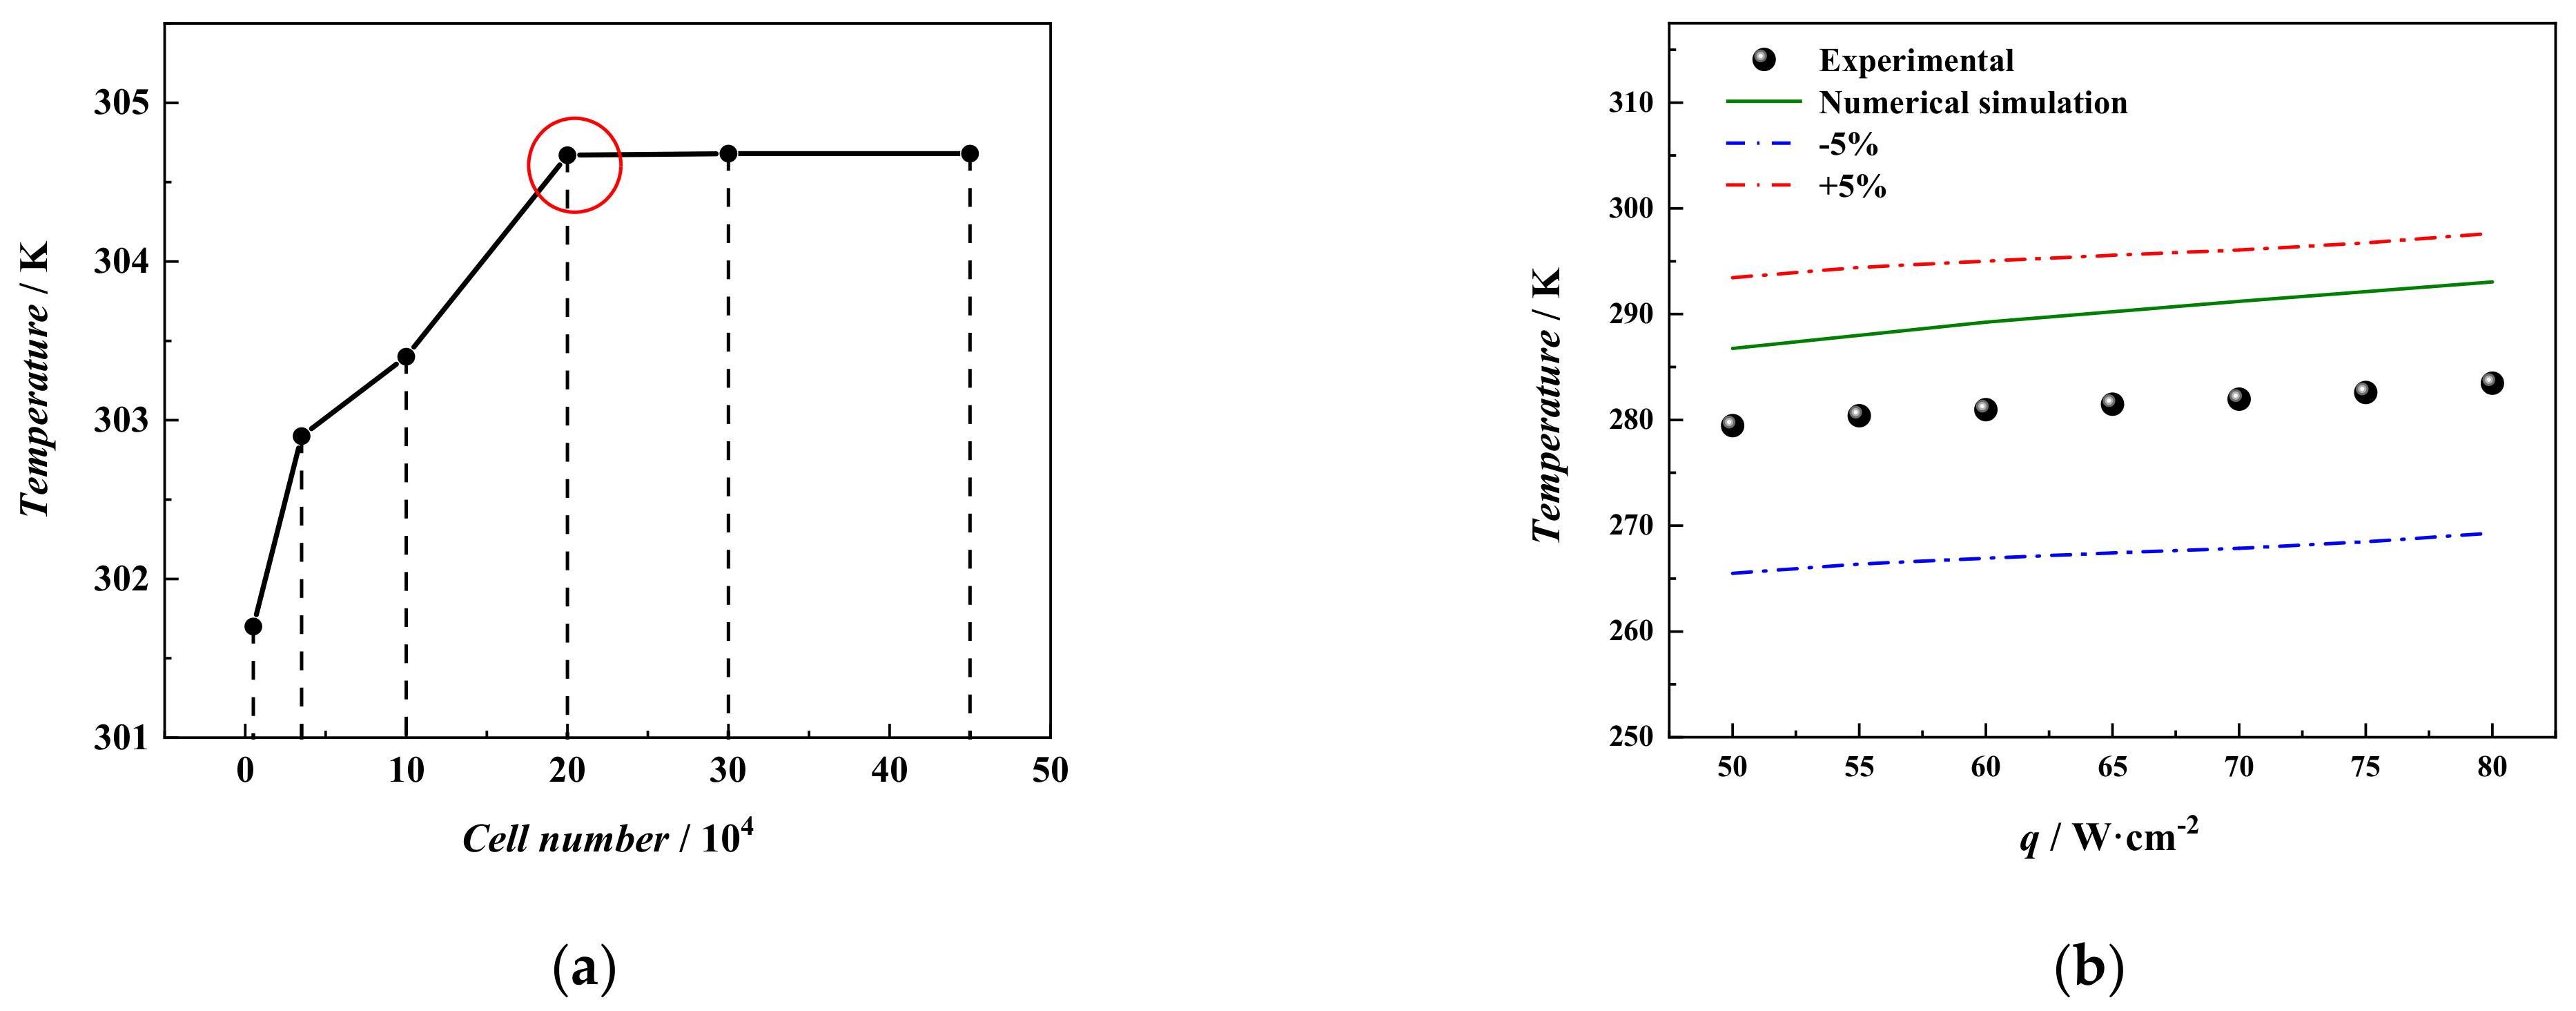
The thermal properties of the R410A coolant were obtained using the REFPROP software (9.1), as shown in Table 1:
As the flowchart shows in Figure 2, firstly the continuous phase is solved and iterates to stability; then, the computation of the discrete phase model starts from the nozzle exit, to update the velocity, temperature, and position. The second-order upwind scheme and the second-order implicit discretization scheme are, respectively, used for the spatial and temporal discretization of the momentum, turbulent kinetic energy, and turbulent dissipation rate equations, and the Simplec algorithm is employed for the pressure–velocity coupling.
According to the design of the R410A closed spray cooling experimental system, the bottom of the spray chamber serves as the pressure outlet. As mentioned in Section 2.1, the constant heat flux wall condition is implemented on the cooling surface, where the wall film model [25] is applied for droplets forming a liquid film. The other surfaces of the spray chamber are set as escape boundaries, meaning that droplets reaching these surfaces will leave the wall and are no longer considered in the computation. At the beginning of the simulation, the spray chamber is filled with R410A gas at an ambient temperature of 300 K.

3. Model Validation

This study employs a polyhedral meshing technique in the Fluent (2022R1) meshing. To ensure more accurate results, three boundary layers are set, as shown in Figure 3.
The distribution of grid mass is shown in Figure 4. The minimum mass of grid cell is 0.29, and the maximum mass of grid cell is 0.99.
The grid independent test is conducted by using different cell numbers: 5000, 35,000, 100,000, 200,000, 300,000, and 450,000 grids. As shown in Figure 5a, when the cell number exceeds 200,000, there is minimal change in the temperature and liquid film height on the cooling surface. Therefore, 200,000 cells are selected for subsequent numerical simulations.
Based on the experimental data of the R410A closed spray cooling system in our group, the following simulations were conducted with a spray height of 25 mm, spray inlet pressure of 2.05 MPa, chamber pressure of 0.54 MPa, spray mass flow rate of 6.7 g/s, cone angle of 33.4°, and a condensation temperature of the cooling agent of 27 °C. The results of the average temperature of the cooling surface at different heat flux densities are compared with the experimental results [14], as shown in Figure 5b. From the figure, it can be seen that the simulated values have the same trend as the experimental results, and the error is within ±5% of the experimental values, which verifies the validity of the model.

4. Results and Discussion

4.1. Cooling Characteristics

In this study, numerical simulations were initially conducted with the following experimental parameters to investigate the characteristics of closed spray cooling: spray height of 25 mm, nozzle outlet pressure of 1.8 MPa, spray chamber pressure of 0.8 MPa, heat flux density of 100 W/cm2, coolant mass flow rate of 4.9 g/s, coolant temperature of 300 K, and a spray angle of 33.4°.

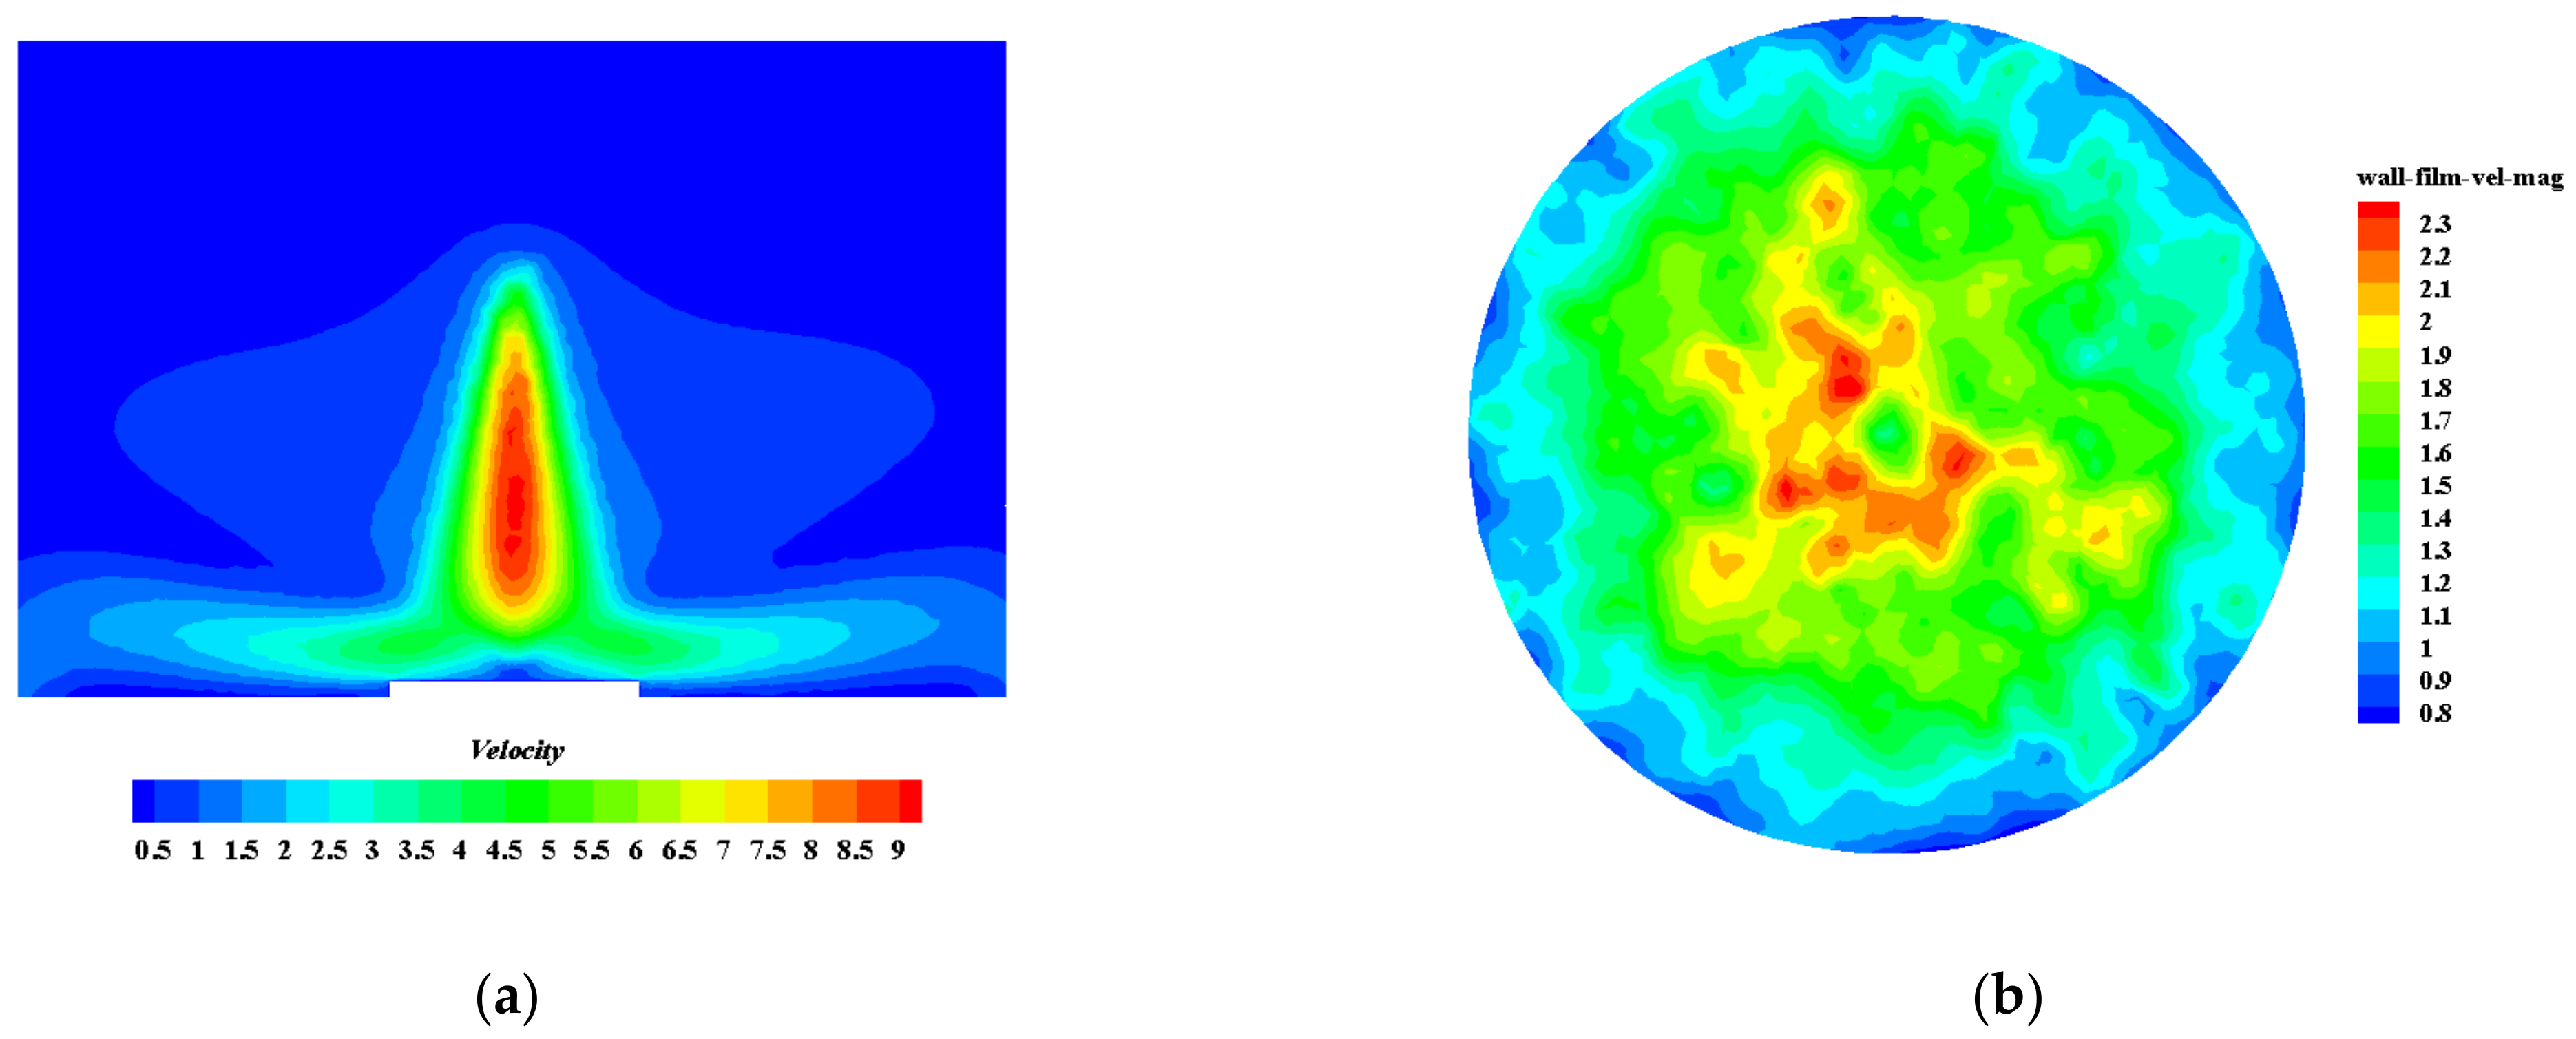
4.1.1. Spray Morphology and Velocity

From Figure 6a, it can be observed that the overall spray morphology is conical, and its velocity distribution shows that the center velocity of the conical spray is significantly higher than its periphery. This is because when the spray enters the chamber from the nozzle in the form of fine droplets, it undergoes flash evaporation due to heat absorption, resulting in a lower number of droplets at the periphery of the conical spray, which leads to internal contraction of the spray. Due to its high velocity, there is almost no radial migration, resulting in a gradual decrease in spray velocity from the center to the periphery. At the bottom end of the spray, on the cooling surface, the overall spray velocity is lower than at the top of the cone, and there is a stagnation point at the center of the cooling surface.
From Figure 6b, it is evident that there is a velocity stagnation point at the center of the cooling surface for the liquid film (highlighted in green at the center). Moving radially from the stagnation point to the outer edge of the cooling surface, the liquid film velocity gradually decreases. Analyzing Figure 7a and Figure 8a in conjunction, it is observed that in regions with higher liquid film velocity, the film thickness is smaller, leading to lower temperatures on the cooling surface. Conversely, in areas with lower liquid film velocity, the film thickness is larger, resulting in higher temperatures on the cooling surface. This is attributed to the fact that in regions with faster liquid film velocity, there is a larger flow rate, causing the cooling medium to accumulate radially outward, leading to a smaller liquid film thickness in areas with higher velocity. Additionally, regions with higher liquid film velocity exhibit enhanced convective heat transfer, resulting in better heat exchange efficiency and lower temperatures on the cooling surface.

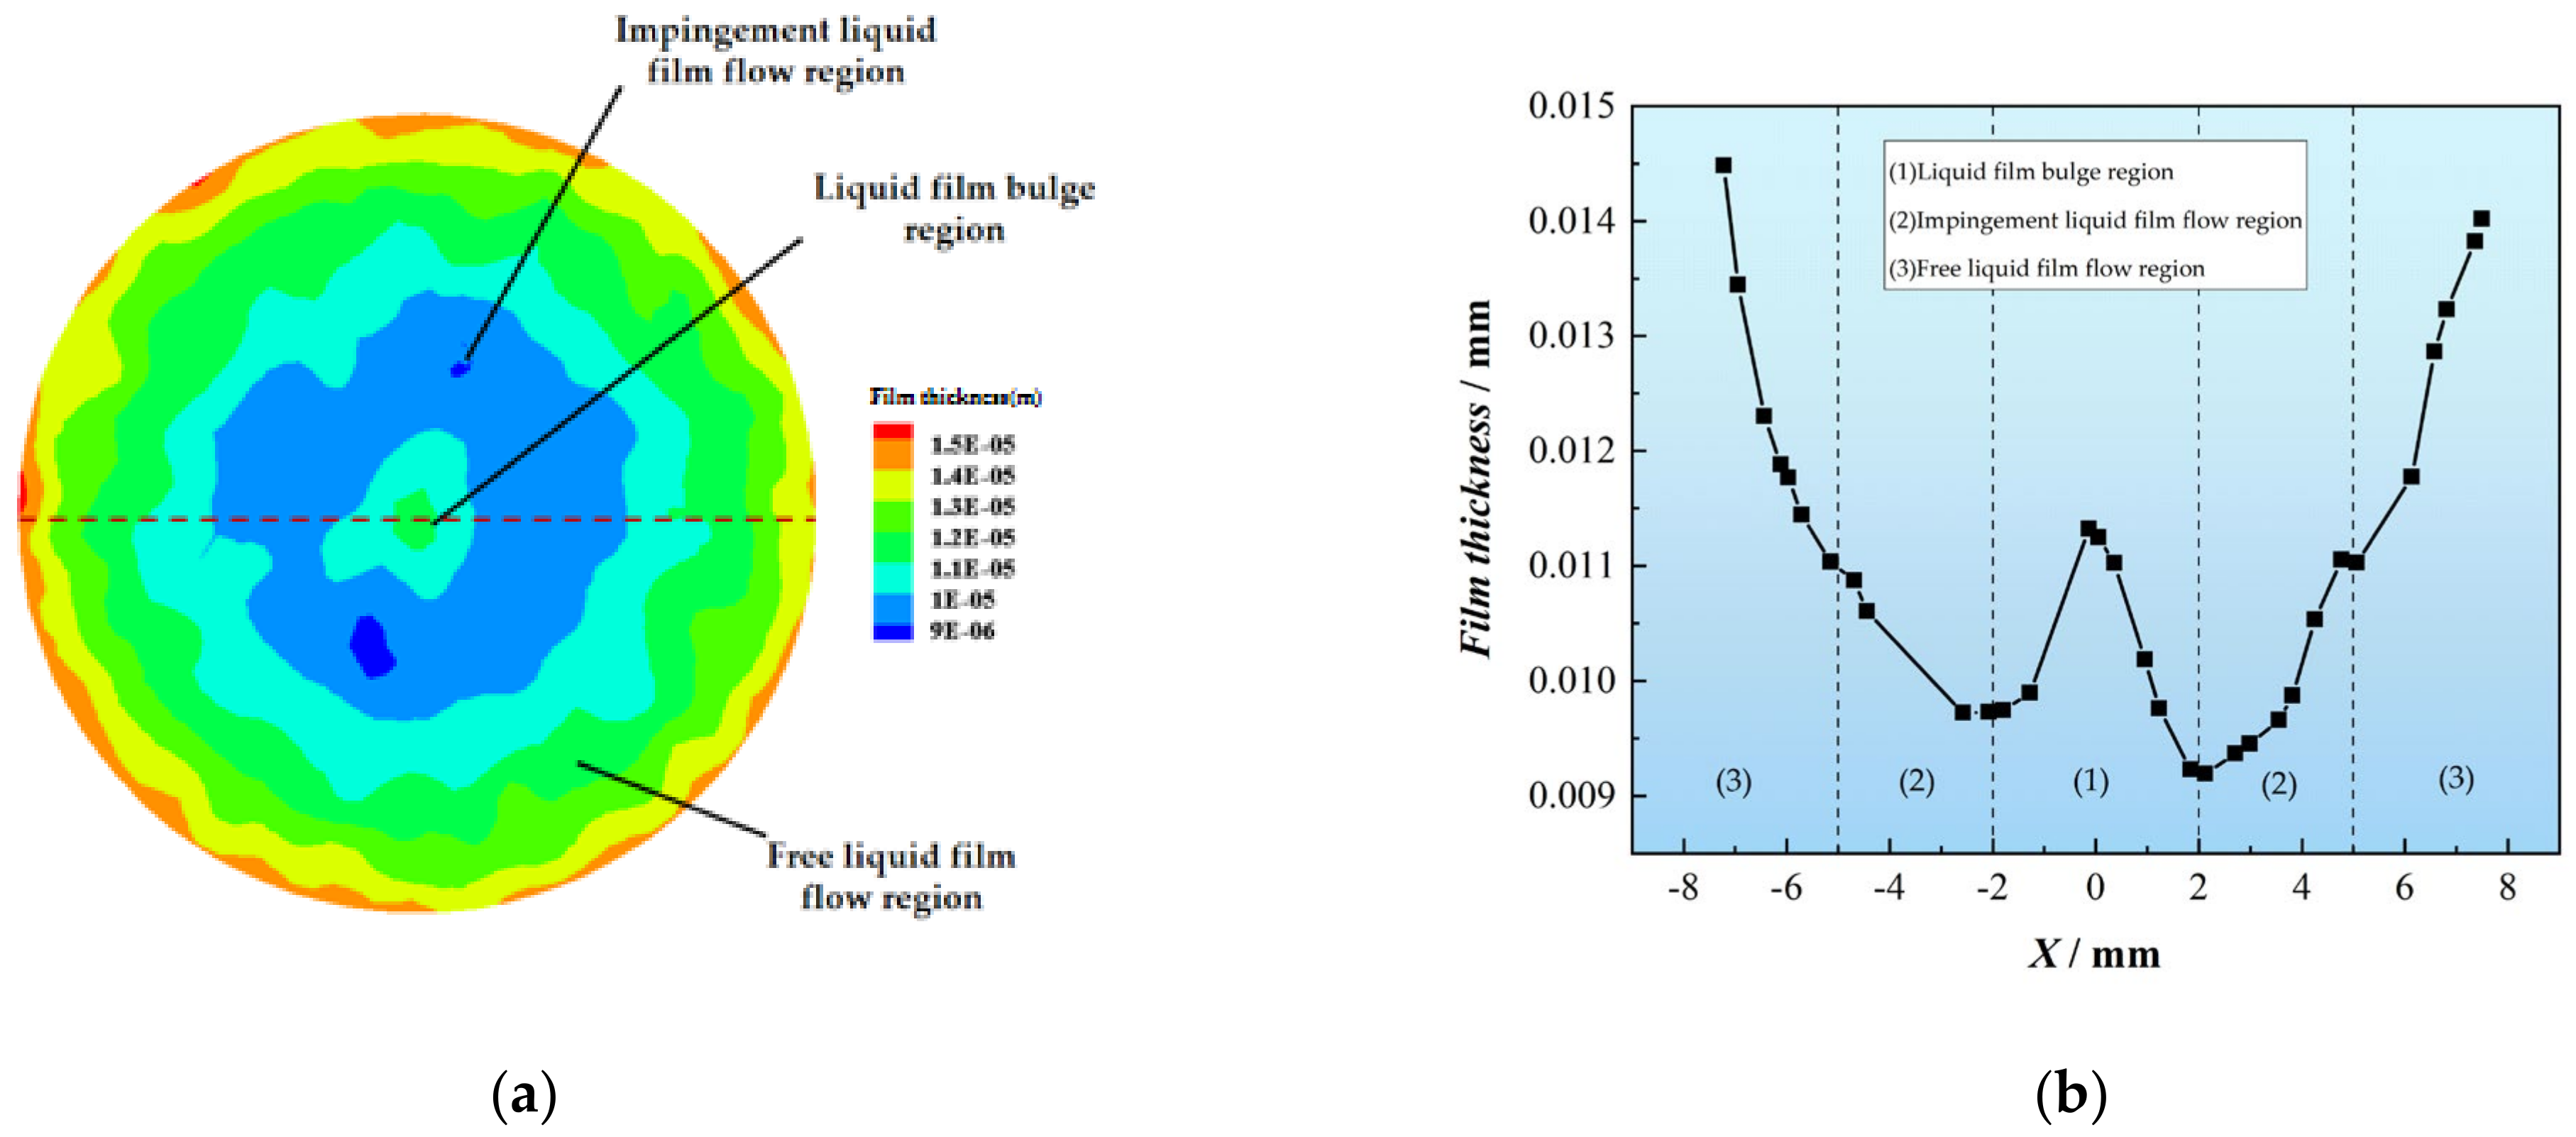
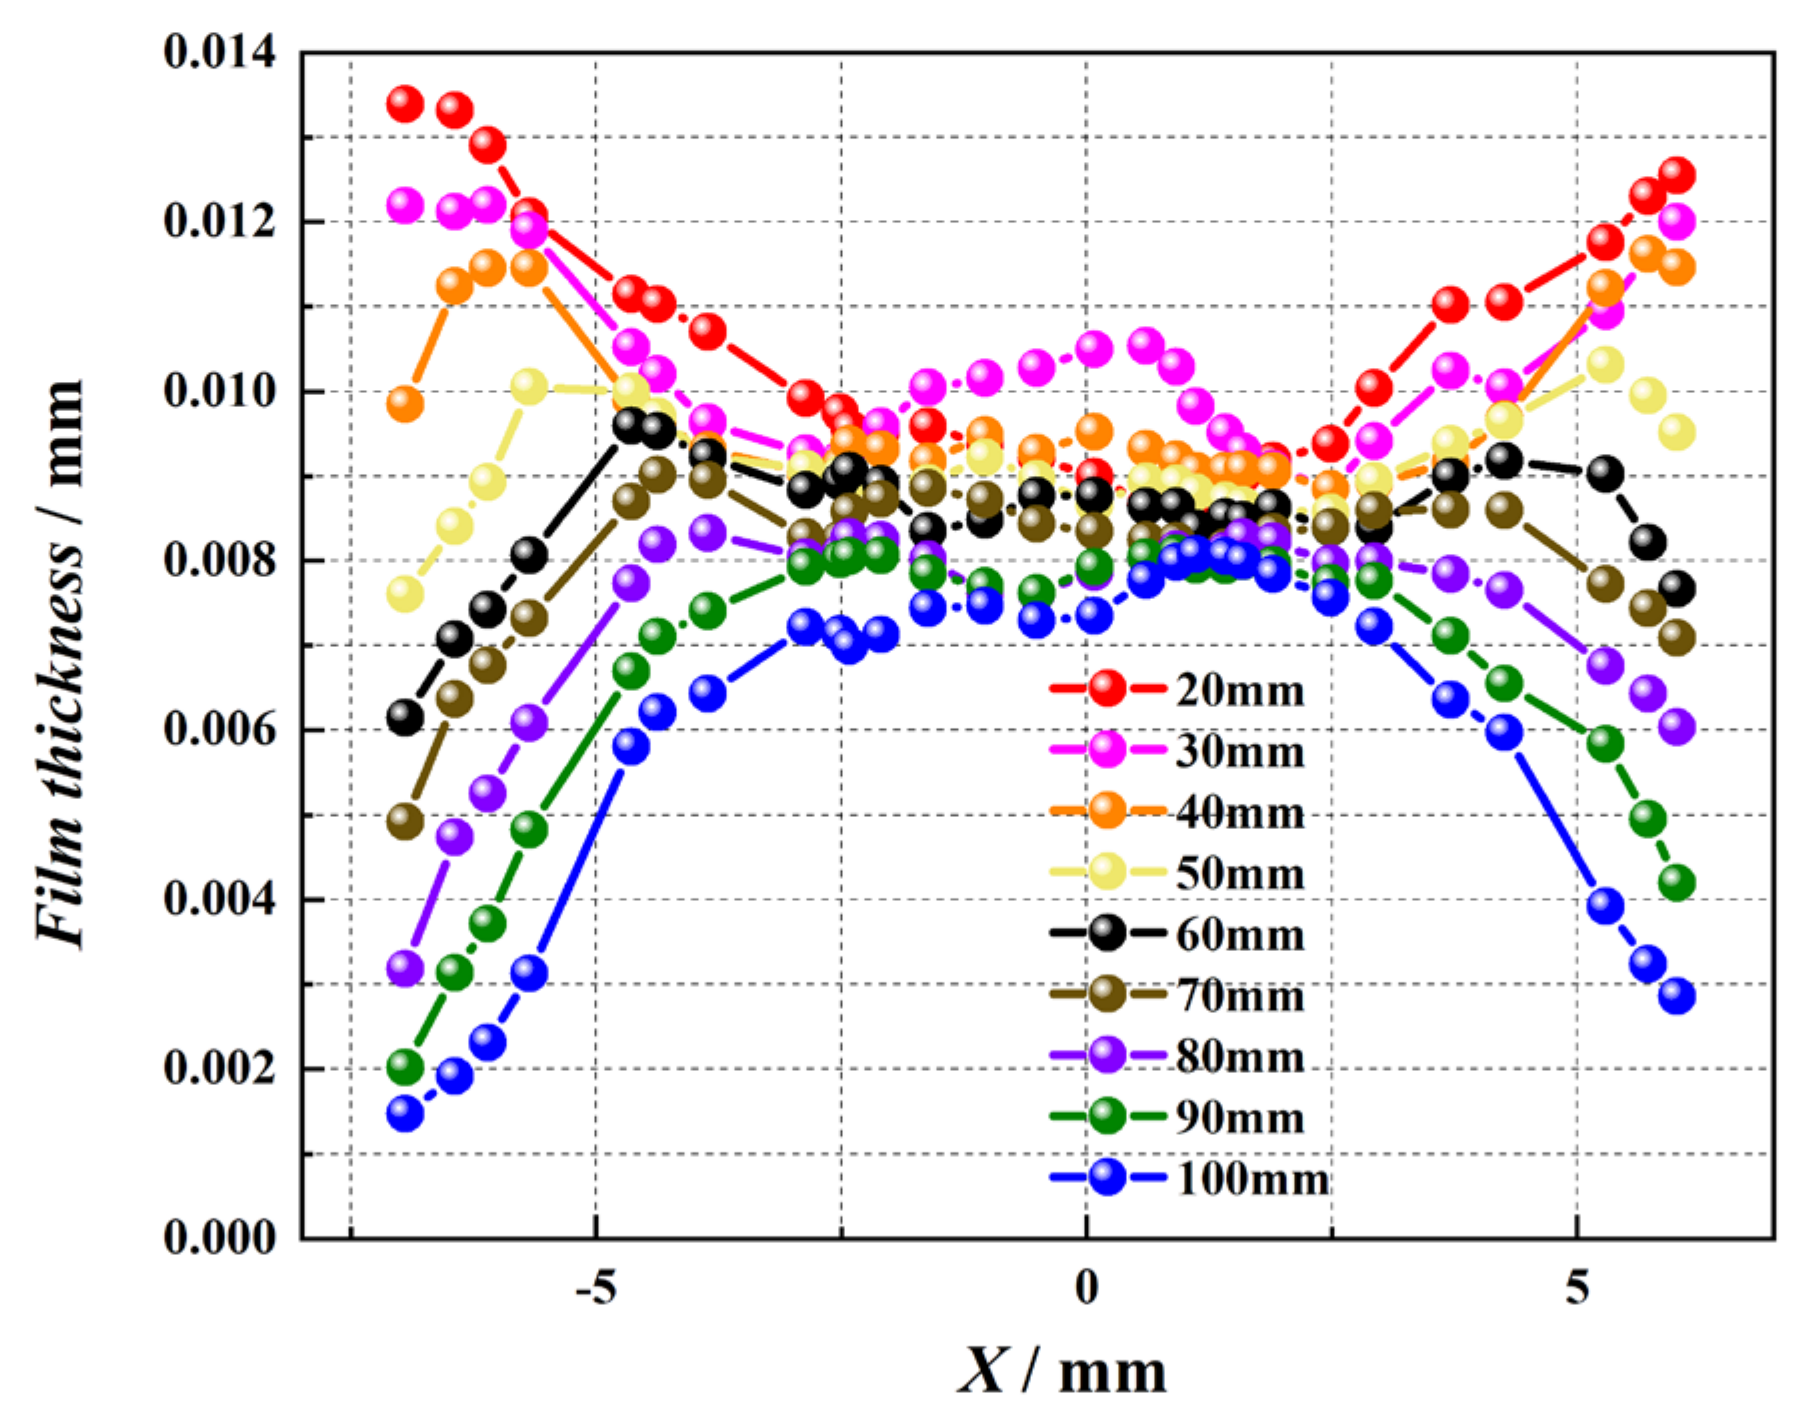
4.1.2. The Distribution of Liquid Film Height

Figure 7a,b provide the contour plot and radial distribution of liquid film height on the cooling surface (dashed line in Figure 7a). From these figures, the liquid film height exhibits a “W” shape, wherein at the center of the cooling surface, the presence of a velocity stagnation point leads to a relatively thicker liquid film (highlighted in green at the center). Moving radially from the stagnation point to the outer edge of the cooling surface, the liquid film thickness gradually increases. As we can see from Figure 7a, the liquid film formed by droplets on the cooling surface can be divided into the liquid film bulge region (green at the circle’s center), the impingement liquid film flow region (blue), and the free liquid film flow region (green, yellow and red), which is consistent with the observation from reference [26]. When droplets reach the wall, the velocity in the direction of vertical heat source becomes zero, and droplets accumulate in the liquid film bulge region. The liquid film formed by the droplet flows around the wall, forming the impingement liquid film flow region in the spray area. As the flow progresses, the liquid film outside the spray area decreases in velocity due to the disappearance of the pressure gradient, and the liquid film tends to become thicker. This part becomes the free liquid film flow region.

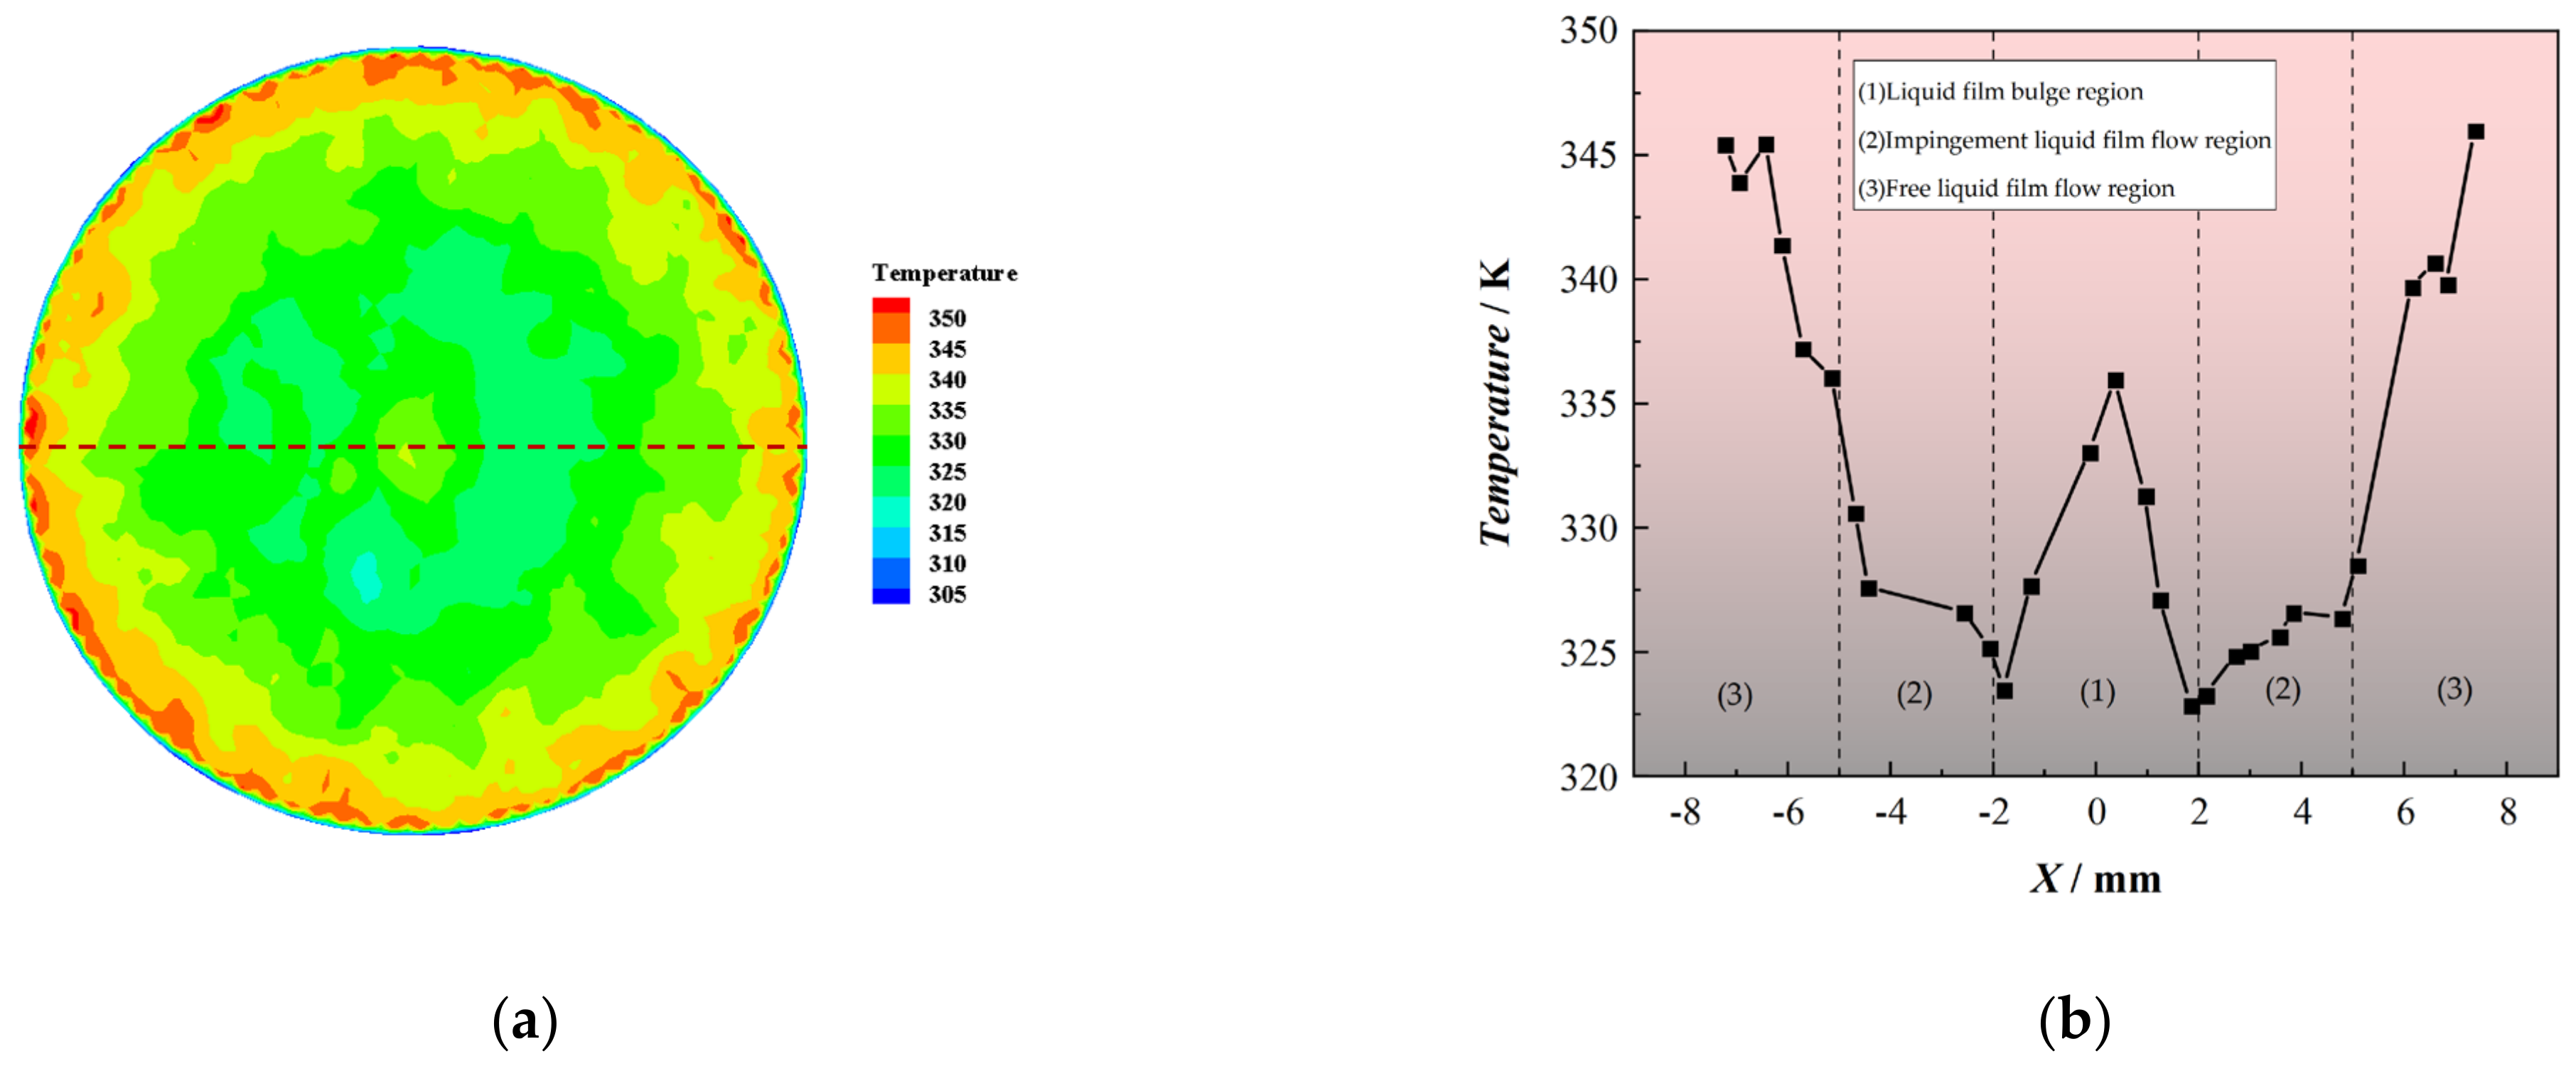
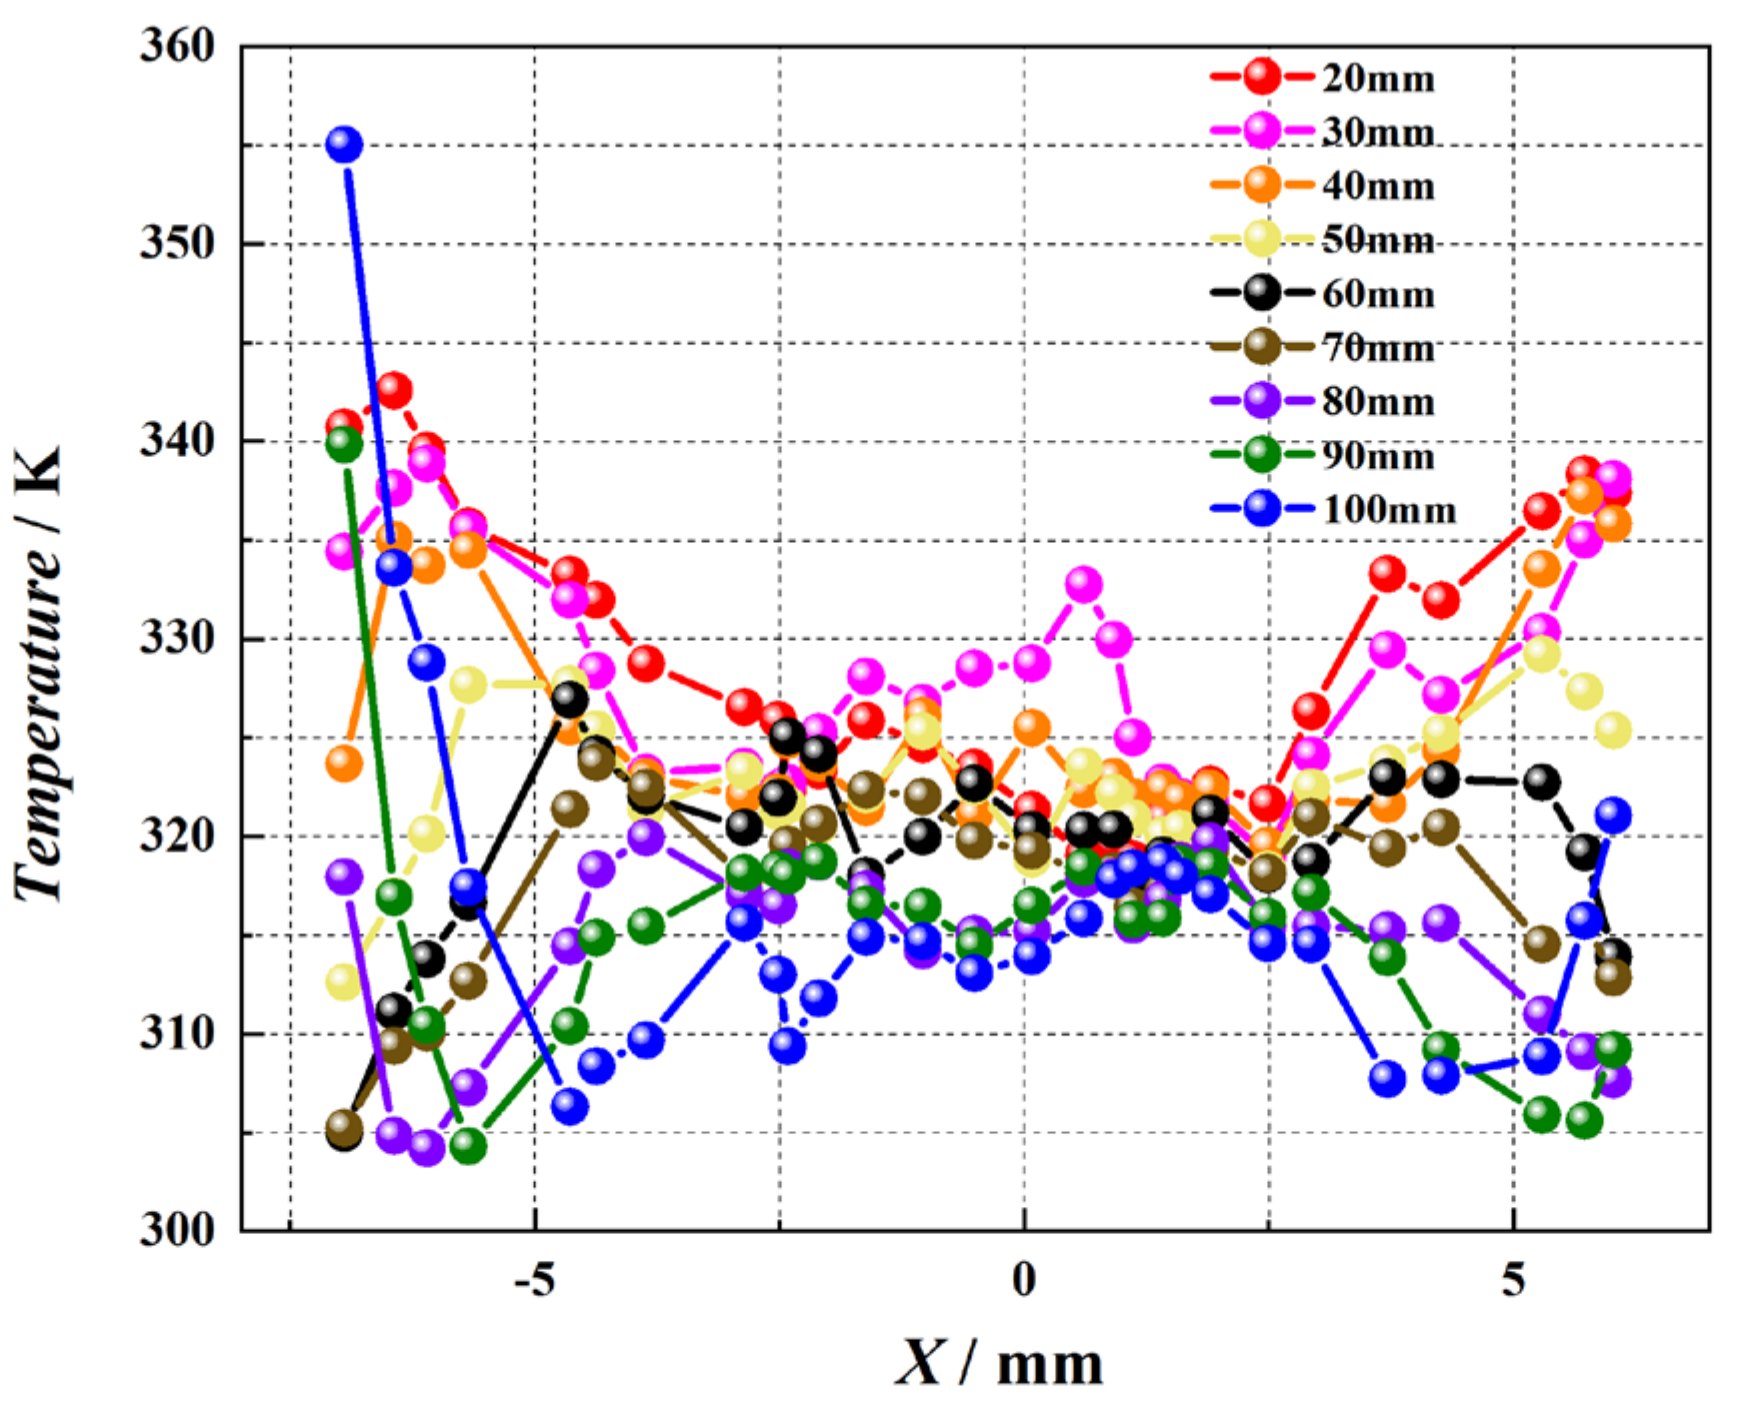
4.1.3. Temperature Distribution on the Cooling Surface

Figure 8a,b provide the temperature distribution contour and radial temperature distribution on the cooling surface (dashed line in Figure 8a). Similar to Figure 7b, the radial temperature distribution on the cooling surface also exhibits a “W” shape. According to the mechanism of spray cooling, the single-phase region is primarily associated with liquid film evaporation and forced convection heat transfer, while the two-phase region is mainly linked to nucleate boiling heat transfer. Through comparing Figure 6b, Figure 7a, and Figure 8a, it is evident that areas with higher liquid film velocity and thinner liquid film exhibit faster liquid film evaporation and lower surface temperatures. This suggests that in R410A closed-loop spray cooling, the dominant heat transfer mechanisms are surface nucleate boiling heat transfer and secondary nucleate boiling heat transfer. Therefore, to enhance the heat transfer performance of closed-loop spray cooling, it is essential to focus primarily on the two-phase region.

4.2. The Influence of Spray Parameters on the Heat Transfer Performance

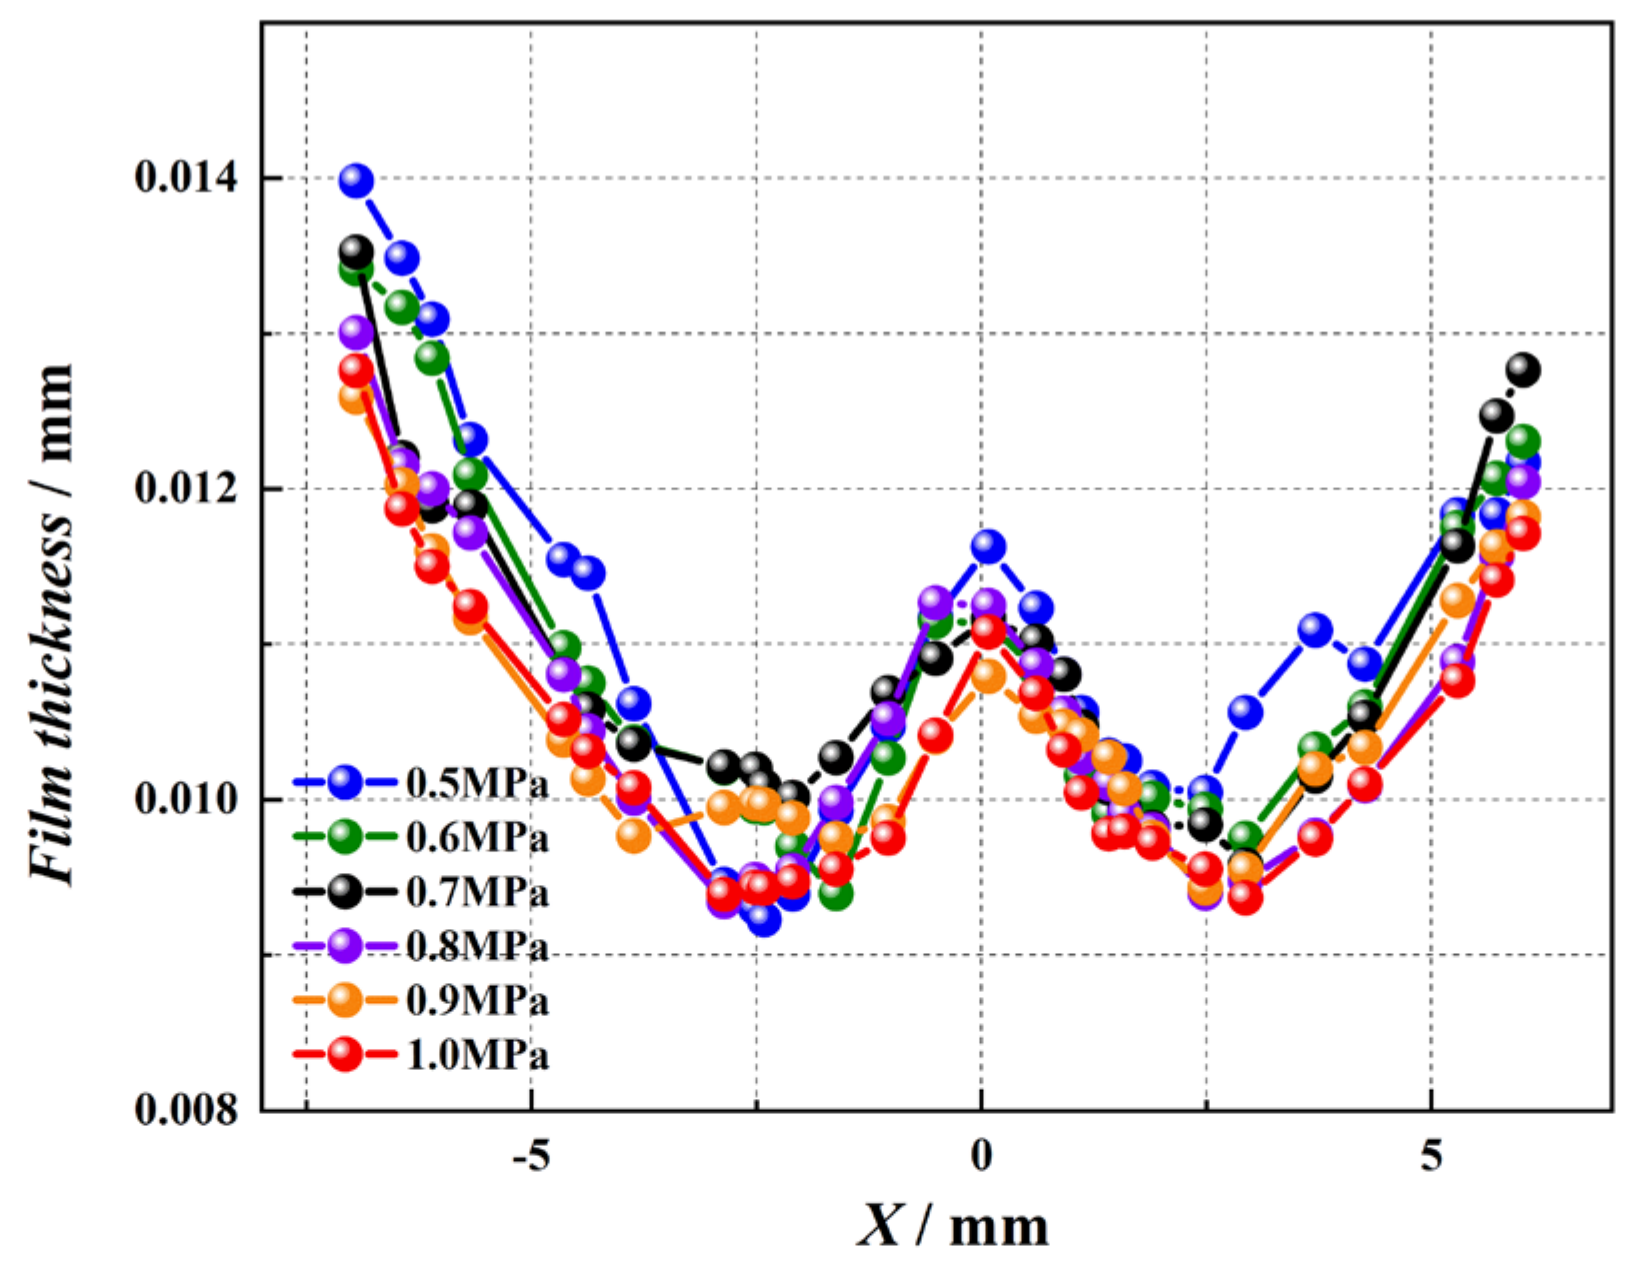
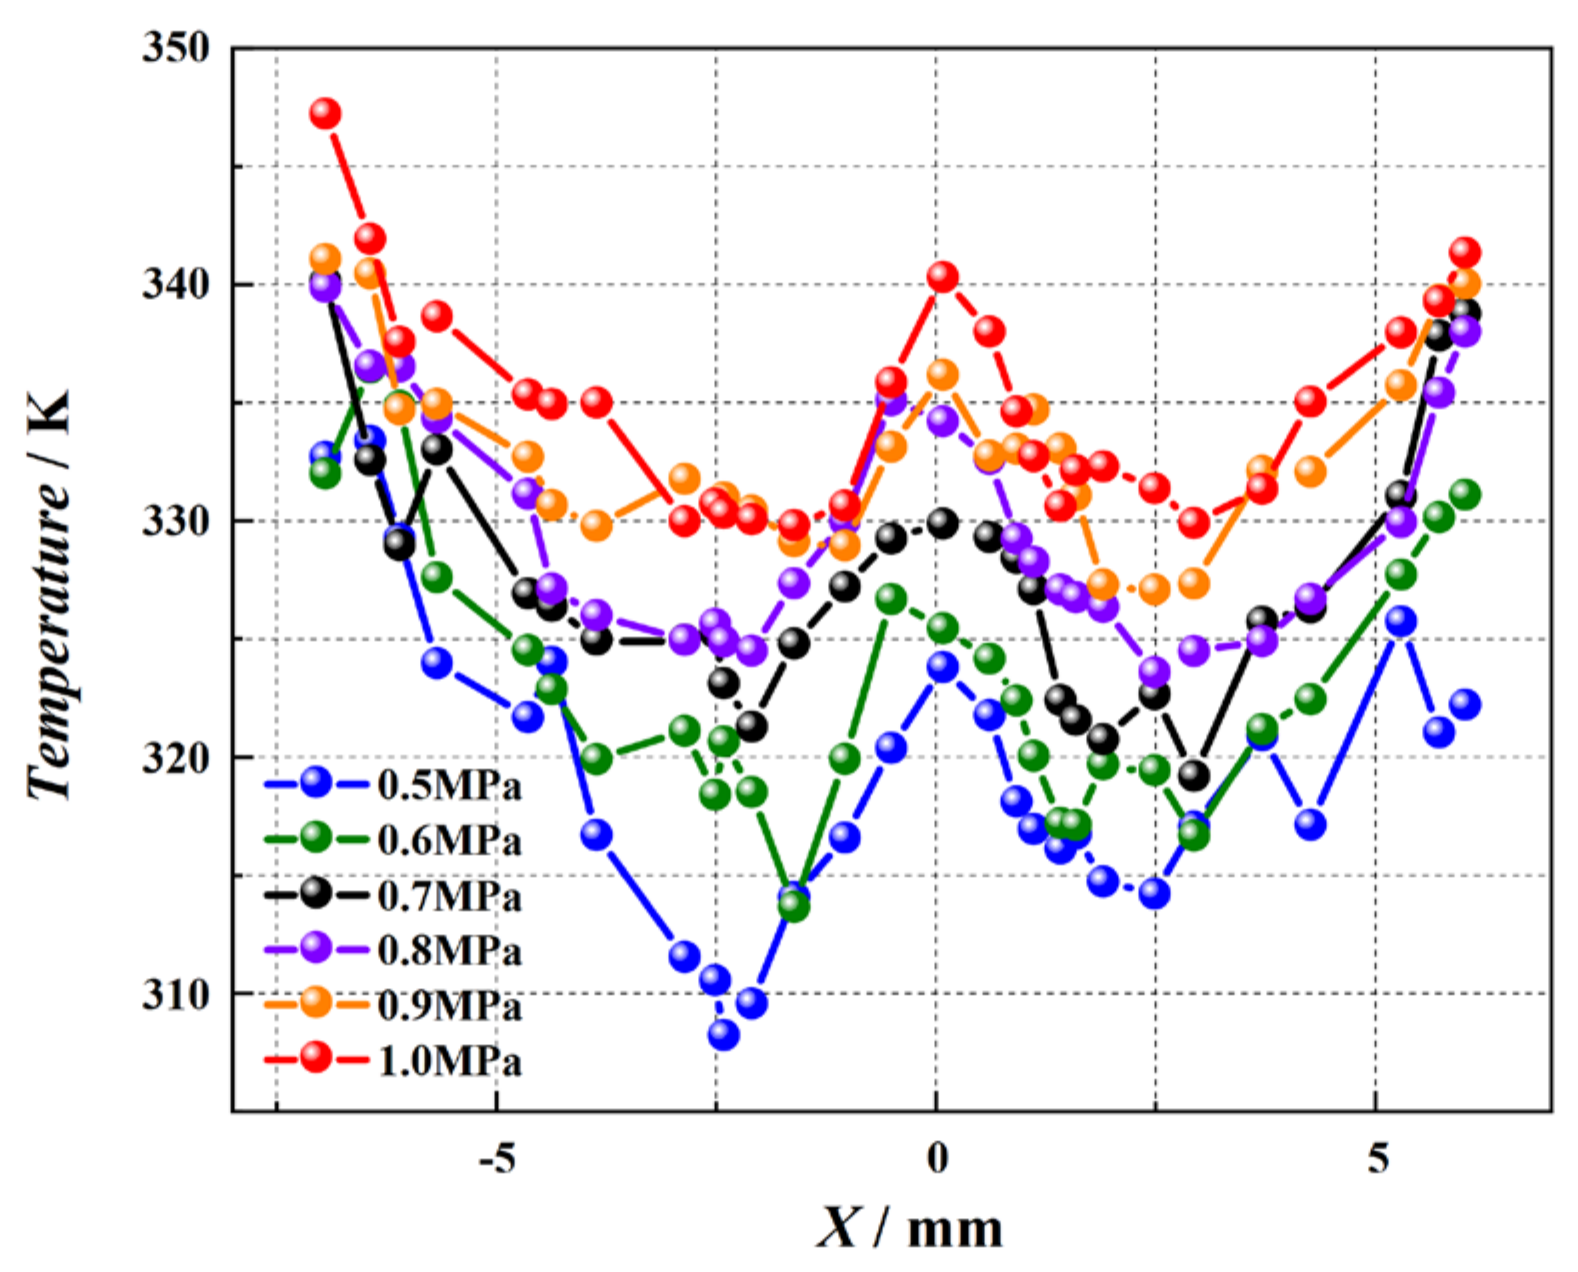
4.2.1. The Impact of Spray Pressure

This section investigates the influence of the pressure inside the spray chamber on spray cooling heat transfer. Keeping all other spray cooling parameters constant, the spray chamber pressures were set to 0.5, 0.6, 0.7, 0.8, 0.9, and 1.0 MPa, respectively.
From Figure 9 and Figure 10, it can be observed that both the radial distribution of liquid film height and the surface temperature exhibit a “W” shape. Under the same pressure, the wall temperature is lower in the region where the liquid film is thinner. The differences in liquid film height distribution are not significant under different pressures. It is worth noting that compared with Figure 9 and Figure 10, the temperature is higher in places where the liquid film is thin under different pressures. This is because with the increase of pressure in the spray chamber, the heat transfer performance deteriorates, the wall temperature increases, the evaporation is intense, and the liquid film becomes thin.
The relationship between spray pressure and the average temperature of the cooling surface, as well as the average liquid film height, is shown in Figure 11. From Figure 11 it can be found that as the spray pressure increases, the average temperature of the heat exchange surface gradually rises. This is due to the fact that with the increase in spray pressure, the corresponding saturation temperature of the cooling medium increases, reducing the temperature difference between the wall surface temperature and the saturation temperature, which results in the decrease of heat transfer efficiency. At the same time, with the spray inlet pressure remaining constant and an increase in the spray pressure, the pressure difference decreases, leading to a deterioration in spray atomization and a decrease in heat transfer efficiency. This also results in an increase in the average wall temperature.

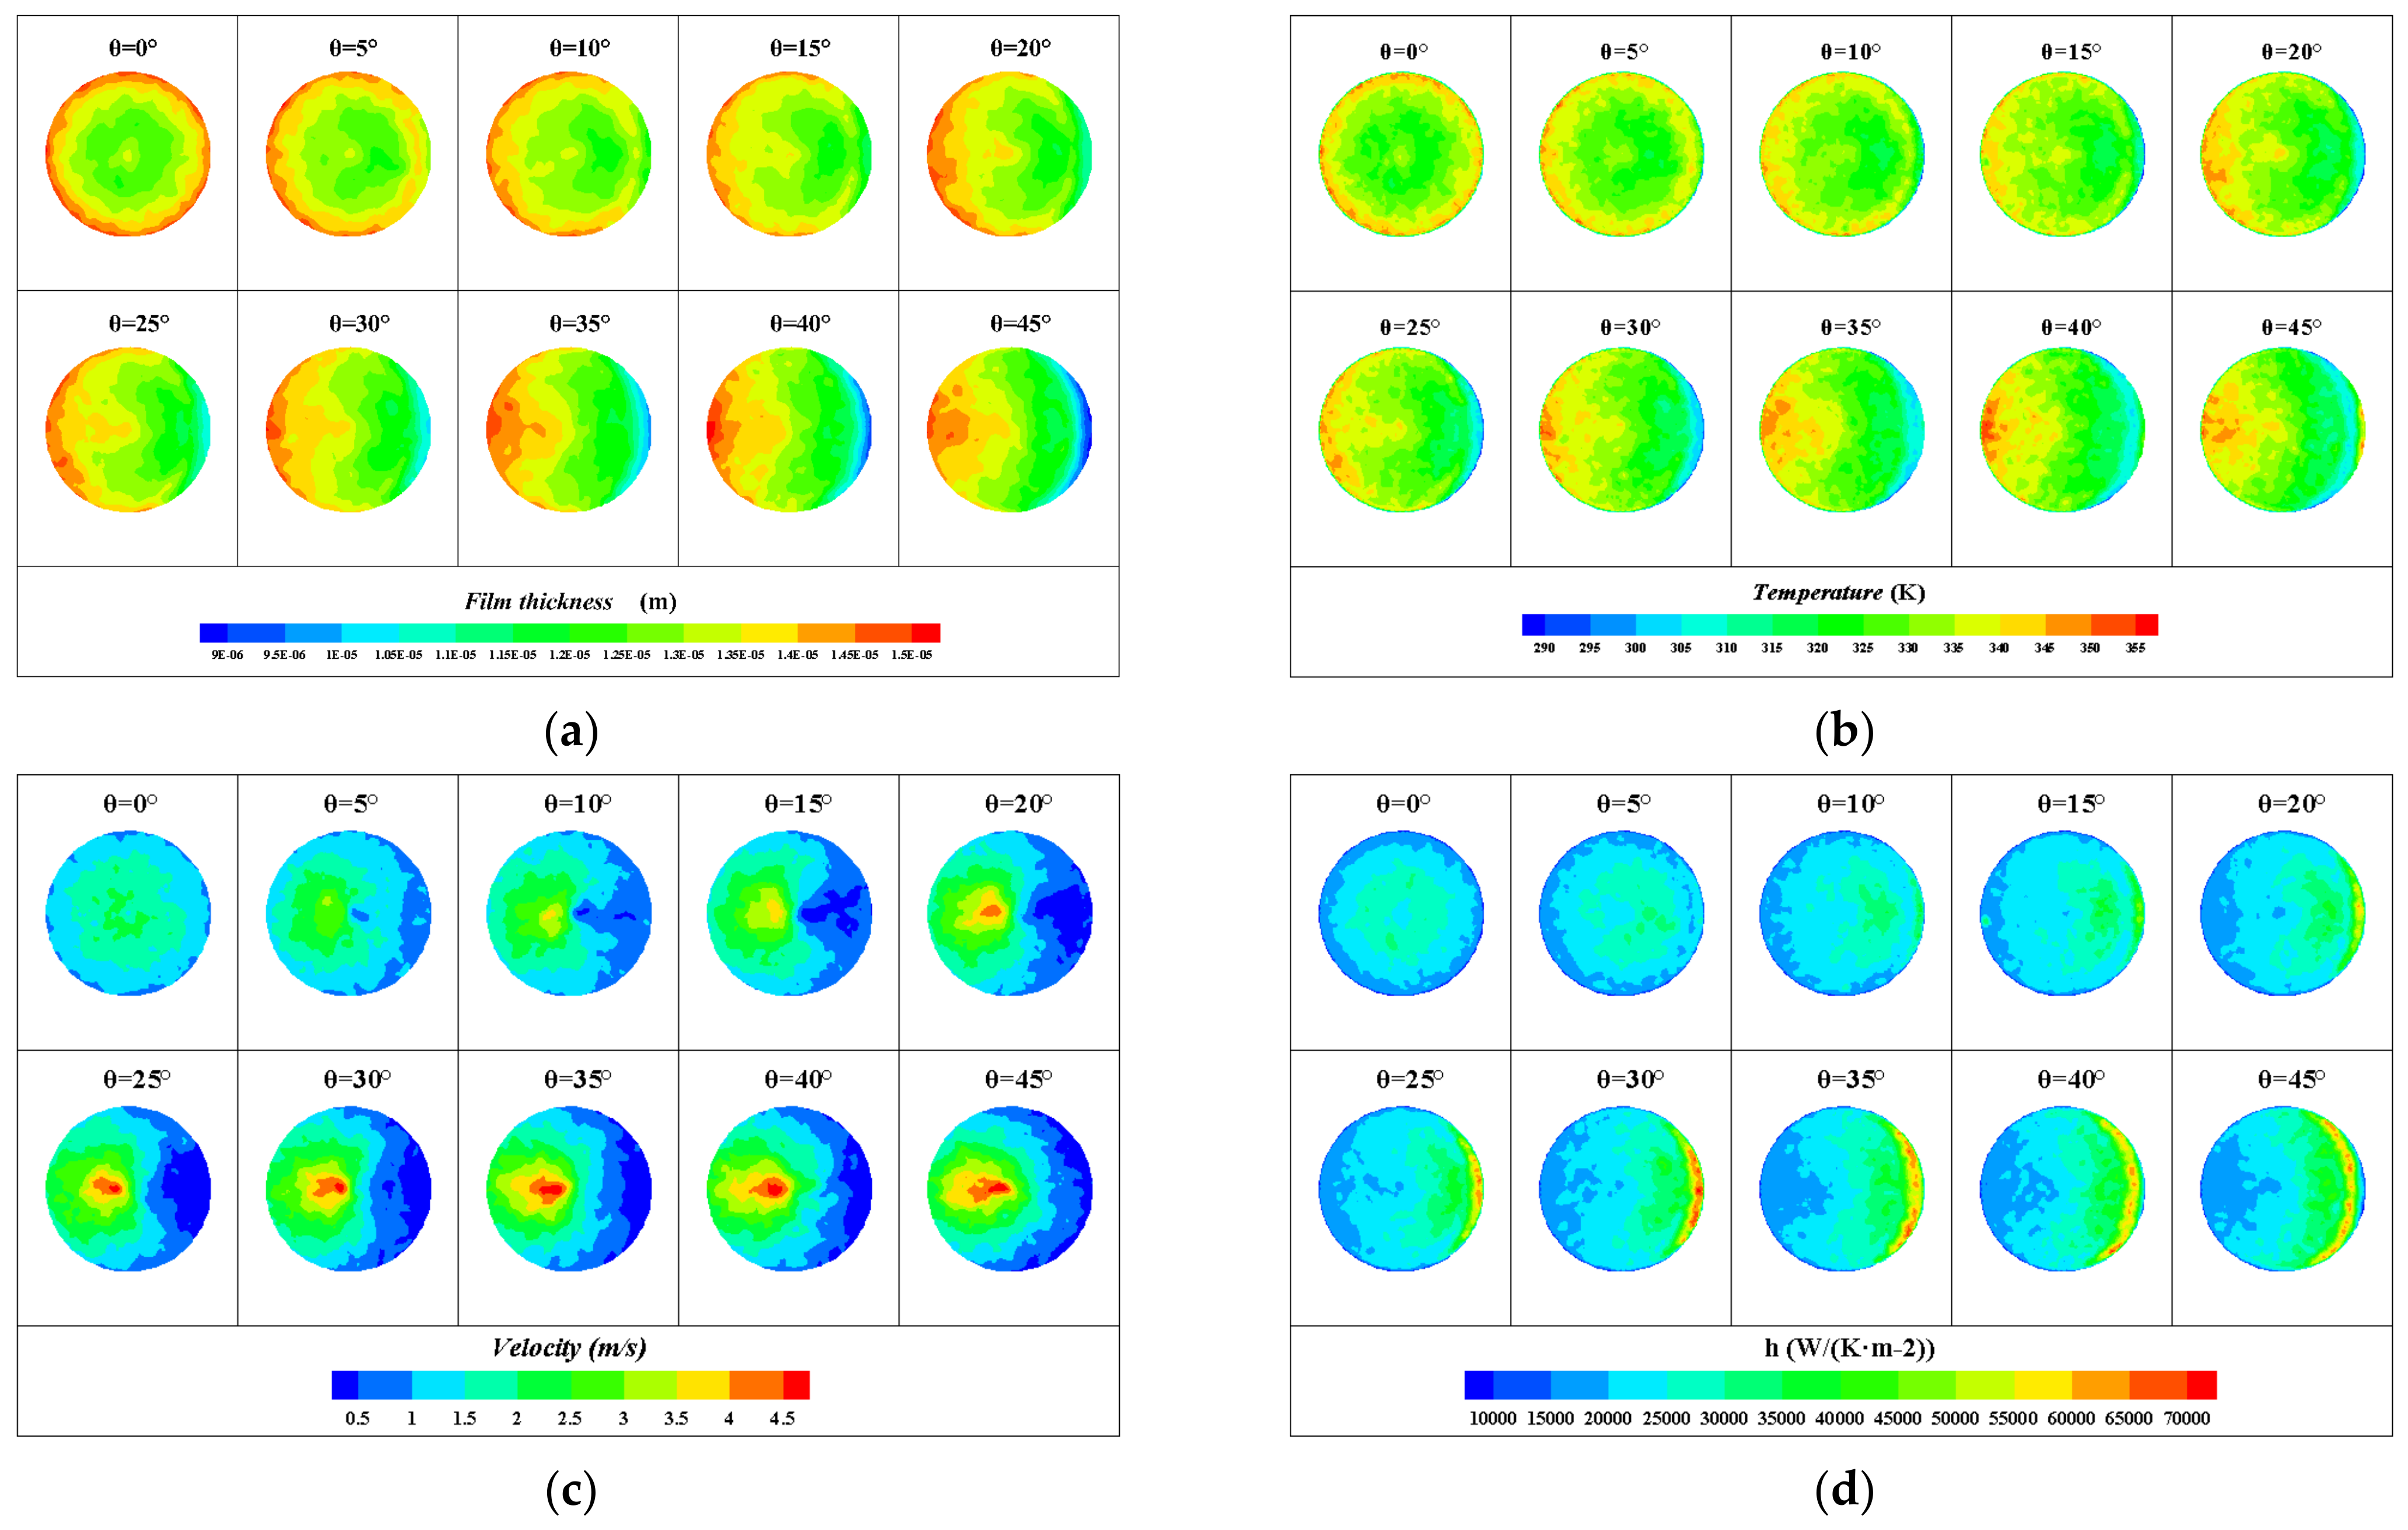
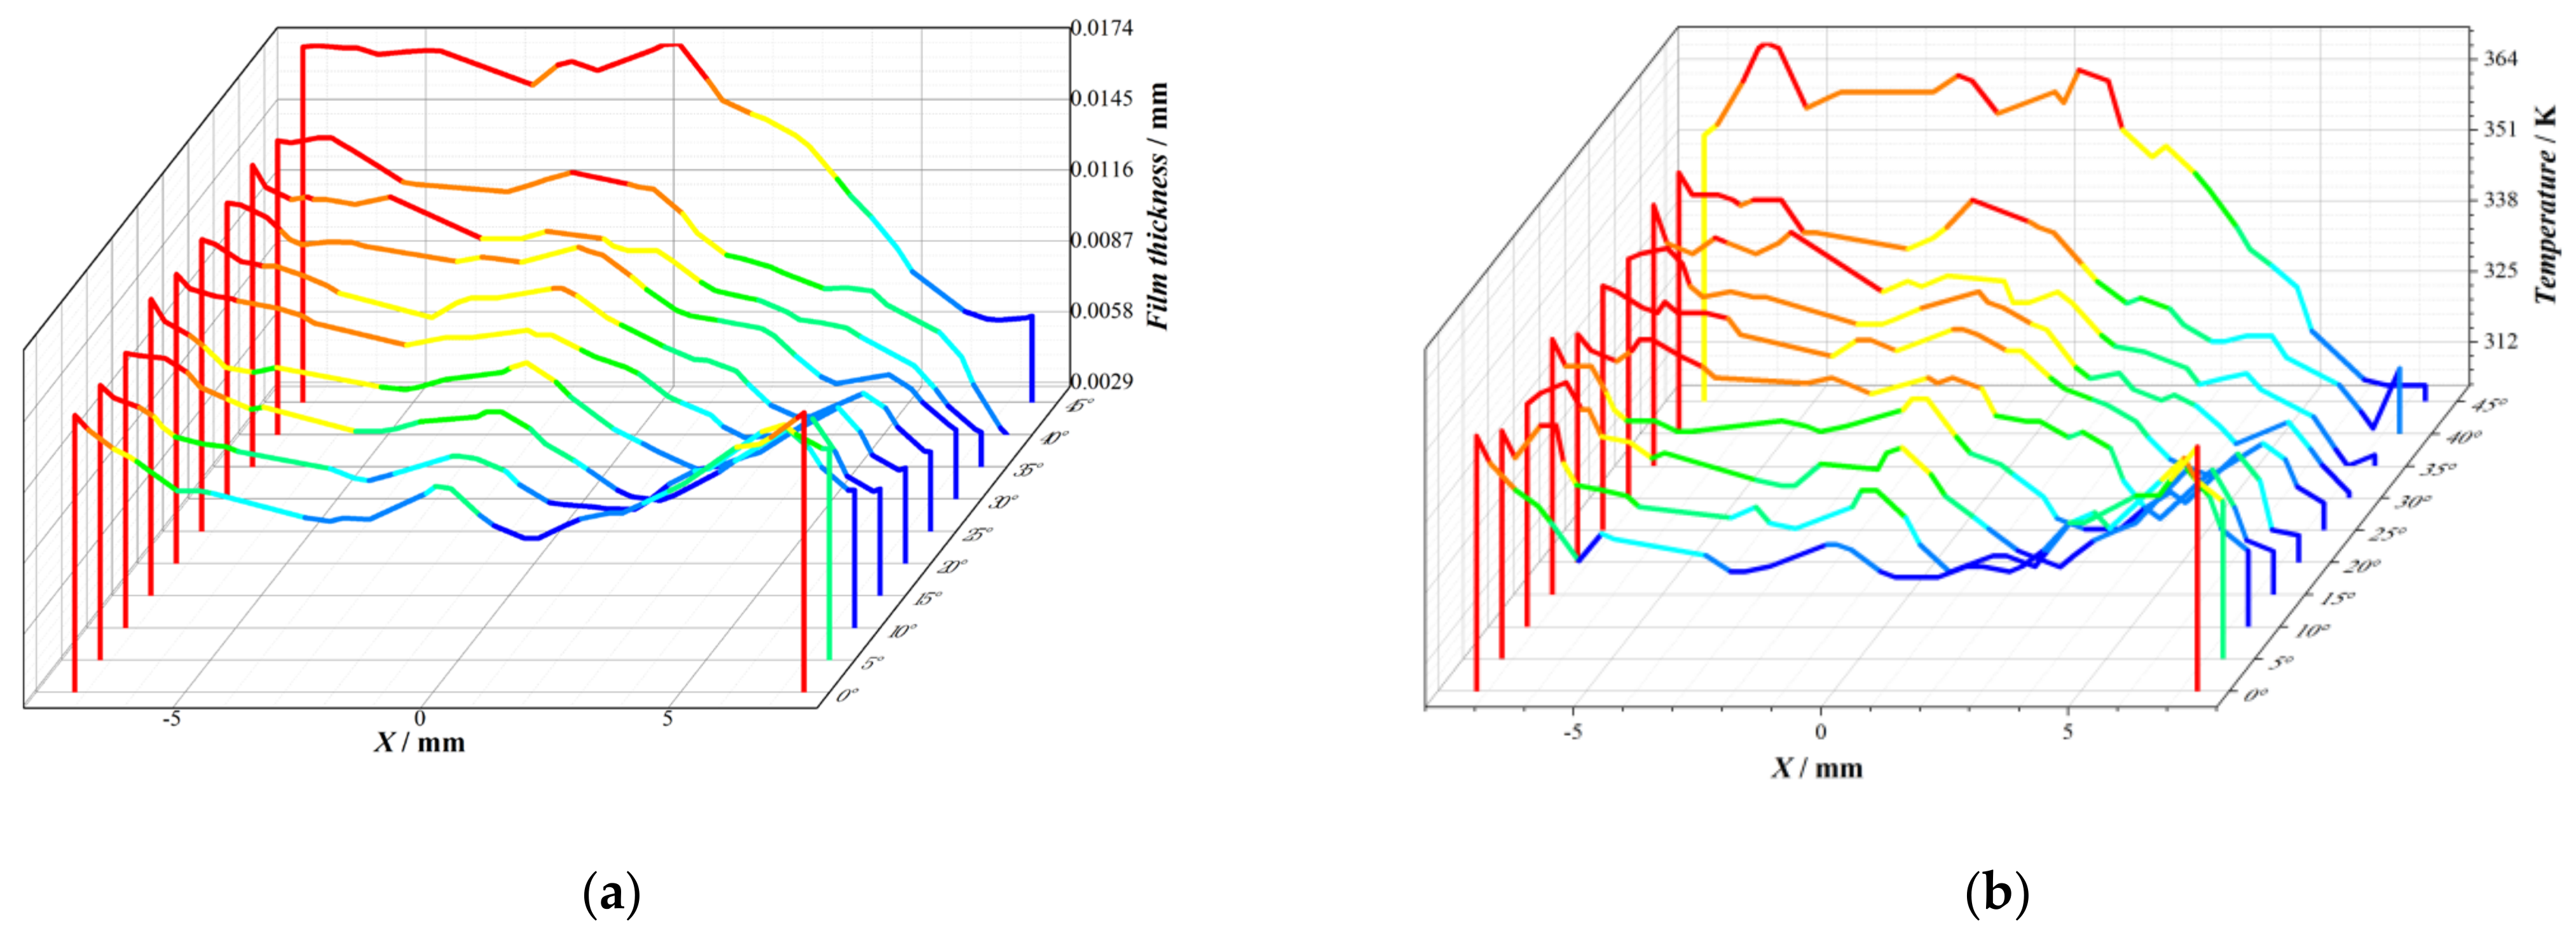
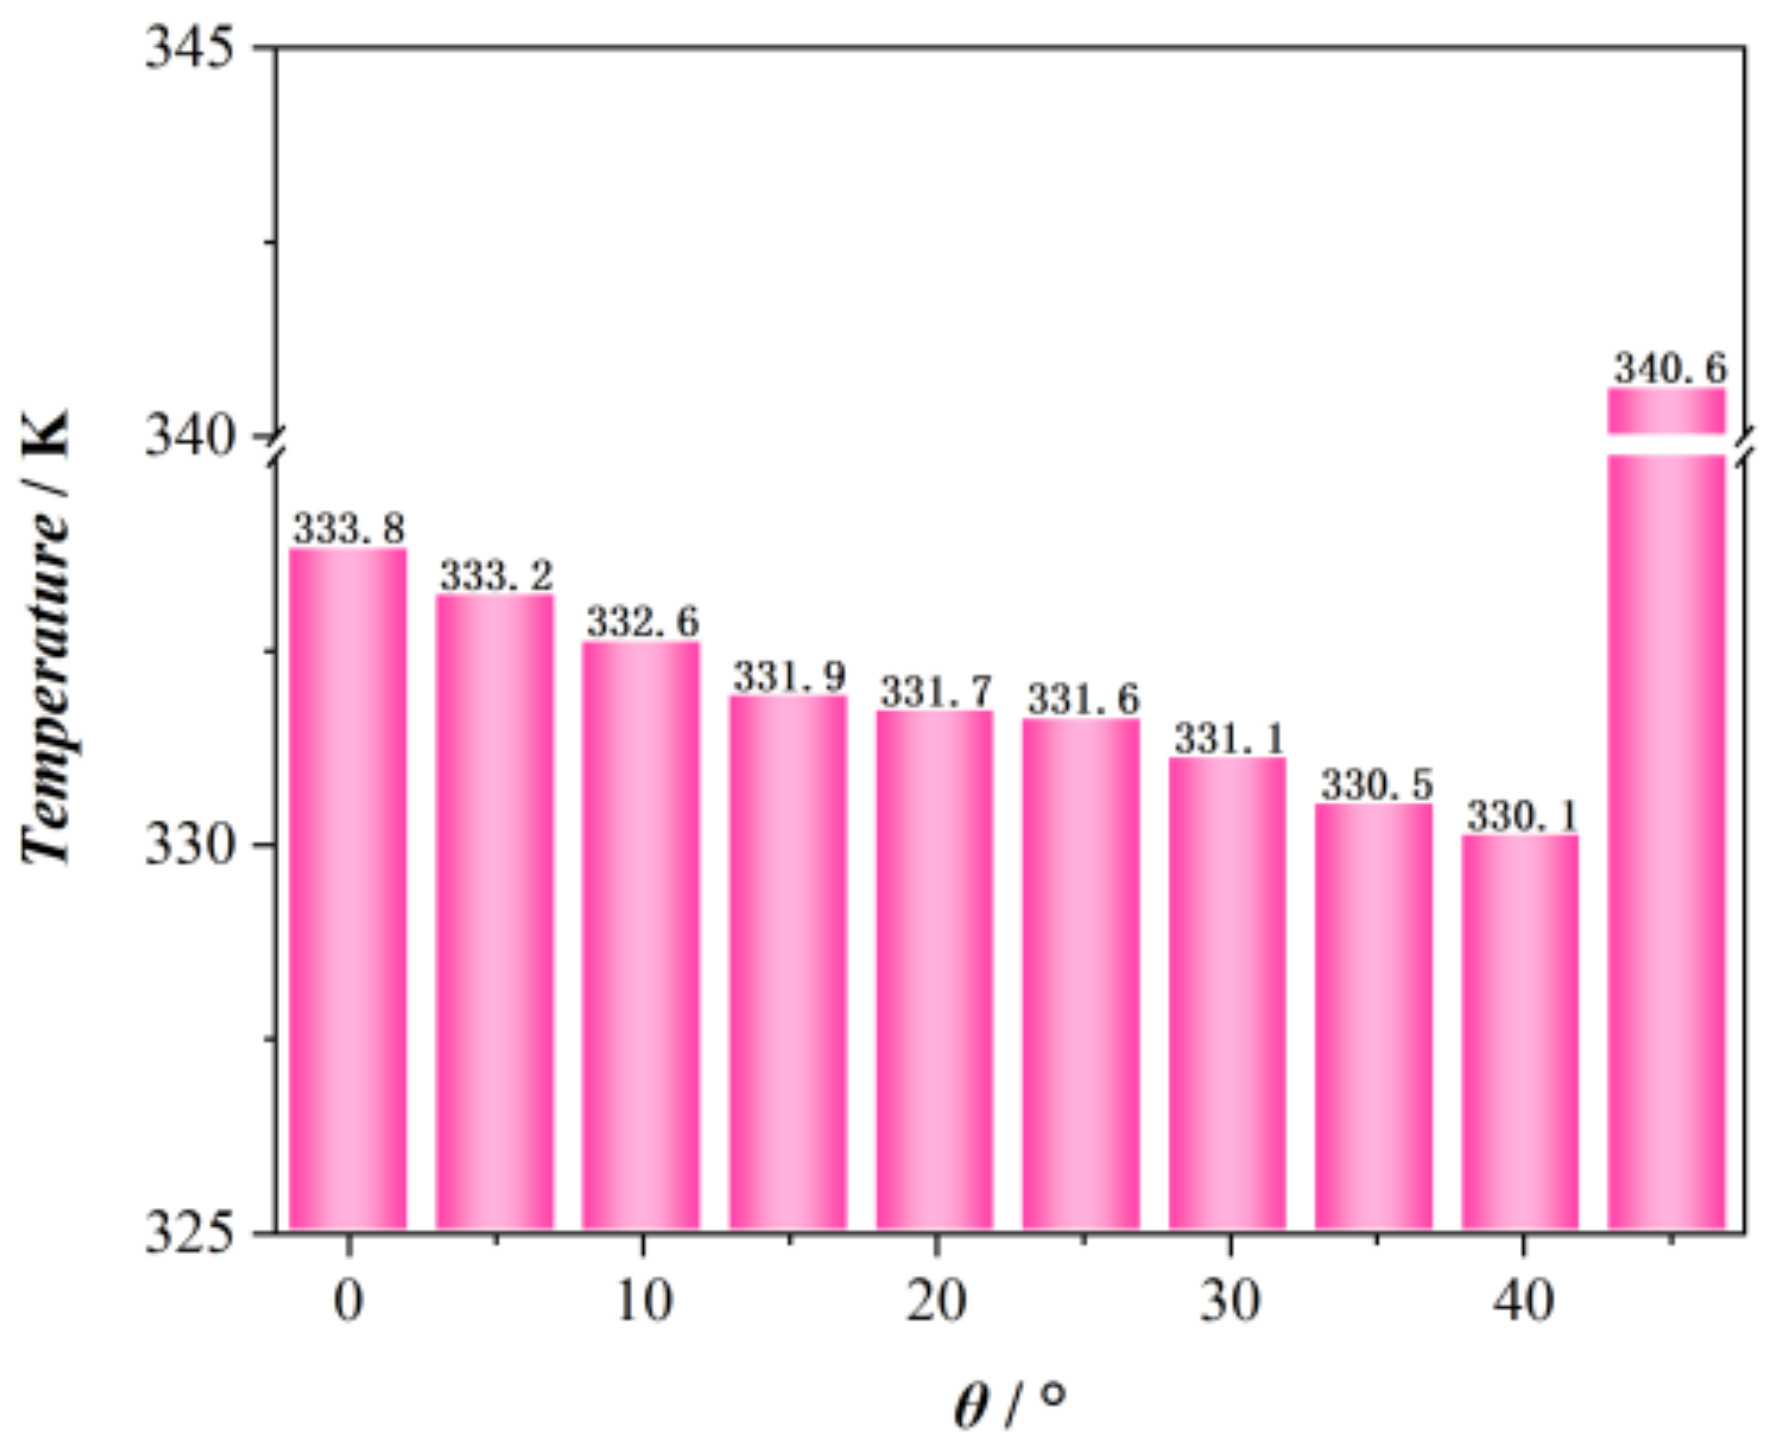
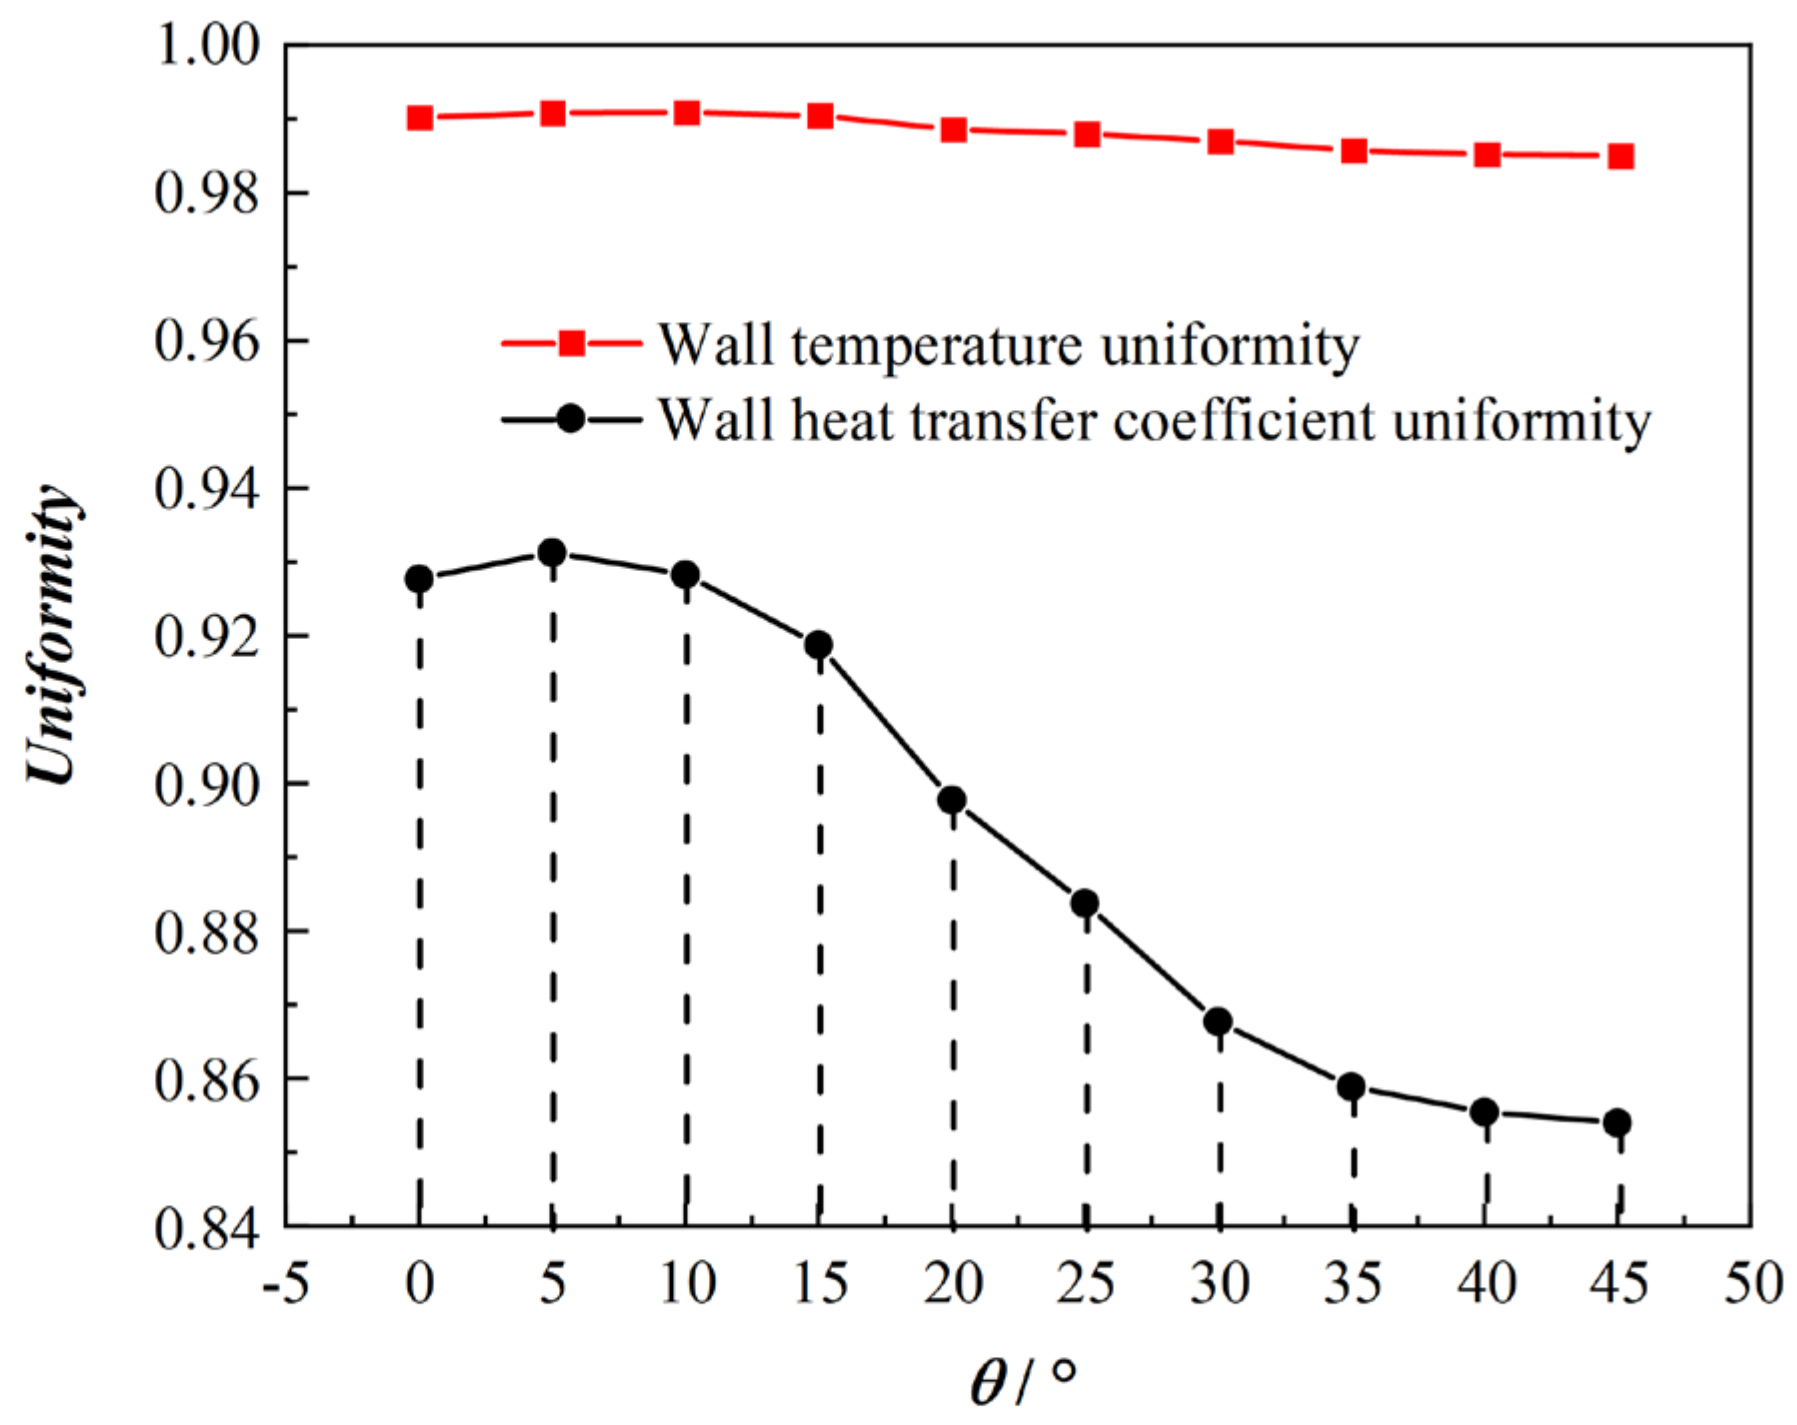
4.2.2. The Impact of Spray Tilt Angle

This section investigates the effect of spray tilt angle, which is the angle formed between the nozzle and the perpendicular direction of the cooling surface, on the heat transfer efficiency of spray cooling. The calculations ensure that the distance H (25 mm) from the nozzle outlet to the center of the heat exchange surface remains constant, while only changing the angle θ between the nozzle and the z-axis. The impact of spray tilt angles (represented by θ) in the range of 0° to 45° is studied, with intervals of 5°.
The distribution cloud charts for different spray tilt angles is shown in Figure 12. The figure reveals that as the spray tilt angle increases, the liquid film velocity increases towards one side gradually, causing liquid film accumulation on that side. In the areas where the liquid film accumulates, the wall temperature is higher, and the heat transfer coefficient is lower. Additionally, it is observed that in regions with high heat transfer coefficients and low wall temperatures, the liquid film height is not necessarily at its minimum. This further demonstrates the existence of an optimal value for liquid film height.
The relationship between the radial distribution of film thickness and wall temperature with respect to the tilt angle is illustrated in Figure 13a,b. In these figures, blue represents the lowest film thickness and wall temperature, while red represents higher film thickness and wall temperature. From the figures, it is easy to observe that the radial distribution of film thickness and wall temperature changes consistently. When the tilt angle is 0°, both exhibit a symmetric “W” shape. The proportion of different colors reflects the local distribution of film thickness and wall temperature. As the tilt angle increases from 0° to 45°, the radial distribution of film thickness and wall temperature gradually increases on the left side of the cooling surface, while it decreases on the right side. This is because as the tilt angle changes from 0° to 45°, the liquid velocity is greater on the left side of the cooling surface, causing liquid droplets to accumulate on the left side. This, in turn, results in higher film thickness on the left side compared to the right side. As mentioned earlier in the distribution of wall temperatures, areas with higher film thickness have less effective heat transfer, resulting in higher wall temperatures, while areas with lower film thickness exhibit better heat transfer and lower wall temperatures.
From Figure 14, which shows the relationship between the average temperature of the heat exchange surface and the tilt angle, it is evident that the cooling surface temperature reaches its lowest point as the tilt angle changes. At a tilt angle of 40°, the average temperature of the cooling surface is 330.1 K. It is apparent that changing the spray tilt angle can easily lead to an asymmetric and non-uniform distribution of cooling surface temperatures. In the cooling process of high-power chips, researchers aim to avoid local overheating. Generally, evaluating heat transfer performance requires examining parameters such as wall temperature and wall heat transfer coefficient. Therefore, this study introduces two evaluation criteria: wall temperature uniformity and wall heat transfer coefficient uniformity, as shown in Figure 15. It is clear that as the spray tilt angle increases, wall temperature uniformity remains relatively consistent. However, wall heat transfer coefficient uniformity remains stable between 0° and 10° but gradually deteriorates beyond 10°. Considering the results from Figure 14, the optimal spray tilt angle is 10°, with an average cooling surface temperature of 332.6 K.

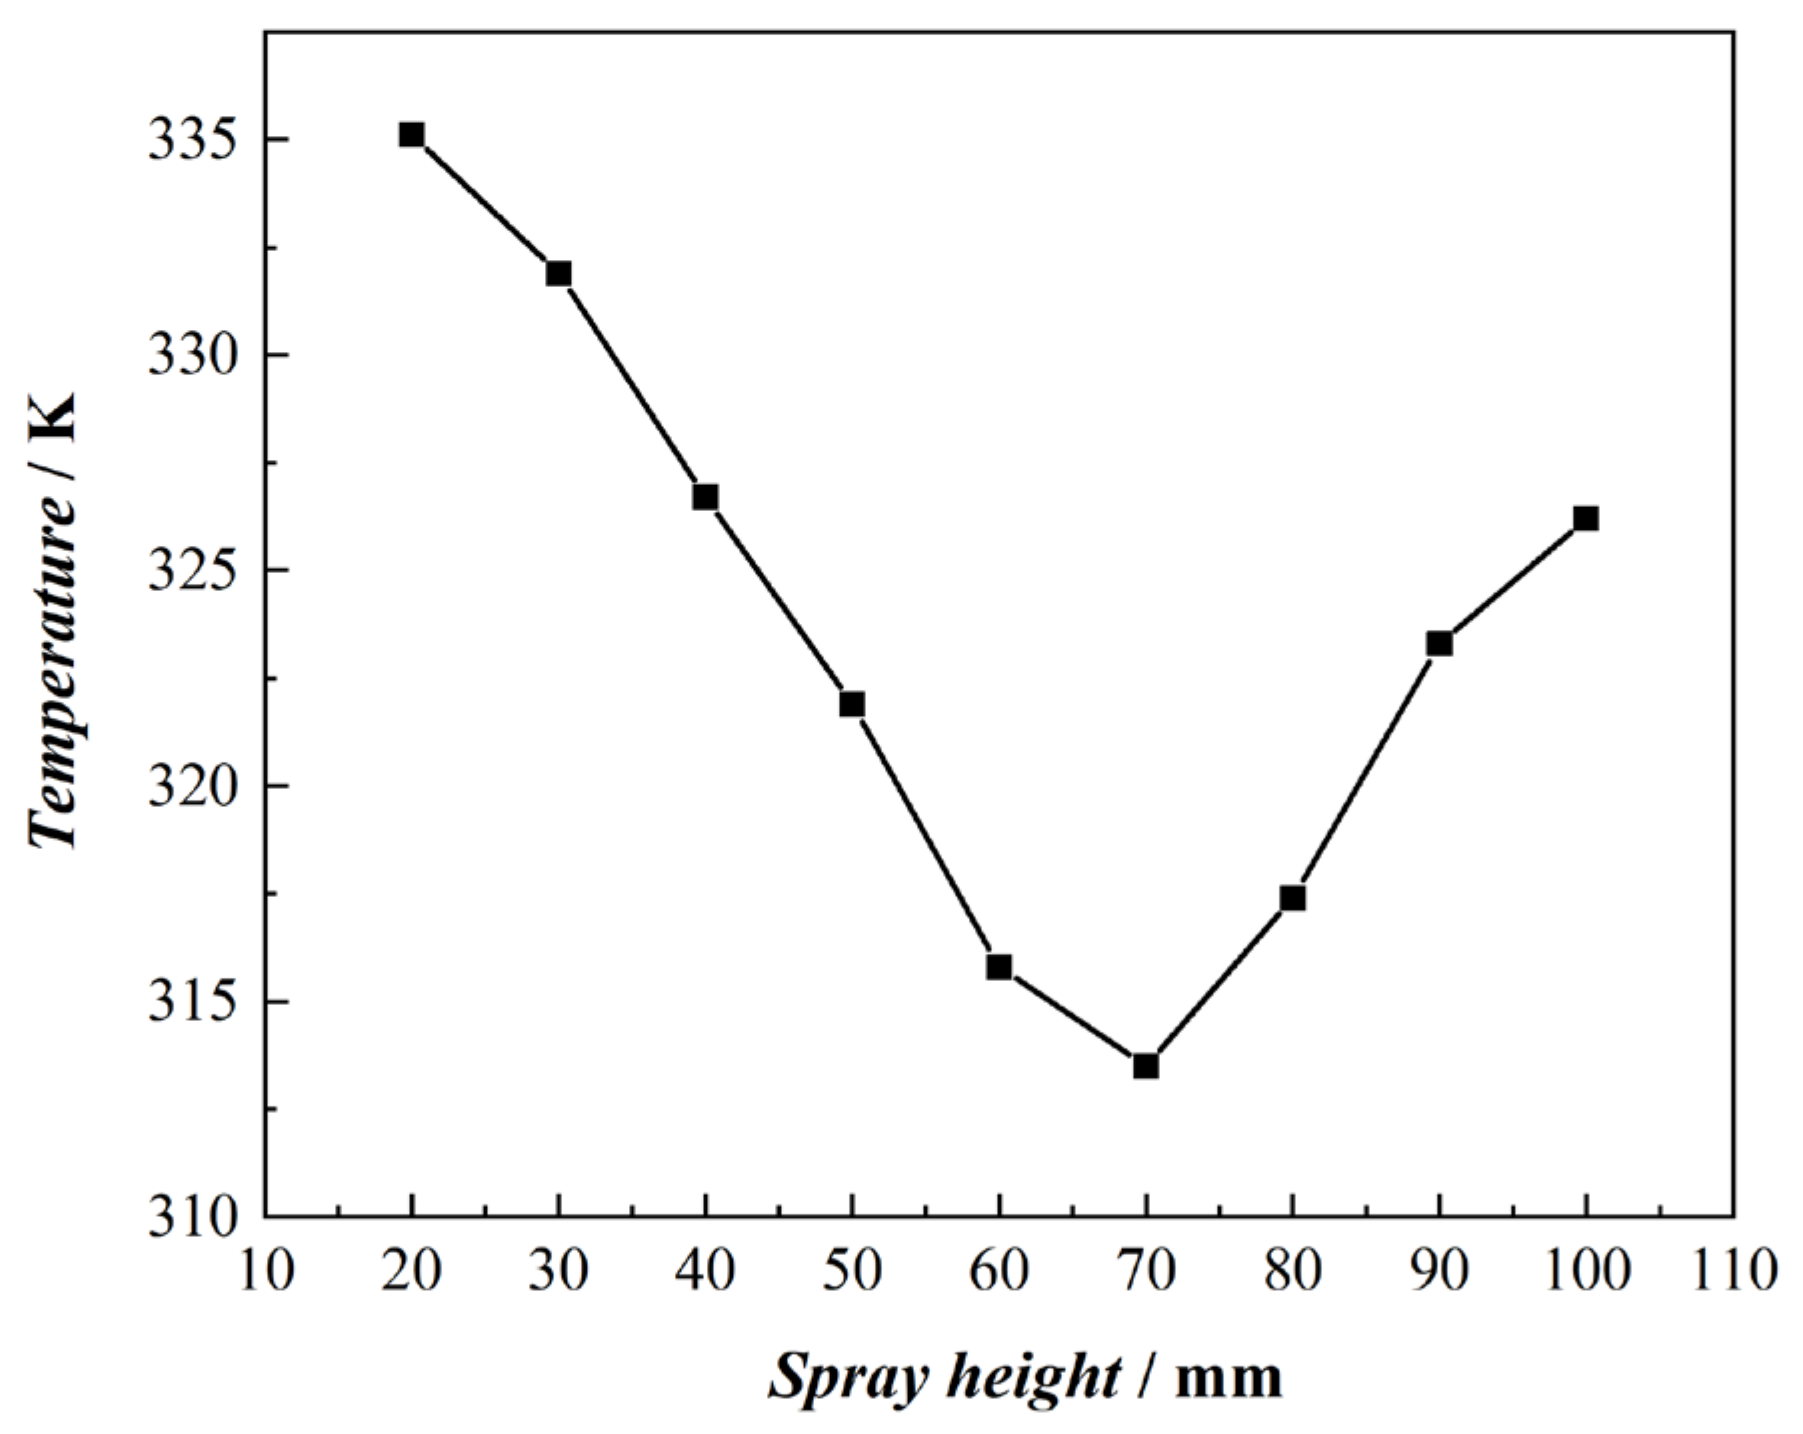
4.2.3. The Impact of Spray Height

This section investigates the effect of spray height on the heat transfer in spray cooling. Keeping other parameters constant, the spray height varies from 20 mm to 100 mm with steps of 10 mm, and the results are shown in Figure 16, Figure 17 and Figure 18. The radial distribution of liquid film height and wall temperature under different spray heights is shown in Figure 16 and Figure 17, respectively. From Figure 16, it can be seen that as the spray height increases, the radial distribution of liquid film height gradually changes from a “W” shape to a more uniform distribution and eventually forms an “M” shape, with the liquid film thickness decreasing. Through a comparison between Figure 16 and Figure 17, there is an optimal value for local liquid film height, which is around 5 μm. Excessively high or low local liquid film heights will lead to higher local wall temperatures.
From Figure 18, it can be observed that the average temperature of the cooling surface decreases as the spray height increases, until it reaches a minimum value and then starts to increase. Therefore, there is an optimal spray height of 70 mm, at which the corresponding liquid film on the surface is the thinnest. Thinner liquid films are advantageous for evaporative heat transfer. When the spray height is less than 70 mm, the impact velocity of droplets on the heat exchange surface is higher, increasing the chances of droplets splashing and rebounding, which is not conducive to liquid film formation and thus reduces heat transfer efficiency. When the spray height is greater than 70 mm, on one hand, the interaction between droplets and air is enhanced, and the interactions between droplets themselves are reduced. This leads to a decrease in droplet momentum and attenuation. On the other hand, thicker liquid films are formed on the heat exchange surface, resulting in slower liquid film flow velocity, reducing the convective heat transfer in the liquid film, and worsening the heat transfer efficiency. The spray coverage gradually increases with the elevation of the spray height, expanding from 1.13 cm2 to 28.27 cm2. Correspondingly, the spray area utilization rate at the optimal spray height ranges from 9.8% to 17.4%.

5. Conclusions

In this study, a mathematical model based on the Eulerian–Lagrangian frame was established for an R410A closed-loop spray cooling system. The conclusions are as follows:
(1)
The spray pattern is conical, with the center velocity significantly higher than that at the edge, and the liquid film velocity gradually decreases from a central stagnation point to the periphery of the cooling surface.
(2)
The temperature distribution of the cooling surface and liquid film height both exhibit a “W” shape.
(3)
The surface temperature gradually increases with an increase in spray chamber pressure, and considering the average cooling surface temperature, the optimal tilt angle is 40° with an average surface temperature of 330.1 K. When considering wall temperature and wall heat transfer coefficient uniformity, however, the optimal tilt angle is 10°, leading to the average surface temperature of 332.6 K.
(4)
There is an optimal liquid film height of approximately 5μm, at which the cooling surface temperature is the lowest. The optimal spray height is around 70 mm, where the average cooling surface temperature is 313.4 K. Correspondingly, the spray area utilization rate at the optimal spray height ranges from 9.8% to 17.4%.

Author Contributions

Conceptualization, W.Y.; methodology, W.Y.; software, W.Y. and X.S.; validation, W.Y.; formal analysis, W.Y.; investigation, W.Y.; resources, B.C.; data curation, W.Y.; writing—original draft preparation, W.Y.; writing—review and editing, W.Y., D.L. and B.C.; visualization, W.Y.; supervision, W.Y.; project administration, B.C.; funding acquisition, B.C. All authors have read and agreed to the published version of the manuscript.

Funding

This research was funded by the National Natural Science Foundation of China, grant number 52036007 and the Fundamental Research Funds for the Central Universities.

Data Availability Statement

All data and models that support the findings of this study are available from the author upon reasonable request. All data and models generated or used during this study appear in the submitted article.

Acknowledgments

This research was supported by the National Natural Science Foundation of China (52036007), the Key Program for International Science & Technology Cooperation Projects from the Ministry of Science and Technology of China (2017YFE0134200), and the Fundamental Research Funds for the Central Universities.

Conflicts of Interest

The authors declare no conflicts of interest.

Nomenclature

tTime, s
u The velocity of the continuous phase fluid, M·s−1
TThermodynamic temperature, K
pPressure, Pa
gGravitational acceleration, m·s−2
SmMass of the continuous phase gas, kg
EInternal energy of the continuous phase fluid, kJ
u Continuous change in momentum, kg·m·s−1
GkTurbulent kinetic energy generated by mean velocity gradients, m2·s−2
GbTurbulent kinetic energy generated by buoyancy forces, m2·s−2
udThe velocity vector of a droplet, m·s−1
ddDroplet diameter, m
CdDrag coefficient for a droplet
Cd,sDrag coefficient for a spherical droplet
ReReynolds number
yShape correction factor for a droplet
ΔtTime step
m ˙ p , 0 Initial mass flow rate of liquid droplets, kg·s−1
m p , 0 Initial mass of a droplet
m p in   Mass of a droplet as it enters the continuous phase grid, kg
m p out   Mass of a droplet as it leaves the continuous phase grid, kg
c p p Specific heat of a particle, J·kg−1·K−1
T p in   Temperature of a liquid droplet upon entering the continuous phase grid, K
T p out   Temperature of a liquid droplet upon leaving the continuous phase grid, K
H lat   ref   Latent heat of vaporization, J·kg−1
qHeat flux, W·cm−2
XCoordinate position, mm
hHeat transfer coefficient, W·K−1·m−2
Greek letters
ρ The density of continuous phase fluid, kg·m−3
λ Fluid thermal conductivity, W·m−1·K−1
μ Viscosity, kg·m−1·s−1
μ t Turbulent viscosity, kg·m−1·s−1
ρ dDroplet density, kg·m−3
θSpray tilt angle, 0

References

  1. Smakulski, P.; Pietrowicz, S. A review of the capabilities of high heat flux removal by porous materials, microchannels and spray cooling techniques. Appl. Therm. Eng. 2016, 104, 636–646. [Google Scholar] [CrossRef]
  2. Shende, M.D.; Mahalle, A. Cooling of Electronic Equipments with Heat Sink: A Review of Literature. IOSR J. Mech. Civ. Eng. 2013, 5, 56–61. [Google Scholar] [CrossRef]
  3. Wang, J.X.; Guo, W.; Xiong, K.; Wang, S.N. Review of aerospace-oriented spray cooling technology. Prog. Aerosp. Sci. 2020, 116, 100635. [Google Scholar] [CrossRef]
  4. Tauseef-ur-Rehman, A.H.M. Experimental investigation on paraffin wax integrated with copper foam based heat sinks for electronic components thermal cooling. Int. Commun. Heat Mass Transf. 2018, 98, 155–162. [Google Scholar] [CrossRef]
  5. Zhou, W.; Dong, K.; Sun, Q.; Luo, W.; Zhang, B.; Guan, S.; Wang, G. Research progress of the liquid cold plate cooling technology for server electronic chips: A review. Int. J. Energy Res. 2022, 46, 11574–11595. [Google Scholar] [CrossRef]
  6. Wei, J.J.; Liu, L.; Yang, X.P. Research Progress on Loop Heat Pipes for Thermal Management of High Heat Flux Electronic Devices. J. Chem. Eng. Chin. Univ. 2023, 74, 60–73. [Google Scholar]
  7. Shen, G.Y. Research on Water Cooling Technology. Refrig. Air Cond. 1999, 43–45. [Google Scholar]
  8. Xu, H.J.; Wang, J.F.; Tian, J.M.; Zhang, Y.; Zhao, T.Y. Heat Transfer Characteristics of Ethanol Electrostatic Spray Cooling under Different Atomization Modes. J. Eng. Thermophys. 2021, 42, 2559–2565. [Google Scholar]
  9. Wang, H.; Wu, J.J.; Yang, Q.; Zhu, X.; Liao, Q. Heat transfer enhancement of ammonia spray cooling by surface modification. Int. J. Heat Mass Transf. 2016, 101, 60–68. [Google Scholar] [CrossRef]
  10. Visaria, M.; Mudawar, I. Effects of high subcooling on two-phase spray cooling and critical heat flux. Int. J. Heat Mass Transf. 2008, 51, 5269–5278. [Google Scholar] [CrossRef]
  11. Liu, Z.M. Alternative Technologies for R22 Refrigerant. Refrig. Air Cond. 2001, 47–53+27. [Google Scholar]
  12. Jin, W.F.; Xue, T.D.; Yuan, X.Y.; Wang, Z.Q. Experimental Study on Concentration Distribution and Indoor Safety of R32 Refrigerant Leakage at Different Locations. J. Refrig. 2022, 43, 114–121. [Google Scholar]
  13. Zhou, Z.F.; Lin, Y.K.; Tang, H.L.; Fang, Y.; Chen, B.; Wang, Y.C. Heat transfer enhancement due to surface modification in the close-loop R410A flash evaporation spray cooling. Int. J. Heat Mass Transf. 2019, 139, 1047–1055. [Google Scholar] [CrossRef]
  14. Zhou, Z.F.; Lin, X.W.; Ji, R.J.; Zhu, D.Q.; Chen, B.; Wang, H.; Lu, Y.J. Enhancement of heat transfer on micro-and macro-structural surfaces in close-loop R410A flashing spray cooling system for heat dissipation of high-power electronics. Appl. Therm. Eng. 2023, 223, 119978. [Google Scholar] [CrossRef]
  15. Wang, S.; Zhou, Z.; Sang, X.; Chen, B.; Romeos, A. Coupling dynamic thermal analysis and surface modification to enhance heat dissipation of R410A spray cooling for high-power electronics. Energy 2023, 284, 129224. [Google Scholar] [CrossRef]
  16. Longo, G.A.; Mancin, S.; Righetti, G.; Zilio, C. Comparative analysis of microfin vs. smooth tubes in R32 and R410A condensation. Int. J. Refrig. 2021, 128, 218–231. [Google Scholar] [CrossRef]
  17. Pan, Y.Q.; Du, Y.J.; Zhang, C.C.; Yu, L. Numerical Simulation of Single-Phase Heat Transfer Characteristics in Small Spray Cooling Systems. J. Chem. Eng. Chin. Univ. 2022, 36, 8. [Google Scholar]
  18. Cai, C.; Liu, H.; Jia, M.; Yin, H.; Xie, R.; Yan, P. Numerical investigation on heat transfer of water spray cooling from single-phase to nucleate boiling region. Int. J. Therm. Sci. 2020, 151, 106258. [Google Scholar] [CrossRef]
  19. Tian, J.; Chen, B.; Zhou, Z.; Li, D. Theoretical Study on Cryogen Spray Cooling in Laser Treatment of Ota’s Nevus: Comparison and Optimization of R134a, R404A and R32. Energies 2020, 13, 5647. [Google Scholar] [CrossRef]
  20. Giannadakis, A. Spray Cooling as a High-Efficient Thermal Management Solution: A Review. Energies 2022, 15, 8547. [Google Scholar]
  21. Wu, T.; Wang, C.; Hu, Y.; Fan, X.; Fan, C. Research on spray cooling performance based on battery thermal management. Int. J. Energy Res. 2022, 46, 8977–8988. [Google Scholar] [CrossRef]
  22. Hu, K.; Li, Z.B. Detailed Explanation of ANSYS ICEM CFD Engineering Examples; CAE Analysis Series; People’s Posts and Telecommunications Press: Beijing, China, 2014; 421p. [Google Scholar]
  23. Liu, H.; Cai, C.; Yan, Y.A.; Jia, M.; Yin, B. Numerical simulation and experimental investigation on spray cooling in the non-boiling region. Heat Mass Transf. 2018, 54, 3747–3760. [Google Scholar] [CrossRef]
  24. Wang, X.Z.; Cui, X.Y.; Deng, L. Obtaining Refrigerant Thermophysical Data in Application Programs. Refrig. Air Cond. 2010, 24, 40–44. [Google Scholar]
  25. Hu, B.M.; Zuo, J.Z. Numerical Simulation of Ultra-Fast Cooling by Liquid Nitrogen Spray. Energy Conserv. 2022, 41, 40–43. [Google Scholar]
  26. Guo, Y.X. Theory of Liquid Film Flow in Spraying and Experimental Study on Spray Cooling of Electronic Devices. Ph.D. Thesis, Xi’an University of Electronic Science and Technology, Xi’an, China, 2009. [Google Scholar]
Figure 1. Spray cooling experimental system, geometric model, and nozzle position: (a) Experimental system spray chamber; (b) Geometrical model.
Energies 17 00339 g001
Figure 2. Schematic diagram of the solution algorithm.
Energies 17 00339 g002
Figure 3. Polyhedral meshing.
Energies 17 00339 g003
Figure 4. Grid quality distribution.
Energies 17 00339 g004
Figure 5. Grid independence test (a) and model validation (b).
Energies 17 00339 g005
Figure 6. Velocity distribution contour in the spray chamber: (a) longitudinal droplet velocity distribution; (b) liquid film velocity distribution on the cooling surface.
Energies 17 00339 g006
Figure 7. Liquid film distribution: (a) liquid film height distribution on the cooling surface; (b) Radial distribution of liquid film height.
Energies 17 00339 g007
Figure 8. Temperature distribution: (a) Temperature distribution on the cooling surface; (b) Radial temperature distribution of cooling surface.
Energies 17 00339 g008
Figure 9. The radial distribution of liquid film height at different spray chamber pressures.
Energies 17 00339 g009
Figure 10. The radial distribution of cooling surface temperature at different spray chamber pressures.
Energies 17 00339 g010
Figure 11. The relationship between wall temperature, film thickness, and spray chamber pressure.
Energies 17 00339 g011
Figure 12. Distribution cloud chart of different spray tilt angles: (a) Film thickness; (b) Temperature; (c) Velocity; (d) Heat transfer coefficient.
Energies 17 00339 g012
Figure 13. The relationship between wall liquid film height, wall temperature radial distribution, and spray tilt angle: (a) Radial distribution of wall liquid film height; (b) Radial distribution of wall temperature.
Energies 17 00339 g013
Figure 14. The relationship between average cooling surface temperature and spray tilt angle.
Energies 17 00339 g014
Figure 15. The relationship between uniformity and spray tilt angle.
Energies 17 00339 g015
Figure 16. The radial distribution of liquid film height at different spray heights.
Energies 17 00339 g016
Figure 17. The radial distribution of cooling surface temperature at different spray heights.
Energies 17 00339 g017
Figure 18. The relationship between wall temperature and spray height.
Energies 17 00339 g018
Table 1. Properties of R410A [24].
Temperature
(K)
Density
(kg/m3)
Thermal Conductivity
(mW/(m·K))
Latent Heat of Vaporization
(kJ/kg)
Viscosity Coefficient
(μPa·s)
Liquid150~3401560.40~714.47175.35~69.67344.05~73.011201.00~54.37
Vapor0.017~275.276.11~46.466.62~20.70
Disclaimer/Publisher’s Note: The statements, opinions and data contained in all publications are solely those of the individual author(s) and contributor(s) and not of MDPI and/or the editor(s). MDPI and/or the editor(s) disclaim responsibility for any injury to people or property resulting from any ideas, methods, instructions or products referred to in the content.

