Article

Distributed Optimization Strategy for New Energy Stations and Energy Storage Stations Considering Multiple Time Scales

1
Yunnan Power Dispatching Control Center of China Southern Power Grid, Kunming 650011, China
2
Xu Ji Electric Co., Ltd., Xuchang 461000, China
*
Author to whom correspondence should be addressed.
Energies 2024, 17(19), 4923; https://doi.org/10.3390/en17194923
Submission received: 2 September 2024 / Revised: 21 September 2024 / Accepted: 29 September 2024 / Published: 1 October 2024
(This article belongs to the Section D: Energy Storage and Application)

Abstract

:
The “dual carbon” goal has made it a mainstream trend for new energy stations (NESs) and energy storage stations (ESSs) to jointly participate in market regulation. This paper proposes a multiple time scale distributed optimization method for NESs and ESSs based on the alternate direction multiplier method (ADMM). By first considering the uncertainty of new energy output and the volatility of electricity market prices, a multi time scale revenue model is constructed for day-ahead, intraday, and real-time markets. Then, the objective function is built by maximizing the comprehensive market revenues and is simplified using the synergistic effect of NESs and ESSs. Next, the simplified objective function is solved by the ADMM, and the revenues are maximized while each energy meets the relevant constraints. Lastly, the 33-node network topology is used to illustrate the feasibility of the proposed method. The simulation results show that after optimization, the output of NESs and ESSs can coordinate work in day-ahead, intraday, and real-time markets, while the abandonment power of wind and light is significantly improved.

1. Introduction

Under the role of the “dual carbon” goal, the full development and utilization of renewable clean energy has become a consensus for social development [1]. In the early power grids, renewable clean energy sources were also used as a resource for power generation, but due to limited technology their access was not significant. With the increasingly improved performance of the power grid, the control technology of renewable clean energy generation has also continuously improved. All kinds of renewable clean energy are now used to generate electricity that reduces the pollution caused by fossil energy power generation and meets people’s normal electricity needs [2].
When a large amount of renewable energy is connected to a power system, it will have a certain impact on the normal operation of the power system. Therefore, there is a need for the unified management of the grid connection for renewable energy generation. The NES contains all the equipment to merge wind power, photovoltaic (PV) power, battery storage, etc., and is the best platform to achieve grid-connected management and to control new energy which has been rapidly developed in recent years [3].
At present, the NES has many achievements both domestically and internationally. In [4,5,6], the longitudinal protection of the transmission lines of new energy stations was studied using different methods. In [7], by using a synthetic inertia block on photovoltaic power plants, a frequency algorithm was proposed to solve the frequency regulation problem in the power system. In [8], a hybrid programming method was proposed to optimize photovoltaic power plants containing energy storage. In [9], the problem of flexible DC high-frequency oscillation in the connection of isolated new energy stations was studied. In [10], the short-circuit ratio problem of multiple NESs was studied, which provided a calculation method for quantitative evaluation indicators for a large amount of integration of new energy. In [11], an energy storage operation model based on centralized management operators was investigated to solve the asymmetric decision problem in new energy power plants under bounded rationality. In [12], the feed-in tariff mechanism for NESs was studied by considering the market functioning environment. In [13], the modeling problem of NESs was introduced. In [14], the optimization operation of energy storage systems was studied using a secondary frequency regulation strategy. In [15], an adjusting assessment indicators method was studied according to the scarcity of peak shaving resources. In [12], the pricing mechanism of NESs was investigated based on a structural change analysis of new energy power generation costs. In [16], a cooperative model for NESs participating in the electric green certificate market was designed. However, although the problems of new energy stations have been studied from different perspectives, they have not included the coordination between NESs and ESSs.
With the continuous development of new energy power systems, the level of energy storage technology continues to improve. In the existing literature, research on energy storage has also made great progress. In [17,18], electric vehicles were used as the research object, and the optimization and energy management of photovoltaic power plants with energy storage were investigated to minimize energy costs. In [19], issues in the improvement of voltage distribution and peak load transfer were analyzed to optimize energy storage stations in distribution networks. In [20], a self-describing model was proposed for the grid connection of battery energy storage stations in response to the hierarchical requirements of information flow. In [21], fair generation technology was used to study the scheduling problem in energy power plants. In [22], a two-layer game model was created to deal with the individual cooperation problem in energy storage configuration. In [23], the hybrid optimization problem of microgrids was addressed by using energy storage as an energy supplement. In [24], a control method for virtual synchronous machines was studied using photovoltaic power plants which contained batteries as the research object. In [25], by considering frequency adjustment costs and the state of charge recovery, an optimization method was proposed for a multiple-battery system. In [26], a distributed method was proposed to deal with the problem of 5G base stations. In [27], by describing the charging profile of fast charging stations as a normal distribution, a method for enhancing the economic efficiency of charging stations was investigated. In [28], an optimum design method was proposed for on-grid microgrids by minimizing annual operating costs. In [29], by considering the complementary impact of multi-wind plants, a hybrid energy storage scheme was proposed. It should be noted that the above achievements have created a detailed study of energy storage issues but have not addressed the coordination and control problems between NESs and ESSs, as well as the optimization problems between stations at multiple time scales.
Therefore, this paper presents a distributed optimization method for NESs and ESSs considering multiple time scales. By taking market revenues as the target, a multiple time scale model is constructed for three markets, and an objective function is established to maximize comprehensive market revenues. The ADMM is utilized to solve the simplified objective function. Finally, some simulation results indicate the rationality of the proposed method.
The paper is organized as follows: Section 2 consists of the formulation of the problem and includes the establishment of a model, constraint conditions and an objective function. Section 3 aims to solve the objective function, which is also the main body of the work. Section 4 contains some example analyses and finally, a conclusion is drawn in Section 5.

2. Problem Formulation

2.1. Model Establishment

NESs include power sources such as generators, wind power, PV power, and battery storage. The uncertainty of new energy output has a certain impact on the station’s revenue. The revenue of the station in day-ahead, intraday, and real-time markets is related to market electricity prices and power differences. The new energy station revenue model for the day-ahead market is as follows:
S q , t = λ q , t α q , t P qg , t + P qw , t + P qv , t + P qesd , t P qesc , t ,
where Sq,t and λq,t are the day-ahead market revenue and the market ESS electricity price at time t, respectively; αq,t is the allocation factor for market output; and Pqg,t, Pqw,t, Pqv,t, Pqesd,t and Pqesc,t are the power from the market generator, wind power, PV power, energy storage (ES) discharge, and ES charge, respectively.
Similarly, the intraday and real-time market revenue models are as follows:
S n , t = λ n , t α n , t P ng , t + P nw , t + P nv , t + P nesd , t P nesc , t ,
S s , t = λ s , t α s , t P sg , t + P sw , t + P sv , t + P sesd , t P sesc , t ,
where Sn,t, λn,t, αn,t, Png,t, Pnw,t, Pnv,t, Pnesd,t, and Pnesc,t are the ESS revenues, electricity prices, allocation factor, the power output of the generator, wind power, PV power, ES discharge, and ES charge for the intraday market at time t, respectively; Ss,t, λs,t, αs,t, Psg,t, Psw,t, Psv,t, Psesd,t and Psesc,t are the ESS revenues, electricity prices, allocation factor, the power output of the generator, wind power, PV power, ES discharge, and ES charge for the real-time market, respectively.
In addition, the three market allocation factors should meet 0 < αq,t < 1, 0 < αn,t < 1, 0 < αs,t < 1, and αq,t + αn,t + αs,t = 1.

2.2. Constraint Condition

The constraint condition mainly includes power balance constraints, generator output constraints, wind and photovoltaic output constraints, ES charge and ES discharge constraints, and state of charge constraints, and all markets need to meet the above constraints.
where
(1)
Power balance constraints
P load , t = P g , t + P w , t + P v , t + P esd , t P bw , t P bv , t P esc , t ,
where Pload,t, Pg,t, Pw,t, Pv,t, Pesd,t, Pbw,t, Pbv,t and Pesc,t are the load power, output power of the generator, wind power, PV, ES discharge, abandoned wind, abandoned light, and ES charge at time t, respectively.
(2)
Generator output constraint
P g , t , min P g , t P g , t , max ,
where Pg,t,min and Pg,t,max are the lower and upper limits of the generator output at time t.
(3)
Wind and photovoltaic output constraints
P w , t , min P w , t P w , t , max ,
P v , t , min P v , t P v , t , max ,
P wesc , t + P wpg , t P w , t ,
P vesc , t + P vpg , t P v , t ,
where Pw,t,min and Pv,t,min are the lower limits of wind power and PV power, respectively; Pw,t,max and Pv,t,max are the upper limits of wind power and PV power, respectively; Pwesc,t, Pwpg,t, are the wind charge power to the energy storage and to the power grid, respectively; and Pvesc,t and Pvpg,t are the PV charge power to the energy storage and to the power grid.
(4)
ES charge/discharge constraints
P esd , t , min P esd , t P esd , t , max ,
P esc , t , min P esc , t P esc , t , max ,
where Pesd,t,min and Pesc,t,min are the lower limits of ES discharge and ES charge power, respectively; Pesd,t,max and Pesc,t,max are the upper limits of ES discharge and ES charge power, respectively.
(5)
State of charge constraint
S soc , t = 1 η soc S soc , t 1 + η c P esc , t 1 P esd , t 1 η d ,
S soc , t , min S soc , t S soc , t , max ,
where Ssoc,t is the ES state; ηsoc, ηc, ηd, Ssoc,t,min and Ssoc,t,max are the ES loss coefficient, charge efficiency, discharge efficiency, and the lower and upper limits of the ES state, respectively.
The ES initial and final states are the same in a scheduling cycle, which is
S soc , 0 = S soc , T ,

2.3. Objective Function

Regardless of whether the new energy power stations participate in day-ahead, intraday, and real-time markets, we hope to achieve the best revenue. With the goal of establishing comprehensive market revenues, the following objective function is established:
max   S = S q , t + S n , t + S s , t s . t .       Equations . ( 4 ) ( 14 ) ,
Equation (15) includes the revenues of the three markets. The objective function is relatively complex and difficult to calculate. By processing the objective function, one can obtain
F q , t = P qg , t + P qw , t + P qv , t + P qesd , t P qesc , t ,
F n , t = P ng , t + P nw , t + P nv , t + P nesd , t P nesc , t ,
F s , t = P sg , t + P sw , t + P sv , t + P sesd , t P sesc , t ,
F t = F q , t + F n , t + F s , t   = i q , n , s P i g , t + P i w , t + P i v , t + P i esd , t P i esc , t   = f g , t + f w , t + f v , t + f esd , t f esc , t ,
where
f g , t = i q , n , s P i g , t ,   f w , t = i q , n , s P i w , t ,   f v , t = i q , n , s P i v , t ,   f esd , t = i q , n , s P i esd , t ,   f esc , t = i q , n , s P i esc , t
At this point, the objective function is equivalent to
min   F t = f g , t + f w , t + f v , t + f esd , t + f esc , t s . t .       Equations . ( 4 ) ( 14 ) ,
In Equation (20), fg,t fw,t, fv,t, fesd,t, and fesc,t are the negative values of the total power of generator output, wind power output, PV power output, ES discharge, and ES charge in day-ahead, intraday, and real-time comprehensive markets, respectively.
After simplification, the original objective function is equivalent to the power relationship between the power supply and ES in the three markets, which is also based on the multi-agent decision-making characteristics of the plant station and power station.

3. Solving the Objective Function

3.1. Alternate Direction Multiplier Method (ADMM)

The ADMM algorithm provides a framework for solving optimization problems with linear equality constraints, which allows us to decompose the original optimization problems into several relatively easy to solve sub-optimization problems for an iterative solution. This method has a fast processing speed and better convergence performance.
Consider the following optimization issues:
min   f 1 x 1 + f 2 x 2 s . t .   A 1 x 1 + A 2 x 2 = b ,
where f1(x1) and f2(x2) are two subproblems to be optimized, x1 and x2 are two decision variables, and A1, A2 and b are coupling constraint matrices.
By introducing Lagrangian multipliers λ, one can build an augmented Lagrangian function:
L ρ x 1 , x 1 , λ = f 1 x 1 + f 2 x 2 + λ T A 1 x 1 + A 2 x 2 b + ρ 2 A 1 x 1 + A 2 x 2 b 2 2 ,
where ρ > 0 is a penalty factor.
The iterative optimization process is
x 1 k + 1 = arg min x 1 L ρ x 1 , x 2 k , λ k ,
x 2 k + 1 = arg min x 2 L ρ x 1 k , x 2 , λ k ,
λ k + 1 = λ k + ρ A 1 x 1 k + 1 + A 2 x 2 k + 1 b ,
It can be seen that the ADMM decomposes a complex problem into several subproblems and obtains the global optimal solution of the original problem by solving the solutions of the subproblems. In the process of solving subproblems, only one subproblem is solved at a time, while the other subproblem is waiting. After the two subproblems are solved, a shared iteration is carried out. During each iteration, the most recent value from the previous iteration is used.
This paper takes comprehensive market revenues as the objective, and the objective function becomes the power output problem of power supply and ES after simplification. Therefore, the ADMM can be utilized to decompose the objective function to obtain the optimization subproblem of NESs and ESSs.

3.2. Distributed Optimization of NESs

In order to maximize the revenue of NESs, it is necessary to comprehensively consider the output of the generator, wind power, PV power, and the ES charge and ES discharge situation in the three markets. The objective function is equivalent to minimizing the total negative output values of the generators, wind power and PV power in the comprehensive market, with the decision quantity being the demand for ES charge and ES discharge power.
min   f c , t = f g , t + f w , t + f v , t + ϕ c , t ,
ϕ c , t = λ 1 t = 1 T P esc , t , ne k P esc , t , k + λ 2 t = 1 T P esd , t , ne k P esd , t , k         + ρ 1 2 P esc , t , ne k P esc , t , k 2 2 + ρ 2 2 P esd , t , ne k P esd , t , k 2 2 ,
where φc,t is the penalty term; λ1 and λ2 are Lagrangian multipliers; T is a scheduling cycle; Pesc,t,ne(k), Pesd,t,ne(k), Pesc,t,(k) and Pesd,t,(k) are the demand for station ES charge power and ES discharge power, and the supply of charging and discharging power for the ESS, respectively. ρ1 and ρ2 are penalty factors.
The constraint conditions are Equations (4)–(14).

3.3. Distributed Optimization of ESSs

The revenues of ESSs are related to the ES charge and ES discharge power. The objective function is equivalent to the vector sum of the ES charge and ES discharge in the comprehensive market, and the decision quantity is the supply power of ES charge and ES discharge.
min   f c , t = f esd , t f esc , t + ϕ es , t ,
ϕ es , t = λ 1 t = 1 T P esc , t , ne k + 1 P esc , t , k + λ 2 t = 1 T P esd , t , ne k + 1 P esd , t , k         + ρ 1 2 P esc , t , ne k + 1 P esc , t , k 2 2 + ρ 2 2 P esd , t , ne k + 1 P esd , t , k 2 2 ,
where φes,t is the penalty term, and Pesc,t,ne(k+1), Pesd,t,ne(k+1), Pesc,t,(k) and Pesd,t,(k) are the demand for ES charge and ES discharge power in the station and the supply of ES charge and ES discharge power, respectively.
The constraint conditions are Equations (10)–(14).
The ADMM iteration process is
λ 1 k + 1 = λ 1 k + ρ 1 P esc , t , ne k P esc , t , k ,
λ 2 k + 1 = λ 2 k + ρ 2 P esd , t , ne k P esd , t , k ,
The convergence condition is
P esc , t , ne k P esc , t , k 2 2 ξ P esd , t , ne k P esd , t , k 2 2 ξ
where ξ is the residual limitation value.
The algorithm flow diagram is shown in Figure 1.

4. Example Analysis

4.1. Result Analysis

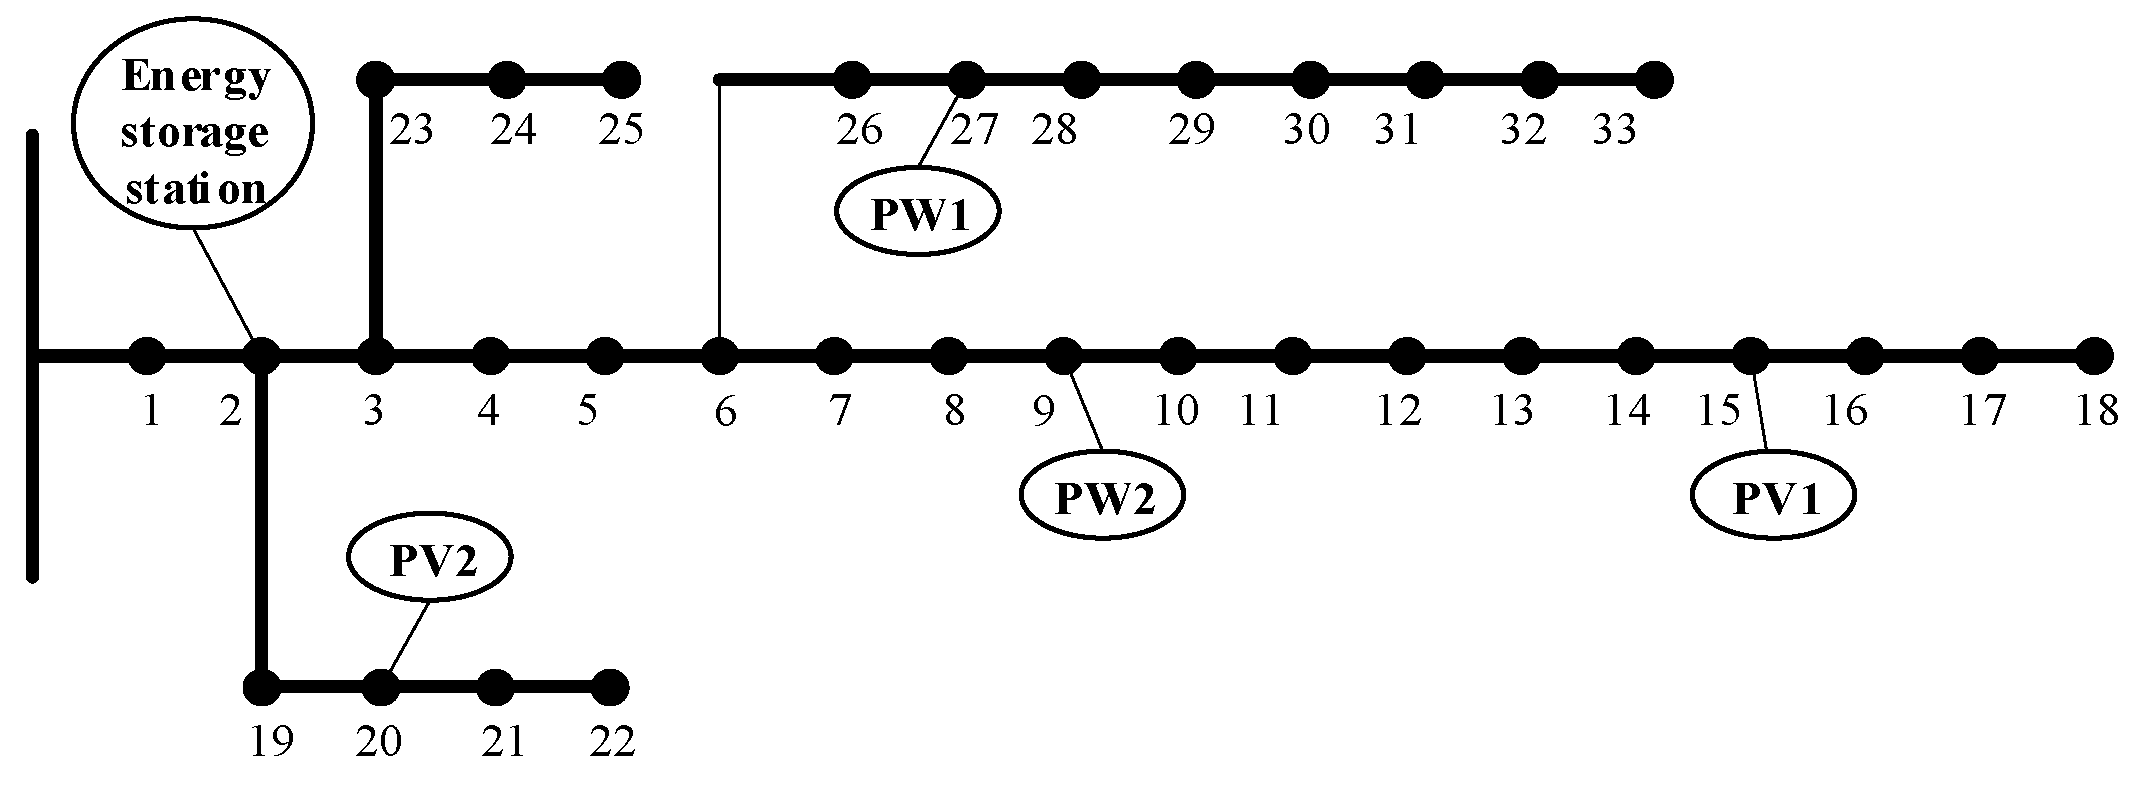
In this subsection, a power grid in a certain region of South China was taken as the research object to verify the effectiveness of the proposed method. The topology diagram is shown in Figure 2, which contains 33 nodes; node 2 is an ESS, node 9 and node 27 are wind power stations, and node 15 and node 20 are photovoltaic power stations. The capacity of the ESS is 50 MWh, the charge and discharge efficiency are both 0.95, the charge and discharge power is 10 MW, the initial energy storage state is 0.5, and the self-loss rate is 0.001.
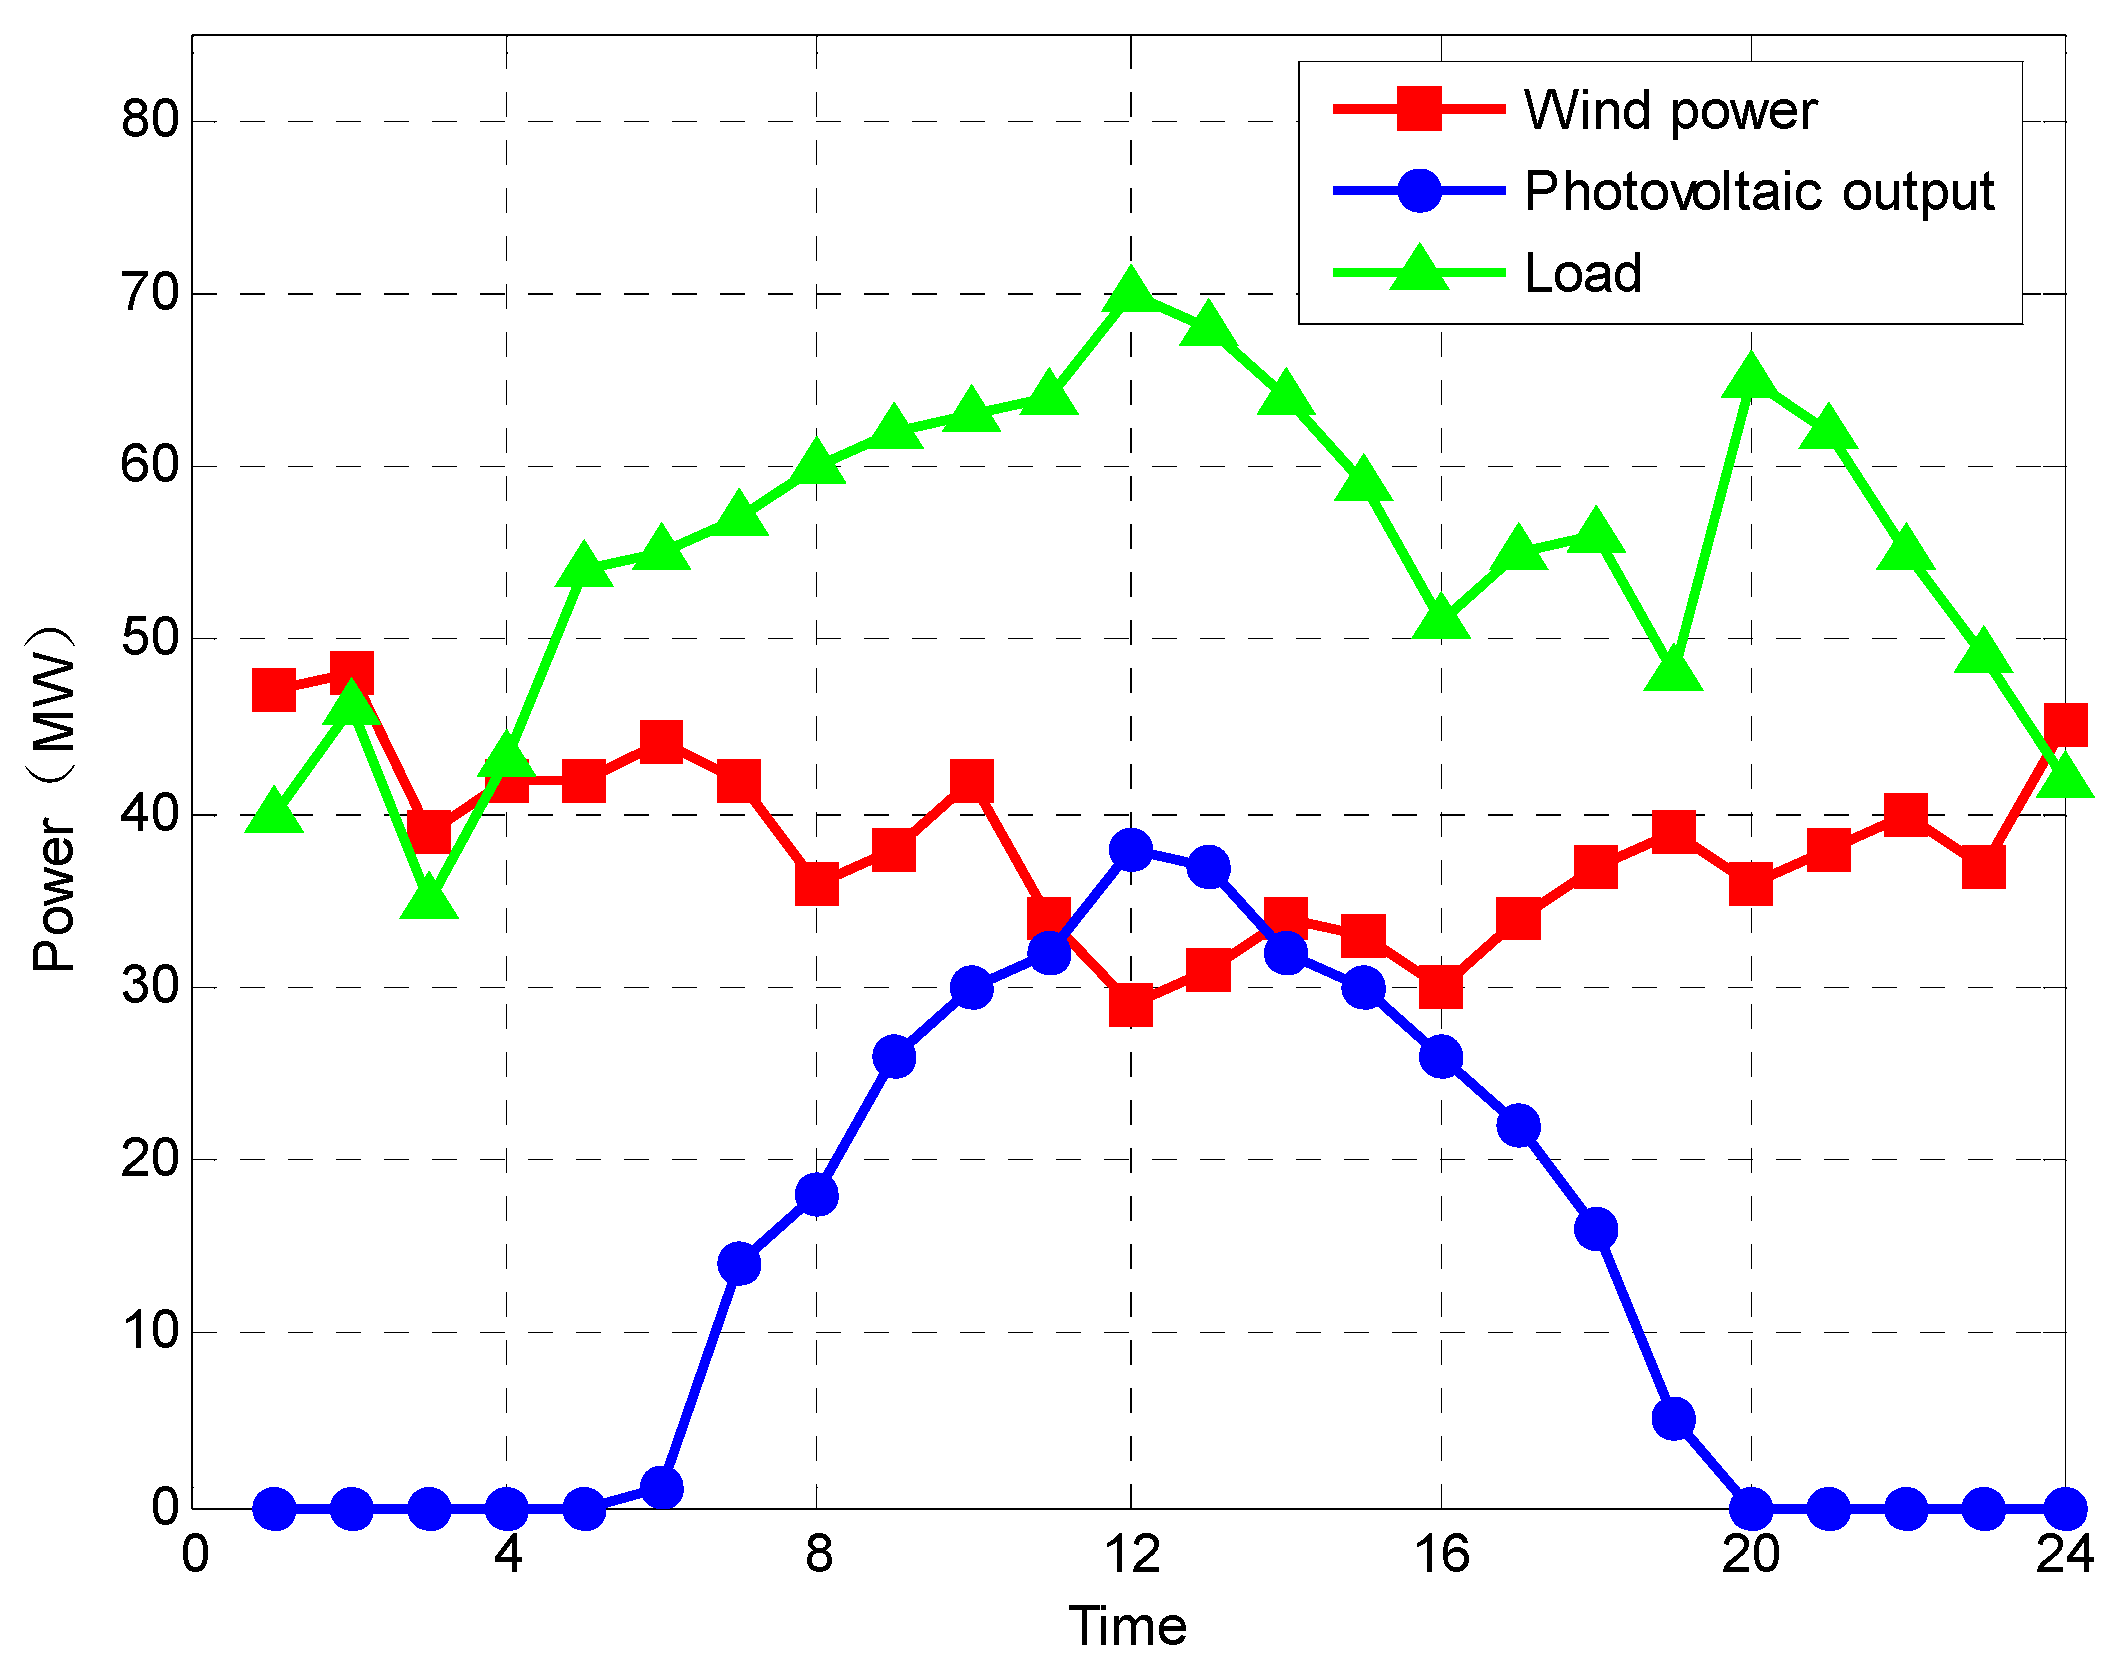
Taking the day-ahead market as an illustration, the scheduling cycle is 24 h, with 1 h as the time period. The power outputs of the wind, PV, and load data in this region are shown in Figure 3, which demonstrates that the wind power output exists throughout the whole scheduling cycle, although there are fluctuations. The PV power output reaches its maximum at noon, with zero output before 6 a.m. and after 8 p.m.
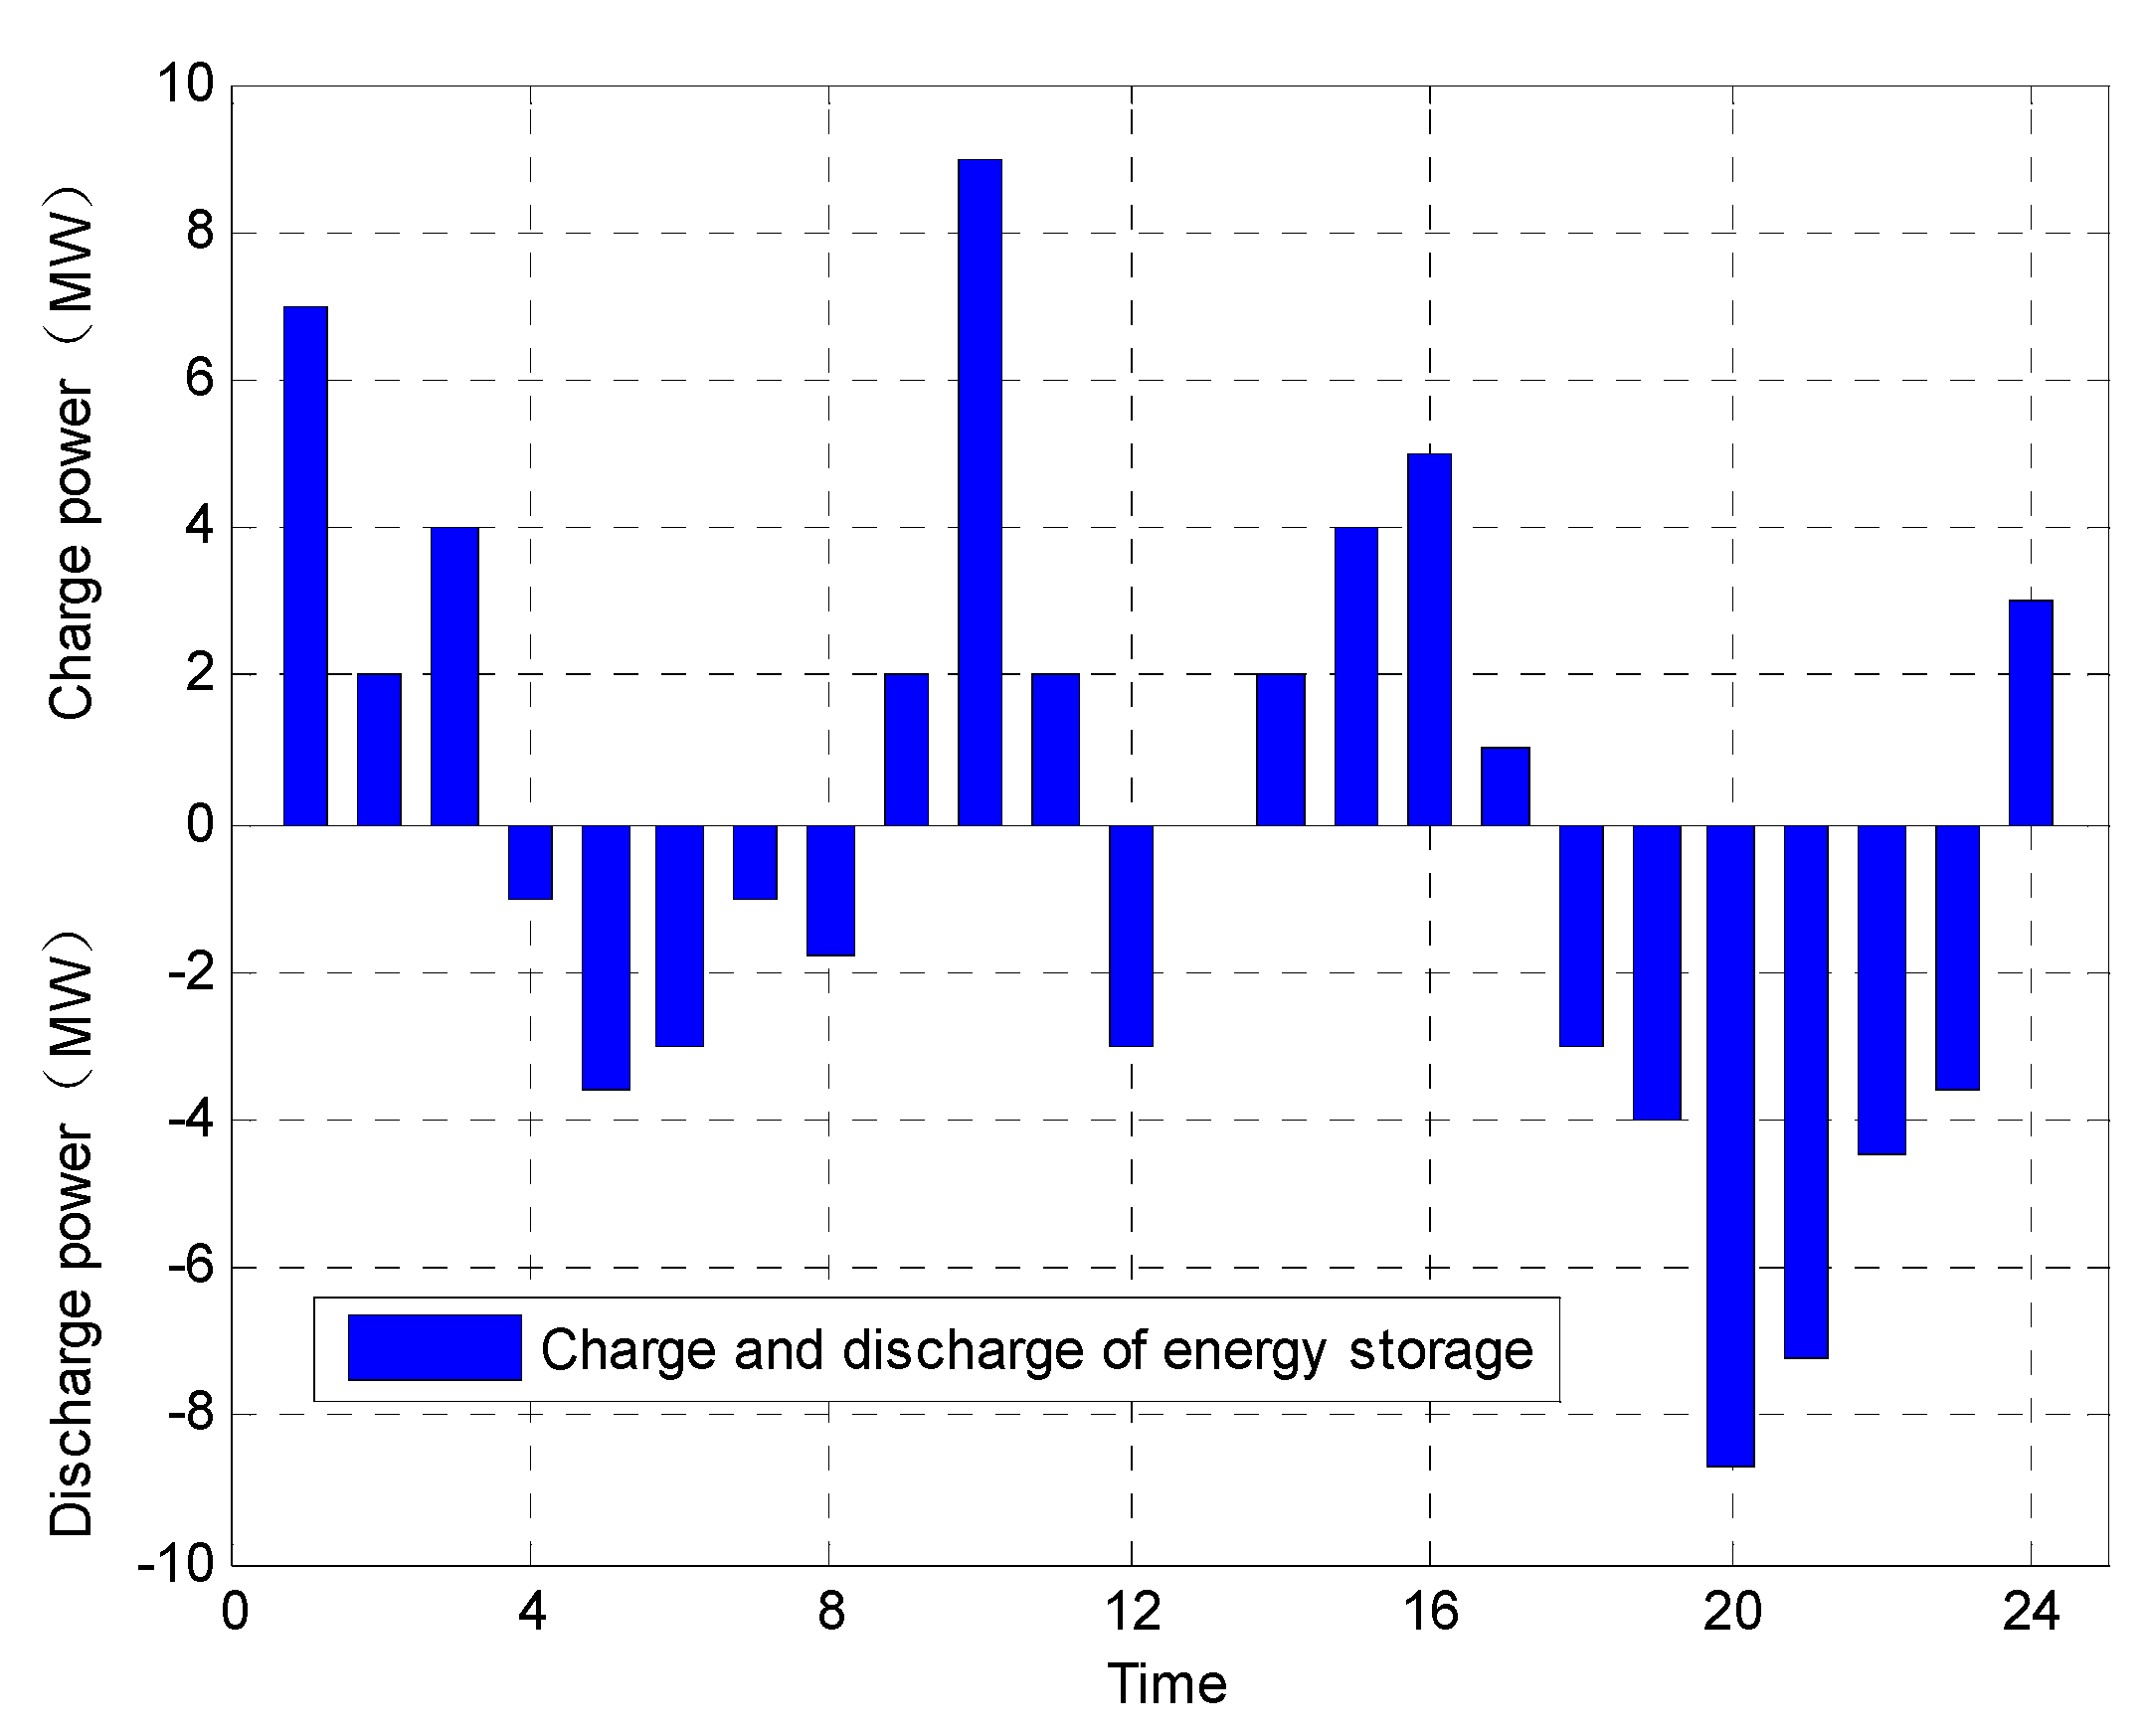
In order to facilitate renewable energy consumption, ESSs need to control charging and discharging to achieve power balance. The control results are given in Figure 4, which shows the states of ES charge and ES discharge at different time periods. The parts above the coordinate axis are the ES charge state; otherwise, it is the ES discharge state.
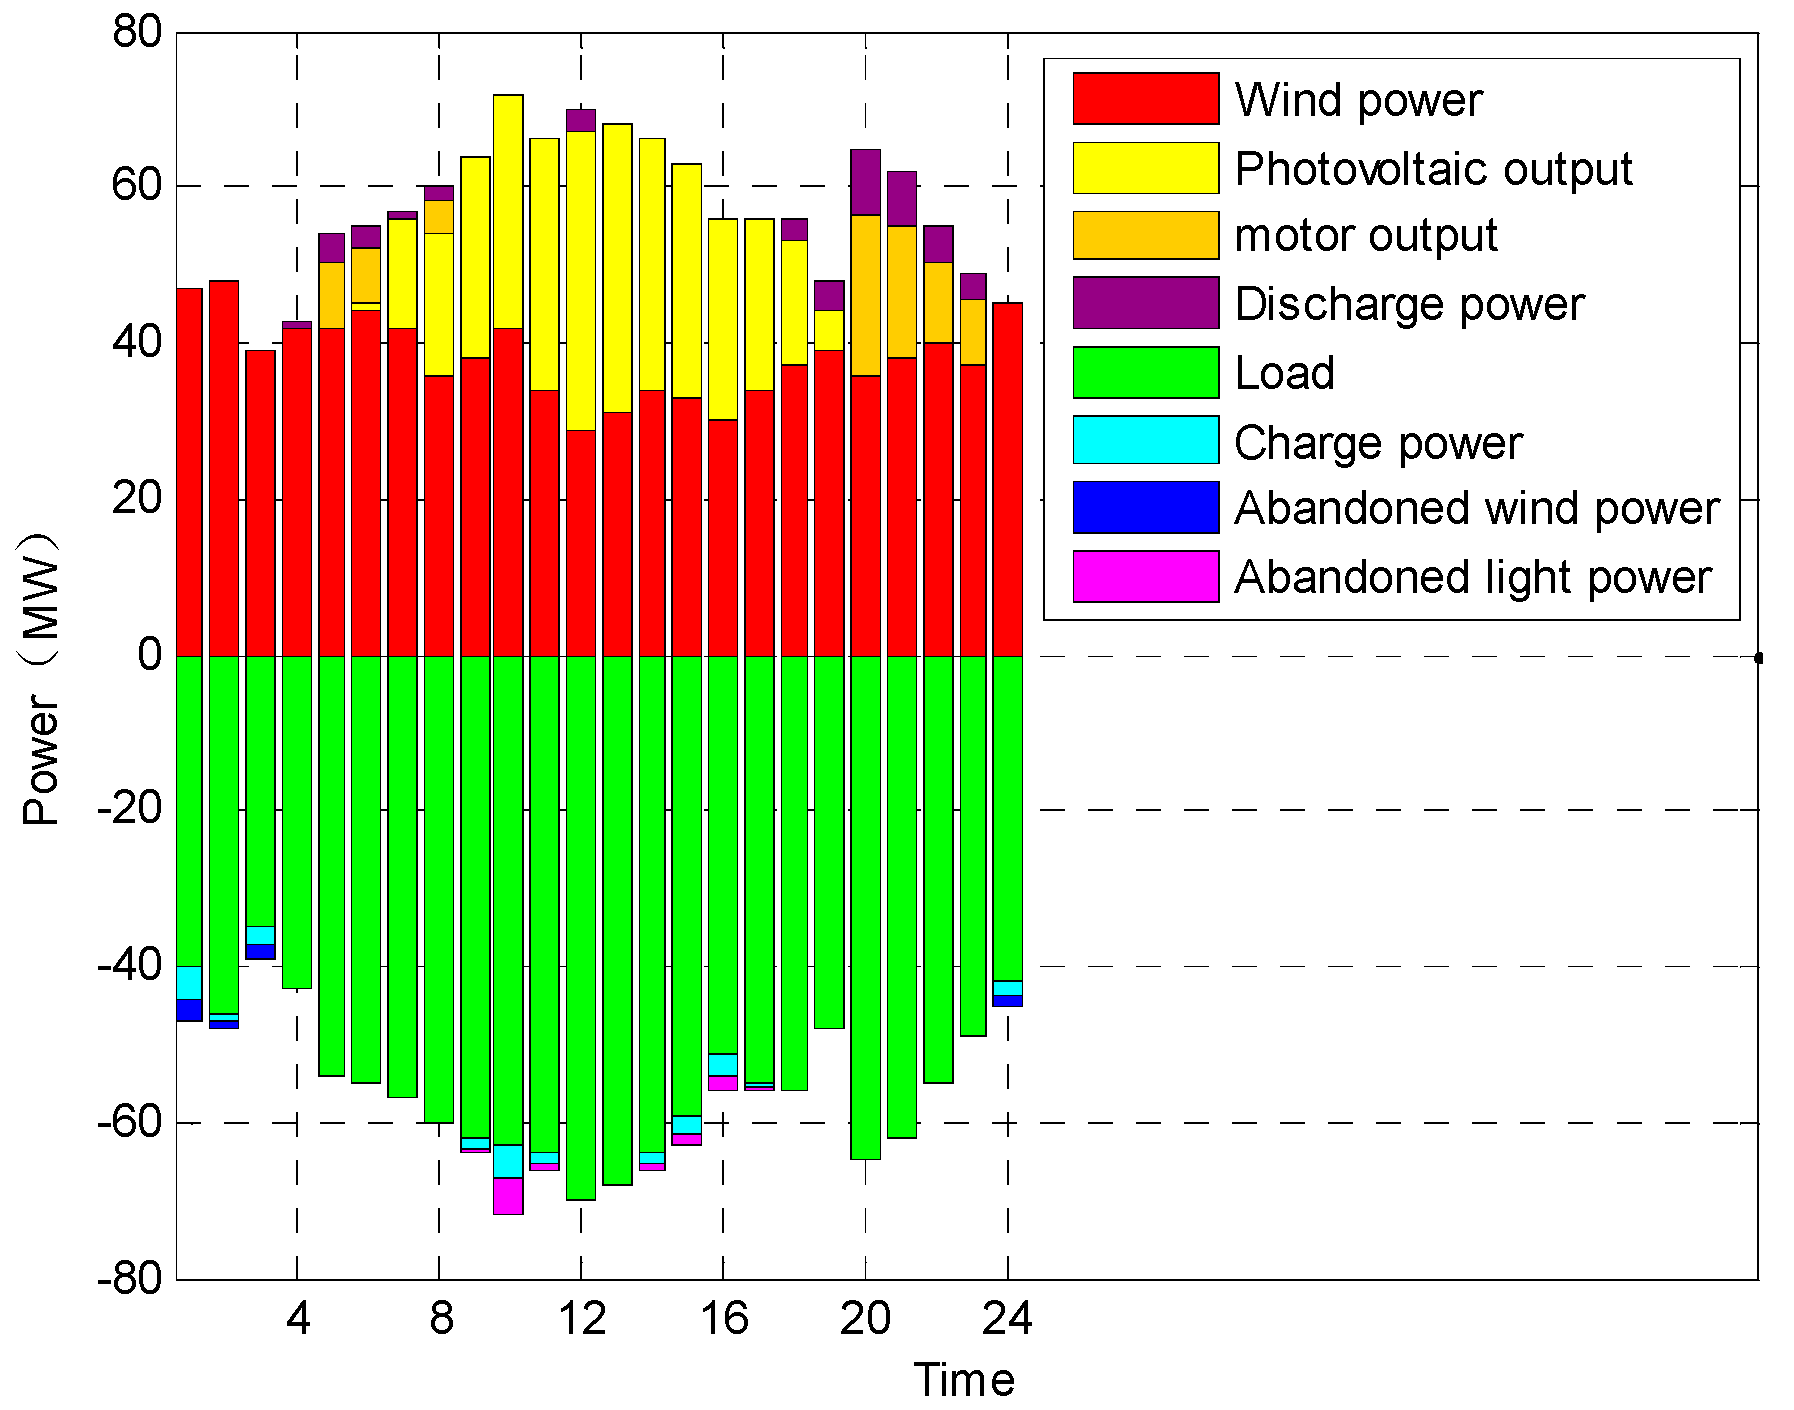
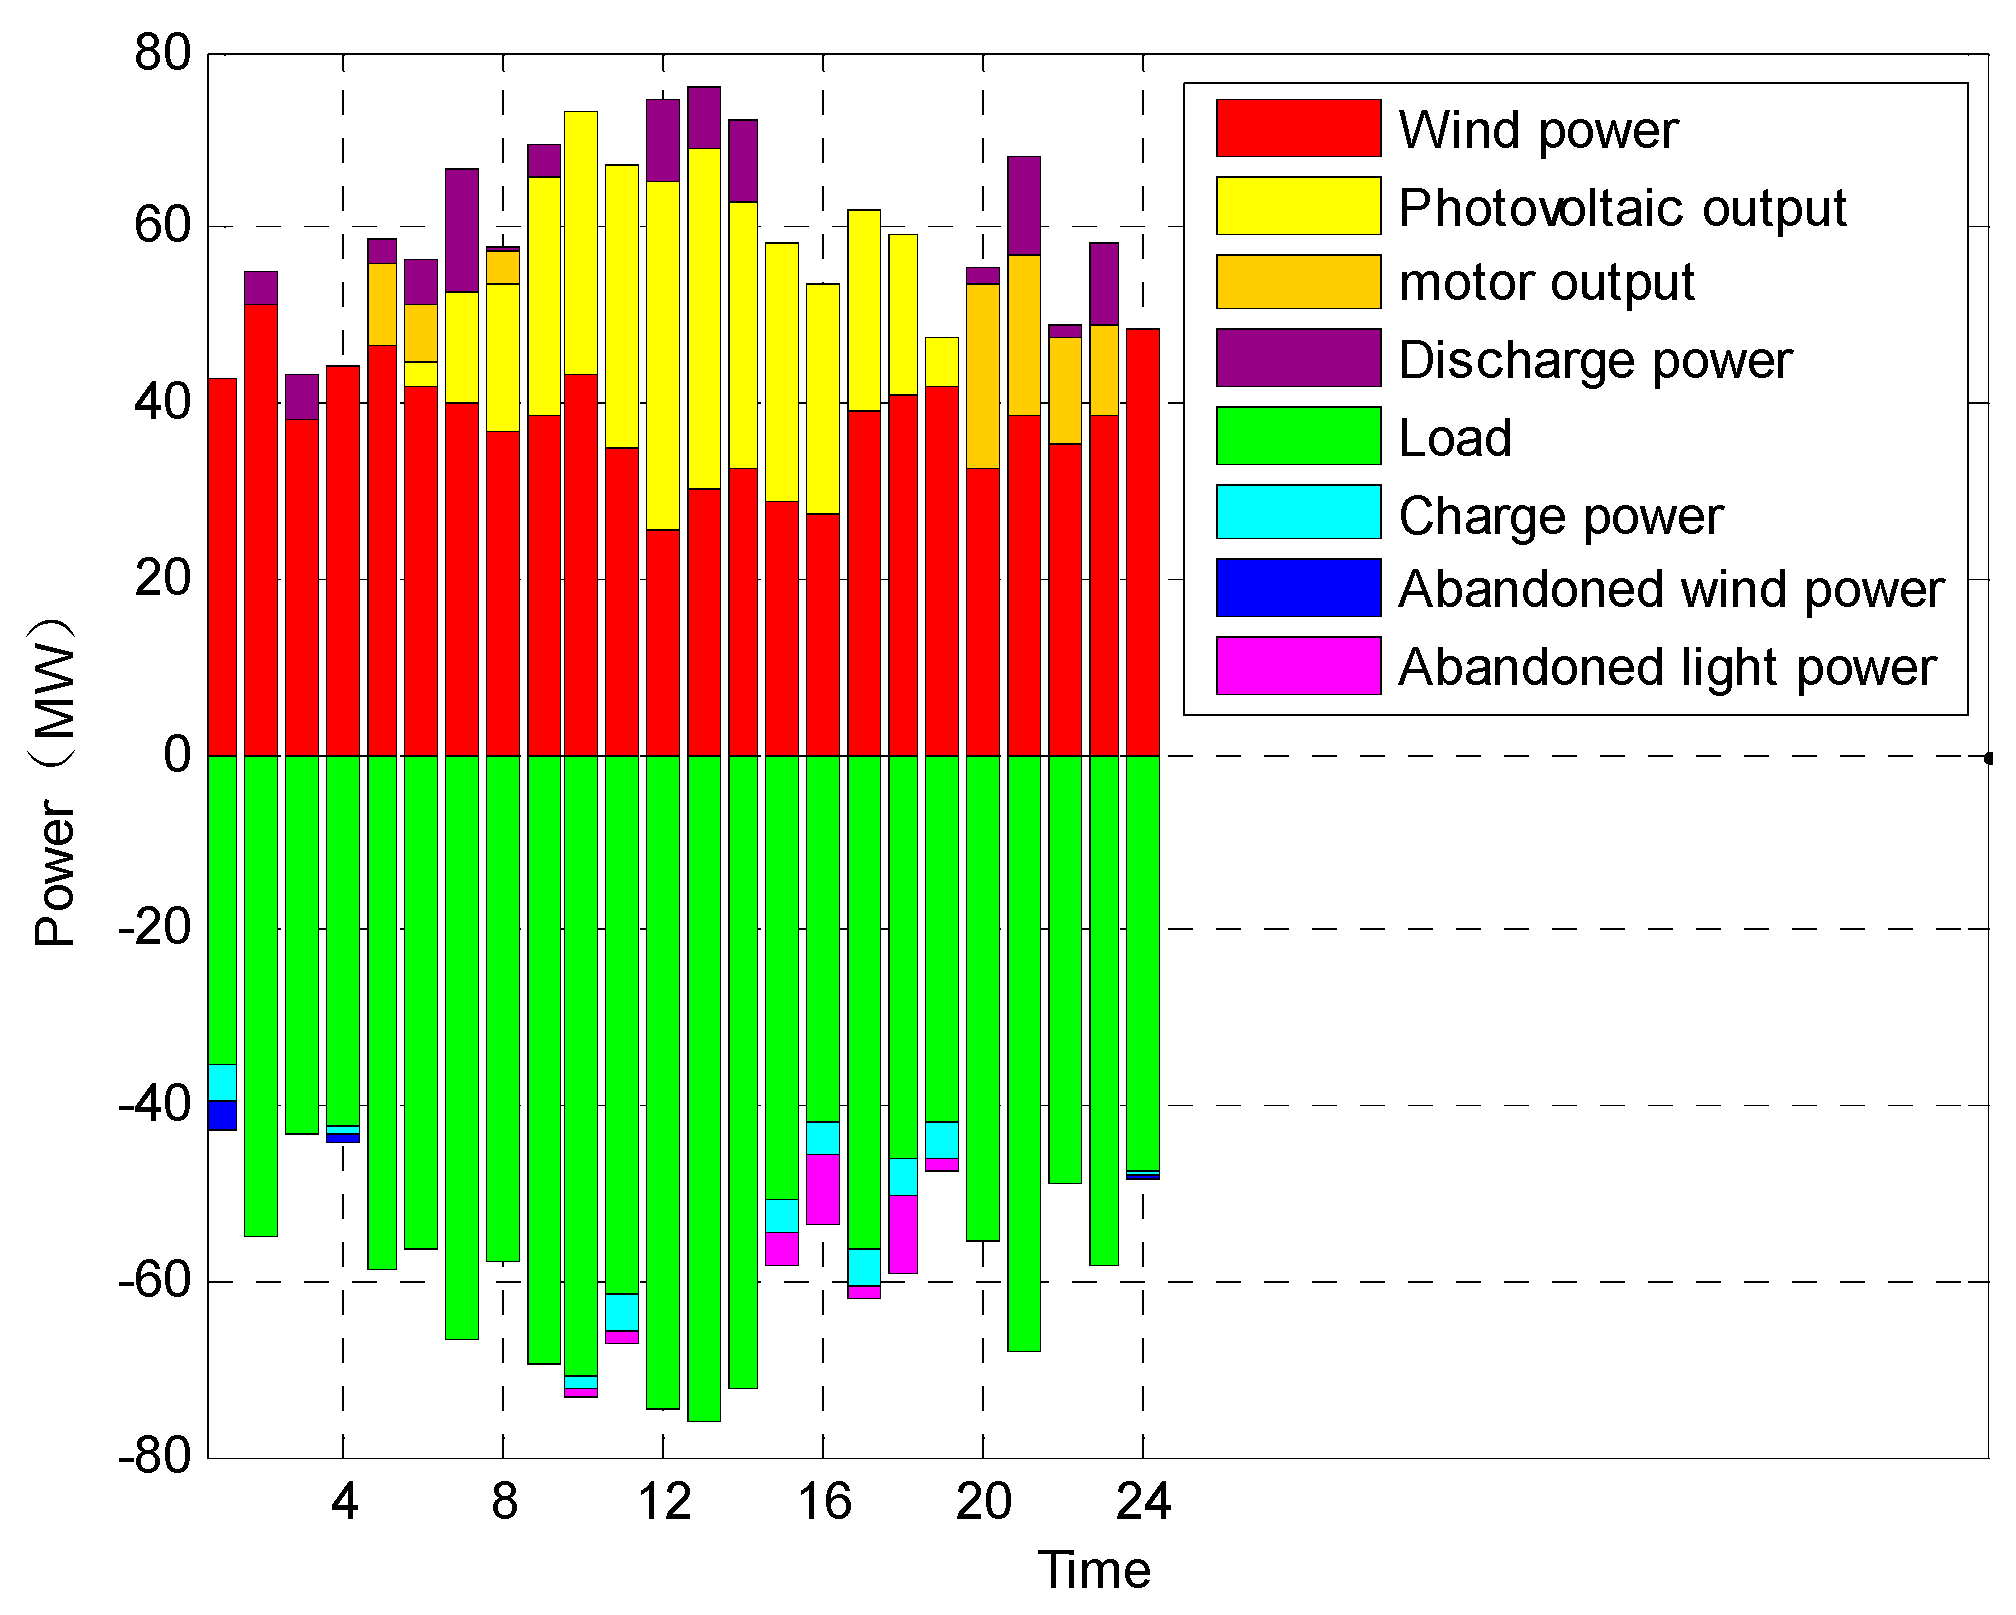
After processing the objective function by using the ADMM, the output of each energy source in the day-ahead market is shown in Figure 5. During the time period 1–3, the wind power output is relatively high, and the excess energy is used to charge the ES. When the ES is fully charged, there is still a certain amount of abandoned wind power. During the 9–11 period, there is a high comprehensive output of wind and photovoltaic power, resulting in the phenomenon of abandoned wind power. During the 20–23 period, the load is at a high value, and the photovoltaic output is 0. As the load demand cannot be met only by wind power output, the generator begins to operate and energy storage is discharged.
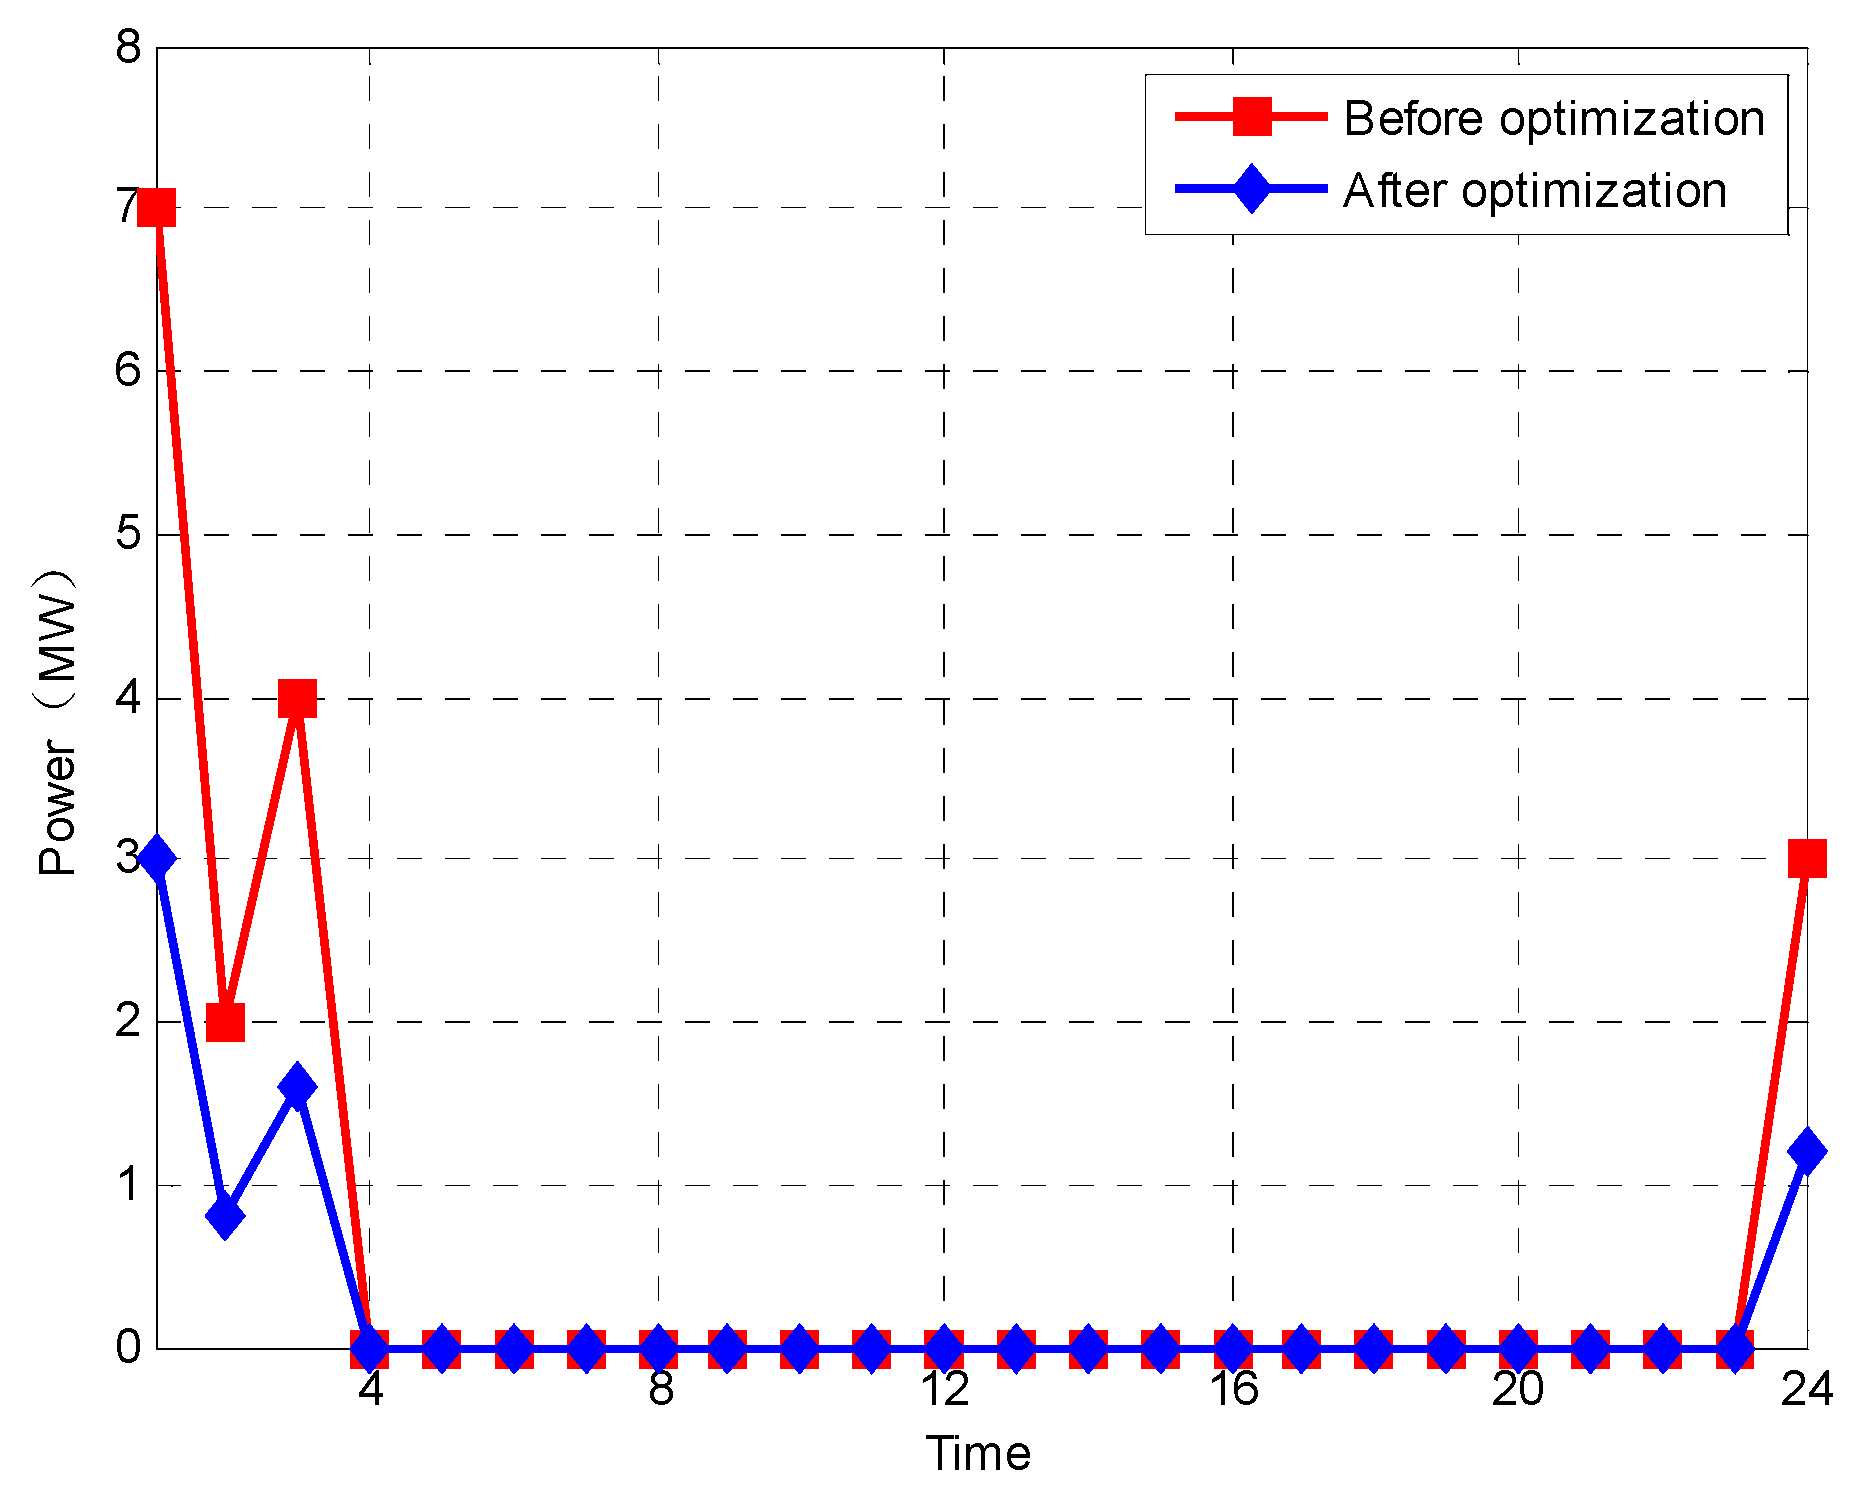
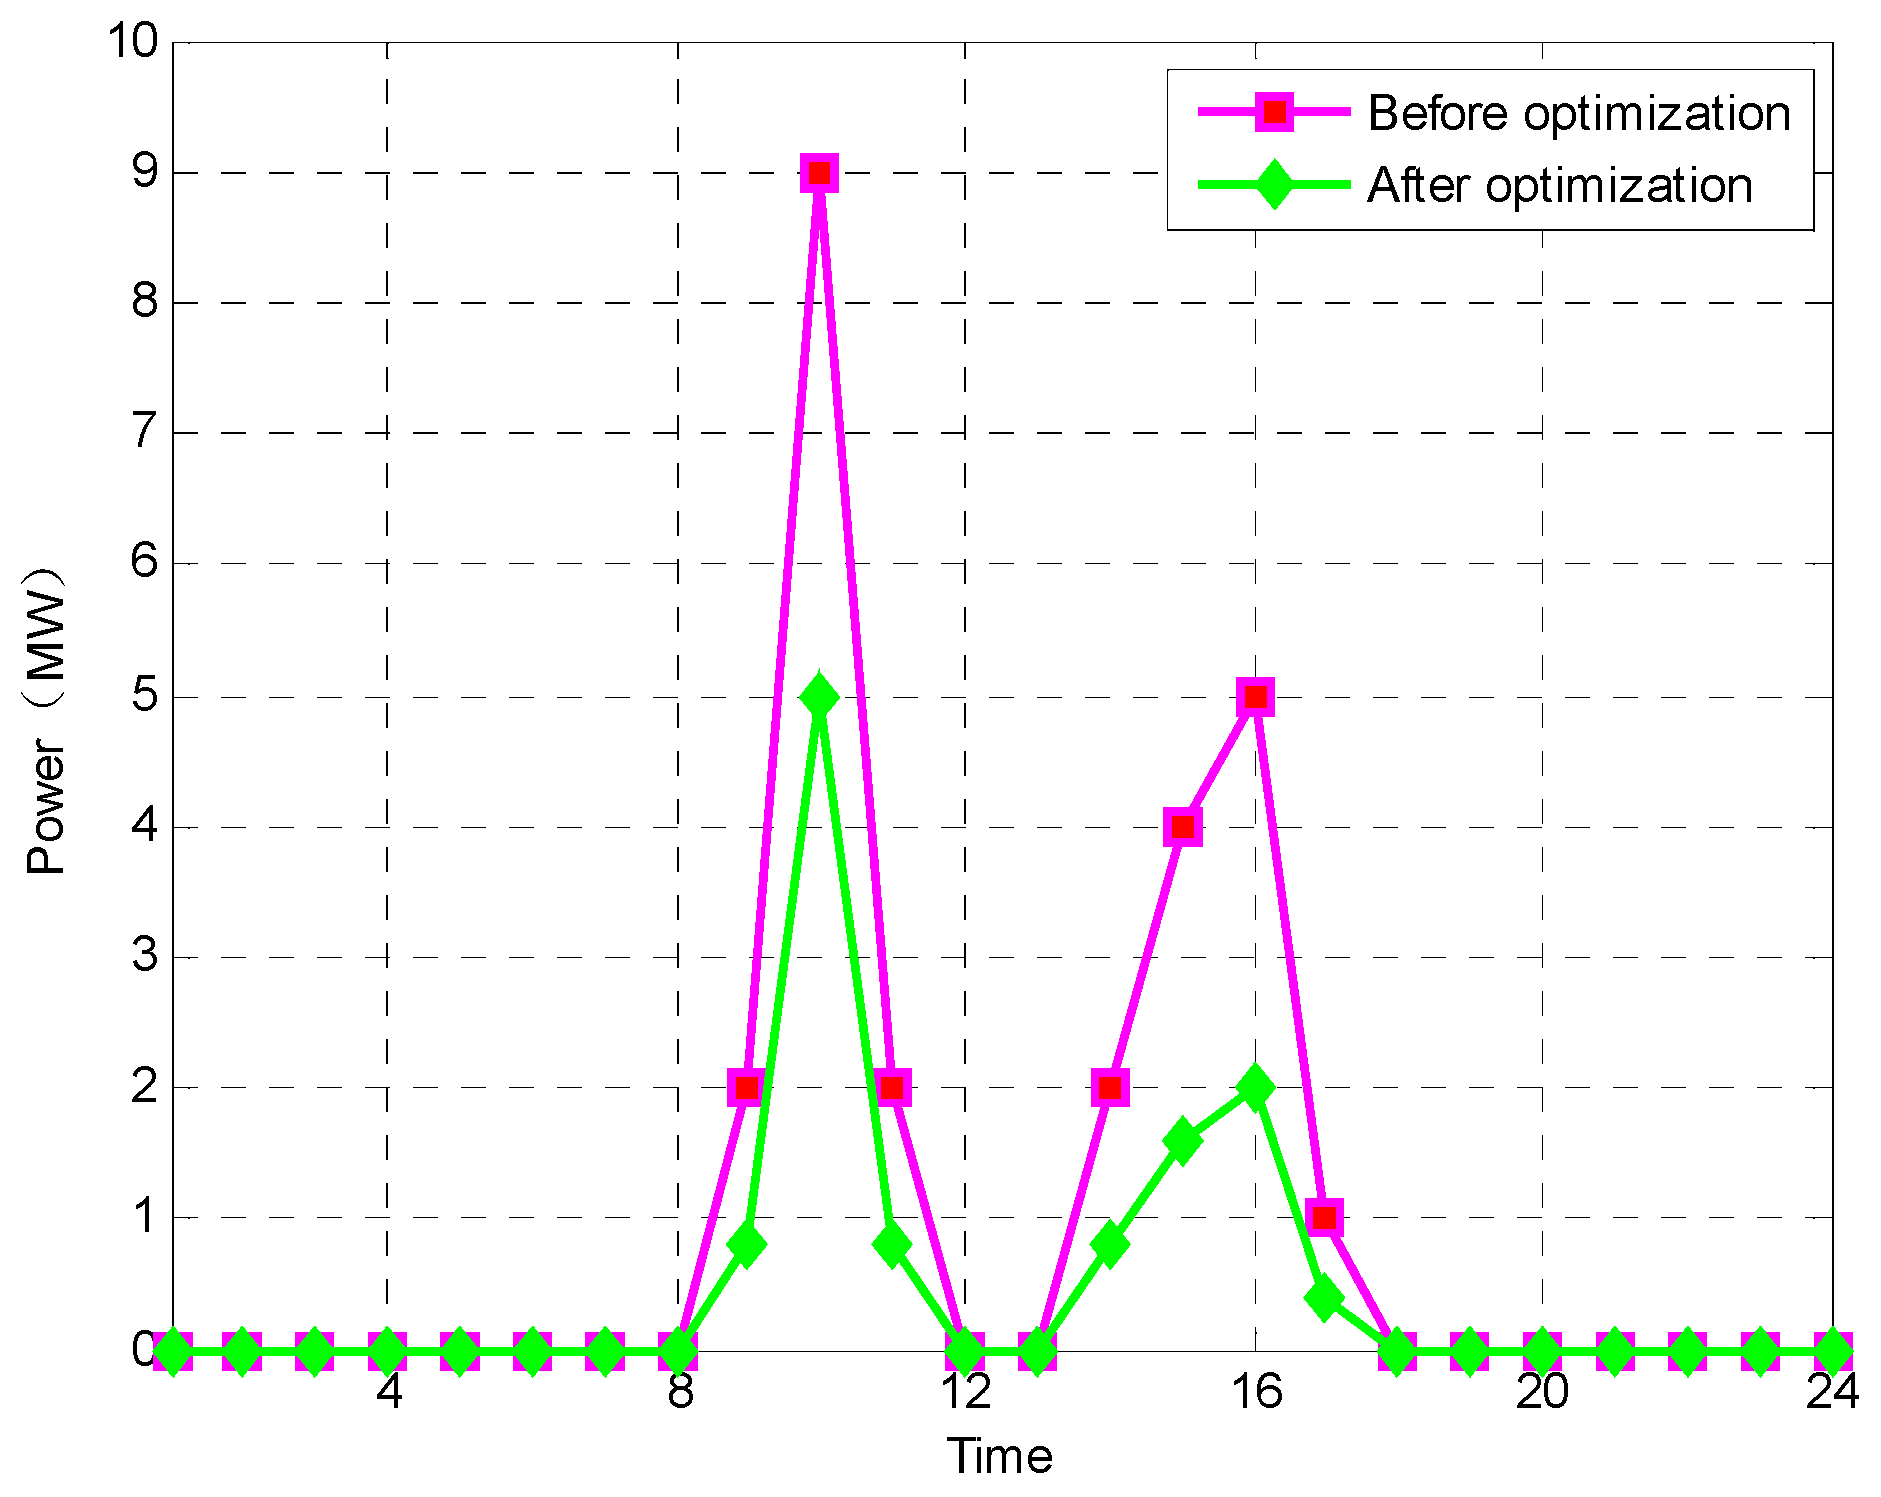
Figure 6 and Figure 7 show the comparison of abandoned wind light power before and after optimization, respectively. After optimization, the power of abandoned wind and light has significantly decreased, which further verifies that the proposed method can effectively promote new energy consumption.
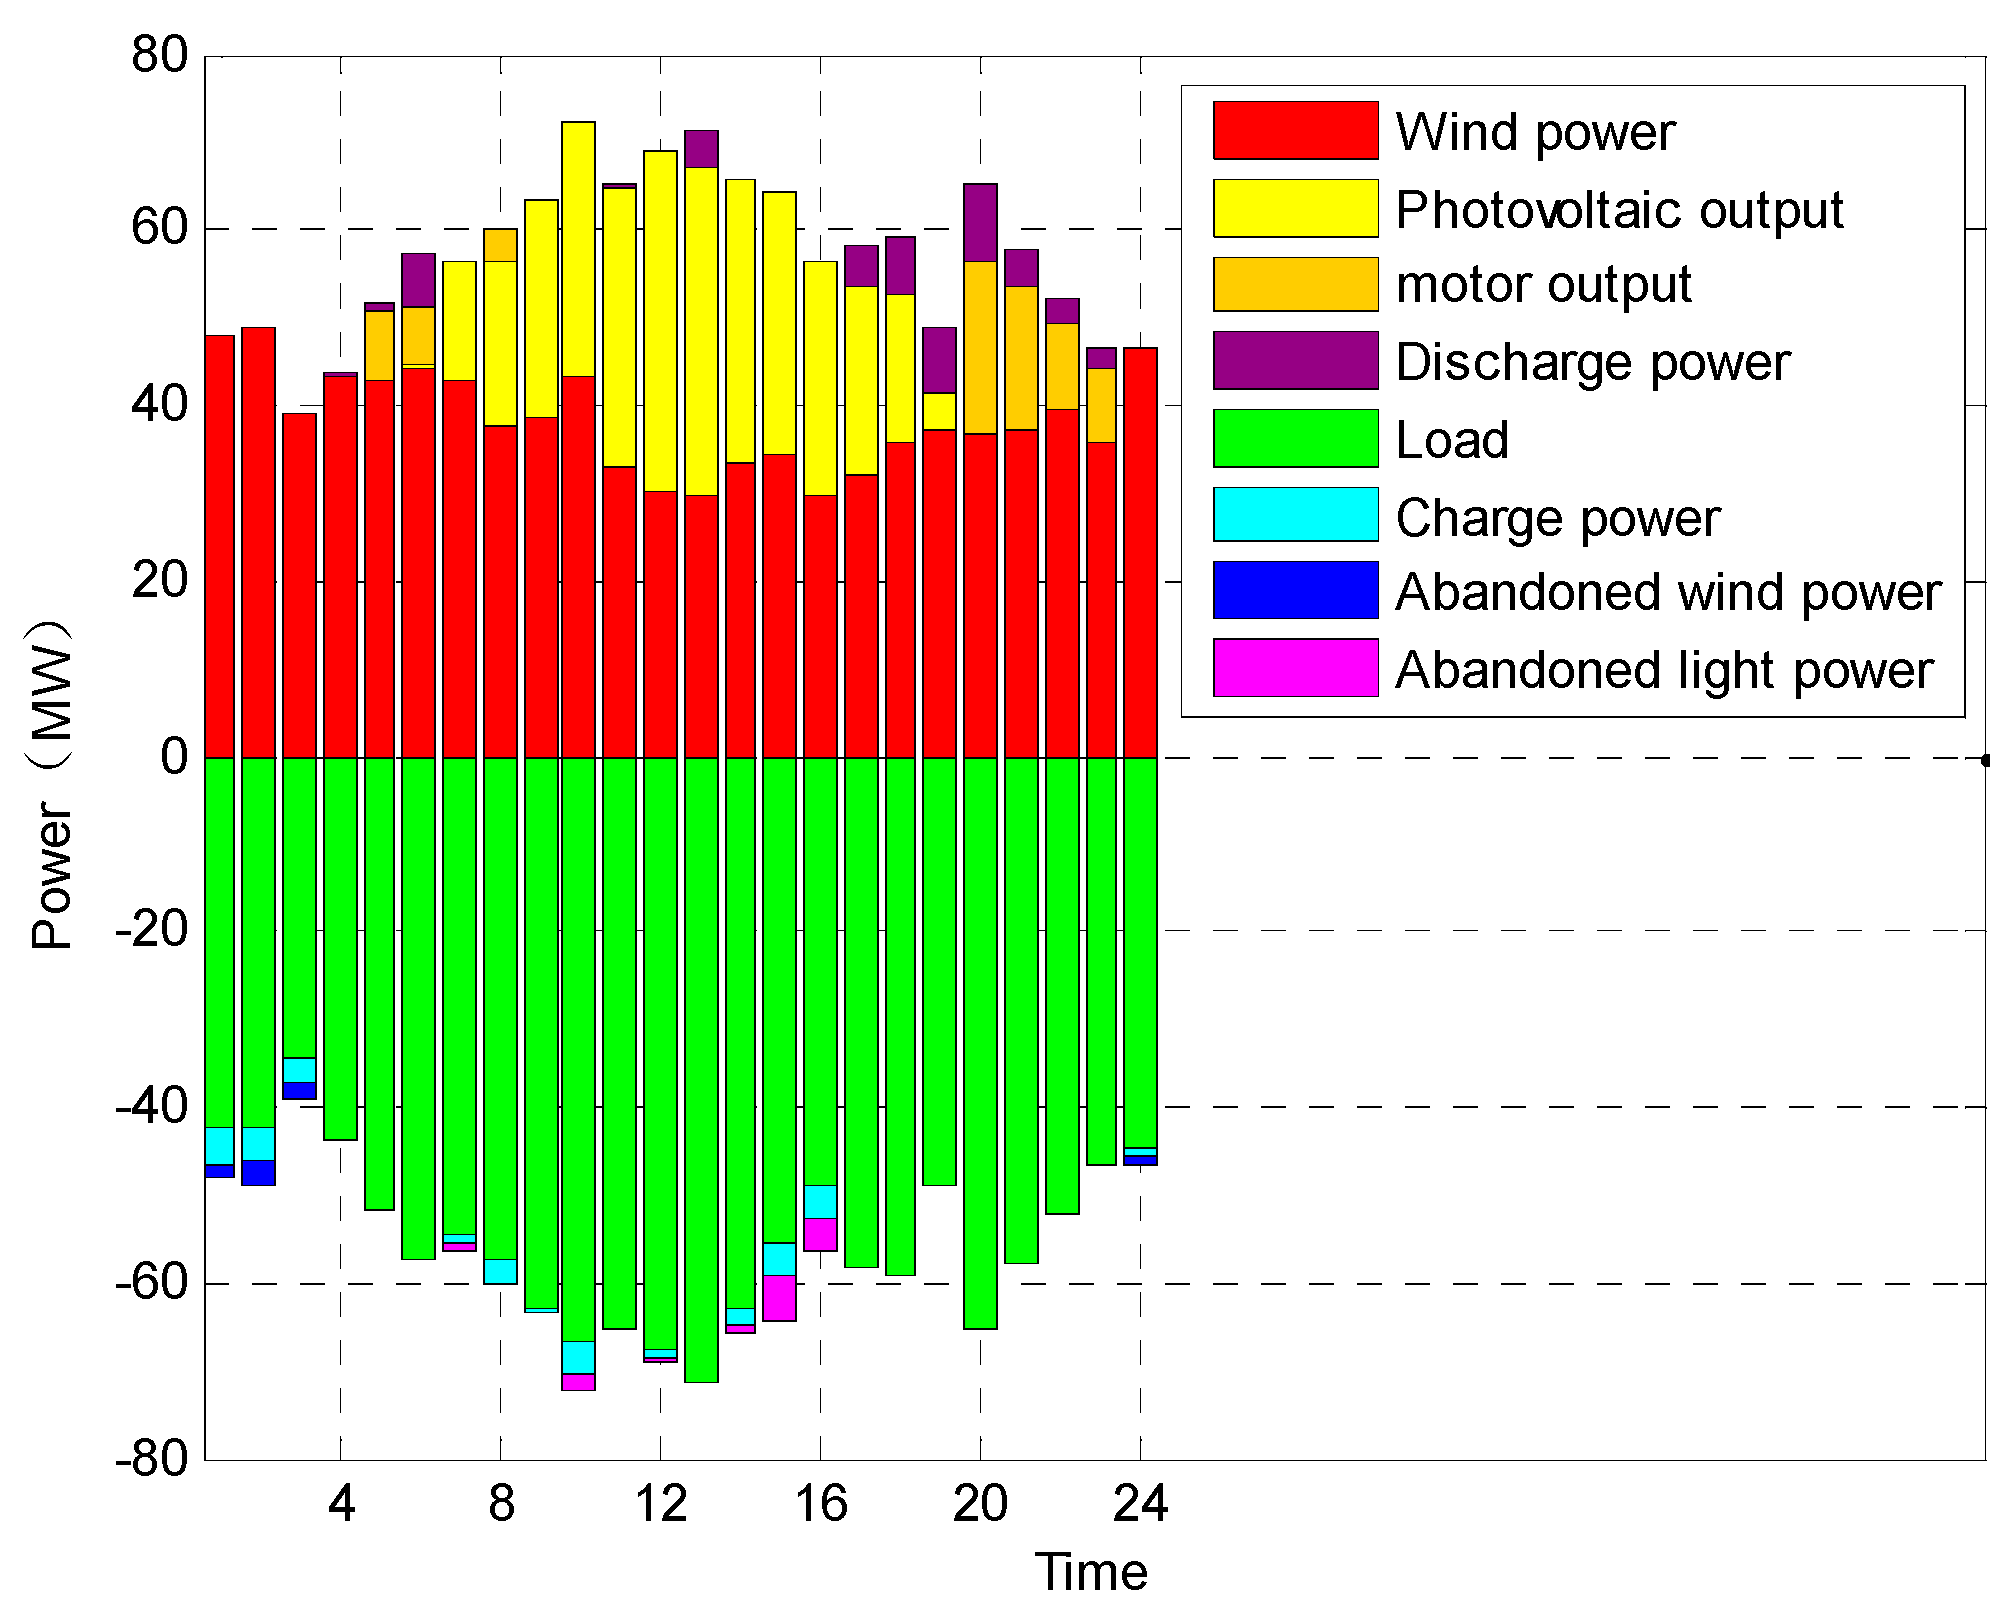
Using the same method, the intraday and real-time market energy outputs after optimization are shown in Figure 8 and Figure 9, respectively.
Compared to Figure 5, Figure 8 and Figure 9 show only slight changes, and the reason for this is the fluctuation in load, wind power, and PV power output in different markets. However, the overall trend in change is the same, which indicates that the proposed algorithm can be used in the above three markets. In addition, there exists the same conclusion between Figure 5, Figure 8 and Figure 9; that is, the ES is charged during low-load periods and discharged during peak-load periods, which can not only achieve effective economic operation of the power system but also promotes the utilization of renewable energy.

4.2. Revenue Analysis

Based on the time-of-use (TOU) electricity price provided in Table 1, the revenues of the three markets before and after optimization can be calculated.
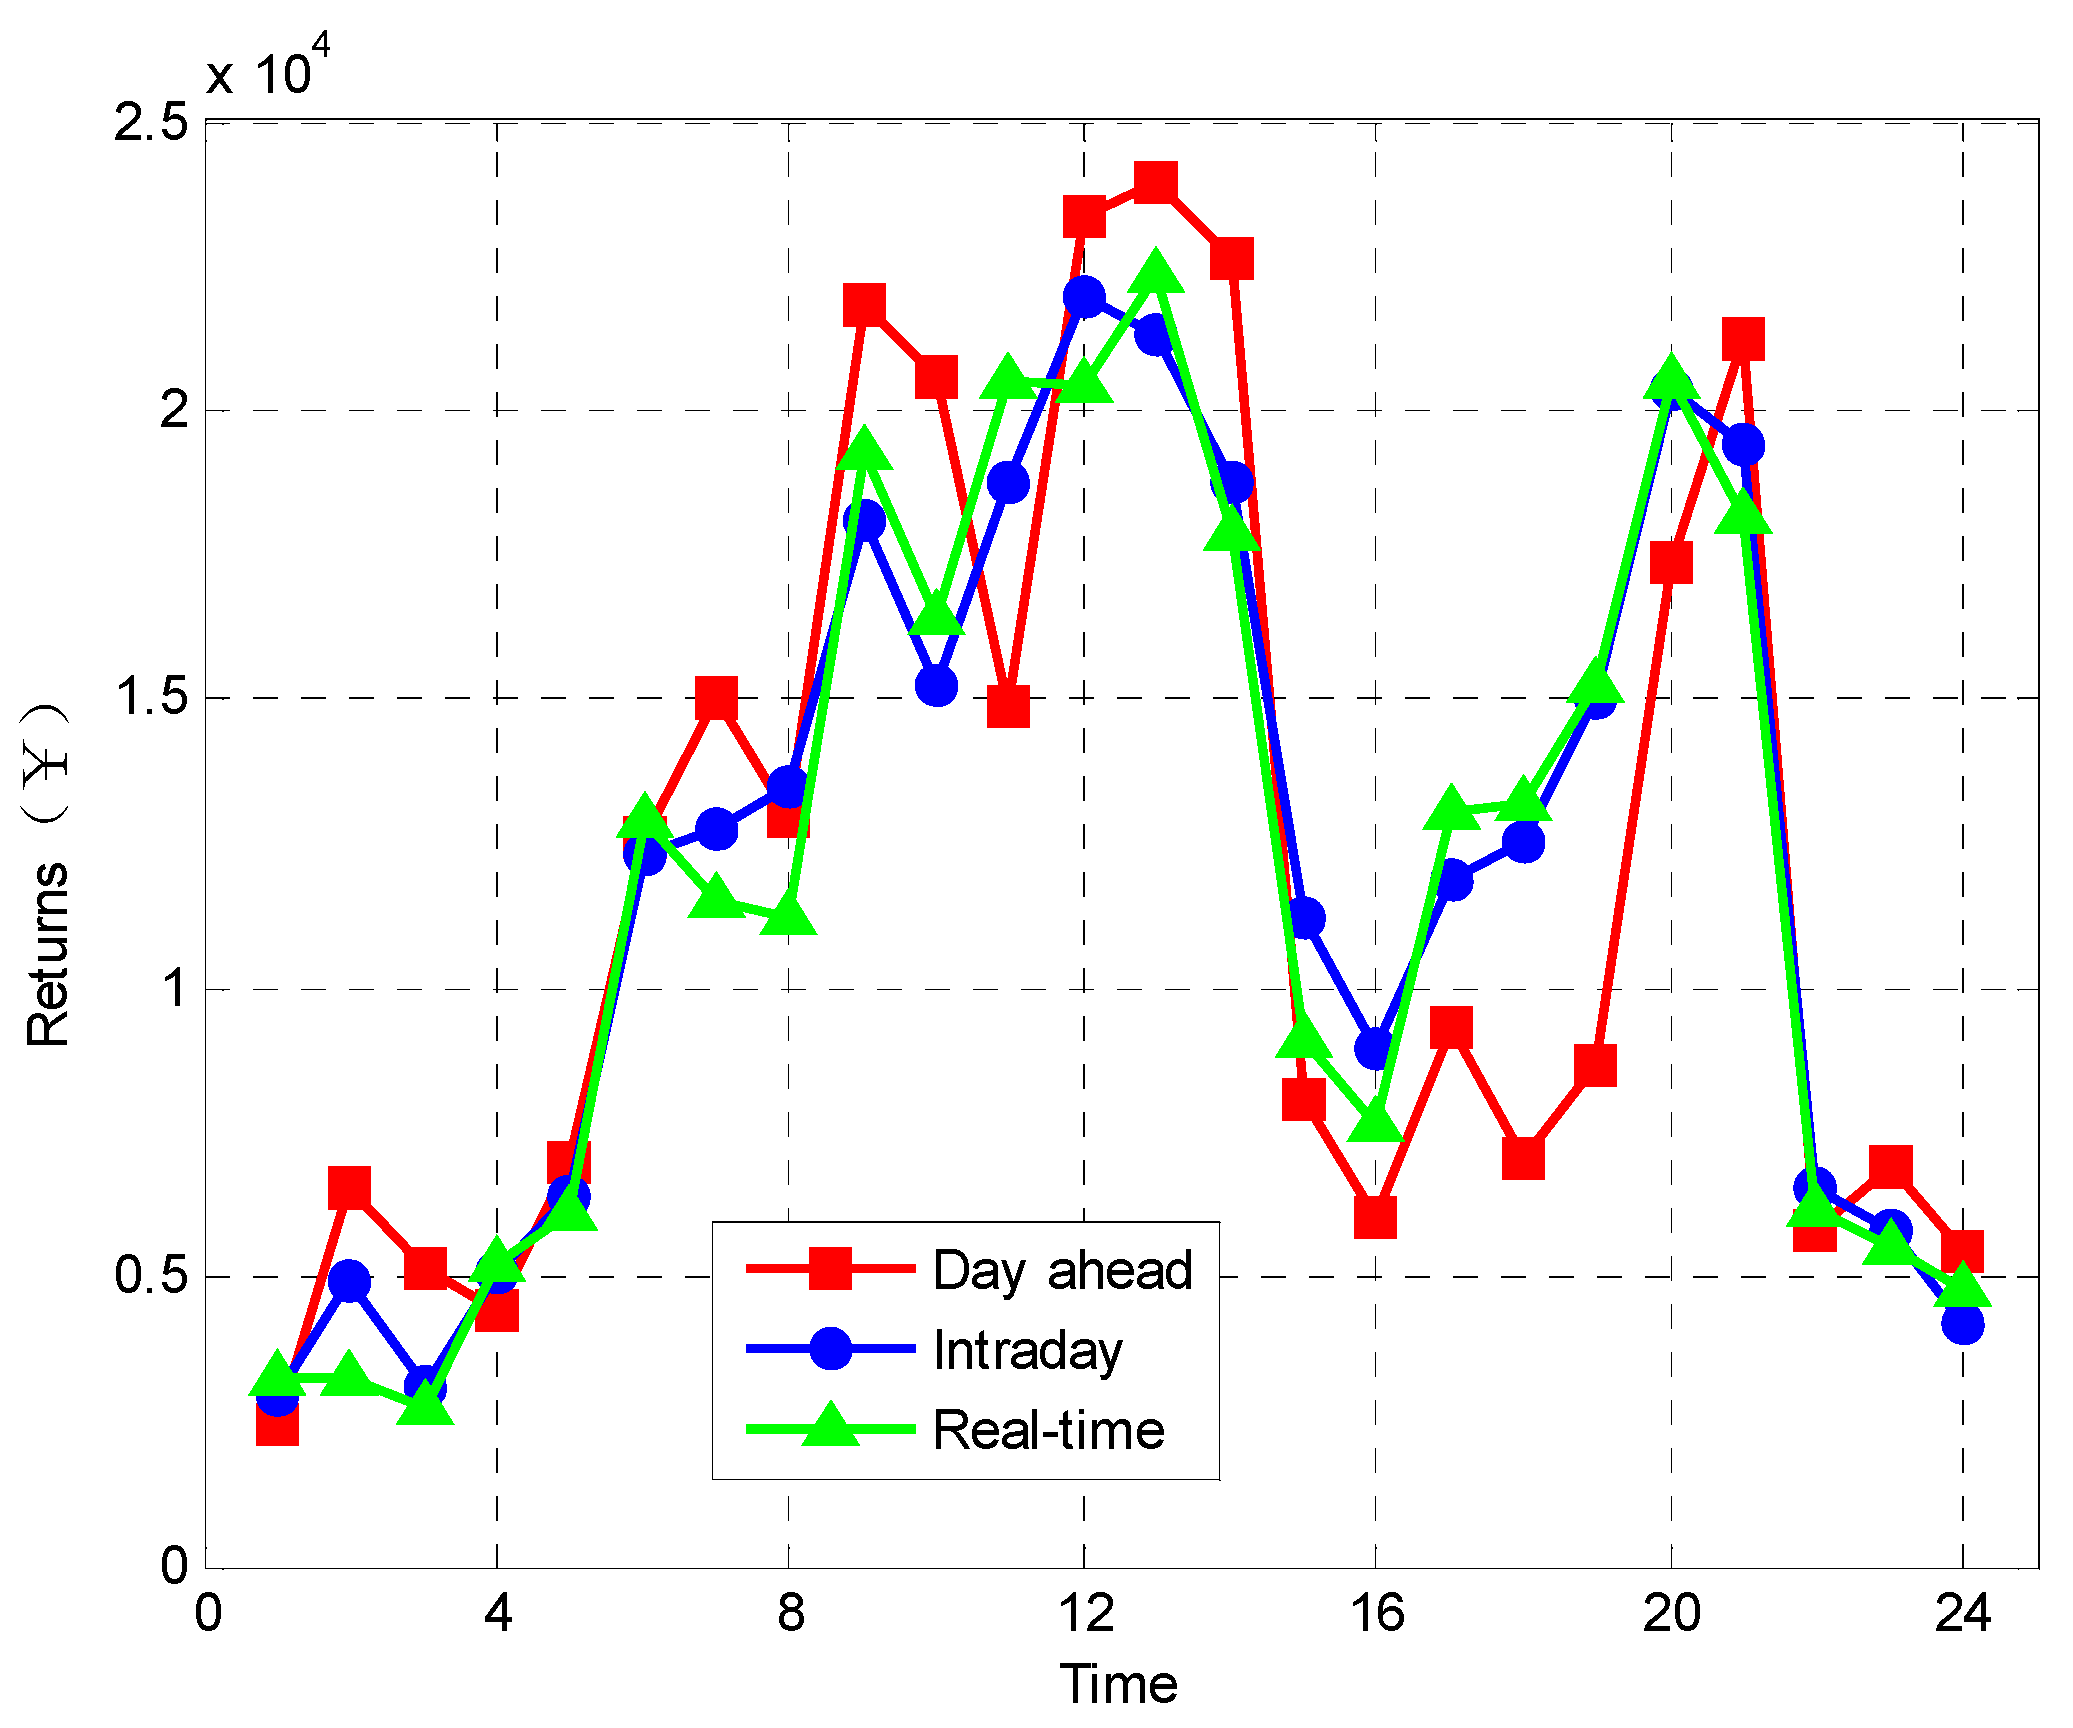
By statistically calculating the revenues for each time period, the market revenues before and after optimization are provided in Figure 10 and Figure 11. It can be seen that there are certain differences in day-ahead, intraday, and real-time revenues at each time period. The revenues are higher after optimization; the reason for this is that after optimization, the phenomenon of abandoning wind and light has improved, and new energy output is effectively utilized.
In order to facilitate a comparative analysis, by superposing the revenues of all time periods within a scheduling cycle, a revenue comparison is shown in Table 2, which indicates that the revenues after optimization are higher than the ones before optimization, once again verifying the correctness of the proposed method.

5. Conclusions

This paper investigated the distributed optimization strategy for NESs and ESSs considering multiple time scales. By considering the uncertainty of new energy output and the volatility of the electricity price market, revenue models were established at different time scales and an objective function was established with the goal of maximizing comprehensive market revenue whilst meeting relevant constraints. By decomposing the objective function, a simplified objective function was obtained, and the ADMM was utilized to process the simplified objective function. Finally, simulation and revenue analyses were provided to verify the effectiveness and feasibility of the proposed method.
It is worth noting that this paper only considers optimization strategies with multiple time scales and does not take the effects of frequency and voltage into account. The follow-up work will explore the distributed optimization problem of NESs and ESSs by considering grid frequency regulation, voltage regulation, and plug and play of energy storage batteries.

Author Contributions

Conceptualization, S.Z.; Methodology, S.Z.; Software, W.L.; Validation, C.Z.; Formal analysis, W.W.; Writing—original draft, S.Z. All authors have read and agreed to the published version of the manuscript.

Funding

This work was supported by the Research and Application of Energy Storage Configuration Methods and Key Technologies for Grid Control in New Energy Stations (NO: YNKJXM20210197).

Data Availability Statement

The original contributions presented in the study are included in the article, further inquiries can be directed to the corresponding author.

Conflicts of Interest

Author Weixin Wang is employed by the Xu Ji Electric Co., Ltd. The remaining author declarse that the research was conducted in the absence of any commercial or financial relationships that could be construed as a potential conflict of interest

References

  1. Yang, S.; Li, B.; Zhao, T.; Zhao, W.; Xu, P.; Xie, H. Transient angle instability mode and mechanism of distributed synchronous condensers in renewable energy station. Autom. Electr. Power Syst. 2023, 47, 12–18. [Google Scholar]
  2. Rosales-Asensio, E.; Diez, D.B.; Cabrera, P.; Sarmento, P. Effectiveness and efficiency of support schemes in promoting renewable energy sources in the Spanish electricity market. Int. J. Electr. Power Energy Syst. 2024, 158, 109926. [Google Scholar] [CrossRef]
  3. Long, Y.; Liu, X. Optimal green investment strategy for grid-connected microgrid considering the impact of renewable energy source endowment and incentive policy. Energy 2024, 295, 131073. [Google Scholar] [CrossRef]
  4. Bi, T.; Li, Y.; Jia, K.; Yang, Q. Transient current waveform similarity based pilot protection for transmission lines connected to renewable energy power plants. Proc. CSEE 2018, 38, 2012–2019. [Google Scholar]
  5. Yang, G.; Fan, P.; Wang, C.; Yu, Y.; Lv, P.; Liang, Y.; Zhang, Z. Pilot protection based on energy distribution for transmission line connected to renewable power plants. Power Syst. Technol. 2023, 47, 1415–1422. [Google Scholar]
  6. Zheng, L.; Jia, K.; Bi, T.; Fang, Y.; Yang, Z. Cosine similarity based pilot protection of teed transmission line connected to renewable energy power plant. Autom. Electr. Power Syst. 2019, 43, 111–119. [Google Scholar]
  7. Ruban, N.; Rudnik, V.; Askarov, A.; Maliuta, B. Frequency control by the PV station in electric power systems with hydrogen energy storage. Int. J. Hydrog. Energy 2023, in press. [Google Scholar] [CrossRef]
  8. Li, Y.; Wu, J. Optimum integration of solar energy with battery energy storage systems. IEEE Trans. Eng. Manag. 2022, 69, 697–707. [Google Scholar] [CrossRef]
  9. Yuan, B.; Li, X.; Yin, C.; Liu, R. Mechanism and suppression strategy of high-frequency oscillation caused by integration of islanded renewable energy station into MMC-HVDC system. Autom. Electr. Power Syst. 2023, 47, 133–141. [Google Scholar]
  10. Sun, H.; Xu, S.; Xu, T.; Guo, Q.; He, J.; Zhao, B.; Yu, L.; Zhang, Y.; Li, W.; Zhou, Y.; et al. Definition and index of short circuit ratio for multiple renewable energy stations. Proc. CSEE 2021, 41, 497–505. [Google Scholar]
  11. Li, X.; Chen, L.; Sun, F.; Hao, Y.; Du, X.; Mei, S. Share or not share, the analysis of energy storage interaction of multiple renewable energy stations based on the evolution game. Renew. Energy 2023, 208, 679–692. [Google Scholar] [CrossRef]
  12. Tan, C.; Tan, Z.; Yin, Z.; Wang, Y.; Geng, S.; Pu, L. Study on grid price mechanism of new energy power stations considering market environment. Renew. Energy 2023, 203, 177–193. [Google Scholar] [CrossRef]
  13. Sun, H.; Li, J.; Li, W.; Guo, J.; Guo, Q.; He, J. Research on model structures and modeling methods of renewable energy station for large-scale power system simulation (part I): Model structure. Proc. CSEE 2023, 43, 1379–1388. [Google Scholar]
  14. Fu, X.; Zhang, Y.; Liu, X.; Liu, Z. Stable power supply system consisting of solar, wind and liquid carbon dioxide energy storage. Renew. Energy 2024, 221, 119730. [Google Scholar] [CrossRef]
  15. Cao, M.; Yu, J. Sales channel classification for renewable energy stations under peak shaving resource shortage. Int. J. Electr. Power Energy Syst. 2024, 160, 110115. [Google Scholar] [CrossRef]
  16. Ju, L.; Bai, X.; Li, G.; Gan, W.; Qi, X.; Ye, F. Two-stage robust transaction optimization model and benefit allocation strategy for new energy power stations with shared energy storage considering green certificate and virtual energy storage mode. Appl. Energy 2024, 362, 122996. [Google Scholar] [CrossRef]
  17. Moradzadeh, M.; Abdelaziz, M. A new MILP formulation for renewables and energy storage integration in fast charging stations. IEEE Trans. Transp. Electrif. 2020, 6, 181–198. [Google Scholar] [CrossRef]
  18. Amry, Y.; Elbouchikhi, E.; Le Gall, F.; Ghogho, M.; El Hani, S. Optimal sizing and energy management strategy for EV workplace charging station considering PV and flywheel energy storage system. J. Energy Storage 2023, 62, 106937. [Google Scholar] [CrossRef]
  19. Li, X.; Ma, R.; Gan, W.; Yan, S. Optimal dispatch for battery energy storage station in distribution network considering voltage distribution improvement and peak load shifting. J. Mod. Power Syst. Clean Energy 2021, 10, 131–139. [Google Scholar] [CrossRef]
  20. Li, G.; Hu, A.; Yang, T.; Zhang, L.; Shui, H.; Fang, C. Research on the control technologies of battery energy storage station for plug and play operation. Electr. Meas. Instrum. 2021, 58, 59–67. [Google Scholar] [CrossRef]
  21. Zhang, P.; Huang, Y.; Li, C.; Kang, L.; Yue, G. Research on coordinated scheduling method of new energy power station based on fair power generation. Electr. Meas. Instrum. 2020, 57, 76–85. [Google Scholar]
  22. Lu, M.; Li, X.; Li, F.; Xiong, W.; Cheng, S. Strategy of energy storage leasing configuration of photovoltaic power station cluster based on bi-level game optimization. Proc. CSEE 2022, 42, 5887–5898. [Google Scholar]
  23. Li, Z.; Li, P.; Xia, J.; Liu, X. Optimization for micro-energy grid dispatch based on non-supplementary fired compressed air energy storage aided energy hub and hybrid hyper-spherical search. J. Mod. Power Syst. Clean Energy 2022, 10, 1009–1020. [Google Scholar] [CrossRef]
  24. Zhu, H.; Yuan, S.; Li, C. Control strategy and analysis of virtual synchronous motor of photovoltaic power plant with energy storage link. Electr. Meas. Instrum. 2023, 60, 45–50. [Google Scholar]
  25. Li, J.; Hou, T.; Yan, G.; Li, C.; Mu, G. Two-layer optimization of frequency modulation power in multi-battery energy storage system considering frequency modulation cost and recovery of state of charge. Proc. CSEE 2021, 41, 8020–8032. [Google Scholar]
  26. Dai, Y.; Li, C.; Xia, S.; He, H.; Wang, P.; Jing, J. Collaborative optimization of distribution network and 5G base stations considering its communication load migration and energy storage dynamic backup flexibility. Int. J. Electr. Power Energy Syst. 2024, 160, 110124. [Google Scholar] [CrossRef]
  27. Mouratidis, P. Augmenting electric vehicle fast charging stations with battery-flywheel energy storage. J. Energy Storage 2024, 97, 112957. [Google Scholar] [CrossRef]
  28. Nagem, N.; Ebeed, M.; Alqahtani, D.; Jurado, F.; Khan, N.H.; Hafez, W.A. Optimal design and three-level stochastic energy management for an interconnected microgrid with hydrogen production and storage for fuel cell electric vehicle refueling stations. Int. J. Hydrog. Energy 2024, 87, 574–587. [Google Scholar] [CrossRef]
  29. Zhu, W.; Xu, X.; Ding, B.; Zhang, Z.; Gao, Q. Cooperative game-based energy storage planning for wind power cluster aggregation station. Energy Rep. 2024, 11, 4021–4031. [Google Scholar] [CrossRef]
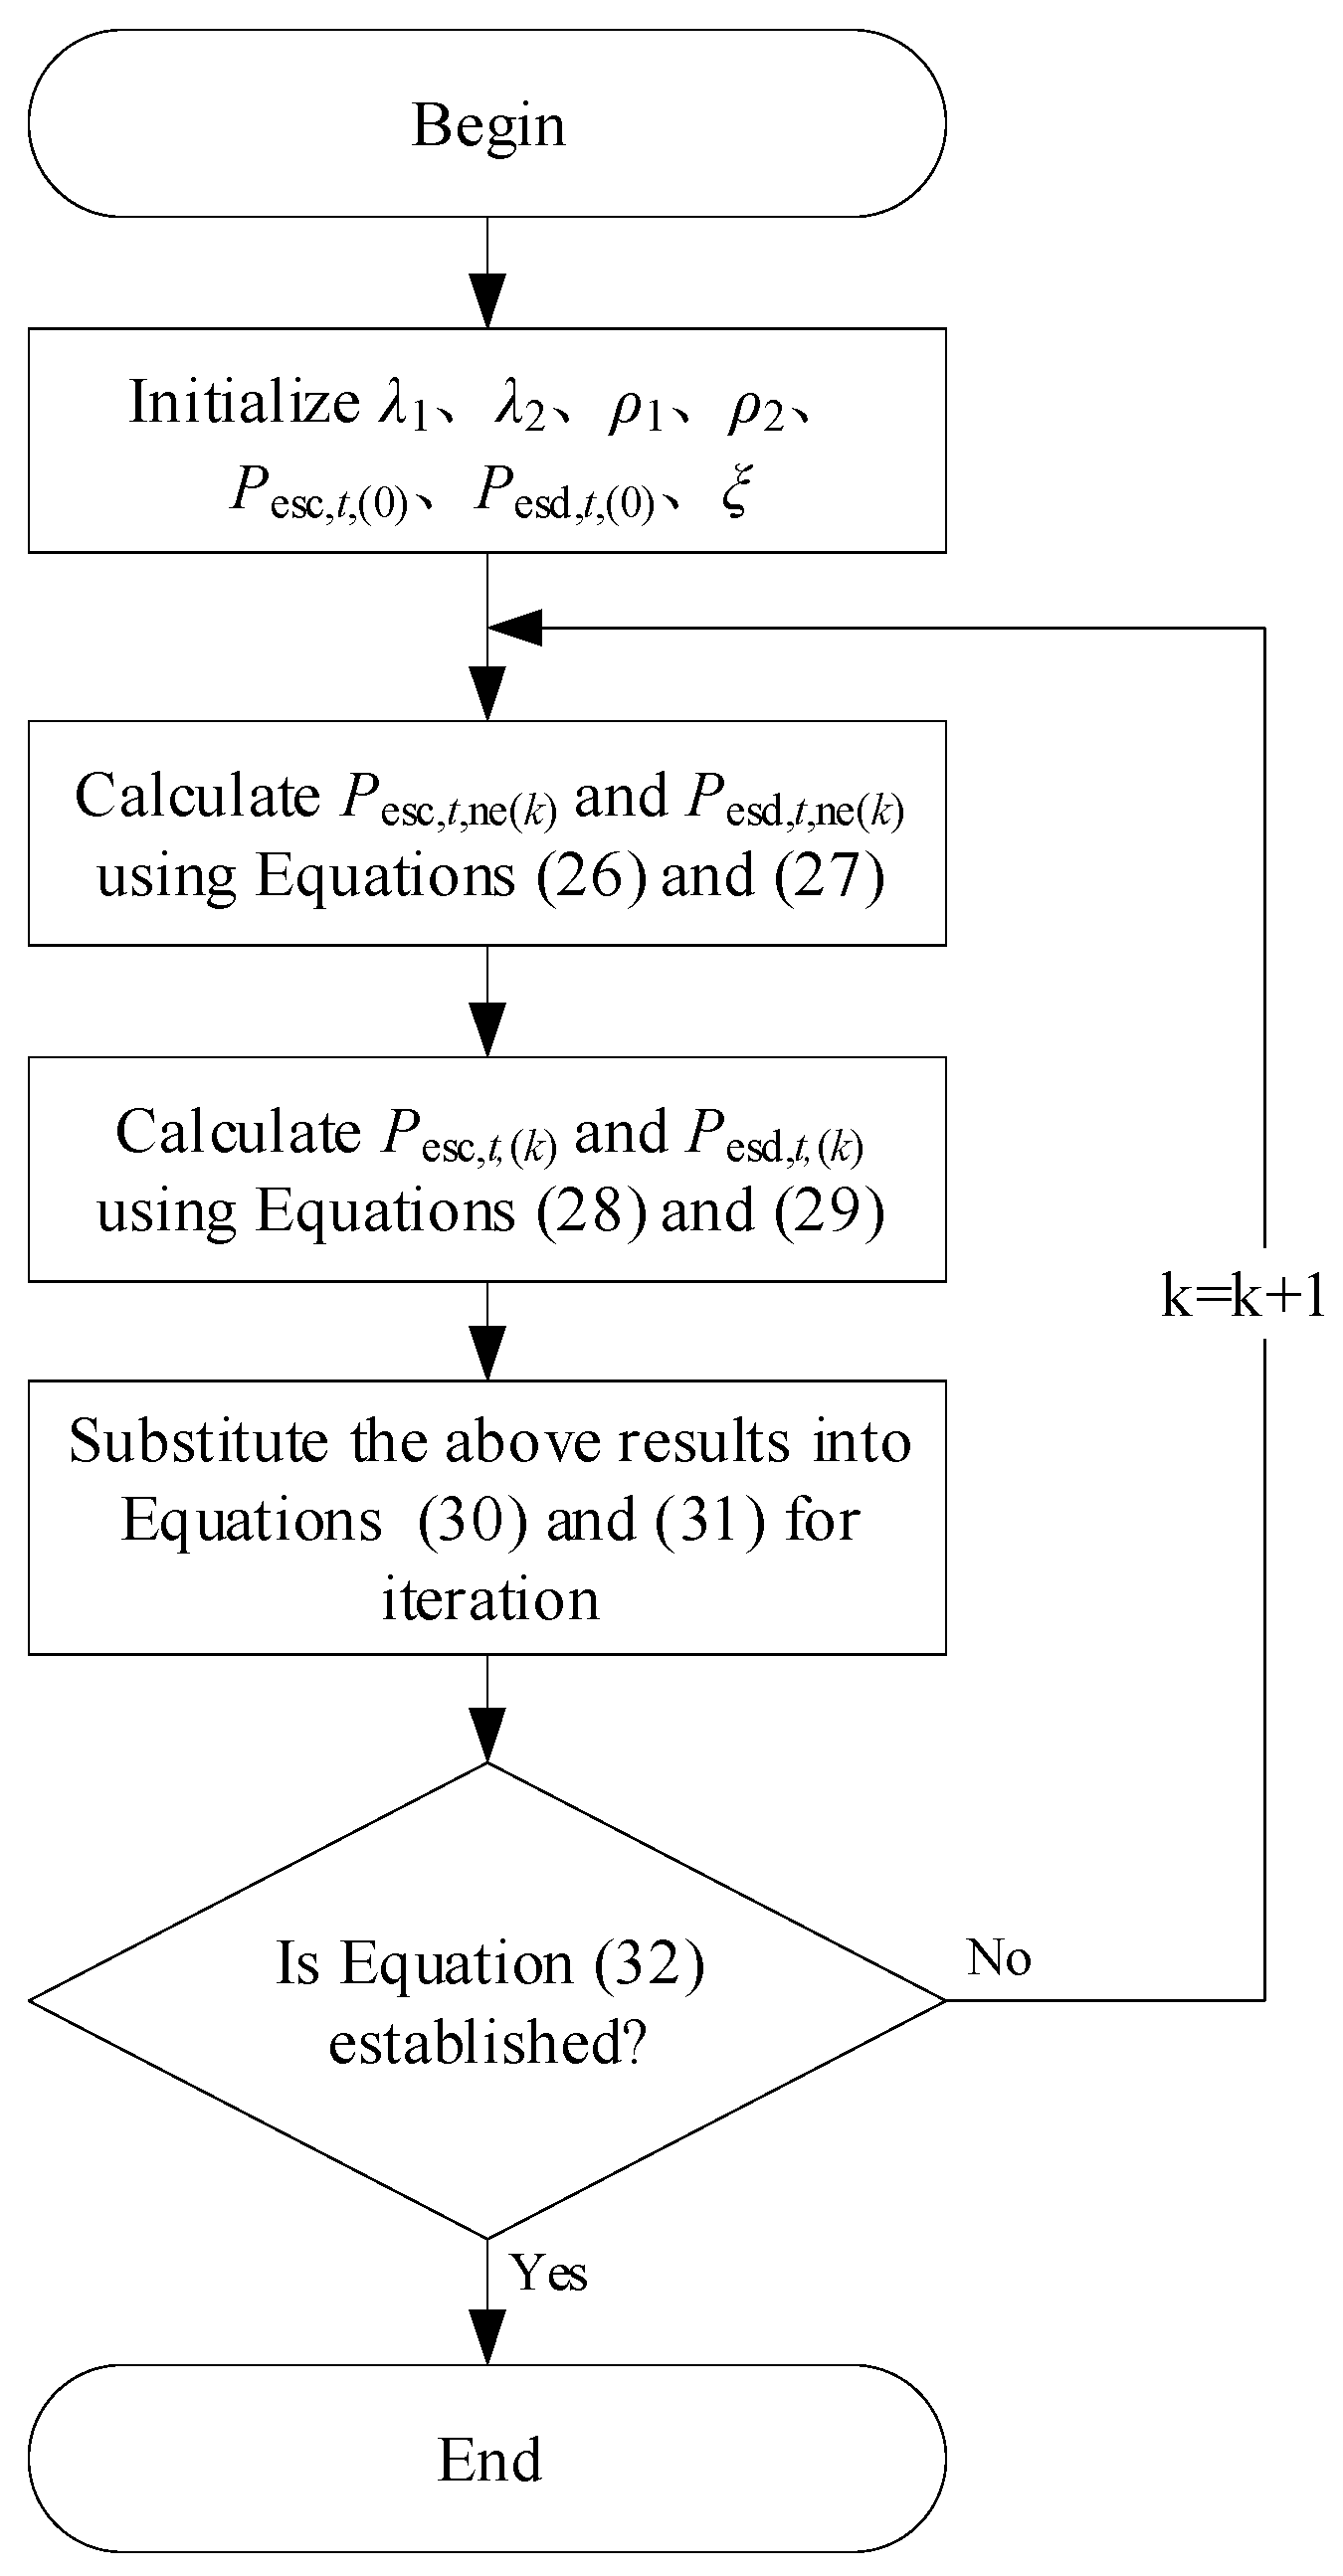
Figure 1. Algorithm flow diagram.
Energies 17 04923 g001
Figure 2. Topological diagram of 33 nodes.
Energies 17 04923 g002
Figure 3. Load, wind power, and photovoltaic output of typical day.
Energies 17 04923 g003
Figure 4. Charging and discharging power of energy storage.
Energies 17 04923 g004
Figure 5. Day-ahead market output of each energy source after optimization.
Energies 17 04923 g005
Figure 6. Comparison of abandoned wind power of day-ahead market.
Energies 17 04923 g006
Figure 7. Comparison of abandoned light power of day-ahead market.
Energies 17 04923 g007
Figure 8. Intraday market output of each energy source after optimization.
Energies 17 04923 g008
Figure 9. Real-time market output of each energy source after optimization.
Energies 17 04923 g009
Figure 10. Each market revenue before optimization.
Energies 17 04923 g010
Figure 11. Each market revenue after optimization.
Energies 17 04923 g011
Table 1. TOU electricity price.
Time PeriodsSymbolElectricity Purchase Price (¥·(kWh)−1)Electricity Selling Price (¥·(kWh)−1)
Peak load periods8:00–14:00, 18:00–21:001.120.95
Normal load periods5:00–8:00, 14:00–18:000.830.68
Low load periods0:00–5:00, 21:00–24:000.450.36
Table 2. Revenue comparison before and after optimization.
Before OptimizationAfter Optimization
MarketsDailyIntradayReal-TimeDailyIntradayReal-Time
Revenues (Ten thousand yuan)28.90629.11528.64933.6832.25732.498
Disclaimer/Publisher’s Note: The statements, opinions and data contained in all publications are solely those of the individual author(s) and contributor(s) and not of MDPI and/or the editor(s). MDPI and/or the editor(s) disclaim responsibility for any injury to people or property resulting from any ideas, methods, instructions or products referred to in the content.