Article

Electric Field Features and Charge Behavior in Oil-Pressboard Composite Insulation under Impulse Voltage

1
China Southern Power Grid EHV Power Transmission Company, Guangzhou 510405, China
2
State Key Laboratory of Alternate Electrical Power System with Renewable Energy Sources, North China Electric Power University, Beijing 102206, China
*
Author to whom correspondence should be addressed.
Energies 2024, 17(19), 4903; https://doi.org/10.3390/en17194903
Submission received: 9 September 2024 / Revised: 26 September 2024 / Accepted: 29 September 2024 / Published: 30 September 2024
(This article belongs to the Section F6: High Voltage)

Abstract

:
Oil-pressboard/paper insulation materials are essential in transformers for ensuring their safe and stable operation, primarily due to their roles in spatial electric field distribution and charge migration mechanisms. Current spatial distribution analyses rely on computational methods that lack empirical validation, particularly for oil-pressboard/paper composites. This study leverages the principles of the Kerr electro-optic effect to develop a rapid measurement platform for electric fields within oil-pressboard/paper insulation under impulse voltage conditions, which measures the spatial electric field characteristics using Cu-Cu and Al-Al electrodes under various scenarios: with asymmetric and symmetric pressboard coverage and different numbers of insulating paper layers. Findings indicated: (1) In asymmetric pressboard models, Cu-Cu electrodes exhibit a consistent peak electric field of approximately 16 kV/mm, while Al-Al electrodes show peak values of 18.13 kV/mm and −14.98 kV/mm. Charge density patterns are similar, with Cu-Cu at about 68 μC/m2 and Al-Al at 11.2 μC/m2 and −124.8 μC/m2. (2) Symmetric models present consistent peak electric fields and charge densities for both polarities. (3) Increasing insulating paper layers elevates electric field strengths. Both electrodes show the similar peak field of about 17 kV/mm with differing paper layers due to higher charge injection from the Al electrode. (4) Utilizing the Schottky effect and field emission principles, the study clarifies charge generation and migration mechanisms. These insights could provide a theoretical foundation for designing and verifying oil-pressboard/paper insulation structures in transformers.

1. Introduction

Transformers are vital components in power systems, enabling the connection of regional grids and the transmission of electrical energy. Their reliability is essential for the stable operation of power systems [1]. To ensure reliability, oil-pressboard/paper composites are commonly used for insulation due to their excellent properties [2,3]. Understanding the spatial electric field characteristics of these materials under real conditions is crucial, especially since transformers often face impulse voltages [4]. Current methods primarily rely on computational analyses [5,6,7], which lack empirical validation.
In terms of measuring the spatial electric field in liquid dielectrics under impulse voltages, MIT have measured the spatial electric field distribution in pure water and a mixture of ethylene glycol under operating impulse voltages using a single-path interferometric fringe method with different electrode materials [8]. Chongqing University used a high-speed CCD to continuously capture the changes in the spatial electric field in propylene carbonate, obtaining the spatial electric field and charge distribution characteristics under operating impulse voltages with different electrode combinations [9]. For lightning impulse voltages, Xi’an Jiaotong University studied the charge injection characteristics of copper-aluminum electrodes in transformer oil using a polarity reversal method under lightning impulse voltages [10]. In the terms of charge migration mechanism, there are currently three models for the space charge model in transformer oil/oil-pressboard/paper insulation: the R-C model, the ion mobility model, and the double electric layer charge injection and migration model [11]. North China Electric Power University analyzed the polarity effects of charge accumulation in insulating oil based on the R-C model [12]. MIT explained the injected charge phenomenon in insulating oil based on the ion mobility model [13]. ABB used the double electric layer model to explain the charge migration rules in insulating oil [14].
In summary, there are several existing issues: (1) The calculation of the spatial electric field does not consider the distortion effect of space charges, and the calculation results lack the support and verification of empirical results. (2) Existing measurements are mostly limited to the measurement of the electric field in pure oil, lacking measurements of the electric field distribution in oil-pressboard/paper composites. (3) Existing charge migration models can explain the charge migration mechanisms in pure oil media well, but they cannot accurately explain the migration mechanisms in oil-pressboard/paper composites. To address these issues, this paper establishes a rapid measurement platform for electric fields in oil-pressboard/paper insulation under impulse voltages based on the Kerr electro-optic effect, aiming to measure the spatial electric field characteristics in oil under impulse voltage. The paper also theoretically analyzes the charge migration mechanisms, which can provide a theoretical basis for the design and verification of oil-pressboard/paper insulation structures.

2. Electric Field Measurement Platform in Oil-Pressboard/Paper Insulation under Impulse Voltage

2.1. Measurement Principle

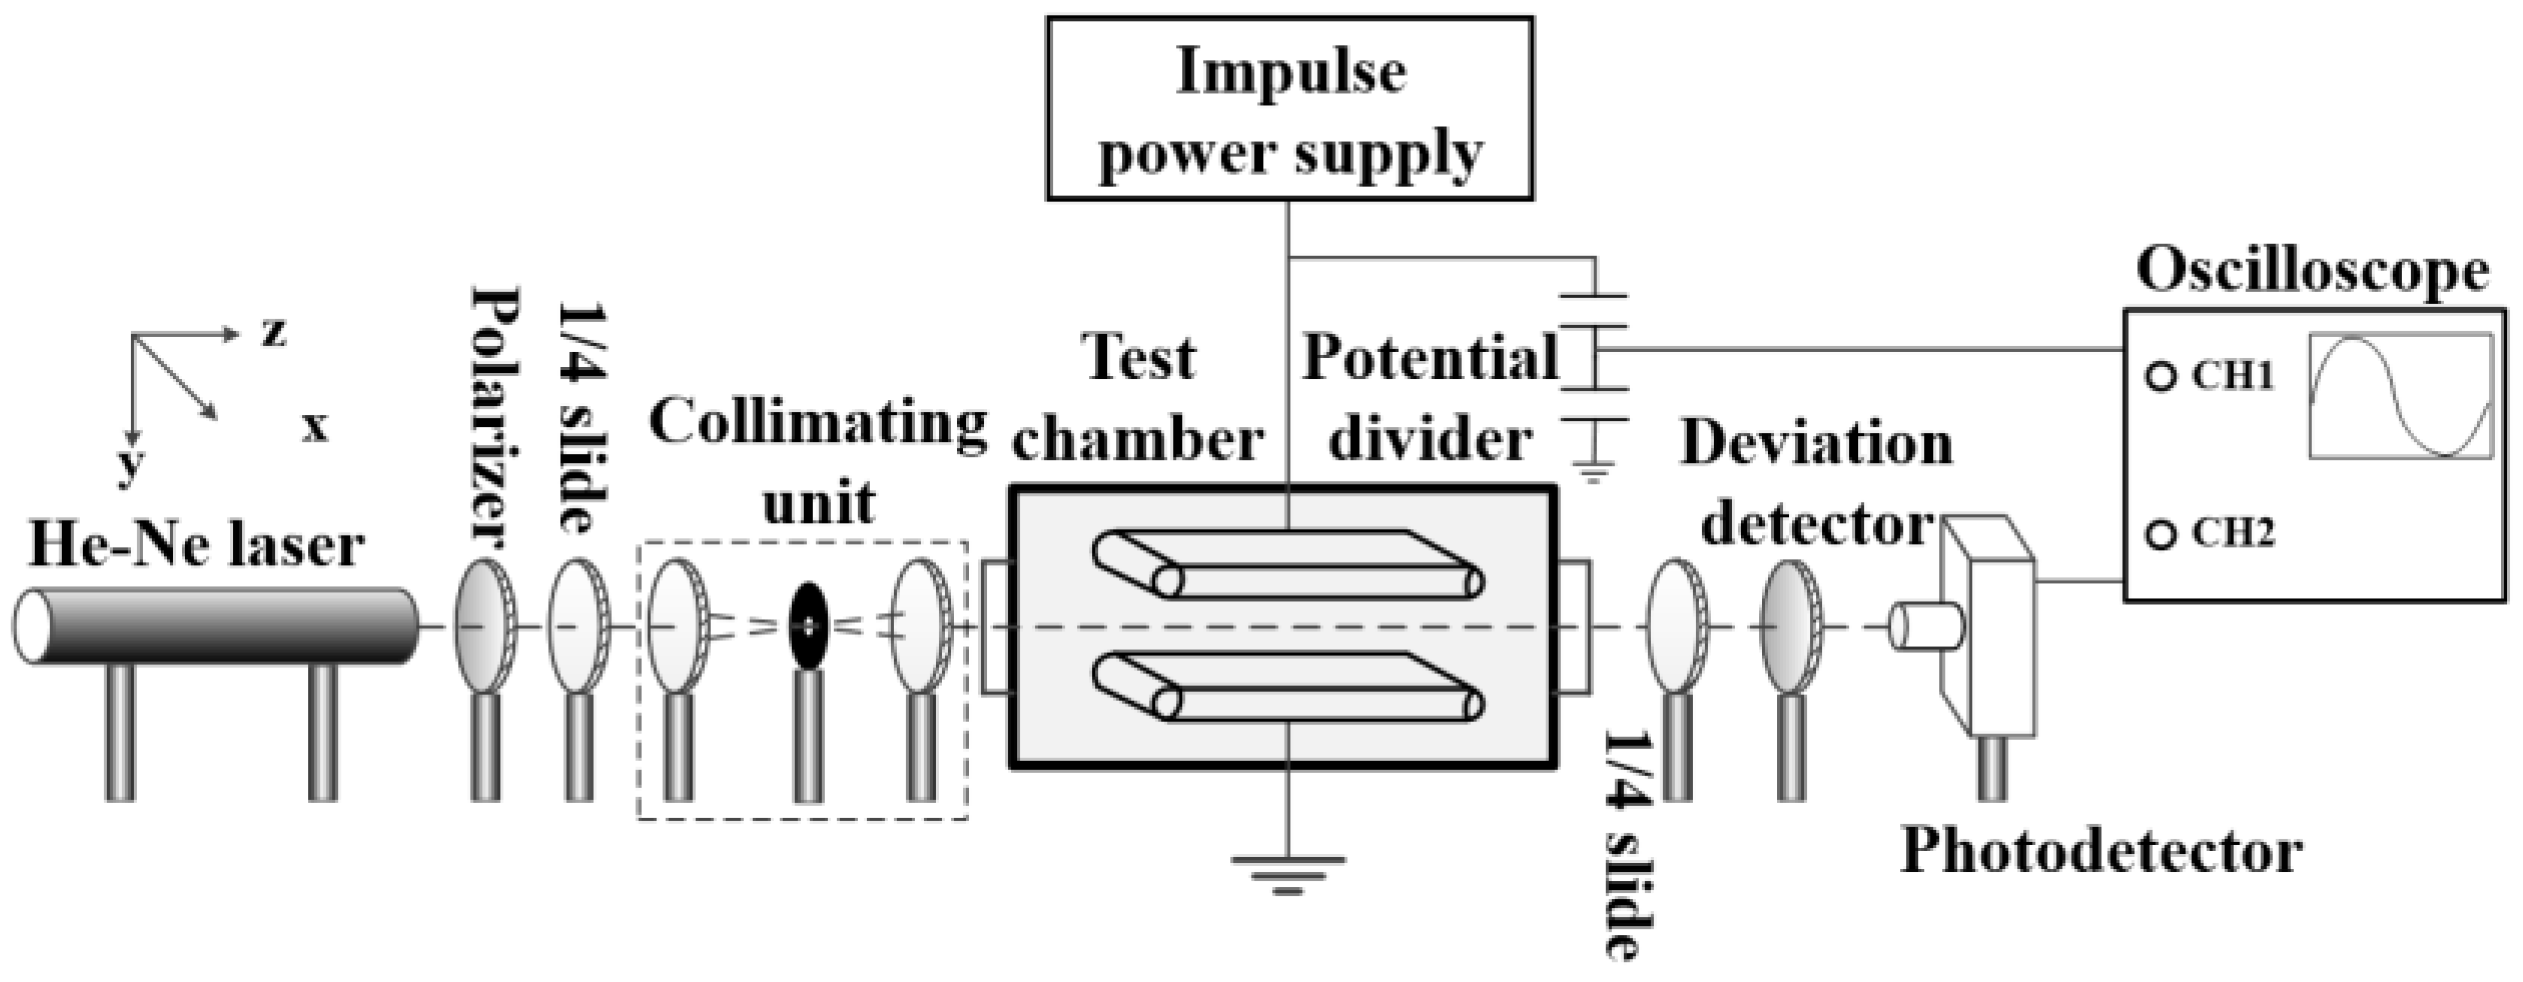
As illustrated in Figure 1, a polarizer and an analyzer are placed before and after the electric field region, respectively, with their polarization directions orthogonal to each other. The polarizer is positioned at a 45° angle and the analyzer at a 135° angle. Between the polarizer and analyzer, two quarter-wave plates are positioned with their fast axes oriented along the y-direction and x-direction, respectively. Utilizing Jones matrices, the vector transformation is performed, synthesizing the relative light intensity. This allows the relationship between the output light intensity and the input light intensity to be derived, as shown in Equation (1).
I o I i = sin 2 ( π 2 ( E E m ) 2 )
where Ii represents the input light intensity and Io is the output light intensity. Em is the field strength when the light intensity reaches its first maximum value, also known as the half-wave field strength. This value depends solely on the Kerr constant and the length of the electric field region. The calculation approach is shown in Equation (2).
E m = 1 / 2 B L
As the output light intensity changes with the increase in the electric field, Em serves as a reference value. When the electric field reaches multiples of Em by √1, √3, √5……√n, where n is an odd number, the light intensity reaches its maximum values.
For non-extreme points, the relationship between the electric field strength and the light intensity as it increases from a minimum to a maximum is given by Equation (3). Conversely, as the light intensity decreases from a maximum to a minimum, the relationship is described by Equation (4).
E / E m = n 1 + 2 π arcsin ( I o / I i ) 1 2 1 2
E / E m = n + 2 π arcsin ( I o / I i ) 1 2 1 2

2.2. Measurement System

The rapid measurement system for impulse electric fields, as shown in Figure 2, consists of an optical system, photoelectric conversion devices, and a sealed chamber. The impulse voltage generator used for the tests is HYCJ-1200 Impulse Voltage Generator manufactured by Jiangdu Huayu High Voltage Electric Co., Yangzhou, China. It features both manual and automatic operating modes and can output 1.2/50 μs lightning impulse voltages and 250/2500 μs switching impulse voltages. The measurement of impulse voltage utilizes a wideband capacitive voltage divider with a division ratio of 1000:1 and a response frequency ranging from 1 kHz to 10 MHz.

2.3. Test Model and Samples

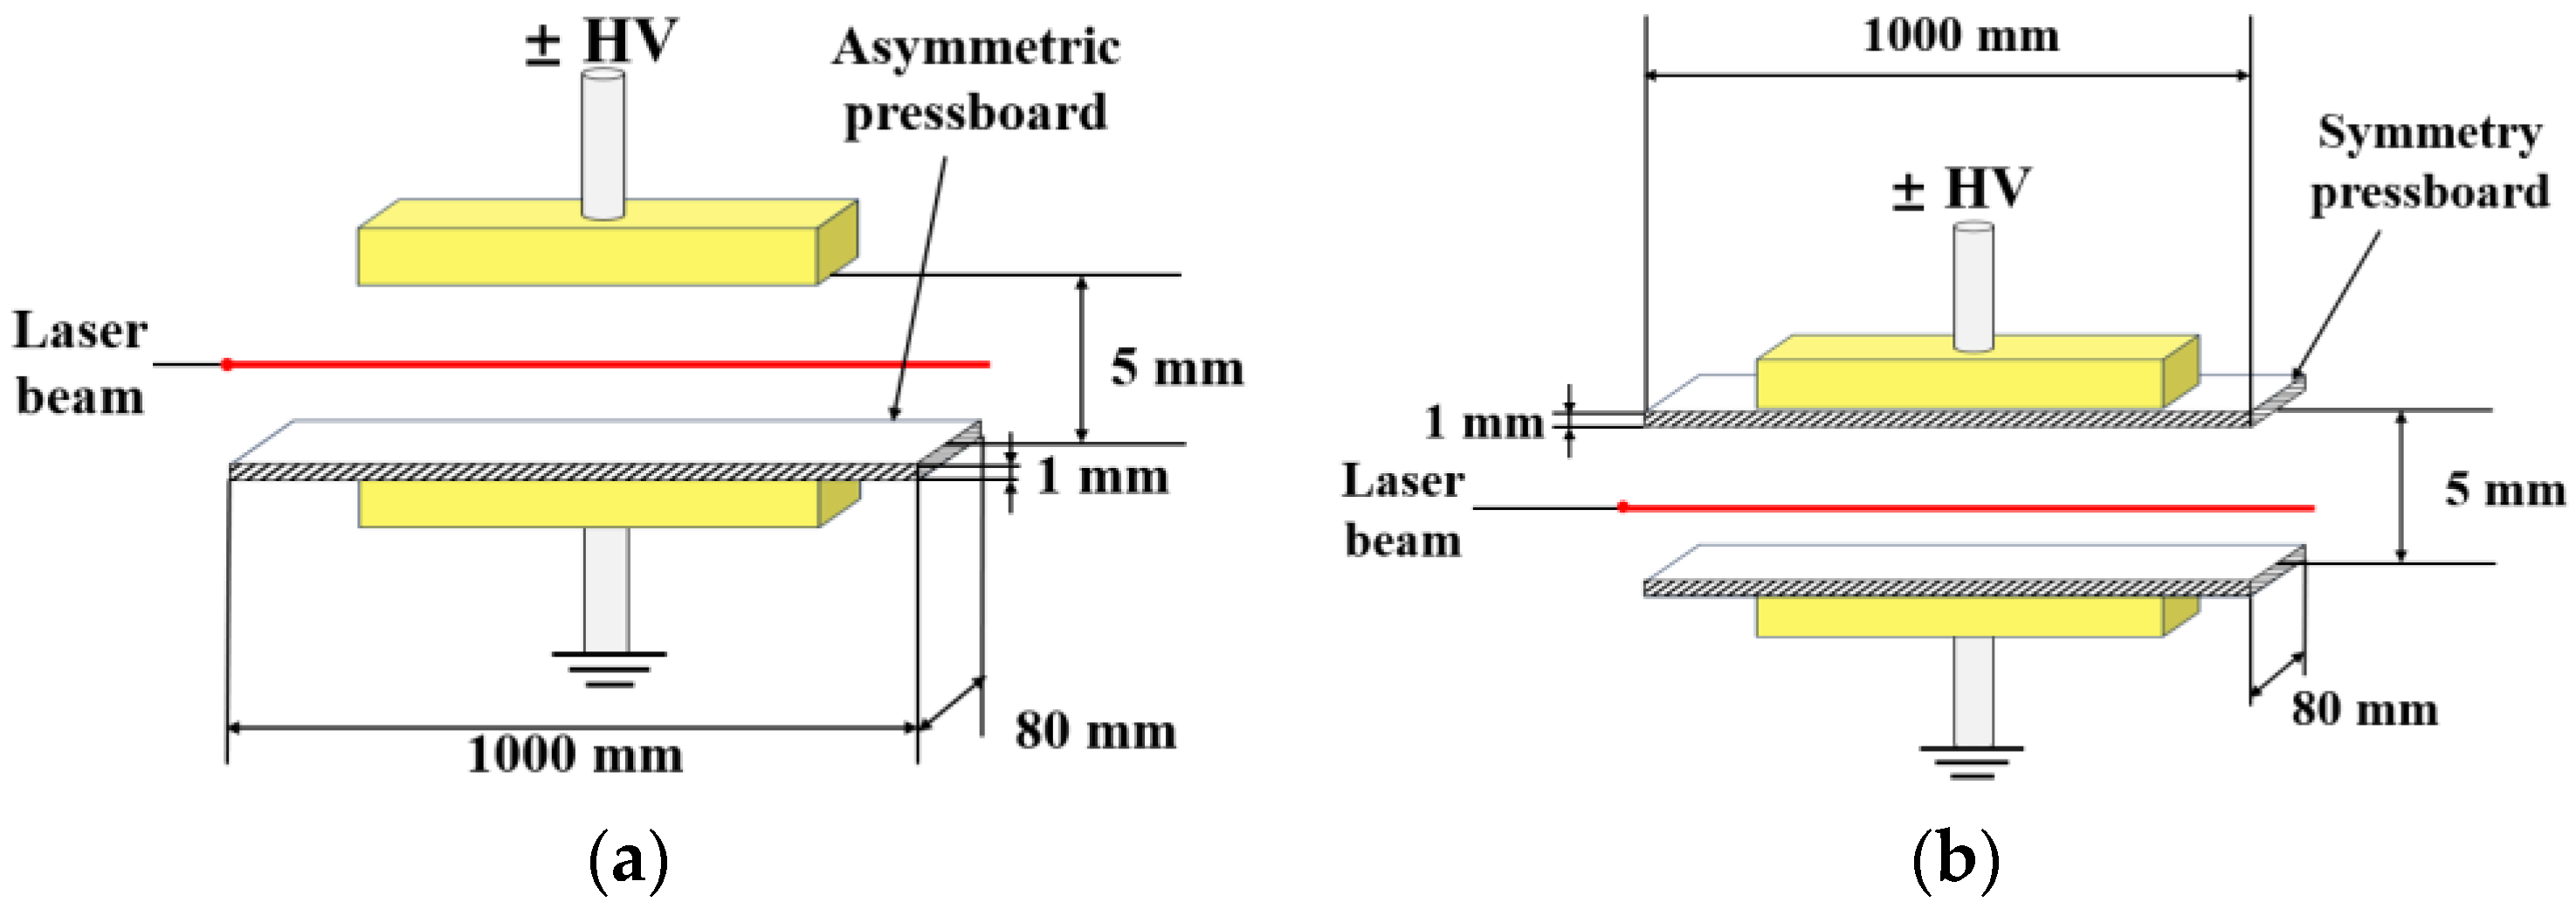
The insulating pressboard models used in this experiment are divided into asymmetric and symmetric pressboard models. The asymmetric pressboard model consists of a single layer of pressboard covering the lower electrode, while the symmetric pressboard model has a single layer of pressboard covering both the upper and lower electrodes. The oil gap is consistently maintained at 5 mm, regardless of the number of pressboards used. A schematic of the experimental model is shown in Figure 3. The insulating pressboard samples used are made from unbleached sulfate pulp fibers, processed into calendered pressboard. These samples are 1 m long, 80 mm wide, and 1 mm thick. After oil impregnation and degassing dehydration treatment, the water content is below 0.8%.
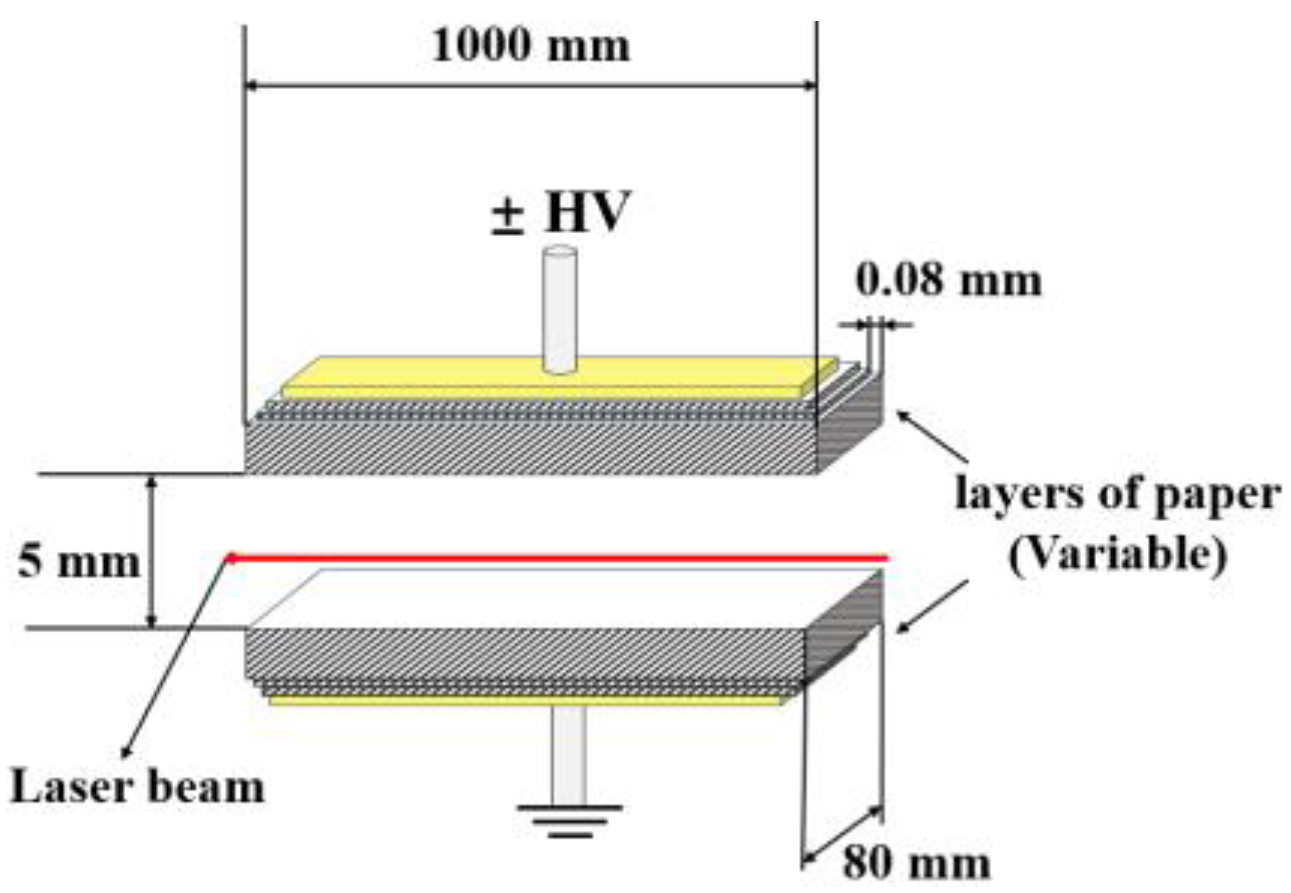
Copper and aluminum are two typical metals, and they are also the most debated materials for transformer and reactor coil selection. Therefore, in this paper, brass and aluminum are selected as electrodes for comparative experimental research. In the insulating paper model, the electrodes are covered with different numbers of insulation paper layers, with both the upper and lower electrodes covered symmetrically. The oil gap distance is also maintained at 5 mm and does not vary with the number of paper layers. The insulation paper samples used were made from aramid fiber composite materials, with dimensions of 1 m in length, 80 mm in width, and 0.8 mm in thickness. After oil impregnation and dehydration, the moisture content was kept below 0.6%.
According to the principle of capacitive voltage division, different models were subjected to different applied voltages to ensure that the voltage across the oil gap remained constant at 90 kV. The applied voltages for various models are shown in Table 1.
The equivalent charge density can be worked out using Gauss’ theorem as shown in Equations (5) and (6).
S E Q d s = Q ε r ε 0
σ = 2 ε r ε 0 E Q
where Q is the total charge inside the Gaussian surface, S is the area of the Gaussian surface, εr is the relative permittivity of the medium, and ε0 is the vacuum permittivity.
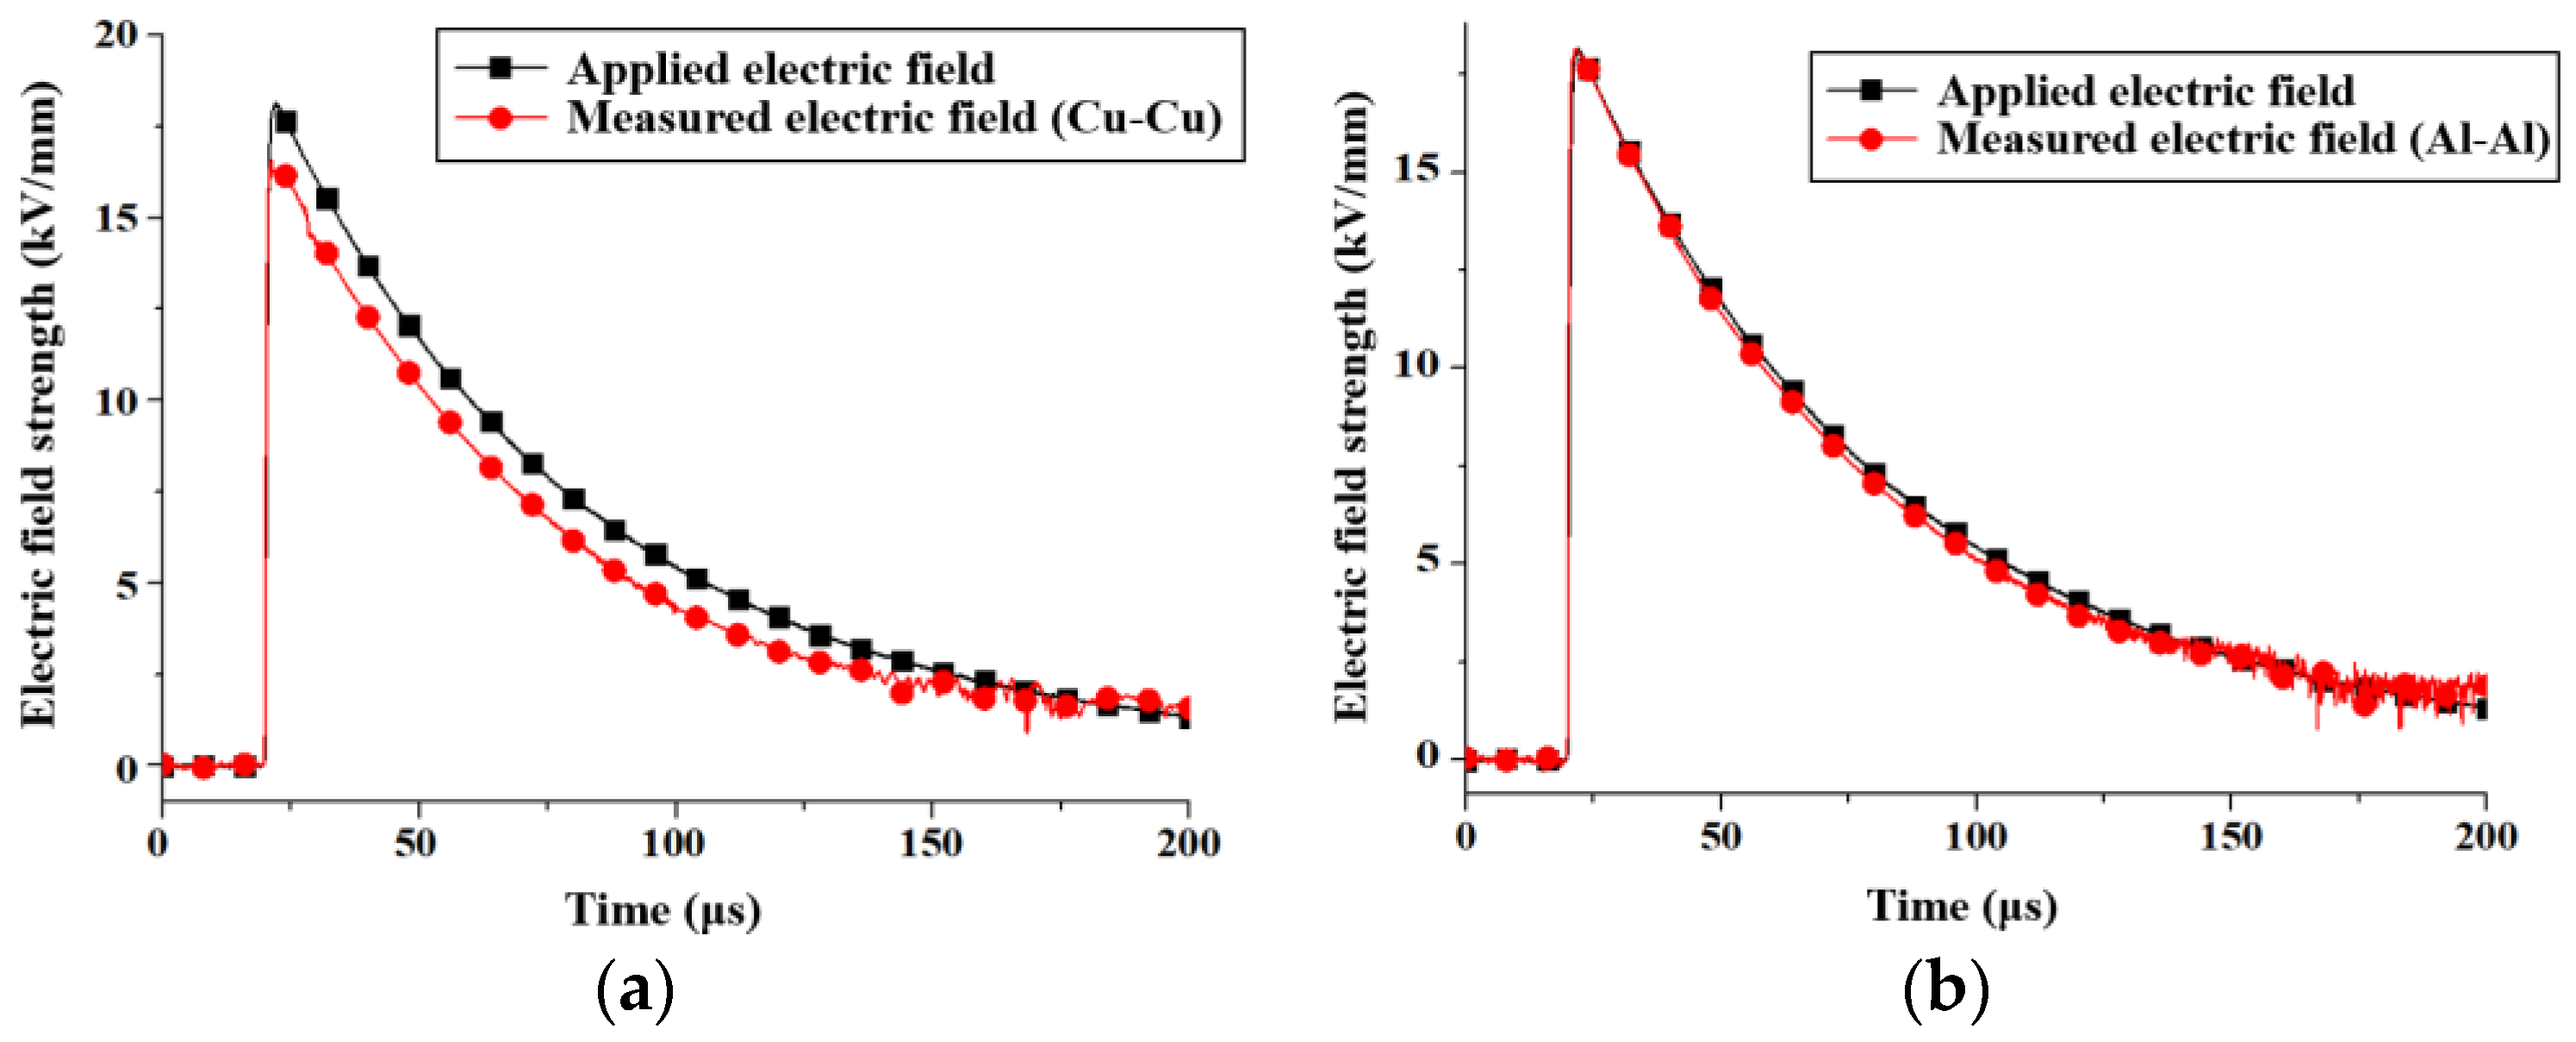
For the pure oil spacing model, the pressboard or paper in Figure 3 and Figure 4 were removed. In this experiment, the variation in spatial electric field and equivalent charge density of the specimen under pure oil were tested, and the results are shown in Figure 5.
From Figure 5, the Cu-Cu electrode spatial electric field measurements are closest to the externally applied electric field and have the smallest equivalent spatial charge, while the Al-Al electrode results in the largest error and has the largest equivalent spatial charge.

3. Electric Field in Oil with Electrodes Covered by Insulating Pressboard

3.1. Asymmetric Pressboard Model

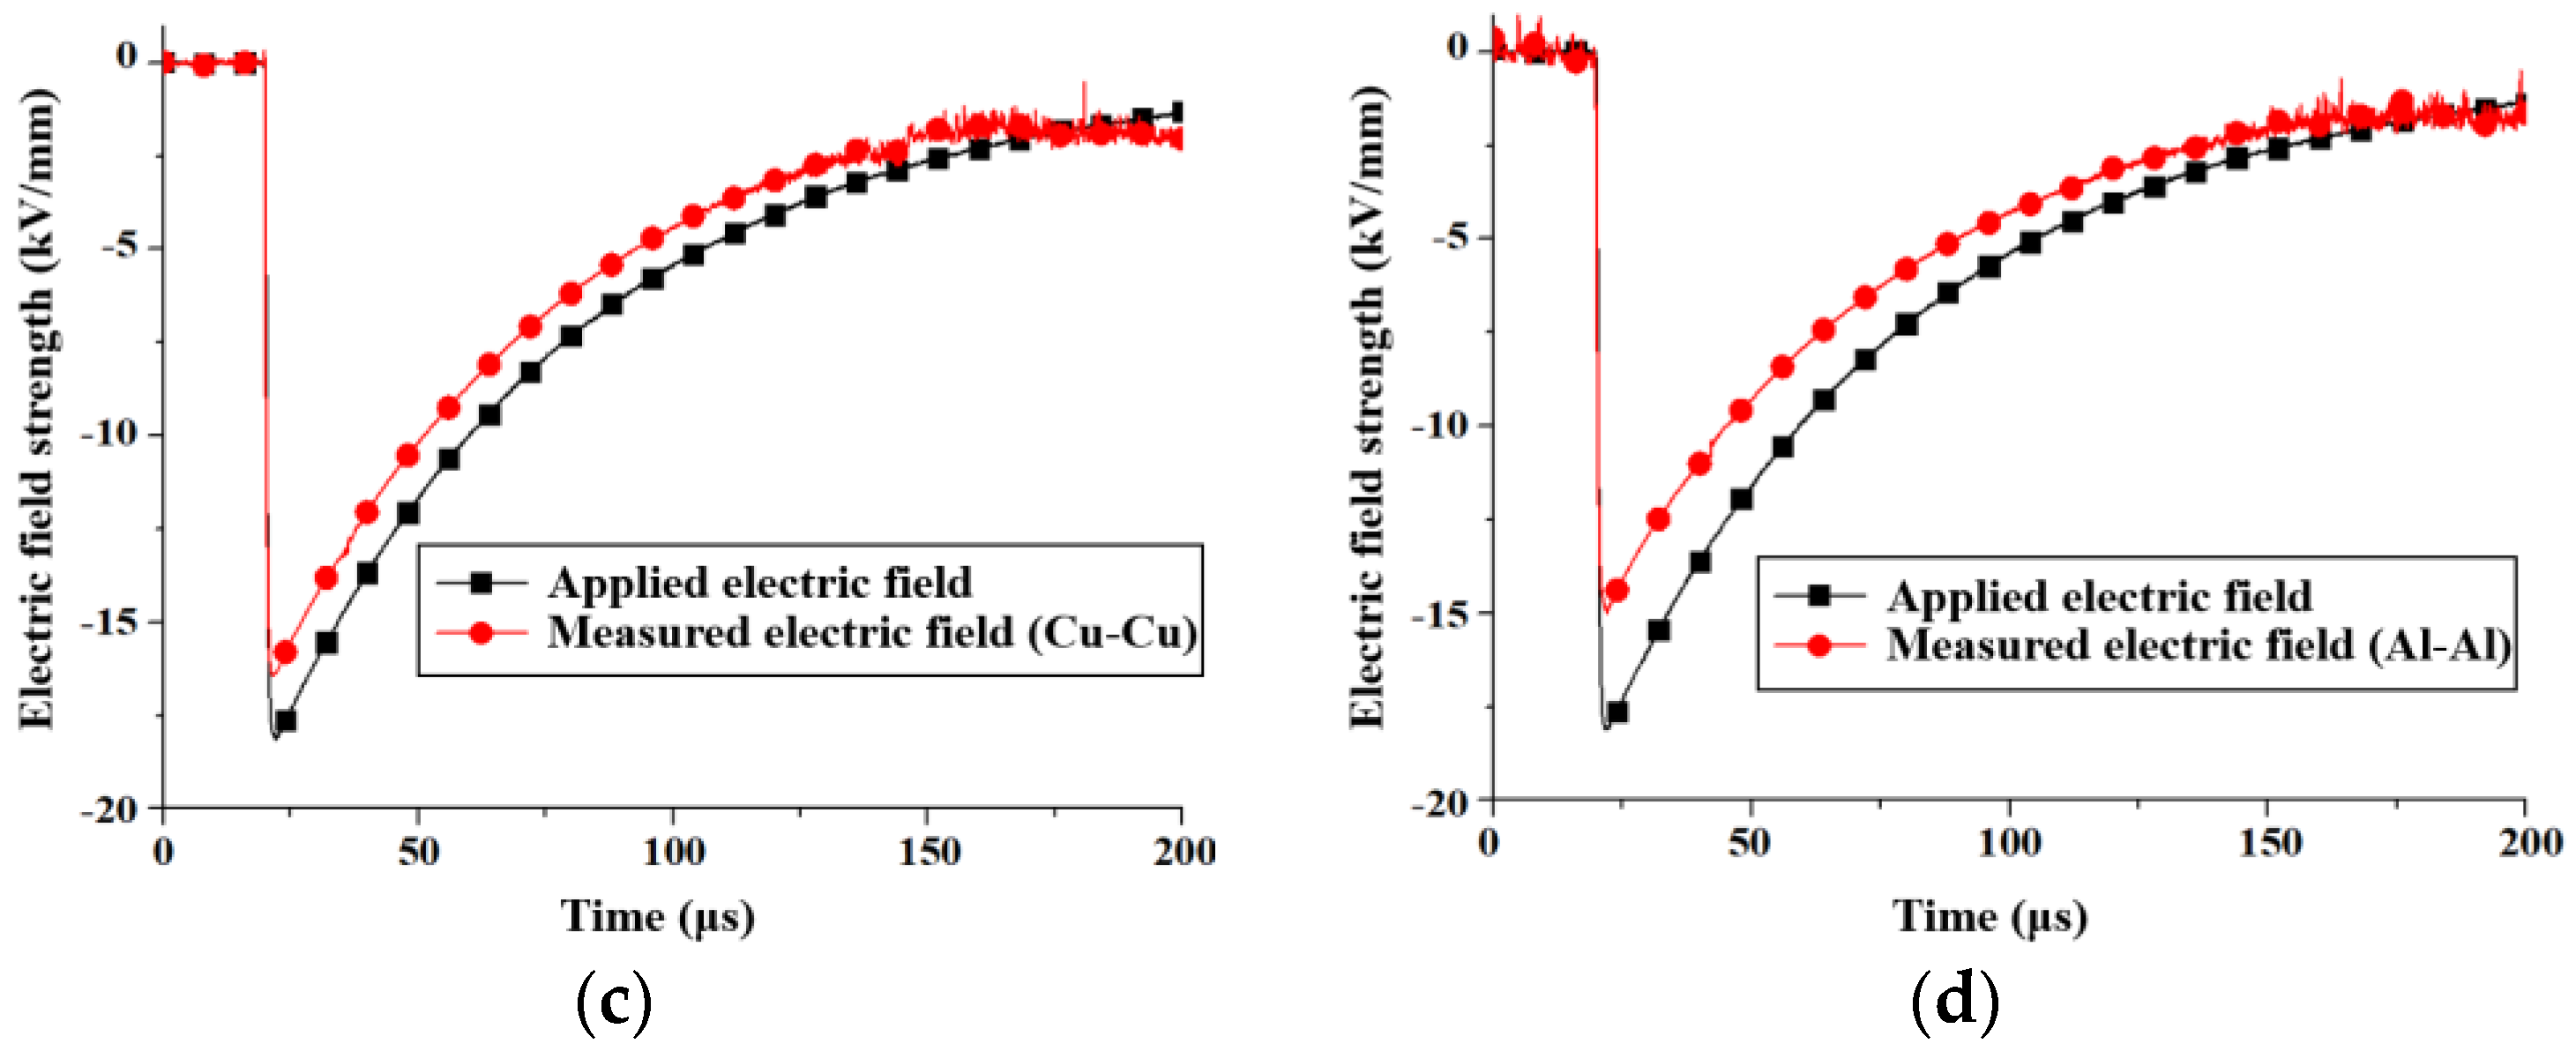
The experimental study employed brass and aluminum as electrode materials for comparison, applying ±90 kV lightning impulse voltages to both asymmetric and symmetric pressboard models. Figure 6 displays the electric field measurement results for the Cu-Cu and Al-Al electrodes in the asymmetric pressboard model.
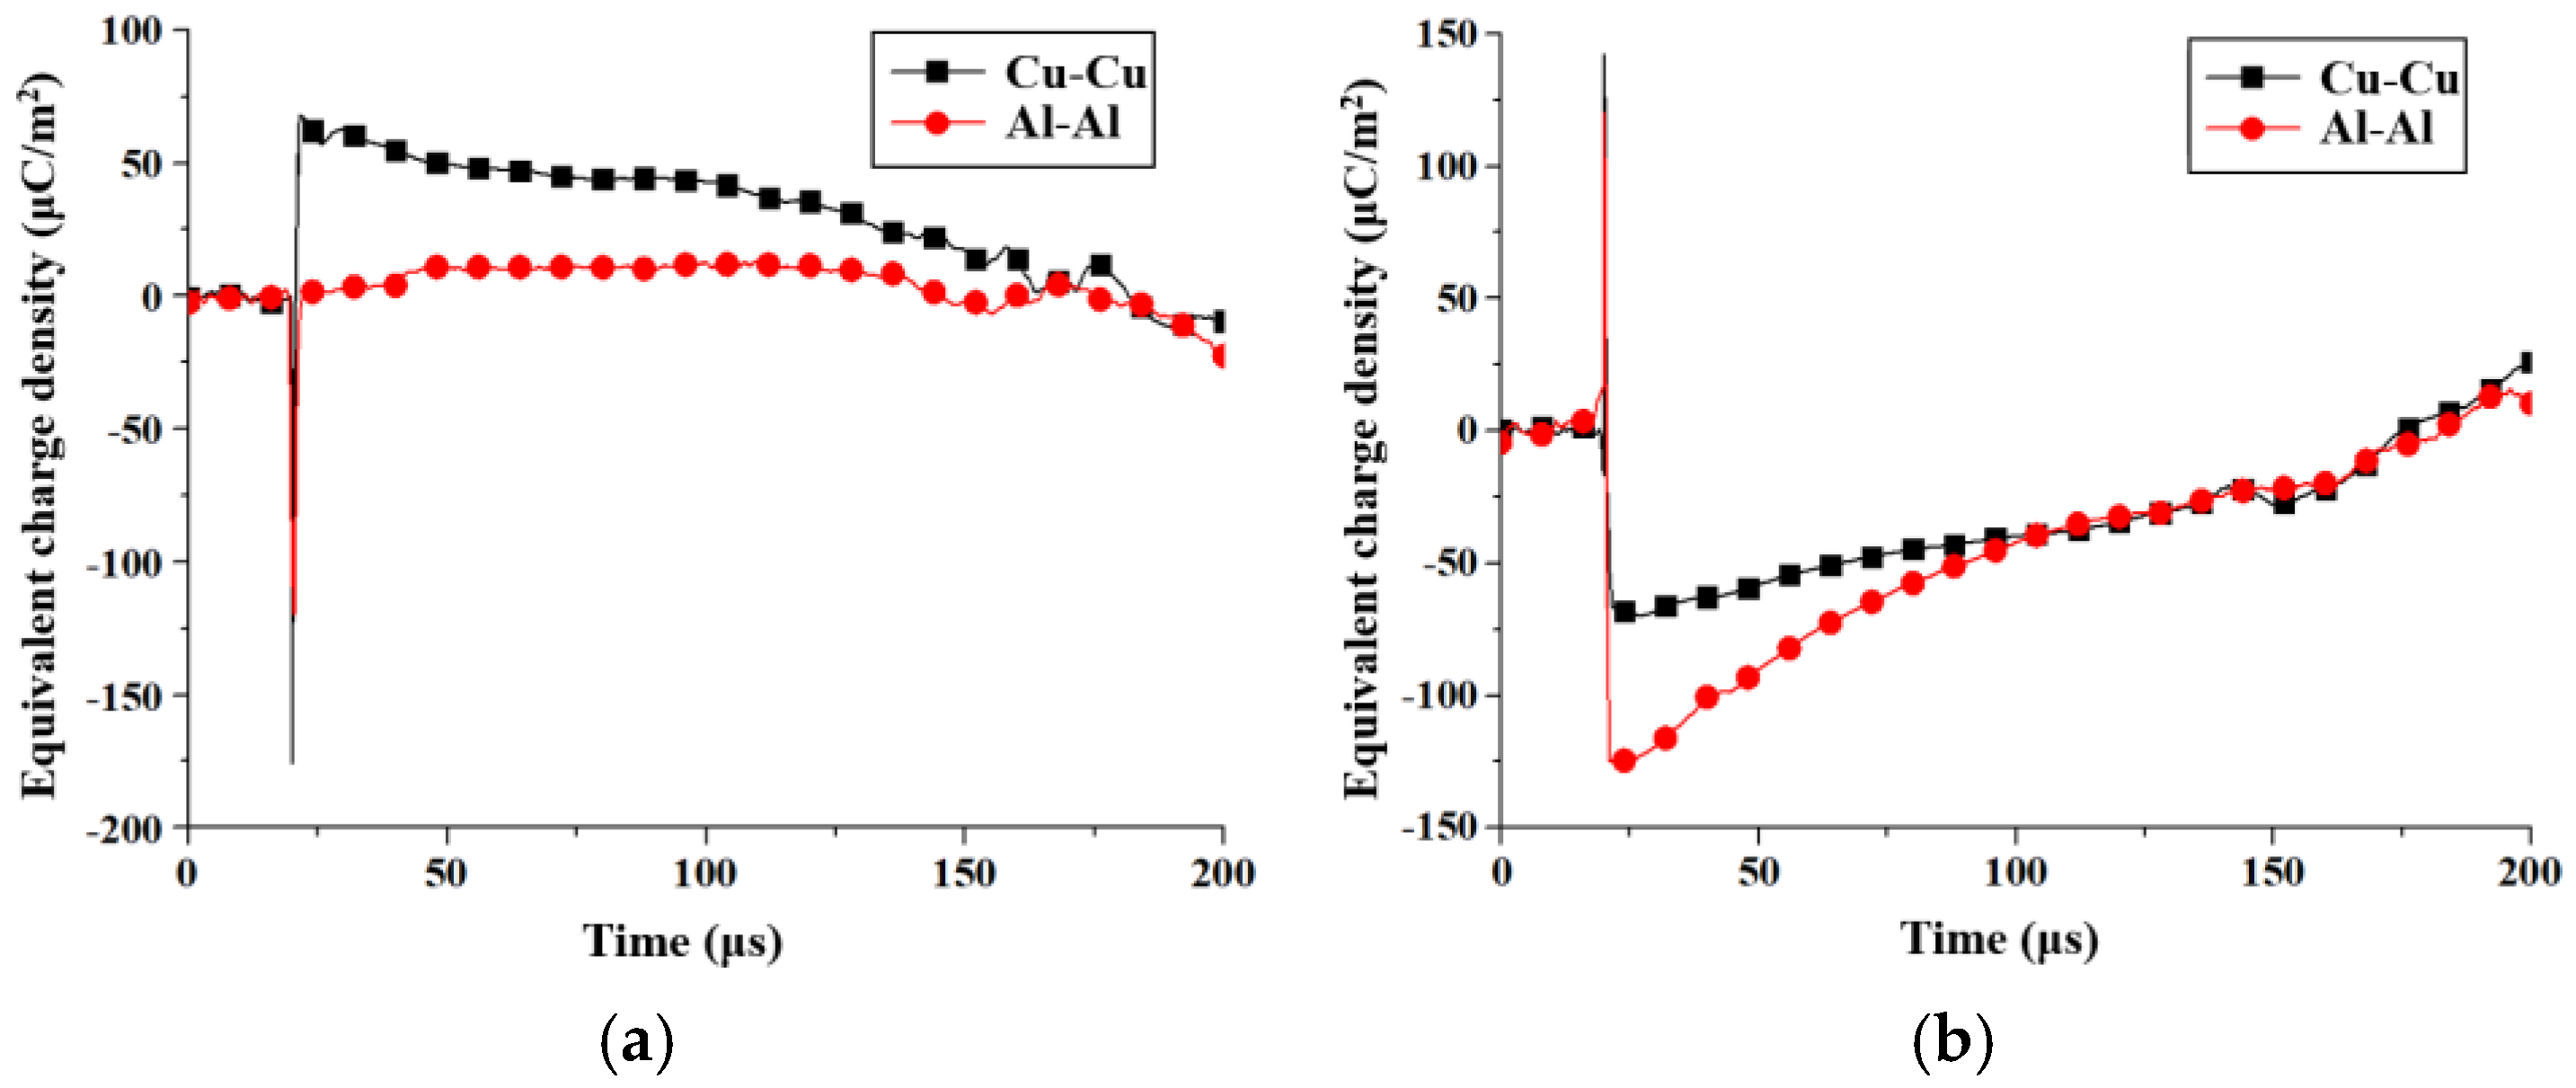
The equivalent charge densities at the measurement points of the two electrodes were calculated separately using the above method and their comparative analysis is shown in Figure 7.
As shown in Figure 6 and Figure 7, for the Cu-Cu electrodes, the peak electric field values measured under positive and negative polarity are 16.6 kV/mm and −16.4 kV/mm, respectively. For the Al-Al electrodes, there is a significant difference between the measured electric fields under positive and negative polarity. The positive polarity peak value is 18.13 kV/mm, which is close to the applied field of 18.15 kV/mm, while the negative polarity peak is −14.98 kV/mm. The equivalent charge density at the peak electric field for the Cu-Cu electrodes under both polarities is 67.7 μC/m2 and −68 μC/m2, showing minimal difference. For the Al-Al electrodes, however, there is a larger discrepancy, with equivalent charge densities of 11.2 μC/m2 under positive polarity and −124.8 μC/m2 under negative polarity. The above phenomena can be attributed to the power function of the electrode material and the nature of the injected charge; the relative details are discussed in Section 5.2.

3.2. Symmetric Pressboard Model

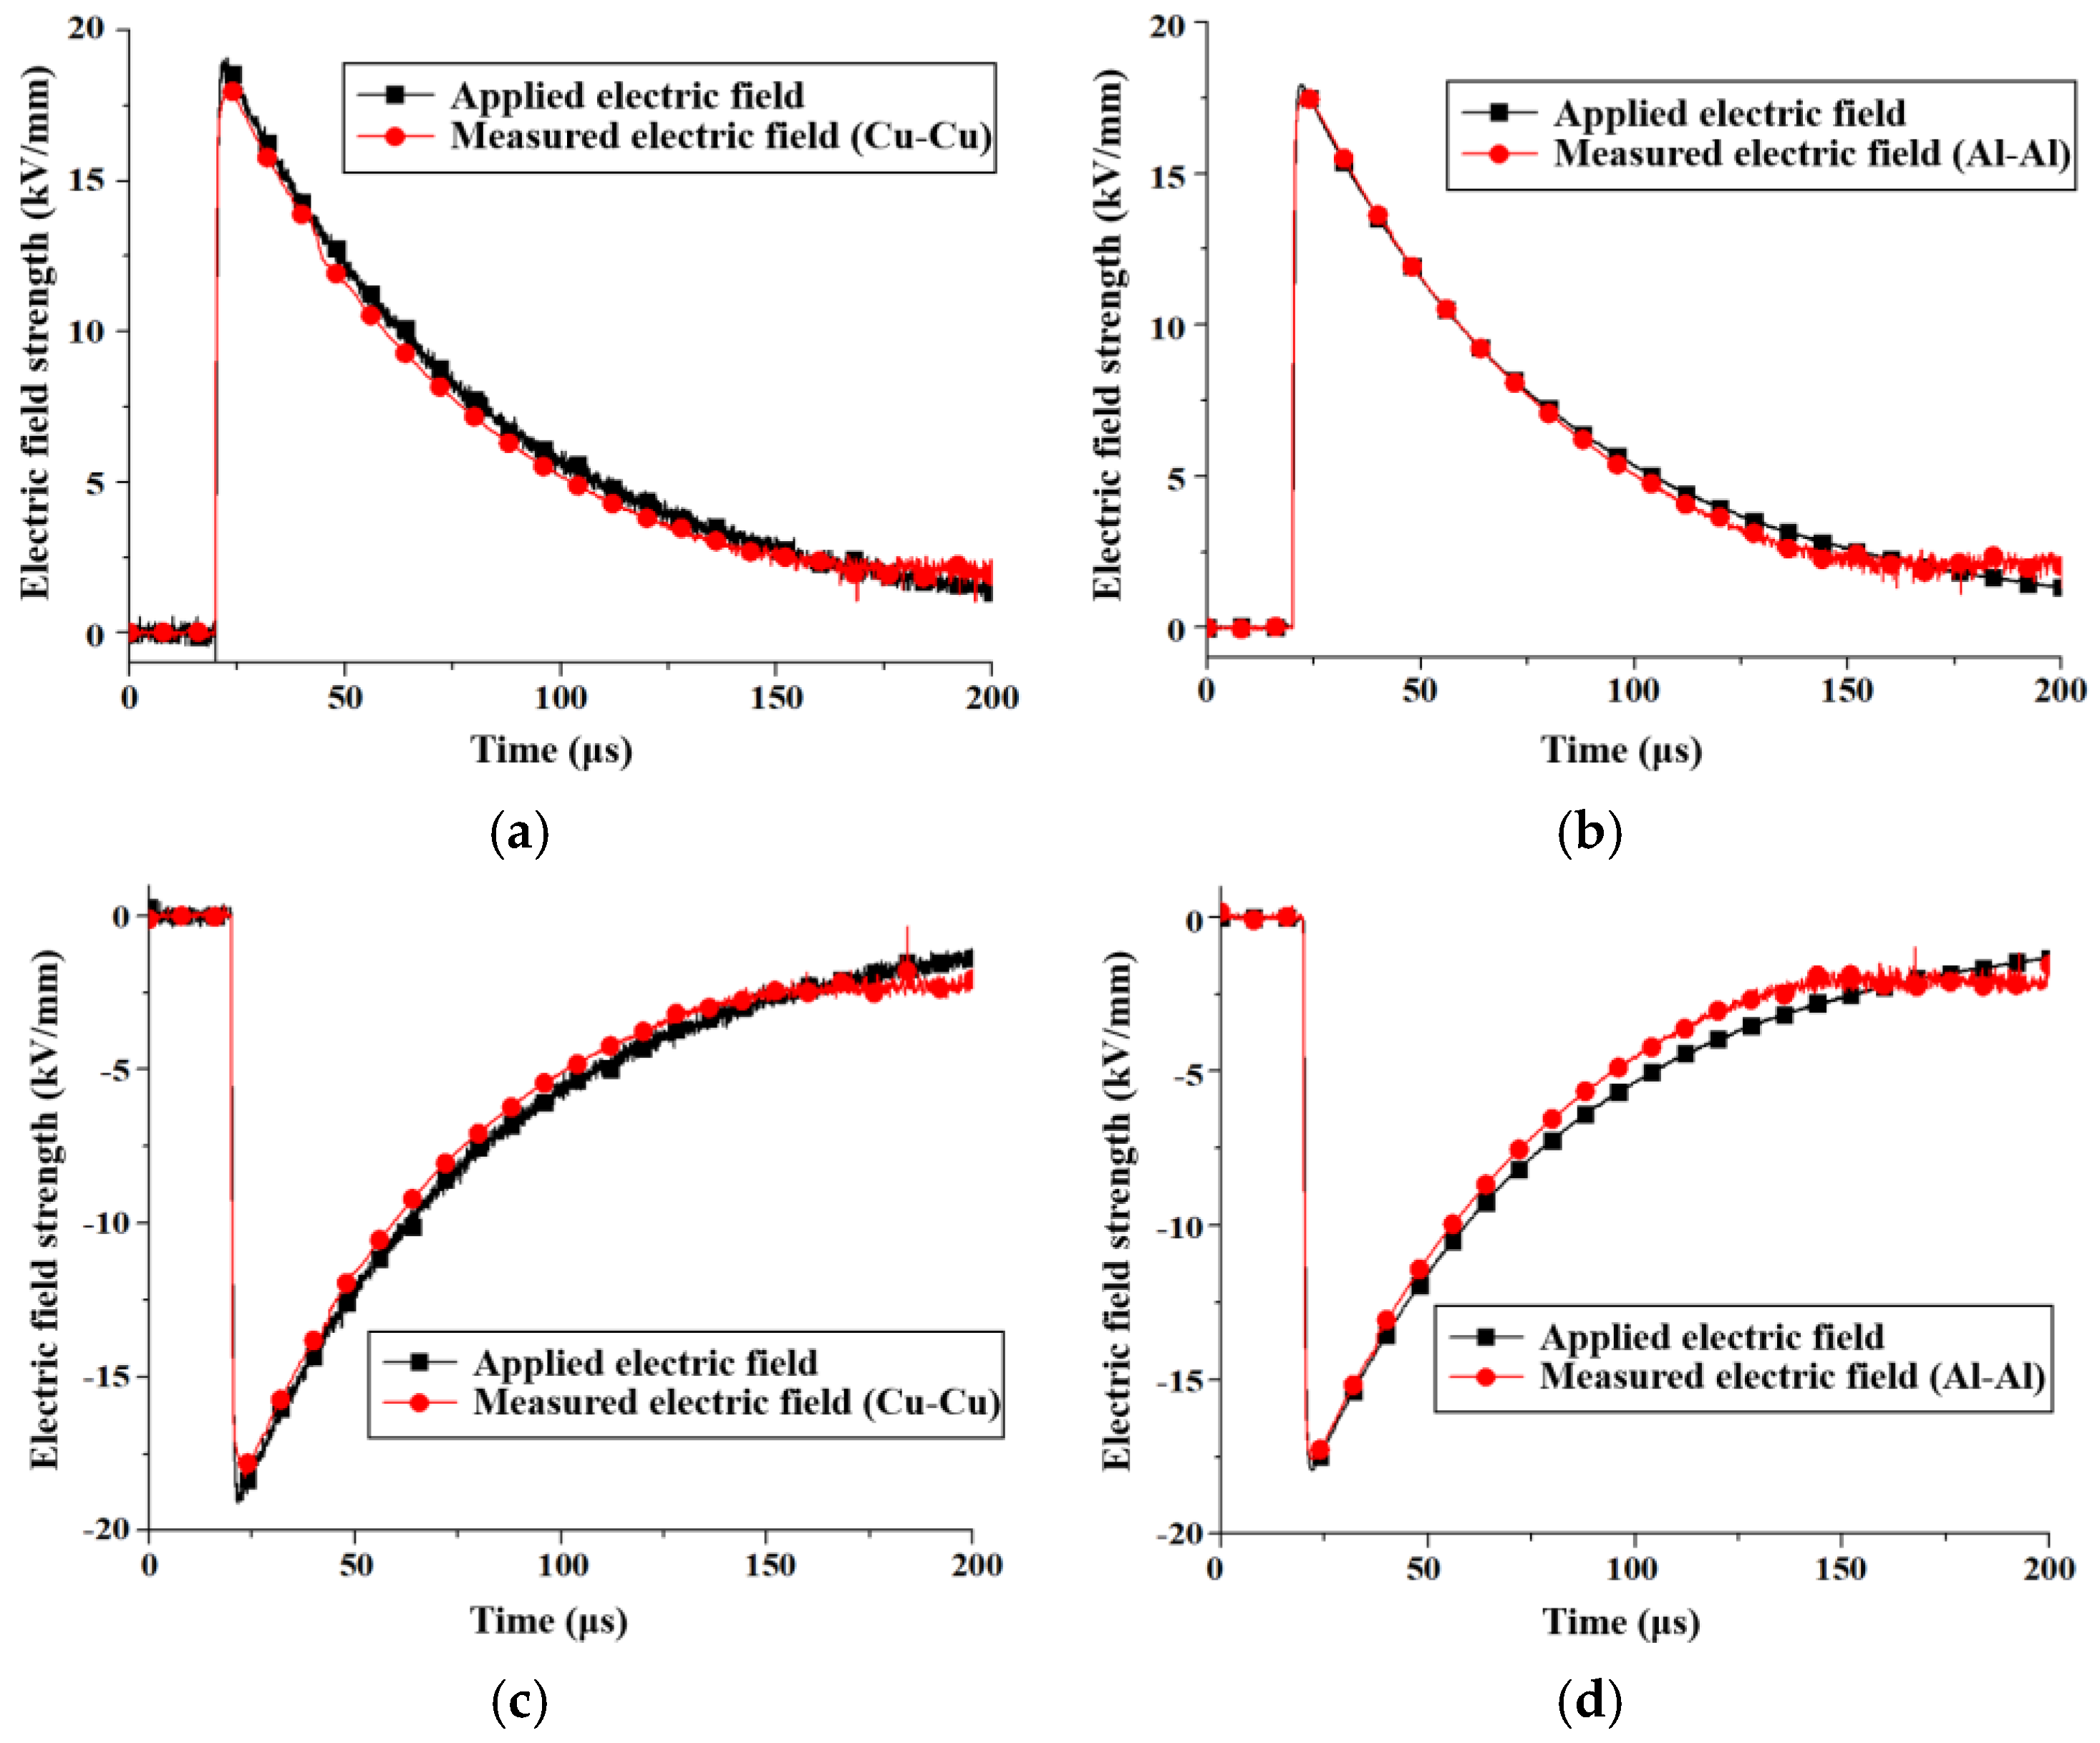
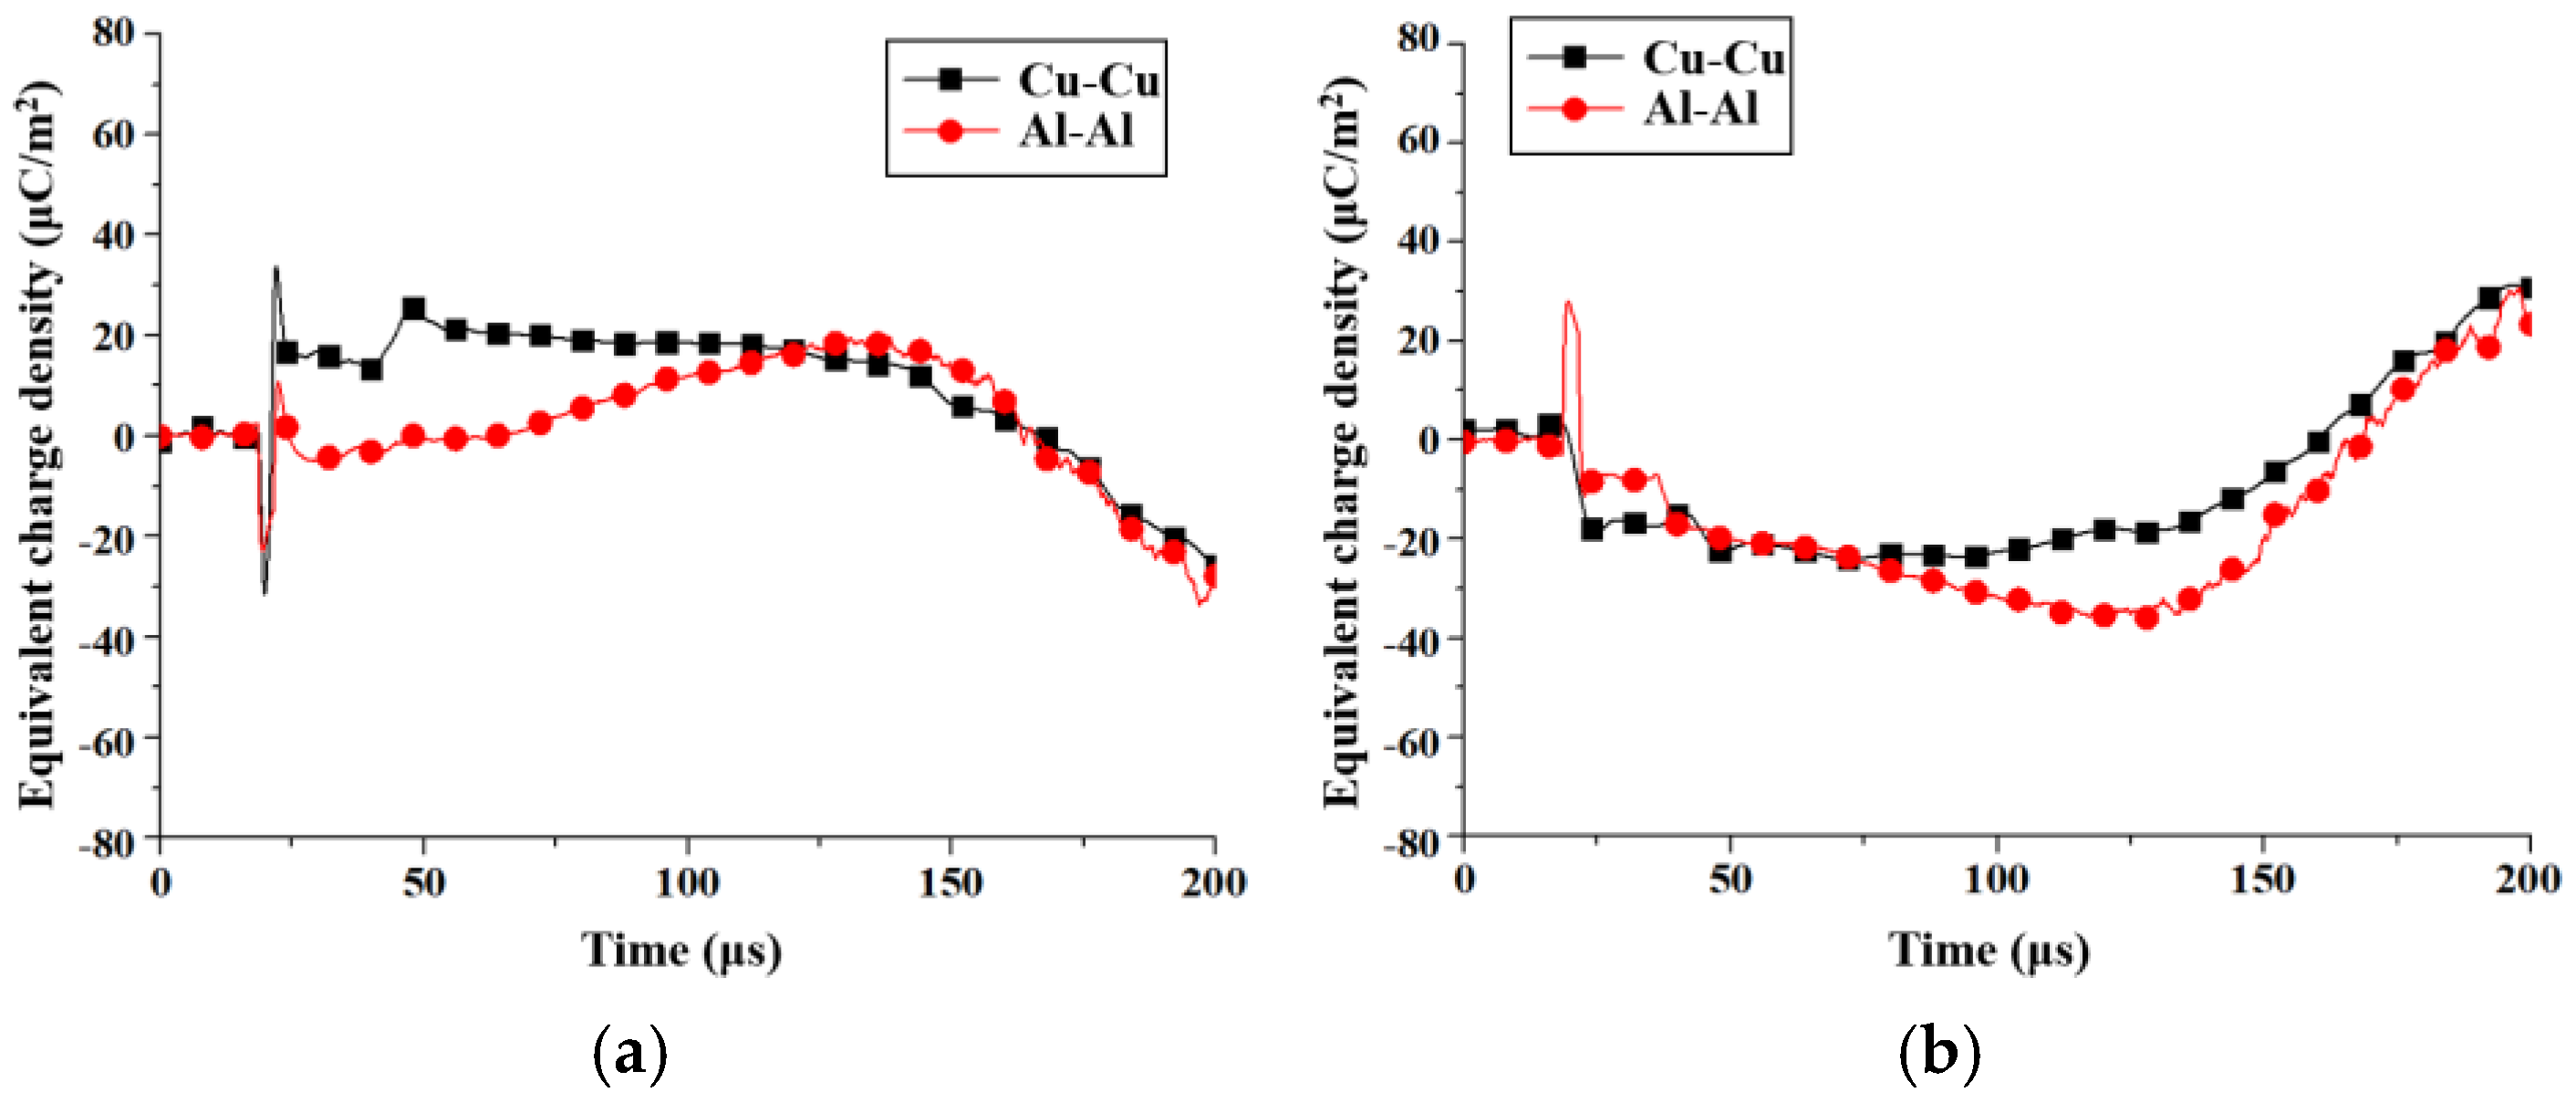
Figure 8 shows the electric field measurement results for the Cu-Cu and Al-Al electrodes under the symmetric pressboard model, while Figure 9 compares the equivalent charge densities at the measurement points for both types of electrodes.
As shown in Figure 8 and Figure 9, for the Cu-Cu electrodes, the peak electric field values measured under positive and negative polarity are 18.2 kV/mm and −18.3 kV/mm, respectively, and their absolute values are close to the applied electric field. For the Al-Al electrodes, the peak electric field values under positive and negative polarity are 17.6 kV/mm and −17.7 kV/mm, respectively, and are also close to the applied electric field. The equivalent charge densities for both types of electrodes in the symmetric pressboard model are significantly lower than those in the asymmetric model. For the Cu-Cu electrodes, the peak equivalent charge densities under positive and negative polarity are 22.5 μC/m2 and −18.5 μC/m2, respectively. For the Al-Al electrodes, the values are 10.7 μC/m2 and −11.2 μC/m2, respectively. This reduction in charge density suggests a more uniform electric field distribution and potentially more effective insulation performance in the symmetric pressboard model.

4. Electric Field in Oil with Electrodes Covered by Insulating Paper

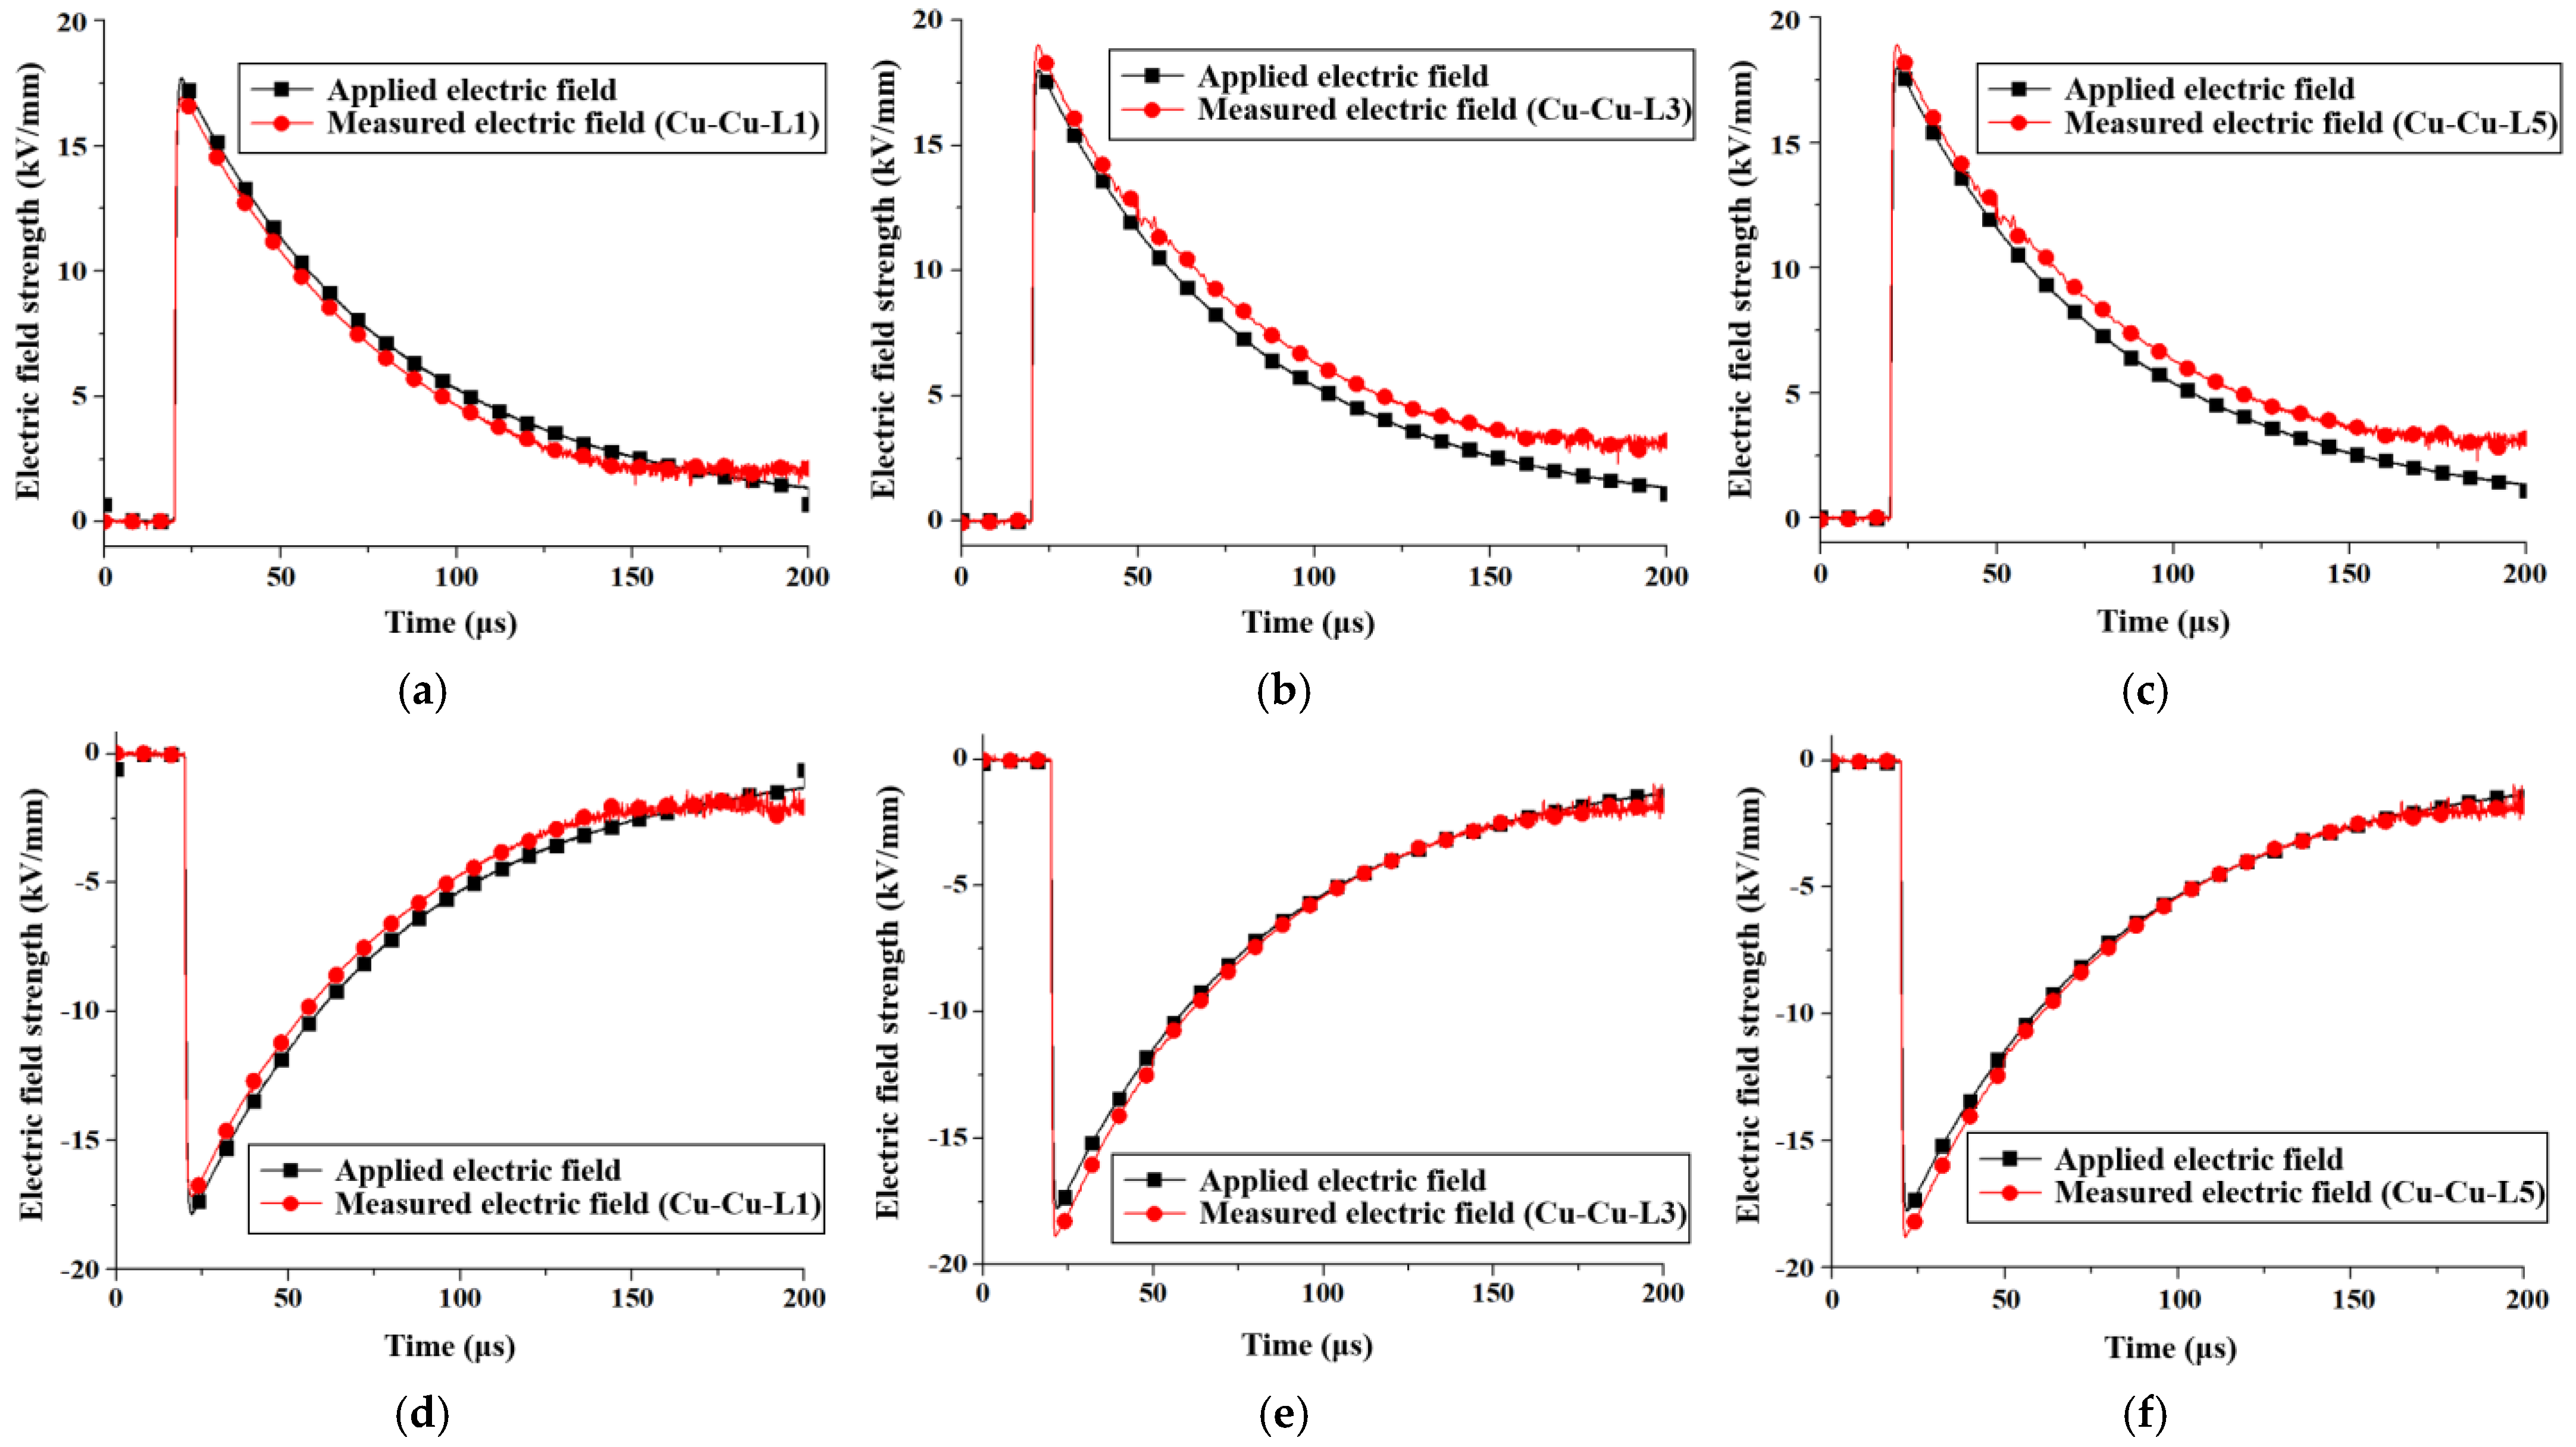
The experiment involved wrapping the upper and lower electrodes with insulating paper and measuring the changes in the midpoint electric field within the oil gap under lightning impulse voltages. The number of insulating paper layers varied—1 layer, 3 layers, and 5 layers—to observe whether the number of layers also plays a role in obstructing and capturing charge movement. Figure 10 depicts the changes in the electric field for positive and negative polarities when the Cu-Cu electrodes are covered with 1, 3, and 5 layers of insulating paper.
Figure 11 shows the changes in the electric field for positive and negative polarities when Al-Al electrodes are covered with 1, 3, and 5 layers of insulating paper. These figures will provide further insights into how Al electrodes behave under similar insulating conditions compared to copper electrodes, and how the number of insulating layers influences the effectiveness of the insulation in modifying the electric field.
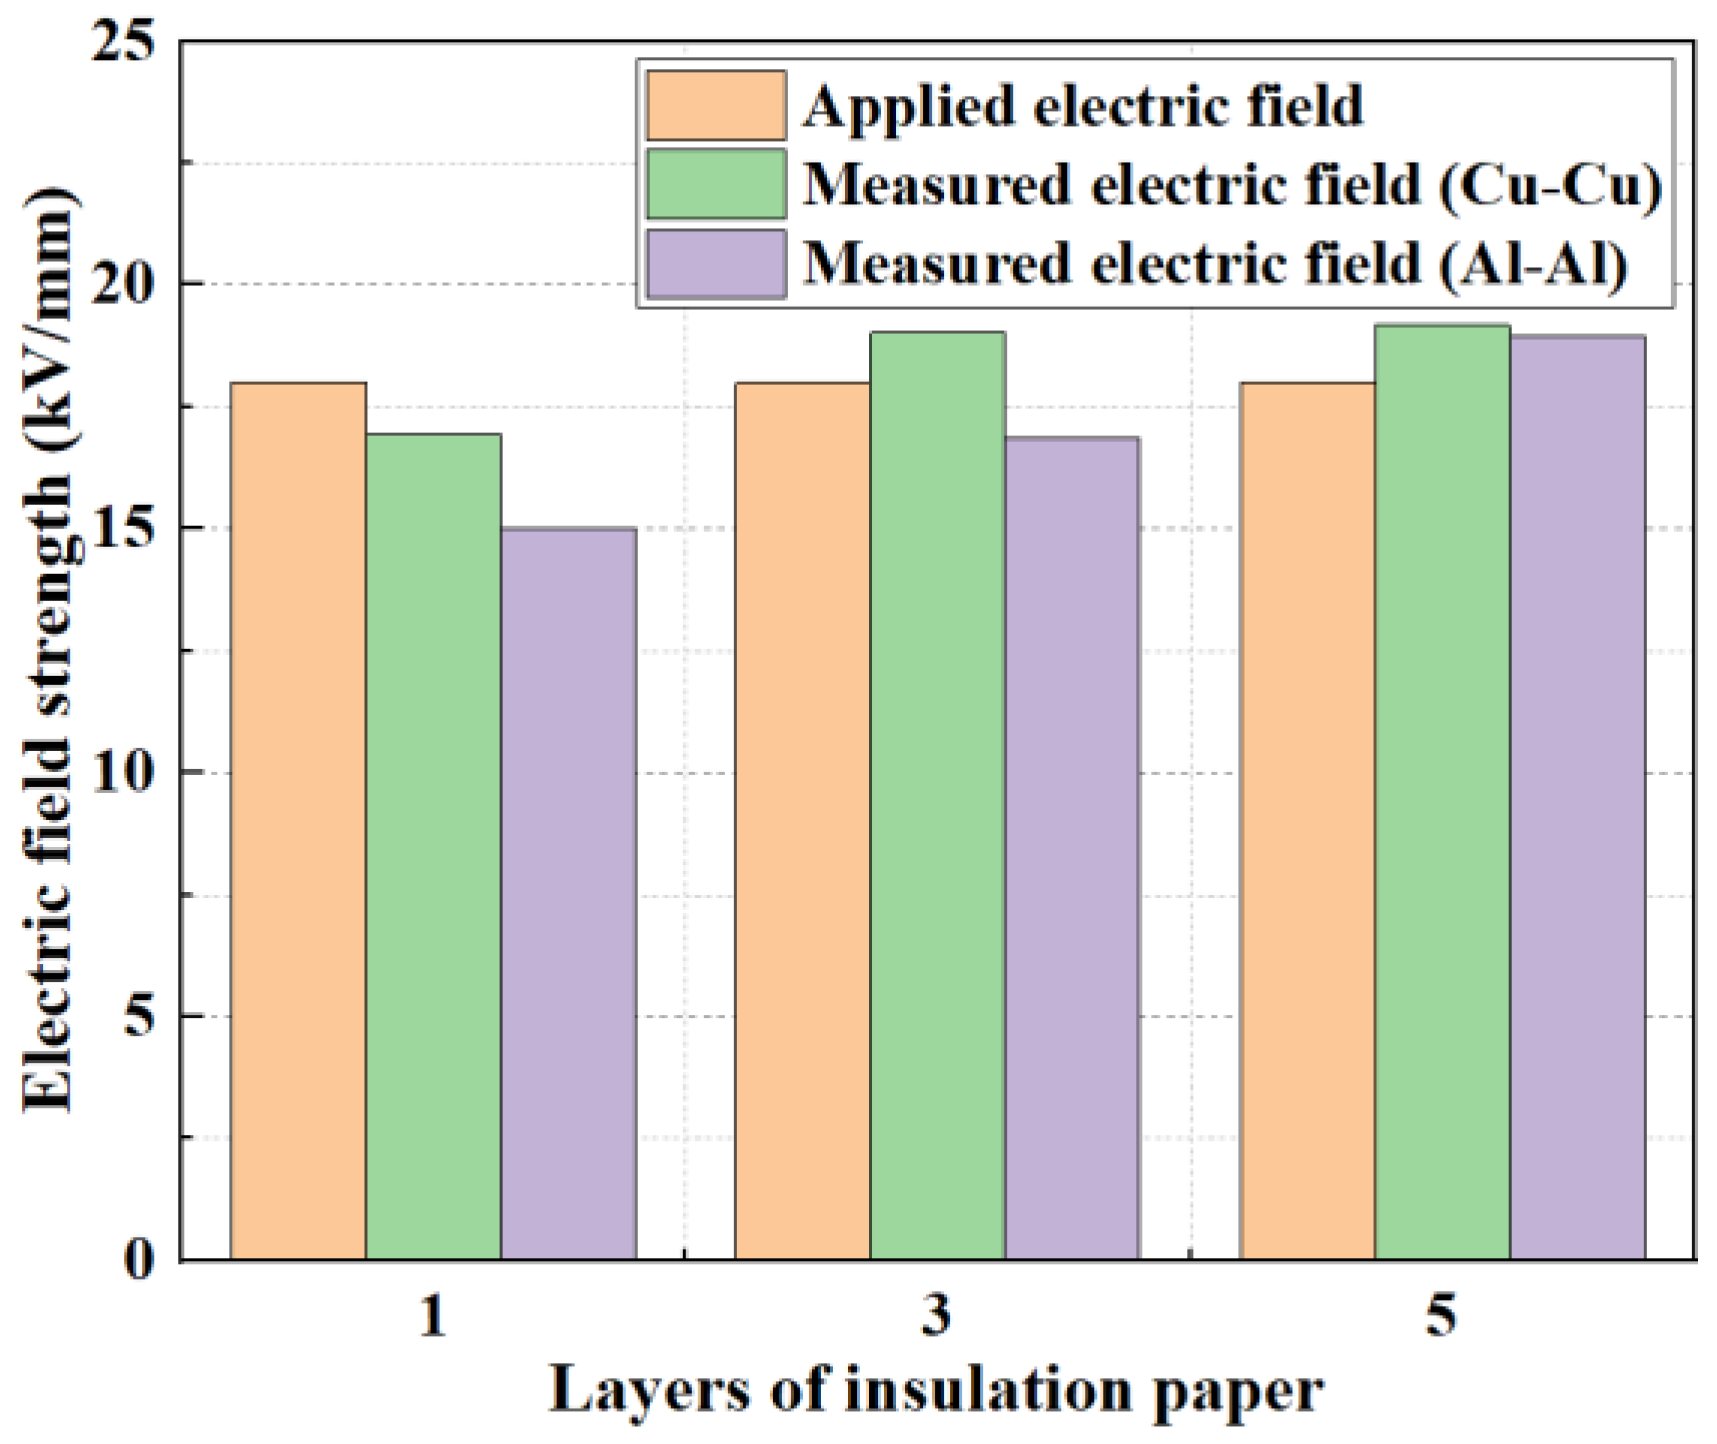
According to Figure 10 and Figure 11, the comparative analysis of peak electric field when Cu-Cu electrodes and Al-Al electrodes are covered with one, three, and five layers of insulating paper is plotted as shown in Figure 12.
From Figure 12, it is evident that (1) when covered with one layer of insulating paper, the actual peak electric field measured under Cu-Cu electrodes and Al-Al electrodes is 16.94 kV/mm and 15.02 kV/mm, respectively. Covered with three layers of insulating paper, the peak electric field is 19.01 kV/mm and 16.87 kV/mm, respectively, 19.18 kV/mm and 18.97 kV/mm for five layers of insulating paper. (2) Considering the externally applied electric field of 18 kV/mm, the measured peak field strength is lower than the externally applied field strength when the Cu-Cu electrodes are covered with one layer of insulating paper, and higher than the externally applied field strength when they are covered with three or five layers of insulating paper. For the Al-Al electrodes, the measured peak field strength is higher than the applied field strength only when five layers of insulating paper are used. (3) The measured peak field strength of the Cu-Cu electrodes is 5.6% higher than the externally applied field strength when five layers of insulating paper are covered, while it is 5.4% for Al-Al.

5. Analysis and Discussion of Space Charge Behaviors

5.1. Charge Behaviors in Oil

5.1.1. Space Charge Injection Mechanism

(1)
The generation of negative charge
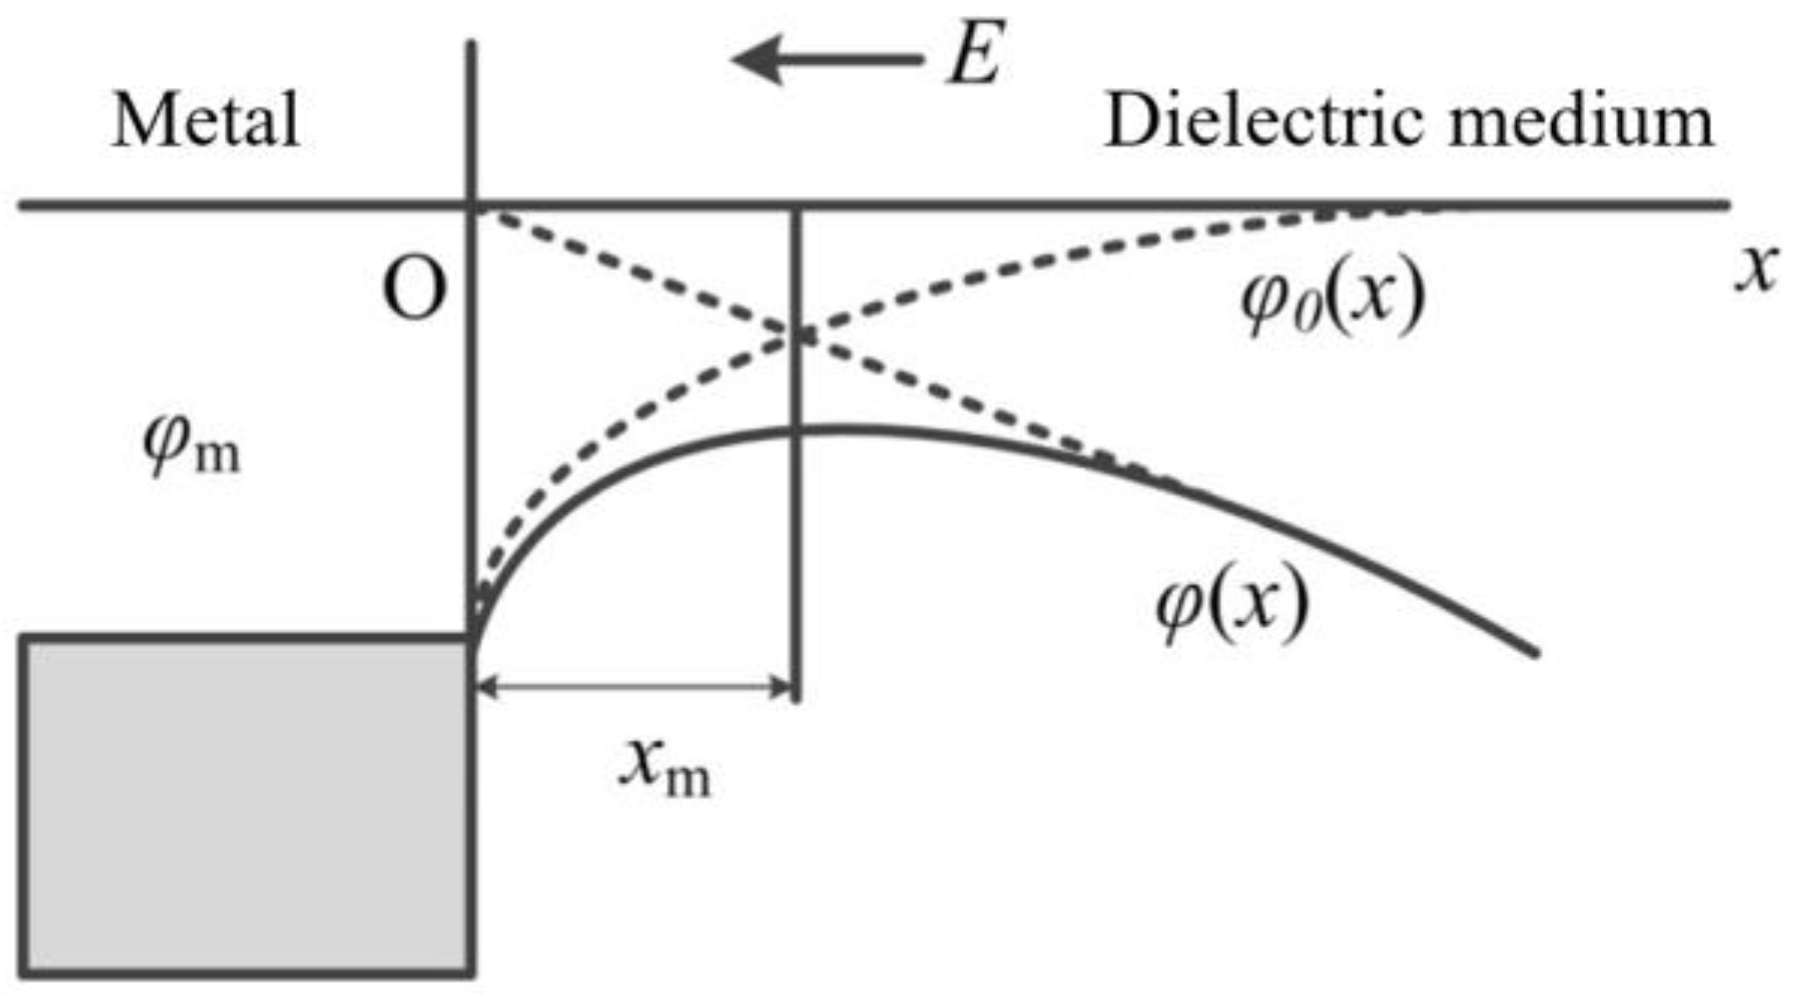
Considering the significantly lower work function of metals compared to dielectrics, the density of free carriers at and near the contact interface between the two is much higher than in the bulk of the material. This interface becomes a layer where carriers accumulate, and electrons from the metal electrodes are injected into the dielectric [15]. Therefore, under a high electric field, the dielectric will occur in the carrier proliferation process; that is, in addition to the dielectric itself being ionized to produce carriers available for transport charge, in a certain temperature and field strength, constituting a field-assisted thermal emission, under the electrons or holes away from the electrodes also into the dielectric, so that the number of carriers in the dielectric is greatly increased. Therefore, the Schottky barrier curve at the metal-dielectric contact interface is shown in Figure 13 and the metal electrode to vacuum thermal emission current density can be described by Equation (7).
J ( T , 0 ) = A T 2 exp ( φ m k T )
In Equation (7), J(T,0) represents the electrode emission current density when T ≠ 0 and E = 0, φm is the work function of the metal, and A is a function related to the electron mass and charge. In Figure 13, the potential barrier to be overcome to set electrons from the metal into the dielectric is the contact barrier φB, and the barrier curve formed by the interaction between the injected electrons and their induced charges on the metal surface represents the curved energy band curve φ(x).
The above phenomenon can be analyzed using the mirror charge method [16]. Consider an electron emitted from point x of an electrode in contact with a dielectric near a metal. This electron will induce a positive charge in the metal and the electron is subjected to the force of its image charge field, called the image force, which can be calculated from Equation (8), while the potential of the electron in the image charge field is given by Equation (9).
F 1 = e 2 4 π ε r ε 0 ( 2 x ) 2
φ 0 ( x ) = x F 1 d x = e 2 16 π ε r ε 0 x
Assuming that the external electric field E is directed towards the negative x-axis, it assists the electron in overcoming the image force and subsequently escaping from the metal surface. The relationship between the electron potential and its distance x from the metal surface is given by Equation (10), and the maximum value of this potential is represented by Equation (11).
φ ( x ) = e E x e 2 16 π ε r ε 0 x
φ m ( x ) = e 3 E 4 π ε 0
The potential barrier that electrons must overcome to transition from the electrode into the dielectric is denoted as the metal escape work φmX. According to the Schottky barrier model, the interface barrier is expressed as φmXφ0(x). In the presence of an external electric field, this injected barrier is further reduced to φmXφ(x). When E ≠ 0, the effective escape work of the field-assisted electron thermionic emission can be calculated by Equation (12), and the electron thermionic emission current density, facilitated by the electric field, is described by Equation (13).
φ ( E ) = φ m e 3 E 4 π ε 0 = φ m Δ φ
J ( T , E ) = A T 2 exp [ ( φ m Δ φ ) k T ] = J ( T , 0 ) exp ( Δ φ k T )
When the external electric field is sufficiently strong, the interface barrier can be reduced to zero. At this point, the critical field strength Ec, at which the barrier vanishes, is determined by Equation (14).
E c = ( 4 π ε r ε 0 e 3 ) φ m 2
The work function of most metals typically falls within a few electron volts, leading to Ec on the order of 1010 V/m. Experimental results have shown that when the field reaches just 1% of Ec, or approximately 108 V/m, non-ohmic currents in the dielectric become substantial, indicating that the Schottky emission model may not fully explain this behavior. Electrode surfaces are not perfectly smooth, often featuring sharp tips and asperities that locally enhance the electric field to values sufficient for electron emission via tunneling effects, reaching 108 V/m. Quantum tunneling theory suggests that electrons can be emitted from the metal into the dielectric even if their energy is below the potential barrier, through a process known as field-induced emission. The current density for this field-induced emission is described by Equation (15).
J = e 3 E 2 ( 8 π h φ m ) 2 exp 8 π ( 2 m ) 1 / 2 φ m 3 / 2 3 e h E
In Equation (15), e represents the electron charge, h is Planck’s constant, and m refers to the electron’s effective mass. This indicates that, under an applied electric field, the negative charges in transformer oil are electrons injected from the cathode. As these electrons travel toward the anode, they may interact with neutral molecules, forming negative ions.
(2)
The generation of positive charge
Under the influence of a strong electric field, electrons can detach from metal atoms and enter the oil, or, similarly, detach from neutral molecules under the same conditions. In the absence of an external electric field, the electrons in oil molecules orbit their nuclei at fixed energy levels. However, when an external electric field is applied, the rough and uneven microstructure of electrode surfaces creates regions of local high field strength. Electrons in neutral oil molecules near the anode, which are at lower energy levels, gain energy from the field, jump to higher energy levels, and become free electrons, leaving behind positively charged ions [17].
Transformer oil contains trace amounts of acids, nitrides, oxides, and hydroxyl compounds. When in contact with metal electrodes, electrochemical reactions occur, producing metal ions such as Cu2+, Fe2+, and Al3+. These ions are readily released from the metal and injected into the oil under the influence of the electric field.
As shown in Figure 14, the positive ions generated from the ionization of oil molecules, along with the Cu2+, Fe2+, and Al3+ ions injected from the electrodes, together constitute the source of positive charges in the oil.

5.1.2. Space Charge Migration Mechanism

The movement of positive and negative charges under the influence of an impulse voltage can be described in the following six stages:
(1)
Voltage Rise Stage: Electrons are distributed close to the cathode surface. The positive ions formed by the loss of electrons from the oil molecules and the positive ions injected from the electrodes accumulate near the anode surface. The oil gap acts as a charge reservoir, and the space charge field strengthens the oil’s electric field. The charges start moving along the electric field lines.
(2)
Charge Movement Stage: Due to the lower mass of electrons compared to positive ions, the electron velocity is much higher. At this stage, electrons are considered to be accelerating, while the positive ions remain stationary near the anode.
(3)
Formation of a Negative Charge Shielding Layer: As the negative charges move toward the anode, they form a shielding layer. The movement slows down as the negative charges accumulate near the anode, forming a reverse electric field that reduces the strength of the applied electric field in the oil. The measured electric field begins to decrease relative to the applied field.
(4)
Charge Accumulation Stage: As more negative charges accumulate, the electric field at the measurement point decreases further. When the voltage approaches its peak, the rate of charge injection balances with the rate of recombination between positive and negative charges, and the space charge’s weakening effect reaches its maximum.
(5)
Voltage Drop Stage: After the voltage peak, the injected charge amount decreases, and due to recombination, the amount of positive and negative charges also reduces significantly. The negative charge front begins to retreat toward the cathode.
(6)
Return to Initial State: When the voltage decreases to near zero, the charge injection from the electrodes drops significantly, and the remaining positive and negative charges in the oil gap recombine and disappear. The space charge field created by the accumulated charges enhances the electric field at the measurement point, causing the measured field to exceed the applied field slightly.

5.2. Effect Mechanism of Insulating Pressboard

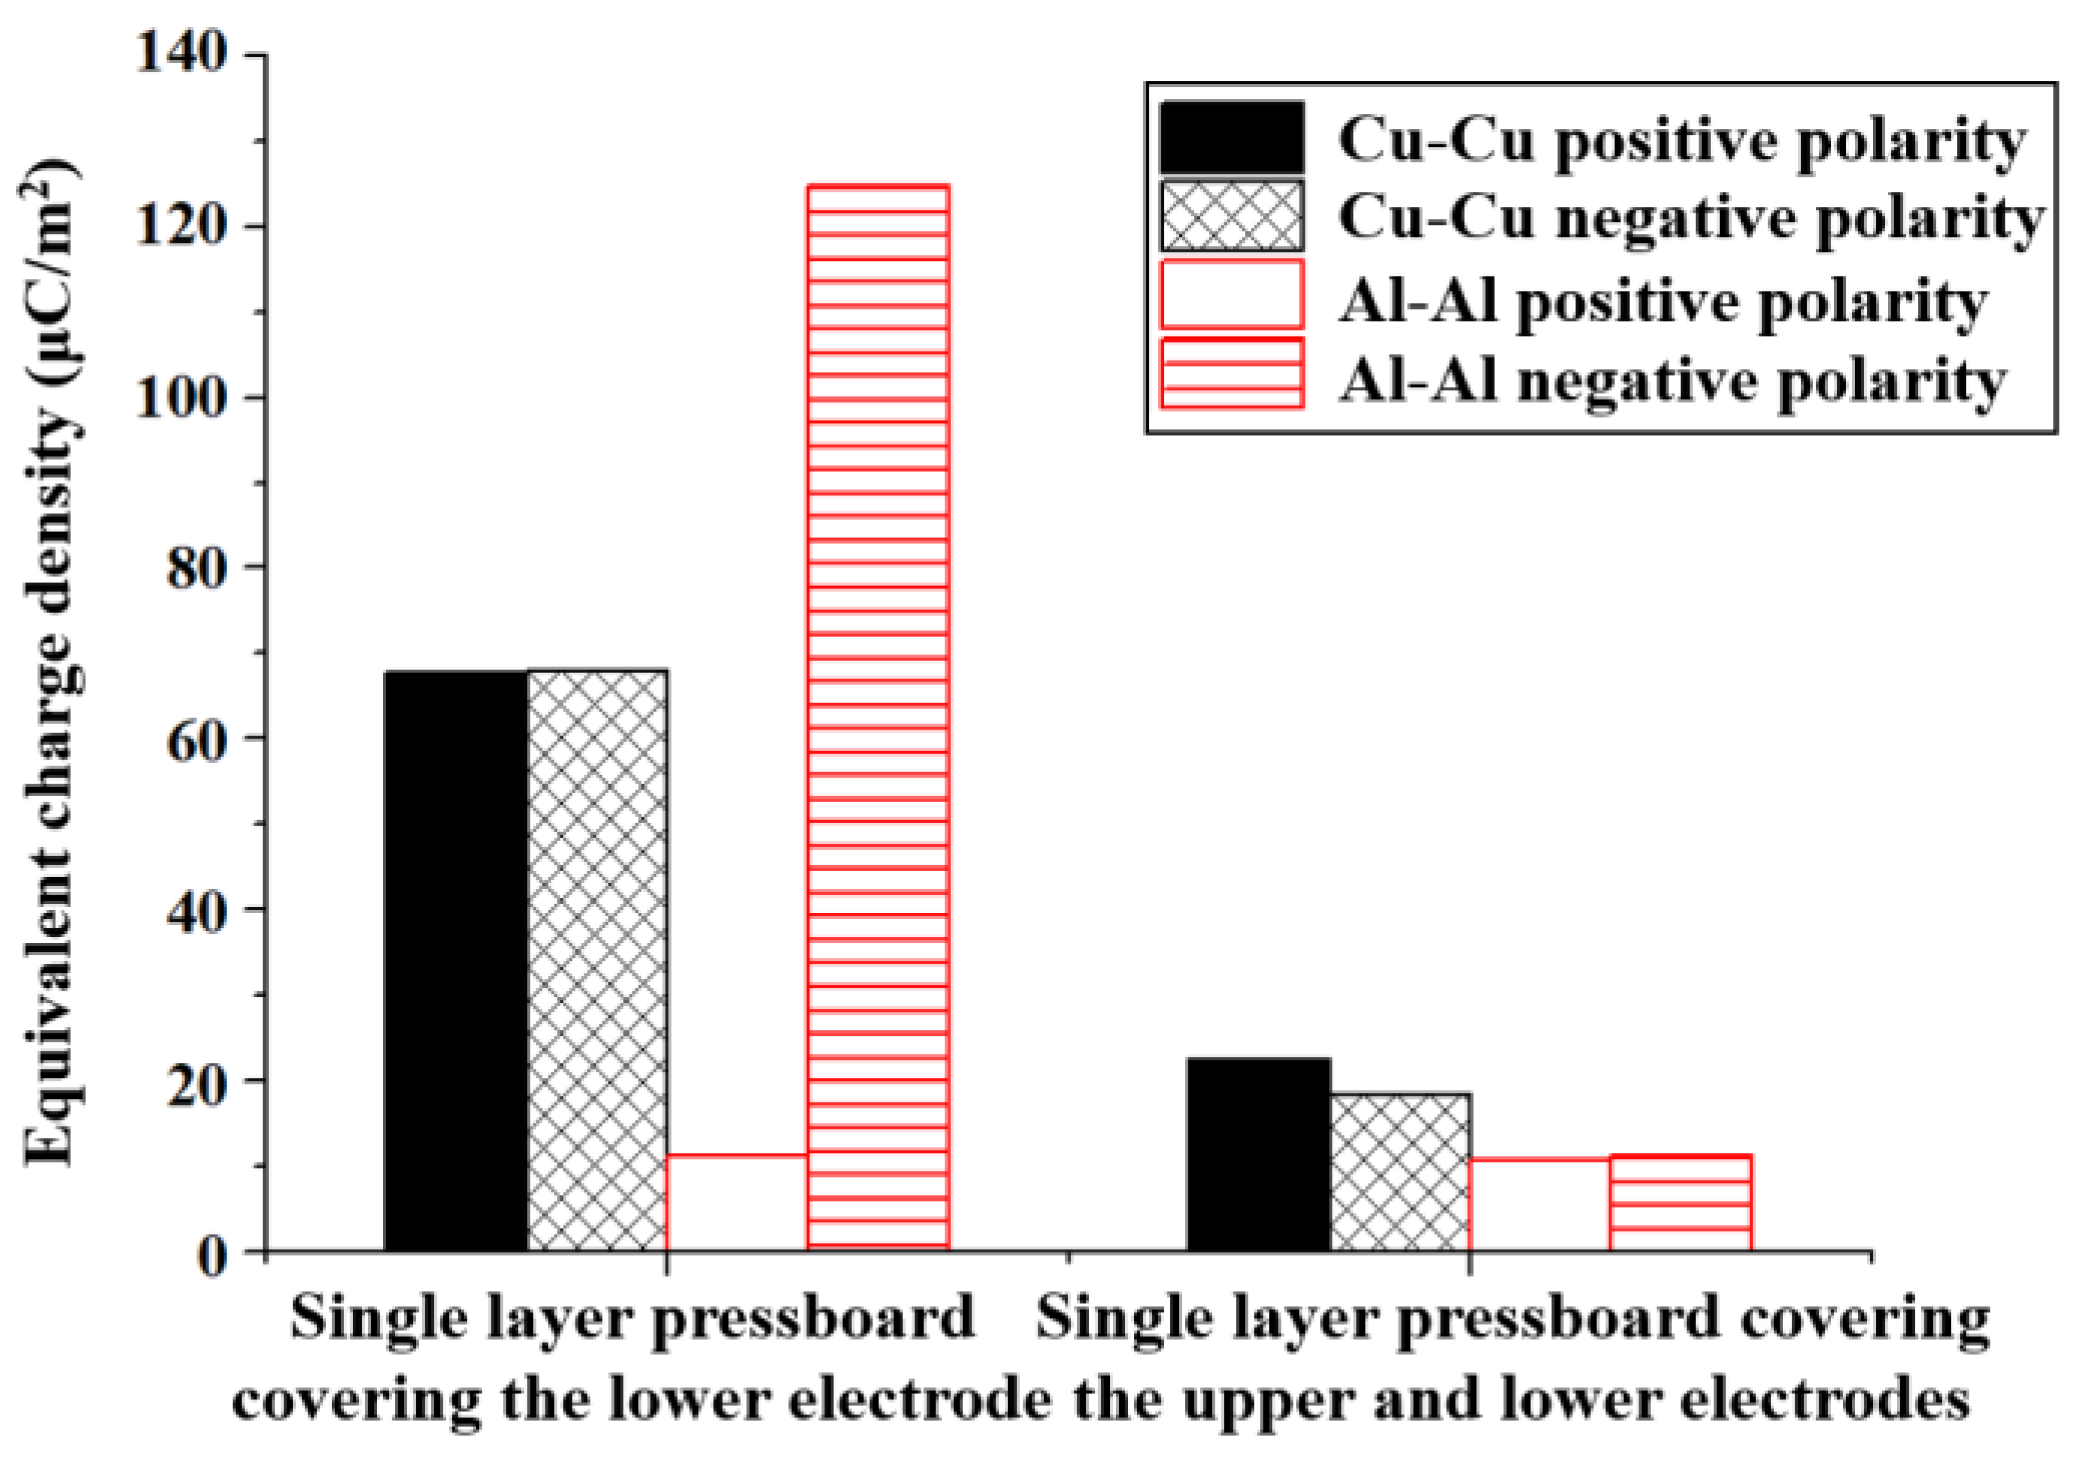
In the two types of insulating pressboard models, Figure 15 shows the comparison of the absolute values of equivalent charge densities at the peak moments for Cu-Cu and Al-Al electrodes.
From Figure 15, it is evident that (1) in the asymmetric pressboard structure, the Cu-Cu electrodes utilize bipolar injection, blocking the charges injected by the lower electrode regardless of polarity, causing the upper electrode’s charges to move towards the lower electrode under the electric field influence. This creates a charge layer at the oil-paper interface that weakens the external electric field. Conversely, the Al-Al electrodes employ unipolar injection, where in positive polarity, the pressboard blocks and captures the negative charge from the lower electrode with no charge injection from the upper electrode, resulting in a measured electric field that closely matches the externally applied field. In negative polarity, the pressboard does not block the negative charge injected from the upper electrode, which also weakens the external electric field at the oil-paper interface. (2) In the symmetric pressboard structure, the pressboard’s blocking and capturing effects prevent charges injected by both electrodes from moving into the oil, leading to an electric field that is largely unaffected by space charges, making the measured field closely align with the externally applied field.
The above phenomena can be attributed to the power function of the electrode material and the nature of the injected charge. Under the same external electric field, metals with lower work functions allow charges to more easily overcome the potential barrier and enter the transformer oil. Table 2 lists the work functions of metals found in Al and Cu, showing that Al < Cu in terms of work function.
In addition, the charge injection mechanism is different for Cu-Cu and Al-Al electrodes in asymmetric pressboard structures. For Cu-Cu electrodes, the charge injection is bipolar, which means that regardless of the polarity, the pressboard prevents charge injection from the lower electrode, while the upper electrode injects charge. These charges, which cannot be neutralized, move towards the lower electrode under the influence of the electric field, forming a charge layer at the oil-paper interface and thus weakening the applied electric field.
In contrast, the charge injection at the Al-Al electrode is unipolar. Under positive polarity conditions, the pressboard blocks the negative charge injected by the lower electrode, while the upper electrode does not inject a charge, thus bringing the measured electric field close to the applied electric field. However, under negative polarity conditions, the pressboard does not block the negative charge injected by the upper electrode, thus forming a charge layer at the oil-paper interface and weakening the applied electric field.
The impact of charge migration can be analyzed from two perspectives: the macrostructure and the microstructure of the insulating pressboard used. From a macrostructural standpoint, the insulating pressboard discussed in this article is made of plant cellulose, a type of chain-like high polymer composed of glucose units that are insoluble in water. The plant fibers are purified through a reaction with a sodium sulfide solution and, after drying, have a degree of polymerization around 2000. From a microstructural perspective, plant cellulose is a linear polymer linked by β-D-glucose units through 1,4-glycosidic bonds, primarily composed of carbon, hydrogen, and oxygen [18]. The molecular formula of this compound is illustrated in Figure 16.
From Figure 16, it is clear that the molecular structure of cellulose contains cyclic structures, where the rings are connected by ether bonds. Each hexagonal ring contains one oxygen atom, and three hydroxyl groups are attached to each ring, with one of them being a primary alcohol, which is highly reactive. The presence of a large number of hydroxyl groups in cellulose molecules makes the pressboard prone to capturing freely moving positive and negative charges in the oil. Additionally, the microfibril structure formed by the alternating connection of crystalline and amorphous regions in the cellulose molecular chain is relatively loose, allowing charges to easily enter the pressboard and be captured by the cellulose molecules, rendering them electrically inactive.

5.3. Effect Mechanism of Insulating Paper

The impact of the number of insulating paper layers differs between Cu-Cu and Al-Al electrodes. The variation in equivalent charge density at the peak moment with increasing insulating paper layers is shown in Table 3.
From Table 3, it can be observed that (1) under positive polarity voltage, a positive charge density indicates that the space charge field opposes the applied electric field, thereby weakening it, while a negative charge density indicates that the space charge field aligns with the applied field, strengthening it. (2) Under negative polarity voltage, the opposite holds true. (3) It can be seen that with three layers of insulating paper, the charge injected by the Cu-Cu electrodes can be effectively blocked, causing the charge to accumulate between the paper layers near both electrodes, which enhances the electric field at the midpoint of the oil gap. However, in the case of Al-Al electrodes, five layers of insulating paper are required to effectively block the charge. This is because, under the same electric field strength, aluminum injects significantly more charge than copper, necessitating more layers of paper to create a stronger barrier to prevent the charge from crossing the paper layers.
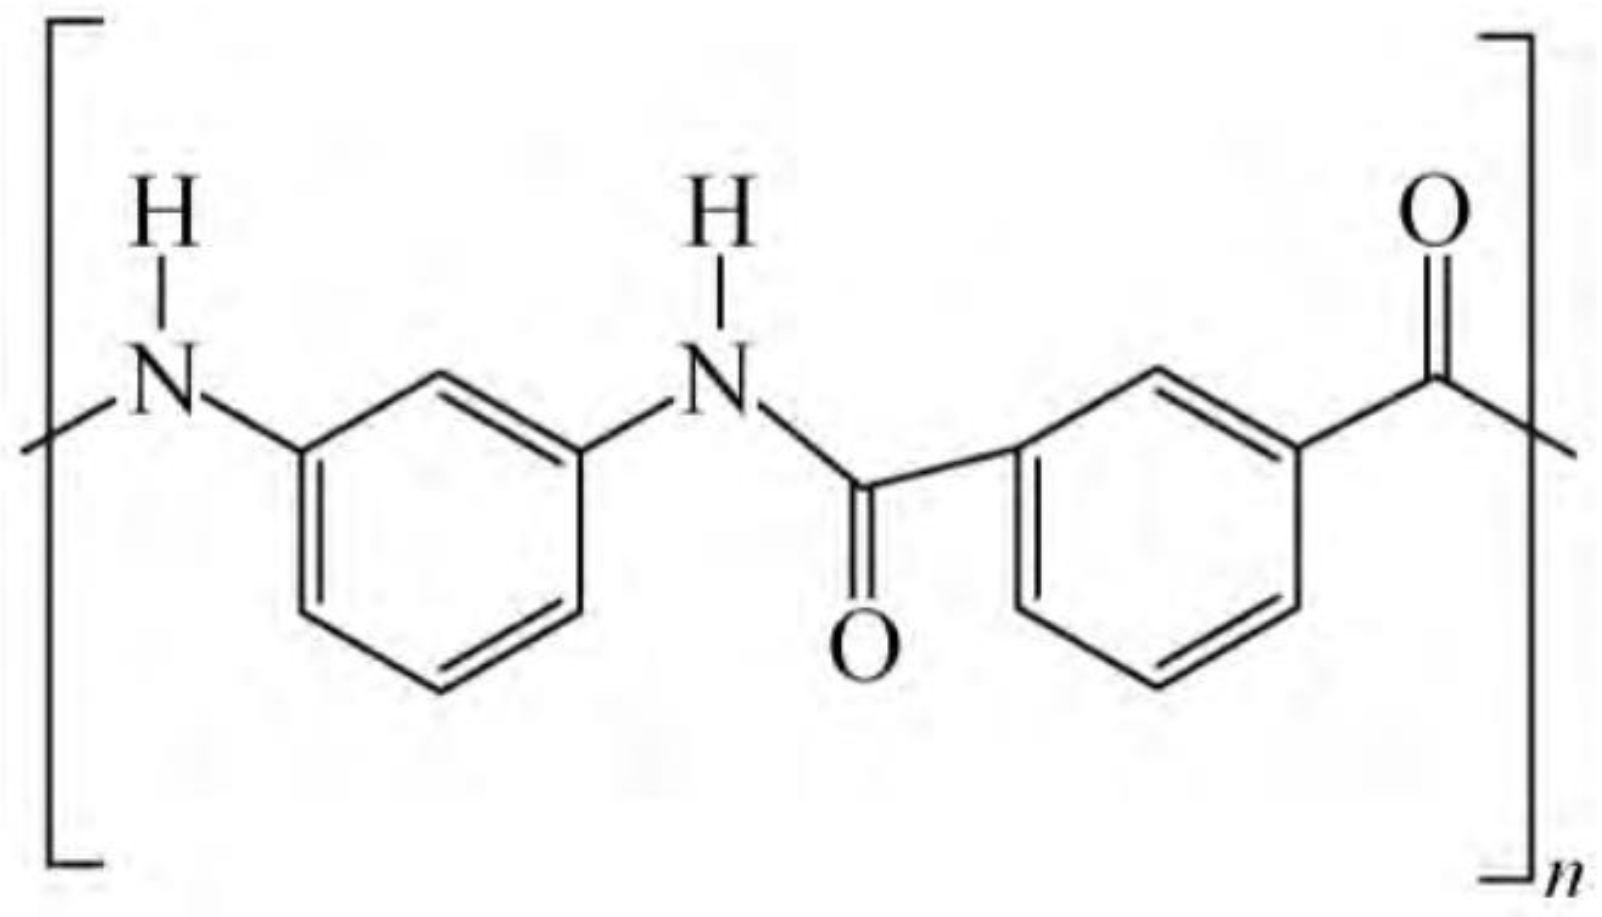
The effect on charge migration can be analyzed from the microstructure of the insulating paper. The insulating paper used in this study is Nomex synthetic fiber insulating paper, primarily composed of meta-aramid short fibers and precipitated fibers. Its molecular structure is shown in Figure 17, which is a linear macromolecule composed of aromatic rings linked by amide bonds [19].
From Figure 17, it can be seen that the precipitated fibers in Nomex insulating paper are relatively soft, with a surface covered in numerous fine, plush-like fibers. These fibers have abundant fibrils, and the ends show clear signs of fibrillation. This fibrillation and the uneven surface texture increase the interweaving force between the fibers. This special microstructure gives Nomex paper a strong resistance to charge migration within the material.
According to existing research, Nomex paper has lower conductivity compared to plant fiber paper. Measurements of space charge within the paper during the depolarization process reveal that the dissipation speed of charge in plant fiber paper is faster than in Nomex paper. This indicates that synthetic fiber materials have a certain ability to limit and obstruct charge migration within the sample, making space charge less likely to migrate along the direction of the electric field. This behavior is closely related to the intrinsic properties of the microstructure and dielectric characteristics of synthetic fiber materials [20]. In the current study, the migration characteristics of space charge in single-layer and double-layer paper of the same thickness were compared using the electroacoustic pulse method. The charge distribution in the thickness direction of the double-layer paper clearly showed space charge accumulation at the interface between the two layers, and the movement of positive charges towards the interior of the dielectric was slower in double-layer paper compared to single-layer paper [21]. This is because the interface between the two layers of paper raises the potential barrier, which is higher than that of the oil-paper medium on both sides, thereby obstructing charge movement and causing charge accumulation at the interface. After the voltage is removed, the dissipation speed of space charge in double-layer paper is significantly slower than in single-layer paper due to the interface barrier.
In conclusion, the different microstructures, physical properties, and chemical properties of plant fiber and synthetic fiber lead to varying impacts on charge movement between insulating pressboard and insulating paper. For insulating pressboard, the microstructure is relatively loose, allowing cellulose molecules to easily capture charges and absorb them into the pressboard, preventing the charges from exhibiting external electrical properties. For insulating paper, the microstructure of synthetic fibers strongly hinders charge migration within the material. As the number of insulating paper layers increases, the barriers between the layers further impede charge movement, causing charge accumulation between the layers. Positive charges accumulate between the layers near the anode, and negative charges accumulate between the layers near the cathode, which may enhance the electric field in the oil. In actual transformer windings, the minimum inter-turn insulation thickness is 0.45 mm, with the number of insulating paper layers ranging from 3 to 12 layers, which is comparable to the model used in this study. Therefore, it can be inferred that the accumulation of charges between layers of multi-layer insulating paper increases the electric field in the oil, thereby raising the probability of breakdown in the oil gap.

6. Conclusions

In this study, based on the Kerr electro-optical effect, a fast measurement platform was established to measure the electric field distribution in oil-paper composites with different insulation structures under impact voltage and to analyze the space charge migration mechanism. The research methodology and conclusions presented in this paper can be applied to electric field measurements and insulation structure verification in oil-immersed power equipment, such as aluminum electrolytic capacitors. The main findings are as follows:
(1)
Asymmetric Pressboard Model: For Cu-Cu electrodes, the measured peak fields and equivalent charge densities at the peak moments for the positive and negative electrodes are not significantly different, approximately 16 kV/mm and 68 μC/m2, respectively. For Al-Al electrodes, the peak electric fields were 18.13 kV/mm and −14.98 kV/mm, with corresponding charge densities of 11.2 μC/m2 and −124.8 μC/m2.
(2)
Symmetric Pressboard Model: The Cu-Cu electrodes continued to show minimal differences in peak electric field and equivalent charge density. For Al-Al electrodes, the observed values of peak electric field for positive and negative polarities were 17.6 kV/mm and −17.7 kV/mm, respectively. The difference in electric fields between positive and negative polarities decreased from 21.02% in the asymmetric model to 0.57%, and the charge density difference decreased from 1014.29% to 4.67%.
(3)
Insulating paper Model: For Cu-Cu electrodes, the recorded peak field strength was 16.9 kV/mm with one layer of insulating paper, and 19 kV/mm with three and five layers, exceeding the applied field by 5.6%. For Al-Al electrodes, the peak electric fields of one, three, and five layers of insulating paper were 15.0 kV/mm, 16.9 kV/mm, and 18.97 kV/mm, respectively. The maximum enhancement is 5.4%.
(4)
Charge generation and migration: The Schottky effect and the field emission principle are utilized to explain the generation of positive and negative charges in transformer oil under high electric field strength. The charge migration model was also improved by combining the hindering effect of insulating platen and insulating paper on charge migration.

Author Contributions

Conceptualization, J.D. and B.Q.; methodology, C.G., X.Z. and B.Q.; formal analysis, Z.X. and C.G.; investigation, C.G., X.Z. and B.Q.; resources, J.D., Z.X., H.Z. and Z.P.; data curation, C.G. and H.G.; writing—original draft, J.D., C.G., H.G. and X.Z.; writing—review and editing, J.D., H.Z. and Z.P.; supervision, B.Q.; project administration, J.D. and Z.X.; funding acquisition, J.D. and Z.X. All authors have read and agreed to the published version of the manuscript.

Funding

This study is supported by the technology project from China Southern Power Grid EHV Power Transmission Company (Grant No. 0120002023030301SJ00004).

Data Availability Statement

The original contributions presented in the study are included in the article, further inquiries can be directed to the corresponding author.

Conflicts of Interest

Authors Jun Deng, Zhicheng Xie, Haibin Zhou and Zhicheng Pan were employed by the China Southern Power Grid EHV Power Transmission Company. The authors declare that the research was conducted in the absence of any commercial or financial relationships that could be construed as a potential conflict of interest. The funding sponsors had no role in the design of the study; in the collection, analyses, or interpretation of data; in the writing of the manuscript; or in the decision to publish the results.

References

  1. He, D.; Guo, H.; Gong, W.; Xu, Z.; Li, Q.; Xie, S. Dynamic behavior and residence characteristics of space charge in oil-paper insulation under polarity-reversal electric field. IEEE Trans. Dielectr. Electr. Insul. 2023, 30, 1021–1031. [Google Scholar] [CrossRef]
  2. Cremasco, A.; Limburg, A.; Wouters, P.; Duivenbode, J. Charge conduction modeling in synthetic ester and Kerr effect measurements of the electric field. In Proceedings of the 2024 IEEE International Conference on High Voltage Engineering and Applications, Berlin, Germany, 18–23 August 2024; pp. 1–4. [Google Scholar] [CrossRef]
  3. Okubo, H. HVDC electrical insulation performance in oil/pressboard composite insulation system based on Kerr electro-optic field measurement and electric field analysis. IEEE Trans. Dielectr. Electr. Insul. 2018, 25, 1785–1797. [Google Scholar] [CrossRef]
  4. Tu, Y.; Wu, S.; Xu, H.; Zhang, X.; Shao, Y.; Chen, G. Simulation on solid-gas interface charge accumulation characteristics under repetitive impulse voltage. In Proceedings of the 2022 IEEE International Conference on High Voltage Engineering and Applications, Chongqing, China, 26–29 September 2022; pp. 1–4. [Google Scholar] [CrossRef]
  5. Sharifi, A.; Akbari, A.; Werle, P.; Rasti, K. Investigation of electric stresses caused by applying DC and AC voltages on the insulation of converter transformers. In Proceedings of the 2021 29th Iranian Conference on Electrical Engineering, Tehran, Iran, 18–20 May 2021; pp. 279–283. [Google Scholar] [CrossRef]
  6. Imburgia, A.; Romano, P.; Ala, G.; Albertini, M.; de Rai, L.; Bononi, S.F.; Sanseverino, E.R.; Rizzo, G.; Siripurapu, S.; Viola, F. Effect of polarity reversal on the partial discharge phenomena. In Proceedings of the IEEE Conference on Electrical Insulation and Dielectric Phenomena, Virtual, 18–30 October 2020; pp. 378–381. [Google Scholar] [CrossRef]
  7. Yang, Y.; Wang, Q.; Gao, C.; Pu, J.; Zhang, X.; Li, J. Study of voltage distribution in transformers under different lightning impulse voltages. In Proceedings of the 2020 IEEE International Conference on High Voltage Engineering and Application, Beijing, China, 6–10 September 2020; pp. 1–5. [Google Scholar] [CrossRef]
  8. Gao, L.; Wu, Y.; Chen, J.; Lv, Z.; Wu, K. Comparison of charge mobility in insulating oil and oil-immersed paper. In Proceedings of the IEEE Conference on Electrical Insulation and Dielectric Phenomena, Denver, CO, USA, 30 October–2 November 2022; pp. 9–12. [Google Scholar] [CrossRef]
  9. Shi, S.; Hao, J.; Jian, Z.; Liao, R. DC electric field effect on conductivity and interface charge of oil-paper insulation. IEEE Trans. Dielectr. Electr. Insul. 2023, 30, 1525–1533. [Google Scholar] [CrossRef]
  10. Yang, D.; Chen, W.; Wan, F.; Zhou, Y.; Wang, J. Identification of the aging stage of transformer oil-paper insulation via Raman spectroscopic characteristics. IEEE Trans. Dielectr. Electr. Insul. 2020, 27, 1770–1777. [Google Scholar] [CrossRef]
  11. Lu, G.; Zhang, Q.; Zheng, D.; Zhang, P. A novel online monitoring strategy for the localized grounding insulation defect of converter transformers based on converter switching states control. IEEE Trans. Power Electron. 2022, 37, 11124–11134. [Google Scholar] [CrossRef]
  12. Gao, L.; Xu, H.; Lv, Z.; Wu, K. Effect of temperature on charge mobility in oil-paper insulation. In Proceedings of the IEEE International Conference on Dielectrics, Toulouse, France, 30 June–4 July 2024. [Google Scholar] [CrossRef]
  13. Fan, Y.; Wu, K.; Cheng, C. The conductivity characteristics of different oils and papers and their effects on the interface charge of oil-paper. In Proceedings of the 2019 IEEE Conference on Electrical Insulation and Dielectric Phenomena, Richland, WA, USA, 20–23 October 2019; pp. 785–788. [Google Scholar] [CrossRef]
  14. Zhang, Y.; Qi, B.; Ma, Y.; Huang, M.; Yuan, Q.; Lv, Y.; Jiao, Y.; Li, C.; Zhang, S. Influencing mechanism of adhesive on partial discharge of pressboard block under AC/DC composite voltage. IEEE Trans. Dielectr. Electr. Insul. 2021, 28, 1883–1891. [Google Scholar] [CrossRef]
  15. Li, Y.; Tang, Z. Simulation of charge transport characteristics of polypropylene. In Proceedings of the 2021 International Conference on Advanced Electrical Equipment and Reliable Operation, Beijing, China, 15–17 October 2021; pp. 1–3. [Google Scholar] [CrossRef]
  16. Cheng, C.; Fu, M.; Wu, K.; Ma, Y.; Hao, Y.; Chen, C. Aging effect on interface charges between oil and oil-immersed paper. IEEE Trans. Dielectr. Electr. Insul. 2021, 28, 1579–1587. [Google Scholar] [CrossRef]
  17. Gao, L.; Xu, H.; Guo, H.; Wu, K. Effect of BTA on charge mobility in insulating oil and oil-immersed paper. In Proceedings of the IEEE Conference on Electrical Insulation and Dielectric Phenomena, East Rutherford, NJ, USA, 15–19 October 2023; pp. 1–4. [Google Scholar]
  18. Gao, C.; Chen, C.; Shi, H.; Yuan, Q.; Qi, B.; Li, C.; Huang, M. Calculating algorithm for the interface charge density of oil-pressboard insulation considering the scale effect under DC voltage. In Proceedings of the 22nd International Symposium on High Voltage Engineering, Xi’an, China, 21–26 November 2021; pp. 2191–2195. [Google Scholar] [CrossRef]
  19. Kato, F.; Amimoto, T.; Nishiura, R.; Mizuno, K.; Toyama, S. Hydrogen generation by adding passivator for suppressing copper-sulfide deposition in transformers. IEEE Trans. Dielectr. Electr. Insul. 2017, 24, 1931–1937. [Google Scholar] [CrossRef]
  20. Liu, H.; Chen, K.; Xiao, M.; Du, B. Space charge deflection behavior under strong magnetic fields. In Proceedings of the 2024 IEEE 5th International Conference on Dielectrics (ICD), Toulouse, France, 30 June–4 July 2024; pp. 1–4. [Google Scholar] [CrossRef]
  21. Jin, F.; Zhou, Y. Effect of electric-field components on the flashover characteristics of oil-paper insulation under combined AC-DC voltage. IEEE Access 2023, 11, 556–563. [Google Scholar] [CrossRef]
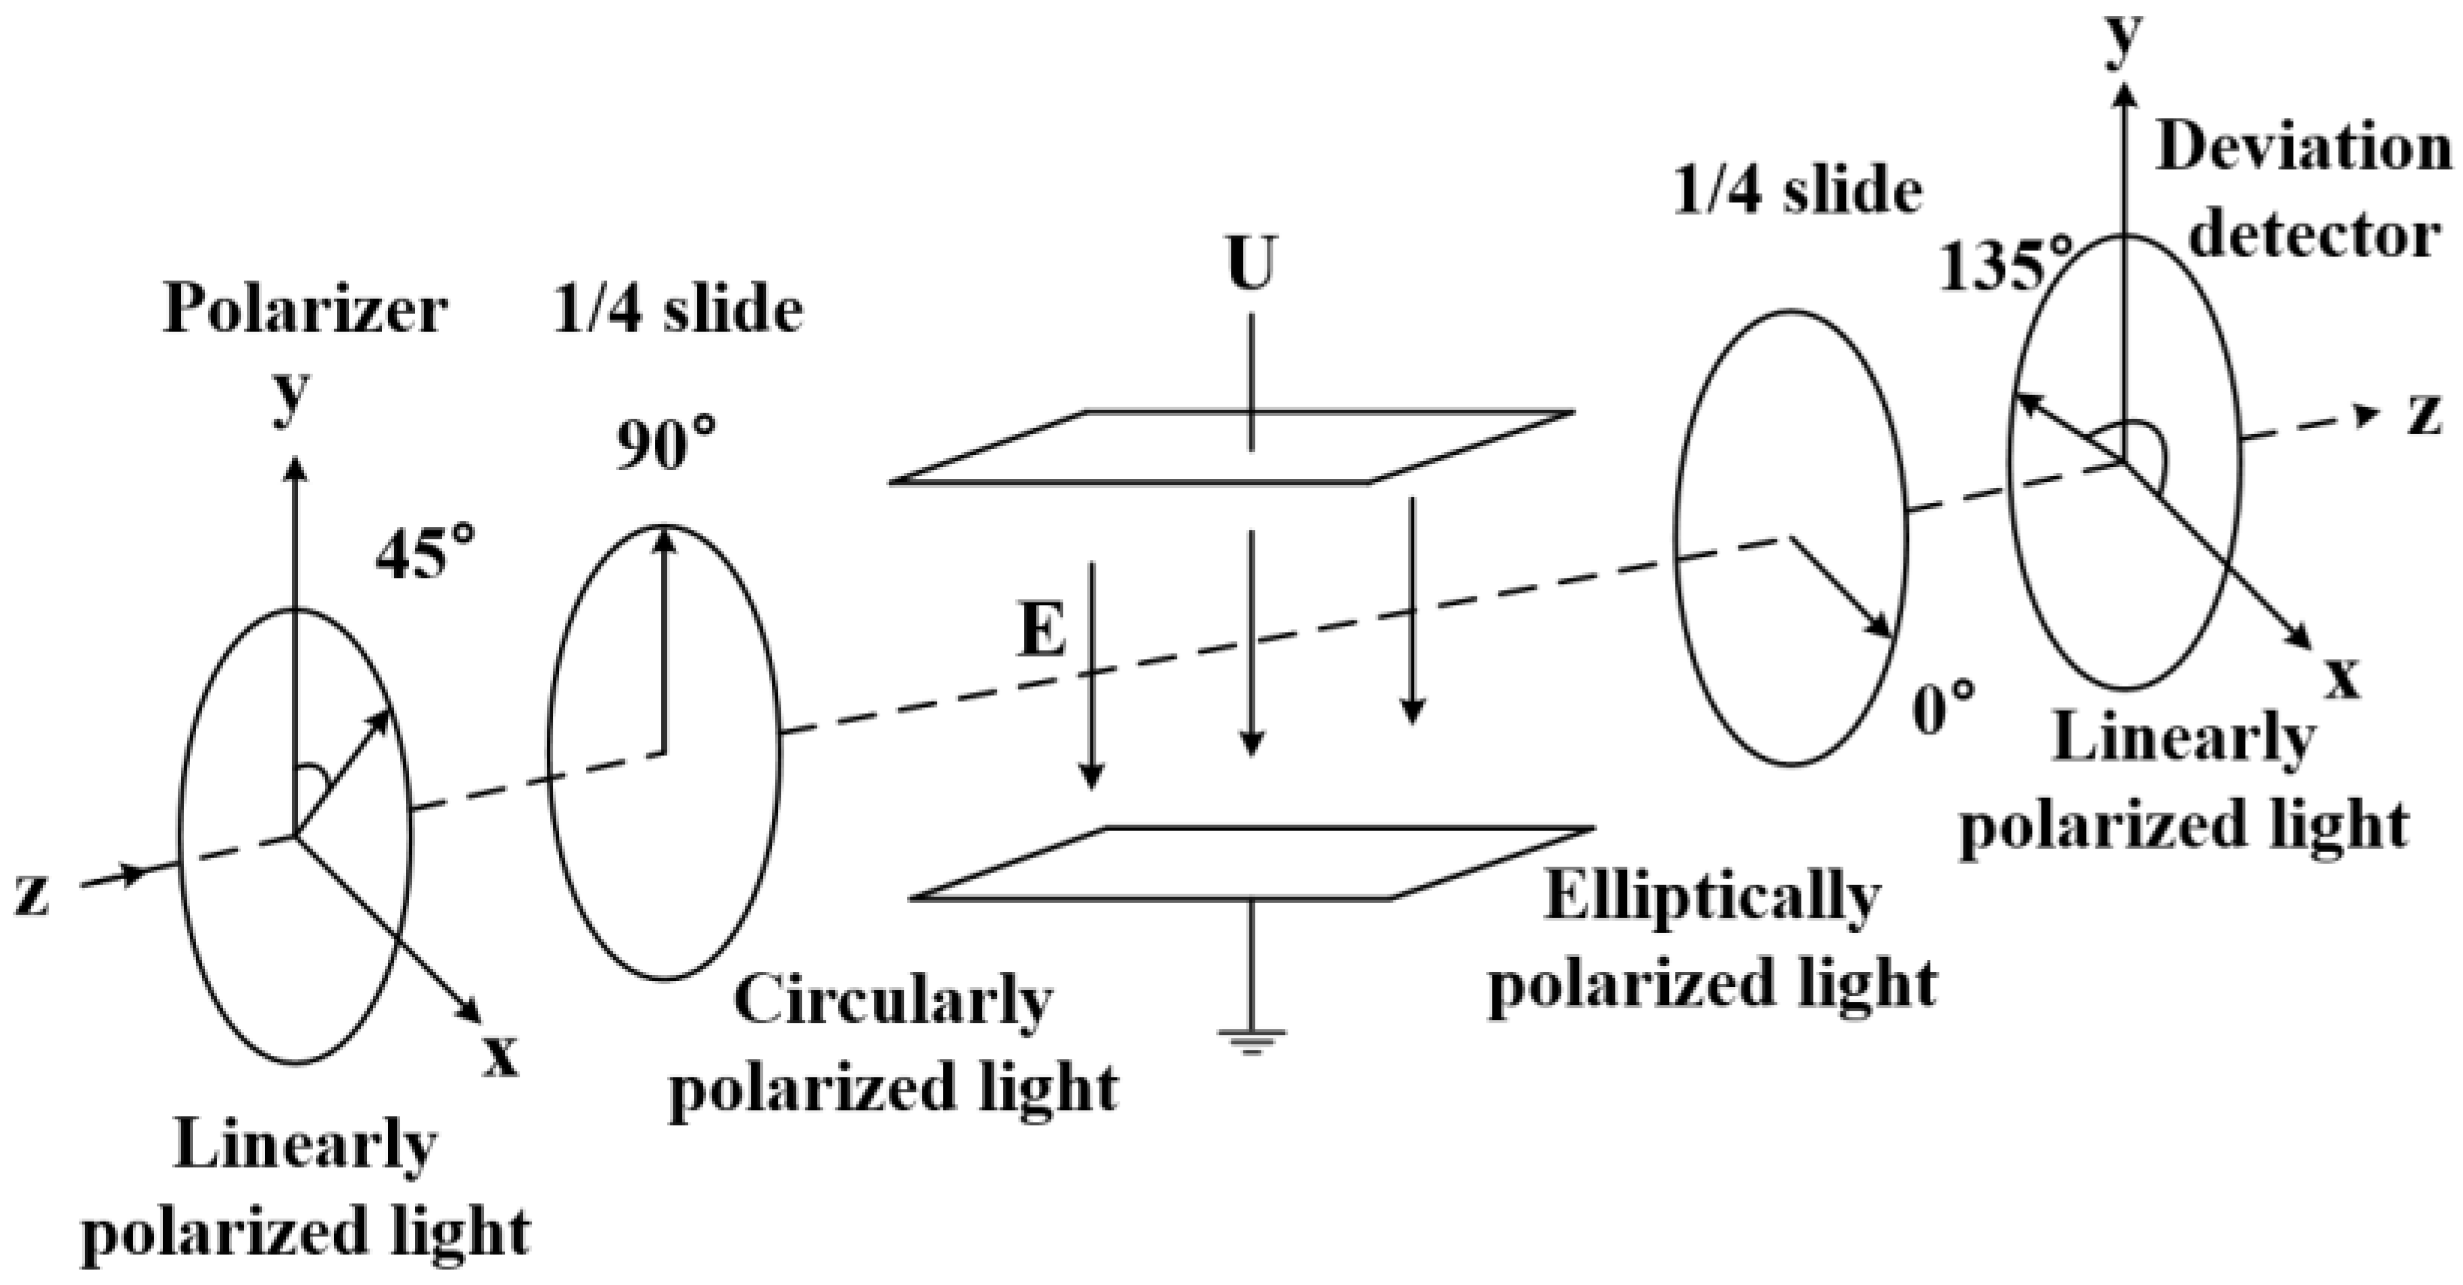
Figure 1. Schematic diagram of optical path.
Energies 17 04903 g001
Figure 2. Schematic diagram of rapid measuring apparatus for impulse electric field.
Energies 17 04903 g002
Figure 3. Insulating pressboard test model: (a) Asymmetric model; (b) Symmetry model.
Energies 17 04903 g003
Figure 4. Insulating paper test model.
Energies 17 04903 g004
Figure 5. Characteristics of electric field and charge behavior of pure oil medium under different electrode conditions: (a) Variation process of electric field; (b) Wavefront partial unfolding; (c) Variation of equivalent charge density.
Energies 17 04903 g005
Figure 6. Variation process of electric field in oil of asymmetric pressboard model: (a) Cu-Cu electrodes-Positive polarity; (b) Al-Al electrodes-Positive polarity; (c) Cu-Cu electrodes-Negative polarity; (d) Al–Al electrodes-Negative polarity.
Energies 17 04903 g006aEnergies 17 04903 g006b
Figure 7. Comparison of equivalent charge density for both types of electrodes in asymmetric pressboard model: (a) Positive polarity; (b) Negative polarity.
Energies 17 04903 g007
Figure 8. Electric field variation process in the symmetric pressboard model: (a) Cu-Cu electrodes-Positive polarity; (b) Al-Al electrodes-Positive polarity; (c) Cu-Cu electrodes-Negative polarity; (d) Al–Al electrodes-Negative polarity.
Energies 17 04903 g008
Figure 9. Comparison of equivalent charge density for both types of electrodes in symmetric pressboard model: (a) Positive polarity; (b) Negative polarity.
Energies 17 04903 g009
Figure 10. Electric field variation process of Cu-Cu electrodes coated with insulating paper: (a) 1 layers-Positive polarity; (b) 1 layers-Negative polarity; (c) 3 layers-Positive polarity; (d) 3 layers-Negative polarity; (e) 5 layers-Positive polarity; (f) 5 layers-Negative polarity.
Energies 17 04903 g010
Figure 11. Electric field variation process of Al-Al electrodes coated with insulating paper: (a) 1 layers-Positive polarity; (b) 1 layers-Negative polarity; (c) 3 layers-Positive polarity; (d) 3 layers-Negative polarity; (e) 5 layers-Positive polarity; (f) 5 layers-Negative polarity.
Energies 17 04903 g011aEnergies 17 04903 g011b
Figure 12. Comparative analysis of peak electric field under different conditions.
Energies 17 04903 g012
Figure 13. Schottky barrier model.
Energies 17 04903 g013
Figure 14. Positive charge injection mechanism in oil.
Energies 17 04903 g014
Figure 15. Comparison of equivalent charge density at crest time between two models.
Energies 17 04903 g015
Figure 16. Molecular structure of cellulose.
Energies 17 04903 g016
Figure 17. Molecular structure of poly-p-phenylene terephthamide.
Energies 17 04903 g017
Table 1. Applied voltage of different models.
Experimental ModelsOil Division CoefficientTotal Applied Voltage (kV)
Insulating pressboard modelAsymmetric0.879±102.4
Symmetry0.784±115.0
Insulating paper model1 layer0.989±91.0
3 layers0.968±93.0
5 layers0.948±95.0
Table 2. The work function of a metallic element.
Metal ElementFunction of Electrical Energy (eV)
Al4.28
Cu4.65
Table 3. Influence of the number of layers of insulating paper on charges.
Layers of Insulating PaperEquivalent Charge Density (μC/m2)
Cu-CuAl-Al
Positive PolarityNegative PolarityPositive PolarityNegative Polarity
142.8−33.9116.8−95.8
3−38.933.944.0−40.1
5−35.029.9−38.626.1
Disclaimer/Publisher’s Note: The statements, opinions and data contained in all publications are solely those of the individual author(s) and contributor(s) and not of MDPI and/or the editor(s). MDPI and/or the editor(s) disclaim responsibility for any injury to people or property resulting from any ideas, methods, instructions or products referred to in the content.