Article

Probabilistic Power and Energy Balance Risk Scheduling Method Based on Distributed Robust Optimization

1
State Grid Jiangsu Electric Power Co., Ltd., Economic and Technological Research Institute, Nanjing 210008, China
2
Tsinghua Sichuan Energy Internet Research Institute, Chengdu 610213, China
3
State Grid Jiangsu Electric Power Co., Ltd., Nanjing 210024, China
*
Author to whom correspondence should be addressed.
Energies 2024, 17(19), 4894; https://doi.org/10.3390/en17194894
Submission received: 29 August 2024 / Revised: 19 September 2024 / Accepted: 24 September 2024 / Published: 29 September 2024
(This article belongs to the Section F1: Electrical Power System)

Abstract

:
The volatility and uncertainty associated with the high proportion of wind and PV output in the new power system significantly impact the power and energy balance, making it challenging to accurately assess the risks related to renewable energy abandonment and supply guarantee. Therefore, a probabilistic power and energy balance risk analysis method based on distributed robust optimization is proposed. Firstly, the affine factor and the flexible ramp reserve capacity of thermal power are combined to establish a probabilistic index, which serves to characterize the risk associated with the power and energy balance. Drawing upon the principles of the conditional value at risk theory, the risk indexes of the load shedding power and curtailment power under a certain confidence probability are proposed. Secondly, the probability distribution fuzzy sets of uncertain variables are constructed using the distributionally robust method to measure the Wasserstein distance between different probability distributions. Finally, aiming at minimizing the operation cost of thermal power, the risk cost of power abandonment, and the risk cost of load shedding, a distributed robust optimal scheduling model based on a flexible ramp reserve of thermal power is established.

1. Introduction

The advancement of new energy technologies is a crucial pathway to realizing the objectives of “carbon peak and carbon neutrality”, addressing environmental pollution, and resolving energy crisis issues. The rapid progress in new energy technology has led to a significant increase in the integration of new energy into the power grid, marking a distinctive characteristic of the modern power system. By the end of 2023, China’s installed capacity of wind power and photovoltaics reached 440 million kW and 610 million kW, respectively. The proportion of new energy installed capacity has reached 36%, making it the second largest power source in China [1].
When analyzing the traditional power system dominated by thermal power generation, the larger controllable range of thermal power generation often leads to an oversight of the temporal coupling relationship of operating constraints and a segmented description of unit outage limits. Furthermore, with a relatively small variance in the load forecast errors, deterministic reserve rules effectively mitigate the power imbalance risk to a low level [2]. The structural and operational characteristics of high-proportion renewable energy power systems exhibit substantial differences from traditional systems. Factors such as generation, demand, and storage collectively contribute to achieving power balance, and the temporal coupling characteristics result in interdependencies among viable solutions for power equilibrium at various time intervals [3,4,5]. The significant random fluctuations in wind and solar power have emerged as the primary source of electricity within the system, characterized by intricate and variable operating conditions that defy representation through a limited set of typical scenarios. There is an urgent imperative for probabilistic analysis of the power quantity balance. Conventional time-series simulation-based methods rely on specific operational points to analyze the power quantity balance, yet these operational points are uncertain under ambiguous conditions, leading to analytical challenges. Mere augmentation of the simulated scenarios or the introduction of segmented probability balance analysis does not effectively resolve the aforementioned issue. Consequently, traditional methods for analyzing the power quantity balance are increasingly inadequate in addressing the need for temporal coupling and probability balance analysis in contexts where wind and solar energy penetration rates are escalating, necessitating a reevaluation of the matter concerning the power quantity balance in power systems.
Analysis of the power quantity balance is a fundamental cornerstone for designing a power distribution and formulating operational strategies, serving as the central and primary concern in establishing new power systems. Presently, research on the deterministic power quantity balance has achieved a significant level of maturity, with key areas of emphasis including the optimized allocation of regulating resources, balanced analysis across multiple time scales within the system, and rapid solution algorithms for production simulation [6,7]. Ref. [8] established the groundwork for power and energy balance analysis calculations, introducing a table-based analysis method based on typical days. However, this approach is only suitable for early power systems dominated by thermal power plants. Furthermore, Ref. [9] considers the timing information between typical days in the planning model with operation constraints and further refines the influence of timing information on power system planning; Ref. [10] proposed a comprehensive energy storage system composed of various types of energy storage equipment to alleviate the difficulty of power and energy balance caused by the uncertainty of new energy; Ref. [11], a model considering the balance ability of the system in the power planning stage is proposed to provide a more powerful planning guarantee for the balance of power and electricity. In the analysis of a medium time scale, the research mainly focuses on the collaborative call analysis between new energy and various types of regulatory resources and mainly uses the time/space decomposition method or variable reduction method to improve the model solvability. To capture the temporal characteristics of new energy generation, time-series production simulation technology is extensively employed to analyze the supply–demand balance in high-proportion new energy systems. Ref. [12] introduces a generator scheduling optimization algorithm that considers fluctuations in wind power generation output by pre-arranging the starting modes of generators based on deterministic wind power generation scenarios in the main problem and adjusting the rescheduling plans of thermal power generation units in sub-problems to accommodate the intermittent nature of wind power generation. The final result is achieved through a hierarchical iterative solution method. Ref. [13] presents a fully parallelized stochastic generator scheduling method that decomposes the stochastic optimization problem into modules for generator configuration, optimal power flow calculation, and connection modules; it calculates the operation modes of each generator within the system under multiple wind power generation scenarios simultaneously, effectively enhancing simulation speed for large-scale transmission, distribution, and transformation networks as well as direct current/alternating current hybrid transmission and distribution networks. There are several commonly used types of production simulation calculation software available both domestically and internationally, including the power system planning and decision-making software developed by Tsinghua University (referred to as grid optimization planning tools, GOPTs 4.0) [14] and the multi-area production simulation (MAPS5.0) software developed by General Electric (GE) [15]. Nevertheless, the existing methods and software for analyzing power generation balance do not fully account for the significant uncertainty associated with high levels of new energy output. The decision-making units’ operational modes fail to encompass the output characteristics during extreme weather scenarios, resulting in a heightened risk of compromised power supply reliability and the curtailment of renewable energy within the power system.
Stochastic optimization and robust optimization are effective methods for dealing with the high uncertainty of renewable energy output, which can help to achieve multi-source coordinated optimization. Among them, stochastic optimization methods aim to minimize the expected value of system operating costs by constructing models that satisfy specific probability level constraints. Ref. [16], a scenario-based adaptive risk-averse stochastic optimization method for multi-energy microgrids and a risk-based microgrid scheduling and control model are proposed. The risk measurement method based on CVaR is used to avoid creating too optimistic of a decision scheme; Ref. [17], considering the operation characteristics of carbon capture power plants, hydropower plants, pumped storage power plants, and traditional thermal power plants, proposes a multi-objective economic-environmental dispatching method based on stochastic programming and fuzzy decision-making method; Ref. [18], considering the factors such as the spinning reserve, wind power randomness, unit climbing ability, and so on, proposes a multi-period environmental-economic dispatch algorithm for power systems based on chance constraint. The robust optimization method, when addressing the uncertainty of renewable energy output, does not necessitate an explicit probability distribution of uncertain variables. Instead, it converts the uncertainty optimization problem into a deterministic optimization problem under extreme scenarios. This approach is currently extensively utilized in integrated energy systems [19], unit combinations [20], and optimal power flow [21] optimization models. To tackle the challenges associated with obtaining probability distribution information for wind and solar power output errors and excessively conservative results from robust optimization, experts have proposed the distributionally robust optimization (DRO) method. DRO establishes fuzzy sets for all potential distributions of uncertain variables based on historical data, effectively managing the uncertainty of renewable energy output. Ref. [22] considers the intra-provincial/inter-provincial coupled scheduling operation mode and establishes an uncertainty set of a source and load power matrix based on the distributionally robust optimization method, achieving the cross-province and cross-region integration of clean energy. Ref. [23] fully exploits the flexible regulation capability of the power system, establishing a two-stage distributionally robust optimization model to achieve the economic dispatch of flexible ramping reserves. However, these models do not quantitatively evaluate the power balance risk in new-type power systems or provide probabilistic risk assessment indicators that adapt to high proportions of new energy access while considering strong uncertainty characteristics. Ref. [24], based on a time-varying probability model for clustered wind turbine virtual units, proposes a quantitative method for risk indicators considering the scheduling characteristics of clustered wind turbine virtual units; however, it does not consider the adjustment capability of fossil fuel-based flexible ramping reserves in response to risks. In summary, existing studies on the uncertainty balance often characterize balanced risks based on deterministic probability distributions or intervals without providing probabilistic indicators with clear physical meanings for power balance risks and without considering flexibility resources’ ability to respond to risks within the system, leading to biased risk assessment results.
In view of the above problems, this paper proposes a probabilistic power balance risk analysis method based on distributed robust optimization. Its innovation lies in the following: (1) A probabilistic risk index is proposed to characterize the power and energy balance of the system. A probabilistic index is defined to characterize the risk of power and energy balance by combining the affine factor and the flexible ramp reserve capacity of thermal power. Based on the conditional value-at-risk theory, the risk indexes of the load shedding power and abandoned power of the system under a certain confidence probability are proposed. (2) Based on the distributionally robust method to measure the Wasserstein distance between different probability distributions, the probability distribution fuzzy set of uncertain variables is constructed. With the goal of minimizing the probability risk index of curtailment and load shedding, a distributionally robust optimal scheduling model based on a flexible ramp reserve of thermal power is established.

2. Assessment of Probabilistic Power and Energy Balance Characteristics and Risk Indicators for Supply–Demand Equilibrium

2.1. Analysis of Probability Balance Characteristics

In conventional power systems, achieving power and energy equilibrium relies on “load balancing source”, where regulating load fluctuations becomes pivotal for maintaining system stability. However, within high-penetration renewable energy frameworks, wind and photovoltaic generation display significant stochastic traits that limit their regulatory capacity. Instead, numerous adaptable loads contribute to supply–demand equilibrium as an emerging form of regulatory asset—ushering in an innovative paradigm characterized by “interconnected equilibrium across all facets of the power network”. Consequently, analyzing the power–energy equilibrium has evolved into assessing adjustable resources alongside regulatory needs to better reflect operational realities. Table 1 illustrates key adjustable resources and regulatory requisites within high-penetration systems.
The probabilistic balance characteristics of power and energy arise from the stochastic variations in non-adjustable loads, wind/solar generation, and other sources. In comparison, the uncertainty associated with wind/solar generation surpasses that of load uncertainty, leading to significant disparities in prediction error levels across different time periods. Fixed reserve capacities struggle to ensure a reliable balance across all time periods due to these differences, making the analysis of probabilistic balance characteristics a focal point of concern.
In a significant portion of the renewable energy power system planning for a specific region, the determination of the system standby capacity is based on the 10% peak load. The probability of standby deficiency for each time slot was calculated using the error distribution of net load forecast for a particular day. The error distribution was color-coded to represent the range of standby deficiency probability, as illustrated in Figure 1. It is evident from the figure that due to substantial variations in net load error distribution across different time slots, there are also considerable fluctuations in standby deficiency probability, with values reaching up to 0.3. Therefore, it is imperative to incorporate probabilistic characteristic analysis into power and energy balance assessments to effectively capture the impact of uncertainty on the system and address the reliability and economic challenges stemming from standby deficiencies.
It is evident that the structure and operational characteristics of high-penetration renewable energy power systems differ significantly from traditional systems. Various adjustable resources in the sources, loads, and storage sectors collectively participate in achieving power and energy balance. The temporal coupling characteristics lead to mutual influences on the existence of feasible solutions for power and energy balance across different time periods. Wind/solar power sources with strong stochastic fluctuations have become the primary source of electricity generation for these systems. Their complex and variable operating conditions are challenging to represent using a limited number of typical scenarios, emphasizing the urgent need for probabilistic characteristic analysis in power and energy balance assessments.

2.2. Indicators of Supply and Demand Equilibrium Risk

According to the analysis of probability balance characteristics, it can be inferred that the high level of uncertainty in predicting errors for new energy is the primary factor contributing to power and energy balance risks in a significant portion of new energy power systems. The combined error in wind and solar predictions is represented as follows:
ψ ˜ t = ω ˜ t wind + ω ˜ t pv
In the equation, ω ˜ t wind / ω ˜ t pv denotes the forecast errors of the wind farm and photovoltaic power station at time t.
Ref. [25] used the affine strategy to adjust the output of the controllable units. Affine decision rules can describe the relationship between flexible resource output and uncertainty; that is, it is assumed that the unit adjusts the output according to a certain response coefficient to balance the power fluctuation of new energy. Therefore, the affine strategy is utilized as a method of adjustment for thermal power units to mitigate the forecast errors associated with wind and solar power. The actual output of the thermal power units is represented by an affine function, incorporating the forecast errors of wind and solar power as variables. The specific value of this affine function can only be computed once the actual outputs of wind and solar energy are determined.
P ˜ i , t G = P i , t G + α i , t G ψ ˜ t = P i , t G + α ¯ i , t G max { ψ ˜ t , 0 } + α _ i , t G min { ψ ˜ t , 0 }
P i , t G R i , t down P ˜ i , t G P i , t G + R i , t up
In the equation, α i , t G  represents the participation factor of the thermal power unit; α ¯ i , t G / α _ i , t G represent the upward/downward adjustment factors of thermal power unit i at time t; R i , t up , R i , t down represent the upward and downward spinning reserve capacities of thermal power unit i at time t.
Combined with the affine factor and the total forecast error of wind and solar power, α ¯ i , t G ψ ˜ t and α _ i , t G ψ ˜ t , respectively, represent the system’s upward and downward regulation requirements. When the thermal power’s upward ramping reserve regulation capacity is insufficient to cover the fluctuation adjustment demand of the forecasted wind and solar outputs, there exists a risk of load shedding in the system. Similarly, when the thermal power’s downward ramping reserve regulation capacity is inadequate to cover the fluctuation adjustment demand of forecasted wind and solar outputs, there exists a risk of curtailment as illustrated in Figure 2.
If the forecast error of wind and solar power is a stochastic variable, then the expression for the system’s probabilistic electricity balance risk is as follows.
inf P t ψ t ψ P t ψ [ α ¯ i , t G ψ ˜ t R i , t up ] 1 γ 1 = β 1 inf P t ψ t ψ P t ψ [ R i , t down α _ i , t G ψ ˜ t ] 1 γ 2 = β 2
In Equation (4), γ 1 / γ 2 represents the allowable loss-of-load/curtailment probability of the system. Equation (4) describes that, even when the wind and solar prediction error distribution P t ψ is in the worst distribution of t ψ , there is a probability less than γ 1 / γ 2 that the constraint cannot be satisfied, as shown in Figure 2.
According to the expression for probabilistic electricity balance risk in Equation (4), random variables for load shedding and curtailed power can be defined as follows:
P ˜ t cut = i = 1 G ( α ¯ i t G ψ ˜ t R i t up ) +
S ˜ t re = i = 1 G ( R i t down α _ i t G ψ ˜ t ) +
In the equation, P ˜ t cut represents the random variable for load shedding and S ˜ t re represents the random variable for curtailed power.
In accordance with the value-at-risk (VaR) definition, the threshold expressions for the random variables of load shedding and curtailed power can be delineated at a specific confidence level.
θ t cut = min [ b 1 : { P ˜ t cut b 1 } 1 γ 1 = β 1 ]
θ t S = min [ b 2 : { S ˜ t re b 2 } 1 γ 2 = β 2 ]
The variables θ t cut and θ t S denote the threshold values of the random variables corresponding to load shedding and curtailed power at time t, respectively.
The physical interpretation of θ t cut is the minimum threshold for load shedding power at a confidence level of β1, indicating the potential imbalance between supply and demand when the dispatch instruction for thermal power reserve exceeds i = 1 G R i t up with a probability greater than β1 at time t. The physical interpretation of θ t cut aligns closely with this concept.
In the optimization strategy for balancing probabilistic power supply and demand in the power system, the objective is to identify the optimal balance point for dispatching thermal power standby capacity. This takes into consideration both safety and economic efficiency, aiming to minimize the likelihood of significant load shedding or curtailment during actual operation while ensuring the effective implementation of dispatch instructions. The conditional value-at-risk (CVaR) theory is utilized to quantify the risk associated with large load shedding or curtailment caused by prediction errors in the probability distribution of new energy sources on both upper and lower tails. This study quantifies risk indicators for supply and demand balance in a high proportion new energy power system based on CVaR, expressing risk indicators for load shedding power and curtailment power at confidence levels β1 and β2 as average VaR values:
φ t cut = 1 1 β 1 P ˜ t cut θ t cut P ˜ t cut p ( ψ ˜ t ) d ψ ˜ t
φ t S = 1 1 β 2 S ˜ t re θ t S S ˜ t re p ( ψ ˜ t ) d ψ ˜ t
The variables φ t cut and φ t S represent the risk indicators for load shedding power and curtailed wind power, respectively, at time t. p ( ψ ˜ t ) denotes the probability distribution function of wind and solar forecasting errors.
φ t cut can be interpreted physically as the conditional expectation value of the load shedding power exceeding its threshold  θ t cut , and a similar physical interpretation applies to  φ t S .
In fact, by minimizing φ t cut / φ t S , a small θ t cut / θ t S is also obtained due to the constraint that θ t cut / θ t S does not exceed φ t cut / φ t S . An auxiliary function F β , t cut / F β , t S is introduced to represent φ t cut / φ t S , which is defined as follows:
F β , t cut = b 1 + 1 1 β 1 ψ ˜ t [ P ˜ t cut b 1 ] + p ( ψ ˜ t ) d ψ ˜ t
F β , t S = b 2 + 1 1 β 2 ψ ˜ t [ S ˜ t re b 2 ] + p ( ψ ˜ t ) d ψ ˜ t
In this formula, [ ] + represents max { , 0 } . F β , t cut / F β , t S can be estimated using sample data of random variables ψ ˜ t j (j = 1, 2,…M) as follows:
F ˜ β , t cut = b 1 + 1 M ( 1 β 1 ) j = 1 M [ P ˜ t cut ( ψ ˜ t j ) b 1 ] +
F ˜ β , t S = b 2 + 1 M ( 1 β 2 ) j = 1 M [ S ˜ t re ( ψ ˜ t j ) b 2 ] +
Furthermore, let
H β , t cut = max { b 1 , 1 1 β 1 P ˜ t cut β 1 b 1 1 β 1 }
H β , t S = max { b 2 , 1 1 β 2 S ˜ t re β 2 b 2 1 β 2 }
Moreover, we can acquire the following:
F β , t cut = b 1 + 1 1 β 1 E P ^ M ( [ P ˜ t cut b 1 ] + ) = E P ^ M ( H β , t cut )
F β , t S = b 2 + 1 1 β 2 E P ^ M ( [ S ˜ t re b 2 ] + ) = E P ^ M ( H β , t S )

3. Probabilistic Balancing Analysis Model for New Energy Power Systems Based on Distributed Robust Optimization

Based on the risk index of supply and demand balance described in Section 2, this chapter proposes a probabilistic balance analysis model of a new energy power system based on distributed robust optimization and further transforms it into a linear model to achieve an efficient solution. For the convenience of description, the model description still only considers the uncertainty of the new energy output and ignores the uncertainty of the load. At the same time, all schedulable flexible resources are represented by generator sets. However, the proposed model and method can also be applied to flexible resources such as energy storage. It is necessary to consider the impact of providing a reserve on the state of charge of energy storage and the availability of subsequent periods, which requires a more complex mathematical model.

3.1. A New Energy Power System Balance Analysis Model Based on Risk Assessment Indicators

(1)
The objective function
The objective function aims to minimize the cost of thermal power generation, standby capacity expenses, and the potential loss costs under extreme distribution conditions for system load shedding and wind curtailment.
min ( t = 1 T i = 1 G ( F i , t G + F i , t R ) + sup B ε ( ^ M ) E ( C L + C E ) )
Among them,
F i , t G = a i ( P i , t g ) 2 + b i P i , t g + c i F i , t R = ρ i G R i , t up + ρ i G R i , t down
C L = c l F β , t cut = c l ( b 1 + 1 1 β 1 E ^ M ( [ P ˜ t cut b 1 ] + ) ) = c l E ^ M ( H β , t cut )
C E = c e F β , t S = b 2 + 1 1 β 2 E ^ M ( [ S ˜ t re b 2 ] + ) = E ^ M ( H β , t S )
In the equation, ρ i G denotes the cost of the spinning reserve capacity for thermal power units; ai, bi, and ci denote the coefficients of a polynomial; P i , t G denotes the power output of unit i at time t; CL represents the load shedding costs; CE represents the curtailment costs; cl is the penalty cost for unit capacity load shedding; and ce is the penalty cost for unit capacity curtailment.
In addition, in order to improve the computational efficiency, the piecewise linear function is used to approximate the power generation cost of the thermal power units [26].
(2)
Equations governing power flow
P i , t = j B G i , j V i , t V j , t cos θ i , j , t + j B B i , j V i , t V j , t sin θ i , j , t ,   i B
P i , t = P i , t g + P i , t wind + P i , t pv P i , t d
Q i , t = j B B i , j V i , t V j , t cos θ i , j , t + j B G i , j V i , t V j , t sin θ i , j , t ,   i B
Q i , t = Q i , t r Q i , t d
P i , j , t l = V i , t 2 G i , j + V i , t V j , t ( G i , j cos θ i , j , t + B i , j sin θ i , j , t )
P ¯ l P i , j , t l P ¯ l ,   ( i , j ) L
V ¯ i V i , t V ¯ i
Q ¯ i r Q i , t r Q ¯ i r
In the equations, B and L represent the sets of buses and lines, respectively; P i , t wind and P i , t pv denote the forecasted output of wind farms and photovoltaic fields at time period t; P i , t g represents the thermal power output at node i; P i , t d denotes the conventional load in the system; Q i , t d represents the reactive power demand in the system; Q i , t r , Q ¯ i r , and Q ¯ i r , respectively, represent the reactive power generation, lower bound of the reactive power output, and upper bound of the reactive power output; P i , j , t l represents the line power flow; V i , t , V ¯ i , and V ¯ i , respectively, represent the node voltage, upper bound of the node voltage, and lower bound of the node voltage.
(3)
Limitations on the commencement and termination of operations for thermal power units
[ t i ( t 1 ) on T i min on ] [ X i ( t 1 ) X i t ] 0 [ t i ( t 1 ) off T i min off ] [ X i t X i ( t 1 ) ] 0
In the equation, T i min on / T i min off represents the minimum start-up/shut-down time for unit i; t i ( t 1 ) on / t i ( t 1 ) off represents the duration of operation/shut-down from unit i to time period t − 1; X i t is a binary integer variable representing the start-up/shut-down status of unit i in time period t, with a value of 1 indicating start-up and a value of 0 indicating shut-down.
(4)
Restrictions on the output limitation of thermal power units
X i t P i G , min P i , t G X i t P i G , max
In the equation, P i G , max and P i G , min represent the upper and lower bounds of unit i’s output, respectively.
(5)
Limitations on the Spinning Reserve Capacity of Thermal Power Units
P i , t G R i , t down X i t P i G , min ,   R i , t down 0 P i , t G + R i , t up X i t P i G , max ,   R i , t up 0
In the equation, R i , t up and R i , t down represent the upper and lower spinning reserve capacity of thermal power unit i in time period t, respectively.
(6)
Limitations on the ramp rate of thermal power units
P i , t G + R i , t up ( P i , t 1 G R i , t 1 down ) r i up P i , t 1 G + R i , t 1 up ( P i , t G R i , t down ) r i down
In the equation, r i up and r i down represent the ramp-up rate and ramp-down rate of thermal power unit i, respectively.

3.2. Wasserstein Fuzzy Sets for Characterizing Uncertainty in Wind and Solar Resources

In the objective function of the model presented in Equation (19), the expected value of the system contingency load shedding and curtailment condition risk loss is approximated based on the empirical distribution ^ M of the wind and solar prediction errors. However, this approach only considers historical sample data and cannot accurately represent the true distribution of the wind and solar prediction errors. The fundamental challenge in robust optimization with distribution lies in constructing a fuzzy set that can authentically reflect the uncertain prediction error distribution of new energy sources. In this paper, we propose a fuzzy set based on the Wasserstein distance, which effectively measures differences between probability distributions. Specifically, given two distributions and within a compact support space Ξ, the Wasserstein distance is defined as follows:
W ( , ) = inf π m ( E × E ) { E × E d ( ξ q , ξ p ) Π ( d ξ q , d ξ p ) }
( d ξ q , d ξ p ) = ξ q ξ p
In the equation, ξ q and ξ p represent stochastic variables; Π denotes the joint distribution of and ; Equation (36) defines the distance between ξ q and ξ p ; · represents a norm operation, with this paper utilizing the -norm to enhance the model solvability. The fuzzy set based on the Wasserstein distance is defined as follows:
B ε ( ) = { | W ( , ) ε }
The variable ε represents a constant derived from historical data, while B ε ( ) denotes a Wasserstein ball with a radius of ε and centered at .
The fuzzy set based on the Wasserstein distance should be centered around a specific distribution , as indicated by Equation (37). However, due to the unknown nature of the error distribution in wind and solar power generation, this center should be determined based on relevant historical data to ensure alignment with the actual distribution of uncertain output errors. Assuming we have a finite historical sample dataset ψ 1 , ψ 2 , , ψ M for an uncertain variable ψ following a certain distribution , we can construct an empirical distribution ^ M to approximate the true distribution. Given that the true distribution typically does not deviate significantly from the empirical one, we select the empirical distribution as the center of our Wasserstein ball for estimating the unknown true distribution. The expression for this empirical distribution is as follows:
^ M = 1 M j = 1 M δ ψ j
In the equation, M represents the sample size; δ ψ j is the Dirac measure (if ψ j A , then δ ψ j ( A ) = 1 , otherwise δ ψ j ( A ) = 0 ; A denotes any set belonging to σ ( Ξ ) ; and Ξ signifies the support set of ψ . As M approaches infinity, ^ M should tend toward the true distribution . In other words, as more data become available, the “distance” between ^ M and will become smaller. The Wasserstein fuzzy set centered around an empirical distribution ^ M can be expressed as follows:
B ε ( ^ M ) = { | W ( , ^ M ) ε }
In this equation, the parameter A can regulate the level of conservatism in the model, which significantly influences its performance based on the Wasserstein distance. A potential choice is suggested in the literature [27]:
ε = D 2 M log ( 1 1 η )
In the equation, η represents the confidence level, and D denotes the diameter of the support points of the random variable. Nevertheless, the literature [28] suggests that the value ε derived from Equation (40) is excessively conservative and proposes a new alternative as follows:
P { W ( , ^ M ) ε } 1 exp ( M ε 2 c 2 )
The calculation method for ε can be derived by setting the right-hand side of Equation (41) equal to the confidence level η of the given fuzzy set.
ε = C 1 M ln ( 1 1 η )
In the equation, C represents a constant. If C = 2 D is true, then Equation (42) transforms into Equation (40). The value of C can be estimated using historical data, and the calculation formula is as follows:
C 2 min ρ > 0 ( 1 2 ρ ( 1 + ln E [ e ρ λ μ ^ 1 2 ] ) ) min ρ > 0 2 1 2 ρ ( 1 + ln ( 1 M j = 1 M e ρ λ μ ^ 1 2 ) )
In this equation, μ ^ represents the average of the historical sample, specifically defined as μ ^ = 1 M j = 1 M ψ j .

4. Transformation of the Model

4.1. Linearization of Trends

In the aforementioned model, the power flow equations for AC systems exhibit non-convex and nonlinear characteristics, rendering direct solutions impractical. Consequently, linearizing the power flow equations for AC systems becomes imperative. The expansion of Equations (23) and (25) results in the following:
P i , t = g i , i V i , t 2 + j B , j i [ g i , j V i , t ( V i , t V j , t cos θ i , j , t ) b i , j V i , t V j , t sin θ i , j , t ] ,   i B
Q i , t = b i , i V i , t 2 j B , j i [ b i , j V i , t ( V i , t V j , t cos θ i , j , t ) + g i , j V i , t V j , t sin θ i , j , t ] ,   i B
We approximate the non-linear terms in Equations (44) and (45) as outlined below:
V i , t 2 V i , t V i , t V j , t sin θ i , j , t θ i , t θ j , t V i , t ( V i , t V j , t cos θ i , j , t ) V i , t V j , t
The ultimate outcome produces the subsequent decoupled linear power flow.
P i , t = j B G i , j V j , t j B B i , j θ j , t Q i , t = j B B i , j V j , t j B G i , j θ j , t , i B
Likewise, the formula for line power is as follows.
P i , j , t l = G i , j ( V i , t V j , t ) B i , j ( θ i , t θ j , t ) ,   ( i , j ) L

4.2. The Dual Transformation of a Distributionally Robust Model

Distributionally robust optimization combines the principles of stochastic optimization and robust optimization, typically framed as a minimax problem. The model is outlined as follows:
inf x sup P Ω P ( ω ˜ ) E P { f ( x , ω ˜ ) }
In this formula, Ω P ( ω ˜ ) represents the fuzzy set of uncertain quantity ω ˜ ; sup P Ω P ( ω ˜ ) represents the worst-case distribution of uncertain quantity Ω P ( ω ˜ ) within fuzzy set sup P Ω P ( ω ˜ ) ; and inf x represents the lower bound of the expected value of f ( x , ω ˜ ) under the worst-case distribution of ω ˜ .
Distributionally robust optimization utilizes the fuzzy set Ω P ( ω ˜ ) to represent the higher-order uncertainty of the uncertain quantity ω ˜ , encompassing both the intrinsic uncertainty of the quantity and the ambiguity in its probability distribution information.
The extreme distribution problem of Model (49) can be reformulated in accordance with the strong duality theory [29] as follows:
inf x sup P Ω P ( ω ˜ ) E P { f ( x , ω ˜ ) } =             inf κ 0 κ ε + 1 M m = 1 M sup ω ˜ Ξ f ( x , ω ˜ ) κ ω ˜ ω ^ m
Model (50) can be further reformulated as follows:
inf κ 0 κ ε + 1 M m = 1 M τ m   s . t .   f ( x , ω ¯ ) κ ω ¯ ω ^ m τ m f ( x , ω _ ) + κ ω _ ω ^ m τ m f x , ω ^ m τ m
In this equation, κ represents a dual variable; ω ¯ and ω _ denote the vectors formed by the boundaries of ω ˜ i .

5. Simulation Study

The proposed method was validated by testing it on the IEEE118 node system with an enhanced structure as a case study. The system structure utilized in the case study is depicted in Figure A1 of Appendix A. It comprises 11 thermal power units (G1–G11) with specific parameters detailed in Table A1 of Appendix A. The installed capacity for wind power is 900 MW, connected to Node 25, while the installed capacity for photovoltaic power is 1500 MW, connected to Node 65. New energy accounts for a substantial 47% of the total installed capacity, signifying a significant proportion within the system. Additionally, each node’s maximum load in the system has been limited to 75% of that in the original IEEE118 node system.
Utilizing the actual and predicted values of historical wind and solar power output, this study modeled the empirical distribution of errors in wind and solar power output. Subsequently, 1000 samples of errors in wind and solar power output were randomly generated at each time point based on the historical empirical distribution.

5.1. Systematic Probabilistic Analysis of Supply and Demand Balance

The paper conducts a probabilistic risk analysis of power generation balance in a high-proportion new energy power system, utilizing proposed load shedding and curtailed power conditions. For instance, the system dispatch optimization results at a 95% confidence level are illustrated in Figure 3, Figure 4, Figure 5, Figure 6, Figure 7, Figure 8, Figure 9, Figure 10, Figure 11 and Figure 12.
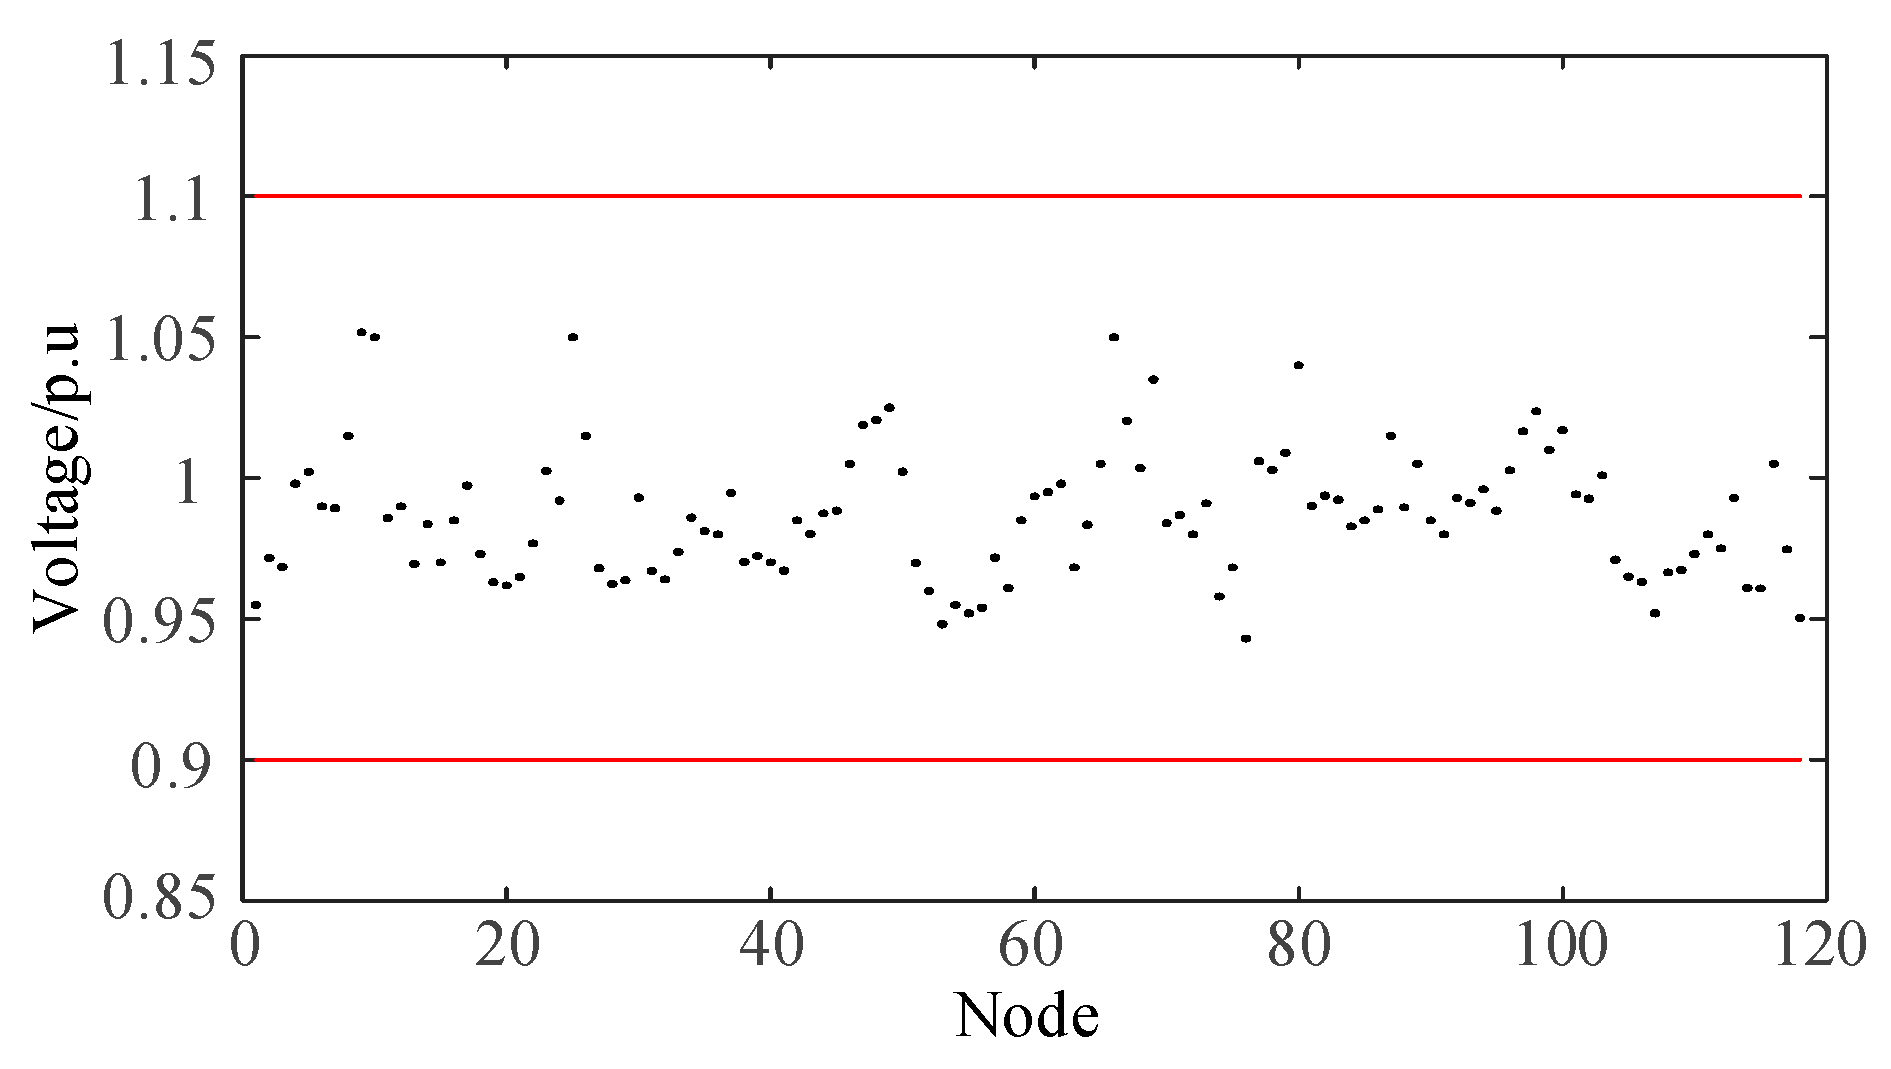
Figure 3 depicts the voltage levels at system nodes at a specific time, demonstrating that the system’s voltage levels are within permissible limits. This validates the effectiveness of the power flow model proposed in this paper.
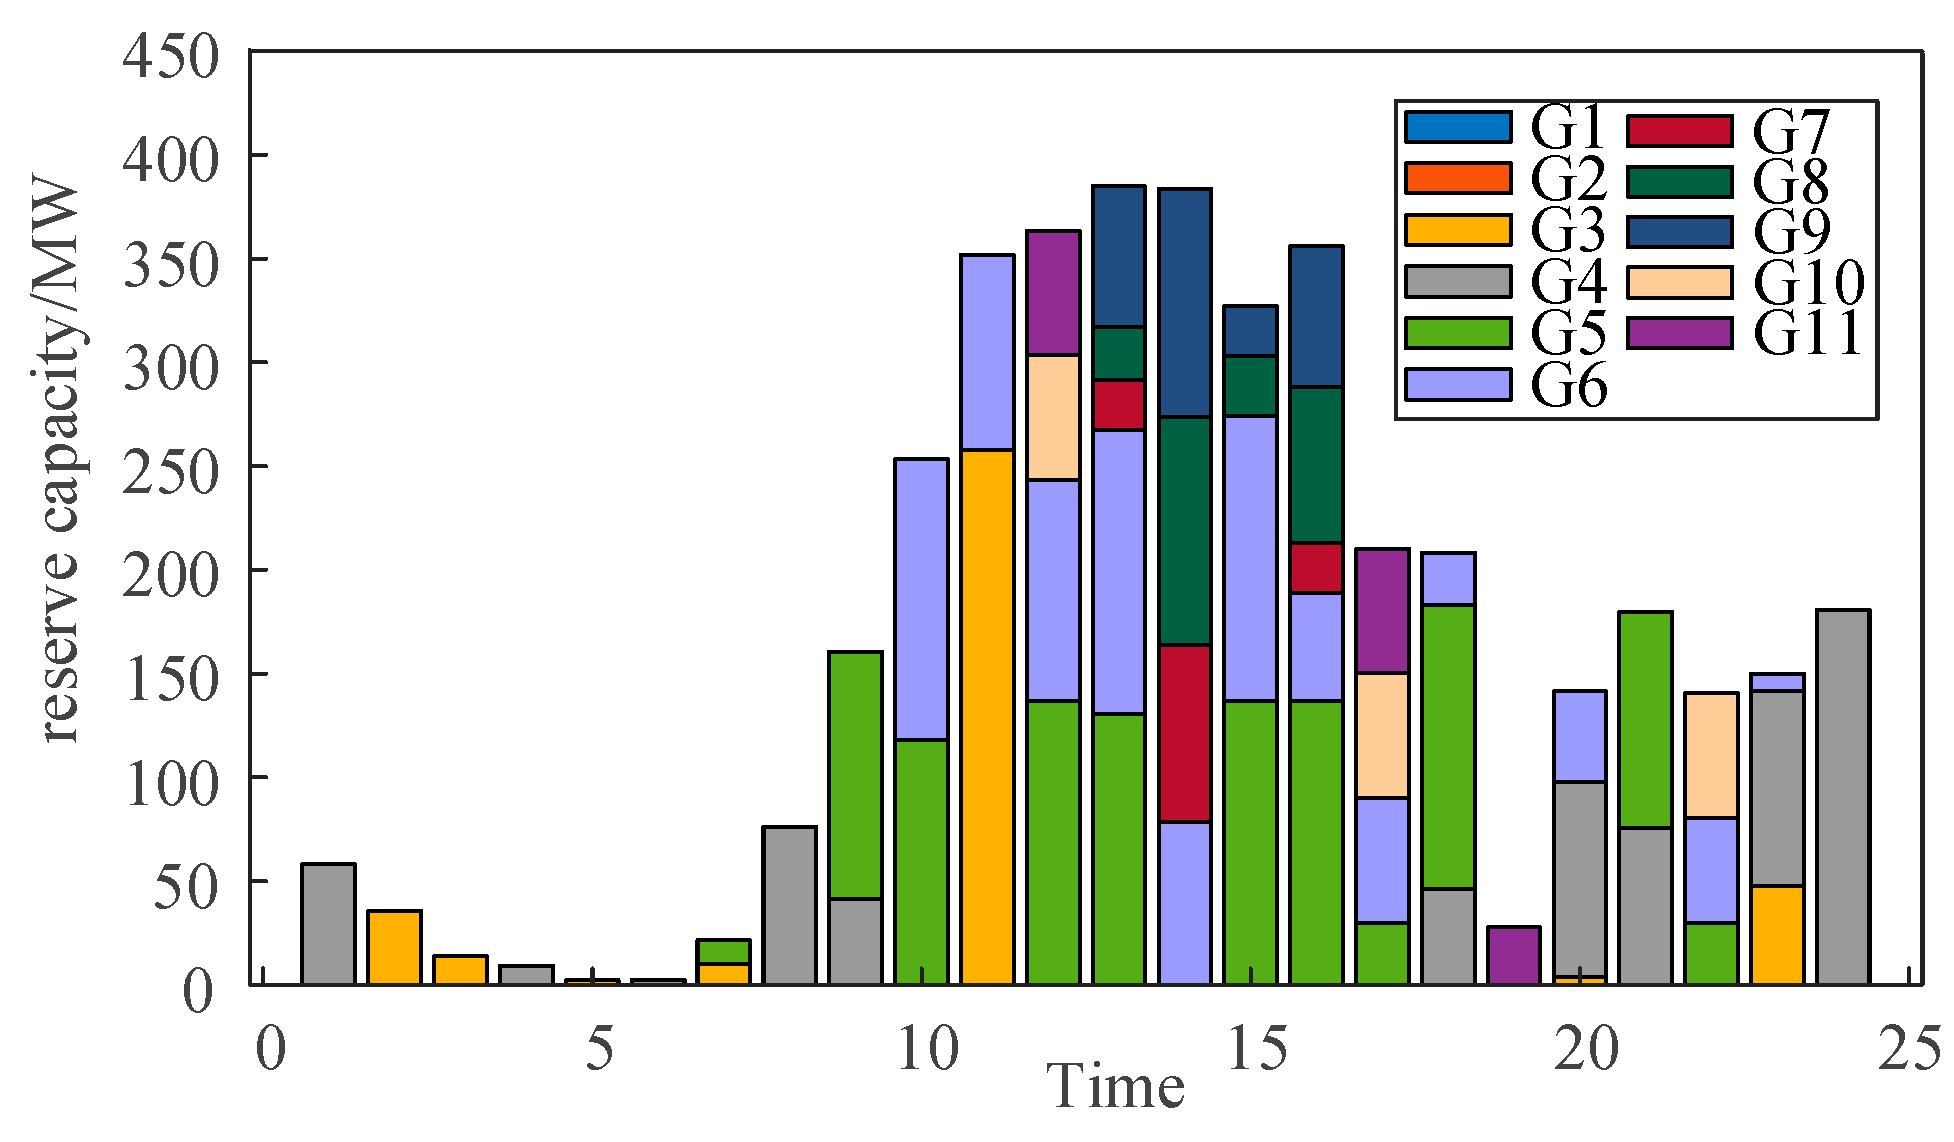
As depicted in Figure 4, the output of new energy sources reaches its minimum value in the early morning. Due to the lower limit on the output of the new energy sources, downward fluctuations are constrained by uncertainty. Consequently, at this time, the total upward ramping reserve is at its daily nadir.
As depicted in Figure 5, the system encounters insufficient climbing reserve capacity around the 19th hour, leading to a potential risk of load shedding. This means that relying solely on the regulation capacity of thermal power plants at this time is no longer adequate to manage the uncertainty of the new energy output. Therefore, it is advisable to utilize a risk value for the probabilistic supply–demand balance cut-load condition as a guide for configuring storage, load demand response, and other flexible resources.
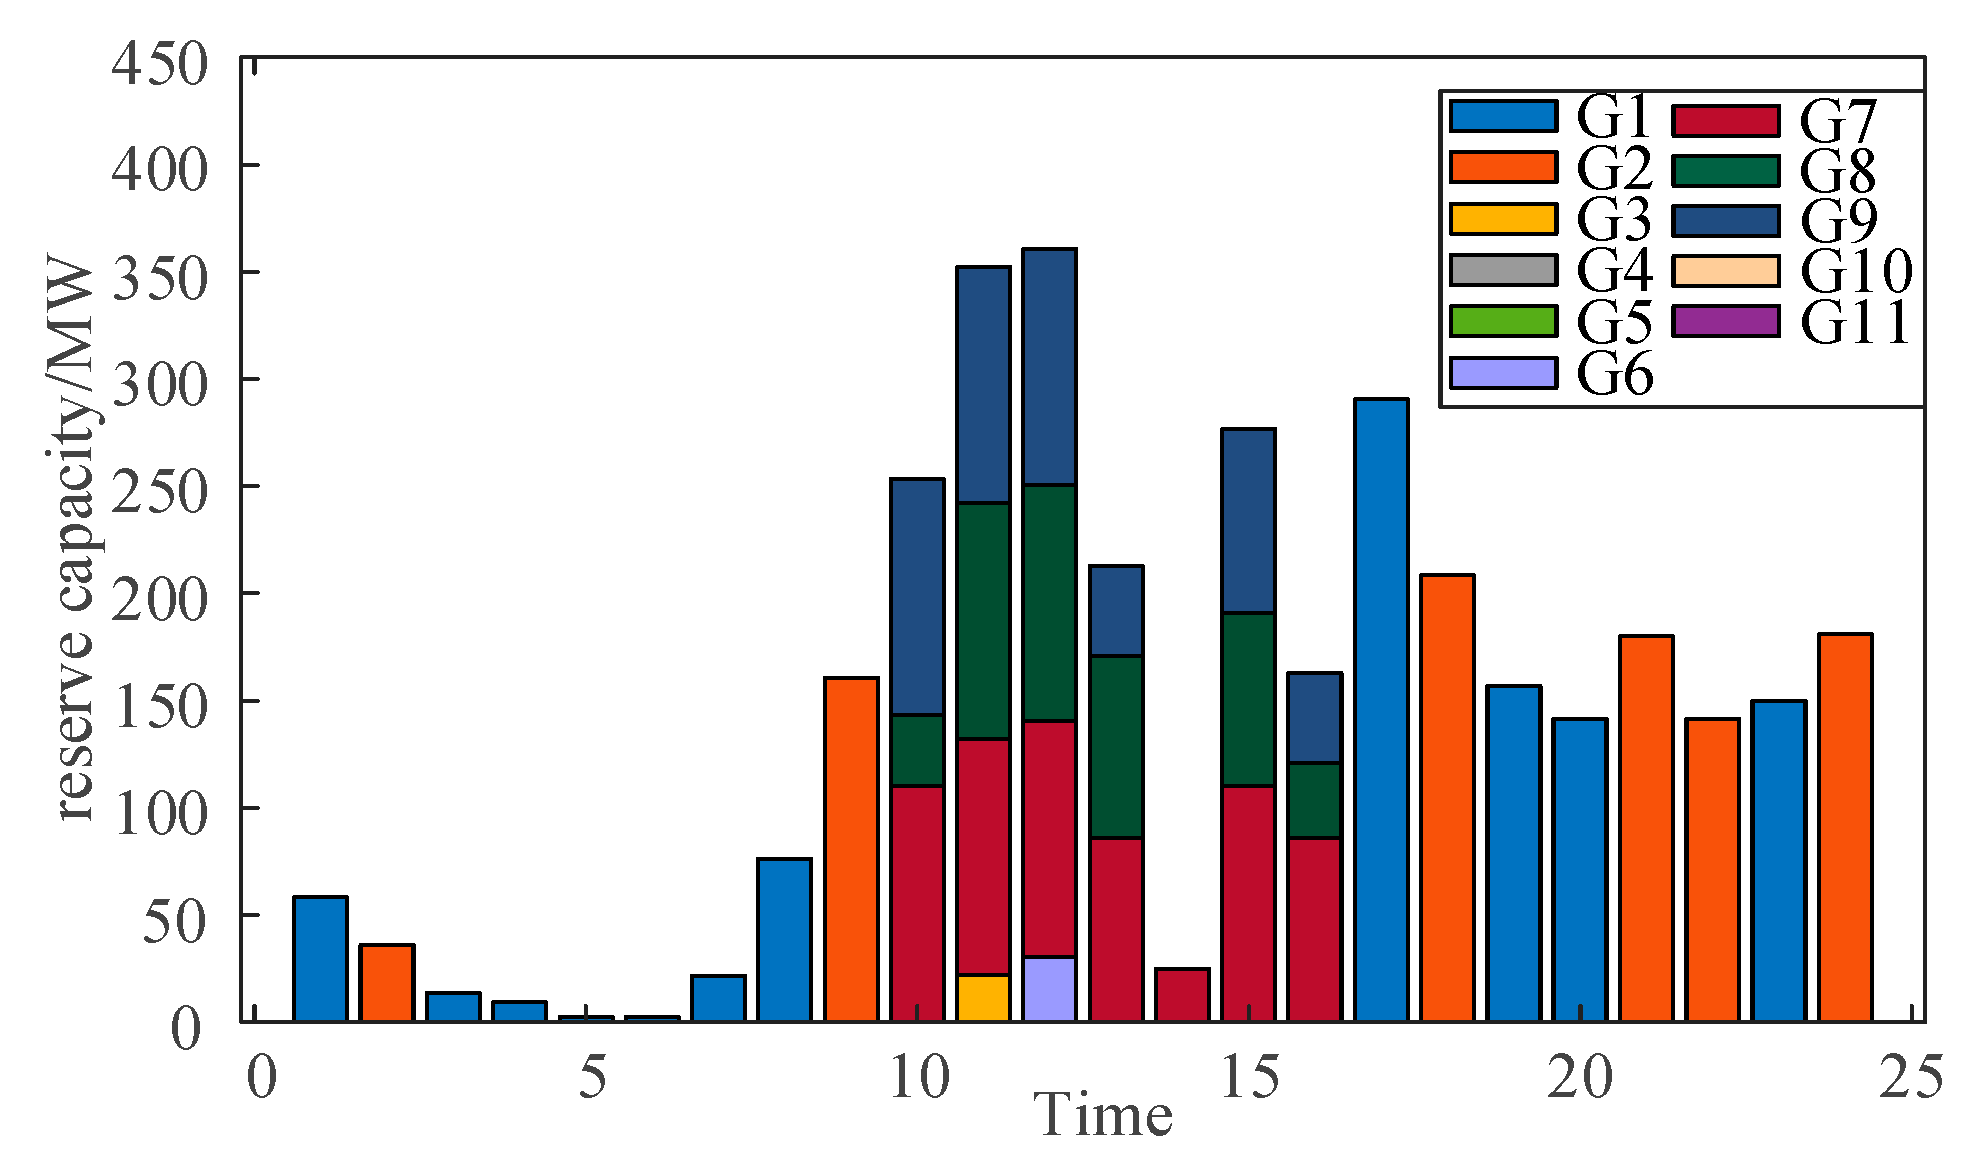
Combined with Figure 6 and Figure 7, it can be seen that during the 14-h period, the system’s downhill reserve capacity is insufficient, and the system has a large risk of power abandonment.
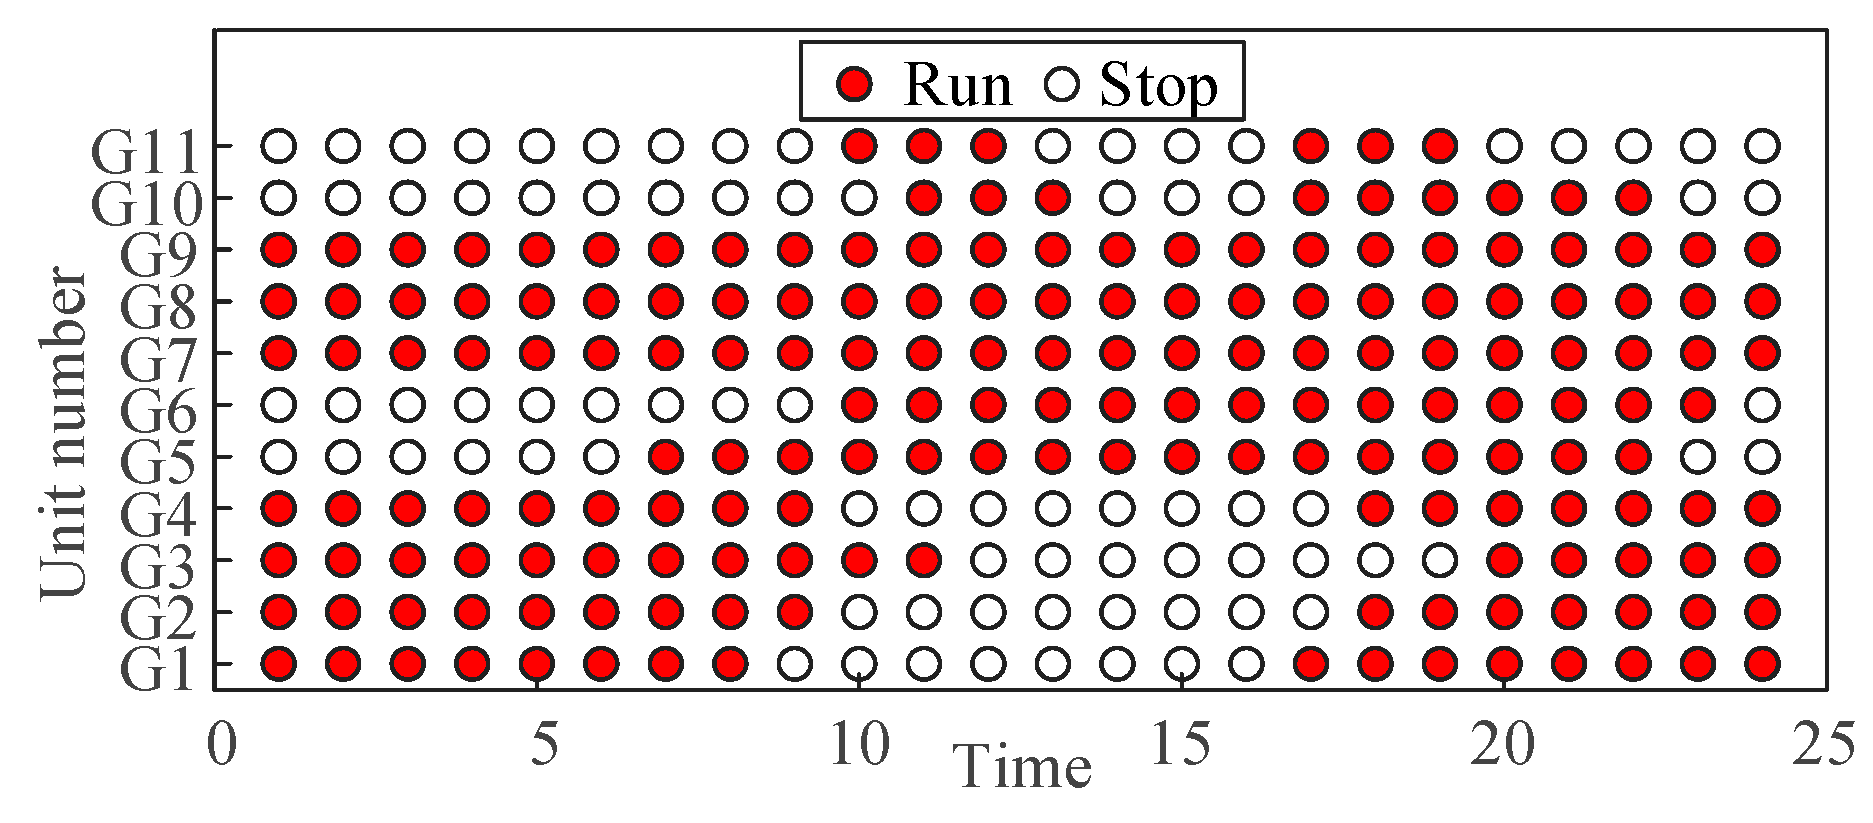
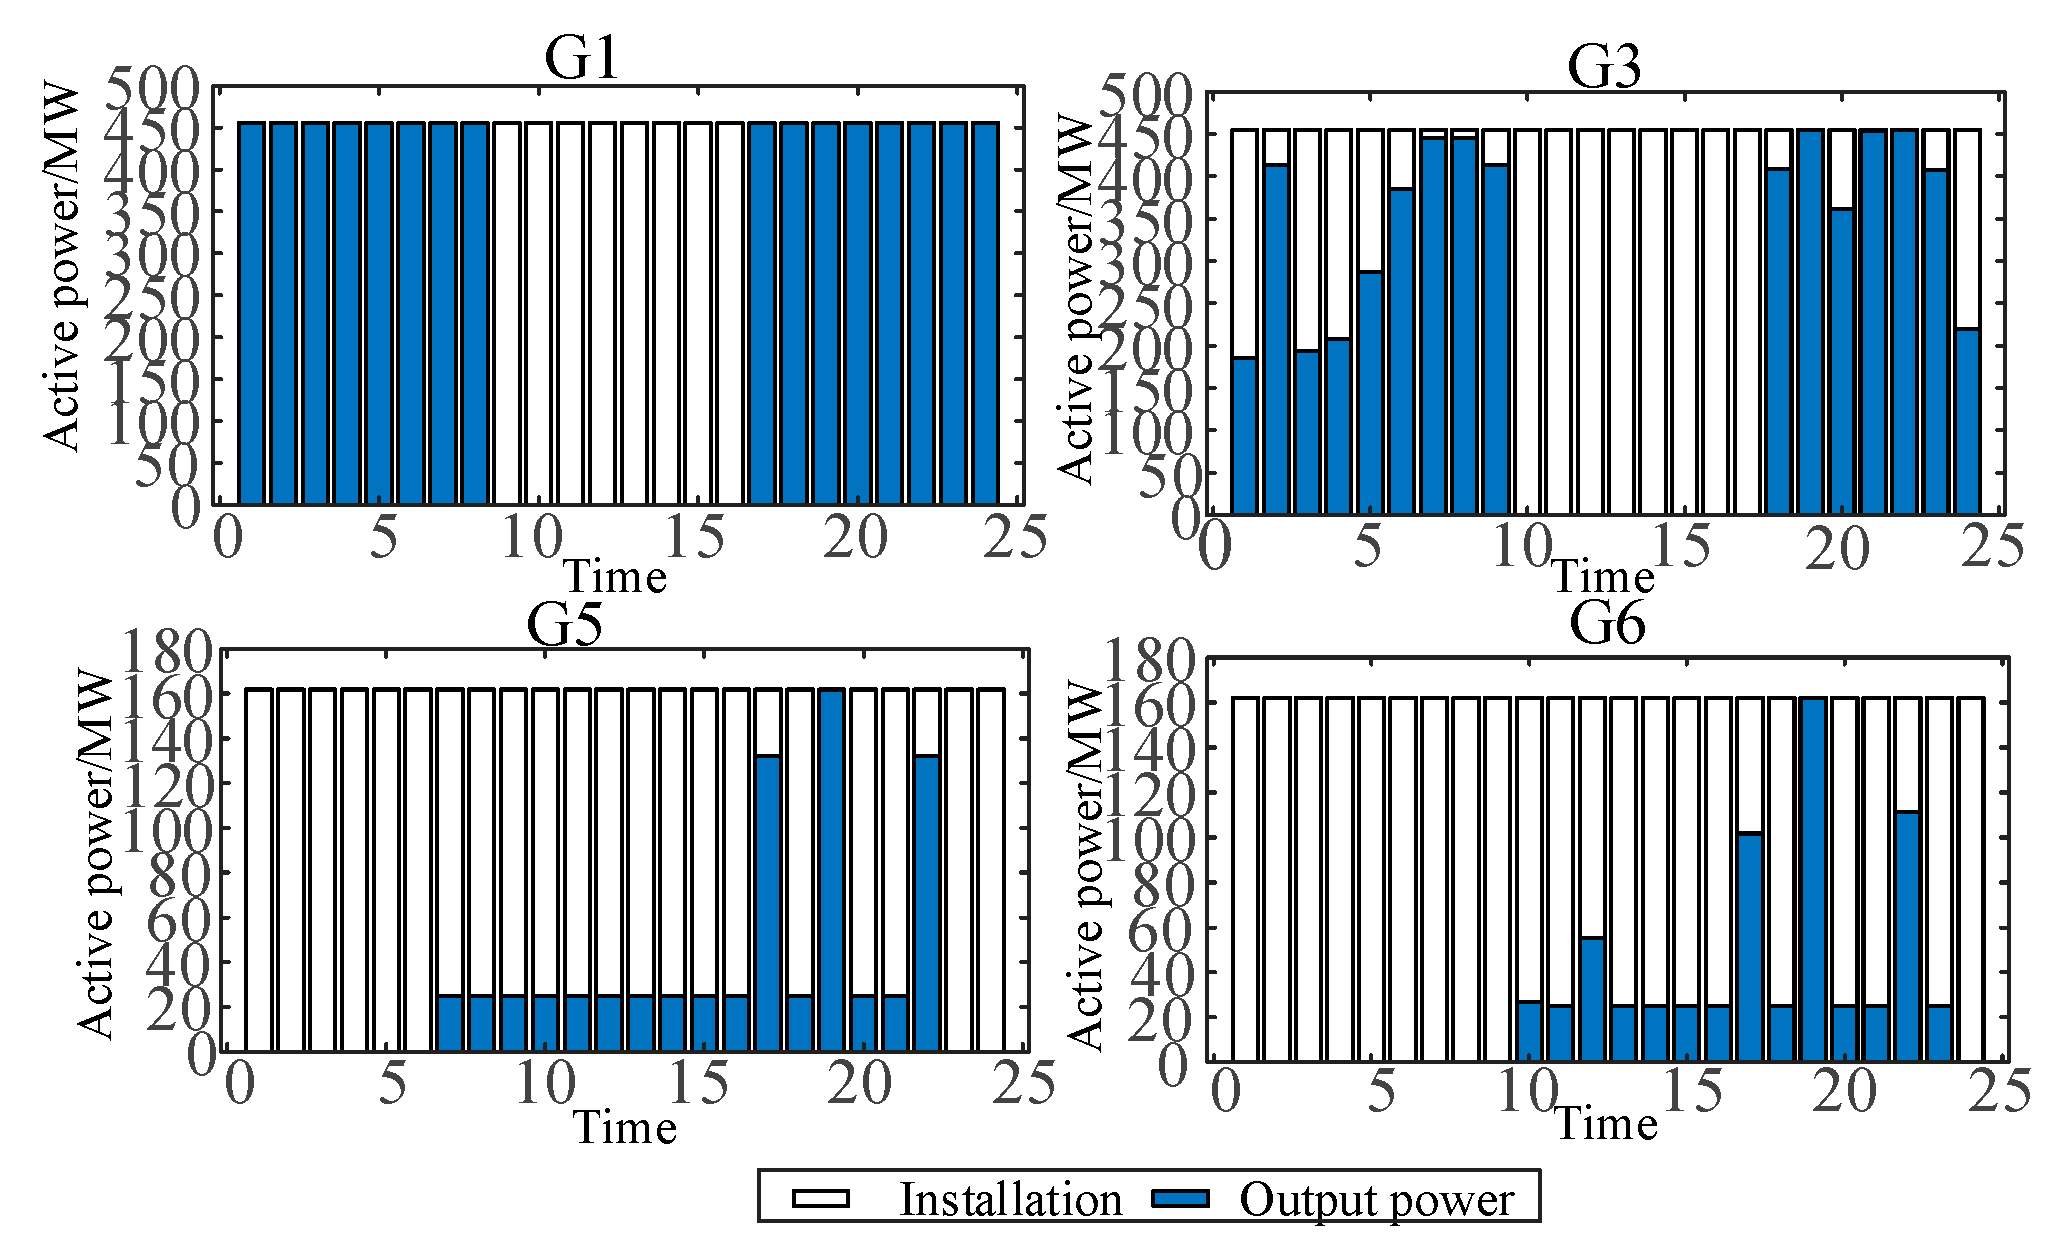
Moreover, by integrating the operational status and output outcomes of each thermal power unit depicted in Figure 8 and Figure 9, it is evident that during the time intervals of 0–10 and 17–24 h, thermal power units G1–G4 are in operation. Conversely, during the period of 10–17 h, the units G5, G6, G10, and G11 are active. The operational state of these units is predominantly influenced by their operating cost coefficients. Consequently, during the time slots of 0–10 and 17–24 h, reliance primarily rests on the thermal power units G1–G4 to furnish reserves for managing uncertainties in the new energy output; whereas during the period of 10–17 h, reliance mainly shifts to G5, G6, G10, and G11 for providing upward ramping reserves.
For instance, during the 10–17 time period, the active power generated by the thermal power units G5 and G6 is notably below their installed capacity. Consequently, they are able to provide a higher upward ramping reserve capacity. The output and reserve capacity configuration of the unit G6 is depicted in Figure 11.
The output and reserve configuration of the thermal power unit G1 are depicted in Figure 10. During the peak load period from 17 to 24 h, in the decision-making process of the power system dispatch, G1 operates at full capacity to optimize economic benefits, primarily providing a downward ramping reserve capacity.
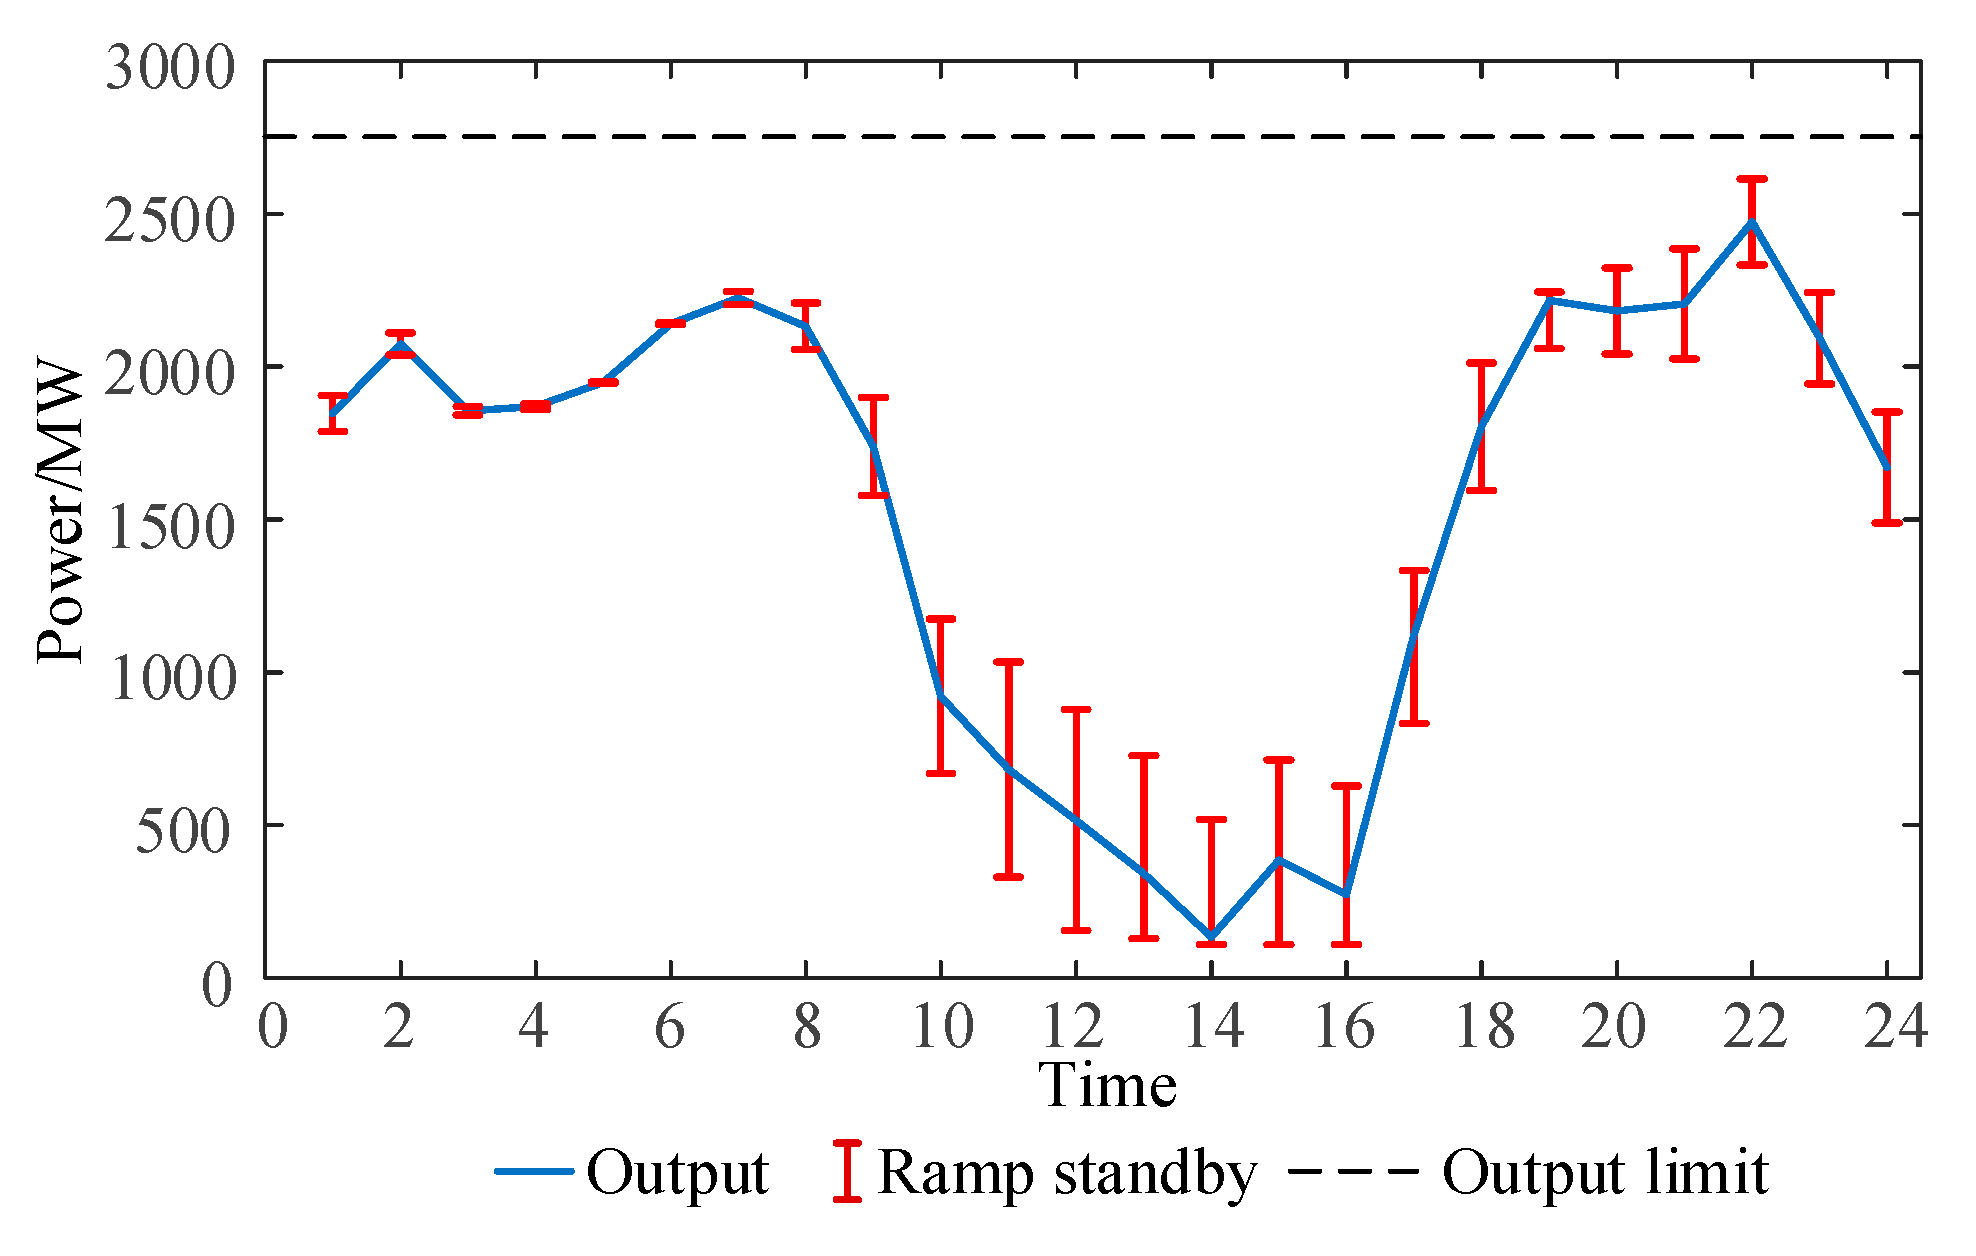
Figure 12 illustrates the correlation between the total output of the power plant and the ramp reserve. During the 1–8 h period in the early morning, there is minimal fluctuation in the output of new energy sources, leading to a small allocation of reserve capacity by the system. However, during the 9–24 h period, significant fluctuations in the new energy source output necessitate a larger allocation of reserve capacity to manage uncertainty. At 14 h, when the system’s thermal power output reaches its lowest point, it provides an ample up reserve capacity but insufficient down reserve capacity.

5.2. Analyzing the Influence of Varying Confidence Levels on Scheduling Outcomes

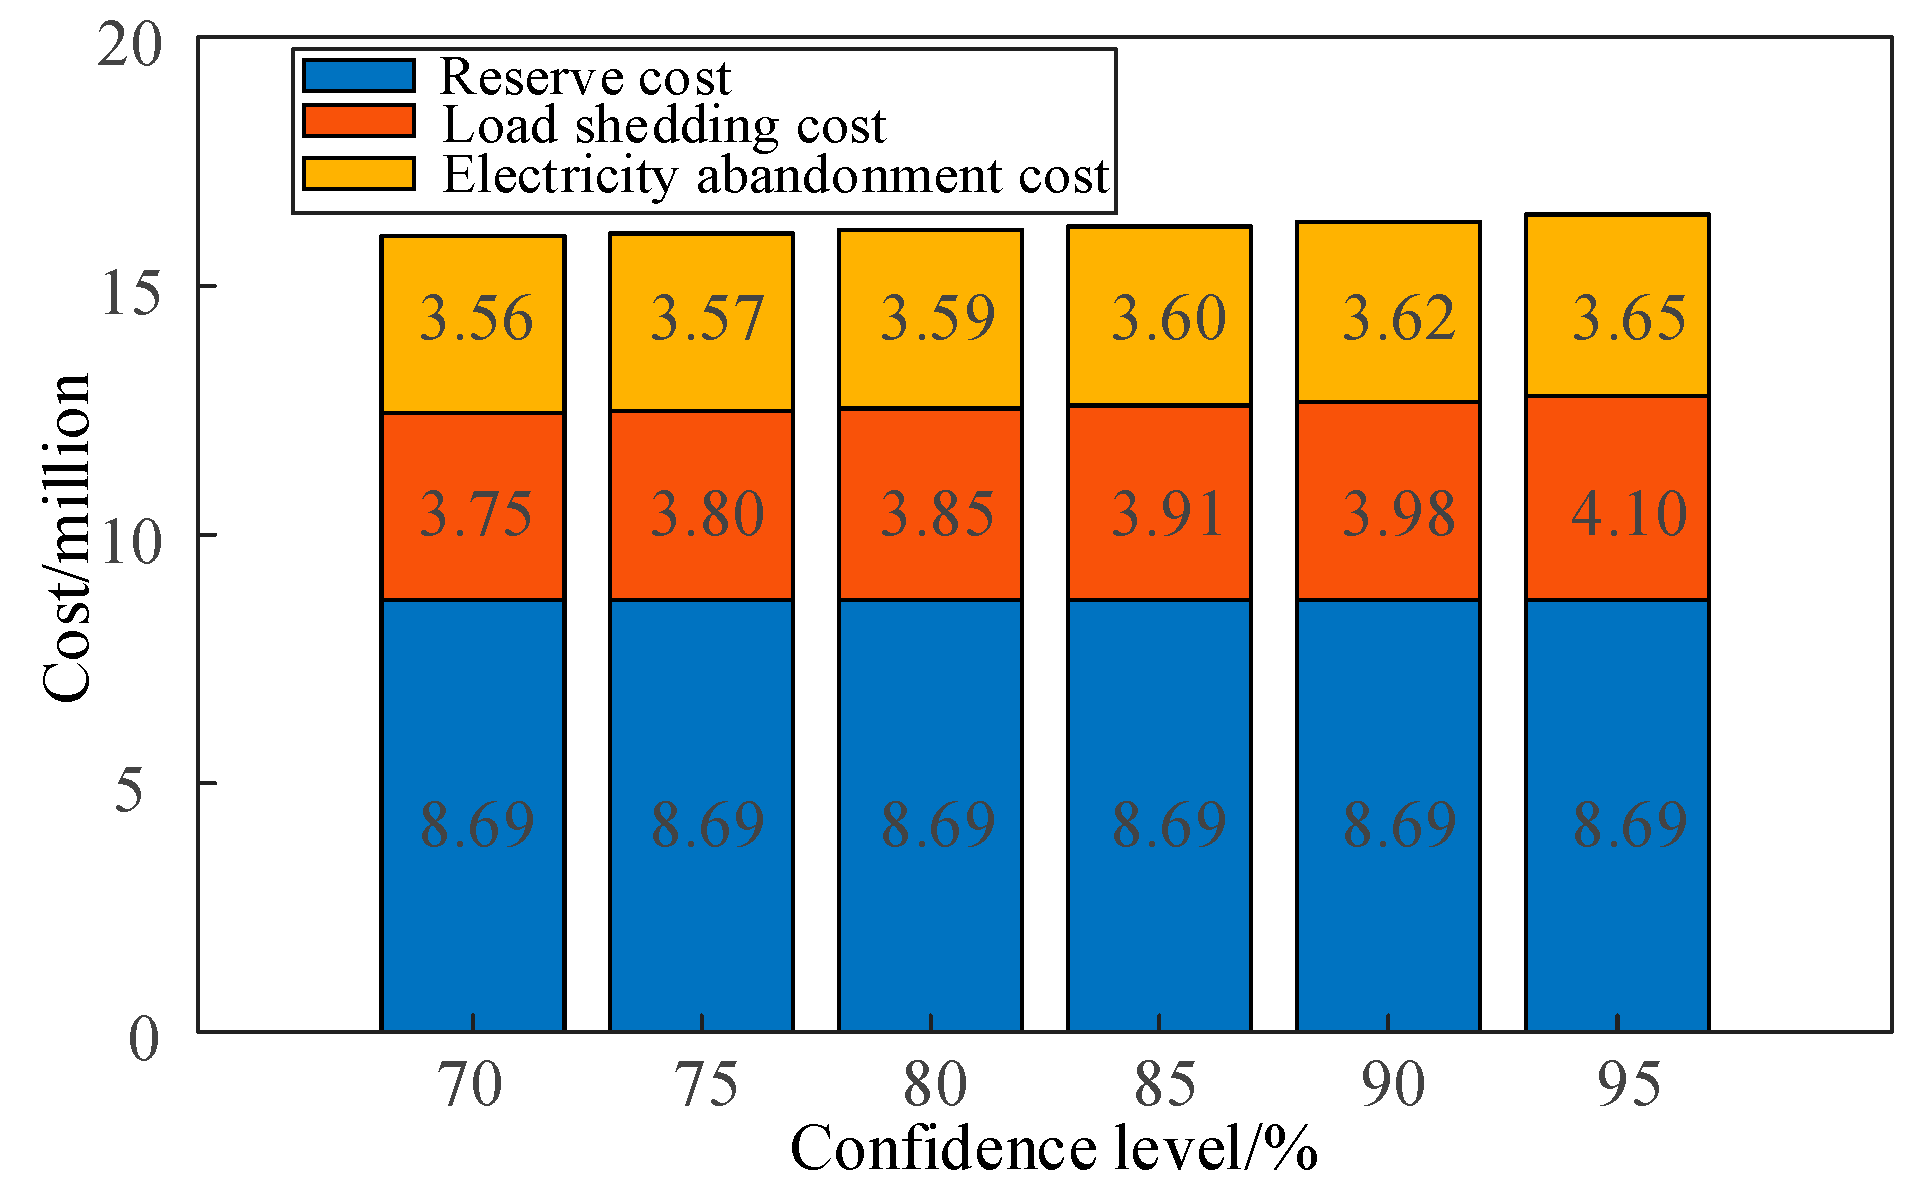
In order to validate the proposed distributed robust coordinated optimization scheduling model under various levels of confidence in load shedding and curtailed wind power risk, this study sets six distinct confidence levels. The corresponding optimized scheduling results are obtained and presented in Figure 13.
Based on Figure 13, it is evident that as the confidence level increases while maintaining the same thermal power regulation capacity, the associated risks also escalate. The expenses related to curtailed wind power and load shedding gradually mount. At a confidence level of 95%, the costs for the curtailed wind power and load shedding amount to CNY 36,500 and CNY 41,000, respectively.
The higher the confidence level, the greater the need for adjustable resources that the system must allocate in order to manage fluctuations in the new energy power and mitigate uncertainty at its source. Simultaneously, system reserve costs also increase as confidence levels rise, reaching CNY 86,900 when the confidence level is 95%.
To assess the scheduling performance of the proposed distributed robust coordinated optimization scheduling model under various levels of fuzzy set confidence, this study establishes six distinct fuzzy set confidence levels. The corresponding optimized scheduling results are computed and presented in Figure 14.
Based on the findings illustrated in Figure 14, it is evident that a higher fuzzy set confidence level corresponds to a larger Wasserstein ball radius and increased uncertainty in the new energy output. Consequently, as the fuzzy set confidence level rises, so does the expected cost of the tail risk for the system. At a 95% confidence level, the costs of curtailment and load shedding are CNY 36,500 and CNY 41,000, respectively.

5.3. Analyzing Scheduling Outcomes Employing Various Optimization Techniques

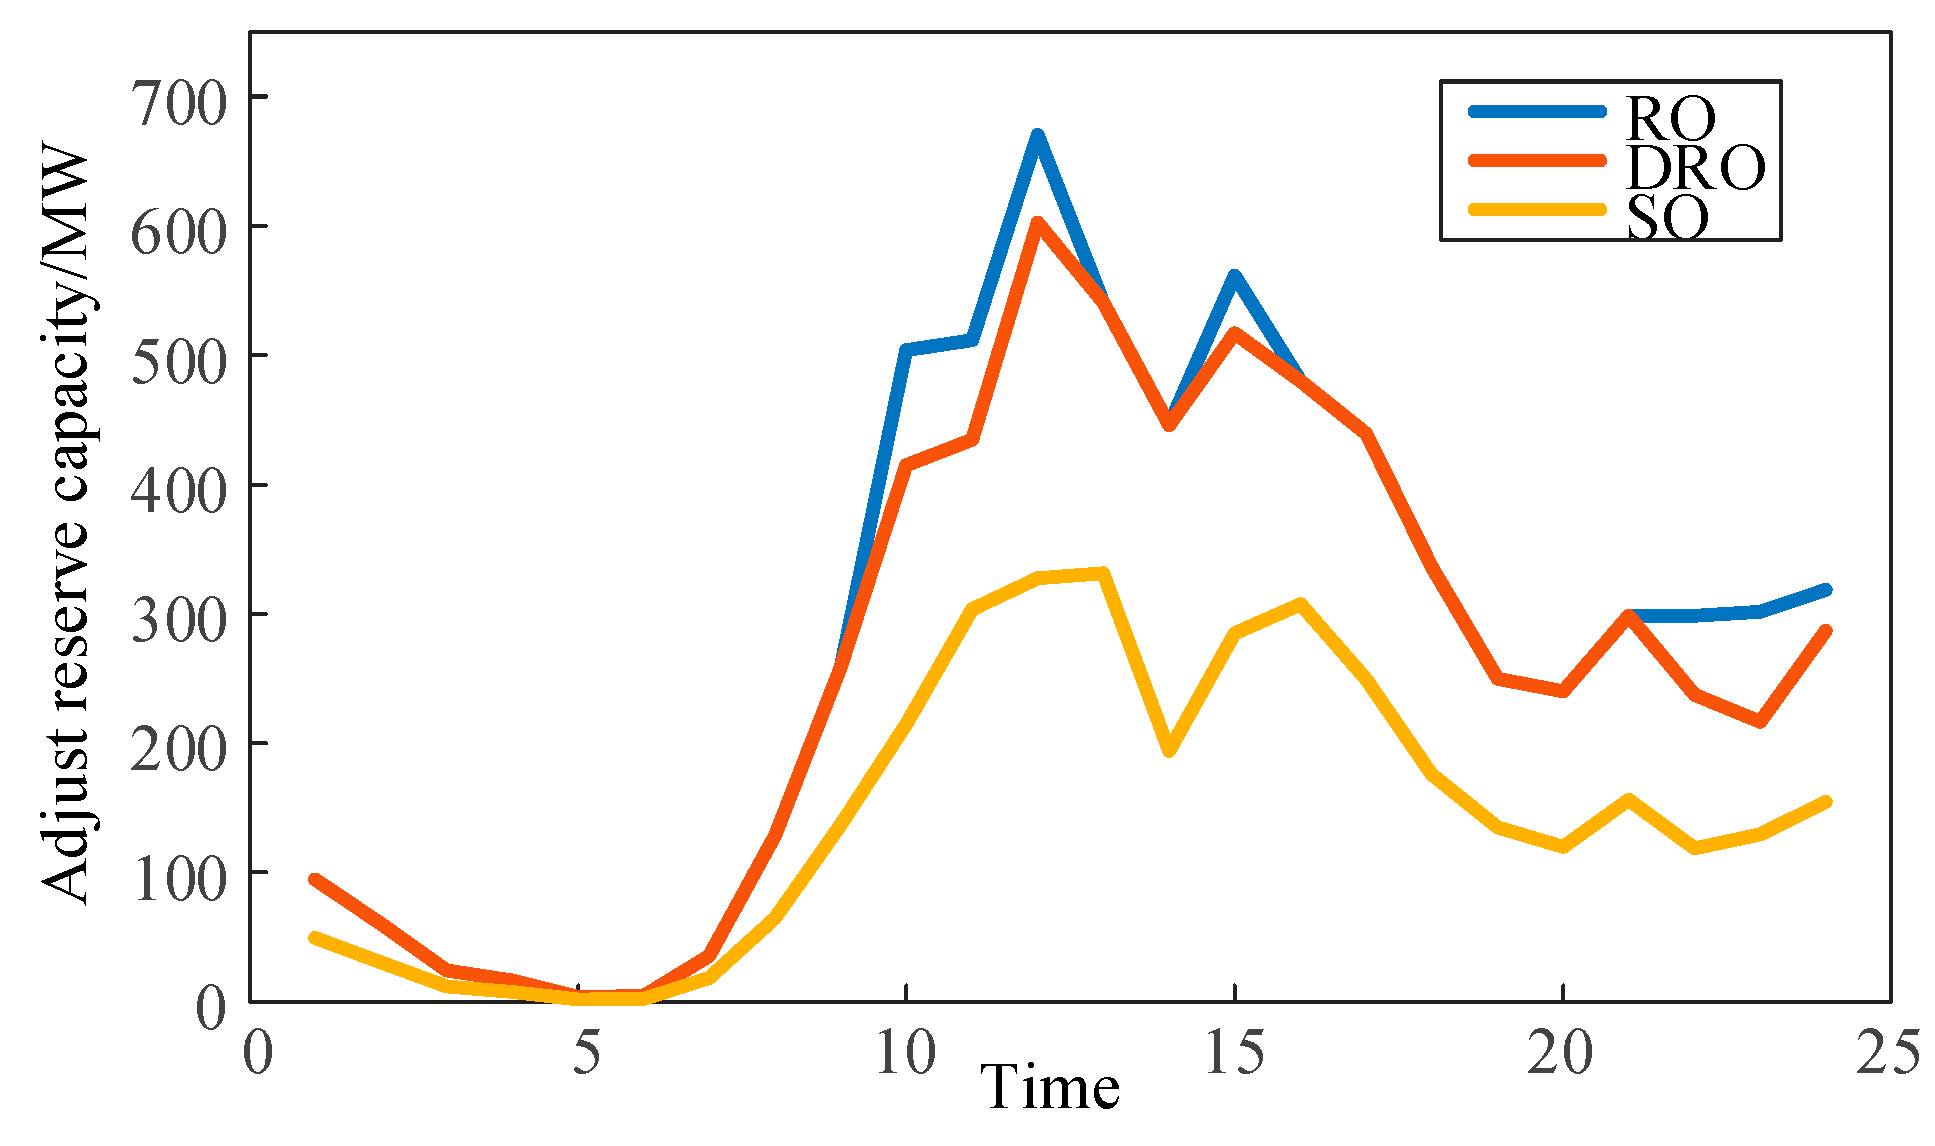
The distributed robust optimization method proposed in this paper is further compared with the robust optimization method and stochastic optimization. In the robust optimization method, the new energy output error at each time is used as the boundary of the sample for new energy output errors at each time; in distributed robust optimization, a conditional risk confidence level of β = 80% and a fuzzy set confidence level of η = 95% are set; for the stochastic optimization model, the confidence parameter value is set to β - = 80%. Subsequently, based on the historical empirical distribution of wind and solar power output errors, 2000 samples are randomly generated to simulate external random scenarios for experimentation. The curtailment probability and load shedding probability for each optimization method are then statistically analyzed. The results of these three methods are presented in Table 2, while adjustments made for reserve allocation are illustrated in Figure 15.
According to Table 2, it is evident that the distributed robust optimization method based on conditional value-at-risk proposed in this paper has led to an approximate increase of 81.4% and 0.7% in total ramping requirements and total scheduling costs, respectively, compared to the stochastic optimization method. However, it has significantly reduced the probabilities of load shedding and curtailment. In contrast, while the robust optimization method can further reduce the supply–demand balance risk, it also results in an approximately 7.2% increase in total ramping requirements compared to our proposed approach. The comparative results suggest that our proposed method effectively balances safety and economic demands by enhancing optimization robustness without incurring excessive additional costs due to overly conservative measures.

6. Conclusions

In order to effectively evaluate the potential risk of power and energy balance disruption resulting from the variability of wind and solar power generation, as well as mitigate the likelihood of curtailment and supply shortages in modern power systems, this study introduces a probabilistic index for assessing the power and energy balance risk based on the conditional value-at-risk (CVaR) theory. Additionally, it develops a robust optimization dispatch model that incorporates flexible ramping reserves from coal-fired power plants. The key findings are as follows:
  • Tailored safety and economic risk indicators for modern power systems’ power and energy balance have been proposed, which can be used in scheduling decisions to achieve operational equilibrium between safety and economic risks.
  • By fully considering the flexible ramping reserves provided by coal-fired power plants, the results of probabilistic risk assessment can guide the rational planning of flexible resources such as energy storage and demand-side response within the system.
This paper only studies the basic problems of power system operation considering the uncertainty of the source side and has not considered the uncertainty factors of the network side and load side. In the future, based on the probabilistic index of the power and energy balance risk based on conditional risk proposed in this paper, considering the relationship between the uncertainty of the source and the network and load side, considering the risk of section overload and the multiple coupling characteristics between the sending end system, the transmission channel, and the receiving end system, the full reserve capacity is reserved to meet the requirements of large-scale the cross-provincial and cross-regional power transmission of clean energy.

Author Contributions

Conceptualization, J.Q.; methodology, J.S. and J.Q.; software, Z.L.; validation, Z.L.; formal analysis, J.S.; investigation, J.S. and Y.G.; resources, Z.L. and B.L.; data curation, Y.G.; writing—original draft preparation, J.S.; writing—review and editing, J.Q. and B.L.; visualization, J.Q. and H.L.; supervision, H.L. and B.L.; funding acquisition, J.S and B.L. All authors have read and agreed to the published version of the manuscript.

Funding

The authors greatly acknowledge the financial support from the Science and Technology Project of State Grid Jiangsu Electric Power Co., Ltd. (Grant No. Research on supply and demand assessment and auxiliary decision-making technology in complex scenarios of new power systems J2023115).

Data Availability Statement

The original contributions presented in the study are included in the article; further inquiries can be directed to the corresponding author.

Conflicts of Interest

Authors Jing Shi, Zesen Li and Yi Ge were employed by the State Grid Jiangsu Electric Power Co., Ltd., Economic and Technological Research Institute. Author Boliang Liu was employed by the company State Grid Jiangsu Electric Power Co., Ltd. The remaining authors declare that the research was conducted in the absence of any commercial or financial relationships that could be construed as a potential conflict of interest. The authors declare that this study received funding from State Grid Jiangsu Electric Power Co., Ltd.

Appendix A

Figure A1. Improved IEEE118 node wiring diagram.
Energies 17 04894 g0a1
Table A1. Thermal power unit parameters.
Unit
Number
Access Nodeai/
(CNY/MW2.h)
bi/
(CNY/MWh)
ci/
(CNY/MW.h)
riup, ridown/
(MW/h)
P G i . max /
MW
P G i . min /
MW
T i o n ,   T i o f f /
h
G1100.003264110.09268002004551508
G2120.003264110.09268002004551508
G3260.002108117.36865962004551508
G4460.002108117.36865962004551508
G5490.027064133.963060100162256
G6590.027064133.963060100162256
G7610.014348112.2462480130205
G8660.0136112.88476080130205
G9800.0136112.88476080130205
G10870.048416151.36825167280203
G11890.005372188.63232648085253

References

  1. National Energy Administration The National Energy Administration Released the Statistical Data of the National Power Industry in 2023. 2024. Available online: https://www.nea.gov.cn/2024-01/26/c_1310762246.htm (accessed on 26 January 2024).
  2. Liu, C.; Huang, Y.; Shi, W.; Li, X. Production Simulation of New Energy Power System; China Electric Power Press: Beijing, China, 2019. [Google Scholar]
  3. Gill, L.; Gutierrez, A.; Weeks, T. 2021 SB 100 Joint Agency Report Achieving 100 Percent Clean Electricity in California: An Initial Assessment; California Energy Commission: Sacramento, CA, USA, 2021.
  4. Chen, G.; Dong, Y.; Liang, Z. Analysis and reflection on high-quality development of new energy with Chinese characteristics in energy transition. Proc. CSEE 2020, 40, 5493–5505. [Google Scholar]
  5. Lu, B.; Blakers, A.; Stocks, M.; Do, T.N. Low-cost, low-emission 100% renewable electricity in Southeast Asia supported by pumped hydro storage. Energy 2021, 236, 121387. [Google Scholar] [CrossRef]
  6. Wu, J.; Luh, P.B.; Chen, Y.; Bragin, M.A.; Yan, B. A novel optimization approach for sub-hourly unit commitment with large numbers of units and virtual transactions. IEEE Trans. Power Syst. 2022, 37, 3716–3725. [Google Scholar] [CrossRef]
  7. Wei, L.; Ai, X.; Fang, J.; Lou, Y.; Liao, S.; Wen, J. Chronological operation simulation for power system with peak regulation ancillary service market in China: Formulation, solving, and validation. Int. J. Electr. Power Energy Syst. 2023, 152, 109156. [Google Scholar] [CrossRef]
  8. Tan, Y. Power System Planning and Design Technology; China Electric Power Press: Beijing, China, 2012. [Google Scholar]
  9. Verástegui, F.; Lorca, A.; Olivares, D.E.; Negrete-Pincetic, M.; Gazmuri, P. An adaptive robust optimization model for power systems planning with operational uncertainty. IEEE Trans. Power Syst. 2019, 34, 4606–4616. [Google Scholar] [CrossRef]
  10. Wan, C.; Qian, W.; Zhao, C.; Song, Y.; Yang, G. Probabilistic forecasting based sizing and control of hybrid energy storage for wind power smoothing. IEEE Trans. Sustain. Energy 2021, 12, 1841–1852. [Google Scholar] [CrossRef]
  11. Da Costa, L.C.; Thomé, F.S.; Garcia, J.D.; Pereira, M.V. Reliability-constrained power system expansion planning: A stochastic risk-averse optimization approach. IEEE Trans. Power Syst. 2021, 36, 97–106. [Google Scholar] [CrossRef]
  12. Wang, J.; Shahidehpour, M.; Li, Z. Security-constrained unit commitment with volatile wind power generation. IEEE Trans-Actions Power Syst. 2008, 23, 1319–1327. [Google Scholar] [CrossRef]
  13. Wang, C.; Fu, Y. Fully parallel stochastic security-constrained unit commitment. IEEE Trans. Power Syst. 2016, 31, 3561–3571. [Google Scholar] [CrossRef]
  14. Power Planning Decision Support System Gopt; Tsinghua University: Beijing, China, 2005.
  15. GE VERNOVA. Multi Area Production Simulation Software. 2023. Available online: https://www.gevernova.com/content/dam/Energy_Consulting/global/en_US/pdfs/GEA35096B-GE-MAPS_Brochure_R3.pdf (accessed on 26 January 2024).
  16. Li, Z.M.; Wu, L.; Xu, Y. Risk-averse coordinated operation of a multi-energy microgrid considering voltage/var control and thermal flow: An adaptive stochastic approach. IEEE Trans. Smart Grid 2021, 12, 3914–3927. [Google Scholar] [CrossRef]
  17. Akbari-Dibavar, A.; Mohammadi-Ivatloo, B.; Zare, K.; Khalili, T.; Bidram, A. Economic-emission dispatch problem in power systems with carbon capture power plants. IEEE Trans. Ind. Appl. 2021, 57, 3341–3351. [Google Scholar] [CrossRef]
  18. Alshammari, M.E.; Ramli, M.A.M.; Mehedi, I.M. Hybrid chaotic maps-based artificial bee colony for solving wind energy-integrated power dispatch problem. Energies 2022, 15, 4578. [Google Scholar] [CrossRef]
  19. Akbari-Dibavar, A.; Daneshvar, M.; Mohammadi-Ivatloo, B.; Zare, K.; Anvari-Moghaddam, A. Optimal Robust Energy Management of Microgrid with Fuel Cells, Hydrogen Energy Storage Units and Responsive Loads. In Proceedings of the 2020 International Conference on Smart Energy Systems and Technologies (SEST), Istanbul, Turkey, 7–9 September 2020; pp. 1–6. [Google Scholar]
  20. Bertsimas, D.; Litvinov, E.; Sun, X.A.; Zhao, J.; Zheng, T. Adaptive robust optimization for the security constrained unit commitment problem. IEEE Trans. Power Syst. 2013, 28, 52–63. [Google Scholar] [CrossRef]
  21. Zheng, L.; Xie, D.; Bai, X. Robust optimal power flow based on Predictive & Prescriptive frame-work. Electr. Power Autom. Equip. 2023, 43, 175–181. [Google Scholar]
  22. Yang, H.; Yi, B.; Meng, K.; Yu, H.; Zhou, N.; Xu, Z. Distributed Robust Optimal Scheduling of the New Interconnected Power System with the Inter-province and Intra-province Considering Moment Uncertainty of Source Load Power. Electr. Power Constr. 2023, 44, 98–110. [Google Scholar]
  23. Wang, H.; Bie, C. Distributionally robust economic dispatch of flexible ramping reserve considering physical boundaries of uncertainty. Autom. Equip. 2023, 43, 59–68. [Google Scholar]
  24. Ye, X.; Lu, Z.; Qiao, Y. Time-varying probabilistic model and dispatch performance indices for wind farm cluster virtual power generator—Part II: Dispatch performance indices. Proc. CSEE 2015, 35, 5395–5404. [Google Scholar]
  25. Lorca, Á.; Sun, X.A. Multistage robust unit commitment with dynamic uncertainty sets and energy storage. IEEE Trans. Power Syst. 2017, 32, 1678–1688. [Google Scholar] [CrossRef]
  26. Zhao, C.; Guan, Y. Data-driven stochastic unitcommitment for integrating wind generation. IEEE Trans. Power Syst. 2016, 31, 2587–2596. [Google Scholar] [CrossRef]
  27. Yang, Y.; Wu, W. A distributionally robust optimization model for real-time power dispatch in distribution networks. IEEE Trans. Smart Grid 2018, 10, 3743–3752. [Google Scholar] [CrossRef]
  28. Zheng, X.; Chen, H.; Xu, Y.; Li, Z.; Lin, Z.; Liang, Z. A mixed-integer SDP solution to distributionally robust unit commitment with second order moment constraints. CSEE J. Power Energy Syst. 2020, 6, 374–383. [Google Scholar]
  29. Zhao, C.; Guan, Y. Data-driven risk-averse stochastic optimization with wasserstein metric. Oper. Res. Lett. 2018, 46, 262–267. [Google Scholar] [CrossRef]
Figure 1. Net load forecasting error distribution and reserve shortage probability of each hour on one day.
Energies 17 04894 g001
Figure 2. Power and energy balance risk diagram.
Energies 17 04894 g002
Figure 3. System voltage level at a given time.
Energies 17 04894 g003
Figure 4. The optimization outcomes of the uphill reserve capacity for each thermal power unit.
Energies 17 04894 g004
Figure 5. The risk assessment of power outages during load shedding in each time period.
Energies 17 04894 g005
Figure 6. The optimization outcomes of the downhill reserve capacity for each thermal power unit.
Energies 17 04894 g006
Figure 7. The conditional risk assessment of decommissioned power in each time period.
Energies 17 04894 g007
Figure 8. The operational status of each thermal power unit.
Energies 17 04894 g008
Figure 9. The active output of each thermal power unit.
Energies 17 04894 g009
Figure 10. The output and reserve configuration of the thermal power G1.
Energies 17 04894 g010
Figure 11. The output and reserve configuration of the thermal power G6.
Energies 17 04894 g011
Figure 12. The aggregate production of thermal power units and the overall allocation of the climbing reserve capacity.
Energies 17 04894 g012
Figure 13. System operating cost at different confidence levels.
Energies 17 04894 g013
Figure 14. System operating cost at different confidence levels of Wasserstein.
Energies 17 04894 g014
Figure 15. Multiple uncertainty optimization methods to adjust standby capacity curves.
Energies 17 04894 g015
Table 1. The main adjustable resources and adjustment demand sources of a high proportion of new energy systems.
InterconnectionAdjustable ResourcesAdjust the Source of Demand
Mains sideThermal power and hydropowerNew energy output prediction error
Load sideAdjustable loadNon-adjustable load
Energy storage sideShort-term and long-term energy storage/
Table 2. Optimization results of different uncertainty optimization methods.
CaseCosts of Scheduling/10,000 CNYUp Reserve Demand/MWDown Reserve Demand/MWElectricity Abandonment Probability/%Load Shedding Probability/%Expected Curtailed Electricity/MWhExpected Load Shedding/MWh
RO560.003661.483161.740.382.2545.483.16
SO555.091860.271649.259.1311.46104.8463.38
DRO559.383656.452711.230.462.8350.983.24
Disclaimer/Publisher’s Note: The statements, opinions and data contained in all publications are solely those of the individual author(s) and contributor(s) and not of MDPI and/or the editor(s). MDPI and/or the editor(s) disclaim responsibility for any injury to people or property resulting from any ideas, methods, instructions or products referred to in the content.