Article

A Novel Approach to Enhancing the Determination of Primary Indicators in Non-Idealised Absorption Chillers

by
Gábor L. Szabó
Department of Building Services and Building Engineering, Faculty of Engineering, University of Debrecen, Ótemető Str. 2-4, 4028 Debrecen, Hungary
Energies 2024, 17(19), 4858; https://doi.org/10.3390/en17194858
Submission received: 30 August 2024 / Revised: 24 September 2024 / Accepted: 25 September 2024 / Published: 27 September 2024
(This article belongs to the Section K: State-of-the-Art Energy Related Technologies)

Abstract

:
The accurate optimisation of absorption chillers is often impeded by idealised models that overlook system interactions and machine complexities. This study introduces a validated mathematical description for predicting the primary indicators of non-idealised absorption chillers, accounting for factors such as the electrical work of the Solution Circulation Pump, entropy changes within the refrigerant cycle, and exergy losses. Validation against 13 years of data (2008–2021) from the University of Debrecen’s absorption chiller indicated close agreement, with deviations within acceptable limits. The use of a solution heat exchanger shifted cooling indicators towards their minima. Sensitivity analyses indicated that a 2.5% reduction in condenser temperature increased COP by 41.3% and Cooling Exergetic Efficiency by 15.5%, while a 2.5% reduction in the Heat Fraction Factor improved both by 34%. Adjusting absorber temperature and Heat Fraction Factor down by 2.5%, alongside a 2.5% rise in generator temperature, resulted in a 100.8% increase in COP and a 52.8% boost in Cooling Exergetic Efficiency. These insights provide a solid foundation for future optimisation strategies in real-life absorption chiller systems.

1. Introduction

In recent decades, the role of cooling within the energy balance of buildings has become increasingly critical, largely due to global warming [1]. This trend varies across countries, influenced by factors such as differences in radiative heat gains [2] and specific comfort standards [3]. Meeting the European Union’s 2050 Energy Roadmap target of reducing greenhouse gas emissions by 80% compared to 1990 levels [4] has driven the demand for more environmentally friendly and energy-efficient cooling systems across industries [5], transportation, and construction [6]. Of course, the focus should not solely be on energy efficiency and environmental friendliness. In buildings with high human activity, additional viewpoints such as virus risk reduction [7] or ensuring suitable comfort and discomfort levels [8] often dominate. Considering these aspects, too, researchers are focusing on developing systems that offer high energy savings and stability from physical and engineering perspectives while having minimal environmental impact [9,10].
One potential solution for saving energy and reducing annual greenhouse gas emissions is the application of absorption machines. Absorption machines (e.g., chillers and heat pumps) can provide a promising and attractive technology for cooling and even heating functions [11], especially when low- or medium-temperature primary heat sources (for example, geothermal energy [12,13] or solar energy [14,15]) or even secondary energy sources (e.g., waste heat [16,17]) are available. These systems can mitigate the environmental impacts of CO2 emissions and may contribute to energy savings. The positive effects of absorption machines are primarily due to this [18].
These devices can be categorised based on several criteria, such as the working fluids used (e.g., LiBr-H2O, H2O-NH3), the number of compression stages, the firing method (indirect or direct), or the temperature of the produced fluid (absorption heat pump or absorption heat transformer) [19,20]. An absorption heat transformer focuses on generating a higher-temperature fluid, while absorption heat pumps concentrate on lower-temperature ones. In recent years, several researchers have examined the industrial applicability of absorption heat pumps for energy-efficient recovery and pollution reduction [21,22]. It is important to note that these machines have a lower coefficient of performance than vapour compression machines. Recent studies on vapour compression systems have reported COPs ranging from 2.5 to 4.7 for various applications. For example, Trutassanawin et al. [23] reported COPs ranging from 2.8 to 4.7 for miniature-scale refrigeration systems, whilst Konovalov et al. [24] achieved a COP value of 7 (at 6 °C coolant temperature) when optimising a low-temperature three-circuit evaporative cooling system for an electric motor using refrigerants. In contrast, absorption systems typically achieve COPs between 0.7 and 0.85; for instance, Manu and Chandrashekar [25] simulated a LiBr absorption heat pump that yielded a COP ranging from 0.7145 to 0.8421 depending on chip temperature. Additionally, Chiriac and Chiriac [26] constructed an analytical model for a water–ammonia solution, achieving a maximum COP of 0.73. Despite this efficiency gap, absorption machines offer unique advantages in certain scenarios. They can utilise low-grade heat sources, operate with environmentally friendly refrigerants, and provide quieter operation, making them particularly suitable for applications where waste heat is available or where environmental concerns are paramount. The development principles of absorption cycles have been widely discussed, e.g., by Wu et al. [27] and Yang et al. [28], with findings applicable in both residential buildings and industrial sectors. An essential development direction is the combination of these systems with other (cooling) technologies to create poly-generation systems. For instance, Toghyani et al. [29] suggested a complex system including a three-stage absorption chiller, a Rankine cycle, a solar collector, an electrolyser, and thermal energy storage for hydrogen production and cooling functions. Liu et al. [30] suggested a GECAHP (Gas Engine Compression–Absorption Heat Pump) system in low air temperatures to improve heating capacity.
Of course, there are numerous articles regarding the optimisation of these systems. For example, Lostec et al. [31] evaluated by experimentation the performance of an absorption chiller, given the changes in various parameters. They found that the performance significantly drops with a decrease in evaporator temperature, attributed to partial evaporation issues when the machine was not operating in its design or nominal state. They also concluded that rich solution flow rate, cooling temperature, and heat source temperature impact the performance. Recent studies have also focused on developing more accurate theoretical models for absorption cycles, addressing the limitations of existing models and exploring the differences between ideal and real absorption cycles [32]. Additionally, novel optimization approaches, such as the heat current method, have been proposed to maximize the cooling capacity of absorption chillers under various operating conditions [33]. The most common method is using one-objective optimisation to minimise or maximise a single parameter. For example, Chen et al. [34] maximised the COP value of an NH3–H2O absorption machine by using one-objective optimisation. Although the main results of these optimisation procedures are correct, their precision needs to increase. These studies often start from an idealised description model, focusing on the complex state properties of thermodynamic systems (e.g., cooling cycles), and either entirely or partially ignore the dynamic behaviour observed in real-life operations. For more accurate optimisation, the effects of connected systems and the external and internal irreversibilities of the absorption machine must be considered.
The operation of real-life absorption machines and their connecting systems results in internal and external irreversibilities, which can significantly reduce the performance of the systems. Various optimisation studies have attempted to overcome these irreversibilities using what is referred to as irreversible models [35,36]. For example, Bhardwaj et al. [37] found that internal irreversibilities significantly influence usable performance and differ substantially from external irreversibilities. Furthermore, Qin et al. [38] demonstrated that the heat capacity values of the components, internal irreversibilities, and external irreversibilities determine the usable performance of absorption heat pumps. Experimental results from Cardoso-Fernandez et al. [39] show that the temperatures of fluids entering and exiting connected systems can significantly affect the Generator–Absorber exchange process. Fumagalli et al. [40] analysed the operation of the Generator–Absorber–Heat Exchanger and showed that the system’s performance depends not only on its performance but also on the integration of the machine into the overall power generation system. Browne and Bansal [41] concluded that ignoring the dynamic behaviour frequently observed in real-life operations is unacceptable and inaccurate from a certainty perspective. Therefore, studies on absorption systems should consider, in addition to optimisation, the extent to which the system’s usable performance and which components’ optimisation can produce the most significant improvement [19].
To optimise absorption machines effectively, it is vital to transcend idealised models and incorporate real-life factors that significantly influence primary performance indicators. This study seeks to refine existing models by addressing key aspects often overlooked in simplified descriptions, including the following:
  • The electrical work of the Solution Circulation Pump;
  • Entropy loss due to the Expansion Valves before the Evaporator and Absorber;
  • Entropy changes resulting from superheating after the Evaporator and subcooling after the Condenser;
  • Heat exchange between the machine components and the environment;
  • Exergy losses associated with heat losses;
  • Exergy destruction within the machine;
  • The effects of the Solution Heat Exchanger.
Building on my previous research [42,43,44,45], this study introduces a refined approach for more accurate determination of primary indicators in non-idealised absorption chillers, validated using empirical data from a real-life absorption chiller. The contributions of this study include the development of novelty equations for primary indicators and a deeper understanding of system component interactions, providing a solid foundation for both quantitative and qualitative optimisation strategies in real-life absorption chiller systems.

2. Material and Methods

Firstly, compare the schemas of the idealised (Figure 1a) and non-idealised (Figure 1b) absorption chillers, focusing on the energy flows and the operating temperatures.
The operation of the system, as illustrated in Figure 1b, is as follows (the values provided in parentheses enhance clarity and are derived from the data in Table 1): In the Evaporator (T0 = 7.3 °C), the refrigerant extracts heat from the Chilled Water (from Tc,1 = 14.0 °C to Tc,2 = 8.0 °C), causing it to fully evaporate and become superheated. The superheated refrigerant enters the Absorber (TA = 27.0 °C), where it is absorbed by the Weak Solution, forming the Strong Solution. The heat released during absorption is removed by the Cooling Water (from Th,1 = 29.8 °C to Th,3 = 28.0 °C). The Strong Solution is pumped through a Solution Heat Exchanger (SHX) to the Generator by the Solution Circulation Pump. There, the Strong Solution is preheated by the Weak Solution returning from the Generator. In the Generator (TG = 68.4 °C), heat (from Tg,1 = 85.0 °C to Tg,2 = 70.0 °C) is applied, causing the refrigerant to separate from the solution, leaving behind a Weak Solution. The Weak Solution flows back to the Absorber via the SHX and an Expansion Valve. The refrigerant, now gaseous, moves from the Generator to the Condenser (TC = 34.0 °C), where it releases heat to the Chilled Water (from Th,3 = 28.0 °C to Th,2 = 26.0 °C) from the Absorber, causing it to condense and subcool. Finally, the refrigerant flows back to the Evaporator through an Expansion Valve, completing the cycle.
Applying Figure 1b, the energy flow (Equation (1)), entropy (Equation (2)), and exergy (Equation (3)) balancing equations can be given for the absorption machines.
Q ˙ 0 + Q ˙ G + P P u m p = Q ˙ A + Q ˙ C + Q ˙ e n v ; [ W ]
Q ˙ 0 T 0 + Q ˙ G T G = Q ˙ A T A + Q ˙ C T C + S R ; W K
E x G + P P u m p = E x 0 + E x A + E x C + E x e n v ; [ W ]
where ‘ Q ˙ 0 ’ is the cooling capacity; ‘ Q ˙ G ’ is the heat consumed in the Generator; ‘PPump’ is the electric power consumed by the Solution Circulation Pump; ‘ Q ˙ A ’ is the heat released in the Absorber; ‘ Q ˙ C ’ is the heat released in the Condenser; and ‘ Q ˙ env ’ is the heat exchange between parts of the machine and the environment (which can take both positive and negative values; it is considered positive when heat flows from the machine to the environment), all in watts (‘W’). ‘Ex0’ is the exergy content of ‘ Q ˙ 0 ’; ‘ExA’ is the exergy content of ‘ Q ˙ A ’; ‘ExC’ is the exergy content of ‘ Q ˙ C ’; ‘ExG’ is the exergy content of ‘ Q ˙ G ’; and ‘Exenv’ is the difference in the exergy content, all in watts (‘W’). ‘T0’ is the evaporation temperature; ‘TA’ is the absorption temperature; ‘TC’ is the condensation temperature; and ‘TG’ is the generator temperature, all in kelvins (‘K’). ‘SR’ is the generated entropy within the refrigerant cycle in watts per kelvin (‘W∙K−1’).
The role of the Solution Heat Exchanger is considered essential to highlight here. The impact of the Solution Heat Exchanger is reflected indirectly in the balance equations; it can be observed in the values of the individual energy flows. The primary goal of employing the Solution Heat Exchanger is ensuring that the weak solution entering the Absorber is as cold as possible while the strong solution entering the Generator is as warm as possible. Achieving this goal leads to using much of the heat released in the Absorber within the machine itself rather than requiring its removal. In a non-idealised machine, the value of Q ˙ A is expected to be lower than that predicted by models of idealised machines.
The qualitative and quantitative indicators of absorption chillers were derived by using balancing equations. In this article, these indicators (Coefficient of Performance, Thermo-Chemical Efficiency, Exergetic Efficiency, and Exergetic Thermo-Chemical Efficiency) are called primary indicators of absorption machines.
The definition of the cooling and heating Coefficient of Performance is the ratio of the usable cooling and heating energy flow to the introduced energy flow. Its determination is as follows [44,46,47]:
C O P C = Q ˙ 0 Q ˙ G + P P u m p ;  
C O P H = Q ˙ A + Q ˙ C Q ˙ G + P P u m p ;  
The cooling and heating Exergetic Efficiency is the ratio of the exergy content of the cooling and heating energy flow to the exergy content of the introduced energy flow [44,46,47]:
η e x , C = E x 0 E x G + P P u m p · 100 ; %
η e x , H = E x A + E x C E x G + P P u m p · 100 ; %
After that, two less often applied primary indicators, which represent the ratio of the former primary indicators to their possible maximum, are provided.
The cooling Thermo-Chemical Efficiency compares the cooling Coefficient of Performance to its maximum [44,46,47]:
η A , C = C O P C C O P C C · 100 100 ; %
where ‘COPCC’ represents the maximum achievable value of the Coefficient of Performance, as determined by the reverse Carnot cycle.
The cooling Exergetic Thermo-Chemical Efficiency compares the Exergetic Efficiency to its maximum [44]:
η A , e x , C = η e x , C η e x , m a x , C · 100 100 ; %
where ‘ηex,max,C’ represents the maximum achievable value of the Cooling Exergetic Efficiency, determined when ‘COPC’ equals ‘COPCC’, in %.
From the viewpoint of the primary indicators, there is no difference between the idealised and the non-idealised absorption chiller. The differences can only be observed if the primary indicators are written down using the secondary indicators. In my previous research [42,43,45,48], these secondary indicators provided deeper information to understand the attributes of the absorption machine. These secondary indicators (Thermo-Chemical Performance Index [42,48], Coefficient Of Compensation For Entropy-Surplus [45], and Thermo-Chemical Instability Index [43]) can be adapted to the non-idealised absorption chiller.
The Thermo-Chemical Performance Index is the ratio of energy flows extracted from and supplied to the Thermo-Chemical Compressor. This secondary indicator characterizes the energy relations of the Thermo-Chemical Compressor [42]:
0 β = Q ˙ A Q ˙ G + P P u m p ; [ ]
Since the heat flow released in the Absorber cannot be negative (not heating the Absorber), this ratio will not be less than zero. This index appears to be an essential indicator of the efficiency of the Solution Heat Exchanger. Because the Solution Heat Exchanger is more energetically efficient, the Thermo-Chemical Performance Index will be lower. Although the maximum value of this index can be used for the idealised absorption chiller, for the real-life absorption chiller, it can cause more issues than it can resolve.
The Coefficient Of Compensation For Entropy-Surplus is, by definition, the ratio of the generated entropy within the refrigerant cycle and the introduced energy flow [45]:
δ A = S R Q ˙ G + P P u m p ; 1 K
The Thermo-Chemical Instability Index characterizes the exposure of primary indicators to fluctuations in heat sources, as determined by the following equation [43]:
0 μ = J m a x J m i n J m a x 1 ;
where ‘Jmax’ is the maximum value of the examined primary indicator; and ‘Jmin’ is the value of the examined primary indicator when β = 0.
In the following, the equations of the two most essential primary indicators are provided, along with the previously mentioned secondary indicators, starting from the three balance equations (Equations (1)–(3)):
C O P C = T 0 T A · T C T A T C T 0 · β + 1 + T C · δ A Q ˙ e n v Q ˙ G + P P u m p Q ˙ G Q ˙ G + P P u m p · T C T G · T 0 T C T 0 ;
η e x , C = T G T A · T C T A T C T 0 · T X T 0 T G Q ˙ G Q ˙ G + P P u m p · T X · β · 100 + 1 + T C · δ A Q ˙ e n v Q ˙ G + P P u m p Q ˙ G Q ˙ G + P P u m p · T C T G · T G T C T 0 · T X T 0 T G Q ˙ G Q ˙ G + P P u m p · T X · 100 ; %
where ‘TX’ is the reference temperature, in kelvins (‘K’).
Since these shapes of the equations did not approach the transparent forms of the idealised absorption chiller [44], further investigation was needed.

3. Results

3.1. New Secondary Indicators

After the theoretical overview, it seemed necessary to introduce three new secondary indicators to facilitate the description of real-life machines. Firstly, the Quality Loss Index (‘σA’) as a secondary indicator is introduced:
0 σ A = E x e n v Q ˙ G + P P u m p ;
Since exergy can be non-negative, this value will be greater than zero.
Introducing, in addition, the Heat Fraction Factor (‘γ’), which gives the part of the heat in the introduced energy flow:
0 γ = Q ˙ G Q ˙ G + P P u m p 1 ;
Since Q ˙ G and PPump can be non-negative, this indicator can vary between 0 and 1.
The third new secondary indicator, the Extreme Values Proximity Index (‘λC’), can describe how closely the respective indicator can approach its possible maximum and minimum value:
0 λ C = J J m i n J m a x J m i n 1 ;
If λC = 0.5, then the indicator is the arithmetic mean of the minimum and maximum values. The investigated indicator is closer to the minimum value when 0.5 > λC > 0 while it is closer to the maximum when 0.5 < λC < 1.
Henceforth, β, δA, σA, and γ (i.e., where dividing by the introduced energy flow) are called ‘simple secondary indicators’, while μC and λC are called ‘complex secondary indicators’.
If the primary indicators are described using the operating temperature and the secondary indicators, the following equations arise:
C O P C = T 0 T C T 0 · T C T A T A · β + 1 σ A + T C T X · δ A T C T G · γ ;
η e x , C = T G T C T 0 · T X T 0 T G γ · T X · T C T A T A · β + 1 σ A + T C T X · δ A T C T G · γ · 100 ; %
η A , C = η A , e x , C = T G T G T A · 1 γ   · T C T A T A · β + 1 σ A + T C T X · δ A T C T G · γ   · 100 ; %
To provide a comprehensive description of the complex secondary indicators, it is essential to specify the maximum values of the primary indicators as well. The reverse Carnot cycle, which represents the most efficient refrigerant cycle, determines the maximum values of the Coefficient of Performance and Exergetic Efficiency. It is crucial to emphasise that for real-life machines, the value of PPump cannot be assumed to be zero. Consequently, the maximum values of the primary indicators can be expressed as follows:
C O P C C = T 0 T G · T G T A T C T 0 · γ ;
η e x , m a x , C = T G T A T C T 0 · T X T 0 T G γ · T X · γ · 100 ; %

3.2. Connection Using the Balance Equations

The connection between the values considered as loss ( Q ˙ env , SR, and Exenv) can be determined by applying the three balance equations of the real-life machine (Equations (1)–(3)).
Q ˙ e n v Q ˙ G + P P u m p = T X · S R Q ˙ G + P P u m p + E x e n v Q ˙ G + P P u m p = T X · δ A + σ A ;
If the heat flow balance equations (Equation (1)) are divided by the introduced energy flows, the connection between the cooling and heating Coefficient of Performance is obtained:
C O P H C O P C = 1 Q ˙ e n v Q ˙ G + P P u m p = 1 T X · δ A σ A ;
In an idealised absorption chiller, the difference between the heating and cooling Coefficient of Performance is exactly one.
Furthermore, the connection between the heating and cooling Exergetic Efficiency can be obtained if the exergy balancing equation is divided by the exergy contents of the introduced energy flows:
η e x , C + η e x , H = 100 E x e n v E x G + P P u m p · 100 = 100 σ A · T G T G γ · T X · 100 ; %
In idealised machines, the sum of the heating and cooling Exergetic Efficiency is exactly 100%.

3.3. A Novelty Description of the Primary Indicators

Because of the effect of the Solution Heat Exchanger (contrary to my previous research), the value of primary indicators should not be based on their maximum value. When the Solution Heat Exchanger operates in a theoretically perfect manner, the heat released in the Absorber ( Q ˙ A ) does not need to be removed by the Cooling Water. In this idealised scenario, the Solution Heat Exchanger effectiveness ensures that Q ˙ A is exactly zero, and consequently, the Thermo-Chemical Performance Index is also zero. Consider this case as the minimum value of the primary indicators occurring theoretically during the actual operation of the absorption machine (their absolute minimum value is, of course, zero, but then the machine’s operation is stopped):
C O P m i n , C = T 0 T C T 0 · 1 σ A + T C T X · δ A T C T G · γ ;
η e x , m i n , C = T G T C T 0 · T X T 0 T G γ · T X · 1 σ A + T C T X · δ A T C T G · γ · 100 ; %
η A , m i n , C = η A , e x , m i n , C = T G T G T A · 1 γ · 1 σ A + T C T X · δ A T C T G · γ · 100 ; %
As observed, the values of Thermo-Chemical Efficiency and Exergetic Thermo-Chemical Efficiency coincide.
The application of the Solution Heat Exchanger, therefore, brings the primary indicators closer to their minimum values. Therefore, when formulating the primary indicators, it is advisable to utilise the complex secondary indicators, which characterise the relationship between the maximum and minimum values. As an initial step, let us express the complex secondary indicators in terms of the operating temperature and the simple secondary indicators. To achieve this, we shall employ the relationships established in Equations (21) and (22) and Equations (26)–(28). Firstly, the Extreme Values Proximity Index is:
λ C = C O P C C O P m i n , C C O P C C C O P m i n , C = η e x , C η e x , m i n , C η e x , m a x , C η e x , m i n , C = η A , C η A , m i n , C 100 η A , m i n , C = η A , e x , C η A , e x , m i n , C 100 η A , e x , m i n , C
λ C = T C T A T A · T G T A + T C T G · γ 1 + σ A T C T X · δ A · β ;
Secondary, the Thermo-Chemical Instability Index of the primary indicators in real-life machines by the extreme values:
μ C = C O P C C C O P m i n , C C O P C C = η e x , m a x , C η e x , m i n , C η e x , m a x , C = 1 η A , m i n , C 1 = 1 η A , e x , m i n , C 1 ;
μ C = T G T A · T C T A T G T A · β γ · λ C ;
Using the presented equations, the primary indicators of real-life absorption machines can be expressed with their extreme values and the (complex) secondary indicators as follows:
C O P C = C O P m i n , C · 1 + μ C 1 μ C · λ C ;
η e x , C = η e x , m i n , C · 1 + μ C 1 μ C · λ C ; %
η A , C = η A , e x , C = η A , e x , m i n , C + μ C · λ C · 100 = η A , m i n , C + μ C · λ C · 100 ; %
Thus, it is possible to express the primary indicators with their minimum values, requiring only the application of the two complex secondary indicators. Interestingly, the ratio of the two most important primary indicators to their minimum values is identical. This relationship is not immediately apparent from either Equations (13) and (14) or Equations (18)–(22).

4. Validation

The measured data from a real-life machine were used to validate the results. This absorption chiller is located at the Medical Centre of the University of Debrecen. This machine is inspected for maintenance twice yearly (at the beginning and end of the cooling season). The measurements are conducted by Johnson Controls. Primarily, the measurements focus on examining the operational ability of the machine, thus providing data on the temperatures of the cooling water, chilled water, and warm water for the entire operational period (8 April 2008–24 May 2022). During the inspection, there is an opportunity to measure the internal temperatures as well, at an auditor’s decision. Unfortunately, this was not consistently performed in each case, resulting in only 14 usable datasets out of the available 29 for validation. These 14 values are evenly distributed over the operational period (see later in Table 2).
The data of the examined machine (York YIA-HW-6C4-50) in its design state are summarized in Table 1. The connected secondary systems of this absorption chiller operate with constant volume flow rate pumps.
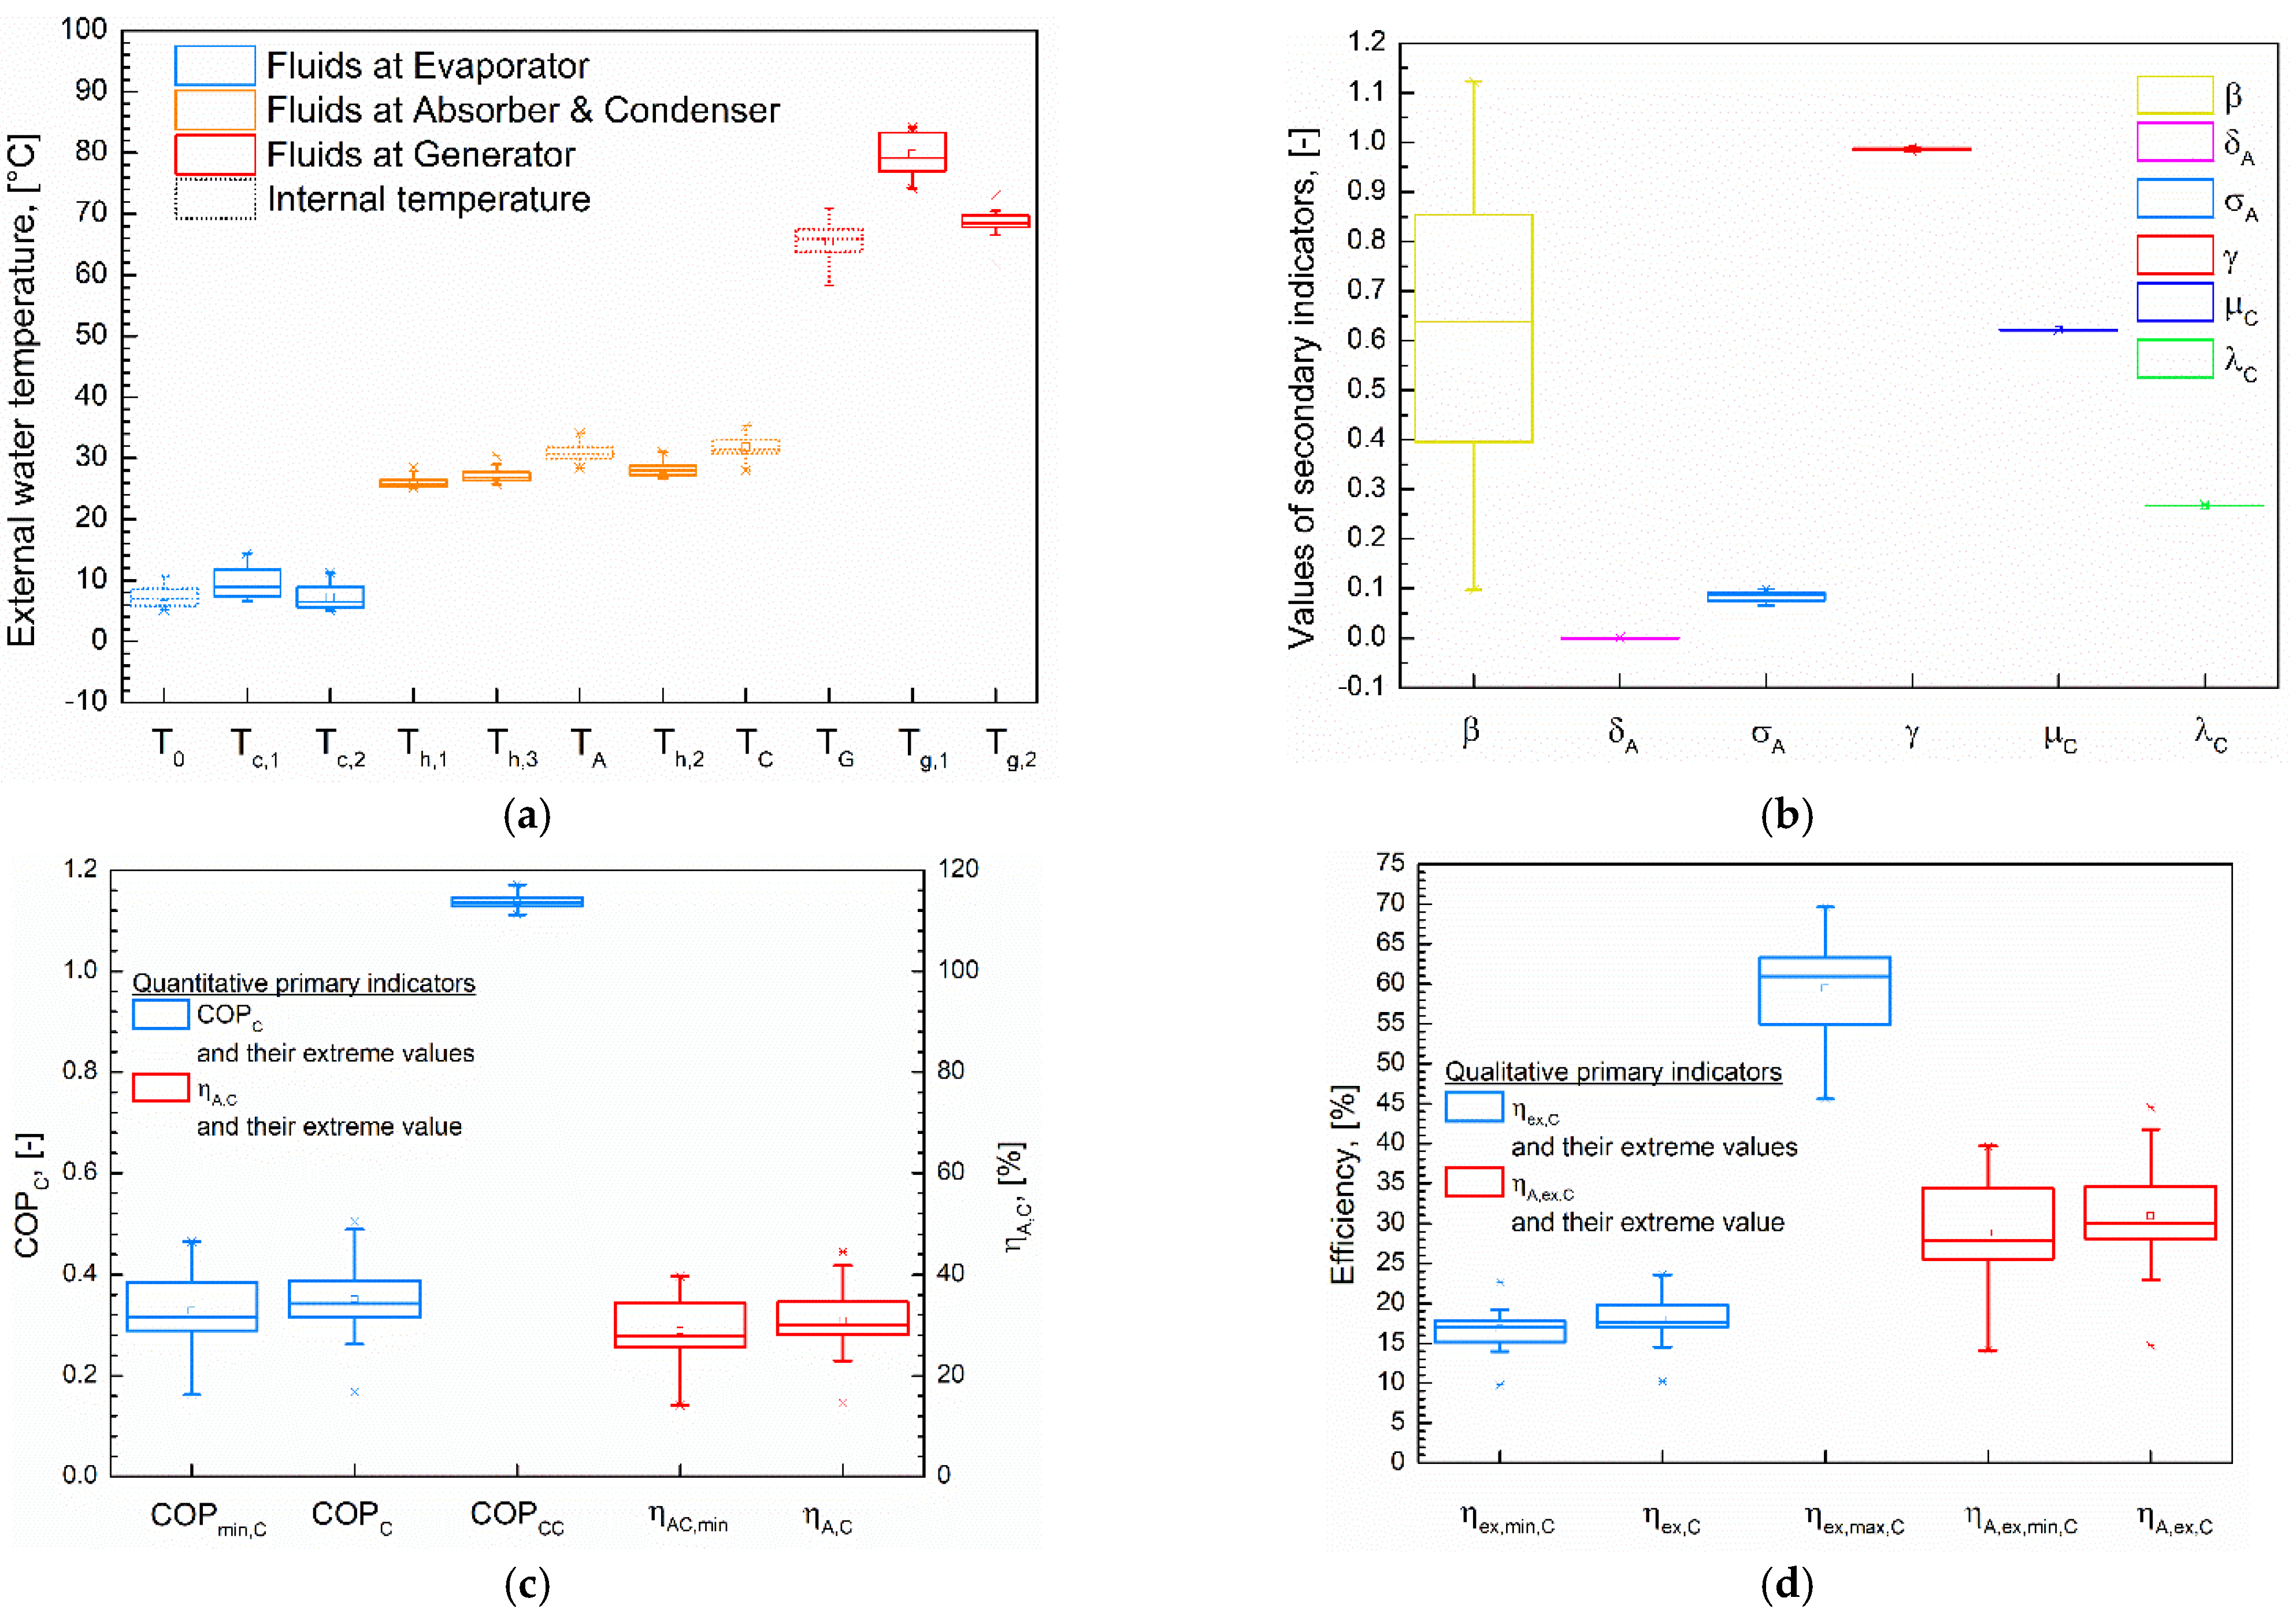
The measured values are shown in Figure 2.
In Figure 2a, the average standard deviation is 1.85. The temperatures of the generator heating system (Tg,1 and Tg,2) exhibit higher standard deviations (exceeding 3), whilst the cooling water system (Th,1, Th,3, Th,2) shows significantly lower values (below 1.18). However, the latter demonstrates high positive skewness (>+1), whereas Tg,1 has a skewness of 0.0. Regarding the secondary indicators (Figure 2b), the notable standard deviation of β (0.289, compared to the mean of 0.06) and the skewness of λC (+1.41) are particularly noteworthy. For the primary indicators and their extreme values (Figure 2c,d), the average standard deviation is 1.3. This arises from most values being below 1, whilst the (cooling) exergetic efficiency and its extreme values show considerably high standard deviations (exceeding 3). A further point of interest is the substantial skewness in the values of COPCC and ηex,max,C (+0.61 and −0.66, respectively).
In Table 2, the difference between the COPC and ηex,C values determined from the measured values (Figure 2c,d) and those determined based on the novelty mathematical description (Equations (18), (19), (31) and (32)) are presented.
Based on this table, it can be observed that the model closely follows the measurement results.
The values for the secondary indicators at the designed and operational states are compared in the following. The designed state values are not significantly deviant, excluding the Extreme Values Proximity Index value. This deviant is shown in Figure 3.
From Figure 3, the λC value is consistently lower than the design state value in all cases. Therefore, the λC value should be advisably maximised in the design state, as it will likely decrease during operation.

5. Discussion

5.1. Correlation and Significance Analysis

Based on the measured results, a correlation and significance analysis were conducted on the connection between the primary indicators and the other factors in the equations. The factors were categorised into three groups for analysis. First, the measured temperatures (Table 3), followed by the extreme values of the primary indicators (Table 4), and finally, the secondary indicators (Table 5) were investigated.
The values at COPC, ηA,C, and ηA,ex,C are similar, while values at ηex,C are significantly different. It can be concluded that the ηex,C is less dependent on temperature than the other primary indicator. Furthermore, it can also be observed that each primary indicator depends most on the absorption temperature and, to a similar but lesser extent, on the evaporation temperature.
Table 4. Correlation and significance analysis of cooling primary indicators with their extreme values.
Pearson CorrelationSignificance
COPCηex,CηA,C; ηA,ex,CCOPCηex,CηA,C; ηA,ex,C
COPmin,C0.983730.902620.982480.000000.000010.00000
COPCC0.201530.092700.144400.489640.752610.62235
ηex,min,C0.811410.976550.813590.000430.000000.00040
ηex,max,C−0.78042−0.41638−0.783650.000990.138620.00091
ηA,min,C; ηA,ex,min,C0.980910.903170.983270.000000.000010.00000
According to Table 4 (also Figure 2, naturally), the primary indicators depend most on their minimum values. Surprisingly, the value of COPC depends little on its maximum value, which is determined by the reverse Carnot cycle (future research can examine the cause of this).
Table 5. Correlation and significance analysis of secondary indicators with cooling primary indicators.
Secondary IndicatorsPearson CorrelationSignificance
COPCηex,CηA,C; ηA,ex,CCOPCηex,CηA,C; ηA,ex,C
Simpleβ0.837360.758260.831550.000190.001670.00023
δA−0.55504−0.48865−0.542580.039370.076220.04499
σA−0.91356−0.75318−0.901440.000000.001870.00001
γ−0.30883−0.49928−0.313180.282660.069120.27559
ComplexμC−0.98091−0.90318−0.983270.000000.000010.00000
λC0.585020.326800.582500.027980.254100.02883
Based on Table 5, among the simple secondary indicators, σA (followed by β) relates most closely to primary indicators. This connection is not evident for γ and δA. Of the complex secondary indicators, rather μC shows a closer connection with the primary indicators.

5.2. Sensitivity Analysis

The values of the cooling primary indicators are closer to their minimum values when a solution heat exchanger is utilised. This hypothesis is supported by Figure 2c,d and Table 4 as well. Therefore, it is beneficial to examine what influences the minimum values of the primary indicators and determine their sensitivity. These details could be relevant for later optimisation processes in determining intervention points. Furthermore, it is also important to examine whether the primary indicators are as sensitive to changes in a parameter as the extreme values of the same primary indicators. For this analysis, a form of the primary indicators and their minimum values, which are defined by operating temperatures and simple secondary indicators (β, σA, δA, and γ), was used. (i.e., Equations (18)–(20) and Equations (26)–(28), respectively)
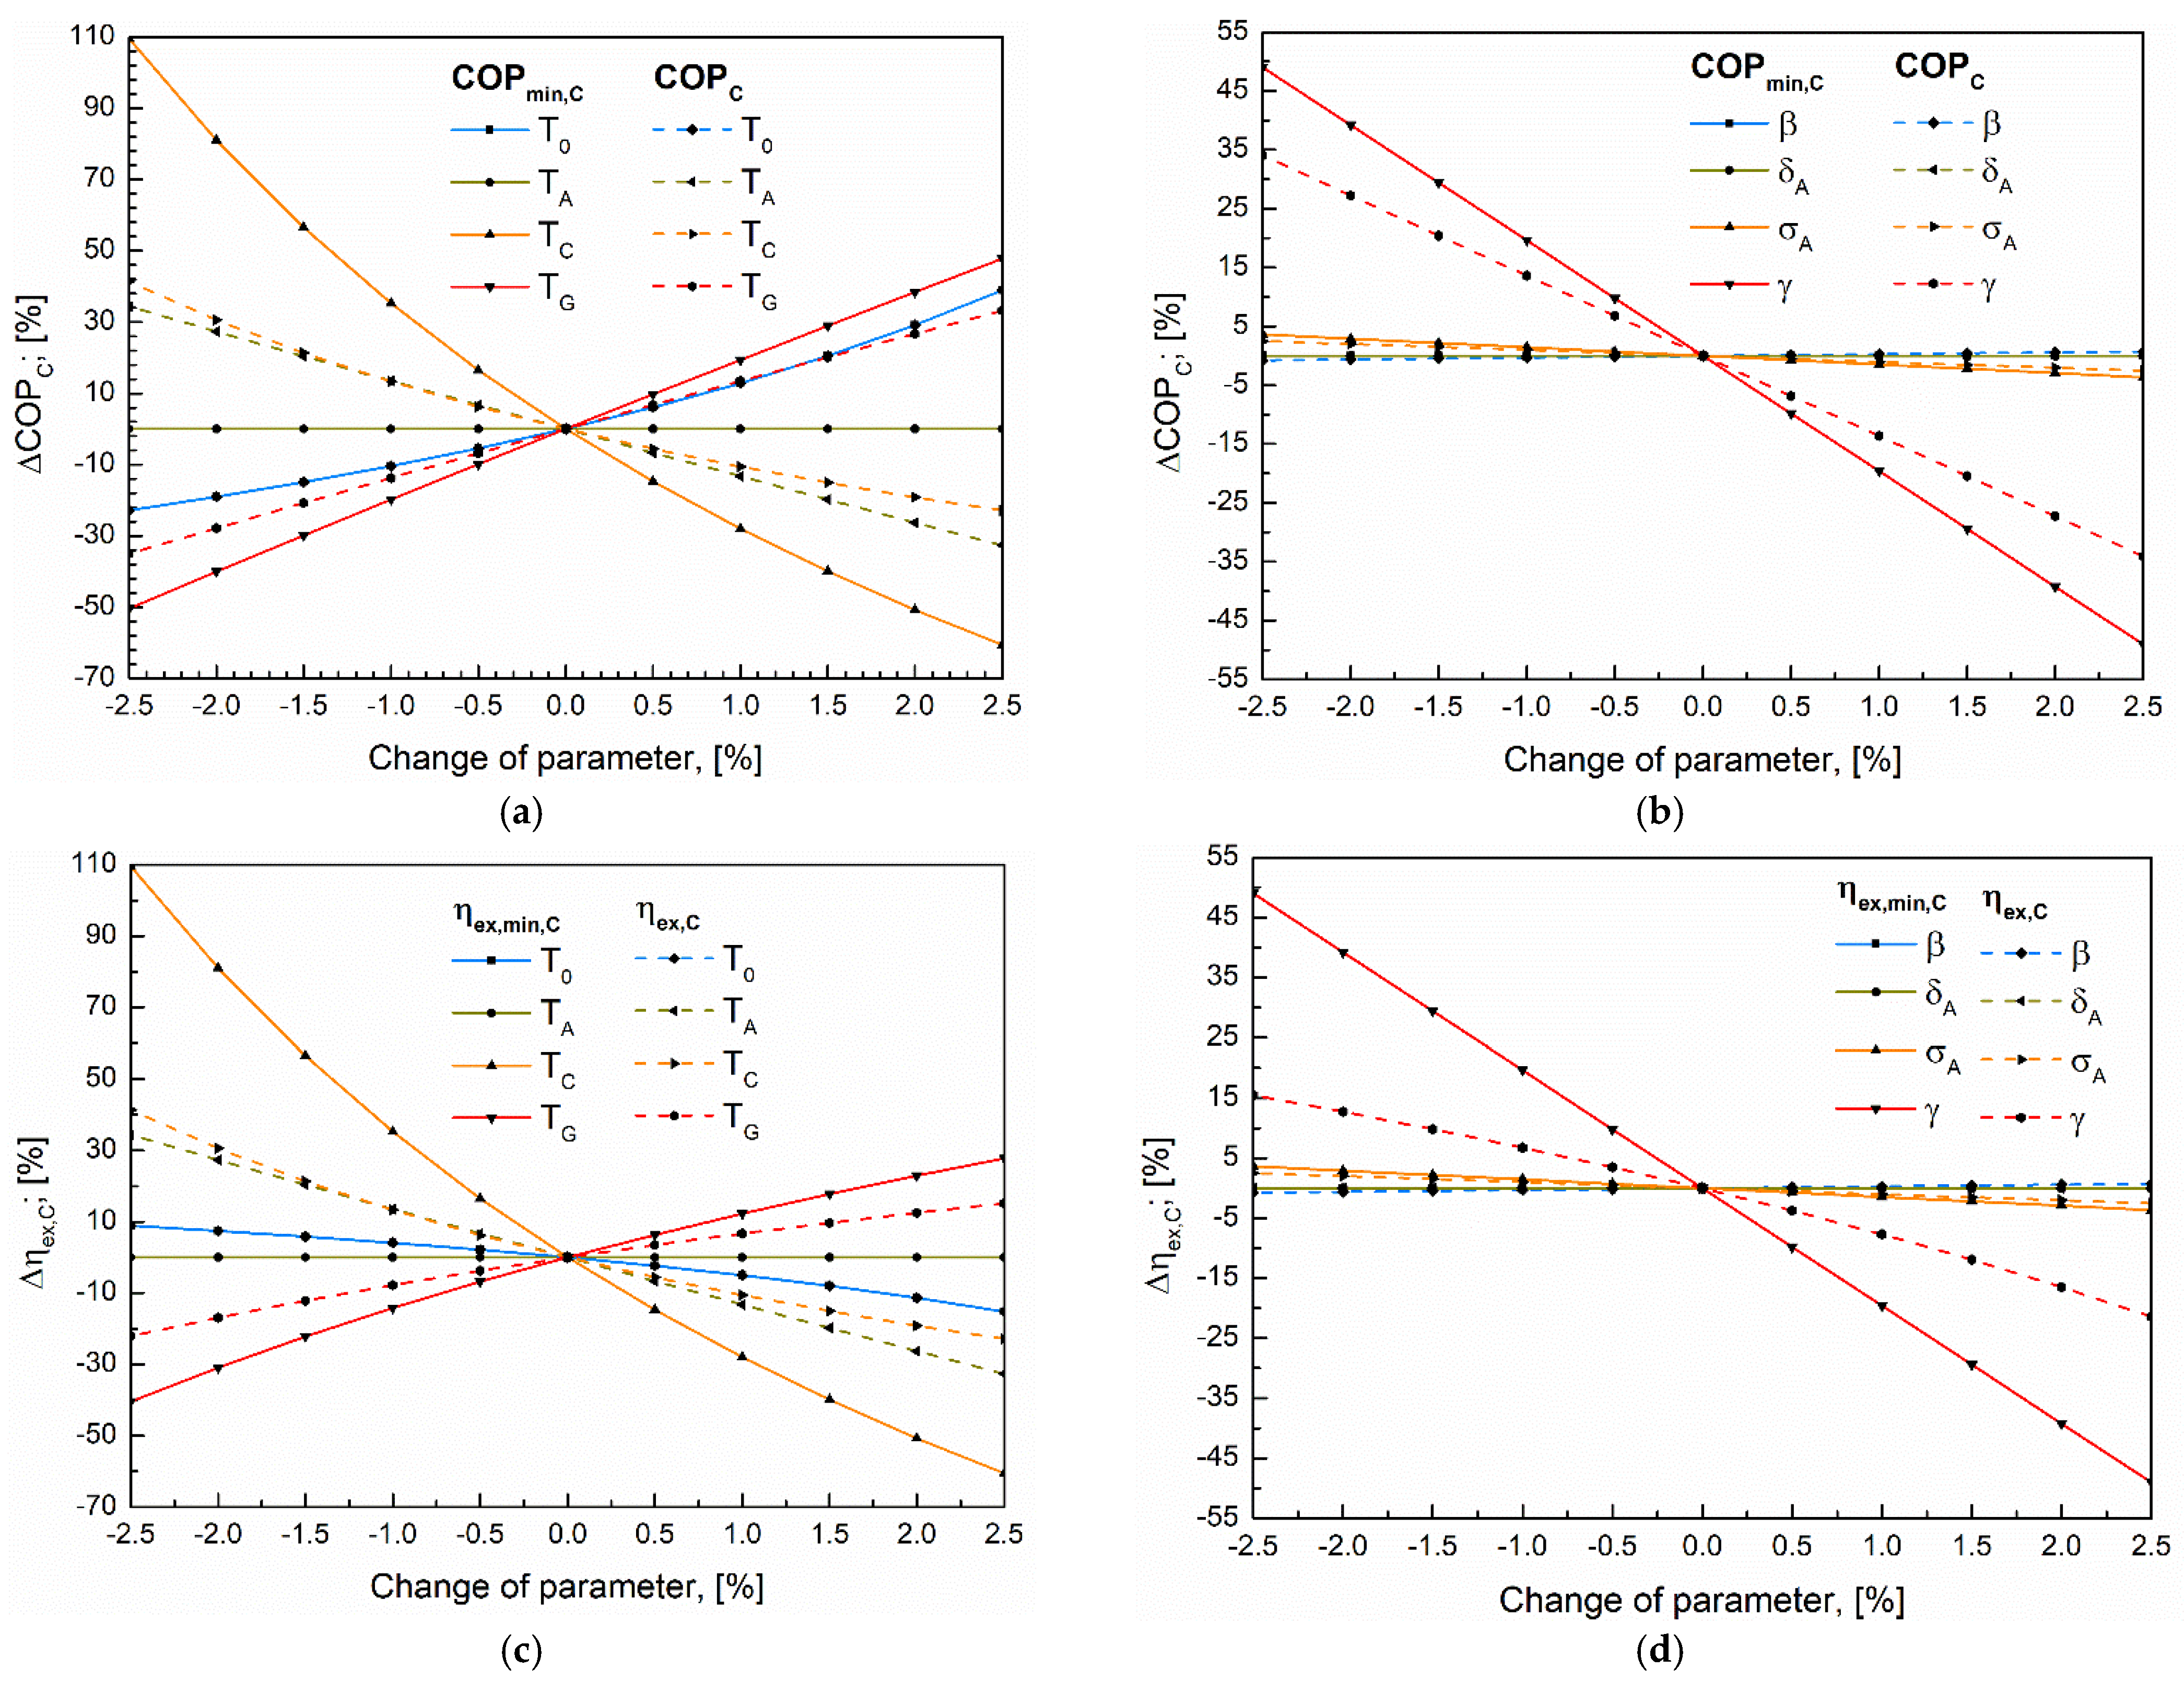
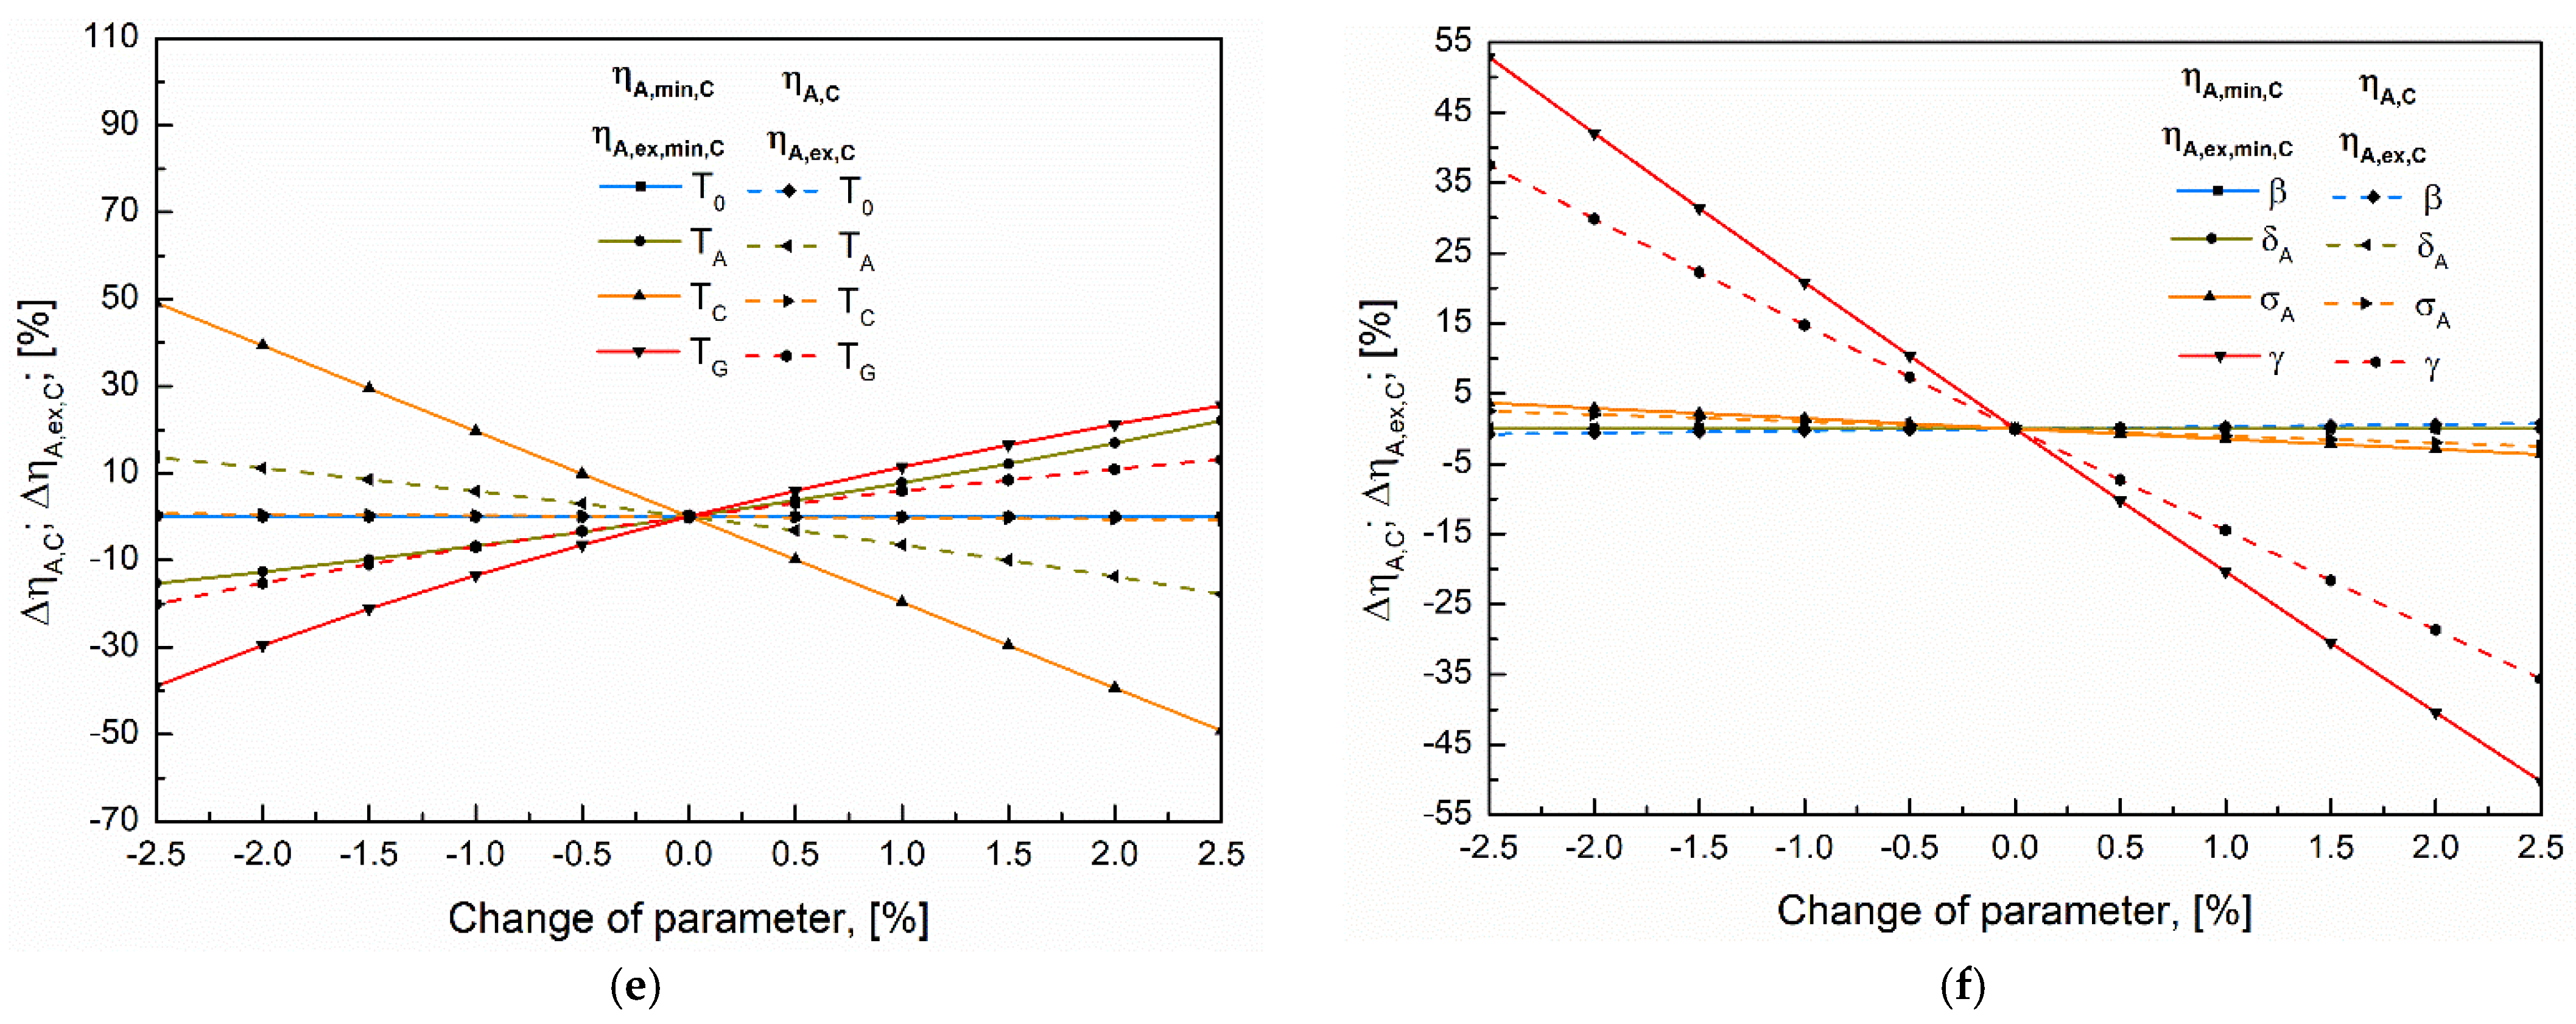
The results of the sensitivity analysis are shown in Figure 4.
Figure 4 shows a complete insensitivity firstly between ηA,C, ηA,ex,C, ηA,min,C, and ηA,ex,min,C and the evaporation temperature change; secondary between COPmin,C and ηex,min,C and the absorption temperature change; and finally between the minimum values of the primary indicators (ηA,min,C, ηA,ex,min,C, COPmin,C, ηex,min,C) and changes in the Thermo-Chemical Performance Index. Low sensitivity is observed between all examined parameters and changes in the Coefficient of Compensation for Entropy-Surplus, as well as between the primary indicators and changes in the Thermo-Chemical Performance Index. The primary indicators exhibit the same sensitivity to changes in evaporating temperature, as do each of their minimum values. The sensitivity of COPC and ηex,C is the same for changes in the absorption temperature as well as changes in the condensation temperature. The same is found between COPmin,C and ηex,min,C.
Further observations can be made by carefully examining Figure 4. It is noted that TA, TC, TG, and γ have the most significant impact on the values of COPC and ηex,C. Additionally, changes in absorption temperature have a similar but contrasting impact on the values of ηA,C and ηA,min,C. Conversely, changes in the condensation temperature have minimal impact on the values of ηA,C and ηA,ex,C.

5.3. Analysis of the Convergence of Primary Indicators to Their Maximum Using the Extreme Values Proximity Index

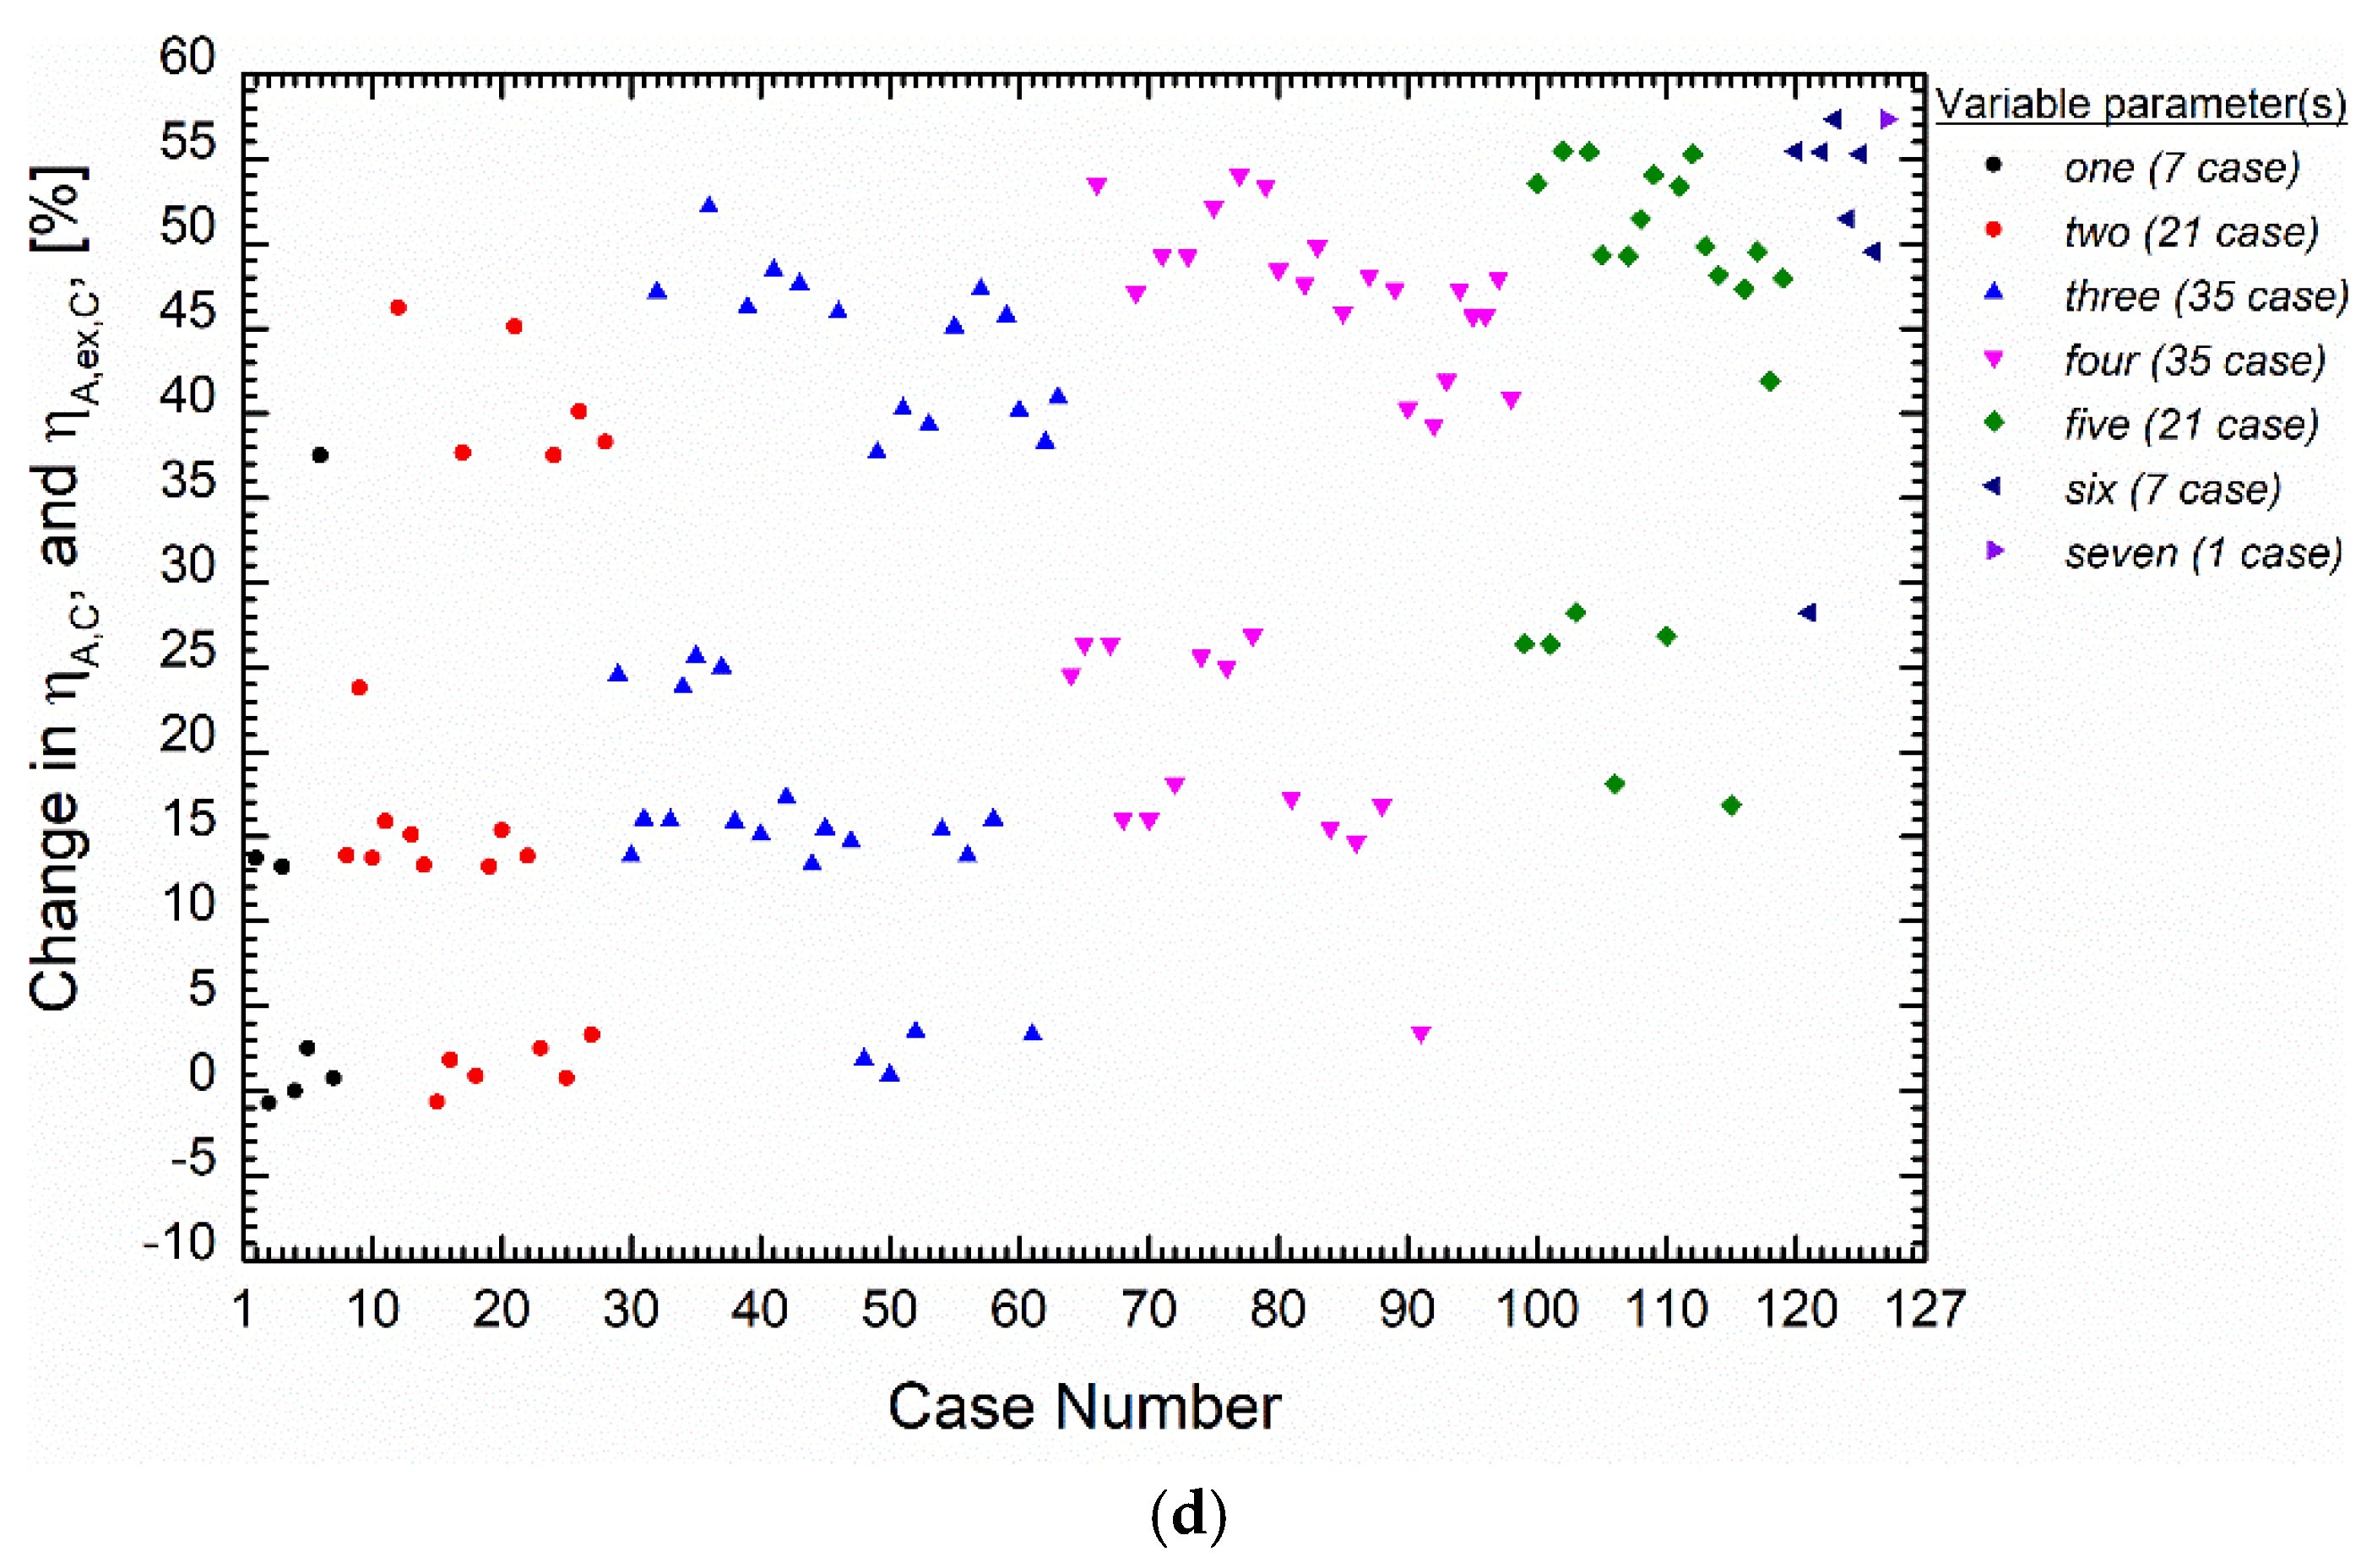
Based on Equation (29b), this complex secondary indicator depends on three operating temperatures (TA, TC, and TG) and four simple secondary indicators (β, σA, δA, and γ), i.e., seven possible parameters can be varied. The convergence of λC = 1 (i.e., the primary indicators reach their maximum value) by adjusting the values of the reference system (Table 1, λC = 0.2674) by at most 2.5% (similar to the sensitivity analysis) was investigated, considering the extreme values of the secondary indicators. A total of one hundred twenty-seven different cases can be constructed by changing the seven possible parameters. The achievable λC values in each case are shown in Figure 5a. Changing λC with the possible parameters naturally affects the primary indicators. These effects can be shown in Figure 5b–d.
The λC = 1 can be reached by changing at most 2.5%, based on Figure 5a. It is closest to this value if the varying parameters include TA, TC, and γ. Analysing Figure 5b–d, groups can be formed among the results based on all three diagrams, although the group boundaries are not perfectly clear and may overlap in some cases. It is evident that the cases involving changes in TA, TG, and γ, while keeping TC constant, consistently produce the best results. These cases (with the number of variables in parameters) are: Case 36 (3); 75 (4); 77 (4); 79 (4); 109 (5); 111 (5); 112 (5); and 125 (6).
Contrary to the λC convergence, the highest increase in the value of the primary indicators can be obtained with varying TA, TG, and γ if the TC remains unchanged. If only the values of TA, TG, and γ are changed by at most 2.5% (this is Case 36), it increases by 100.8% in COPC, by 52.84% in ηex,C, and by 52.14% in ηA,C and ηA,ex,C. Another interesting result is that changing the TC value to increase λC leads to a decrease in the primary indicators or causes a reduction in the increase caused by TA, TG, and γ. Based on these findings, simultaneous decreasing of TA and γ and increasing of TG are recommended for optimal performance improvement.

5.4. The Qualitative and Quantitative Nature of Indicators and Their Included Parameters
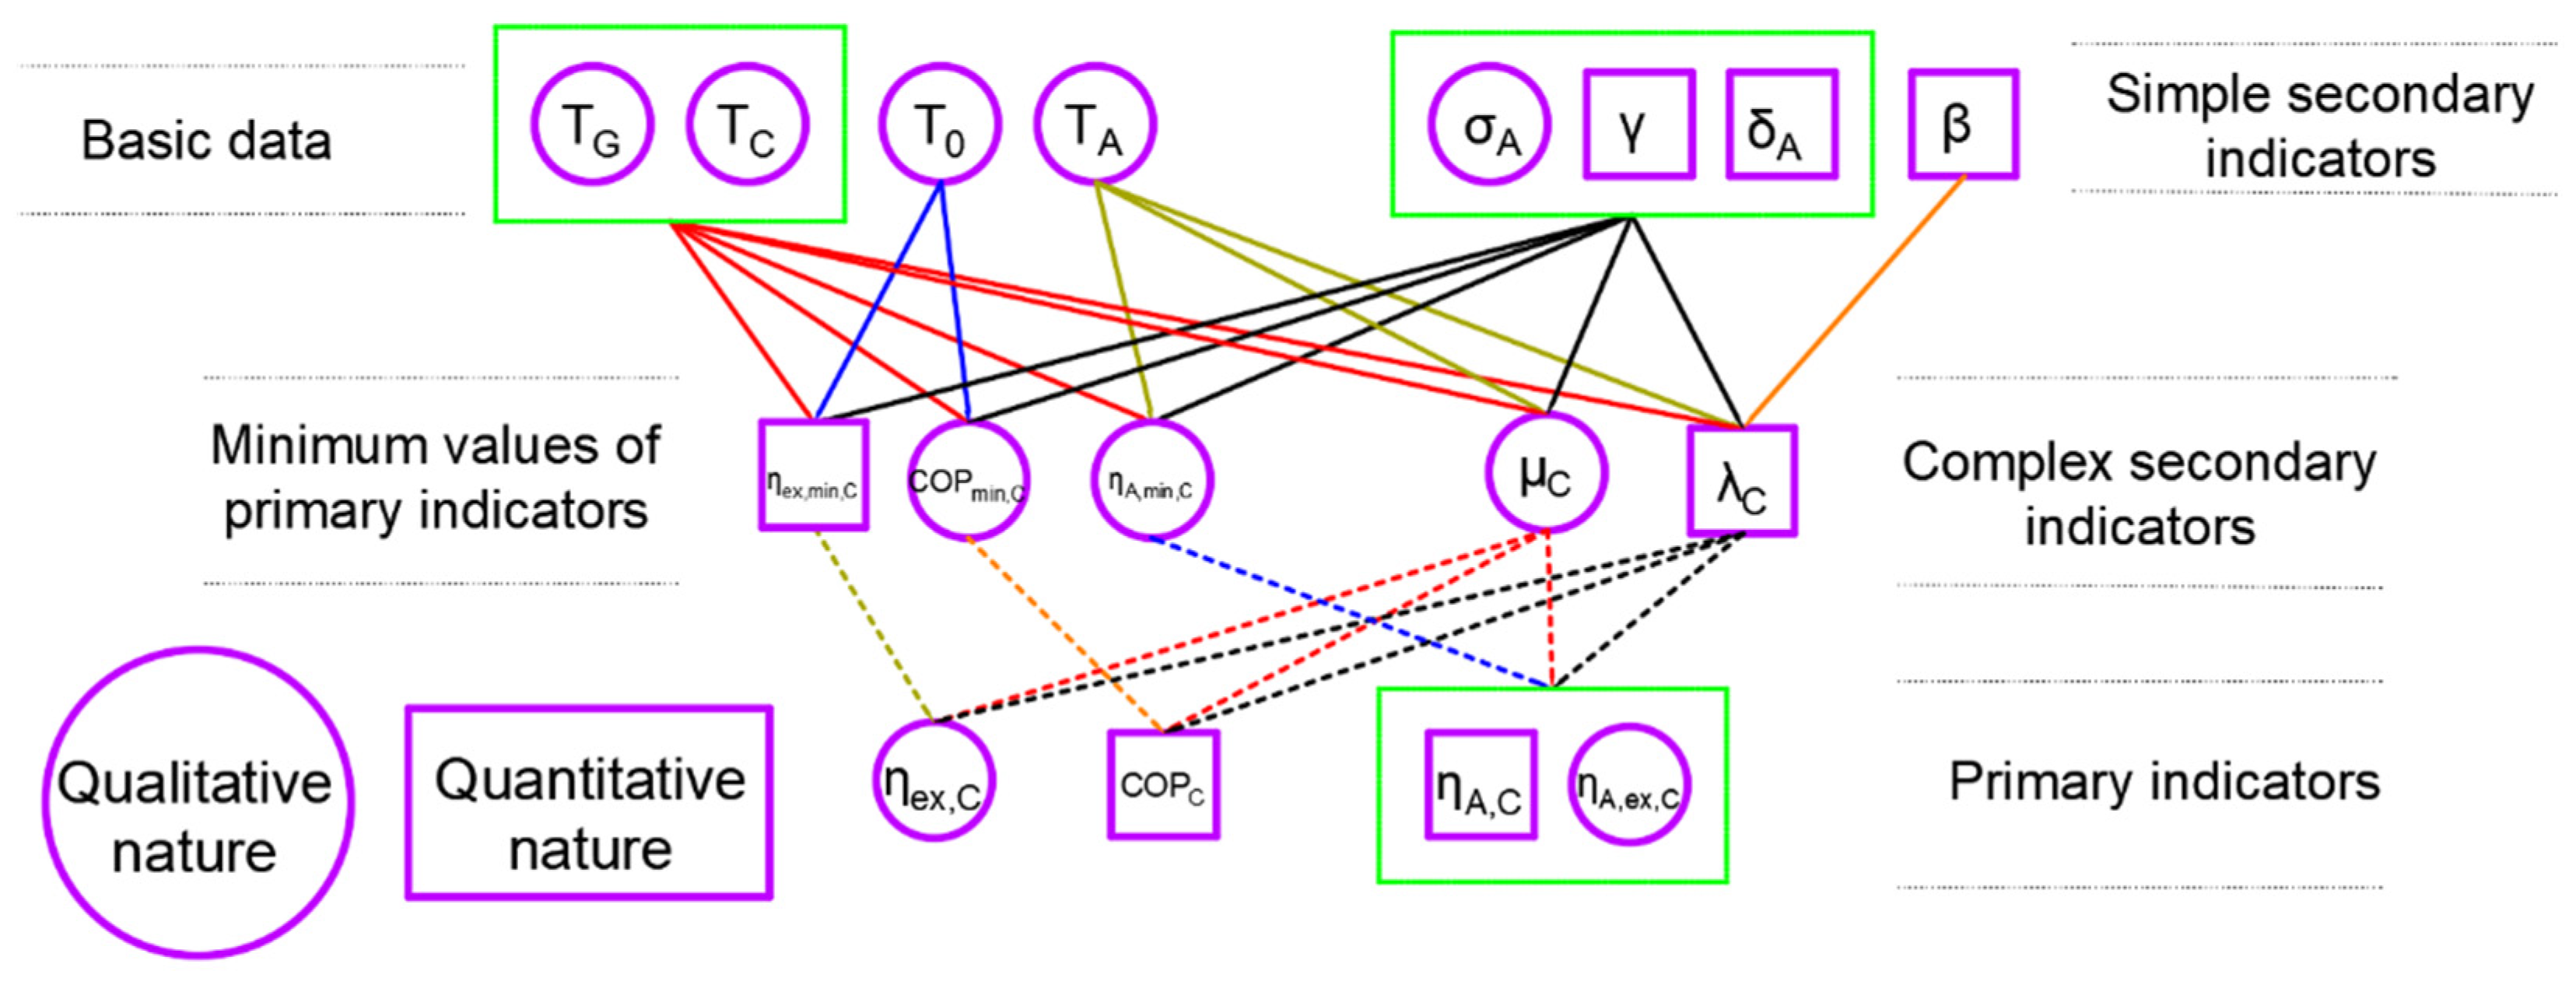
Effective optimisation and precise control, particularly intervention in problems, require not only precise objective definition but also a clear understanding of how affected characteristics influence other parameters. Without sufficiently detailed knowledge of these interactions, there is a risk of creating a larger problem than the original one. To mitigate this risk, my objective is to thoroughly explore the relationships between operating temperatures and performance-influencing parameters (e.g., secondary indicators), and their effects on primary indicators. This may require understanding how these parameters interact, which characteristics are more or less significant, and whether these parameters predominantly influence quantitative or qualitative aspects of the process.
In my previous article ([44]) a summary diagram illustrated the connections between ‘Basic data,’ ‘Secondary indicators,’ and ‘Primary indicators’ and whether the data represented a predominantly quantitative or qualitative nature. Building on the analyses presented in that article, these connections can be extended to non-idealised systems. These connections are visualised in Figure 6.
The ‘Basic data’ consists of measured temperatures, while the ‘Simple secondary indicators’ are defined in Equations (10), (11), (15), and (16). The relationship between ‘Basic data’ and ‘Simple secondary indicators’ with the ‘Minimum values of primary indicators’ is described in Equations (26)–(28), whereas their connection to ‘Complex secondary indicators’ is outlined in Equations (29a), (29b), (30a) and (30b). The relationship between ‘Primary indicators’ and both ‘Minimum values of primary indicators’ and ‘Complex secondary indicators’ is defined in Equations (31)–(33).
Figure 6. Connections and qualitative/quantitative nature of basic data, secondary indicators, and primary indicators.
Energies 17 04858 g006
When determining the nature of the characteristics, a few factors could be considered purely qualitative or quantitative. A factor was classified as qualitative if its determination required only temperatures (‘Basic data’) or exergy contents (ηex,C, ηA,ex,C), and as quantitative if it could be defined as a ratio of heat flows (COPC, ηA,C, β, and γ). For other factors, the nature was less clear, prompting a closer examination of the strength of their correlation with, and significance related to the temperatures. Therefore, their connections with the operating temperatures are examined in Table 6.
The analysis revealed that among the factors with uncertain nature, σA is closely related with temperatures, while δA and ηEX,min,C show no significant correlation. As a result, the former was classified as qualitative, while the latter was deemed quantitative. The nature of the remaining four characteristics was not definitively determined based on these analyses, suggesting that further studies and additional measured data should be considered in future research. When constructing the figure, I primarily considered the results of the significance analysis, categorising μC, COPmin,C, and ηA,min,CA,ex,min,C) as qualitative characteristics, whereas λC was regarded as more quantitative in nature.
Understanding these relationships and classifications is essential for identifying intervention points in future optimisation and efficiency improvement processes.

6. Conclusions

Specifically, this study successfully developed and validated a mathematical description of non-idealised absorption machines, incorporating often-overlooked aspects, such as the electrical work of the Solution Circulation Pump, the entropy generated within the refrigerant cycle, and the differences in exergy content. The introduction of secondary indicators, including the Quality Loss Index, Heat Fraction Factor, and Extreme Values Proximity Index, simplifies the representation of complex mathematical relationships and aids in exploring the relationship between primary indicators and their extreme values.
Data from the University of Debrecen’s real-life absorption chiller support the description’s effectiveness. The validation process indicated that the values of primary indicators approach their minimum values (λC < 0.1) when using the Solution Heat Exchanger. Sensitivity analyses show that small changes in main parameters can lead to substantial performance improvements. For instance, a 2.5% decrease in condenser temperature results in a 41.34% increase in COPC and a 15.49% increase in ηex,C, while a 2.5% decrease in the Heat Fraction Factor yields a 34.06% increase in both indicators. Based on the correlation and significance analysis, TA, TC, σA, and β are of significant importance. Conversely, based on the sensitivity analysis, TA, TC, TG, and γ have the most significant impact on the values of primary indicators. However, the convergence analysis shows that only TA, TC, and γ are the most significant in inducing primary indicator values (suggesting that TG has less impact than the other three indicators). Finally, as a summary of the results, a comprehensive figure is developed to briefly present the indicated connections, highlighting the quantitative or qualitative nature of each parameter.
Given these findings, future research and optimisation strategies should focus on TA, TC, and γ, as these parameters have the most significant impact on primary indicator values. The comprehensive analysis presented in this study provides a foundation for enhancing the efficiency and performance of real-life absorption chiller systems, offering both quantitative and qualitative insights to guide future optimisation efforts in this critical area of sustainable cooling technology.

Funding

Project no. TKP2021-NKTA-34 was implemented with the support provided from the National Research, Development and Innovation Fund of Hungary, financed under the TKP2021-NKTA funding scheme.

Data Availability Statement

The original contributions presented in the study are included in the article, further inquiries can be directed to the author.

Conflicts of Interest

The author declares no conflicts of interest.

Nomenclature

Q ˙ 0 is the cooling capacity, in W.
Q ˙ A is the heat released in the Absorber, in W.
Q ˙ C is the heat released in the Condenser, in W.
Q ˙ G is the heat consumed in the Generator, in W.
Q ˙ H is the total heat released in the Absorber and Condenser, in W.
PPumpis the electric power consumed by the Solution Circulation Pump, in W.
Q ˙ env is the heat exchange between parts of the machine and the environment, in W.
SRis the generated entropy within the refrigerant cycle, in W∙K−1.
Ex0is the exergy content of Q ˙ 0 , in W.
ExAis the exergy content of Q ˙ A , in W.
ExCis the exergy content of Q ˙ C , in W.
ExGis the exergy content of Q ˙ G , in W.
Exenvis the difference in the exergy contents, in W.
T0is the evaporation temperature, in K.
TAis the temperature in the Absorber (absorption temperature), in K.
TCis the condensation temperature, in K.
TGis the temperature in the Generator (generator temperature), in K.
TXis the reference temperature, in K.
Tc,1; Tc,2is the supply and return temperature of chilled water, in K.
Tg,1; Tg,2is the temperature of heating water entering and leaving the Generator, in K.
Th,1; Th,2is the supply and return temperature of cooling water, in K.
βis the Thermo-Chemical Performance Index.
σAis the Quality Loss Index (absorption chiller).
δAis the Coefficient of Compensation for Entropy-Surplus (absorption machine), in K−1.
γis the Heat Fraction Factor.
μCis the Thermo-Chemical Instability Index (cooling mode).
λCis the Extreme Values Proximity Index (cooling mode).
COPCis the Coefficient of Performance (cooling mode).
COPmin,Cis the value of Coefficient of Performance (cooling mode) when β=0.
COPCCis the maximum value of Coefficient of Performance (cooling mode).
COPHis the Coefficient of Performance (heating mode).
ηex,Cis the Exergetic Efficiency (cooling mode), in %.
ηEx,min,Cis the value of the Exergetic Efficiency (cooling mode) when β = 0, in %.
ηex,max,Cis the value of the Exergetic Efficiency (cooling mode) when COPC = COPCC, in %.
ηex,His the Exergetic Efficiency (heating mode), in %.
ηA,Cis the Thermo-Chemical Efficiency (cooling mode), in %.
ηA,min,Cis the value of the Thermo-Chemical Efficiency (cooling mode) when β = 0, in %.
ηA,ex,Cis the Exergetic Thermo-Chemical Efficiency (cooling mode), in %.
ηA,ex,min,Cis the value of the Exergetic Thermo-Chemical Efficiency (cooling mode) when β = 0, in %.

References

  1. Santamouris, M. Cooling the buildings—Past, present and future. Energy Build. 2016, 128, 617–638. [Google Scholar] [CrossRef]
  2. Csáky, I. Analysis of daily energy demand for cooling in buildings with different comfort categories—Case study. Energies 2021, 14, 4694. [Google Scholar] [CrossRef]
  3. Kalmár, F.; Kalmár, T. Thermal comfort aspects of solar gains during the heating season. Energies 2020, 13, 1702. [Google Scholar] [CrossRef]
  4. European Commission. Energy—Roadmap 2050; Publications Office: Brussels, Belgium, 2012. [Google Scholar]
  5. Kostyák, A.; Szekeres, S.; Csáky, I. Investigation of Sensible Cooling Performance in the Case of an Air Handling Unit System with Indirect Evaporative Cooling: Indirect Evaporative Cooling Effects for the Additional Cooling System of Buildings. Buildings 2023, 13, 1800. [Google Scholar] [CrossRef]
  6. Nemogne, R.L.F.; Wouagfack, P.A.N.; Nouadje, B.A.M.; Tchinda, R. Exergetic, ecological and thermo-economic (3E) optimization of an absorption heat pump with heat resistance, heat leakage and two internal irreversibilities: Comparison. Int. J. Refrig. 2020, 112, 251–261. [Google Scholar] [CrossRef]
  7. Kalmár, T.; Szodrai, F.; Kalmár, F. Experimental study of local effectiveness in the case of balanced mechanical ventilation in small offices. Energy 2022, 244, 122619. [Google Scholar] [CrossRef]
  8. Kalmár, F.; Kalmár, T. Numerical evaluation of thermal discomfort in conditions of surface heating and asymmetric radiation. Int. Rev. Appl. Sci. Eng. 2019, 9, 175–179. [Google Scholar] [CrossRef]
  9. Wouagfack, P.A.N.; Tchinda, R. Finite-time thermodynamics optimization of absorption refrigeration systems: A review. Renew. Sustain. Energy Rev. 2013, 21, 524–536. [Google Scholar] [CrossRef]
  10. Feidt, M. Evolution of thermodynamic modelling for three and four heat reservoirs reverse cycle machines: A review and new trends. Int. J. Refrig. 2013, 36, 8–23. [Google Scholar] [CrossRef]
  11. Alhuyi-Nazari, M.; Mukhtar, A.; Yasir, A.S.H.M.; Ahmadi, M.H.; Kumar, R.; Luong, T.N.L. Applications of geothermal sources for absorption chillers as efficient and clean cooling technologies for buildings: A comprehensive review. J. Build. Eng. 2024, 82, 108340. [Google Scholar] [CrossRef]
  12. Ehyaei, M.A.; Ahmadi, A.; El Haj Assad, M.; Rosen, M.A. Investigation of an integrated system combining an Organic Rankine Cycle and absorption chiller driven by geothermal energy: Energy, exergy, and economic analyses and optimization. J. Clean. Prod. 2020, 258, 120780. [Google Scholar] [CrossRef]
  13. Leveni, M.; Cozzolino, R. Energy, exergy, and cost comparison of Goswami cycle and cascade organic Rankine cycle/absorption chiller system for geothermal application. Energy Convers. Manag. 2021, 227, 113598. [Google Scholar] [CrossRef]
  14. Er, D.; Göktun, S. Optimum performance of an irreversible solar-driven cogeneration heat pump system. Energy Convers. Manag. 2001, 42, 329–337. [Google Scholar] [CrossRef]
  15. De Francisco, A.; Illanes, R.; Torres, J.L.; Castillo, M.; De Bla, M.; Prieto, E.; García, A. Development and testing of a prototype of low-power water–ammonia absorption equipment for solar energy applications. Renew. Energy 2002, 25, 537–544. [Google Scholar] [CrossRef]
  16. Chahbani, M.H.; Labidi, J.; Paris, J. Modeling of adsorption heat pumps with heat regeneration. Appl. Therm. Eng. 2004, 24, 431–447. [Google Scholar] [CrossRef]
  17. Jeong, S.; Kang, B.H.; Karng, S.W. Dynamic simulation of an absorption heat pump for recovering low grade waste heat. Appl. Therm. Eng. 1998, 18, 1–12. [Google Scholar] [CrossRef]
  18. Míšek, P.; Adamovský, R.; Neuberger, P. Laboratory and operational analysis of air to water gas absorption heat pump cycle. Energy Build. 2023, 292, 113180. [Google Scholar] [CrossRef]
  19. Zhang, X.; Wu, J.; Li, Z. Irreversibility characterization and analysis of coupled heat and mass transfer processes in an absorption system. Int. J. Heat Mass Transf. 2019, 133, 1121–1133. [Google Scholar] [CrossRef]
  20. Shirazi, A.; Taylor, R.A.; Morrison, G.L.; White, S.D. Solar-powered absorption chillers: A comprehensive and critical review. Energy Convers. Manag. 2018, 171, 59–81. [Google Scholar] [CrossRef]
  21. Siddiqui, M.U.; Said, S.A.M. A review of solar powered absorption systems. Renew. Sustain. Energy Rev. 2015, 42, 93–115. [Google Scholar] [CrossRef]
  22. Kim, D.S.; Ferreira, C.A.I. Solar refrigeration options—A state-of-the-art review. Int. J. Refrig. 2008, 31, 3–15. [Google Scholar] [CrossRef]
  23. Trutassanawin, S.; Groll, E.A.; Garimella, S.V.; Cremaschi, L. Experimental investigation of a miniature-scale refrigeration system for electronics cooling. IEEE Trans. Compon. Packag. Technol. 2006, 29, 678–687. [Google Scholar] [CrossRef]
  24. Konovalov, D.; Tolstorebrov, I.; Iwamoto, Y.; Kobalava, H.; Lamb, J.J.; Eikevik, T.M. Optimizing Low-Temperature Three-Circuit Evaporative Cooling System for an Electric Motor by Using Refrigerants. Energies 2024, 17, 3942. [Google Scholar] [CrossRef]
  25. Manu, S.; Chandrashekar, T.K. A simulation study on performance evaluation of single-stage LiBr–H2O vapor absorption heat pump for chip cooling. Int. J. Sustain. Built Environ. 2016, 5, 370–386. [Google Scholar] [CrossRef]
  26. Chiriac, V.; Chiriac, F. Absorption refrigeration method with alternative water-ammonia solution circulation system for microelectronics cooling. In Proceedings of the 2010 12th IEEE Intersociety Conference on Thermal and Thermomechanical Phenomena in Electronic Systems, ITherm 2010, Las Vegas, NV, USA, 2–5 June 2010; pp. 1–8. [Google Scholar] [CrossRef]
  27. Wu, W.; Wang, B.; Shi, W.; Li, X. Absorption heating technologies: A review and perspective. Appl. Energy 2014, 130, 51–71. [Google Scholar] [CrossRef]
  28. Yang, B.; Jiang, Y.; Fu, L.; Zhang, S. Experimental and theoretical investigation of a novel full-open absorption heat pump applied to district heating by recovering waste heat of flue gas. Energy Build. 2018, 173, 45–57. [Google Scholar] [CrossRef]
  29. Toghyani, S.; Afshari, E.; Baniasadi, E.; Shadloo, M.S. Energy and exergy analyses of a nanofluid based solar cooling and hydrogen production combined system. Renew. Energy 2019, 141, 1013–1025. [Google Scholar] [CrossRef]
  30. Liu, F.; Dong, F.; Li, Y.; Jia, L. Study on the heating performance and optimal intermediate temperature of a series gas engine compression-absorption heat pump system. Appl. Therm. Eng. 2018, 135, 34–40. [Google Scholar] [CrossRef]
  31. Le Lostec, B.; Galanis, N.; Millette, J. Experimental study of an ammonia-water absorption chiller. Int. J. Refrig. 2012, 35, 2275–2286. [Google Scholar] [CrossRef]
  32. Yi, Y.; Xie, X.; Zhang, H.; Jiang, Y. Thermodynamics and process studies on absorption cycle from the perspective of real solution with non-volatile solute. Energy 2024, 291, 130356. [Google Scholar] [CrossRef]
  33. Zhao, T.; Chen, X.; Chen, Q. Heat current method-based modeling and optimization of the single effect lithium bromide absorption chiller. Appl. Therm. Eng. 2020, 175, 115345. [Google Scholar] [CrossRef]
  34. Chen, Y.; Han, W.; Jin, H. Thermodynamic performance optimization of the absorption-generation process in an absorption refrigeration cycle. Energy Convers. Manag. 2016, 126, 290–301. [Google Scholar] [CrossRef]
  35. Bhardwaj, P.K.; Kaushik, S.C.; Jain, S. Finite time optimization of an endoreversible and irreversible vapour absorption refrigeration system. Energy Convers. Manag. 2003, 44, 1131–1144. [Google Scholar] [CrossRef]
  36. Su, H.; Gong, G.; Wang, C.; Zhang, Y. Thermodynamic optimization of an irreversible Carnot refrigerator with heat recovery reservoir. Appl. Therm. Eng. 2017, 110, 1624–1634. [Google Scholar] [CrossRef]
  37. Bhardwaj, P.K.; Kaushik, S.C.; Jain, S. General performance characteristics of an irreversible vapour absorption refrigeration system using finite time thermodynamic approach. Int. J. Therm. Sci. 2005, 44, 189–196. [Google Scholar] [CrossRef]
  38. Qin, X.; Chen, L.; Ge, Y.; Sun, F. Thermodynamic modeling and performance analysis of the variable-temperature heat reservoir absorption heat pump cycle. Phys. A Stat. Mech. Its Appl. 2015, 436, 788–797. [Google Scholar] [CrossRef]
  39. Cardoso-Fernández, V.; Bassam, A.; Tzuc, O.M.; Ch, M.A.B.; de Jesús Chan-González, J.; Soberanis, M.A.E.; Velázquez-Limón, N.; Ricalde, L.J. Global sensitivity analysis of a generator-absorber heat exchange (GAX) system’s thermal performance with a hybrid energy source: An approach using artificial intelligence models. Appl. Therm. Eng. 2023, 218, 119363. [Google Scholar] [CrossRef]
  40. Fumagalli, M.; Sivieri, A.; Aprile, M.; Motta, M.; Zanchi, M. Monitoring of gas driven absorption heat pumps and comparing energy efficiency on primary energy. Renew. Energy 2017, 110, 115–125. [Google Scholar] [CrossRef]
  41. Browne, M.W.; Bansal, P.K. Transient simulation of vapour-compression packaged liquid chillers. Int. J. Refrig. 2002, 25, 597–610. [Google Scholar] [CrossRef]
  42. Szabó, G.L. Energy and Exergy Analysis of Radiant Cooling Systems in Buildings; University of Debrecen: Debrecen, Hungary, 2020. [Google Scholar]
  43. Szabó, G.L. Thermo-chemical instability and energy analysis of absorption heat pumps. Energies 2020, 13, 1966. [Google Scholar] [CrossRef]
  44. Szabó, G.L. Exergetic optimization of absorption chillers—A case study. Case Stud. Therm. Eng. 2021, 28, 101634. [Google Scholar] [CrossRef]
  45. Szabó, G.L. Energetic and exergetic study of a potential interconnection of a natural gas engine, heat pumps with a thermal and a mechanical compressor. Therm. Sci. Eng. Prog. 2022, 36, 101525. [Google Scholar] [CrossRef]
  46. Arora, C.P. Refrigeration and Air Conditioning, 3rd ed.; Tata McGraw-Hill Education Pvt. Ltd.: New Delhi, India, 2009. [Google Scholar]
  47. Balmer, R.T. Modern Engineering Thermodynamics; Elsevier Inc.: Amsterdam, The Netherlands, 2011. [Google Scholar]
  48. Szabó, G.L. Az abszorpciós gépek jelzőszámai és ezek kapcsolata. Energiagazdálkodás 2018, 59, 38–42. [Google Scholar]
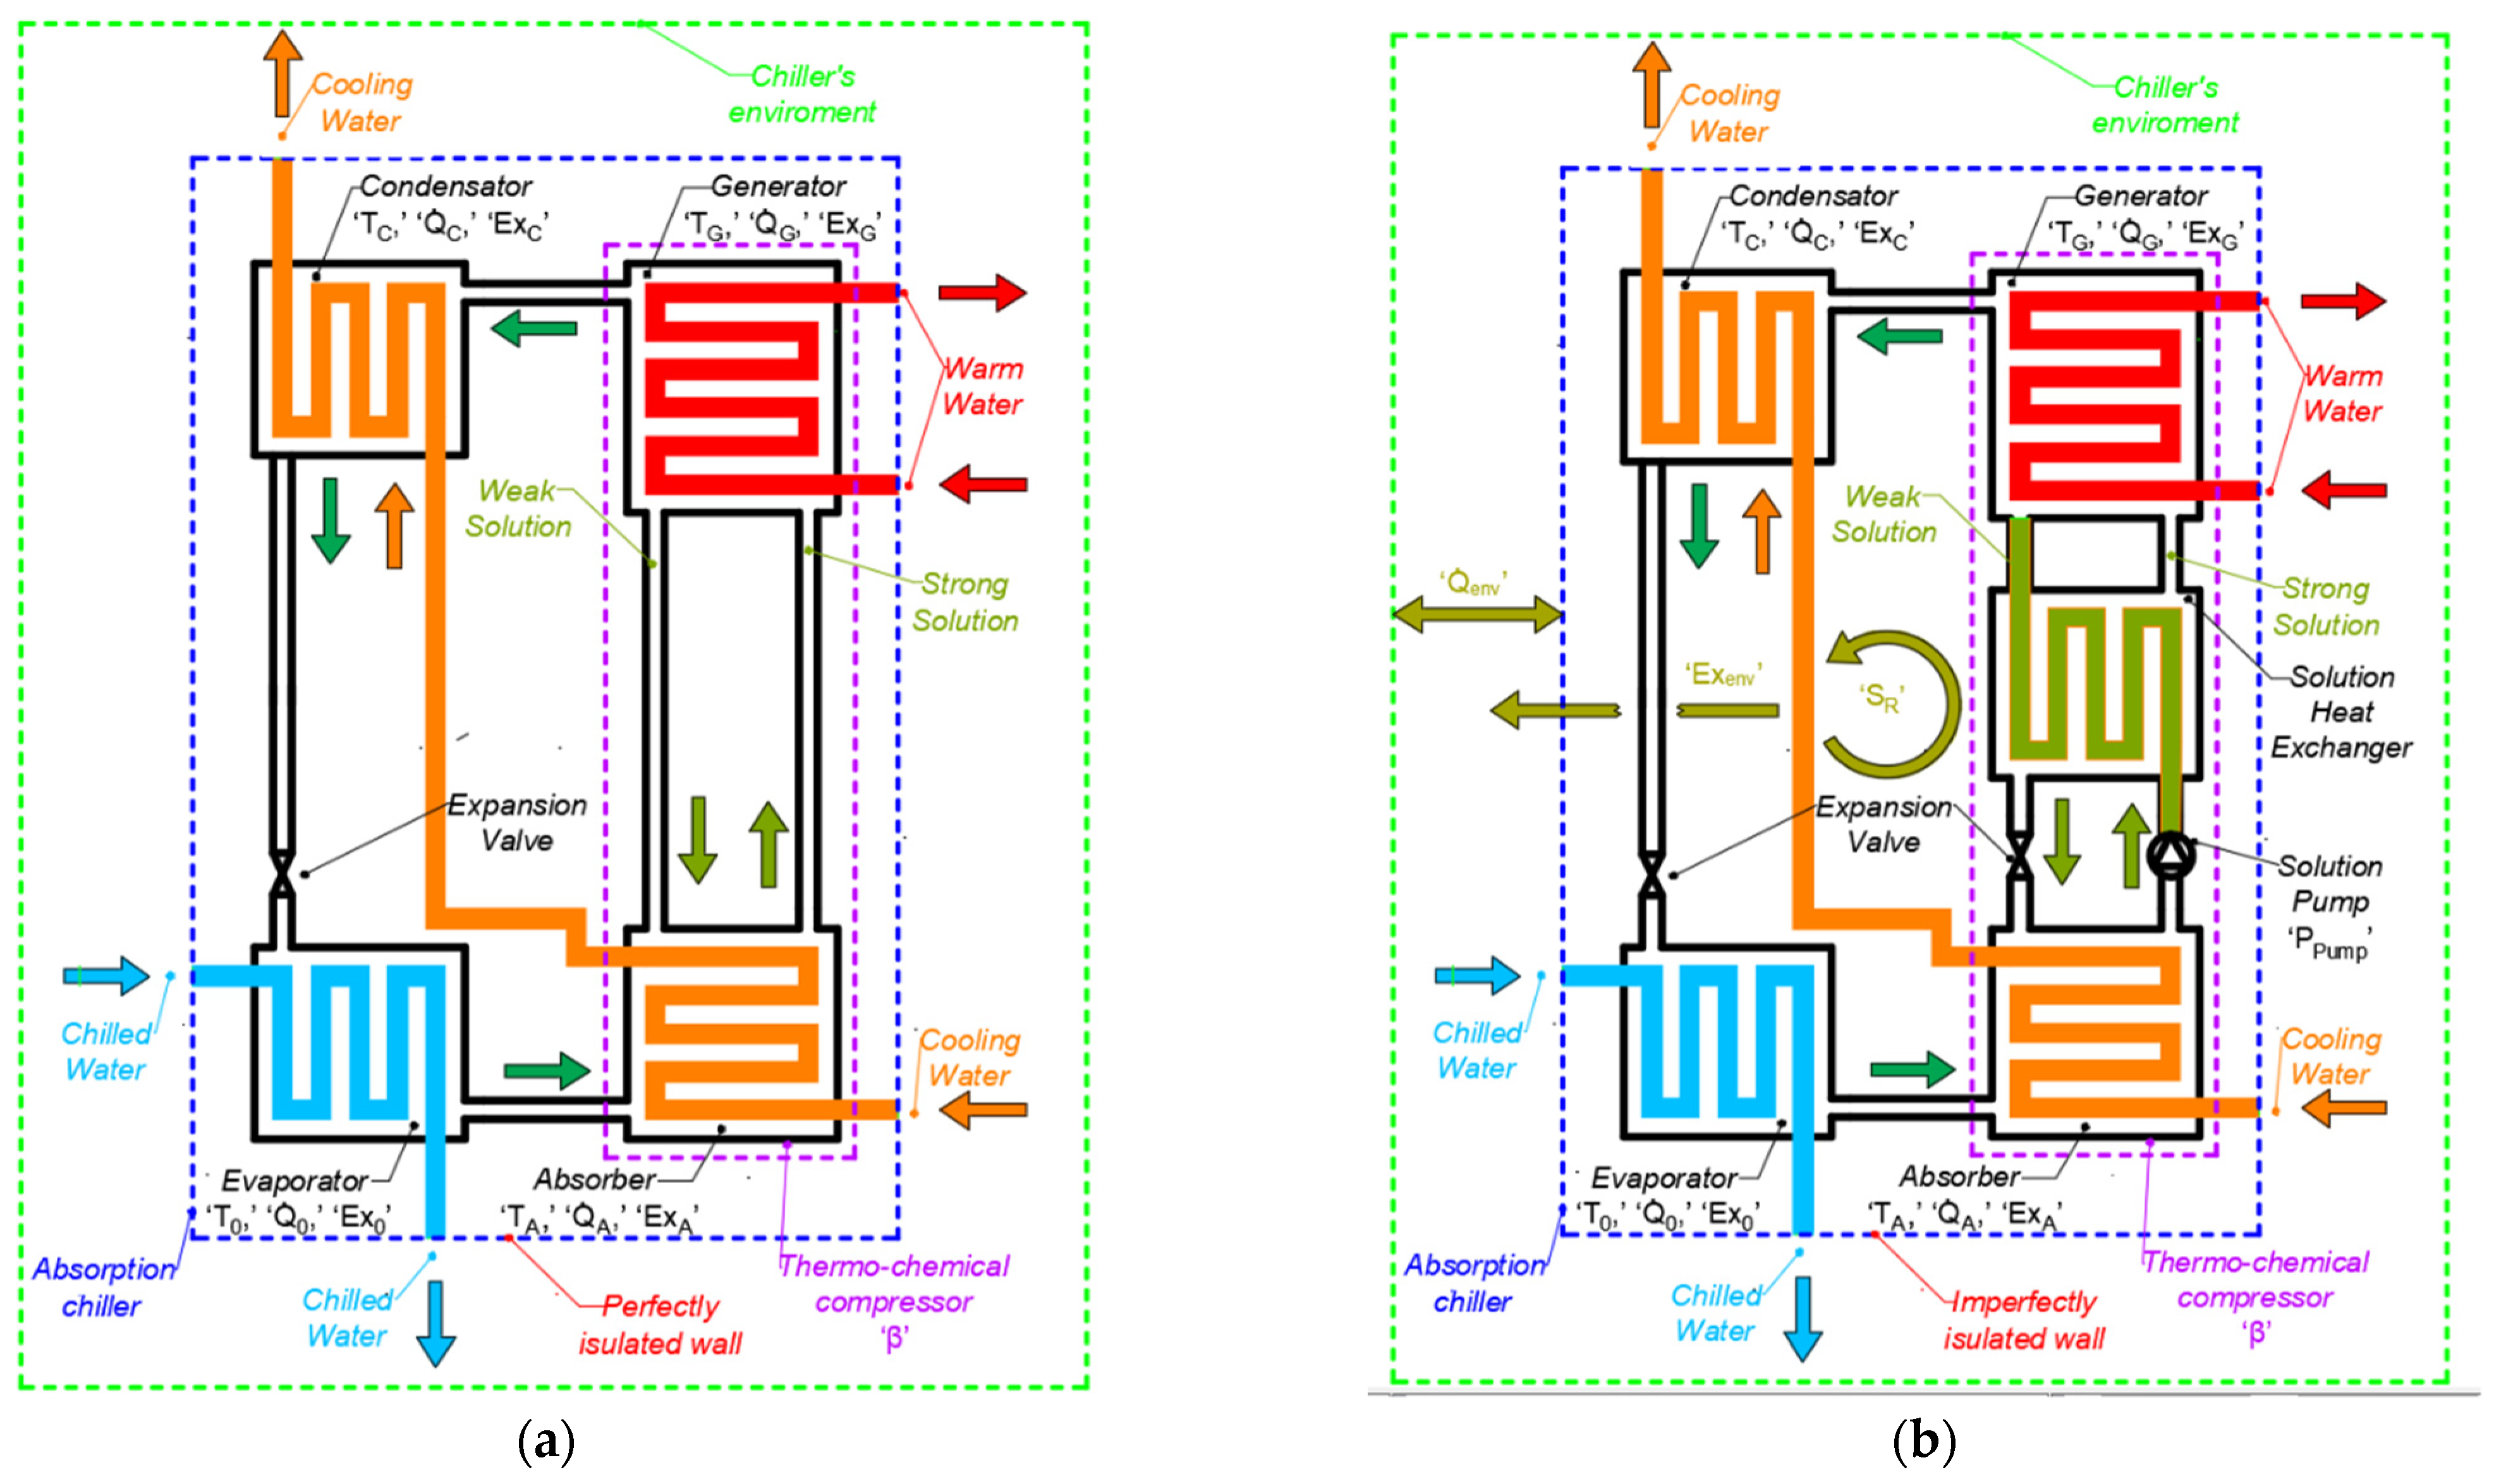
Figure 1. (a) Schema of an idealised absorption machine. (b) Schema of a non-idealised absorption machine.
Energies 17 04858 g001
Figure 2. (a) The external and internal temperatures; (b) secondary indicators; (c) energetic primary indicators and their extreme values; and (d) exergetic primary indicators and their extreme values.
Energies 17 04858 g002
Figure 3. Values of Extreme Values Proximity Index at measurement time points for the examined machine.
Energies 17 04858 g003
Figure 4. Sensitivity of (a) COPC depending on operating temperatures; (b) COPC depending on secondary indicators; (c) ηex,C depending on operating temperatures; (d) ηex,C depending on secondary indicators; (e) ηA,C and ηA,ex,C depending on operating temperatures; (f) ηA,C and ηA,ex,C depending on secondary indicators.
Energies 17 04858 g004aEnergies 17 04858 g004b
Figure 5. The achievable (a) λC values (b) COPC changing, (c) ηex,C changing, (d) ηA,C and ηA,ex,C changing by adjusting the seven possible parameters.
Energies 17 04858 g005aEnergies 17 04858 g005b
Table 1. The main data of the real-life machines.
DenominationNotationValue
Energy flow Q ˙ 0 / Q ˙ G /Ppump/ Q ˙ H ; in kW910/1312.5/15.8/2154.6
Q ˙ A / Q ˙ C / Q ˙ env ; in kW1134.0/1020.6/83.7
ExergyEx0/ExG/Ppump; in kW60.68/162.93/15.8
ExA/ExC/Exenv; in kW3.78/26.58/87.66
TemperatureT0/ TC; in °C7.3/34.0
TA/TG; in °C27.0/68.4
Tc,1/Tc,2; in °C14.0/8.0
Tg,1/Tg,2; in °C85.0/70.0
Th,1/Th,2; in °C29.8/26.0
TX; in °C26.0
Volume flow V ˙ chilled ; in m3/h
(at the Evaporator)
130
V ˙ cooling ; in m3/h
(at the Absorber and the Condenser)
486
V ˙ warm ; in m3/h
(at the Generator)
75
Simple secondary indicatorsβ0.864
δA−0.00001006
σA0.06599
γ0.9881
Complex secondary indicatorsμC0.6217
λC0.2674
Primary indicatorsCOPC/COPH0.685/1.622
ηex,Cex,H; in %33.96/16.99
ηA,CA,ex,C; in %54.46/54.46
Table 2. Deviation between measured and model-determined COPC and ηex,C values.
COPC; [−]ηEx,C; [%]
Date of MeasurementBased on Measure DataBased on ModelDeviationBased on Measure DataBased on ModelDeviation
Equation (4)Equation (18) Equation (6)Equation (19)
13 May 20210.34410.3441−1.943 ∙ 10−1519.77819.778−1.279 ∙ 10−13
7 September 20200.50590.50593.664 ∙ 10−1520.27920.2799.948 ∙ 10−14
29 August 20180.31470.31472.109 ∙ 10−1516.98616.9861.101 ∙ 10−13
5 July 20170.31720.3172−2.165 ∙ 10−1517.67517.675−1.279 ∙ 10−13
27 September 20160.16860.16862.165 ∙ 10−1510.24210.2421.261 ∙ 10−13
5 July 20160.35220.35222.665 ∙ 10−1516.51416.5141.279 ∙ 10−13
25 August 20140.26250.26258.327 ∙ 10−1614.52314.5235.684 ∙ 10−14
10 June 20140.38810.3881017.53317.5330
9 September 20130.34040.3404−6.661 ∙ 10−1618.72418.724−4.263 ∙ 10−14
29 May 20130.32090.3209−3.164 ∙ 10−1517.35717.357−1.599 ∙ 10−13
27 June 20120.36370.36371.110 ∙ 10−1517.65317.6539.237 ∙ 10−14
21 June 20110.43930.4393023.58423.5840
31 May 20110.48970.4897022.94922.9490
18 July 20080.30890.30891.998 ∙ 10−1517.96417.9641.101 ∙ 10−13
Table 3. Correlation and significance analysis of measured operating temperatures with cooling primary indicators.
Pearson CorrelationSignificance
COPCηex,CηA,C; ηA,ex,CCOPCηex,CηA,C; ηA,ex,C
T00.70440.337920.691370.004910.237340.00617
TA0.726650.390090.73820.003240.167930.00257
TC0.581260.176060.587280.029250.547130.02723
TG0.391270.117360.410680.166540.689490.14467
Table 6. Correlation and significance analysis of secondary indicators, and minimum values of cooling primary indicators with operating temperatures.
Pearson CorrelationSignificance
T0TATCTGT0TATCTG
σA−0.8067−0.6367−0.5747−0.21554.89 × 10−40.01430.03160.4594
δA−0.2977−0.3628−0.2706−0.30090.30130.20240.34950.2959
μC−0.6034−0.7183−0.5045−0.41280.02240.00380.06580.1424
λC0.74820.46520.66280.19440.002080.09370.00980.5055
COPmin,C0.61770.70590.49850.39150.01860.00480.06960.1662
ηEX,min,C0.21080.33790.06020.10530.46950.23740.83810.7203
ηA,min,C; ηA,ex,min,C0.60340.71830.50450.41280.02240.00380.06580.1424
Disclaimer/Publisher’s Note: The statements, opinions and data contained in all publications are solely those of the individual author(s) and contributor(s) and not of MDPI and/or the editor(s). MDPI and/or the editor(s) disclaim responsibility for any injury to people or property resulting from any ideas, methods, instructions or products referred to in the content.