1. Introduction
Lithium-ion batteries (LIBs) are currently used in a wide range of applications, from portable electronics to the automotive industry and power networks. Their widespread adoption is possible thanks to their capability of providing long life cycles, high energy density and high power density. However, along with these advantages, they also have some disadvantages, the main one being their thermal instability under the various conditions that they can experience (abuse conditions), which can have serious consequences. In fact, besides rapid degradation in cases of slight abuse, at higher levels of abuse, venting and, in cases of severe faults, thermal runaway (TR) can occur. A thermal runaway consists of an uncontrolled and irreversible chain of reactions that produces an increase in temperature and internal pressure leading to an eventual gas leakage, fire and explosion. As their application is increasingly spreading in safety-critical sectors, such as the automotive and transportation sectors, great effort must be made to face these safety challenges.
Abuse conditions are in general classified as mechanical abuse, electrical abuse and thermal abuse. Mechanical abuse is related to the battery deformation, compression or penetration that can be caused, for example, by collision or crushing; electrical abuse is related to overcharge, overdischarge and external short circuit; while thermal abuse is related to overheating, high ambient temperature, fire effects, etc. All of the aforementioned abuse conditions are somehow accompanied by an Internal Short Circuit (ISC) [
1,
2,
3,
4,
5,
6]. The ISC occurs when the anode and the cathode come into contact due to a failure of the separator. For example, mechanical abuse can deform or fracture the separator; electrical abuse may create dendrites that pierce the separator; while thermal abuse causes the shrinkage and collapse of the separator. The heat generated by the ISC can intensify the electrochemical side-reactions, causing the generation of a large amount of flammable gasses inside the cell that leads to an increase in its internal pressure and to the expansion of the battery outer case. In the most severe cases, these gasses can be released into the environment, possibly resulting in fire and/or explosion.
The temperature profile of the TR is characterized by three characteristic temperatures [
1,
2,
4,
7]. When the first temperature is reached (on-set temperature), the cell starts to experience self-heating. The recognized cause of this effect is Solid–Electrolyte Interface (SEI) decomposition. At the second temperature level (T2, TR triggering temperature), the separator fails, with a consequent Internal Short Circuit, which causes a more rapid temperature increase. T3 is the highest temperature reached by the cell, and its level directly depends on the main part of the heat released during TR. Feng et al. [
2] studied the TR of several types of cells, reporting that T3, together with the temperature derivative at T2, are higher for cells with higher energy densities. This implies that the new chemistries that improve the energy densities [
5,
8], such as Ni rich Lithium Nickel Manganese Cobalt Oxide (NMC) cathodes or Li rich Lithium Manganese-Based Oxide (LMO) cathodes, are more critical from a safety point of view. These high energy density batteries are especially required for electric vehicles to improve the vehicles’ range. This application also requires a high safety level, making the control of the thermal runaway a critical aspect.
Brand et al. [
9] compared the safety performances of three types of cells: Lithium Nickel Manganese Cobalt Oxide (NMC) cathode, Lithium Nickel Cobalt Aluminum Oxide (NCA) cathode and Lithium Iron Phosphate (LFP) cathode, all with graphite anodes. In their study, they carried out overcharge, overdischarge, short circuit and accelerated rate calorimetry (ARC) tests. NMC and NCA cells showed lower thermal stability, confirming that they are more dangerous in cases of both thermal and electrical abuse. On the other hand, an advantage of NMC and NCA cells is the charge reserve they have in case of overcharge: at 100% State of Charge (SOC) they can accept further charges before irreversible damages.
Within the various abuse conditions, overcharge is one of the most critical. Wei et al. [
10] tested three methods of abuse (side heating, nail penetration and overcharge) on cells with NMC cathode and graphite anode. The tests were carried out on both a single cell and on a cell within a battery module to investigate TR propagation. They found that the overcharge method was the most violent of the three and that, in the module case, resulted also in the most severe damage to the passive cells. The reason for such intensive consequences is recognized to be the higher energy content of the cell when overcharged [
5,
10,
11].
Also, the current level of the overcharge influences the outcome: at low current levels, the cell will only swell, while at high current levels, it could explode [
5]. Mao et al. [
12] investigated the behavior of cells with NMC cathodes during thermal runaway induced by overcharge at different currents and heat dissipation conditions, and they reported that the cells were more susceptible to thermal runaway in the case of poor heat dissipation conditions and with an increase in charging current.
Thermal runaway involves several reactions, which can differ based on the type of abuse to which the LIBs are subjected. Besides electrical and thermal measurements, physical measurements can also help understand the process. Gong et al. [
13] studied the residue of a 12 Ah pouch Li(Ni
0.8Co
0.1Mn
0.1)O
2 cell subjected to overcharge abuse by means of Scanning Electron Microscopy and X-ray diffractometry. By investigating the macro characteristics, micromorphology and phase composition of the residue with these methods, it is possible to provide a scientific basis for determining the cause of LIB thermal runaway accidents.
In order to improve the safety characteristics of LIBs, cells can be equipped with protection devices [
14]. The most common ones are the Current Interrupt Device (CID), the safety vent and the Positive Temperature Coefficient (PTC) resistor. In addition, or as an alternative, current-limiting fuses and diodes can be used. The above-mentioned systems are classified as passive devices, but active devices that monitor the cell state and cut off the current when needed can also be used. Examples vary from the Protection Circuit Board (PCB), which can be integrated into the single cells, to the Battery Management System (BMS) boards, which control multiple cells together and that adopt complex algorithms able to identify critical situations.
CID and safety vent triggering are based on the cell’s internal pressure. In the case of the CID, when the internal pressure reaches a defined activation value, the device cuts off the electrical pathway with the aim of interrupting the electrochemical reactions. If the side reactions continue to occur, the safety vent mechanism allows the release of the gasses with the aim of lowering the cell internal pressure. The PTC, instead, is triggered by the temperature. This device is a disk, generally a polymer containing conductive particles, such as carbon black and metal particles, whose resistance grows with a temperature increase. When the temperature increases, the polymer expands and increases the distance between the conductive particles [
15]. The design target is to have a low resistance of the device at normal operating temperatures, while expecting it to quickly become an insulator at the required trigger temperature.
The protection circuit board is a small device, usually integrated into the cell upper lid or the cell bottom, that can perform simple electrical measurements, such as current and voltage, and cut off the circuit when a critical condition is detected.
The BMS is the most complex system since it can have several sensors for each cell (current, voltage, temperature, impedance, etc.) operated by a control system based on models of the cell and the battery. These algorithms allow identifying possible abuse conditions, such as an overcharge [
16]. For example, Erol et al. [
17] used the impedance response to detect a cell state of overcharge or undercharge, while Cao et al. [
18] developed an early fault diagnosis method for thermal runaway caused by overcharge based on the Gramian Angular Summation Field and Residual Network.
Li et al. [
19,
20] studied the CID and safety vent response for a total of four 18650 commercial cells. They reported similar activation pressures at ambient temperature in the four cases, both for the CID (within 0.997 MPa and 1.393 MPa) and for the safety vent (from 2.190 MPa to 2.363 MPa). At increasing temperature, a lower activation pressure was measured both for the CID and the safety vent.
Meng et al. [
21,
22] reported the PTC triggering temperature of two 18650 cell types: ICR18650-26JM, manufactured by Samsung SDI Co., Ltd., Suwon, Republic of Korea, and 18650M26, manufactured by LG Chem, Ltd., Seoul, Republic of Korea. The measured temperatures were, respectively, 117.9 °C at 0.5C of current overcharge and 82.3 °C at 3C of current overcharge, for the first cell type, while 151.3 °C at 0.5C of current overcharge and 139.4 °C at 3C of current overcharge, for the second cell type.
The CID, safety vent and PTC must guarantee appropriate safety levels during the whole cell life. The absence of a PTC resistor and the ineffectiveness of the CID were pointed out by Kong et al. [
23] as the main causes of the several fire and explosion incidents that occurred with the MXJO 18650 cylindrical lithium-ion cells.
In the present work, the results of overcharge abuse tests on commercial graphite-based anode cells (NCR18650B) are reported to evaluate the performance of protection devices integrated into the cells. Two types of cells were considered for the testing, those defined by the supplier as “protected” and those defined as “unprotected”. The former differed from the latter by the presence of a Protection Circuit Board (PCB) that offered active protection against abuse conditions, such as overcharge, overdischarge and short circuit. However, as confirmed also by cell disassembly, both cell types were also equipped with passive protection devices such as a Current Interruption Device (CID), a safety vent and a Positive Temperature Coefficient (PTC) device.
In addition to the overcharge tests, an analysis of the Positive Temperature Coefficient (PTC) device is also reported to evaluate its resistance variation with the temperature.
The following
Section 2 describes the experimental set up used and the results obtained about the protection device performance during overcharge abuse tests. The description of the set up adopted for the PTC characterization and the discussion of the results are given in
Section 3, while
Section 4 provides the general conclusions of this study.
2. Overcharge Abuse Tests on 18650 Lithium-Ion Cells
The tests were carried out both in open-air conditions and in a climate chamber. Some of the abused cells were disassembled; the electrodes were observed under a Scanning Electron Microscope (SEM) to evaluate any morphological change.
2.1. Experimental Set Up for Overcharge Abuse Tests
The cells used in this study (NCR18650B) were all cylindrical 18650 with graphite-based anode and Lithium Nickel Manganese Cobalt oxides (NMC) cathode (
Table 1); some of them were provided with an active Protection Circuit Board (PCB).
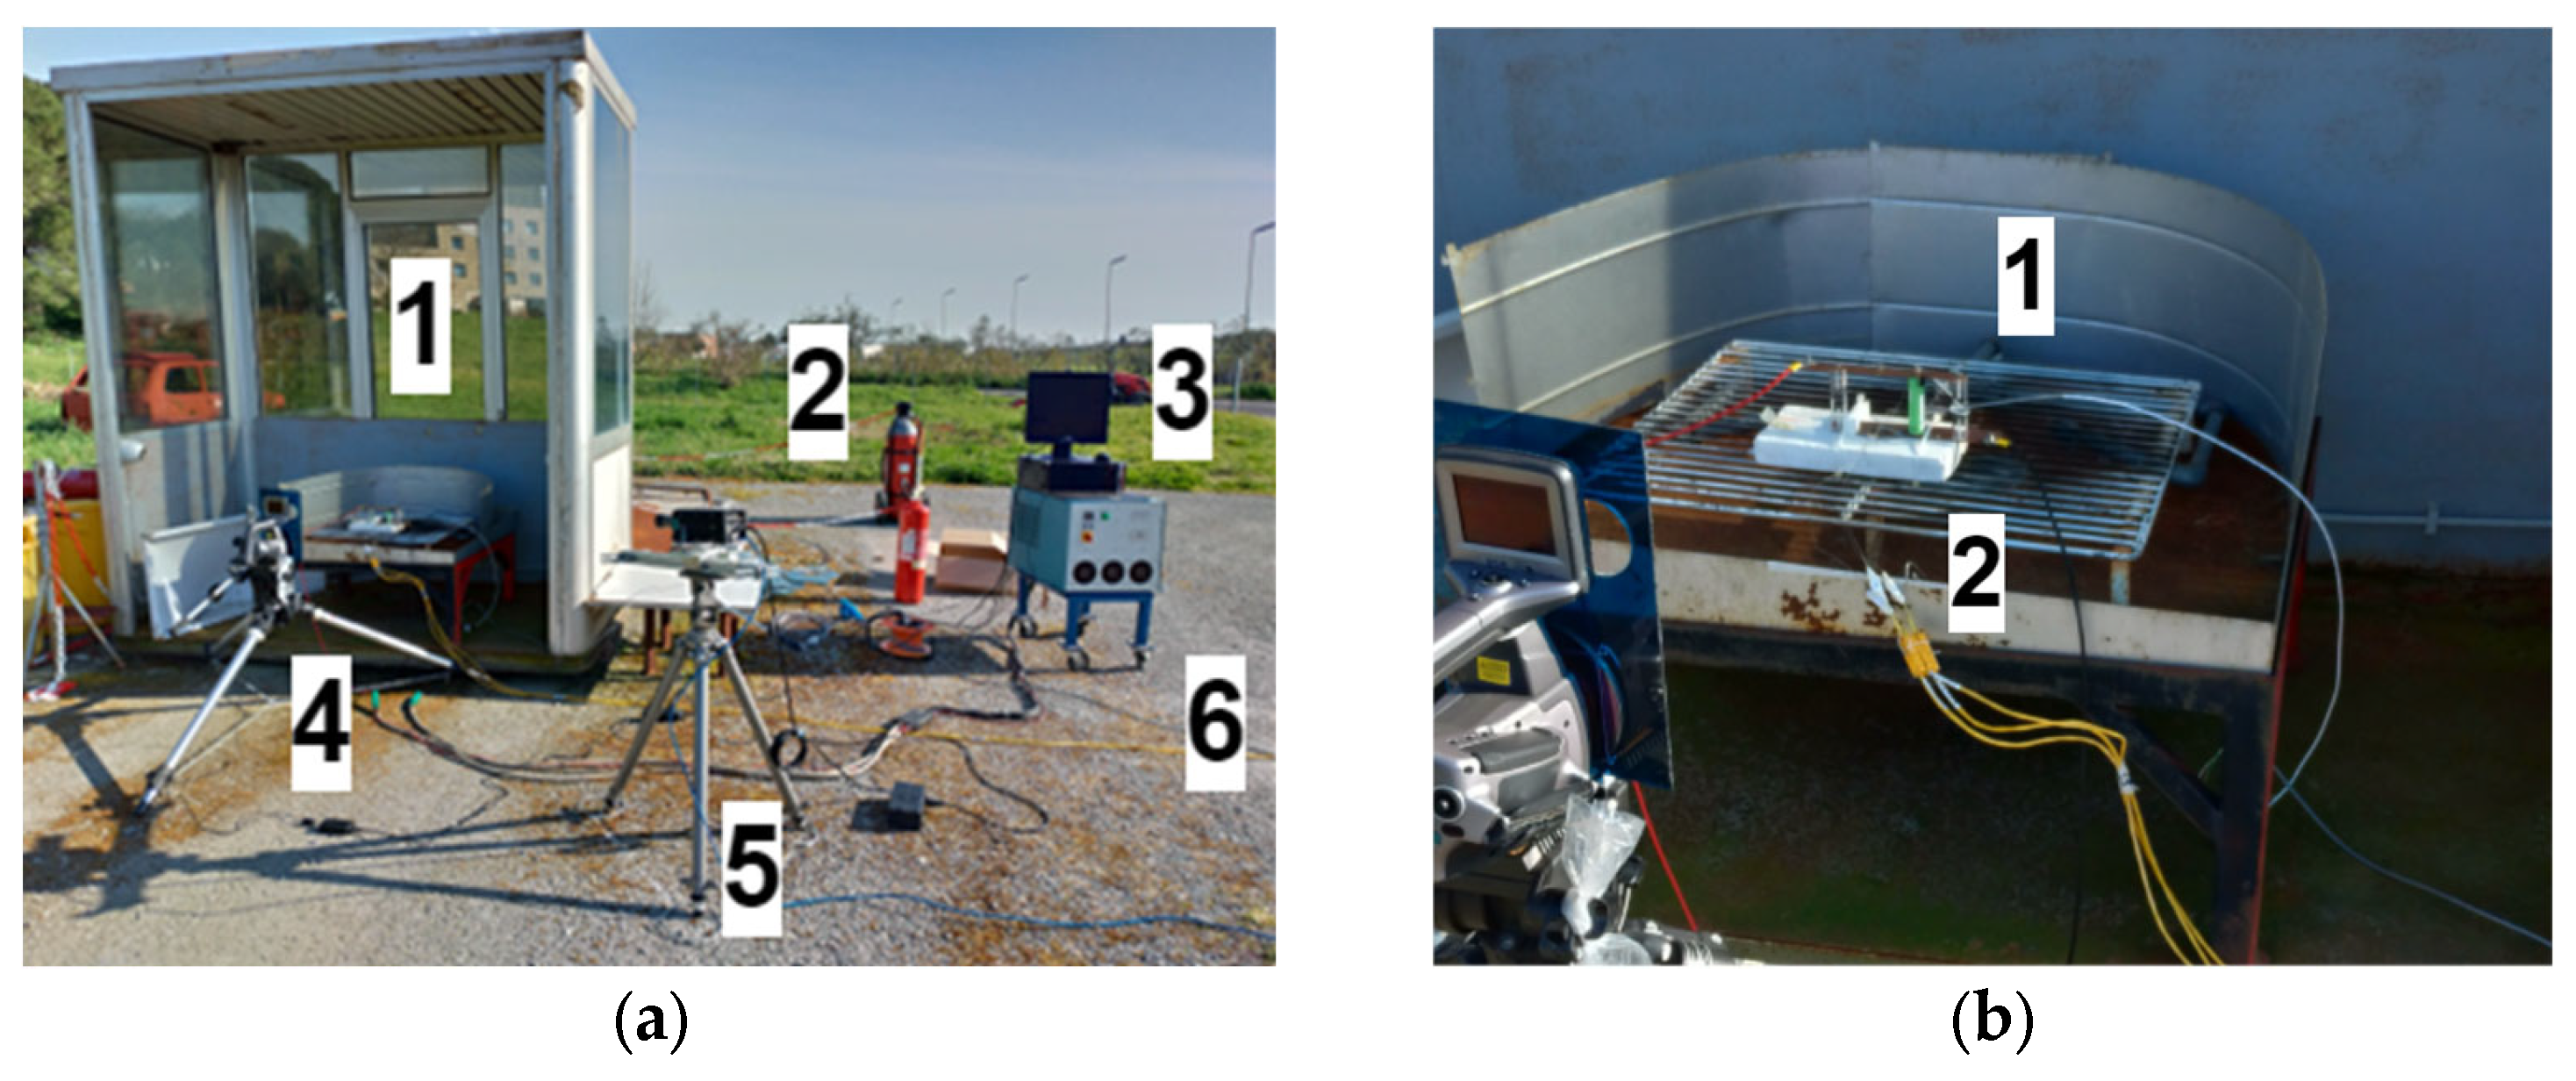
At first, the overcharge tests were carried out in an open-air test field at the FARO plant (
Figure 1) located at the ENEA Casaccia Research Center. It serves primarily as a dedicated testing ground for abuse tests on cells and battery packs. It covers an area of about 900 square meters, and it is equipped with facilities for the management of abuse tests, such as control rooms and warehouses.
At this plant, three NCR18650B unprotected cells and one NCR18650B protected cell were tested.
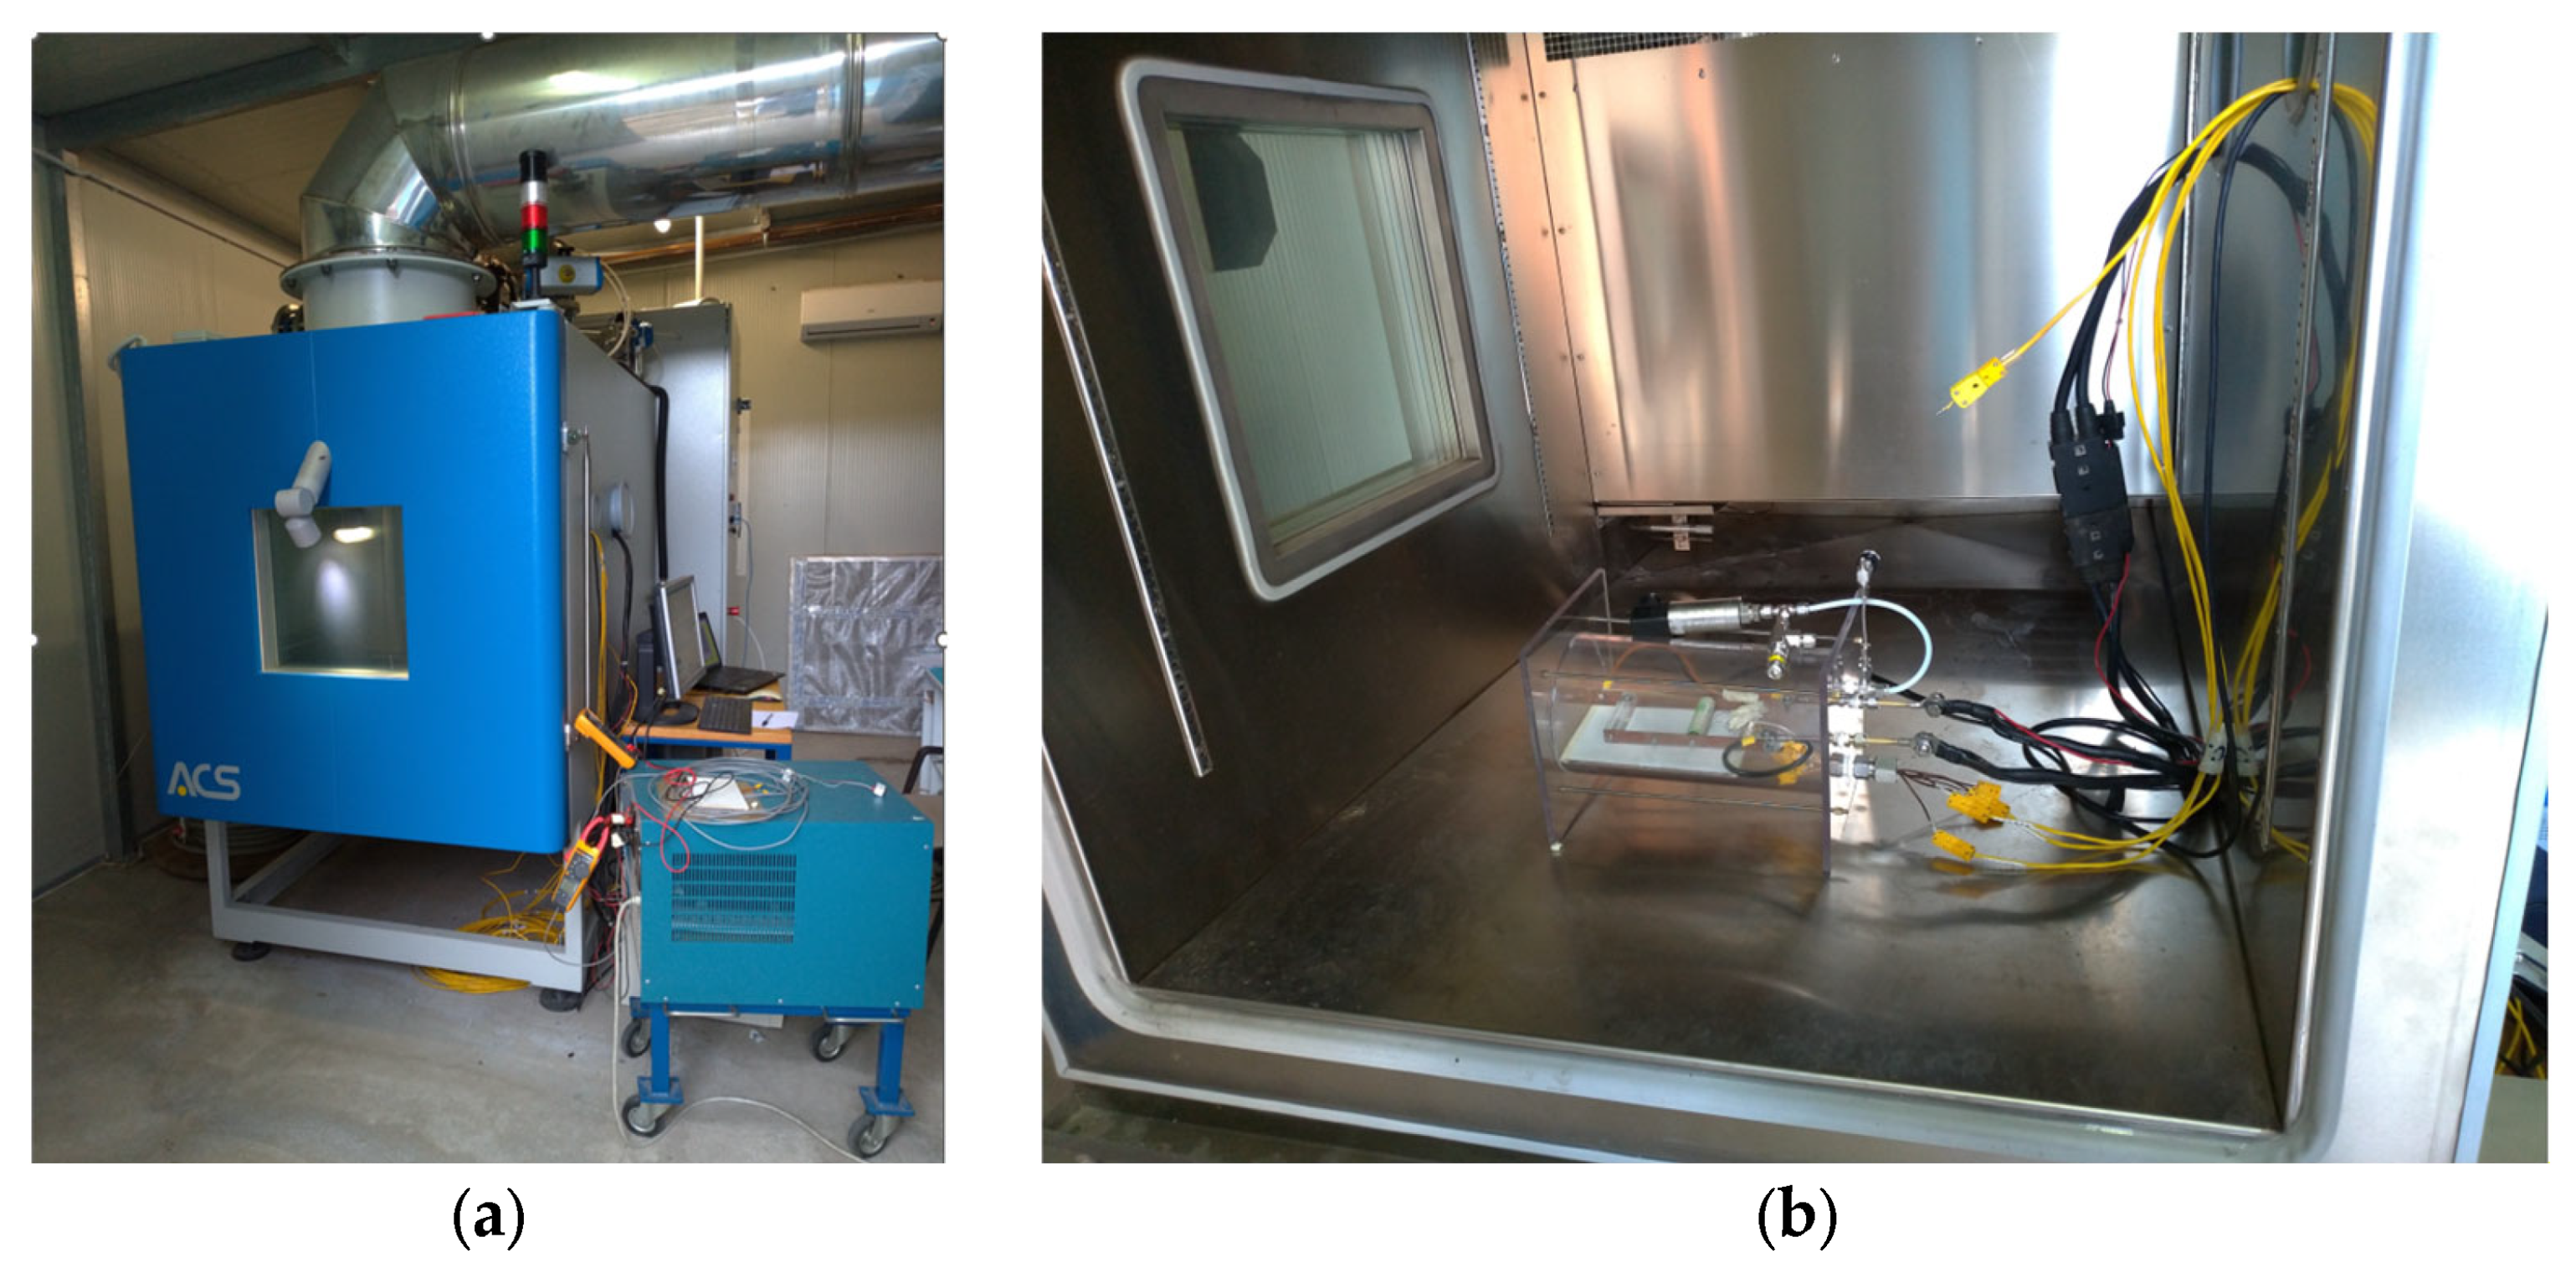
Afterwards, the following overcharge tests were carried out inside a climate chamber to assess the influence of different ambient temperatures on the protection device performance. The climate chamber was specifically designed for abuse tests on batteries (
Figure 2). It has a load-bearing structure made up of carbon steel panels and profiles protected by powder coating based on polyester resins properly selected for their excellent resistance to atmospheric agents and abrasion. The internal compartment is made of fully vapor-tight welded stainless steel sheet (AISI 304), and thermal insulation is obtained using polyurethane panels and glass wool in panels treated with a special binder based on thermosetting resins.
Inside the climate chamber, a total of five NCR18650B unprotected cells were tested.
The acquisition system, used both in the open-air test field and in the climate chamber, was composed of:
Three calibrated type K thermocouples (accuracy of ±0.1 °C) located close to the positive connector, at the cell center, and close to the negative connector.
A “CompactDAQ” from National Instrument, Austin, TX, USA, chassis with a thermocouple module (24 bit ADC, 16 channels) and one voltage input module (16 bit ADC, 32 channels).
A data acquisition system designed using LabVIEW 2018.
For the open-air tests, a thermal infrared camera and a fast camera were used. The thermal infrared camera was the S60 model from Flir System, Wilsonville, OR, USA, with the following characteristics: Tmax: 1500 °C, thermal sensitivity: <0.1 °C, accuracy: ±2 °C or ±2%. The fast camerawas the MotionPro Y3S1-M model from Redlake, San Diego, CA, USA, with the following characteristics: 3000 fps with a resolution of 1280 × 1024 pixels. The fast camera was adopted to film the thermal runaway events, which, however, did never occur.
For the tests in the climate chamber, the following additional set up was used:
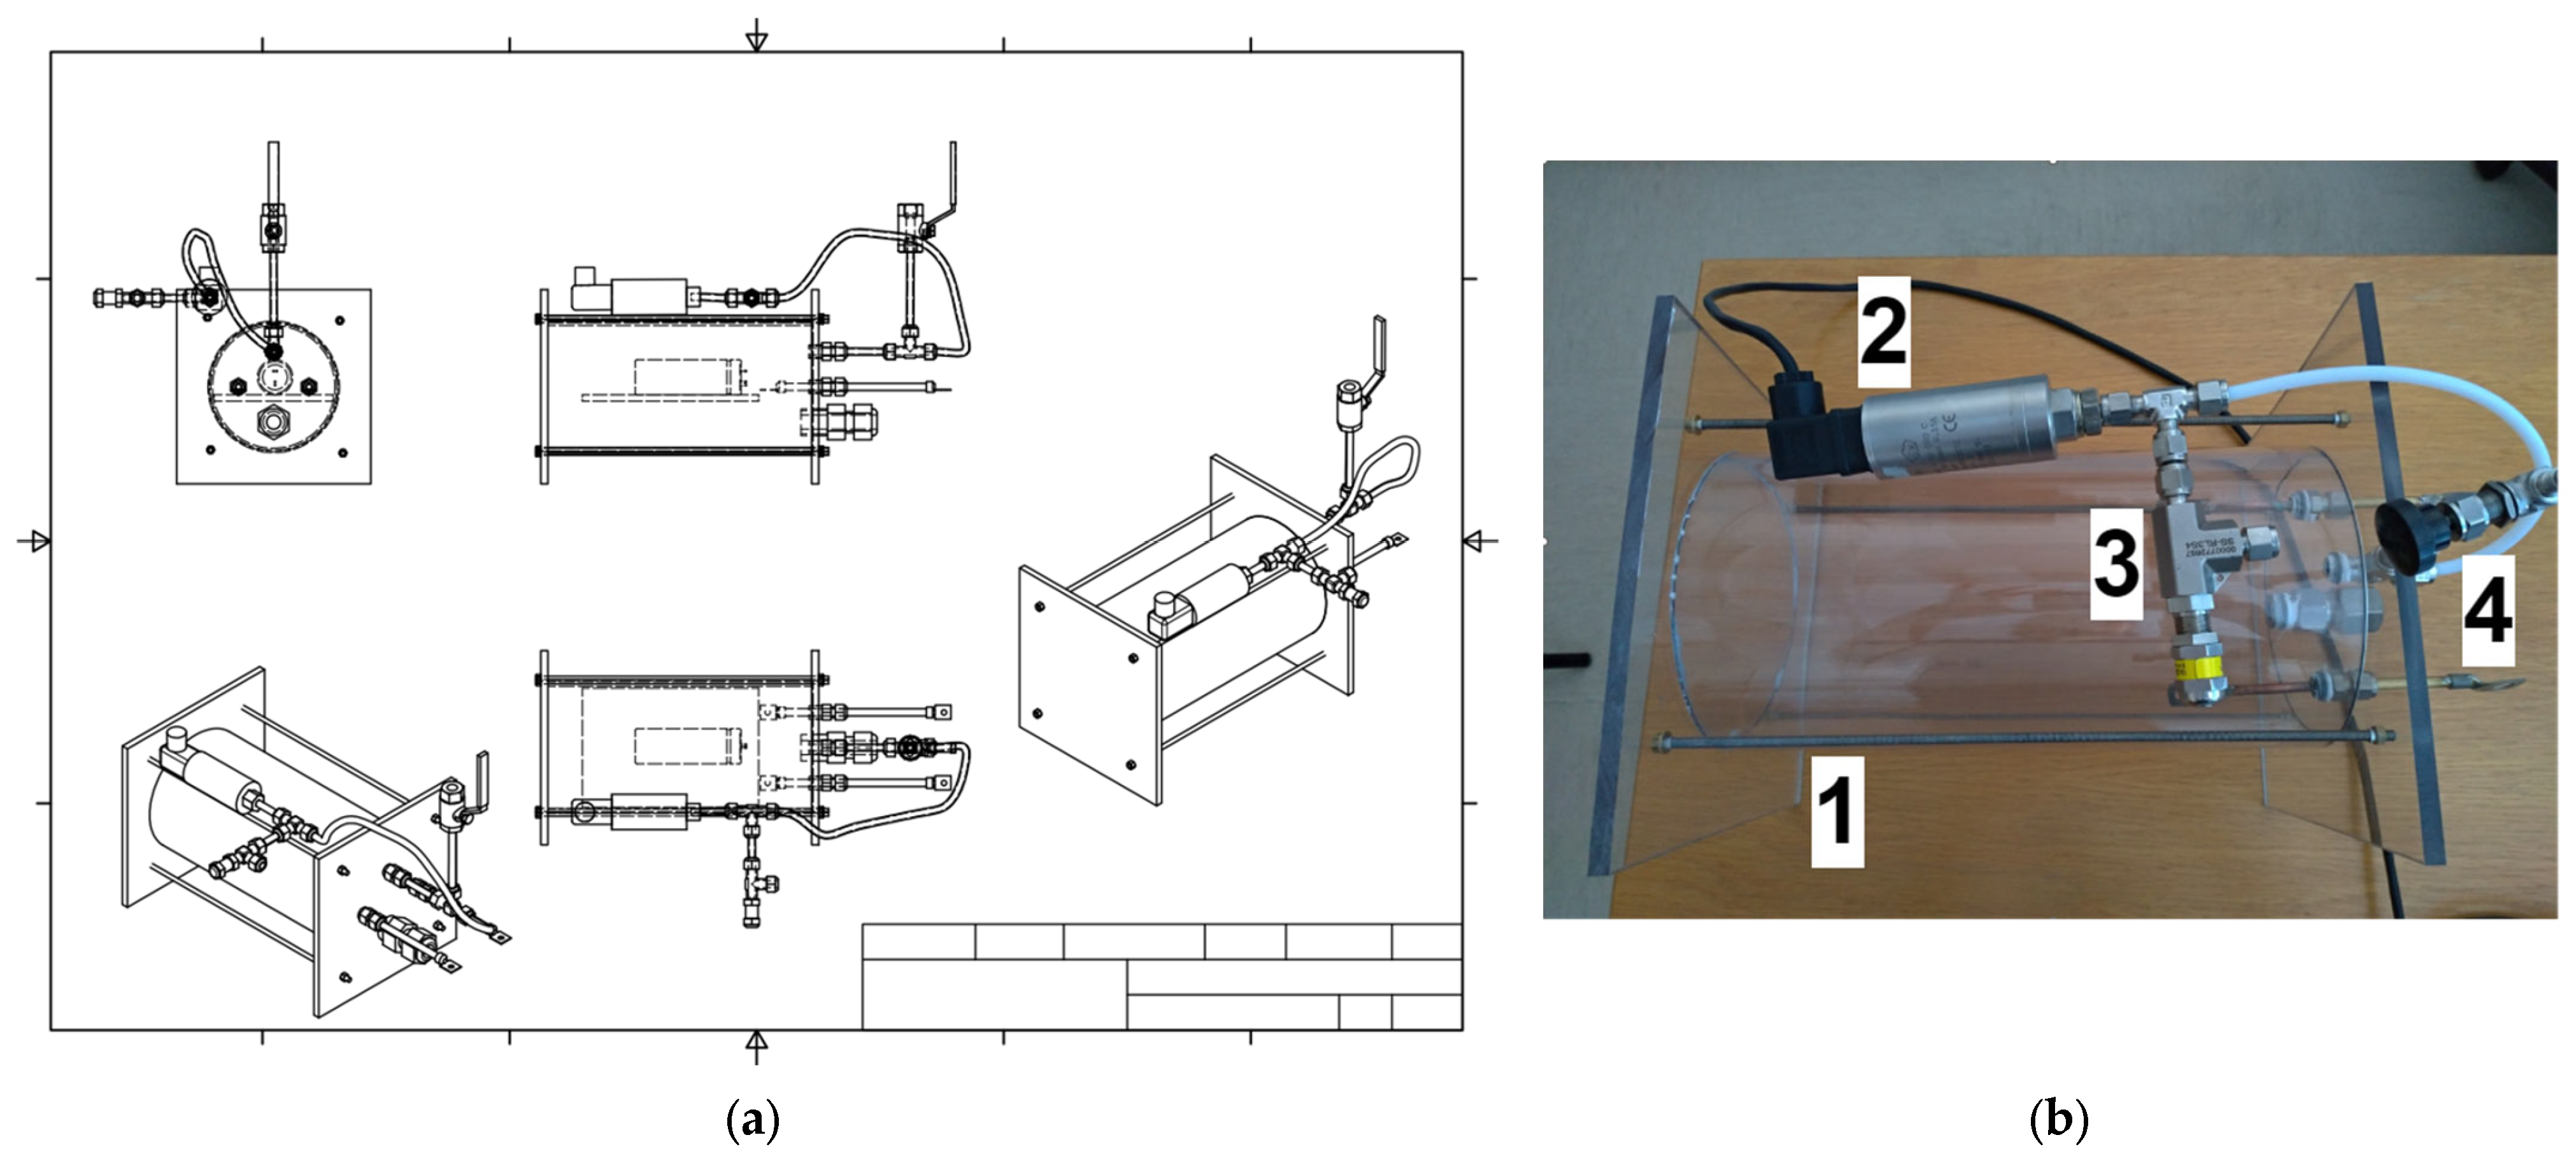
A case made up of a transparent extruded polycarbonate PCT160/150 tube with diameter 160/150 mm and length 205 mm, closed by polycarbonate plates with a thickness of 8 mm.
A pressure transducer, model PTX 610-I from Druck Ltd., Leicester, UK, with the following characteristics: range 0–10 barg, output current 4–20 mA DC nom.
A safety valve, model SS-RL3S4 from Swagelok, Solon, OH, USA with a pressure range of 0.7–15 bar.
The purpose of the container (
Figure 3) is to avoid the dispersion of the mechanical parts in the climate chamber after the cell failure and to hold in the gas in the event of activation of the safety vent or, in the worst-case scenario, of the explosion of the cells. The case was equipped with a pressure transducer to measure any eventual pressure increase, which would highlight the release of gas from the cell due to venting or breaking/explosion. Its design is based on literature data related to the gas amount generated during the venting with the consequent overpressure formation, and it is equipped with:
A drain valve, whose purpose is to collect any possibly vented gasses and send them to analysis by gas chromatographic techniques.
A safety valve that opens whenever the pressure exceeds the maximum value allowed by the transducer.
Ahead of the abuse tests, all the cells were cycled with three cycles of standard discharge and charge by an Eltra E-8094 cycler, Eltra, Segrate, Italy (nominal voltage 3.6 ÷ 6 V, current 0 ÷ 280 A), reaching a SOC of 100% in the last cycle. For the abuse tests, a portable Eltra E-8325 cycler, Eltra, Segrate, Italy was used (voltage 0 ÷ 18 V, maximum discharge current 150 A and maximum charge current 80 A). The cycler made it possible to acquire the data related to the state of the battery and to estimate the SOC % reached during the overcharge.
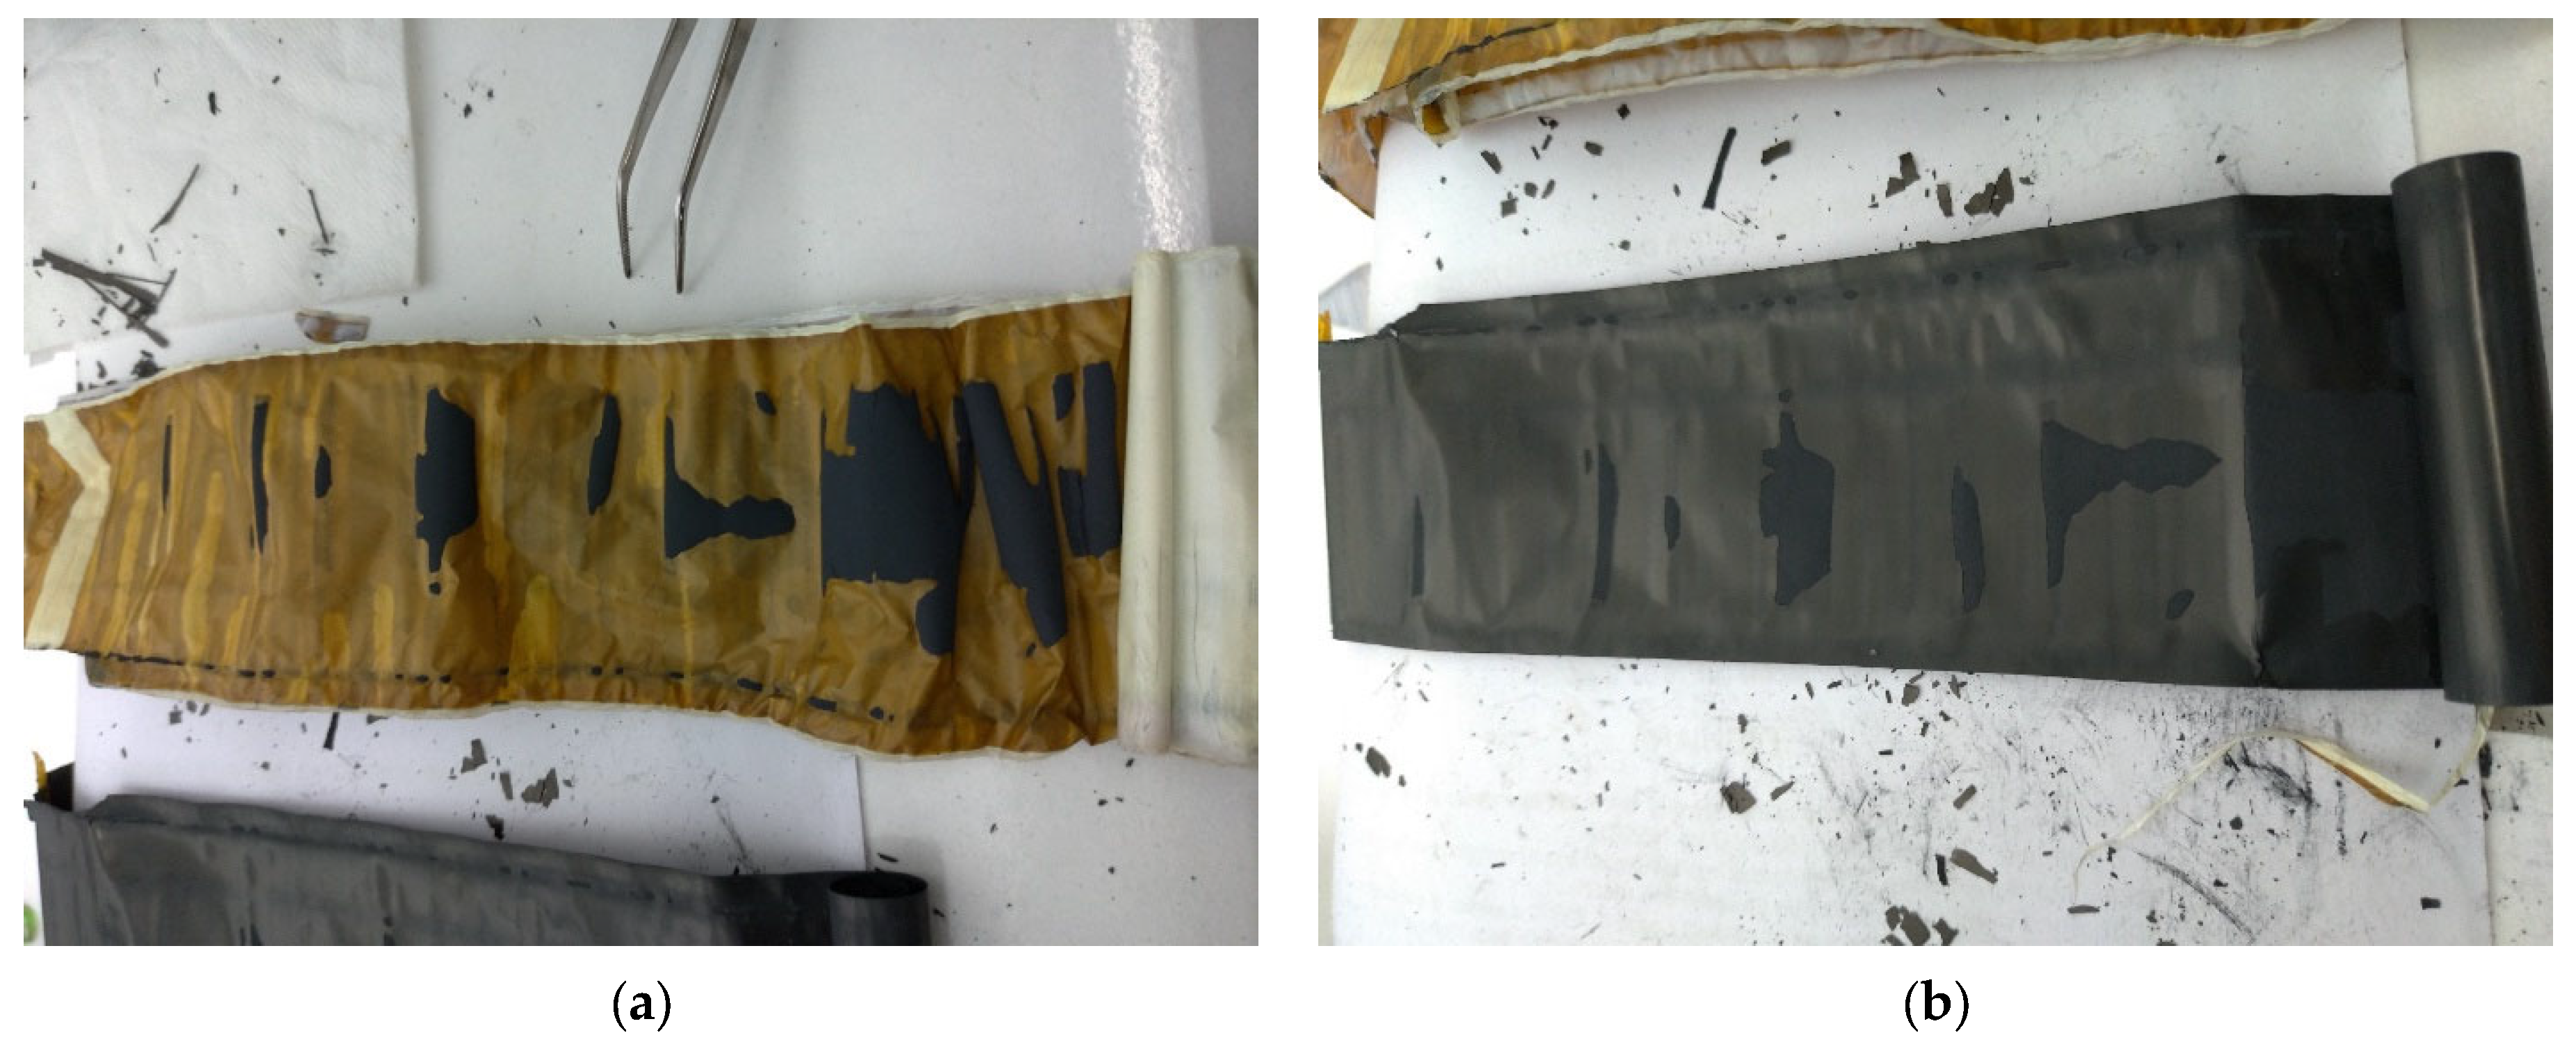
In addition to the electrical measurements, physical observation of the electrodes by a Scanning Electron Microscope (SEM), JEOL JSM-5510LV, JEOL, Tokyo, Japan, was performed both on an overcharged cell and on a new reference cell to investigate the morphological changes on the electrodes surface. To this end, the two cells were completely disassembled to isolate the jellyroll from the remaining parts of the cells: the cap, the case and the protection devices (CID and PTC). Afterward, the active components of the cell were unrolled and separated.
Figure 4 shows the separator, and the cathode layered on the aluminum collector.
2.2. Overcharge of “Unprotected” NCR18650B Li-Ion Cells
The cells without protection were tested at different currents of overcharge and at different ambient temperatures.
Table 2 summarizes the tests performed.
Dangerous events such as thermal runaway, venting phenomena, fires or explosions were avoided in all tests thanks to the intervention of the Current Interruption Device (CID). The State of Charge (SOC) reported in
Table 2 refers to the period when the power supply delivers the imposed constant current (9.6 A, 3.2 A and 1.6 A); also, the maximum temperature reported in
Table 2 refers to the period when the imposed constant current is applied.
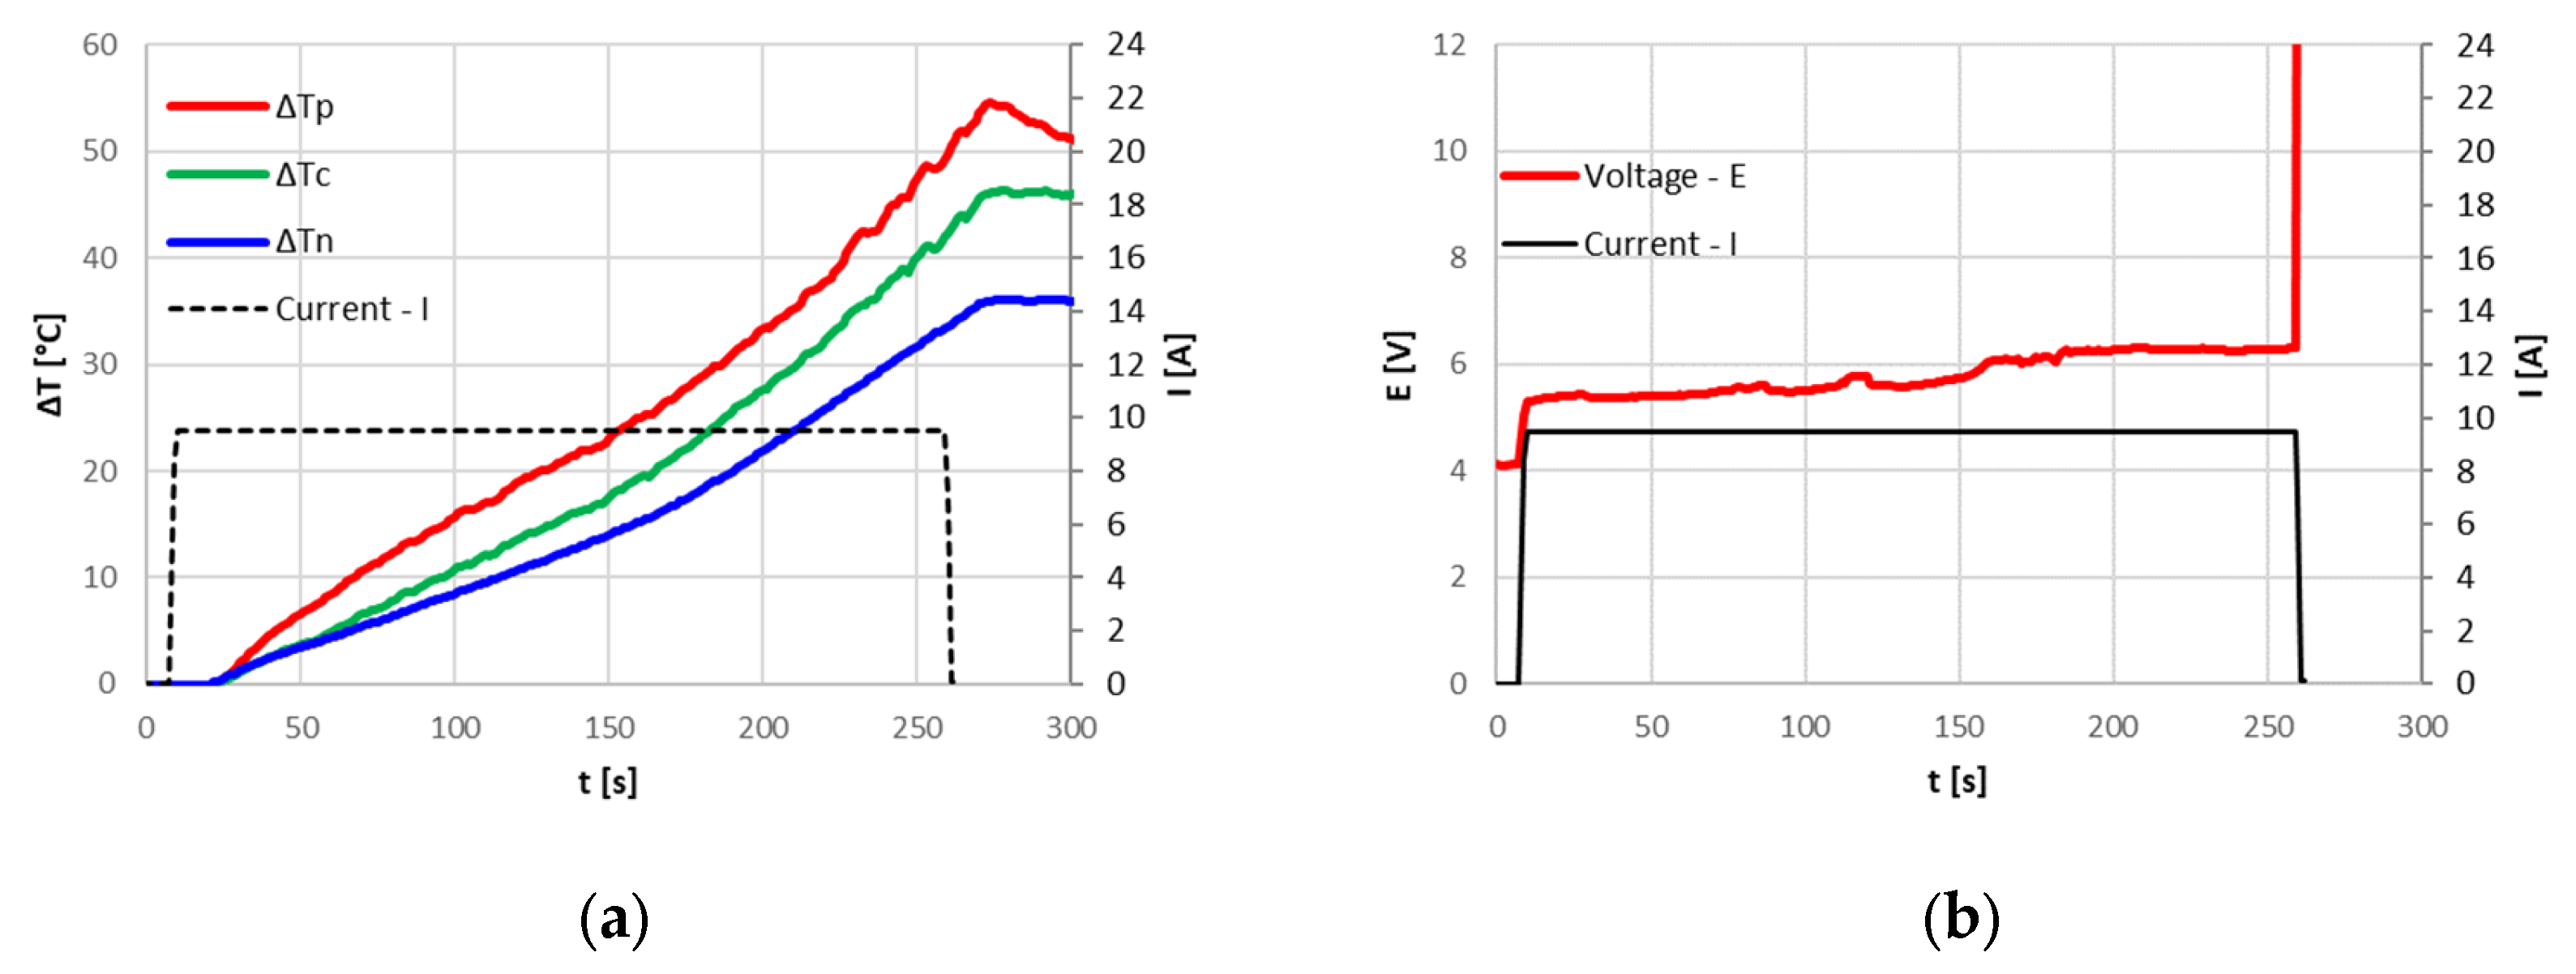
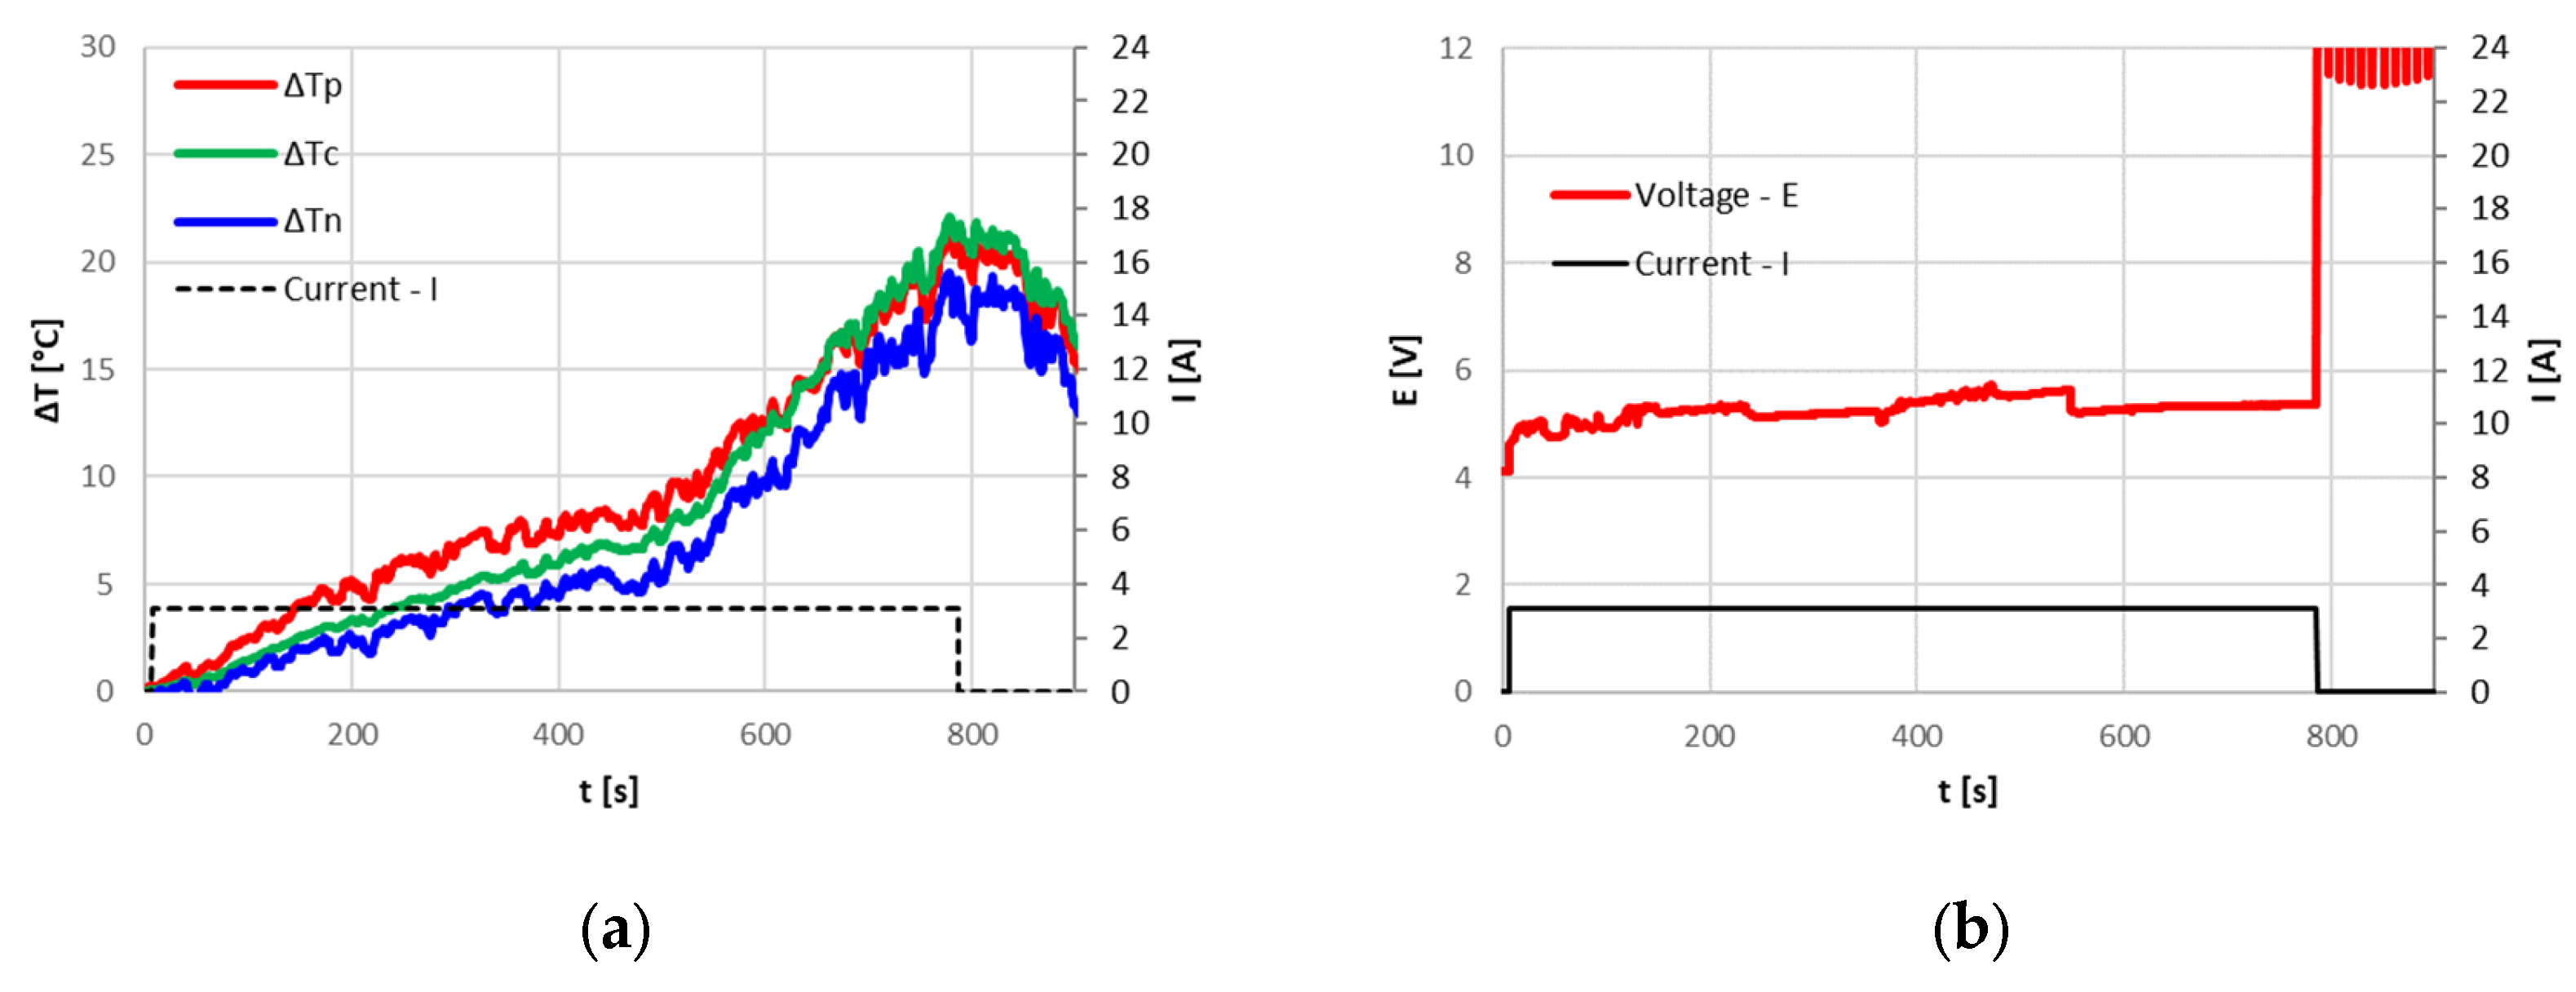
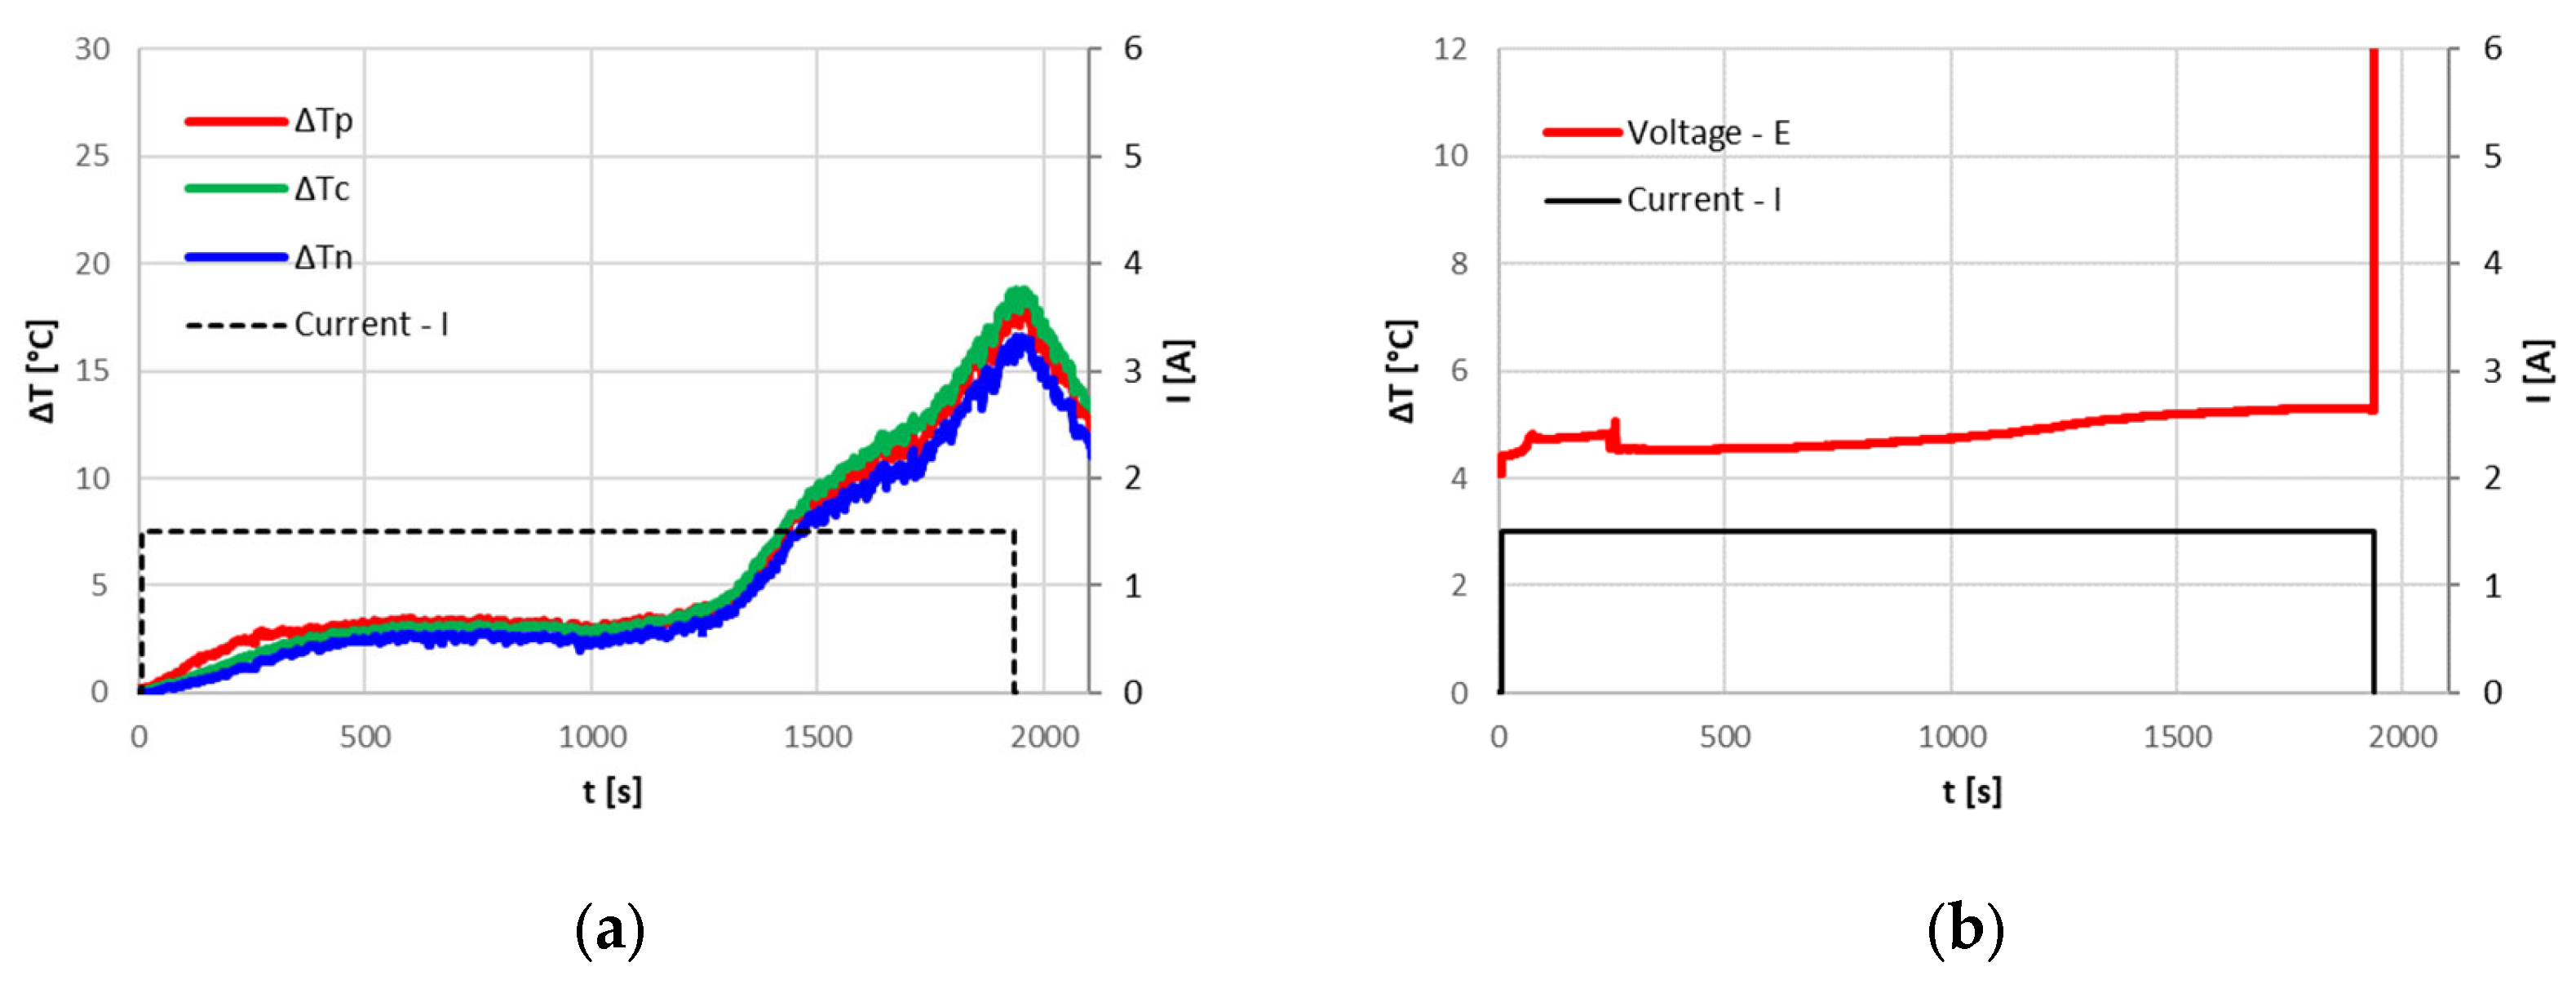
In the tests performed at the FARO plant, where the ambient temperature ranged between 15 °C and 20 °C, the CID correctly intervened, blocking overcharging. Due to the irreversibility of the CID intervention, the cells were no longer usable, and the 0 Volt measured at the terminals after the tests confirmed that the circuit was cut off. The cell temperature reached at the CID intervention depended on the applied current; a current increase leads to higher temperatures. The following
Figure 5,
Figure 6 and
Figure 7 show the temperature increase with respect to the initial temperature at the three cell locations for current values of 9.6 A (3C), 3.2 A (1C) and 1.6 A (0.5C). The CID intervened correctly in all three cases. From
Table 2, it can be seen that with lower currents, an increase in the overcharged SOC at the CID intervention is found; nonetheless, all the cells remained in a safe state.
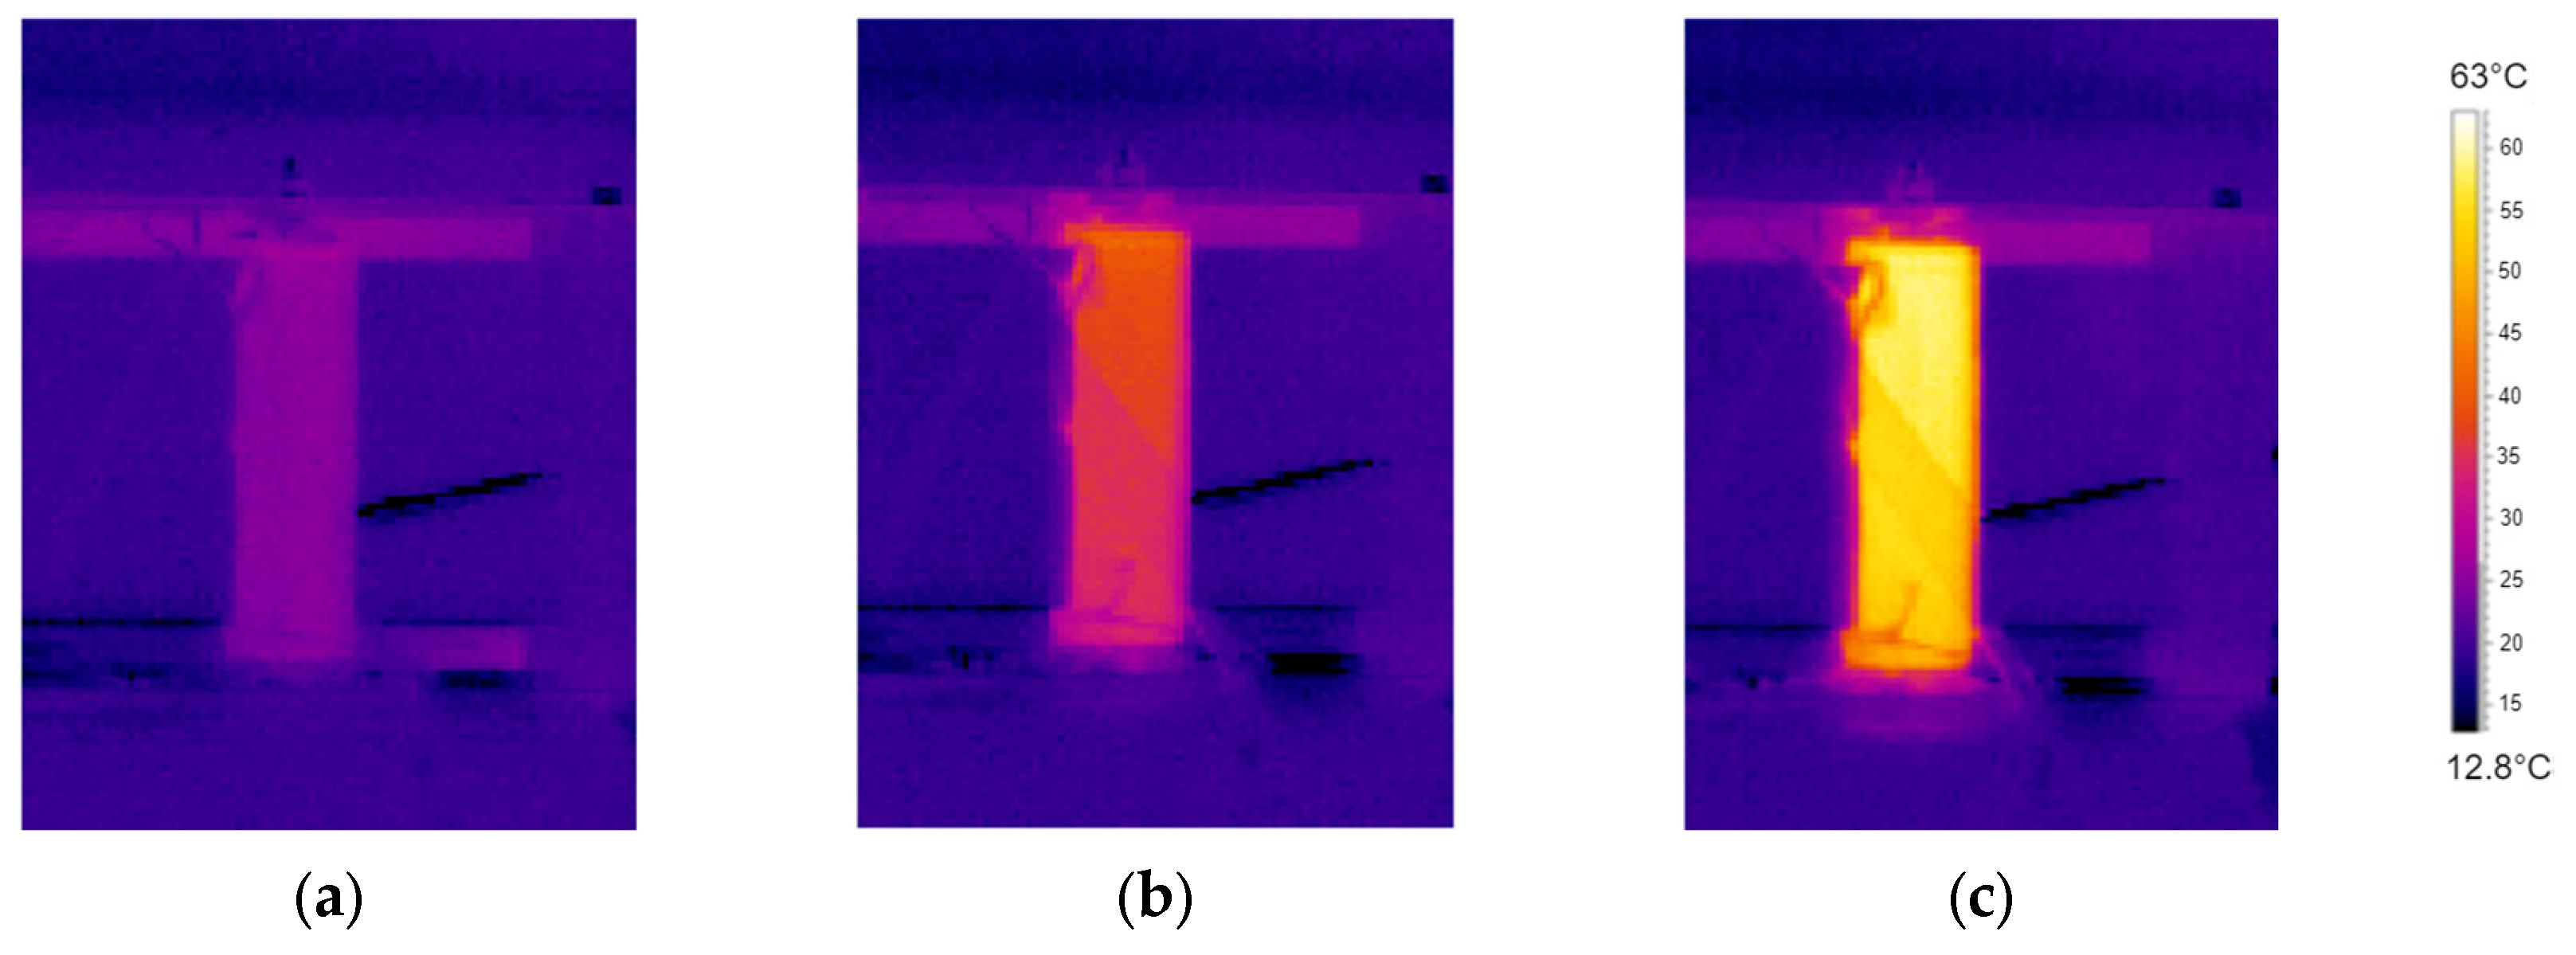
The previous graphs also demonstrate that, for higher currents, the temperature at the positive terminal rises more markedly than that at the center of the cell and at the negative terminal. As it will be discussed in the subsequent paragraphs, the presence of the CID and the PTC increases the resistance at the cell top, causing a greater energy dissipation than in other parts of the cell, as already found by Menale et al. [
24] by thermal infrared camera measurements (
Figure 8).
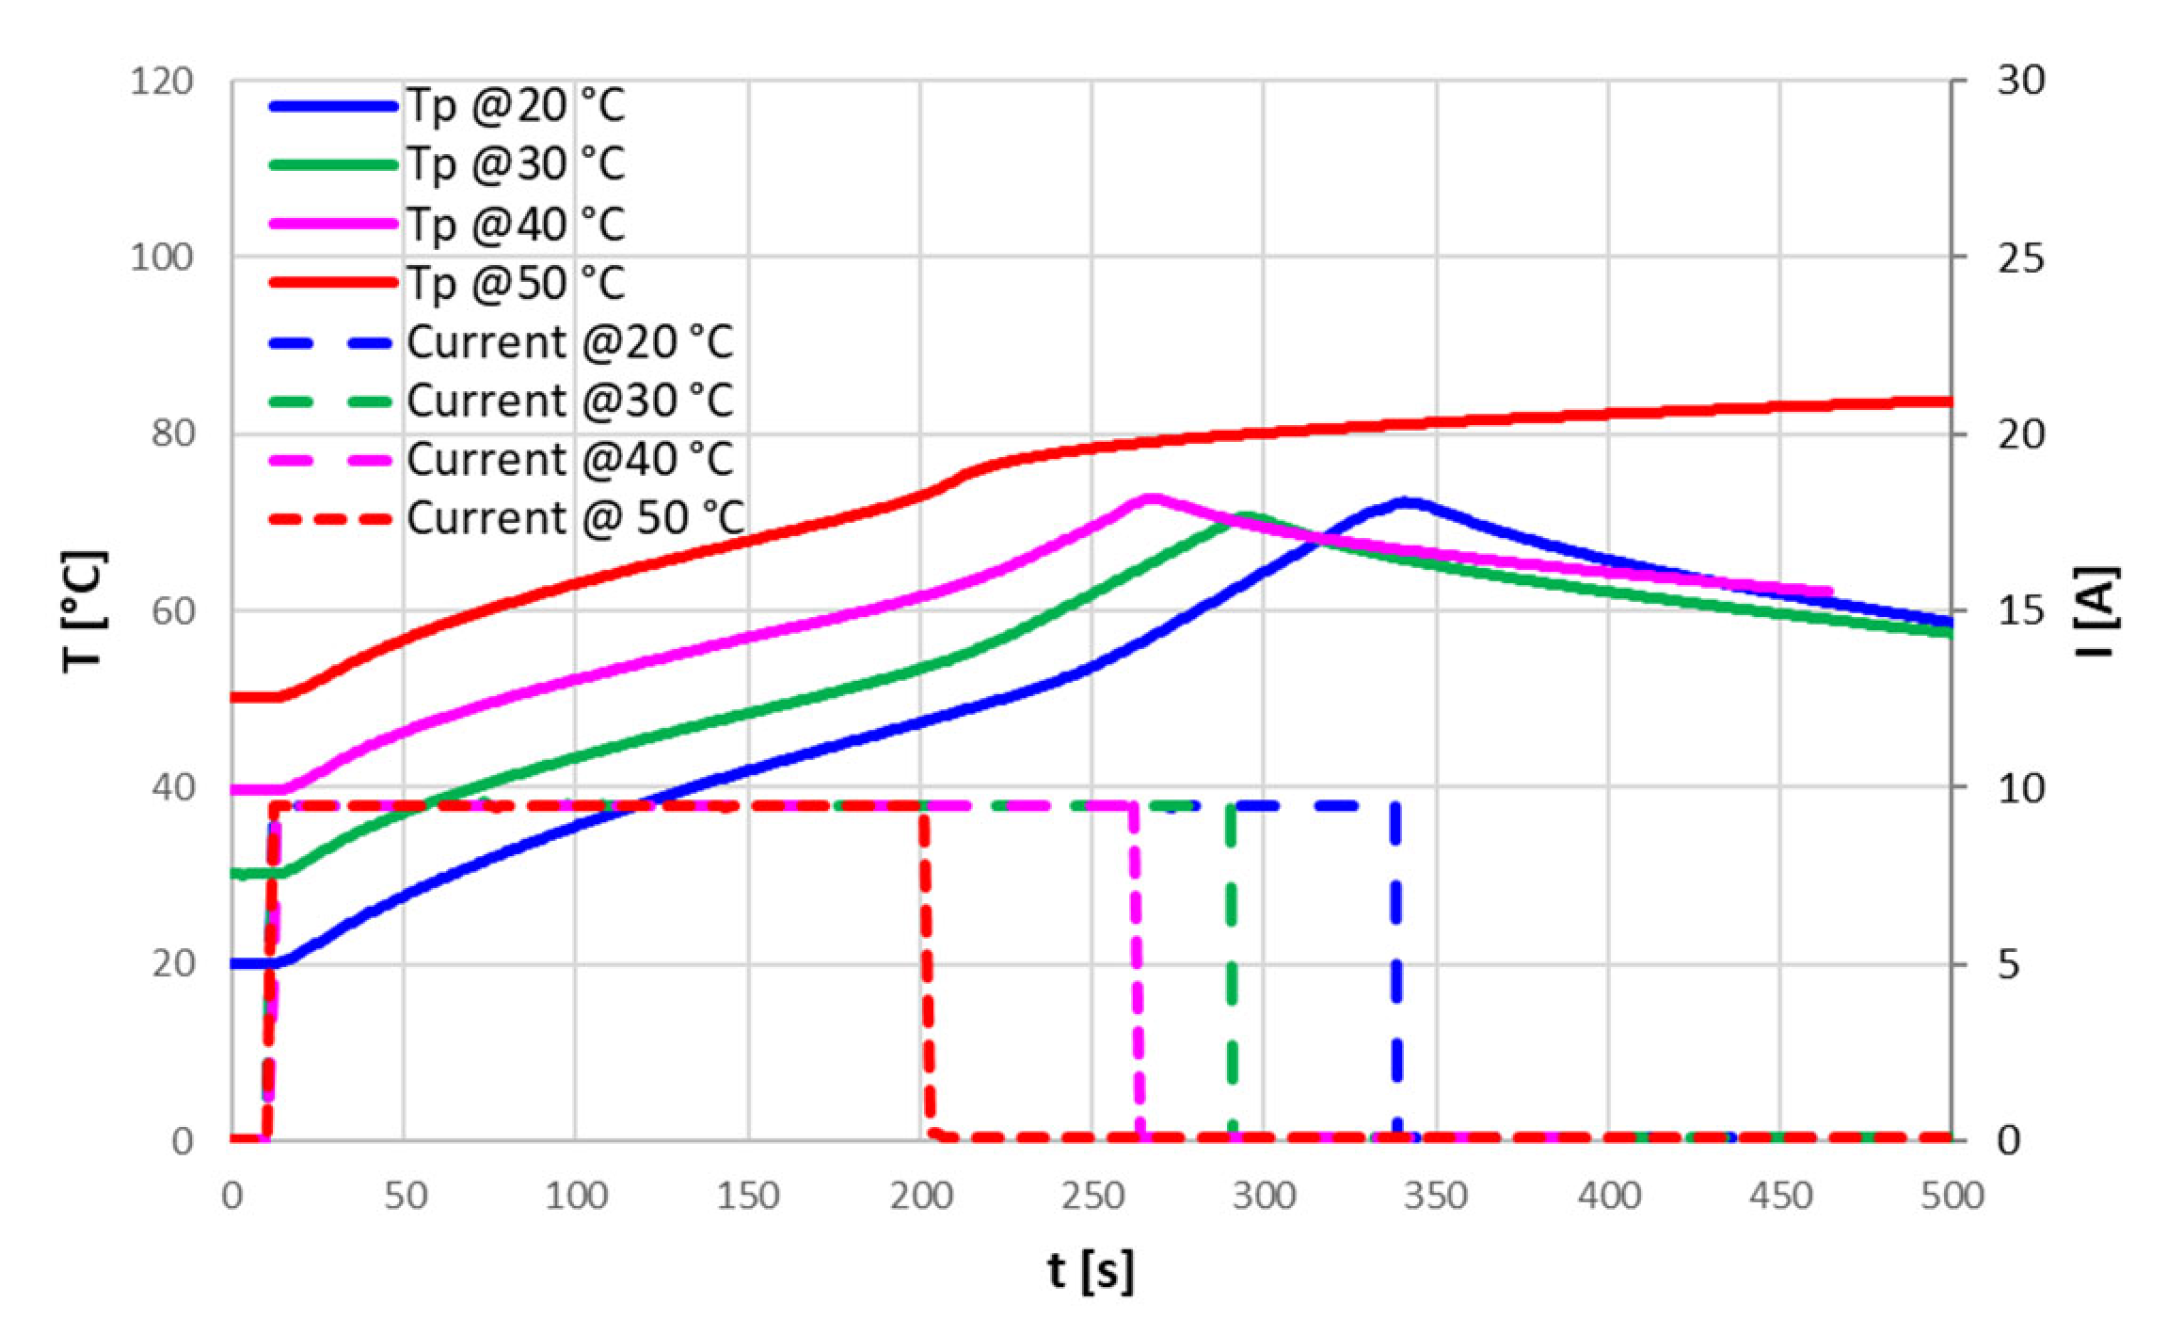
By setting different ambient temperatures inside the climate chamber for a current of 9.6 A (3C), the CID intervention is always triggered at a temperature of the positive contactor of about 70 °C (
Figure 9). The time when the CID is triggered increases at lower ambient temperatures, leading to an increase of overcharged SOC.
These tests proved that the CID properly operates to protect the cell from overcharge when the temperature rises above about 70 °C, or, for low currents where the temperatures do not reach high values, when the SOC achieves critical values.
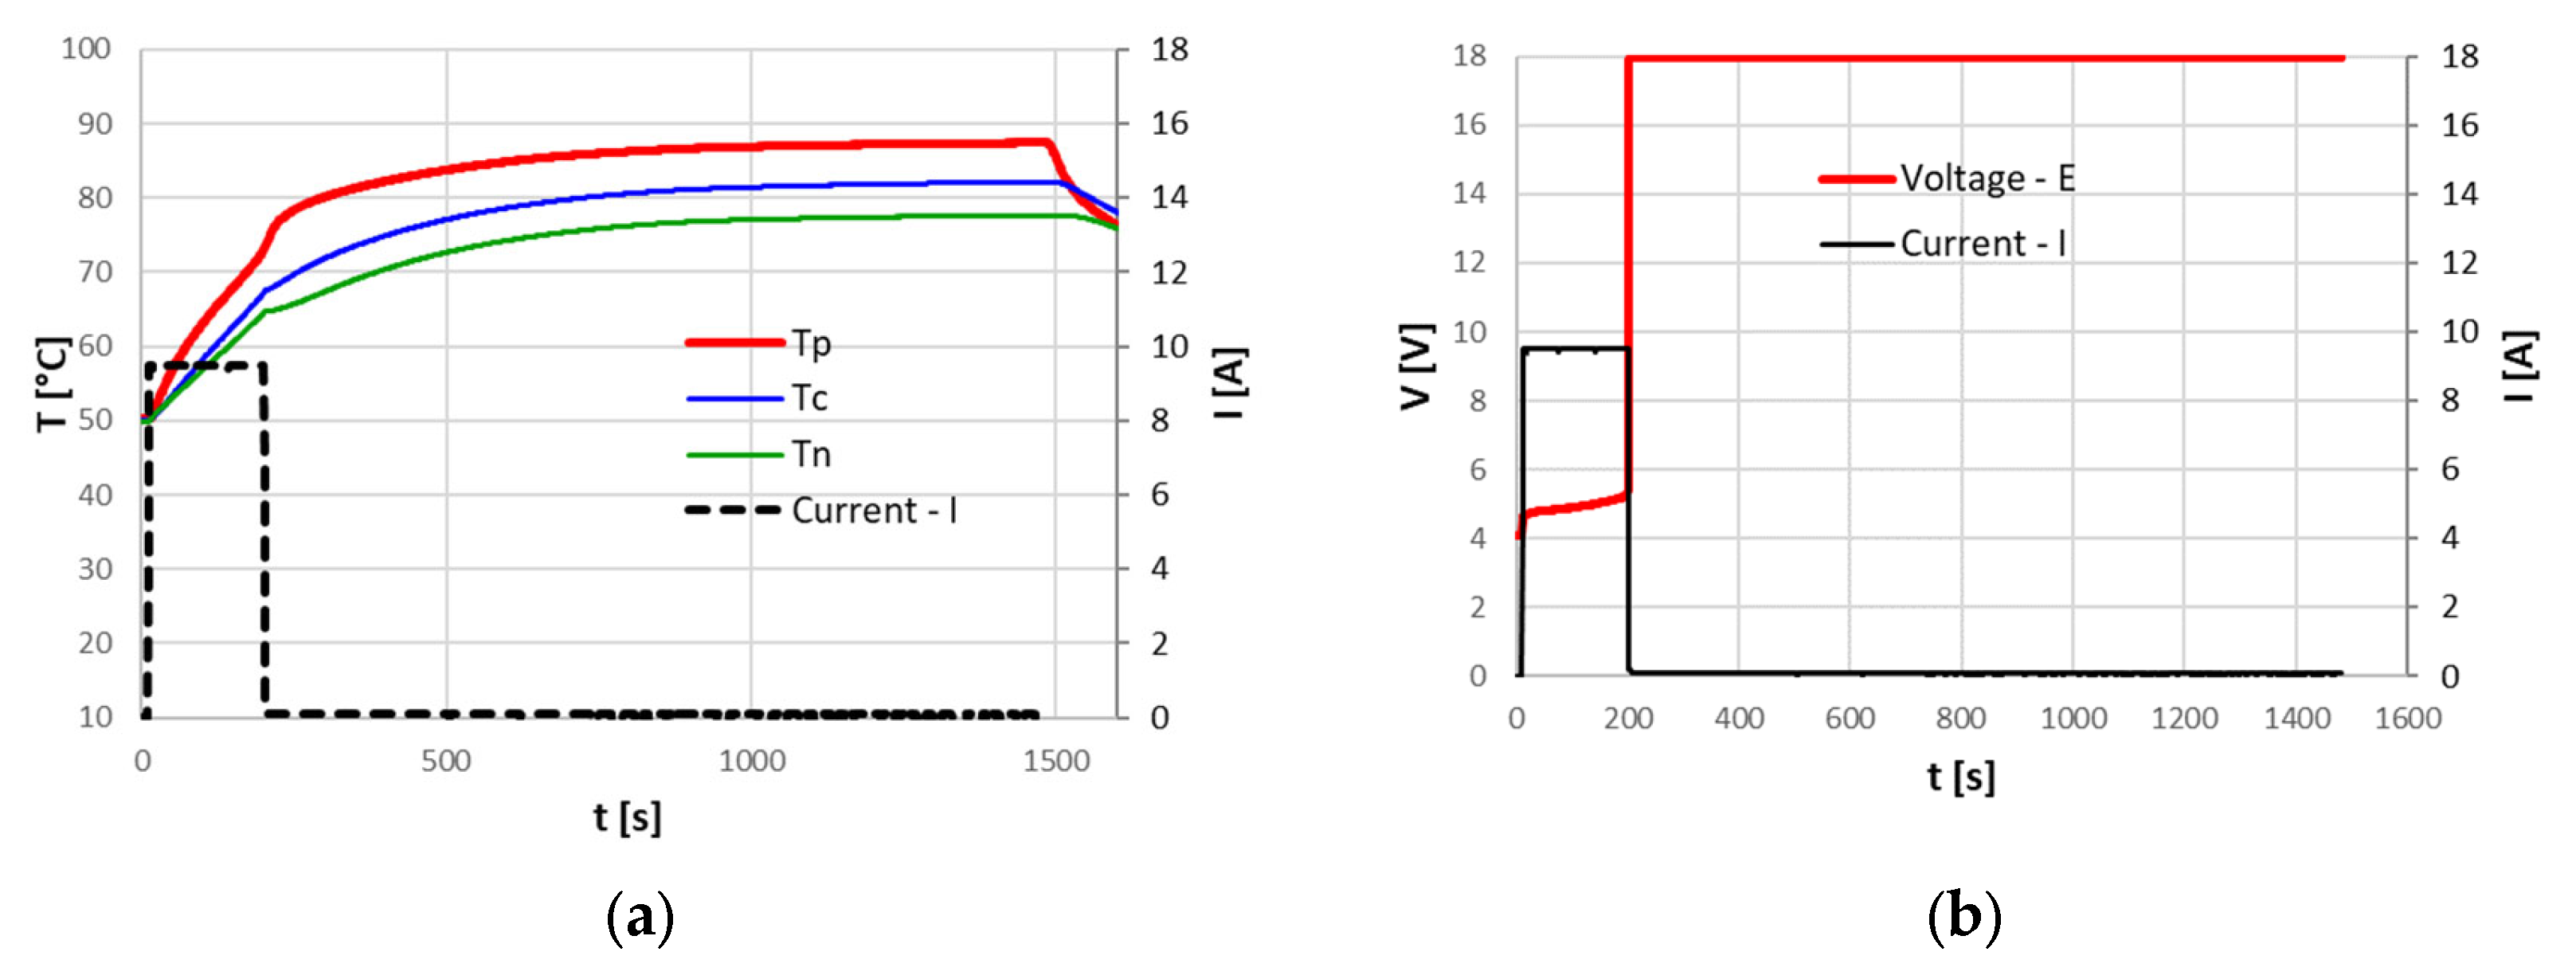
Despite no serious events being recorded in the open air or in the climate chamber, where the pressure sensor never detected a pressure increase that could be related to a venting phenomenon, at 50 °C ambient temperature, an inadequate intervention of the CID was noticed. In fact, as shown in
Figure 10, at the limiting temperature of about 70 °C the current decreases, as in all the other cases, indicating the CID intervention, but the temperature continues to rise until reaching a plateau at 87 °C. The temperature decreases only when the cycler is finally switched off. This behavior highlights that a small current (of the order of tens of mA) continues to flow inside the cells when the cycler reaches its saturation voltage, 18 V, confirming an inadequate CID opening. The same test with an initial temperature of 50 °C and an overcharge current of 9.6 A (3C) was repeated on the other cells, always obtaining similar results.
As the current decreases, the temperature gradient at the positive terminal of the cell increases, while it decreases at the locations of the other two thermocouples. This indicates a localized increase in resistance at the positive terminal, resulting in heat generation at this specific point. In the remaining parts of the cell, the low current intensity and the assumed constant resistance of the active elements did not lead to an increase in the temperature gradient; instead, a decrease was observed. Therefore, it is hypothesized that the subsequent temperature rise in this region of the cell might be due to the propagation of heat generated at the positive terminal. Initially, since the cell voltage at the end of the abuse was different from 0, it was supposed that the PTC intervened instead of the CID. This hypothesis is however incorrect since, as explained in the next section, the PTC operation is reversible and its triggering temperature is over 115 °C. Possible explanations for the increase in the resistance at the positive terminal might be proposed; however, validating these hypotheses would require Computed Tomography (CT) analysis at varying temperatures to directly observe the internal changes within the cell. This evaluation; however, would be outside the scope of the present study.
2.3. Overcharge of “Protected” NCR18650B Li-Ion Cells
Three overcharge abuse tests were performed on commercial cell NCR18650B labeled as “protected”, i.e., equipped with a protection circuit board (PCB), to assess the effectiveness of this device against overcharge:
Charge with a current of 9.6 A (3C), with a maximum voltage of 18 V allowed by the cycler (maximum limit of the instrument).
Charge with a current of 3.2 A (1C), with a maximum voltage of 6 V allowed by the cycler.
Discharge with a current of 3.2 A (1C) until 80% of SOC and then charge with a current of 3.2 A (1C).
In each of the three tests, the PCB adequately intervened by blocking the current absorption by the already charged cells, thus avoiding irreversible damage.
In the case of the “unprotected” cells, the intervention of the CID made it impossible to restore cell operation because of the irreversible circuit cutoff. On the contrary, for the “protected” cell, the intervention of the PCB is reversible; in case of overcharge, the device blocks the current absorption, still allowing a possible subsequent discharge. Thanks to this, the last test was carried out discharging the cell to 80% SOC and then charging the cell to reach the cell overcharge state to check when the PCB interrupts the overcharge.
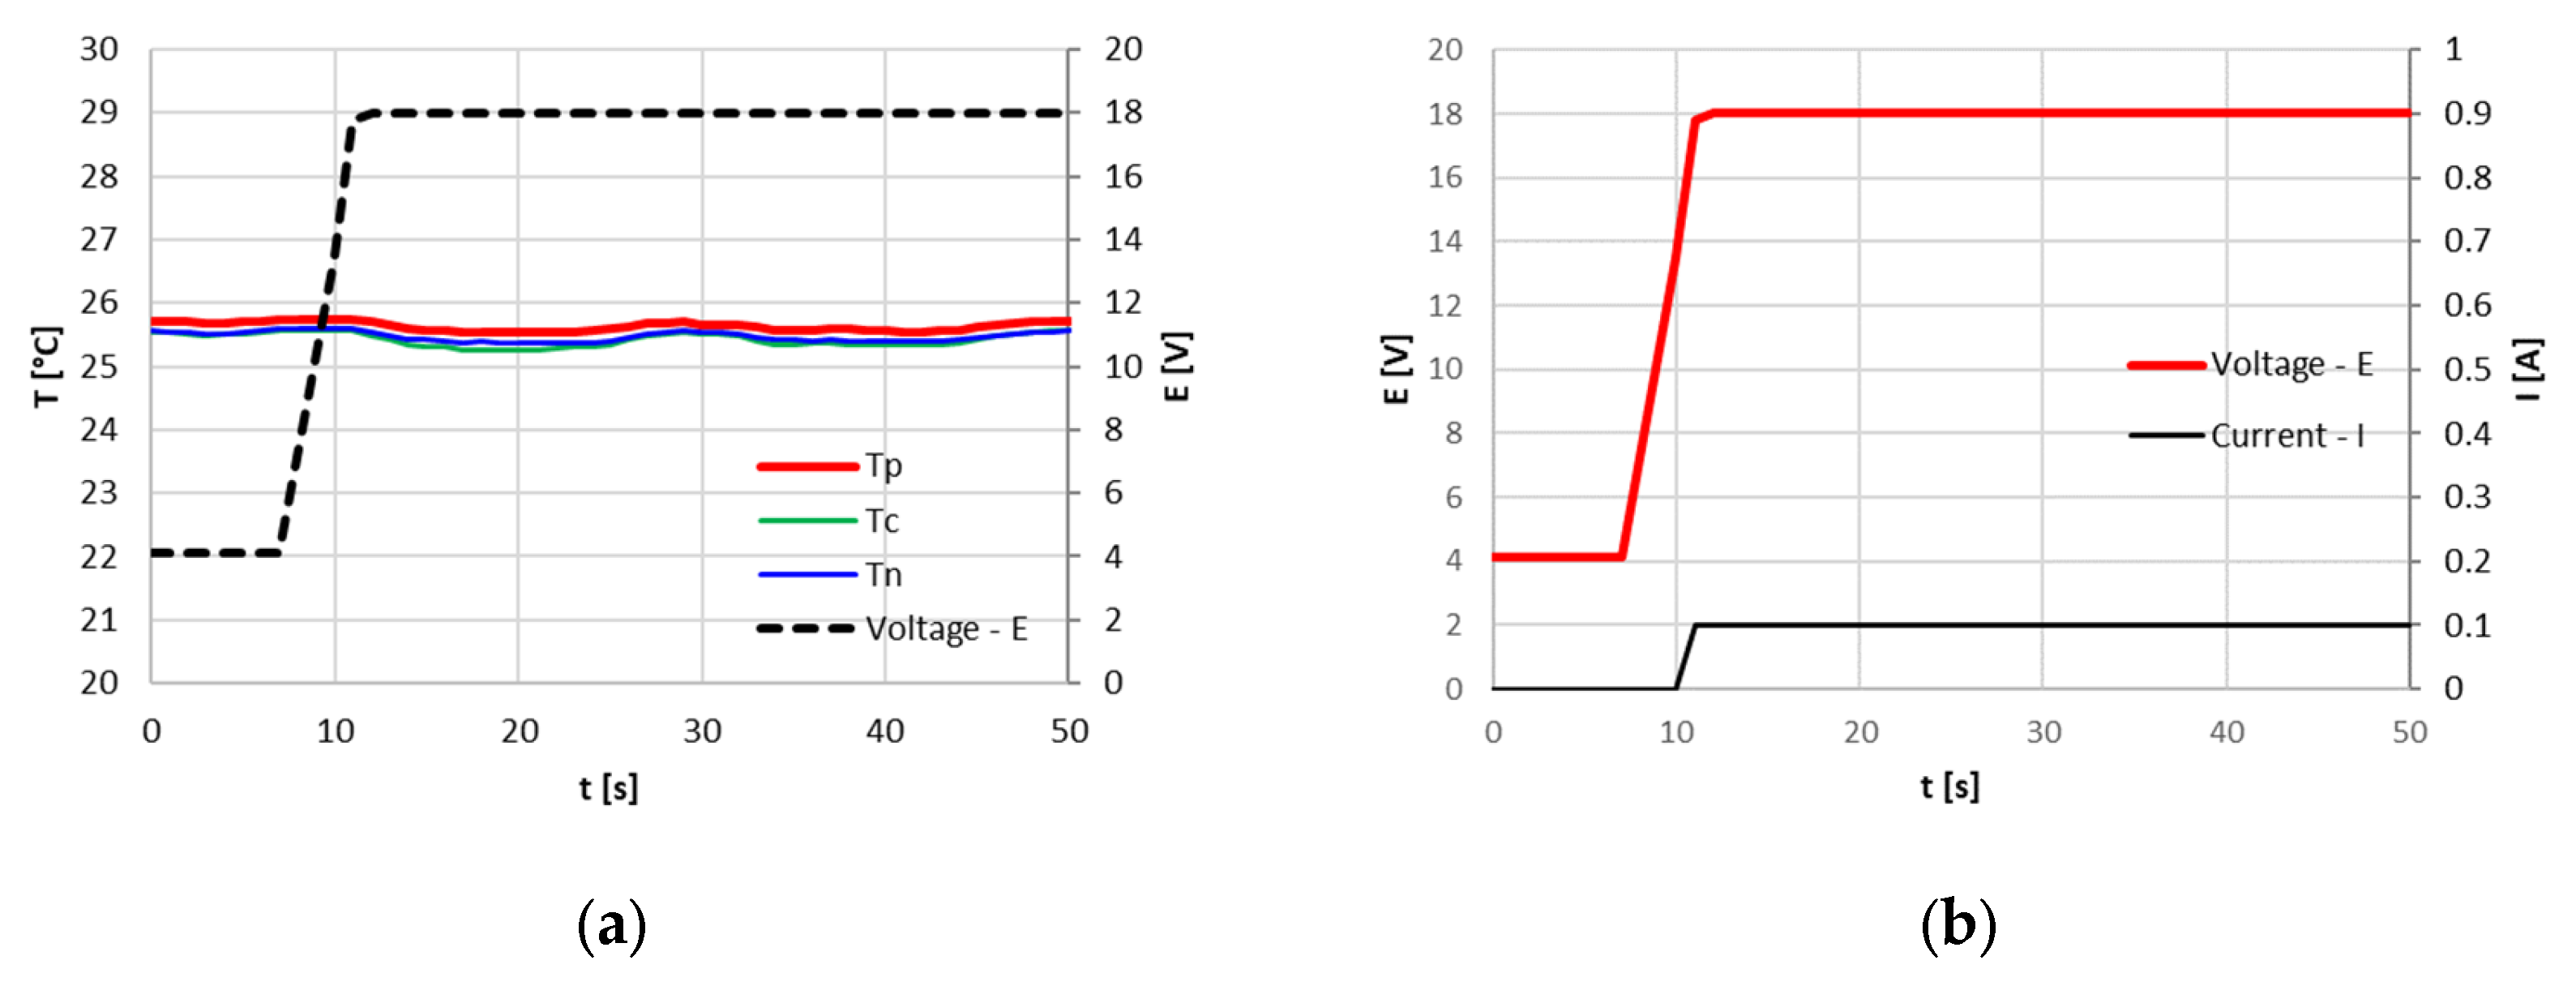
Both the attempts to overcharge the cell from 100% SOC, the first one with a current of 9.6 A (3C) and the second one with a current of 3.2 A (1C), resulted in the immediate PCB intervention that cut off the circuit, pushing the cycler voltage at its limit of 18 V, as shown in
Figure 11 and
Figure 12. In these cases, the target current was never achieved due to the fast response of the PCB device.
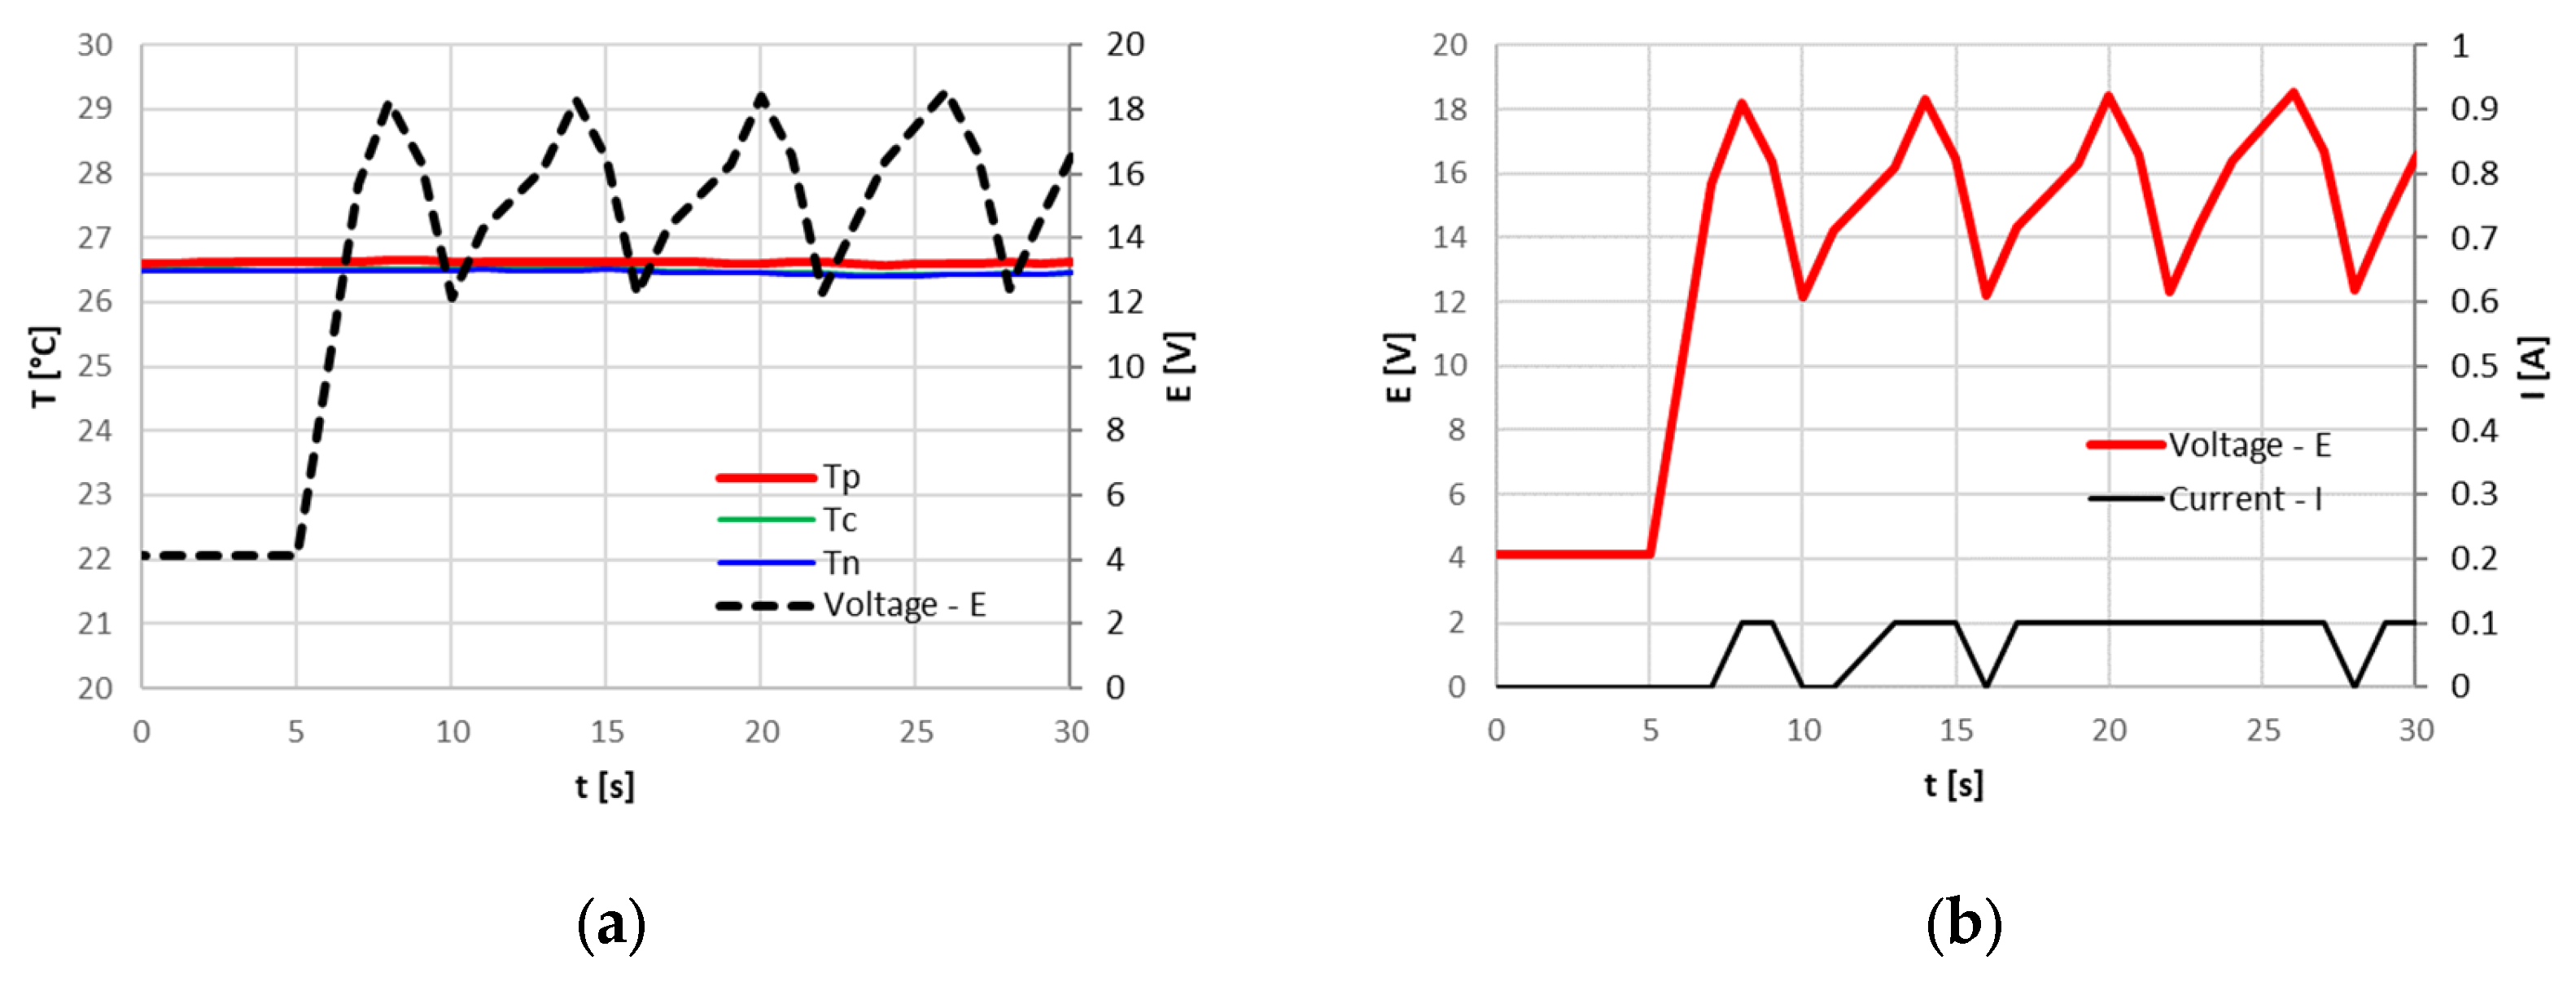
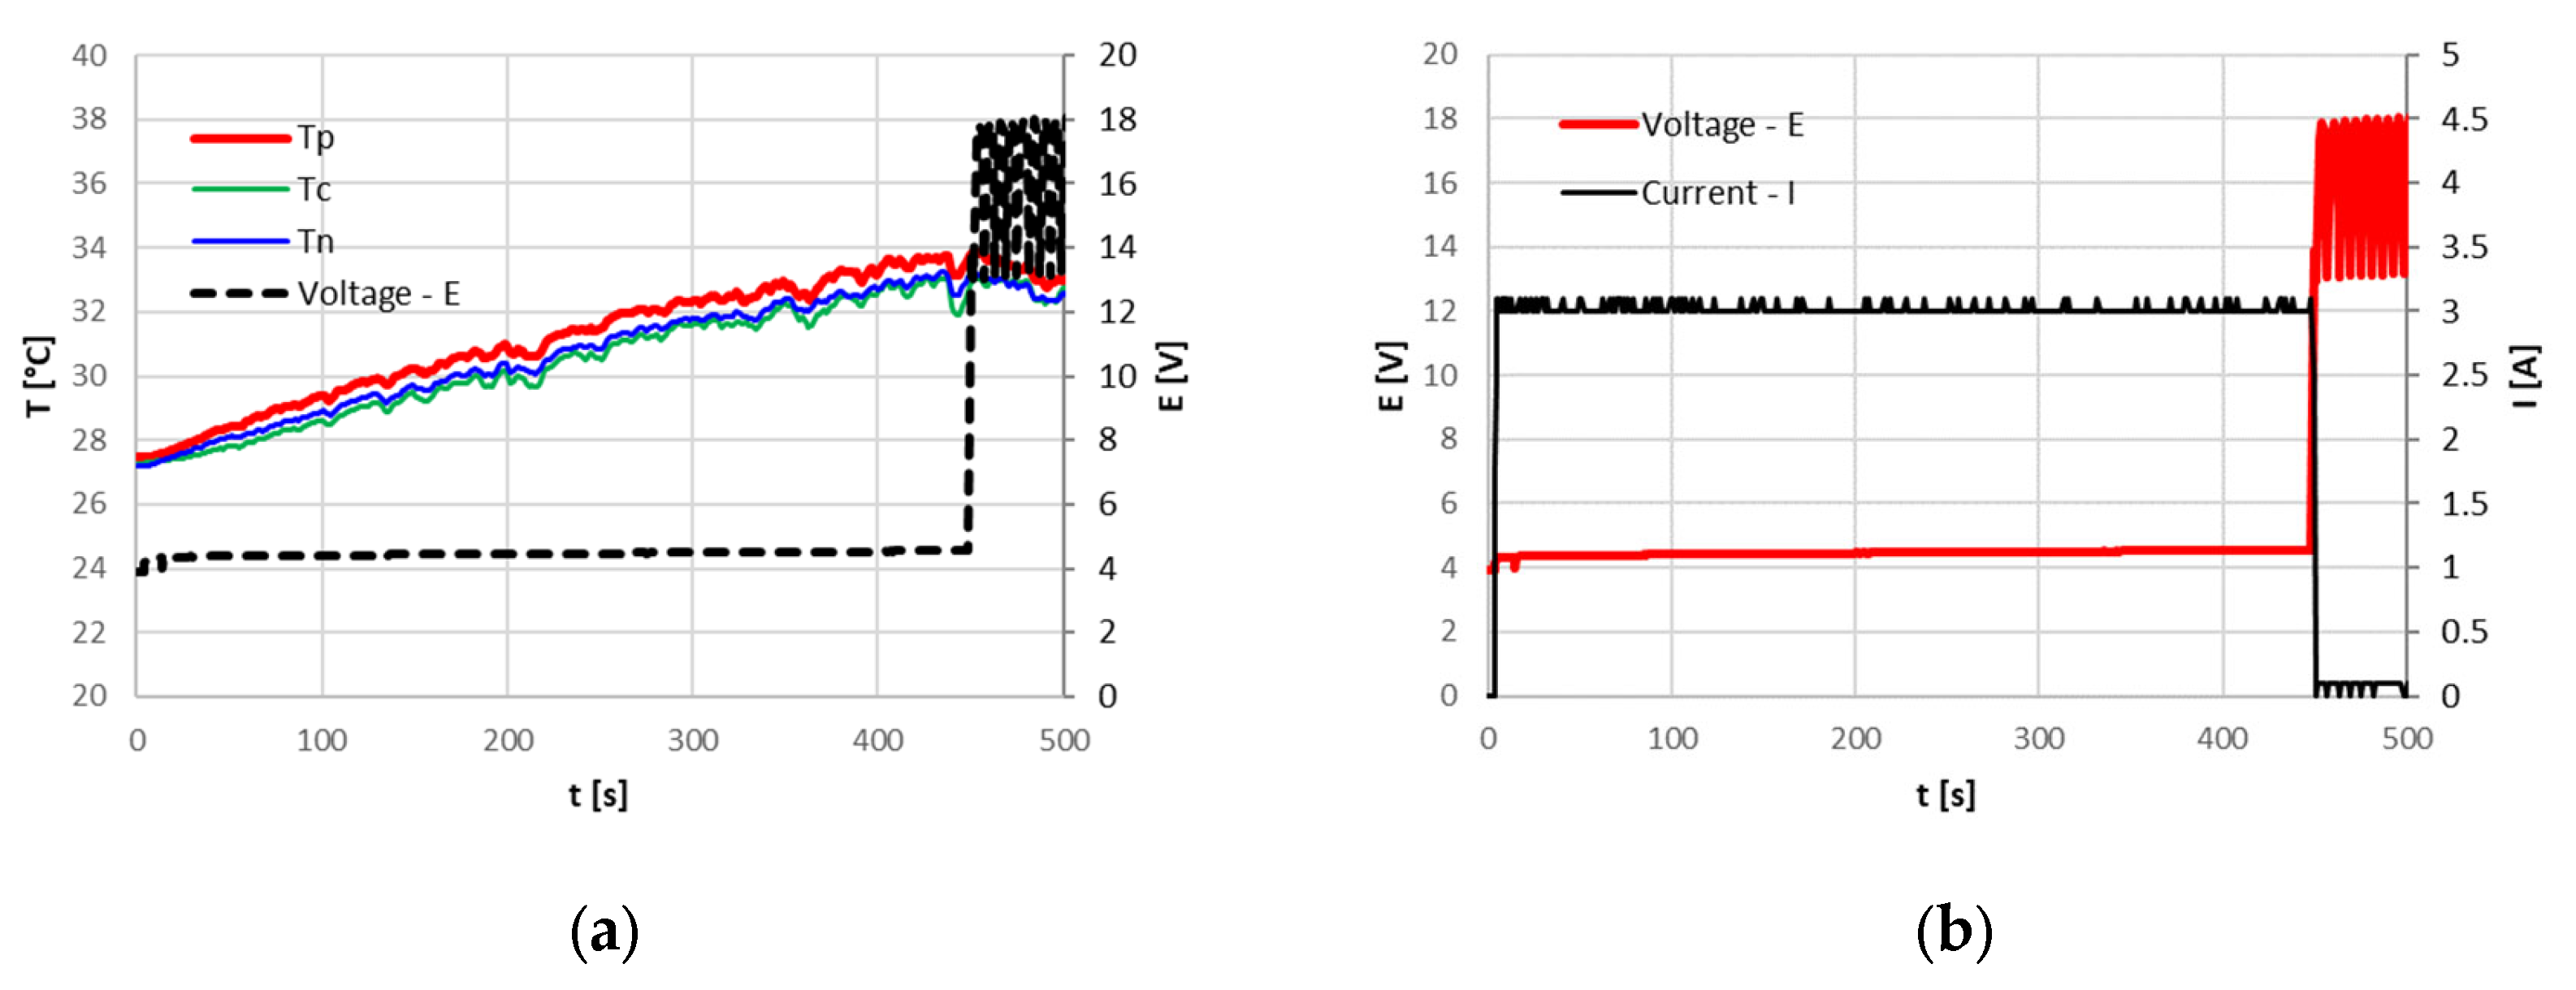
In the last test, the cell was discharged at 80% SOC with a current of 3.2 A (1C) and then charged with a current of 3.2 A (1C), as shown in
Figure 13. Charging ends when the cycler reaches 4.55 V. The constant current mode of charging results in less charge accumulated by the cells with reference to the CC-CV charge used for the cell initial cycles, probably because the PCB intervention is based on voltage limits.
2.4. SEM Analysis
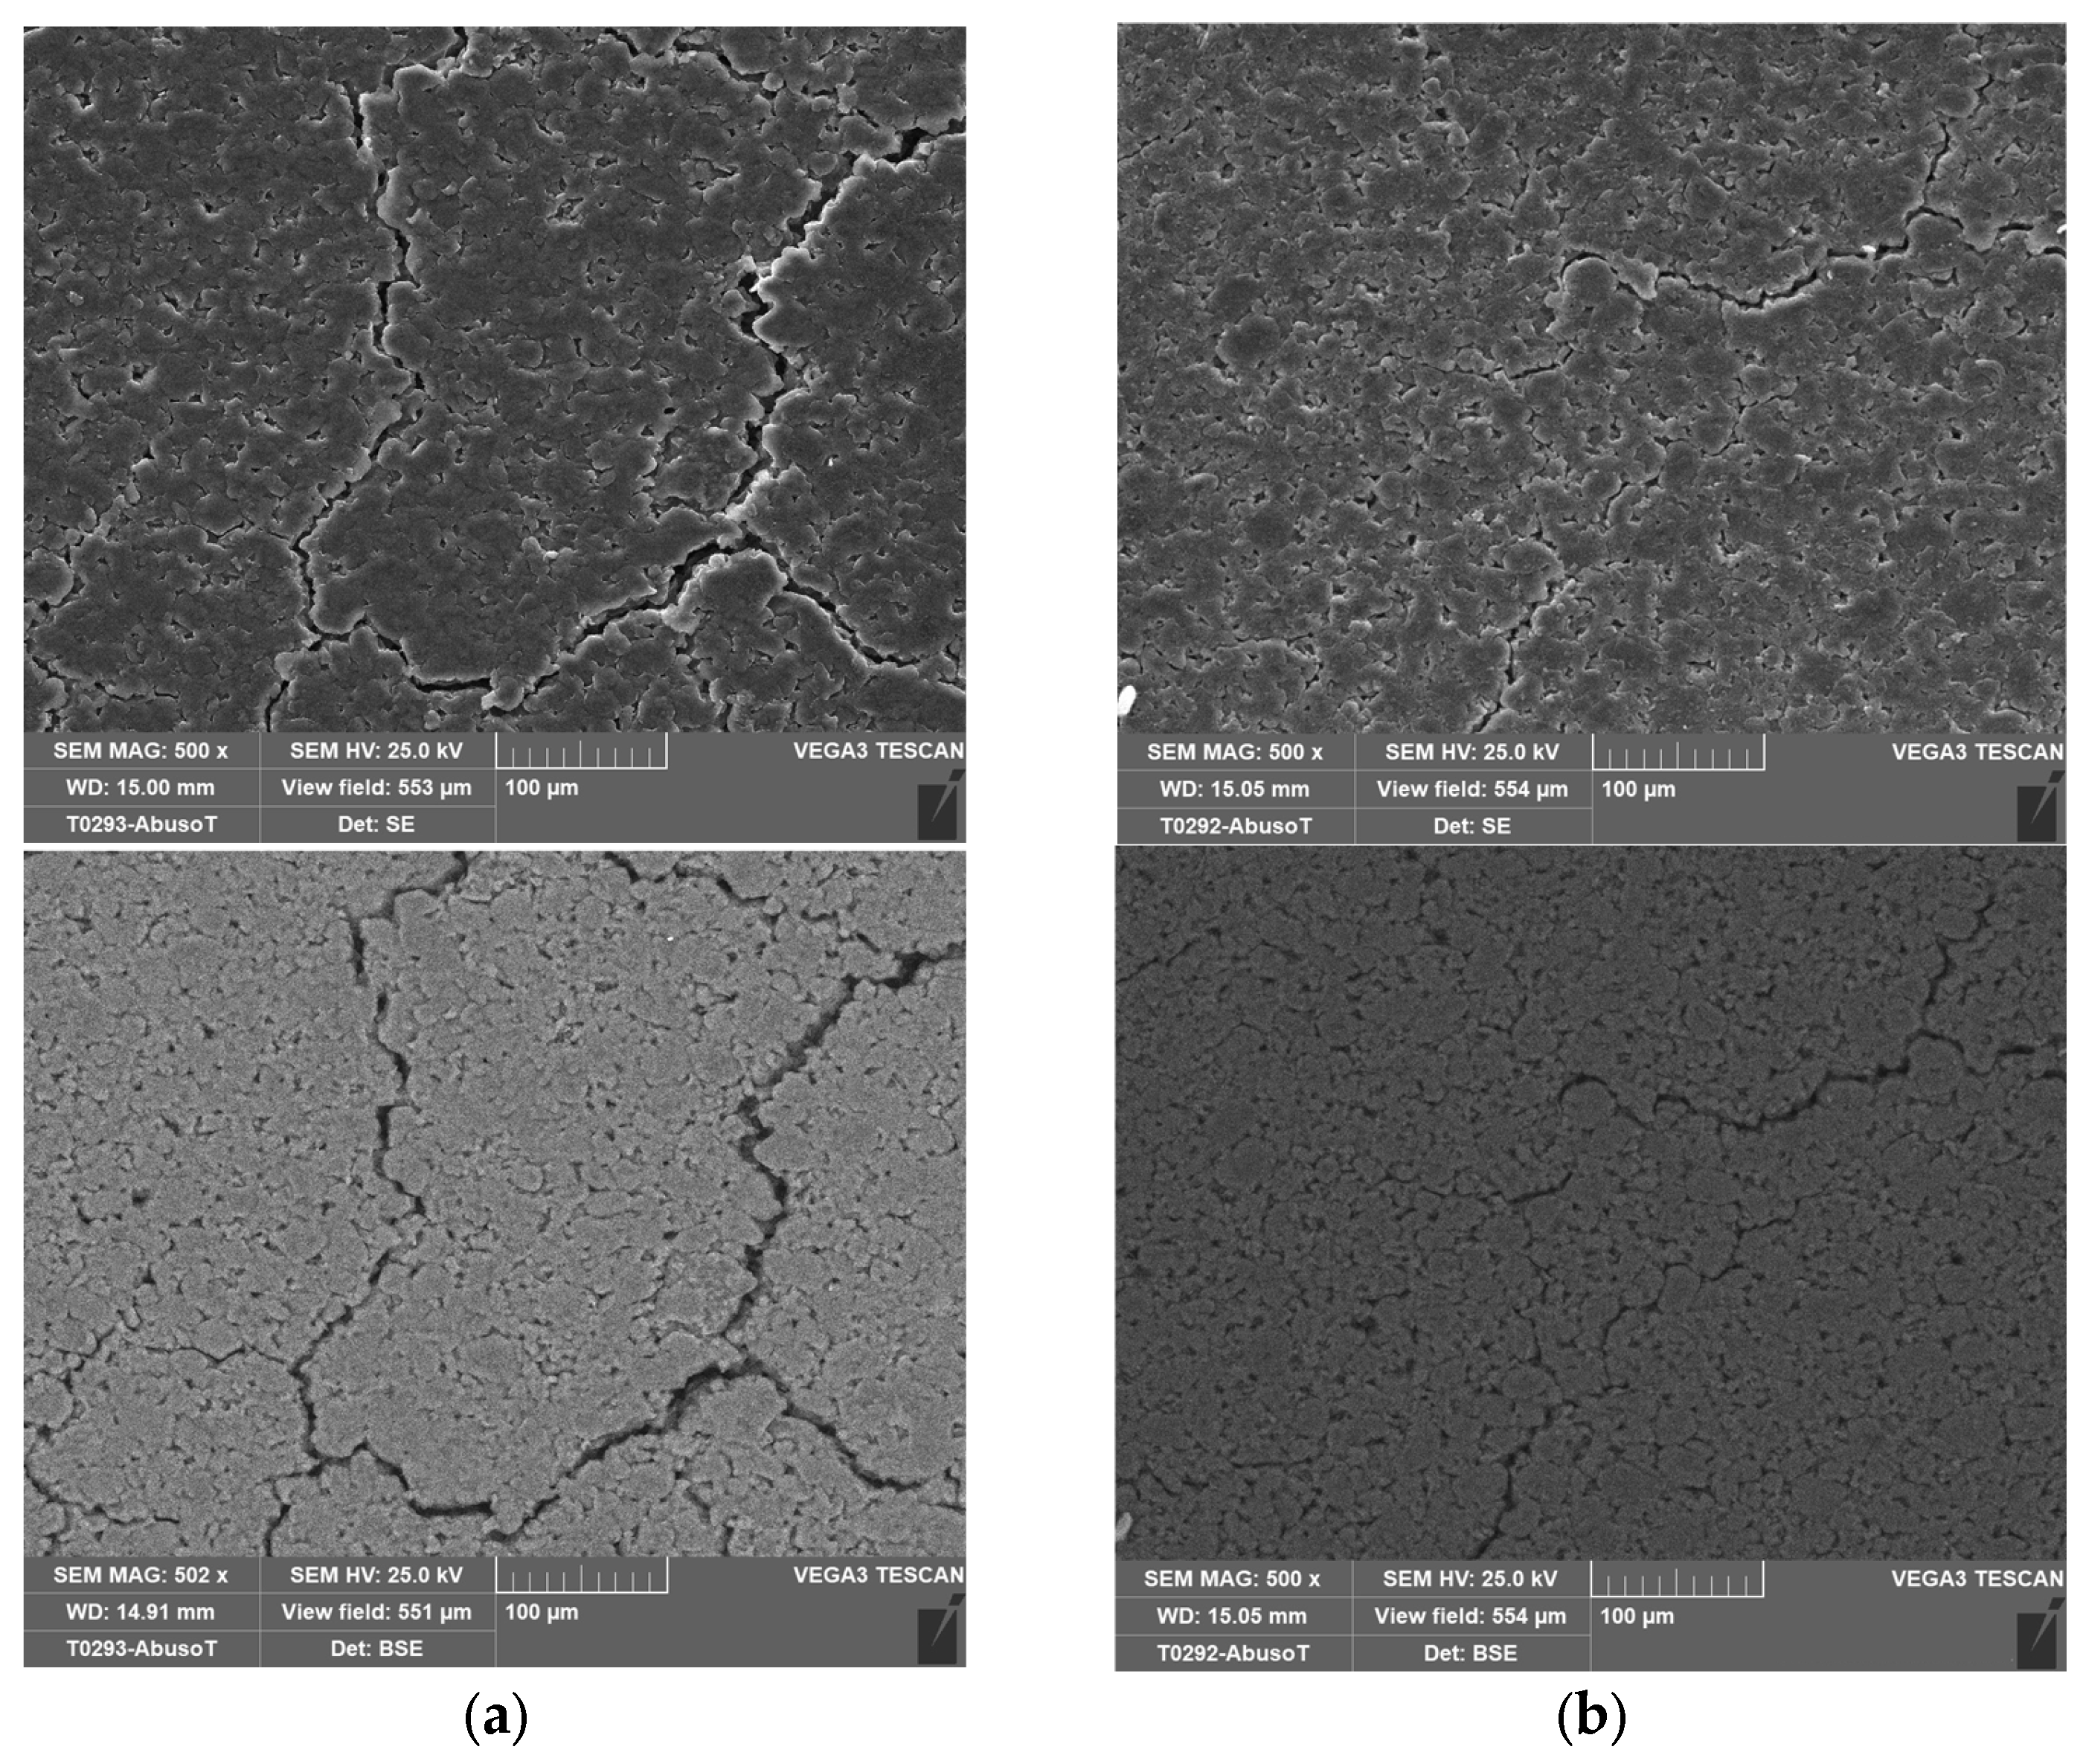
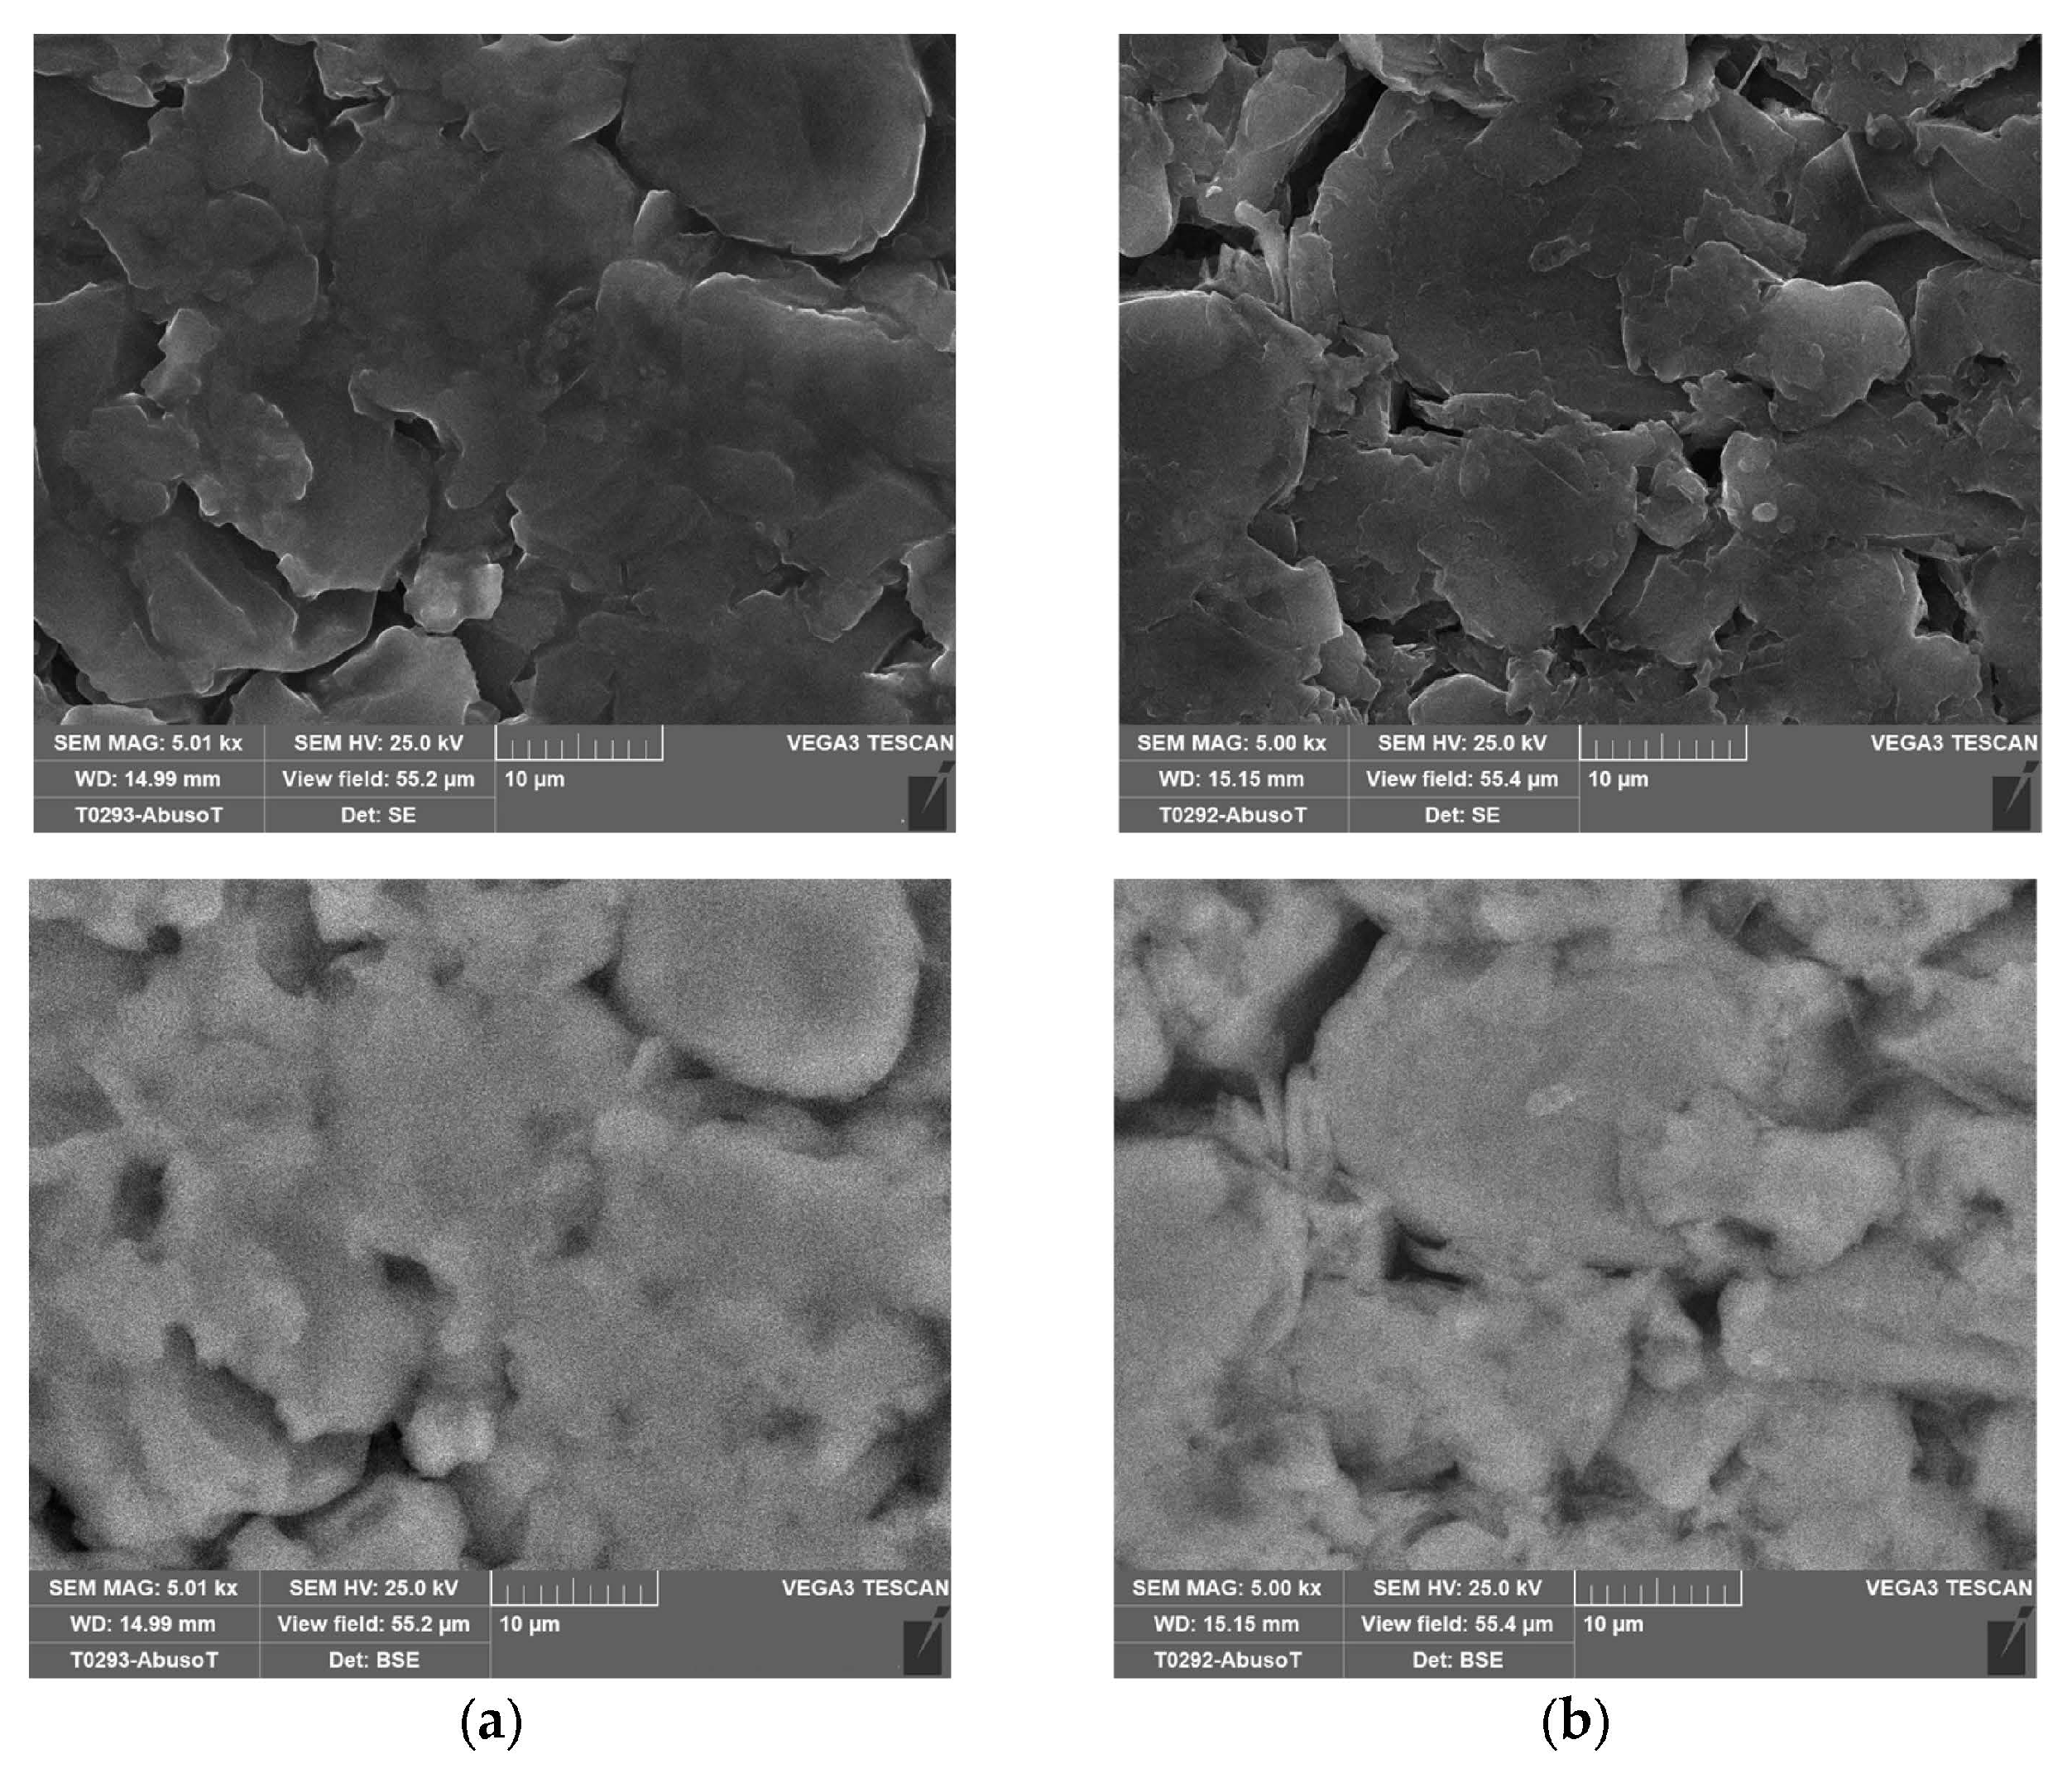
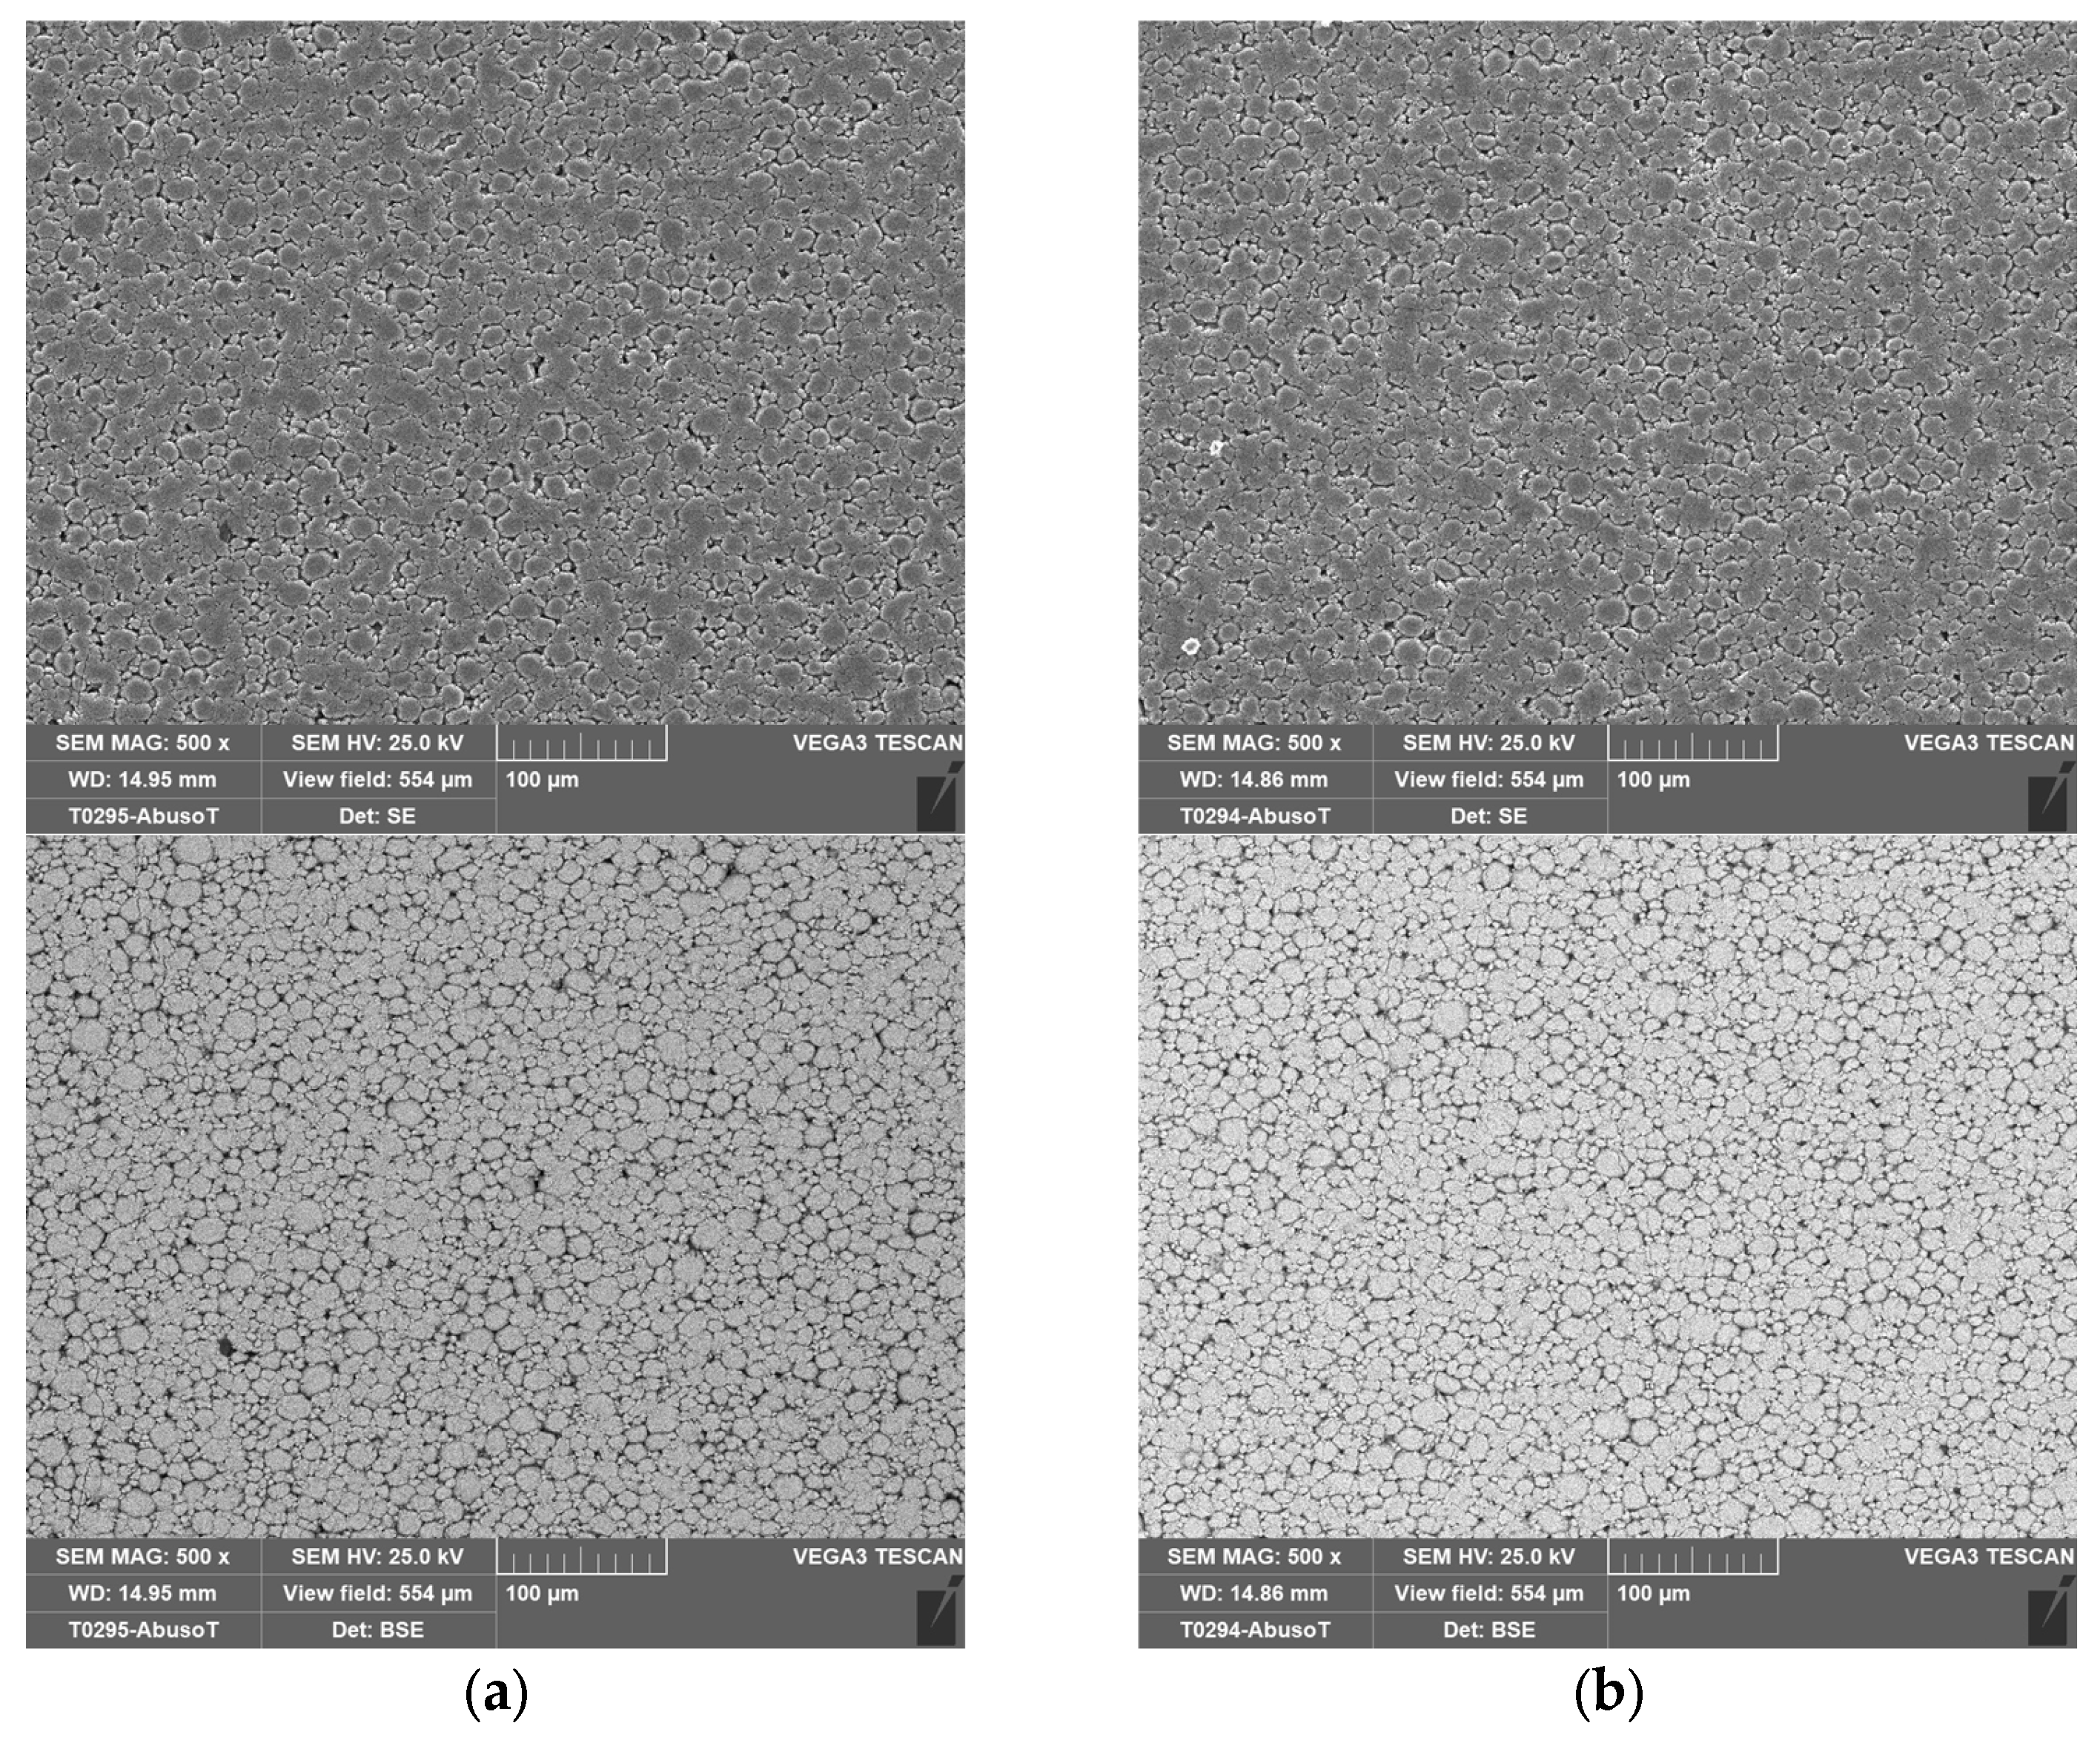
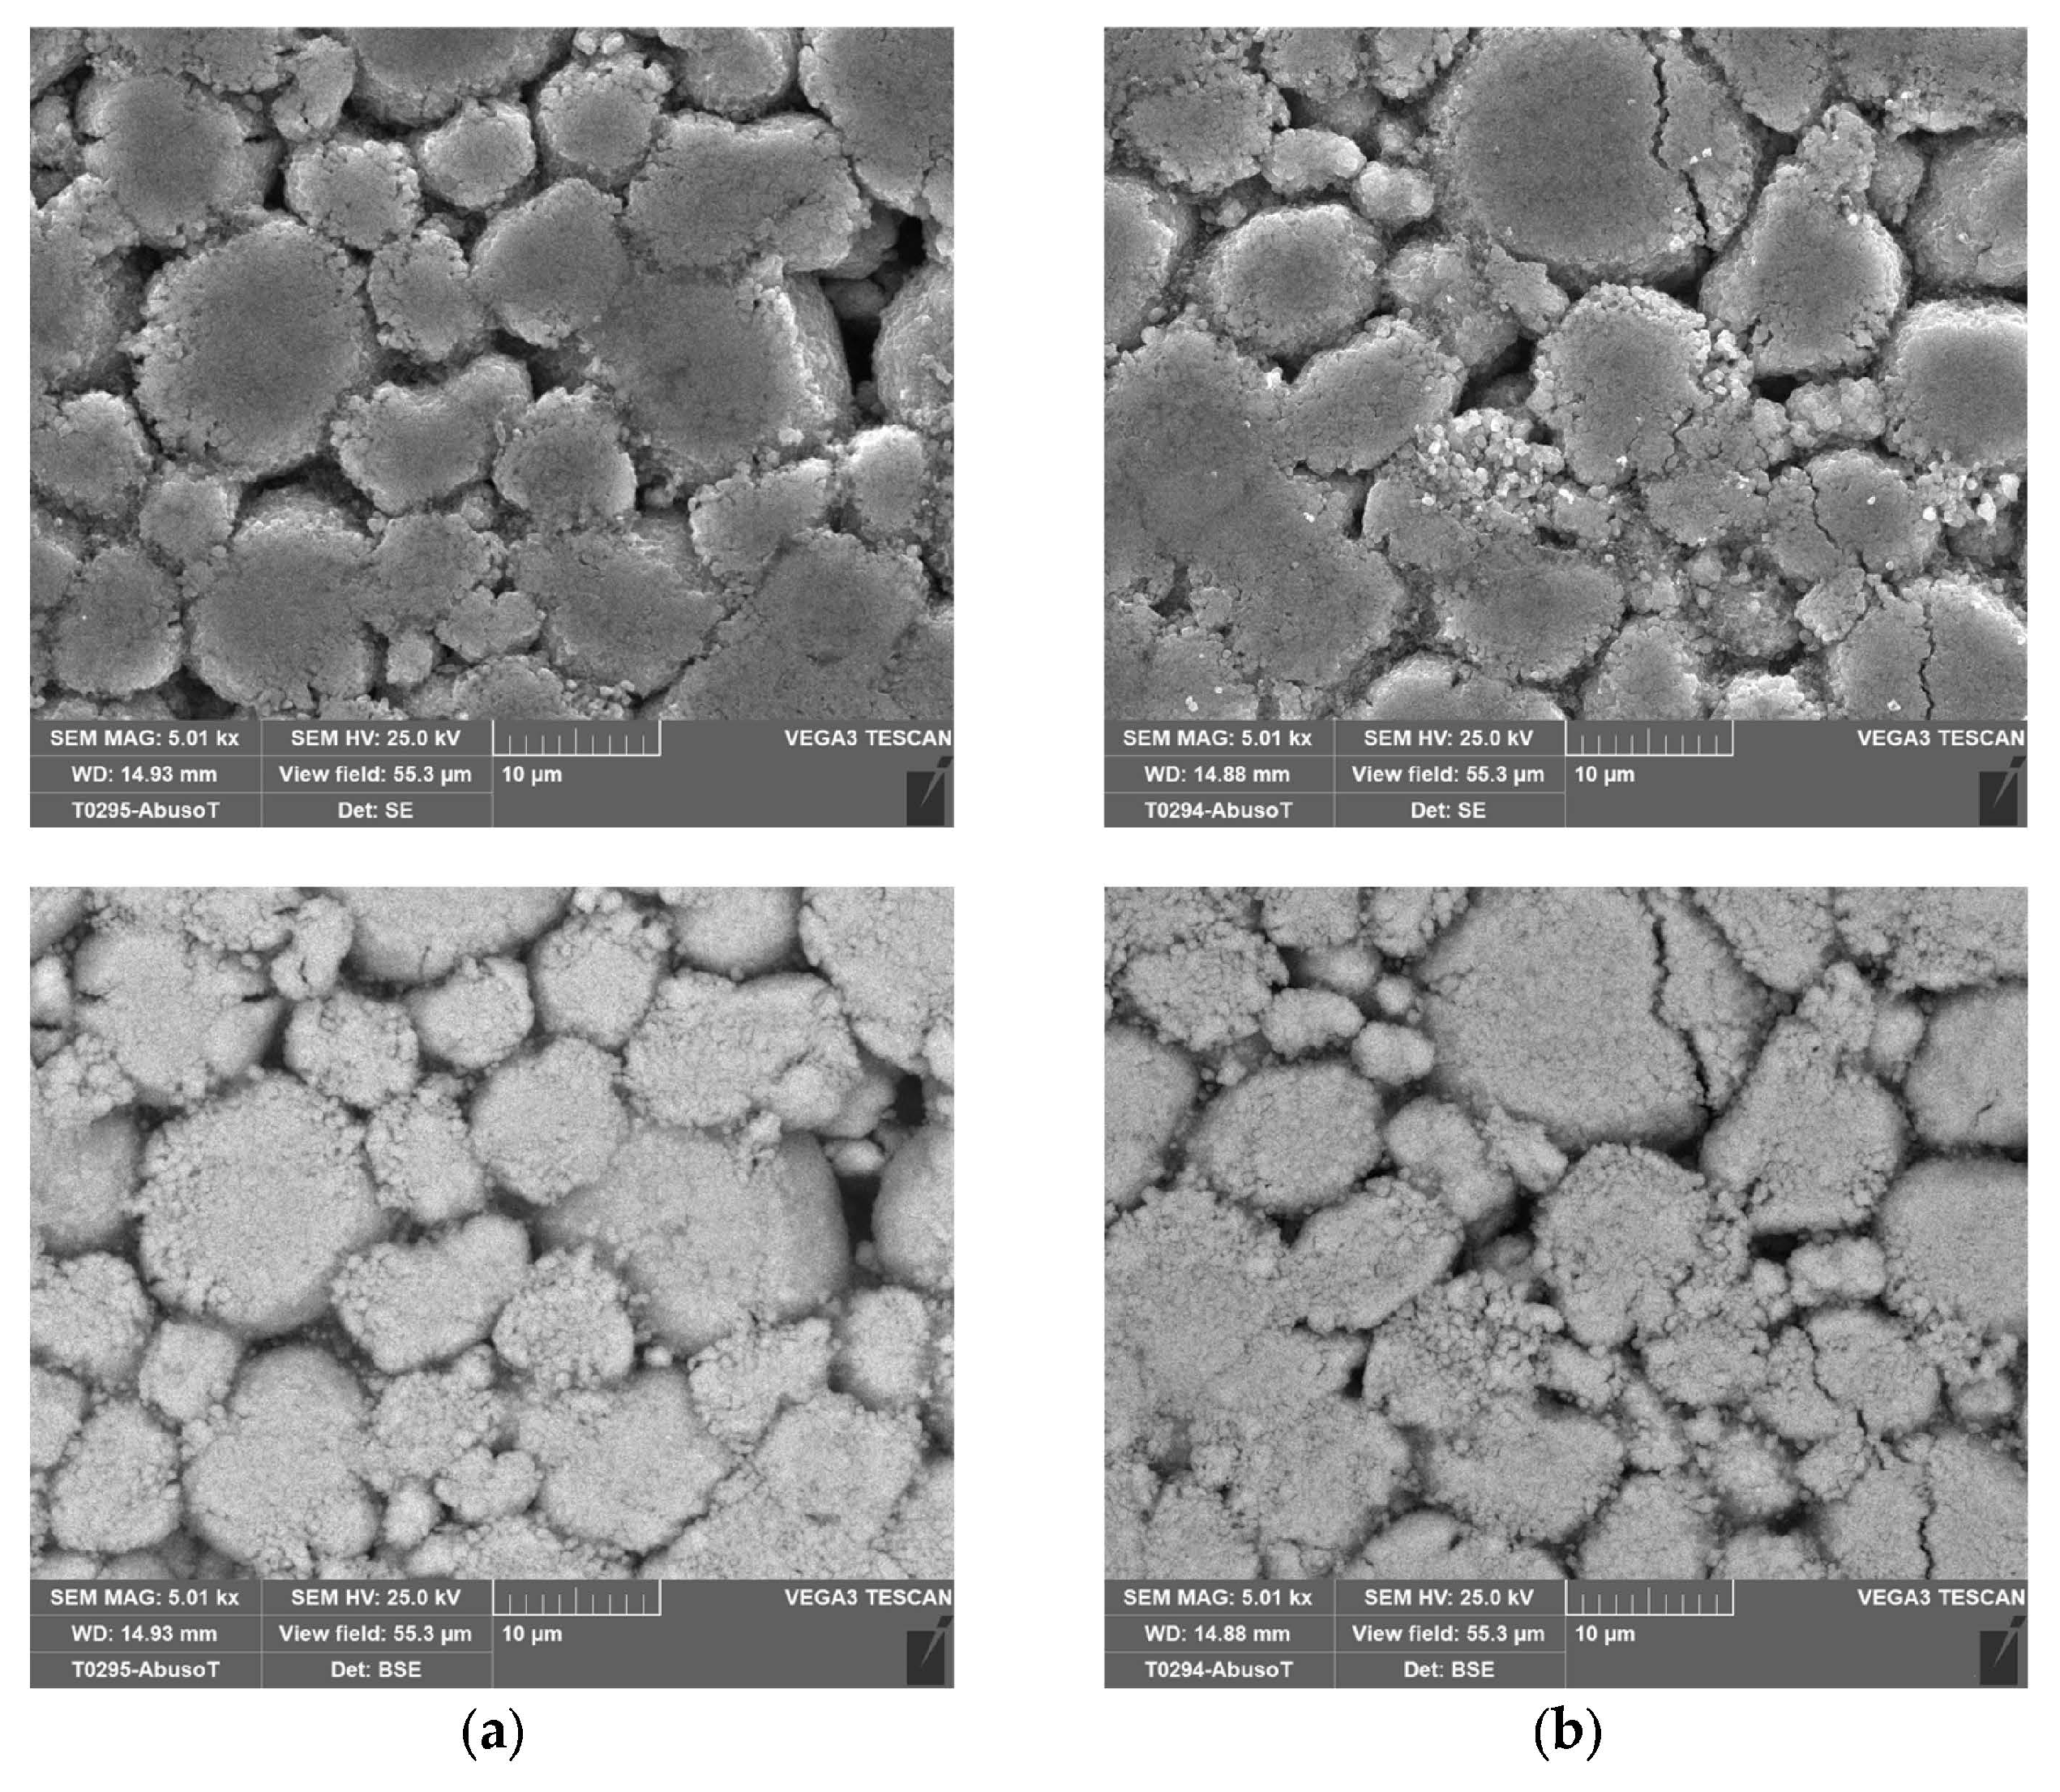
In order to investigate any morphological changes on the electrode’s surface, two cells were analyzed by SEM: a new one and the cell (no. 8 in
Table 2) that was subjected to overcharge with a current of 9.6 A (3C) at an ambient temperature of 50 °C. This was the case where the CID did not operate properly. As in the case of the new one, this allowed the cell to discharge at the minimum voltage recommended by the supplier (2.5 V) before the SEM analysis.
With the cell discharged, the procedure explained in
Section 2.1 was performed to isolate the three main components: the anode, the cathode and the separator soaked in the electrolyte.
Figure 14,
Figure 15,
Figure 16 and
Figure 17 shows the SEM analysis at different magnifications of the anode and cathode.
No morphological variations between the new and the abused cells were identified on the electrodes through the SEM analysis, confirming a proper design and operation of the CID.
4. Conclusions
Research on the safety of lithium-ion batteries has increased in recent years and now plays an important role due to the widespread diffusion of this type of battery, especially in sectors where high safety standards are required. The major safety concern of lithium-ion batteries is thermal runaway, because of its serious consequences, such as flames and explosions. This study focused on overcharge abuse tests of cylindrical 18650 Li-ion cells, either equipped only with passive protection devices or equipped also with active protection devices.
The cells with passive protection devices were tested first in open air and then in a climate chamber. Different levels of current and ambient temperature have been set to investigate several scenarios. In all the cases, the Current Interruption Device (CID) intervened during the overcharge, preventing both venting and thermal runaway. Only at an ambient temperature of 50 °C did the CID not operate correctly, causing the flow of a weak current which entailed a temperature increase of about 15 °C, from 72 °C to a plateau of 87 °C. The activation of CID is not reversible, and the cells were no longer usable after the abuse.
The cells with the Protection Circuit Board (PCB), defined by the cell supplier as “Protected”, did not allow the overcharge, blocking the current immediately at the abuse start. Trying to overcharge with a constant current of 3.2 A starting from a SOC of 80% resulted in current interruption at about 4.55 V, leading to a SOC lower than 100%. The intervention of the PCB is reversible; in the case the cell did not allow a charging current, a discharging current would still be allowed.
The electrodes of an abused cell have been observed by Scanning Electron Microscope (SEM) to assess possible morphological variations. The comparison with the electrodes of a new cell did not show significant morphological changes.
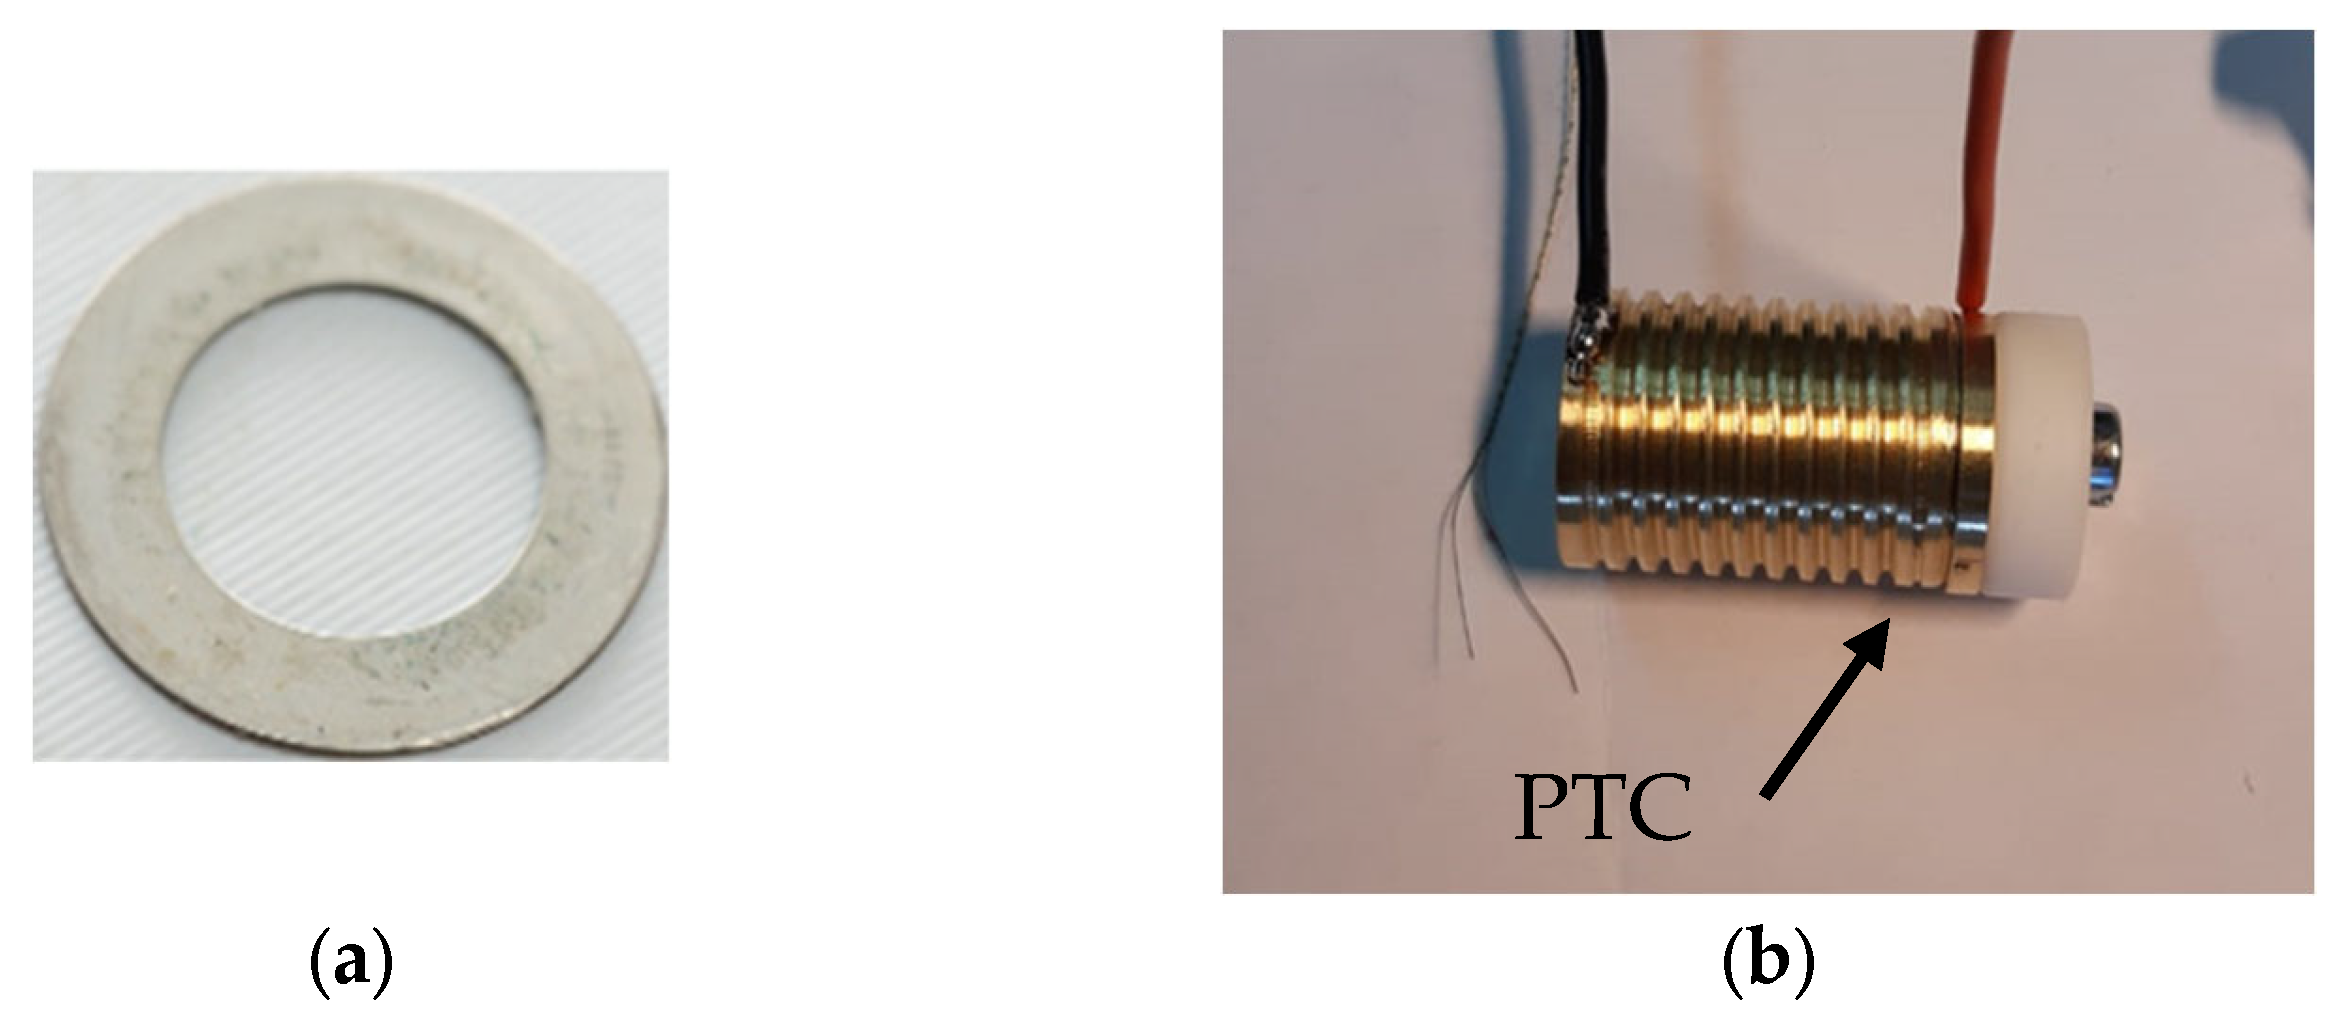
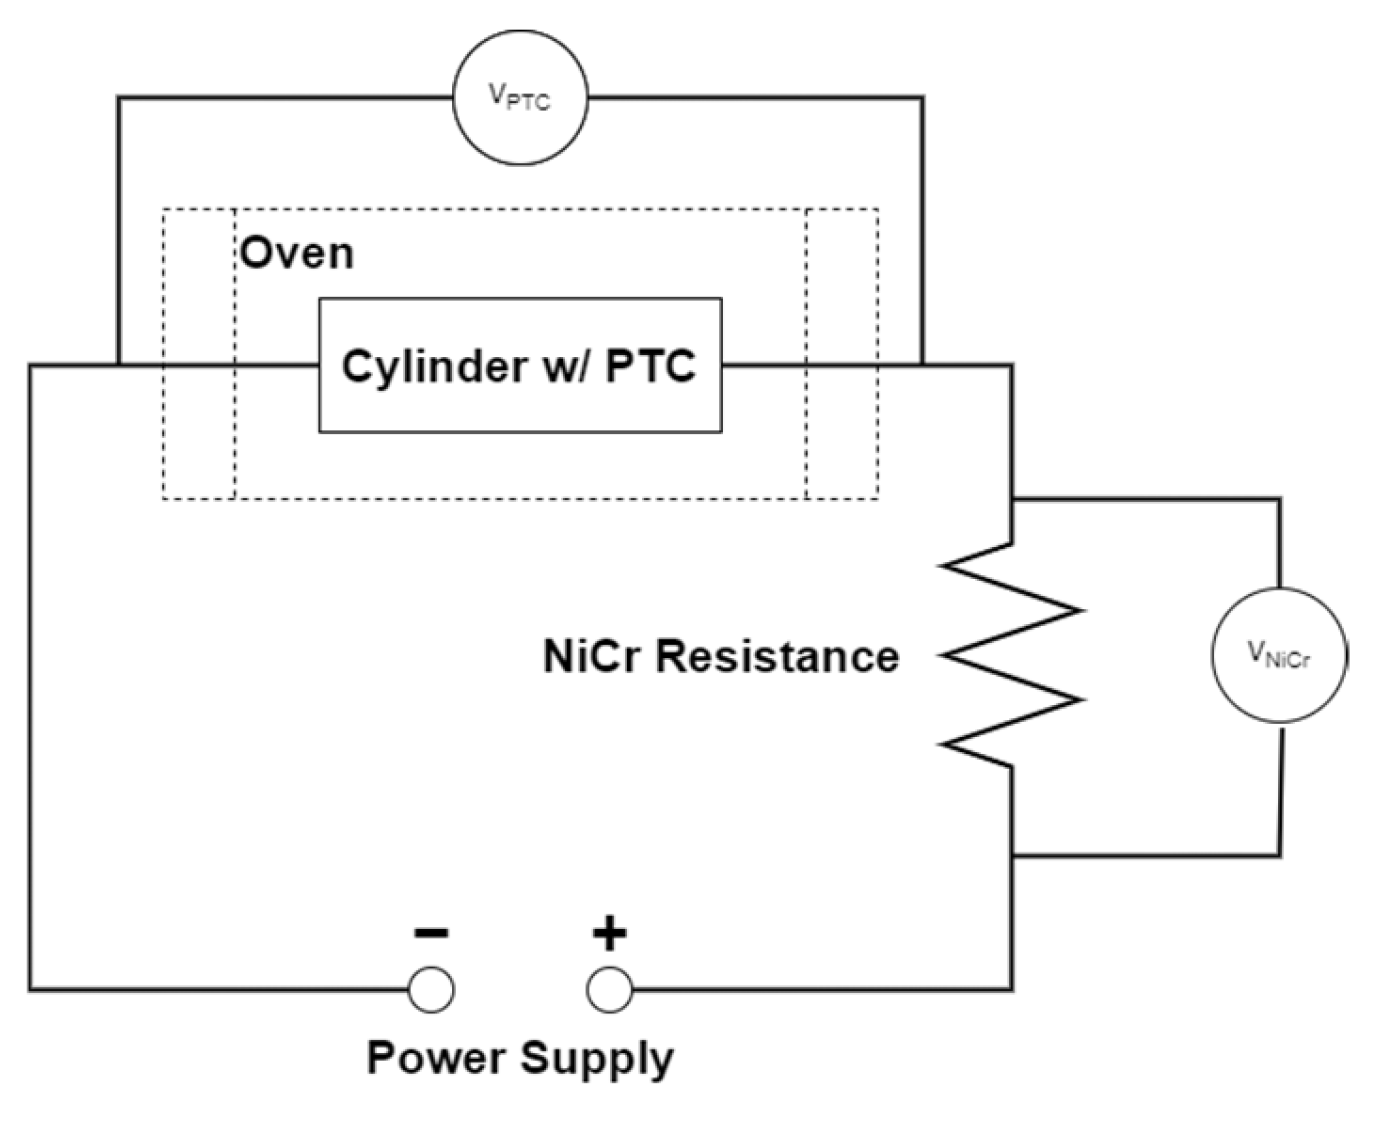
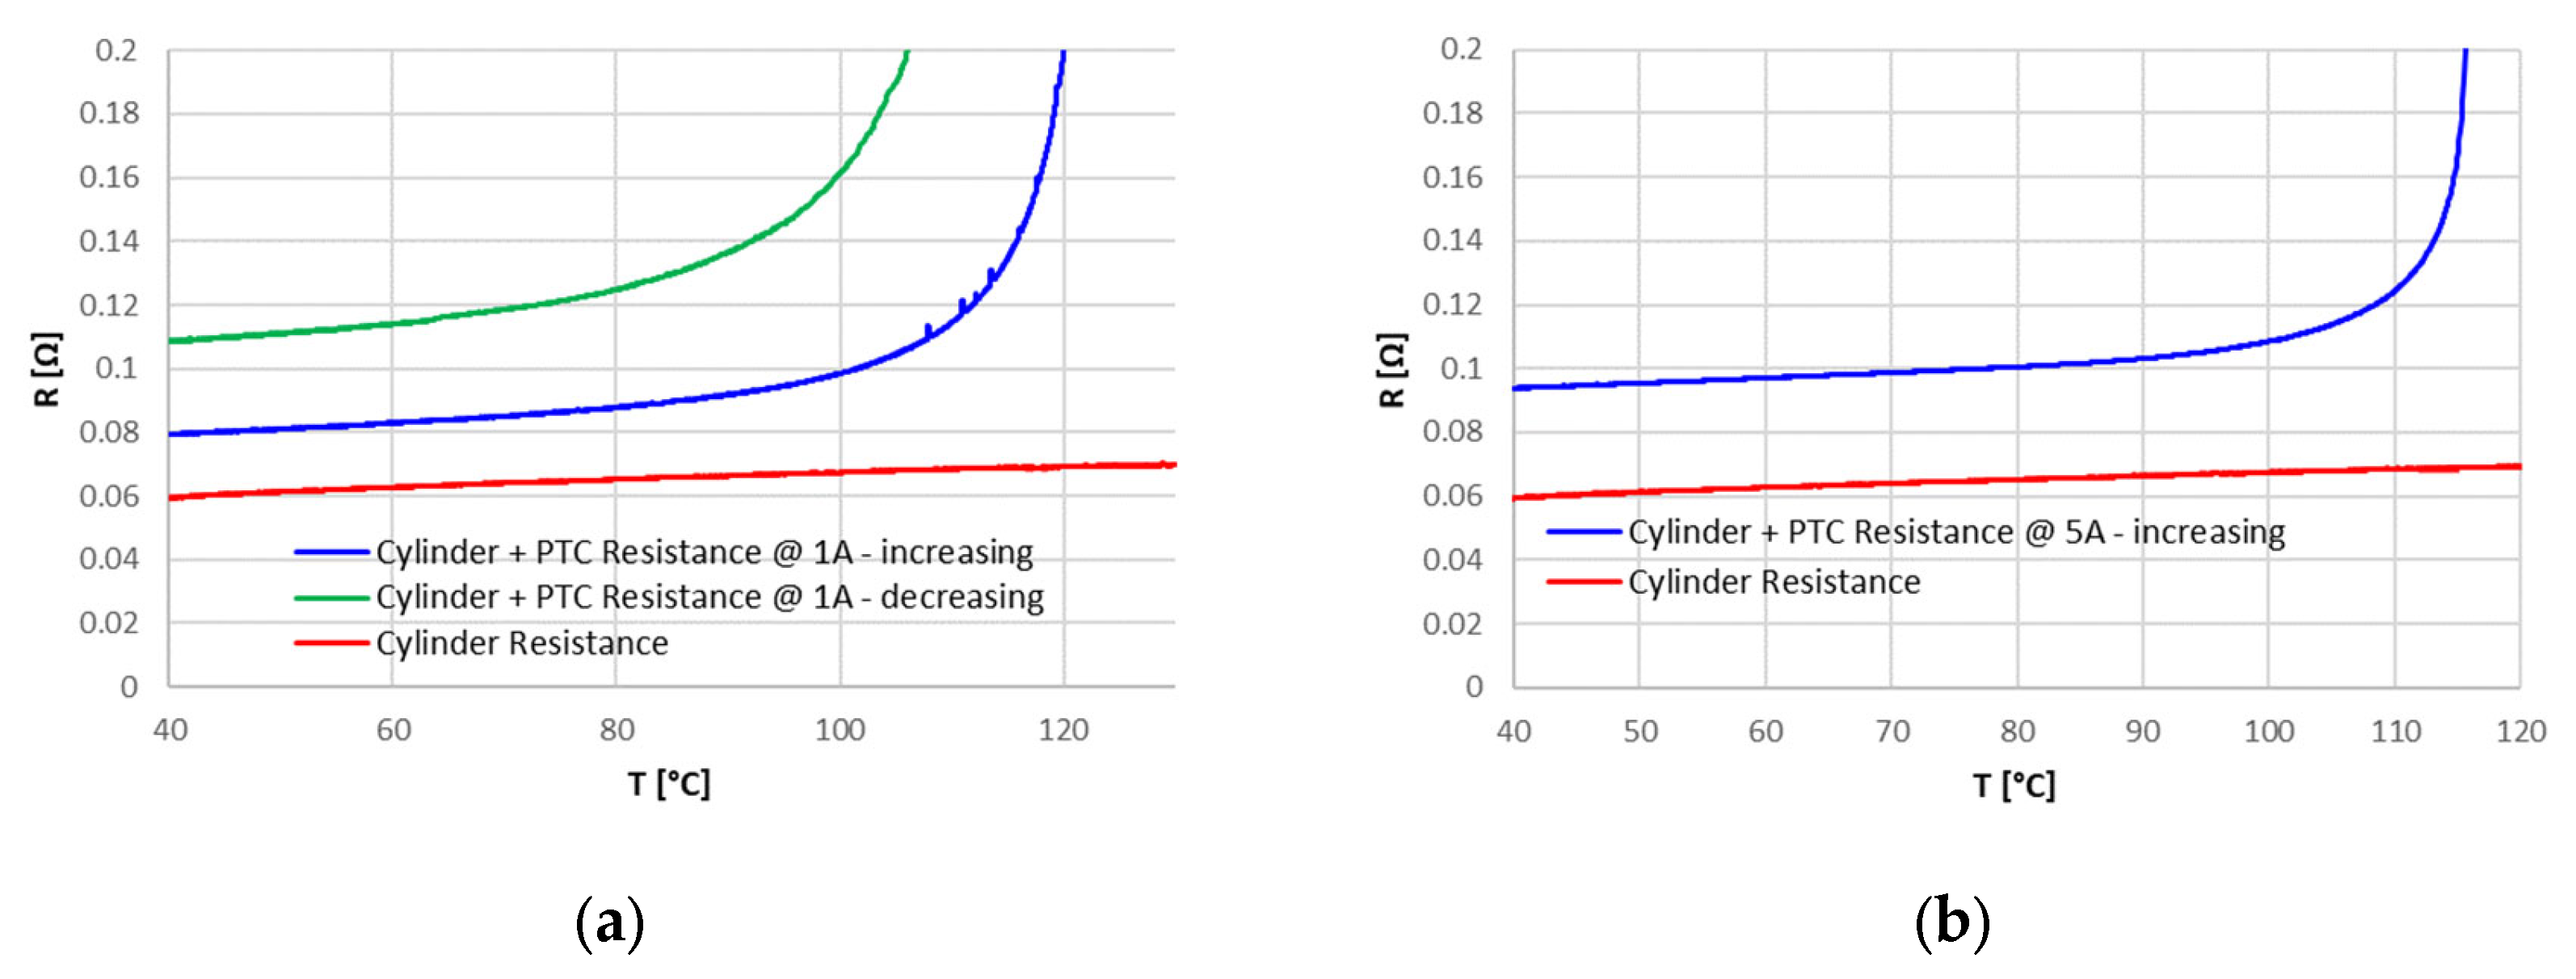
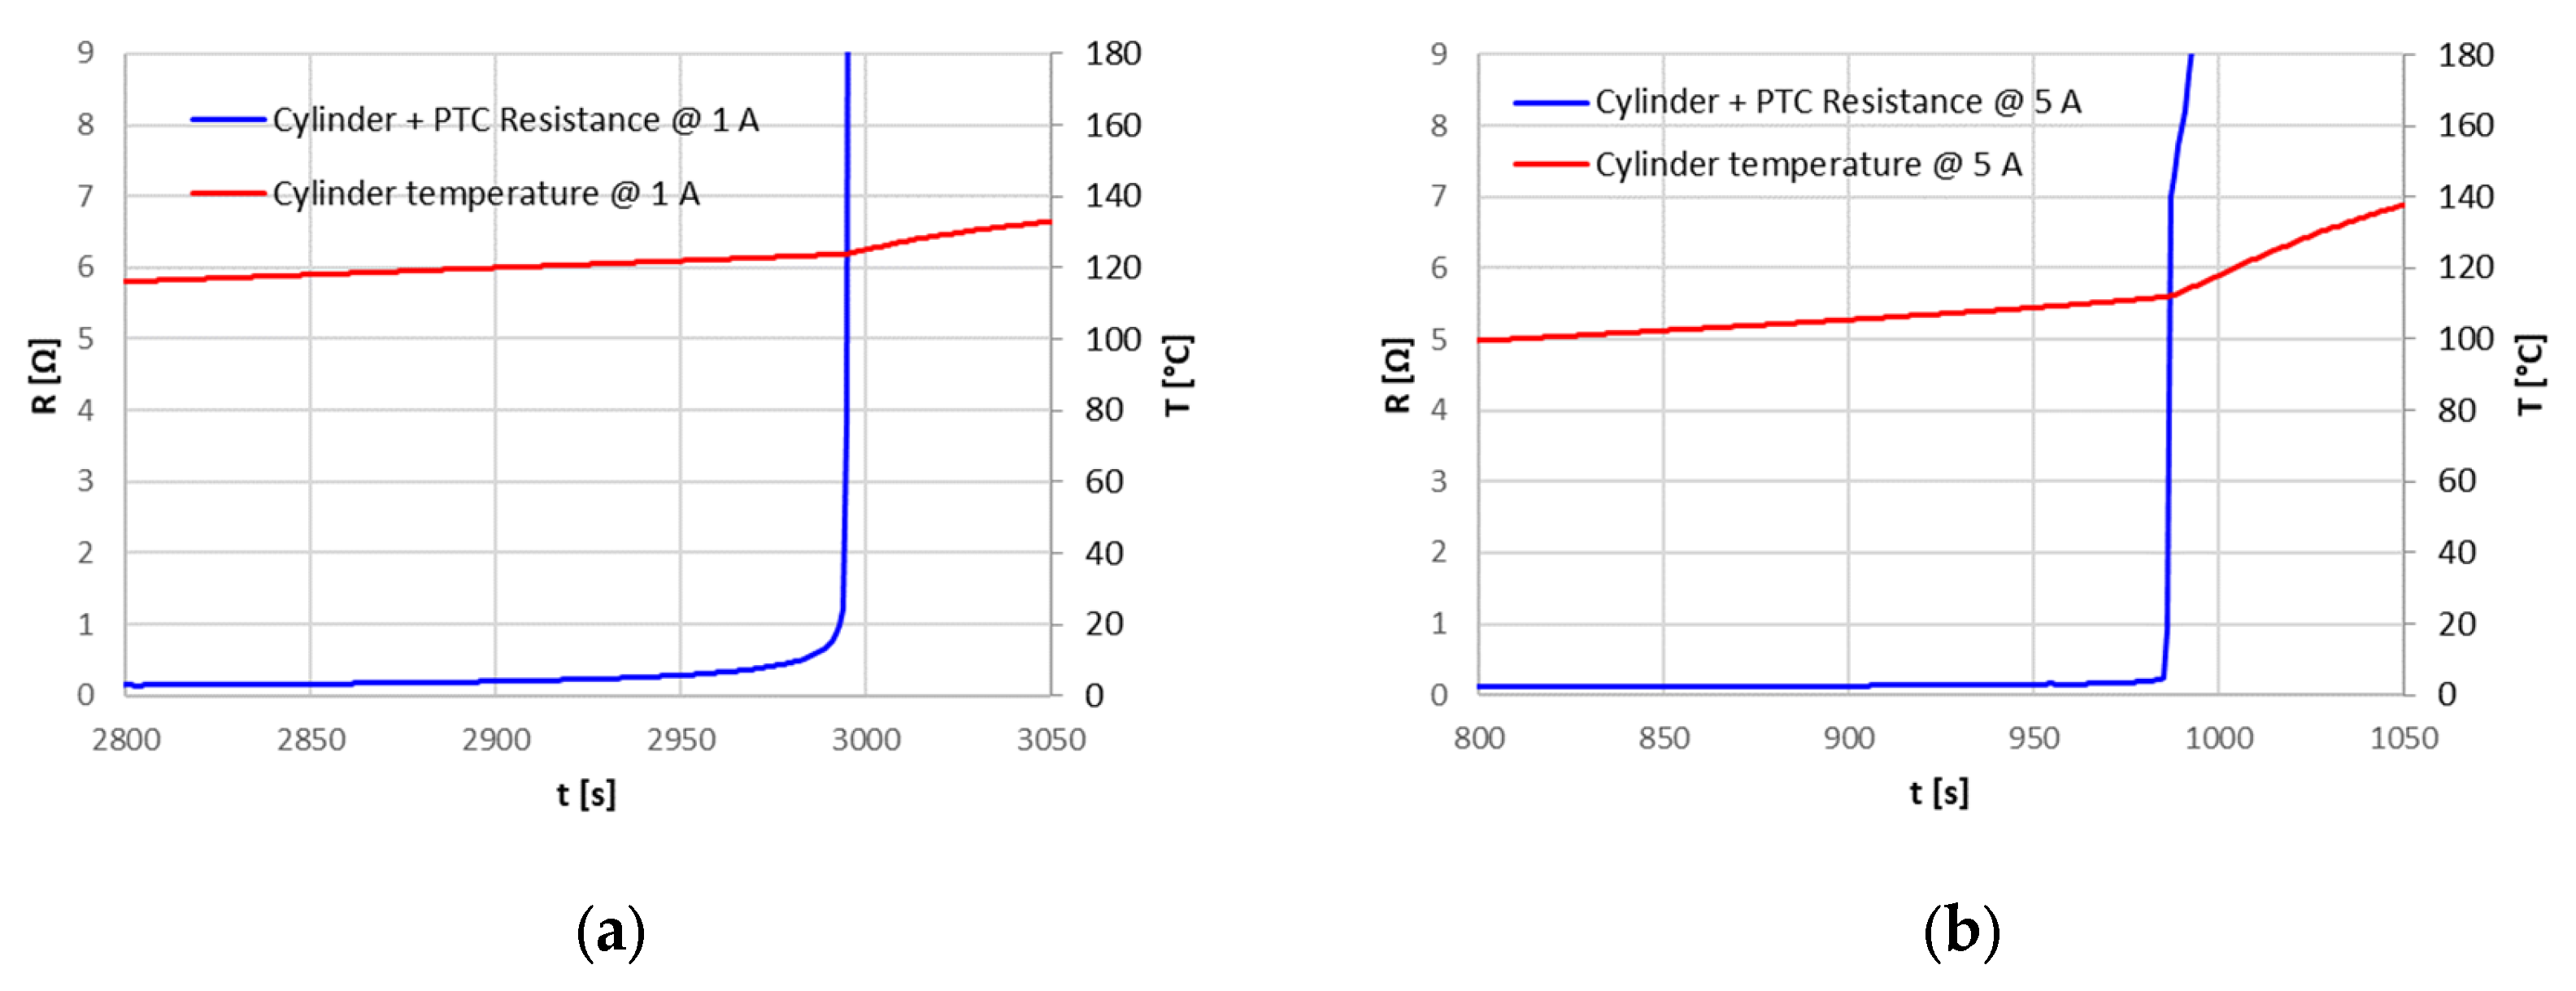
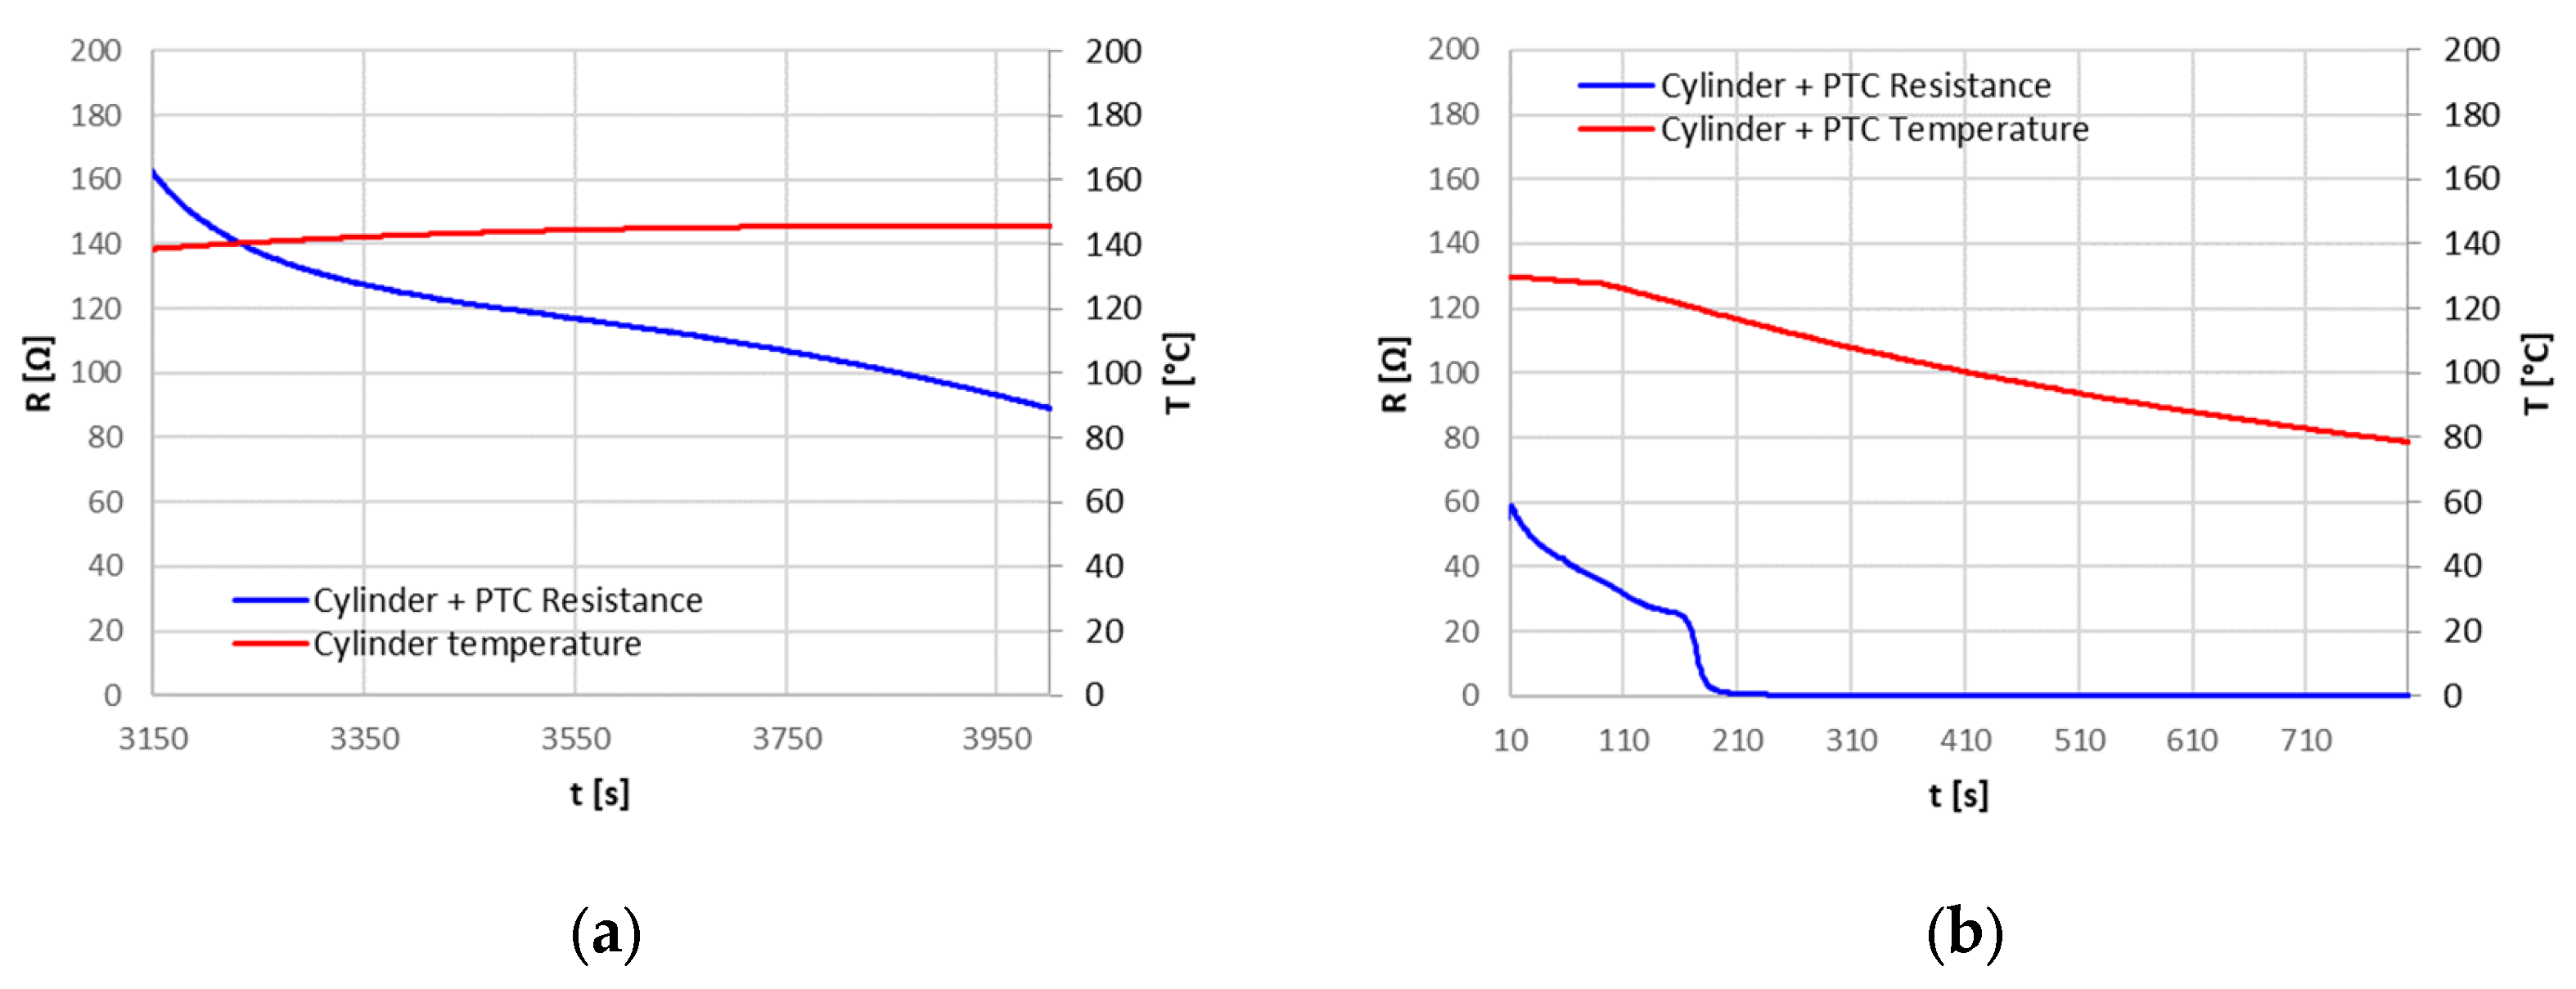
The Positive Temperature Coefficient (PTC) device never intervened in the tests, so it was isolated and tested in a separate set up to evaluate its characteristics. For temperatures below about 100 °C, the PTC had a constant resistance of 20 mΩ: this resistance can explain, in the case of high currents, the higher temperature reached at the positive terminal, where the PTC is placed, compared to the rest of the cell. For the PTC, a triggering temperature of about 120 °C has been identified, with a resistance greater than 160 Ω; this resistance, however, decreased after the triggering point, also maintaining a high temperature.
The different overcharge currents and ambient temperatures provided an initial characterization of the protection devices, in particular of the CID. For the PTC that never intervened during overcharge tests, a characterization on a dedicated set up was performed. Despite the limitations associated with the necessarily limited number of samples analyzed and the lack of more detailed information, which would have allowed a more accurate modeling of the different components, the results obtained in this work are useful from an operational perspective: they provide information about the actual intervention and operation of the safety devices under different operating conditions and can be used as a starting point for more detailed overcharge abuse models that include the whole cell system and not only the cell active materials, such as electrodes and electrolytes. They might also be used to set up specific testing procedures for the assessment of reliability of the safety devices of commercial Li-ion cells.
