Article

Probabilistic Assessment of the Impact of Electric Vehicle Fast Charging Stations Integration into MV Distribution Networks Considering Annual and Seasonal Time-Series Data

by
Oscar Mauricio Hernández-Gómez
1,2,* and
João Paulo Abreu Vieira
1
1
Electrical Engineering Graduate Program, Federal University of Pará, Belém 66075-110, PA, Brazil
2
I2E Research Group, Electronic Engineering Program, Faculty of Engineering, Universidad Pedagógica y Tecnológica de Colombia, Tunja 150002, Colombia
*
Author to whom correspondence should be addressed.
Energies 2024, 17(18), 4624; https://doi.org/10.3390/en17184624
Submission received: 22 May 2024 / Revised: 11 July 2024 / Accepted: 15 July 2024 / Published: 15 September 2024

Abstract

:
Electric vehicle (EV) fast charging stations (FCSs) are essential for achieving net-zero carbon emissions. However, their high power demands pose technical hurdles for medium-voltage (MV) distribution networks, resulting in energy losses, equipment performance issues, overheating, and unexpected tripping. Integrating FCSs into the grid requires considering annual and seasonal variations in EV fast-charging energy consumption. Neglecting these variations can lead to either underestimating or overestimating the impacts of FCSs on the networks. This paper introduces a probabilistic method to assess voltage profile violations, overload capacity, and increased power losses due to FCSs. By incorporating annual and seasonal time-series data, the method accounts for uncertainties related to EV fast charging. Applied to an MV feeder in Brazil, our evaluations highlight the impact of annual power consumption seasonality on EV-grid integration studies. Considering seasonal dependency is crucial for precise impact assessments of MV distribution networks. The proposed method aids utility engineers and planners in quantifying and mitigating the effects of EV fast charging, contributing to more reliable MV grid integration strategies.

1. Introduction

Electric mobility has emerged as a global solution for decarbonizing transportation, garnering widespread government support. In 2022, global electric vehicle (EV) sales exceeded 10 million units, with a continued strong upward trajectory in 2023, totaling 2.3 million units in the first quarter alone. Concurrently, EV charging infrastructure has expanded significantly, with 1.8 million charging points installed in 2021, which increased by 330,000 globally in 2022 [1].
While fast charging stations facilitate longer trips by minimizing charging time, their high power consumption poses challenges to medium-voltage (MV) distribution networks, sometimes requiring infrastructure upgrades [2]. FCS integration into the network can increase peak load demand, and FCSs can cause voltage drops [3], affecting the stability of the network and causing impaired equipment functioning, including possible partial or total outages. Additionally, the current to supply fast charging can cause conductors to heat up, exceeding their thermal limits. Related to protection coordination, the new load can interfere with the existing protection scheme, requiring adjustment of protection settings. These issues require careful planning to maintain the reliability of the network. Some studies on EV fast charging impacts primarily employ a snapshot or daily time-series approach, overlooking annual and seasonal variations.
The number of studies on electric vehicles with FCSs has increased significantly in recent years, mainly focusing on the impact of the high power required for fast charging on distribution networks. Since EV charging can occur at any time and has different durations depending on the initial state of charge (SOC), the time available to the user, and other factors, various methodologies have been used, including stochastic approaches. A bibliometric review was performed using the SCOPUS platform to evaluate this approach in existing literature studies using the following strings: “electric vehicles” OR “EV” AND “fast-charging stations” OR “fast-charging stations” AND “time series”. The search yielded 657 scientific studies, including research articles, conference papers, and book chapters.
Figure 1 shows a thematic map of the keywords obtained from the title, abstract, and keywords of the 657 considered studies using VOSviewer software version 1.6.11. The studies consider stochastic methods, and the Monte Carlo method stands out, known for its ability to generate variables or random numbers associated with a problem. Figure 1 shows that, even though time series was considered in the search, the results do not show any studies using this method with studies on electric vehicles and fast charging.
Several works have examined the technical impacts of EV fast charging, employing probabilistic assessment [4,5,6,7,8,9,10,11,12]. Gonzalez et al. [4] presented an analysis of the impact of EV fast charging stations in Cuenca, Ecuador, which concluded a low impact in terms of harmonic distortion and energy capacity. Paudyal et al. [5] delved into the hosting capacity of real-world feeders, assessing their capability to accommodate EV charging loads according to voltage and thermal limit violations. Basta and Morsi [6] explored the impact of large-scale high-power fast charging stations on power quality, employing the Monte Carlo method to estimate power demand and reveal potential stress points in the distribution system. Alshareef [7] employed machine learning and Monte Carlo simulations to scrutinize the impact of fast charging stations on voltage sag, distinguishing between system faults and charging events. Caballero et al. [8] extended the inquiry to encompass photovoltaic systems, storage units, and electric vehicle charging stations, employing deterministic and probabilistic methods to assess the hourly impacts on a test feeder. Kenari and Ozdemir [9] introduced a model for an FCS combining a negative exponential model with a constant power model. The authors applied the model in the 69 bus IEEE test system. Benavides et al. [10] introduced a “predictive-flex smoother” method to mitigate power fluctuations in grid-connected photovoltaic systems while optimizing energy management in electric vehicle charging stations, improving energy quality delivery. Amini et al. [11] evaluated the effect of large-scale utilization of electric vehicles (EVs) on total system loss. The authors defined four scenarios to determine the effect of the charging rate and distribution of EVs over the network over a 24 h evaluation. Sanchari et al. [12] proposed an index to evaluate the impact of voltage stability, power losses, and reliability, evaluating it on the 33 bus IEEE test system. These studies focused on specific aspects, such as power quality, voltage sag, and PHEV charging/discharging schedules. However, the previous works lack consideration for annual and seasonal variations, prompting the need for a comprehensive assessment.
Other works have evaluated the impact of fast charging via case studies [13,14,15,16], investigating and analyzing various technical impacts of electric vehicles (EVs) and their charging infrastructure on distribution networks and smart grids. Abdullah et al. [13] focused on the impact of increasing EV penetration in Surabaya, Indonesia, assessing different scenarios modeled on EV charging patterns with Markov Chain Monte Carlo simulations. Toledo-Orozco et al. [14] determined the technical impacts on voltage, peak power, and energy losses in medium-voltage networks using OpenDSS software in Cuenca, Ecuador, without incorporating stochastic data. Roy et al. [15] examined the impact of EV charging in western Kentucky, identifying potential overload risks and proposing mitigation solutions under projected EV adoption scenarios. Bucarelli et al. [16] studied ultrafast EV charging stations in Terni, Italy, considering different EV diffusion scenarios and evaluating power consumption, voltage profiles, and overload while exploring the role of distributed generation with storage.
In the literature review, there are studies [17,18,19] that specifically show seasonal or annual impact assessments. Rahman et al. [17] analyzed power quality impact in Riyadh, Saudi Arabia, but considered a load curve only in summer months. Vopava et al. [18] developed a power grid model that analyzed the impact of e-mobility penetration on grid load and demonstrated the model’s efficiency in considering annual load profiles and identifying seasonal effects; however, the article did not consider the effects in voltage, overload, or power losses. Visakh and Selvan [19] evaluated the impact of multiple penetration levels on the aging of distribution transformers during summer and winter. Unfortunately, they did not evaluate voltage profiles or loading in the network.
Table 1 shows a comparison of the literature review and the present work.
We propose a practical and probabilistic approach to evaluate the impact of EV fast charging on medium-voltage (MV) distribution networks. Our approach uses various probability distributions to create random variables associated with fast charging. These variables help us to generate daily EV charging load profiles with five minutes of granularity. The generated EV load profile allows us to simulate the load flow every five minutes to obtain daily results of voltage level, line load, and technical losses. Each simulation day is different because there is a new set of random values for the charging variables, and the measured daily load profile is also different. Simulations can be scalable weekly, monthly, or annually. The resulting time-series data from the simulations are used to calculate and give time-series data that show the likelihood of exceeding limits in voltage level, line load, and technical losses. Since existing studies do not provide such time-series data on limit violation probabilities, our research fills this gap.
We focus on an MV feeder near a busy highway exit in northern Brazil, but the method applies to any feeder. We systematically assess technical issues like voltage drop, thermal overload, and power losses. The essential advantage of our method lies in combining measured annual load profiles with synthetic EV charging data. This blend enhances the representativeness of the load profile by considering current usage patterns and future projections. Additionally, synthetic data offer flexibility and scalability, allowing for extending load profiles beyond actual measurements.
While creating daily load profiles over a year and considering seasonality is a valuable tool for simulations and projections, it is important to avoid drawing incorrect conclusions. Focusing solely on specific days or months, such as worst-case scenarios or light load days, can lead to ineffective network management. For instance, assuming that network reinforcement is necessary based solely on worst-case analysis may not be accurate. Conversely, analyzing a light load day might incorrectly suggest that the network is problem-free, leading engineers to take no action. These incorrect conclusions can have significant consequences for network management.
Conducting daily analyses over a year is a critical step in understanding the impact of fast charging on network variables. This approach explicitly considers the probability of violating permissible limits for network variables such as voltage levels, element overload, and technical losses. By evaluating the risk of exceeding these limits through time series probabilities, utility engineers can determine the necessity of corrective measures. If the probability of exceeding the limits is low, corrective measures may be unnecessary. However, a high probability of exceeding the limits necessitates crucial decisions, such as injecting reactive power, adjusting voltage regulators, or proposing network reinforcements, despite the required investment.
The main contributions of the study are:
  • Method for Generating Synthetic EV Load Profiles: The approach employs various probability distributions for stochastic variables related to EV charging and seasonal variations. A software code was developed to generate EV fast-charging profiles for an FCS. The code realistically models an FCS with selectable charging points according to the implementation requirements. Each charging point randomly selects the number of EVs to charge during the day and their arrival times, considering whether there is a holiday season. During the holiday season, EV charging increases. Charging power for each EV is calculated, considering random battery capacity, the initial/final state of charge, and charging duration. The charging profile of the FCS results from summing individual EV charging profiles throughout the day. This process is repeated for additional days to cover an entire year. The code for generating these profiles is available at the provided URL: https://drive.google.com/drive/folders/1tRKRfQQbBUYsdyXWh5N0iVXT8fdUiVPm?usp=sharing (accessed on 25 June 2024).
  • Time Series of Probability Limit Violations: While the study focuses on an accurate feeder in Brazil, it is important to note that the approach applies to any feeder. It assesses monthly probabilities of exceeding permissible limits for network variables (voltage, element overload, and losses). The monthly time series over a year empowers network engineers to make informed decisions, mitigating the negative impact of fast EV charging. This contribution fills a gap in the literature, as existing cases rarely evaluate monthly and yearly probabilities of exceeding network variable limits.
The paper is structured as follows: Section 2 describes the materials and methods used in this study; Section 3 presents the simulation procedure and fast-charging modeling; Section 4 provides an overview of the test system and study cases; Section 5 presents the results and discussion; and finally, Section 6 concludes the paper.

2. Materials and Methods

Annual and seasonal time-series load flow simulations were executed using DIgSILENT PowerFactory© 2022 SP1 software through the Quasi-Dynamic Simulation toolbox, which allows for the execution of simulations in the medium and long term. The tool calculates multiple load flows in each selected simulation step in 5 min.
Different stochastic test cases (further explained in Section 4) were simulated for a one-year interval. The simulation of each case was performed multiple times, depending on the user’s requirements. The results obtained from the various simulations were averaged at each simulation step and then analyzed to evaluate the probabilities of voltage and overload limit violations. The computer used to run the simulations was a Lenovo IdeaPad 320 with an Intel® Core™ i7-7500U CPU processor @ 2.70–2.90 GHz and 12 GB of RAM.
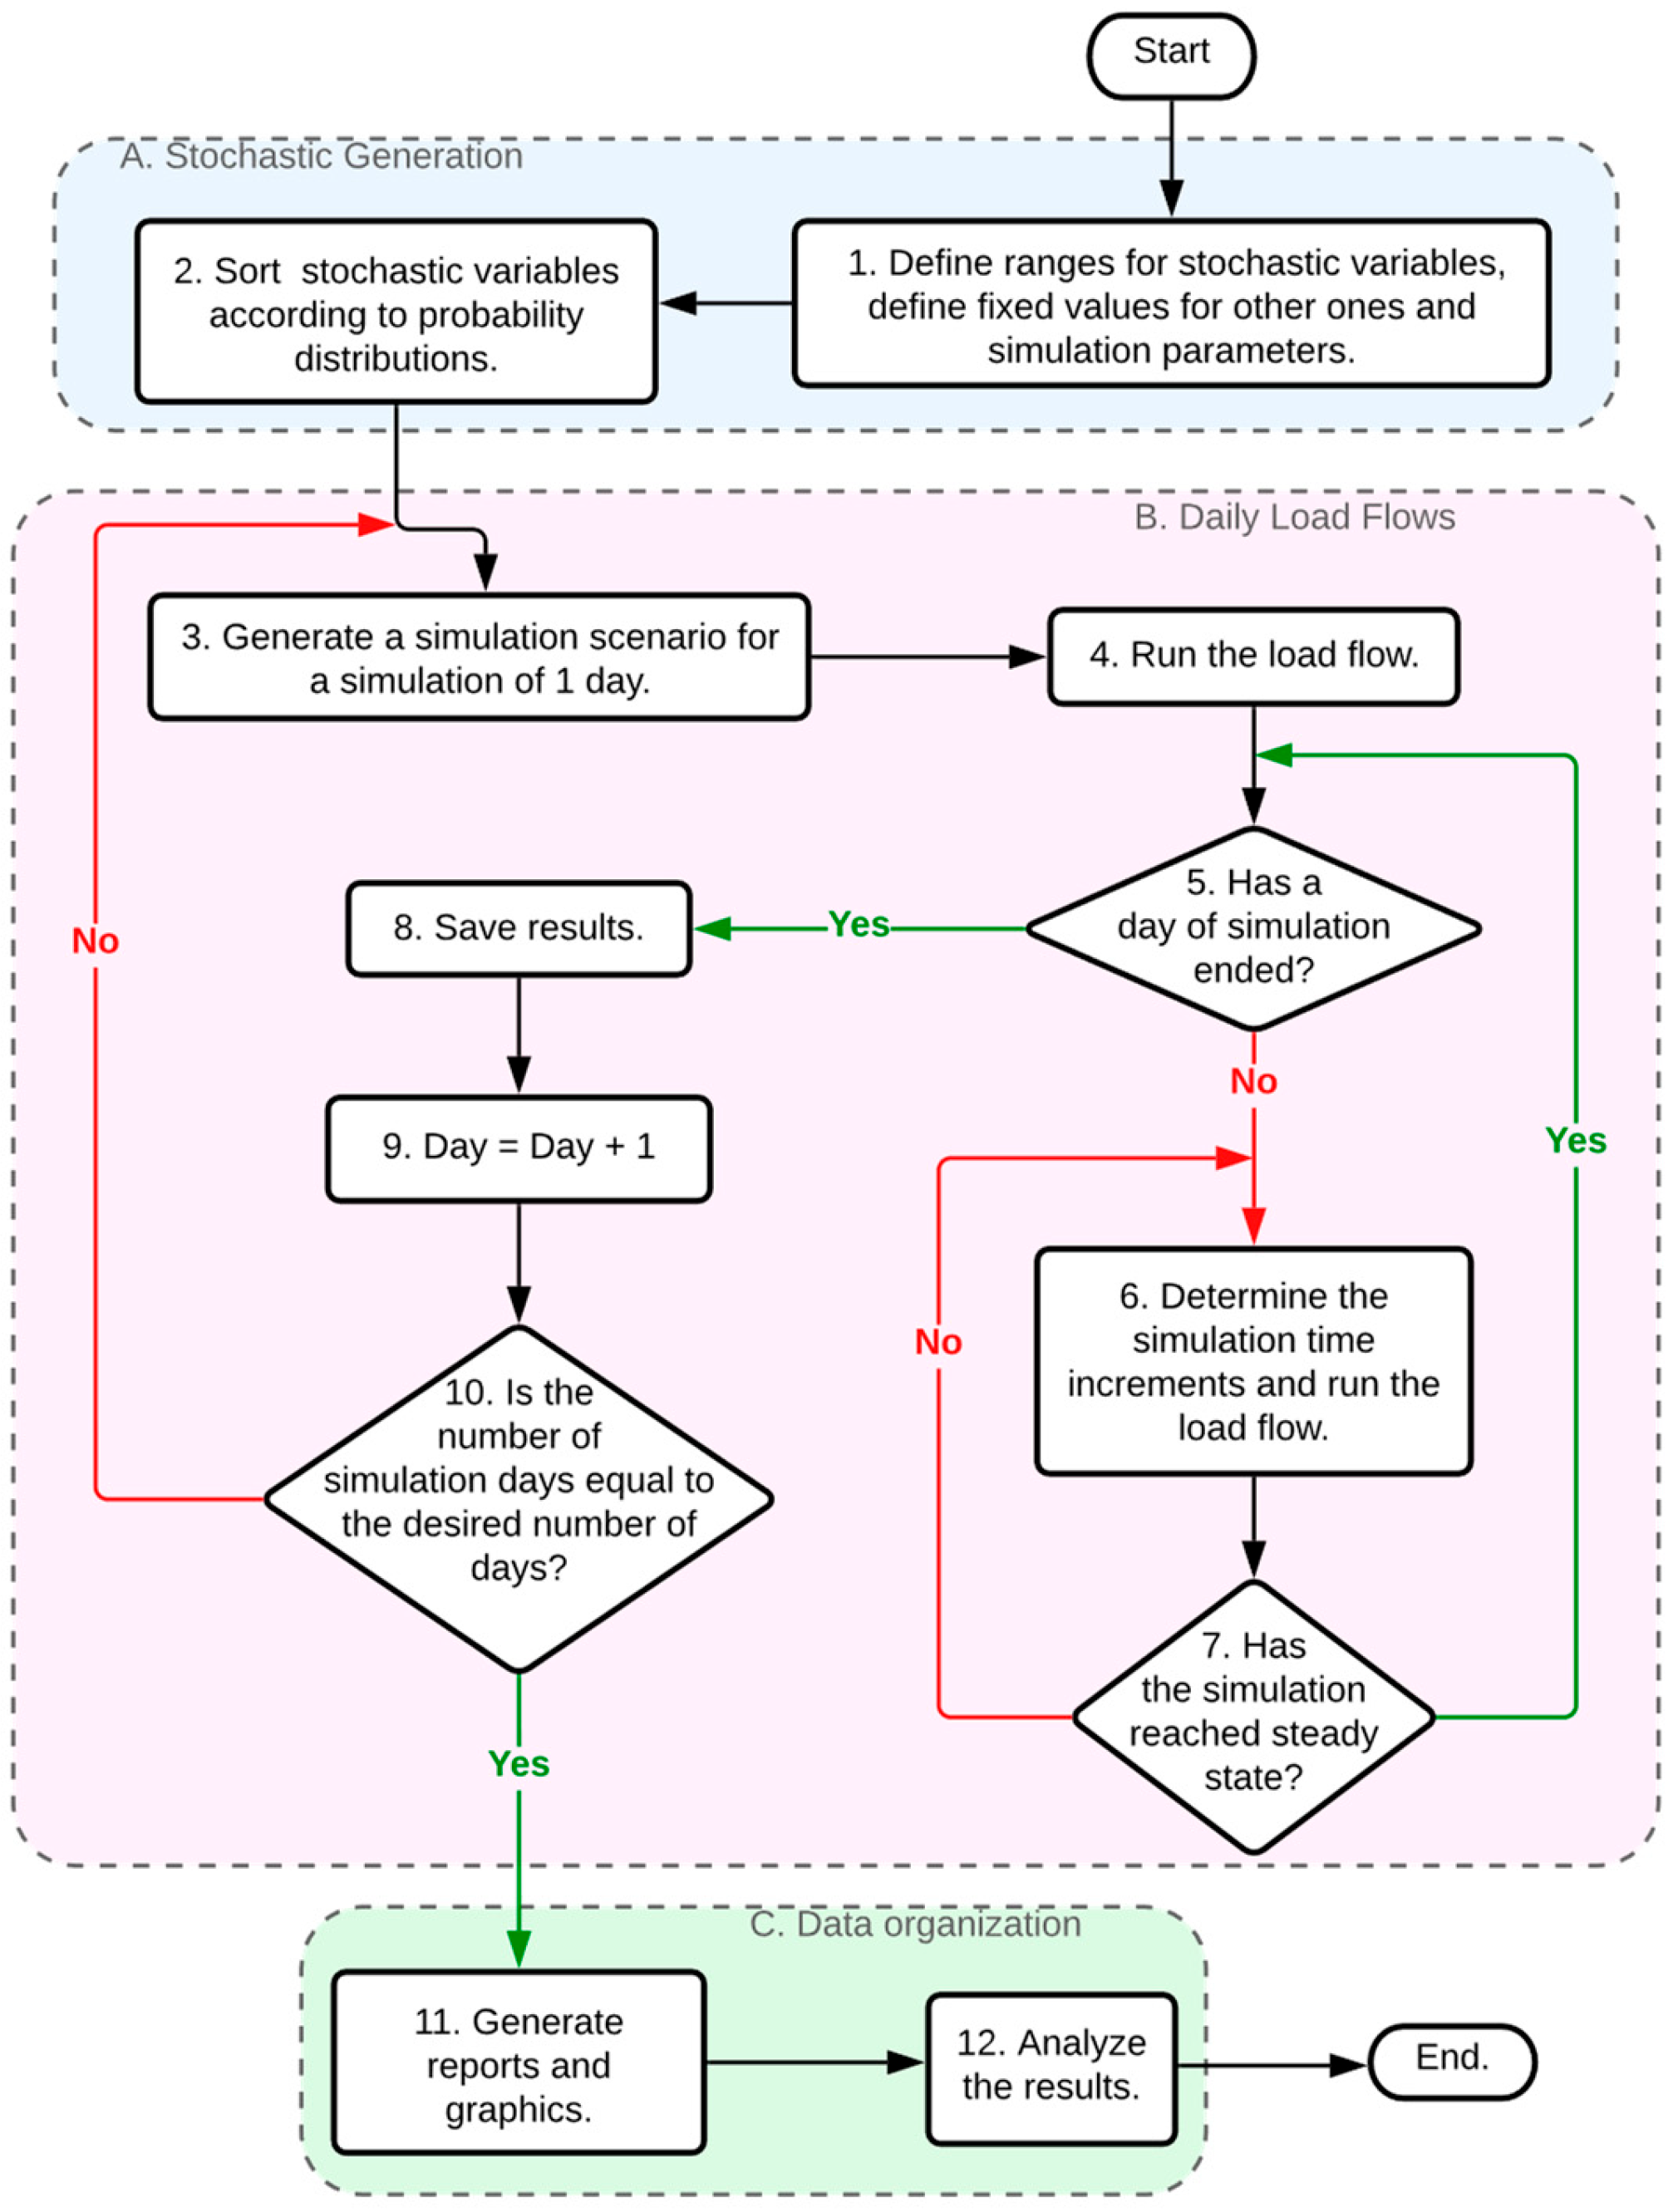
The proposed probabilistic method assesses the impact of EV fast charging stations (FCSs) on medium-voltage (MV) distribution networks, considering annual and seasonal synthetic time-series data of EV FCS energy consumption as well as power load measurements in the feeder. The proposed method, illustrated in the flowchart of Figure 2, can be applied to any feeder and FCS.
The method is divided into three parts: A—Stochastic Generation, B—Daily Load Flows, and C—Data Organization. The range values of the stochastic variables in the charging process are defined in part A. These variables include the battery’s initial and final state of charge, the arrival time of the EV at the FCS, the battery’s capacity, the EV charging time, and the number of EVs arriving at the FCS. This study assumes that the number of EVs arriving at the FCS increases stochastically during vacation compared to typical working months. This approach accounts for the annual seasonality of EV fast charging. Additionally, other variables are defined, such as the time range or number of days to simulate and the step time of the quasi-dynamic simulation (e.g., one or five minutes).
A code block is programmed within the MATLAB© R2015 environment to perform steps 1 and 2, which results in a detailed charging power profile for EVs at each charging point. This profile is generated daily throughout the year or for any predetermined number of days set for the simulation. Section 3 comprehensively explains the methods for generating random variables and charging profiles. These profiles are then stored in a time-based data file, ready to be uploaded to PowerFactory.
In PowerFactory, Section B of the flowchart is carried out. Step three processes the charging data for the initial simulation day using the synthetic EV charging profile. Steps four through seven involve running multiple load flow analyses for this first day, with each load flow occurring every five minutes—the interval chosen for this study. This process continues until a full simulation day is completed, yielding 288 data points for each evaluated variable (12 load flows per hour over 24 h). The results of the evaluated variables (step eight) are stored, and one day in a counter of the simulation days is added (step nine).
After the above, compliance with the total number of days programmed in the simulation is verified in step ten. If the desired number of simulation days is not completed, the process returns to step three to load the EV charging profile of the next simulation day and repeats the process. If it reaches the desired number of days, part C of the flowchart is executed, generating reports and graphs (step eleven). Finally, the results are available for analysis in step twelve.
A “runs test” is employed to analyze the data and ascertain the likelihood of voltage or loading violations and the percentage of technical losses. The test determines the probability of voltage violations for data lower than the threshold value of 0.93 per unit (p.u.) and the probability of loading violations for data greater than 100% in distribution lines. These threshold values are set based on Brazil’s National Electric Energy Agency (ANEEL) standards as outlined in the country’s Electric Energy Distribution Procedures for the National Electric System [20]. ANEEL also stipulates the allowable percentages for technical and non-technical losses that energy companies can incur. In this study, the authors chose a 5% threshold to evaluate technical losses.
The “runs test” counts the amount of data (n) that is less than or greater than a threshold value. With this information, the probability of violations is calculated by dividing the amount of data out of limits by the total number of data (N) for each evaluated variable, as shown in Equation (1):
P r o b   % = n N 100 % .

3. Simulation Procedure and Fast Charging Modeling

3.1. Simulation Procedure

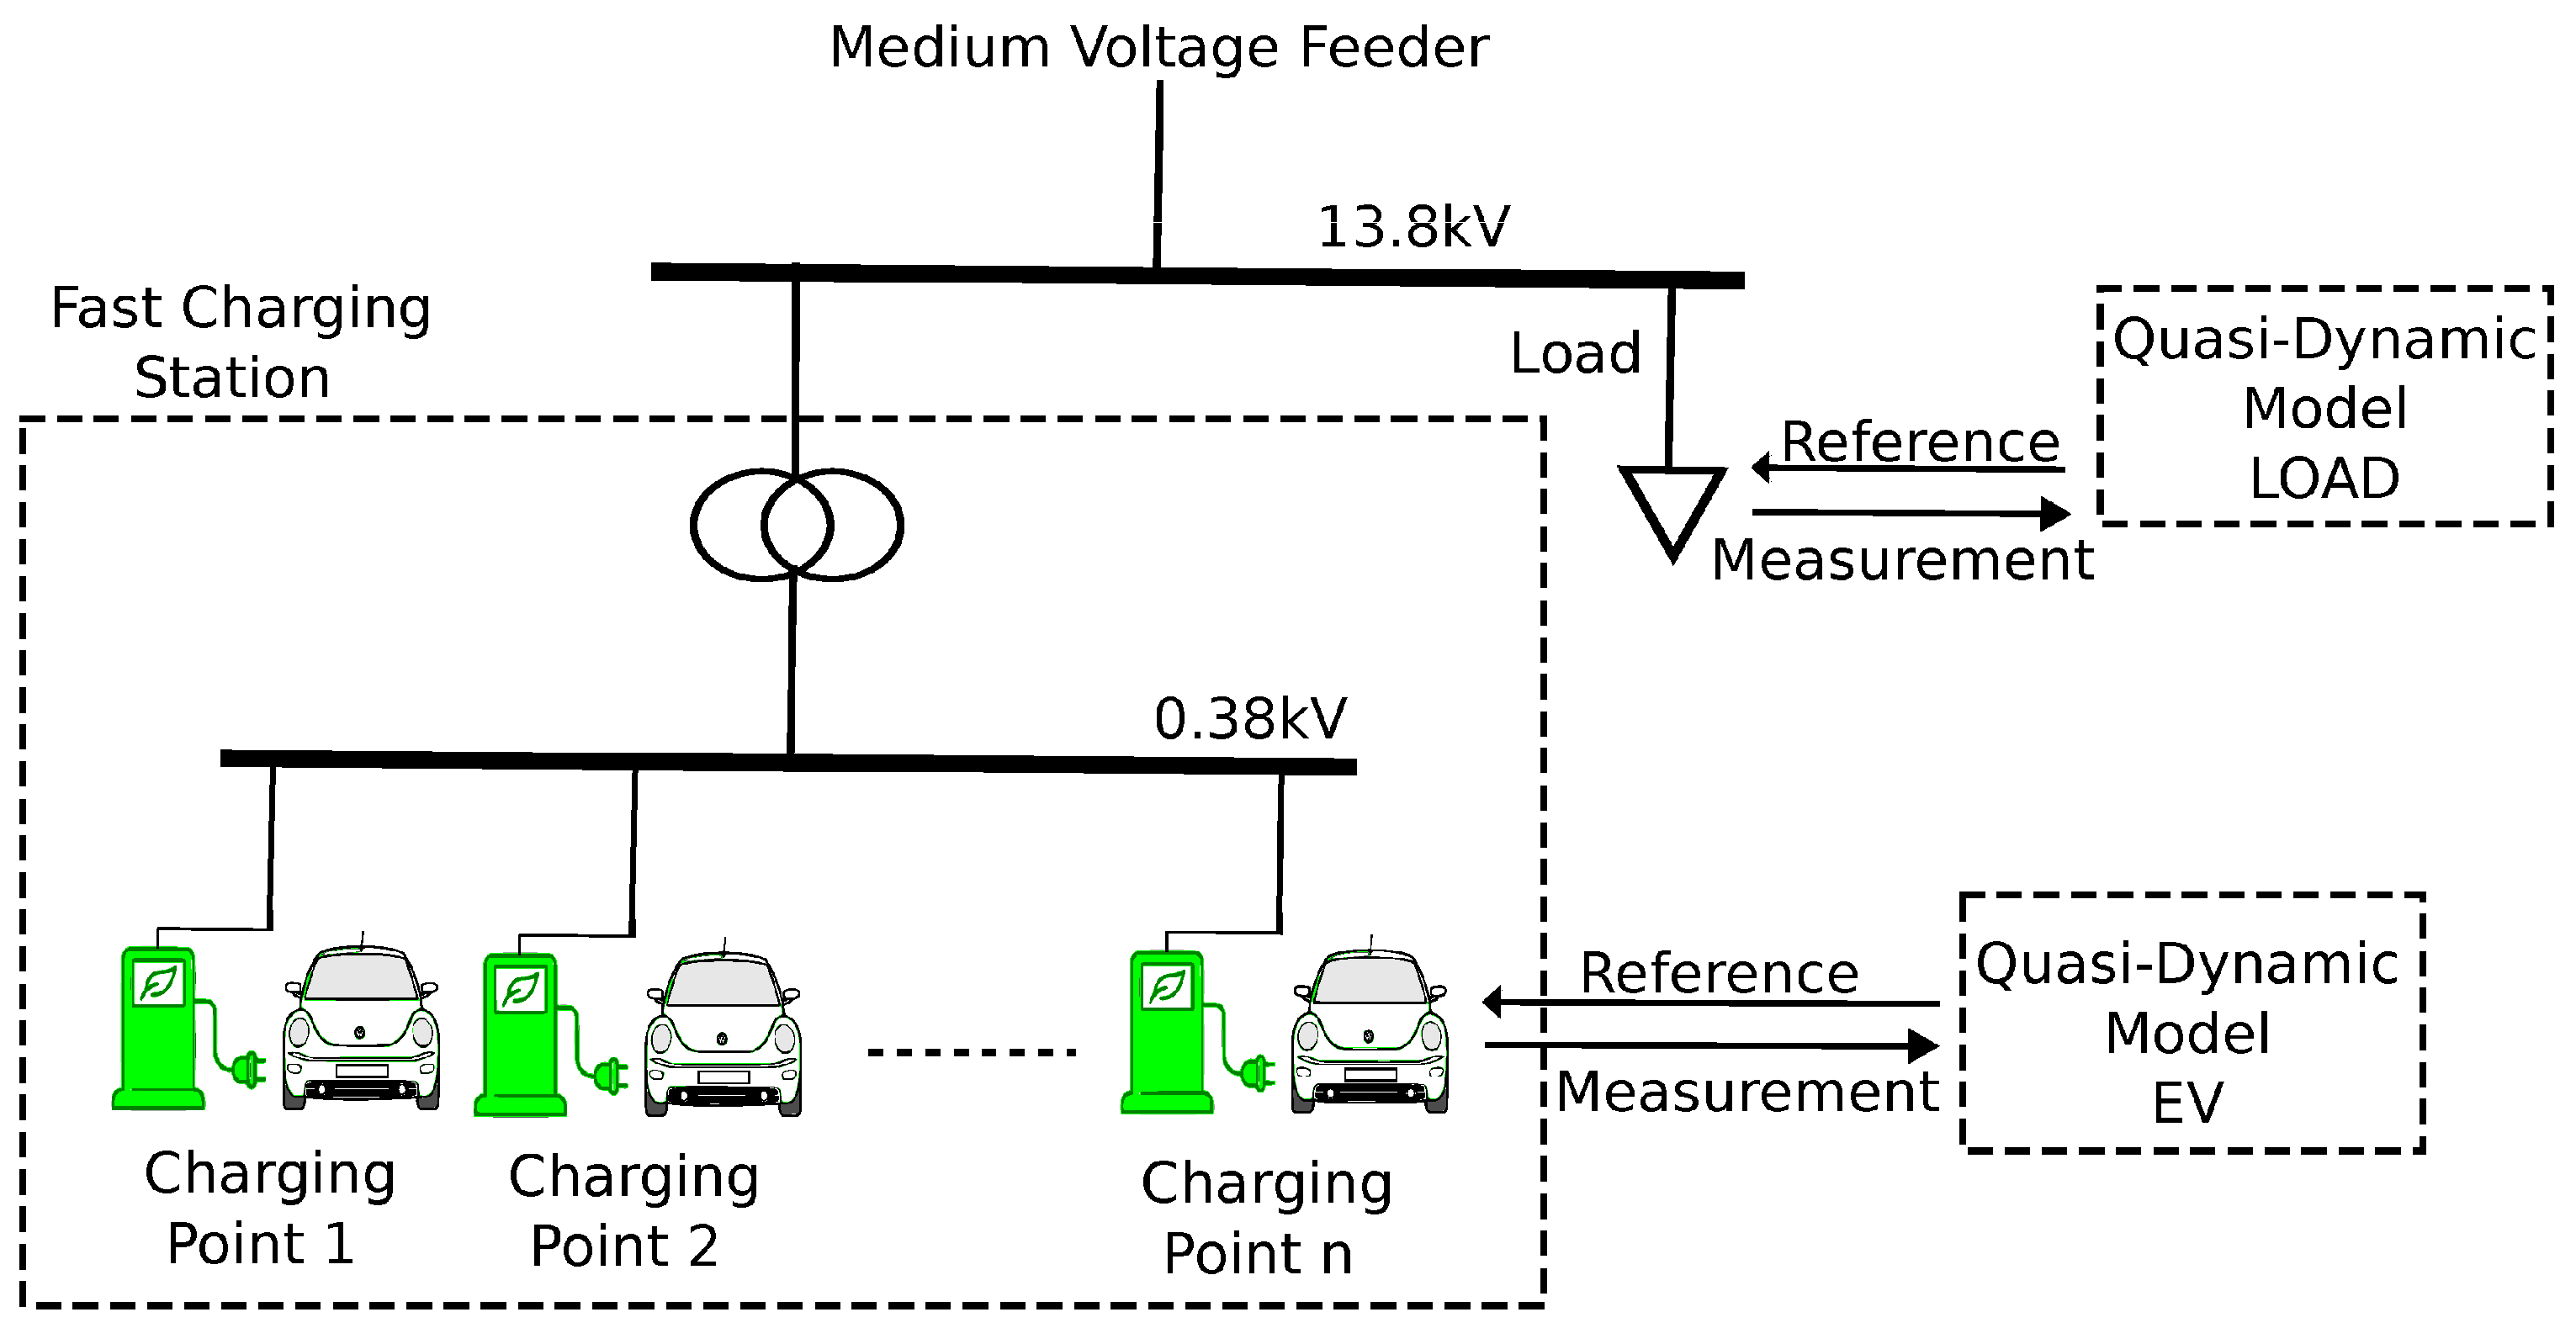
To simulate the behavior of the MV distribution network over time, it is necessary to use quasi-dynamic models (QDMs) for the feeder loads and each EV arriving at a fast-charging point. QDMs are models that change their values over time. Figure 3 illustrates the procedure for integrating QDMs into the distribution network. The reference values and measurement signals of different variables are obtained from the load flow simulations. For the purposes of this article, there is no communication between the different charging points, and the EV fast charging controller is not smart.

3.2. Quasi-Dynamic Model for a Fast Charging Station

An FCS comprises a 13.8 kV/0.38 kV step-down transformer and six charging points. Each charging point can charge one EV. Each EV has a QDM based on the method described in Section 2. This way, each EV at each charging point has its own set of random variables, simulating the individual behavior of each point to be like an actual EV-FCS. The QDM for an EV that arrives at an FCS charging point has an equivalent load profile of the power consumed during the charging process. The QDM for the FCS is the sum of all load profiles for each EV at a charging point.
Each EV load profile is calculated based on the stochastic variables related to the charging process, thus:
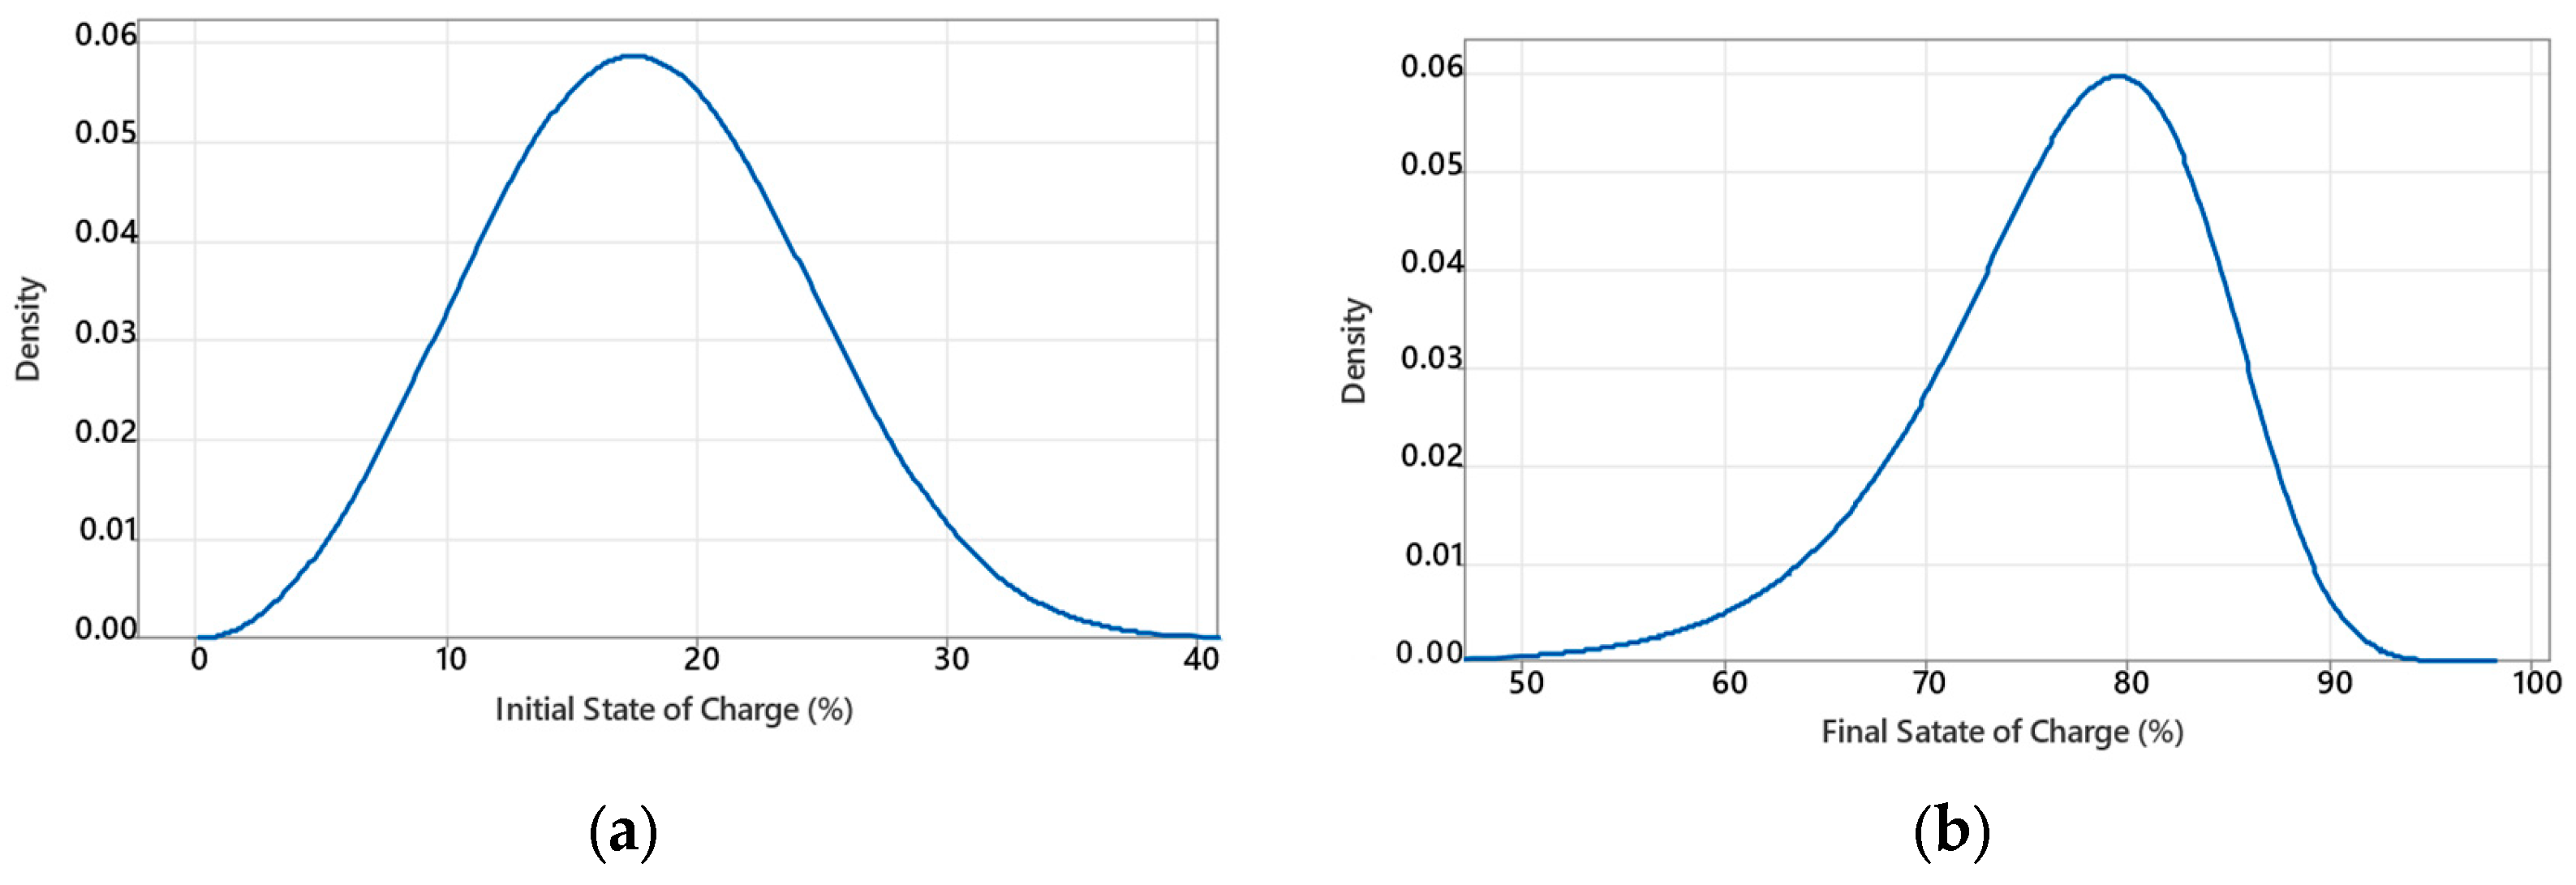
  • Battery’s initial state of charge (SOCini): When an EV arrives at a charging station, the battery’s initial state of charge remains undetermined. A Weibull probability distribution characterized by a shape parameter of 3 and a scale parameter of 20 is used to generate this variable. This approach enables the random generation of initial SOC up to 40%, as depicted in Figure 4a.
  • Final state of charge (SOCfin): The developed model considers the possibility of a user departing from the charging point without reaching full charge. This scenario is modeled using a Weibull probability distribution with a shape parameter of 13 and a scale parameter of 80. This approach allows for the random generation of final charge states within an approximate SOC range of 50% to 95%, as demonstrated in Figure 4b. This flexibility in modeling user behavior is a key feature of our simulation model.
  • Arrival time of the EV at the charging point: The specific time when an EV arrives at a charging station during the day cannot be precisely determined. A normal probability distribution with a mean of 13 h and a standard deviation of 4 h is selected to address this variability. This statistical approach produces a higher frequency of predicted arrival times around midday.
  • Battery’s capacity (Cbat): This variable is generated using a uniform distribution, considering the diverse battery capacities of EVs arriving at the charging station. This approach accounts for the commercially available range of battery capacities, which typically spans from 30 to 67 kW/h.
  • EV charging time (Tch): This is the required time to charge the EV. It is modeled using a uniform distribution that spans a timeframe of 20 to 40 min for the charging process.
  • Number of EVs arriving at an FCS: The EV charging points account for charging between 20 and 40 EVs each. The specific number of EVs to be charged is randomly generated using a uniform distribution.
Table 2 displays the probability distributions and the parameters used for each random EV variable. The random variables’ intervals consider values from commercial vehicles and some literature about vehicle charging [21,22]. During the holiday months of December, January, and July, the number of EVs arriving at an FCS randomly increase between 20% and 50% compared to other months.
Listing 1 displays a segment of the MATLAB© code developed to set the ranges and to generate the stochastic variables, as outlined in section A of the flowchart (Figure 2).
Listing 1. Segment of the developed code in MATLAB© environment.
% Definition of constants
MIN_DIA = 1440;  %Minutes in a day
DIAS_ANO = 365;  %Number of days in the year
n_Punt_Rec = 6;   %Number of charging points within an FCS
MAX_VE = 40;    %Maximum number of EV at the charging point
MIN_VE = 20;    %Minimum number of EV at the charging point
T_CAR_MIN = 20;  %Minimum charging time in minutes
T_CAR_MAX = 40;  %Maximum charging time in minutes

for punt=1:n_Punt_Rec*N_Estac
for ve=1:N_VE(punt)
SOC_INI(ve,punt) = round(wblrnd(20,3),1);  %Weibull for SOC ini
SOC_FIN(ve,punt) = round(wblrnd(80,13),1); %Weibull for SOC fin
T_CAR(ve,punt) = round(unifrnd(T_CAR_MIN,T_CAR_MAX));
if dia_ano == 1
T_ARR(ve,punt) = round(normrnd(MU,SIGMA));
else
T_ARR(ve,punt) = round(normrnd(((dia_ano-1)*MIN_DIA+MU),SIGMA));
end
AUX = round(unifrnd(1,8)); %Random aux for sort C bat
switch AUX
case 1
C_BAT(ve,punt) = 30;
case 2
C_BAT(ve,punt) = 33;
case 3
C_BAT(ve,punt) = 38;
case 4
C_BAT(ve,punt) = 40;
case 5
C_BAT(ve,punt) = 42;
case 6
C_BAT(ve,punt) = 50;
case 7
C_BAT(ve,punt) = 52;
otherwise
C_BAT(ve,punt) = 67;
end
end
end
  …
Equation (2) in the proposed model below calculates the charging power (Pch) of the i-th EV from a set of NEV EVs. The i-th EV arrives at the k-th charging point in the j-th FCS, where np is the number of charging points in the FCS. Equation (2) uses the stochastic generated variables to calculate Pch. The subscripts [i], [j], and [k] are used to indicate that the variable they are associated with depends on the i-th electric vehicle in the charging process, at the k-th charging point, within the j-th charging station.
P c h i j k = S O C f i n i j k S O C i n i i j k T c h i j k × C b a t i j k
The daily load profile at each charging point is determined by the number of EVs arriving and their respective arrival times. Therefore, the charging power at any given charging point within the FCS is detailed in Equation (3), where Pch[np] is the charging power at charging point np, Pch[k] is the charging power at the k-th charging point, and Pch [1] is the charging power at the first charging point. Additionally, for each EV, Pch NEV np indicates the charging power for the NEVth EV at charging point np, Pch NEV k is the charging power for the NEVth EV at the k-th charging point, and Pch NEV 1 is the charging power for the NEVth EV at the first charging point.
P c h   [ n p ] = P c h   [ 1 ]   [ n p ] + P c h   [ 2 ]   [ n p ] + + P c h   [ N E V ]   [ n p ] = x = 1 N E V   n p P c h   [ x ]   [ n p ] P c h   [ k ] = P c h   [ 1 ]   [ k ] + P c h   [ 2 ]   [ k ] + + P c h   [ N E V ]   [ k ] = x = 1 N E V   k P c h   [ x ]   [ k ] · P c h   [ 1 ] = P c h   [ 1 ]   [ 1 ] + P c h   [ 2 ]   [ 1 ] + + P c h   [ N E V ]   [ 1 ] = x = 1 N E V   1 P c h   [ x ]   [ 1 ]
The overall charging load profile for the FCS is calculated by summing up the charging powers from each individual charging points, as outlined in Equations (4) and (5).
P c h   [ F C S ] = P c h   [ n p ] + + P c h   k + + P c h   1 = x = 1 N E V   n p P c h   x n p + + x = 1 N E V   k P c h   x k + + x = 1 N E V   1 P c h   [ x ]   [ 1 ]
P c h   [ F C S ] = x = 1 n p P c h   x
Each charging point is configured to feed a maximum charging power of 100 kW. Figure 5 shows the process of generating the load profile of the j-th FCS to program the QDM for the simulation.

4. Test System and Study Cases

4.1. Network Description

The case study focused on an MV distribution network near a highway linking Benevides City and Santa Isabel City in northern Brazil. These intermediate cities are located in close proximity to Belém, the capital of the state of Pará. The feeder’s strategic location near the main road, which leads to other tourist destinations, generates substantial vehicular traffic. Consequently, it presents an excellent opportunity for the installation of fast charging stations.
The network includes a 13.8 kV, 12.54 km feeder named BENBN-01, which has 161 distribution transformers, a bank of three single-phase step voltage regulators with 2.75 MVA and 13.8 kV, and two 600 kVAr fixed capacitor banks. A 20 MVA, 110 kV/13.8 kV, three-phase transformer supplies the feeder at the Benevides substation. Annual load demand profiles of feeder BENBN-01 were obtained from actual measurements at the Benevides substation. The step voltage regulator control was out of service.

4.2. Study Cases

The simulations were performed for three cases: the Base Case, the FCS connections along the feeder, and the FCS connections concentrated at the end of the feeder. The behavior of the network being tested was simulated using actual feeder load data for the year 2019. The annual simulation was performed with a simulation step of 5 min, resulting in 105,120 data points for the simulated year. The simulation was repeated ten times for each case, and the processed data corresponded to the average results of the simulations for each analyzed variable for each simulation step. The study cases are as follows:
  • Case 1—Base Case: The Base Case does not have FCSs.
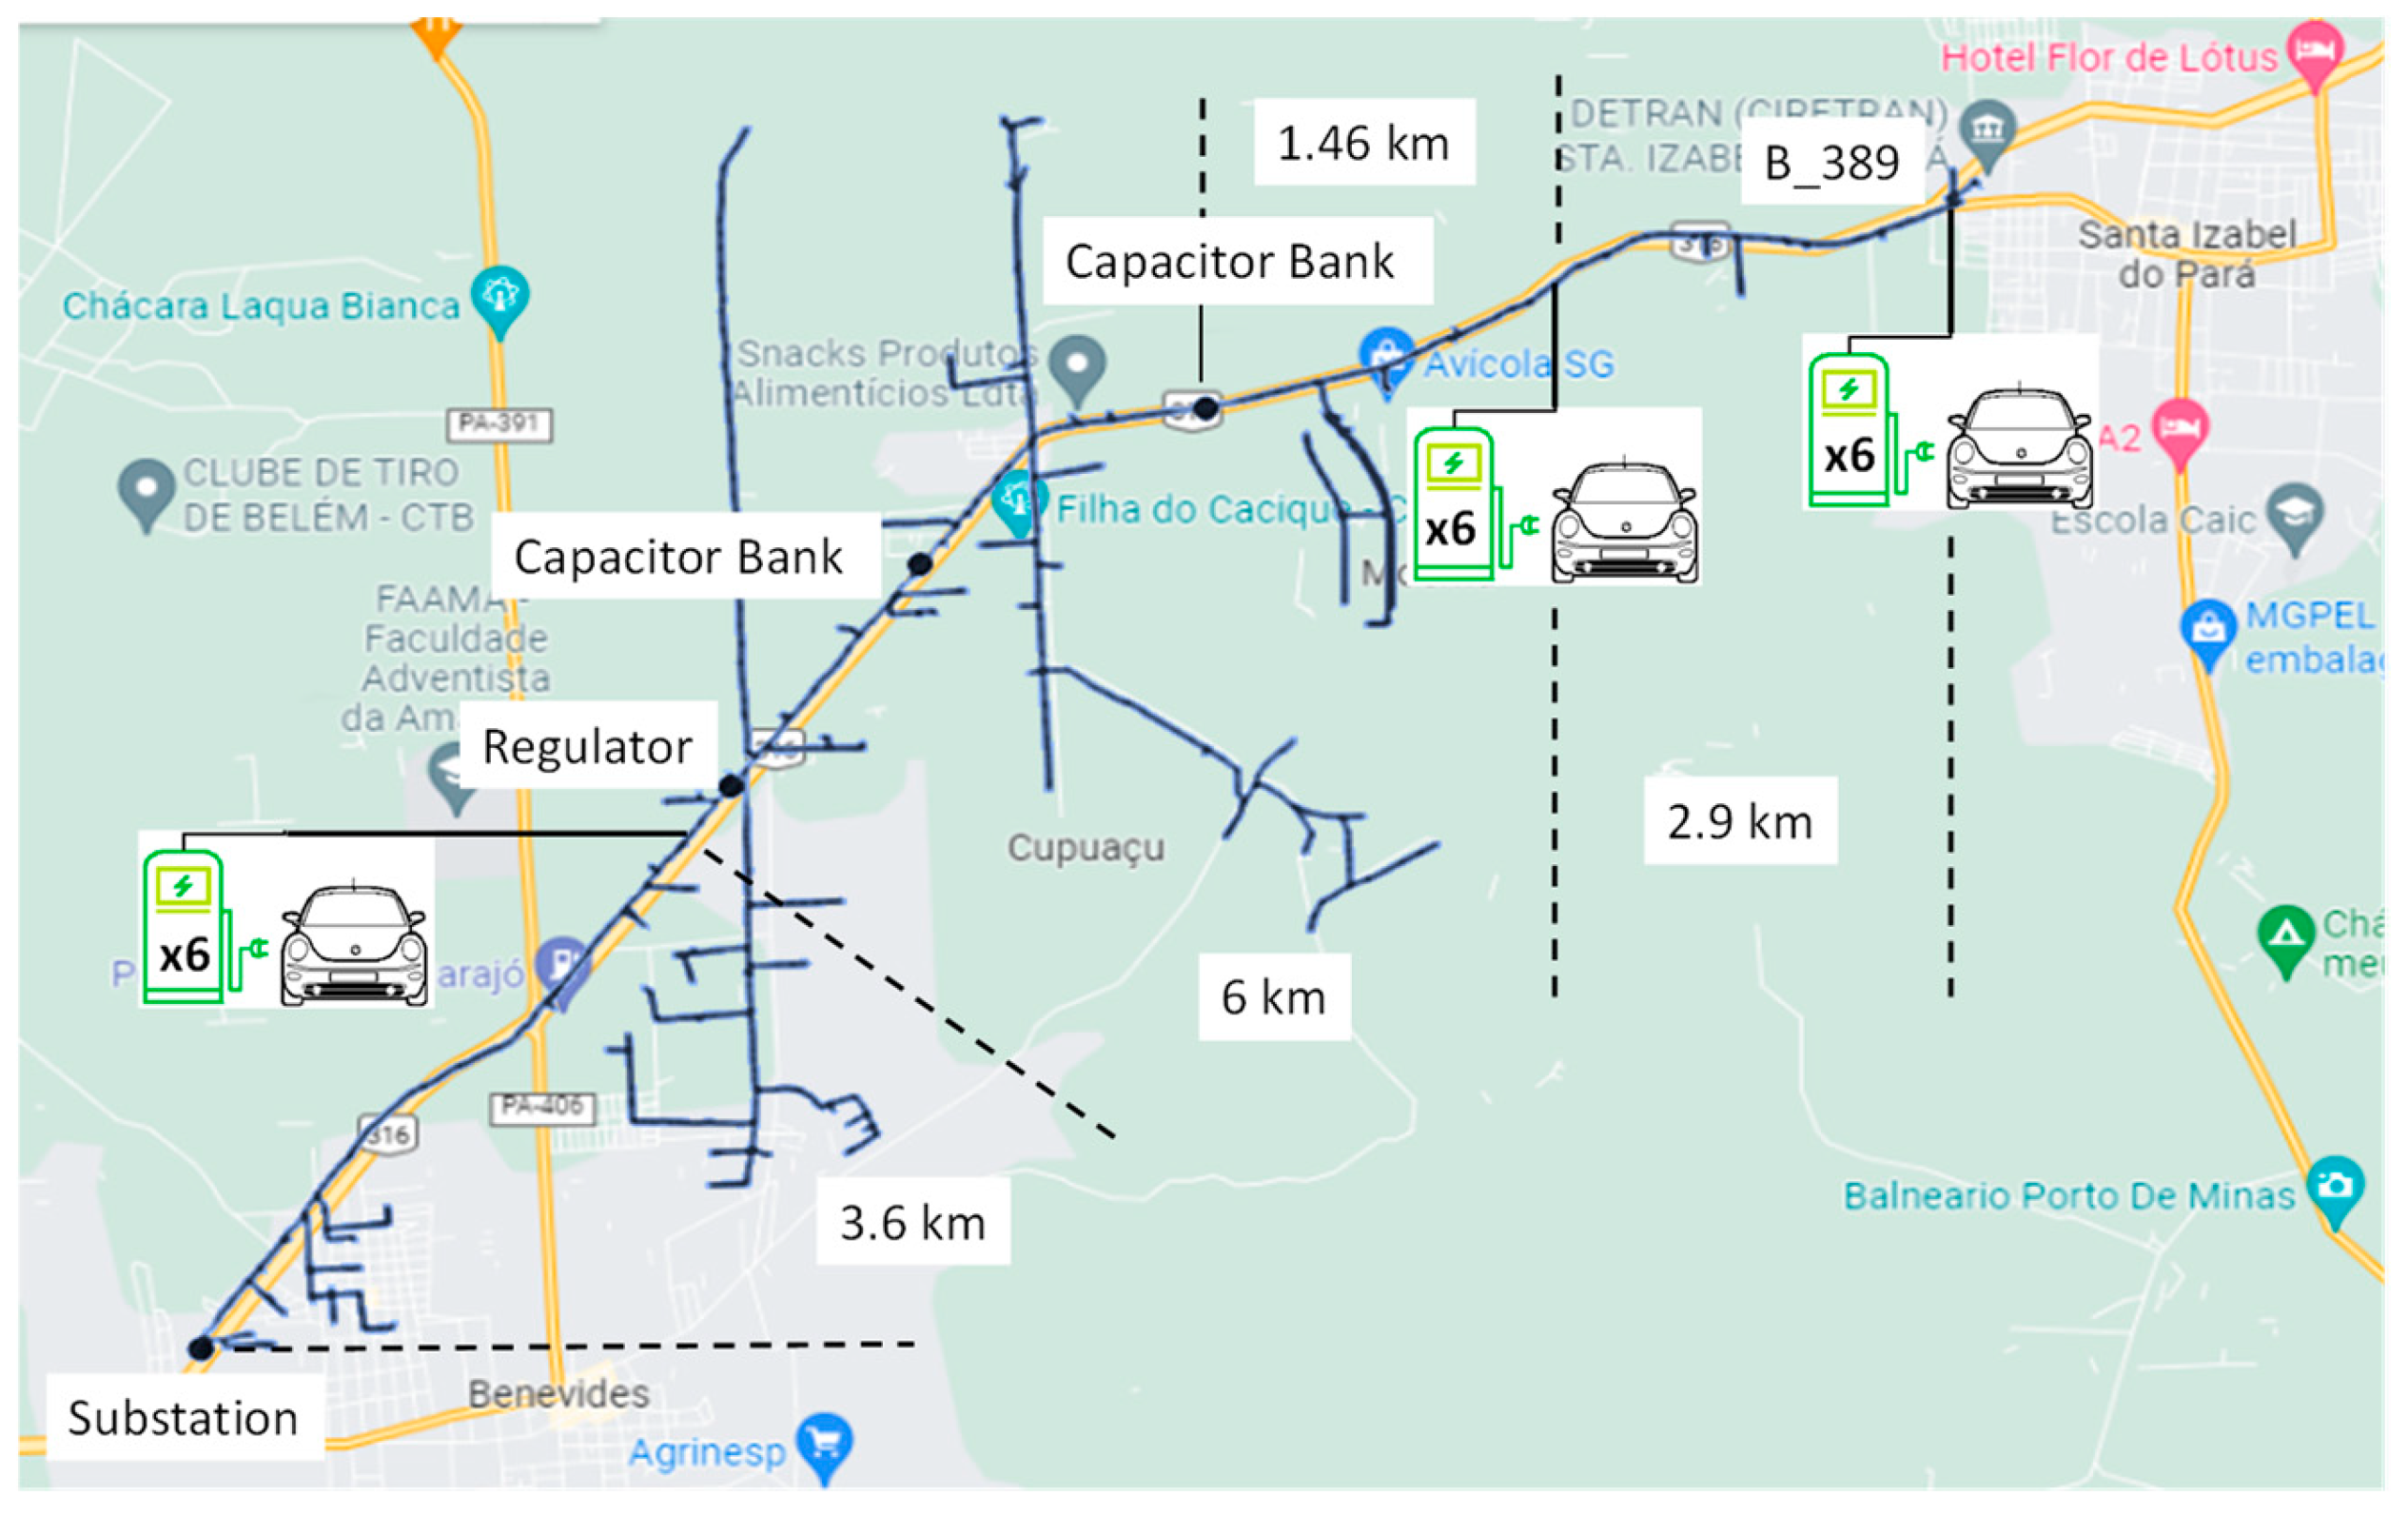
  • Case 2—Feeder BENBN-01 with three FCSs located along the feeder: Three FCSs are located at different places in the feeder, as illustrated in Figure 6.
  • Case 3—Feeder BENBN-01 with concentrated fast charging points at the end of the feeder: In this case, the B_389 bus has 18 charging points from an FCS. A 13.8/0.38 kV, 2.5 MVA, three-phase transformer feeds the charging points.
Additionally, in Cases 2 and 3, two impact scenarios are compared for each case. The first scenario does not include the effects of increasing EV mobility due to the holiday season, while the second scenario does.

5. Results and Discussion

This section presents the results of the proposed method, considering the annual seasonal time-series data mentioned above. The cities of Benevides and Santa Isabel, located in the state of Pará in Brazil, do not experience the traditional four seasons due to their geographical location. Instead, the year is divided into two distinct periods: season 1, from January to May, features heavy rainfall exceeding 120 mm, while season 2, from June to December, has lighter rainfall, not surpassing 120 mm. From a stochastic analysis, the results regarding voltage magnitude, feeder loading, and increased active power losses in the feeder are presented.

5.1. Assessment of Undervoltage Violations

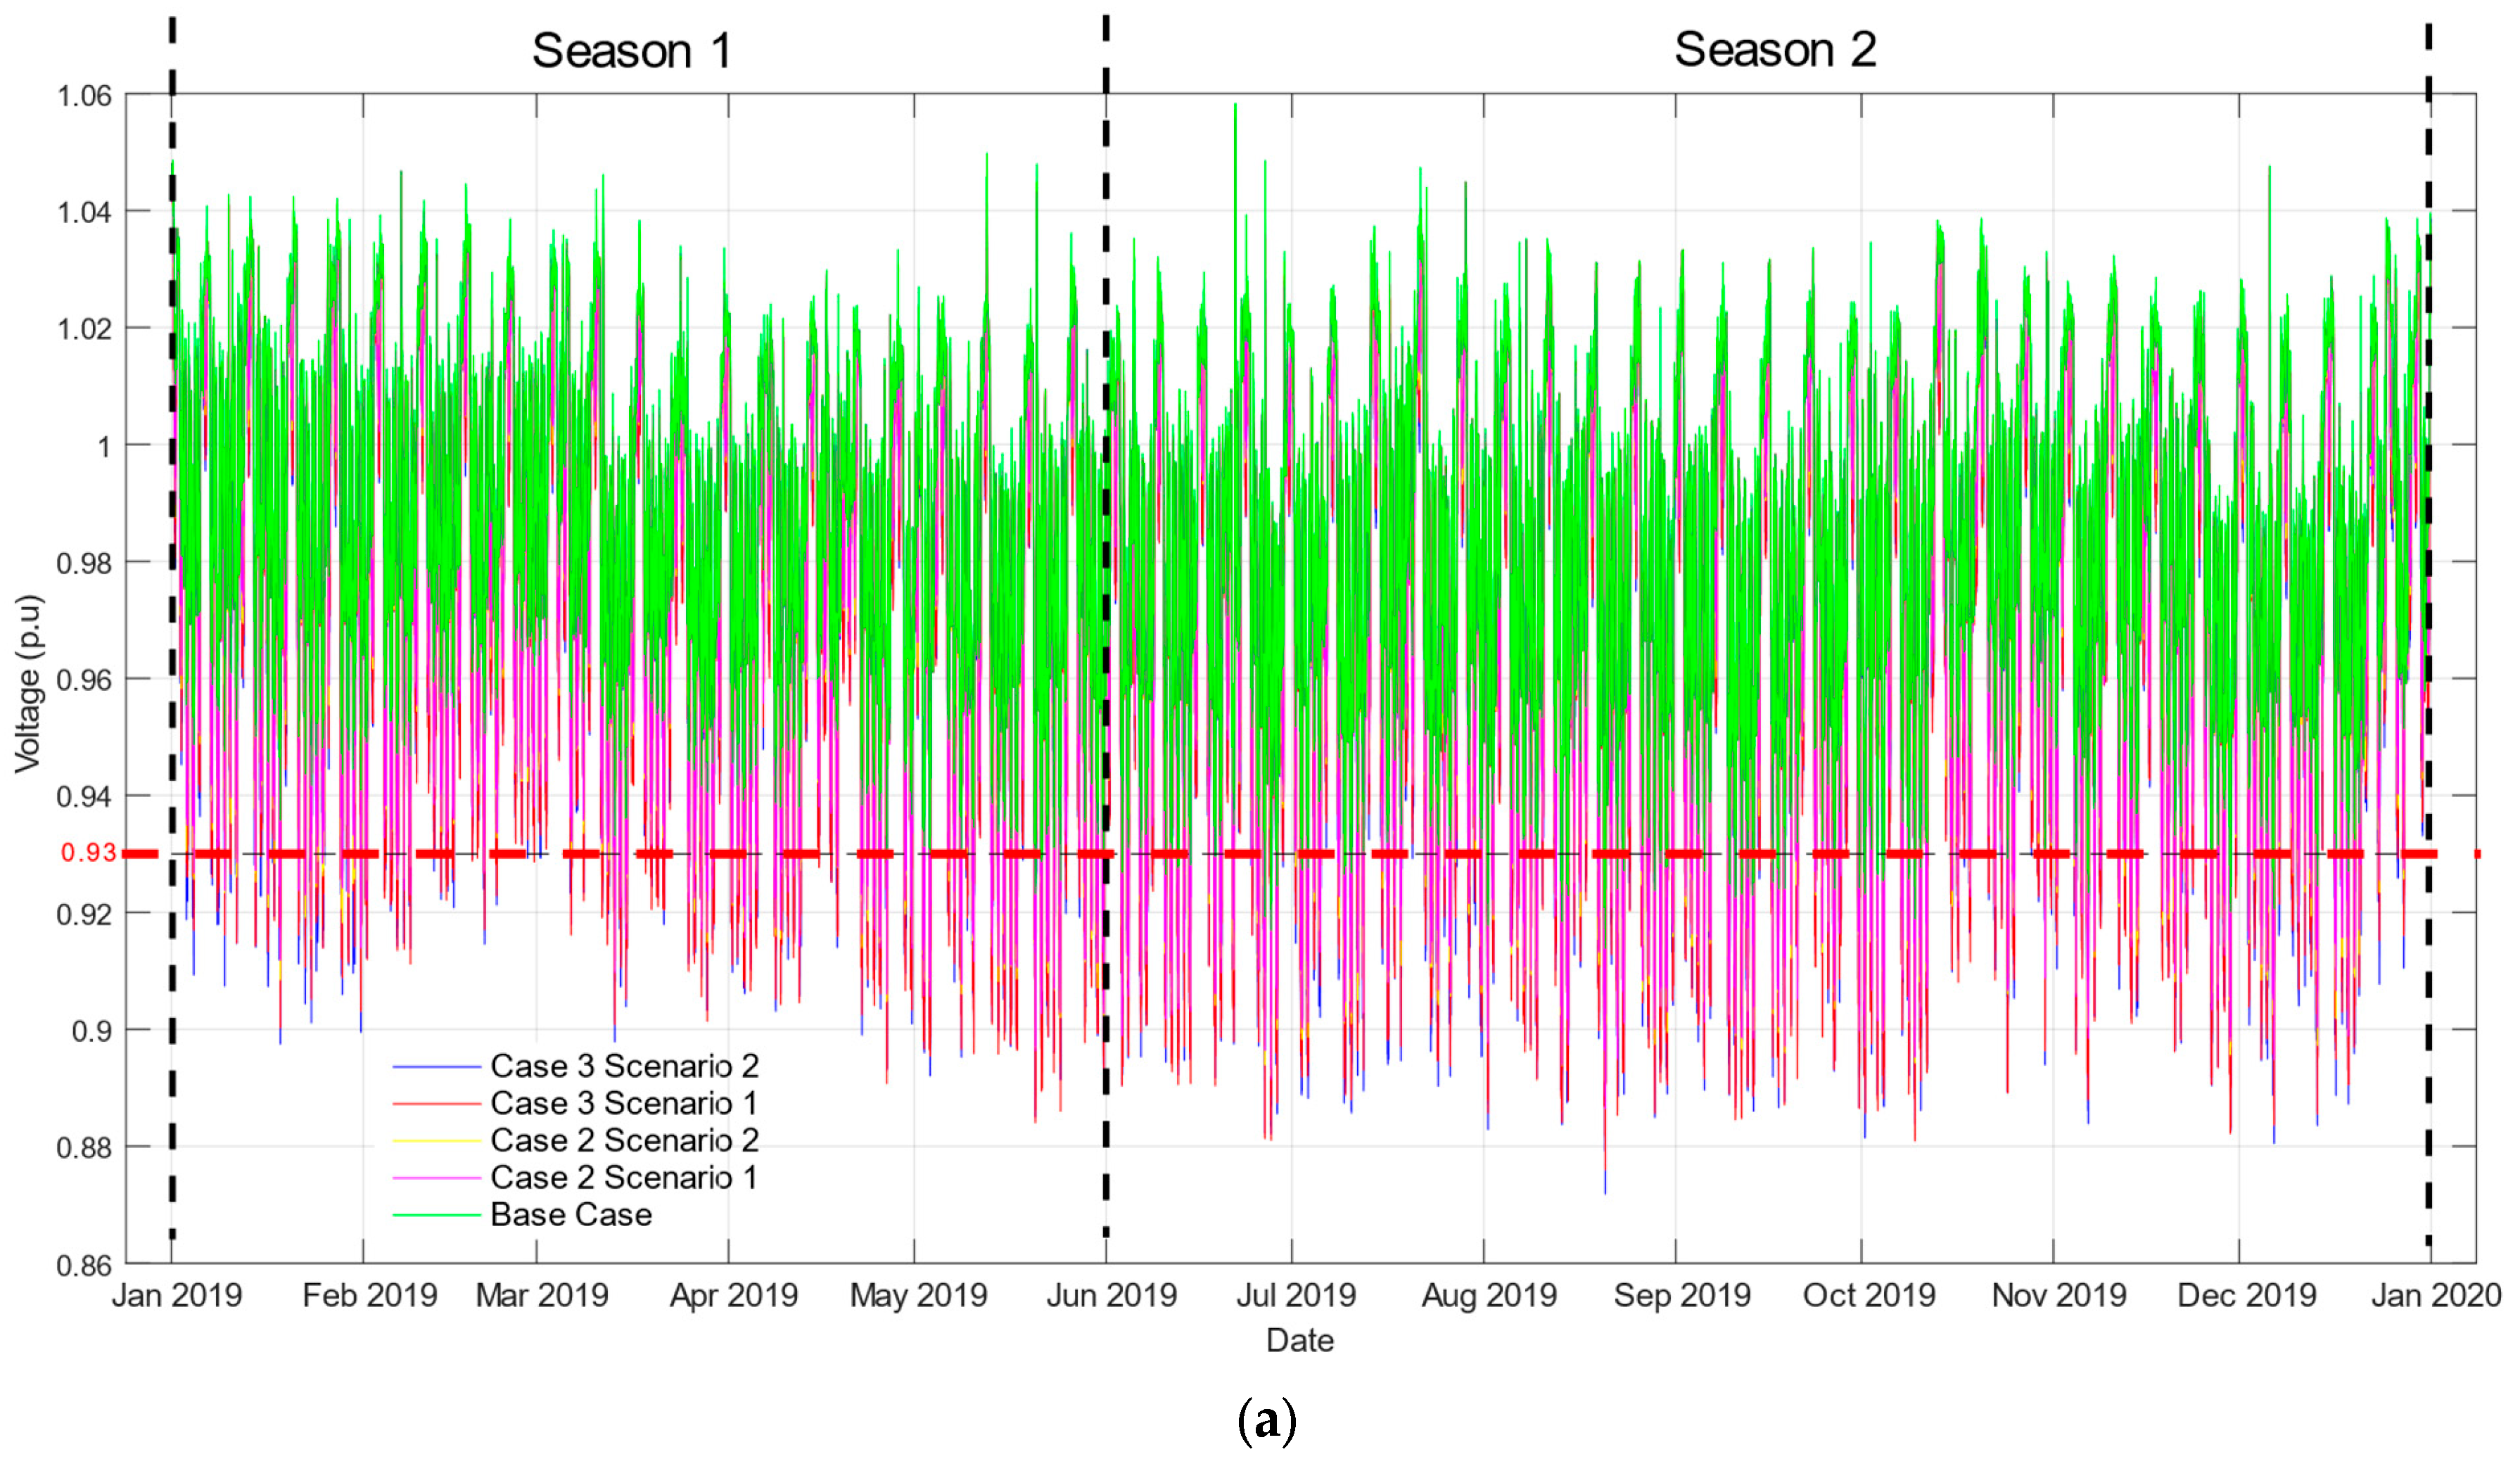
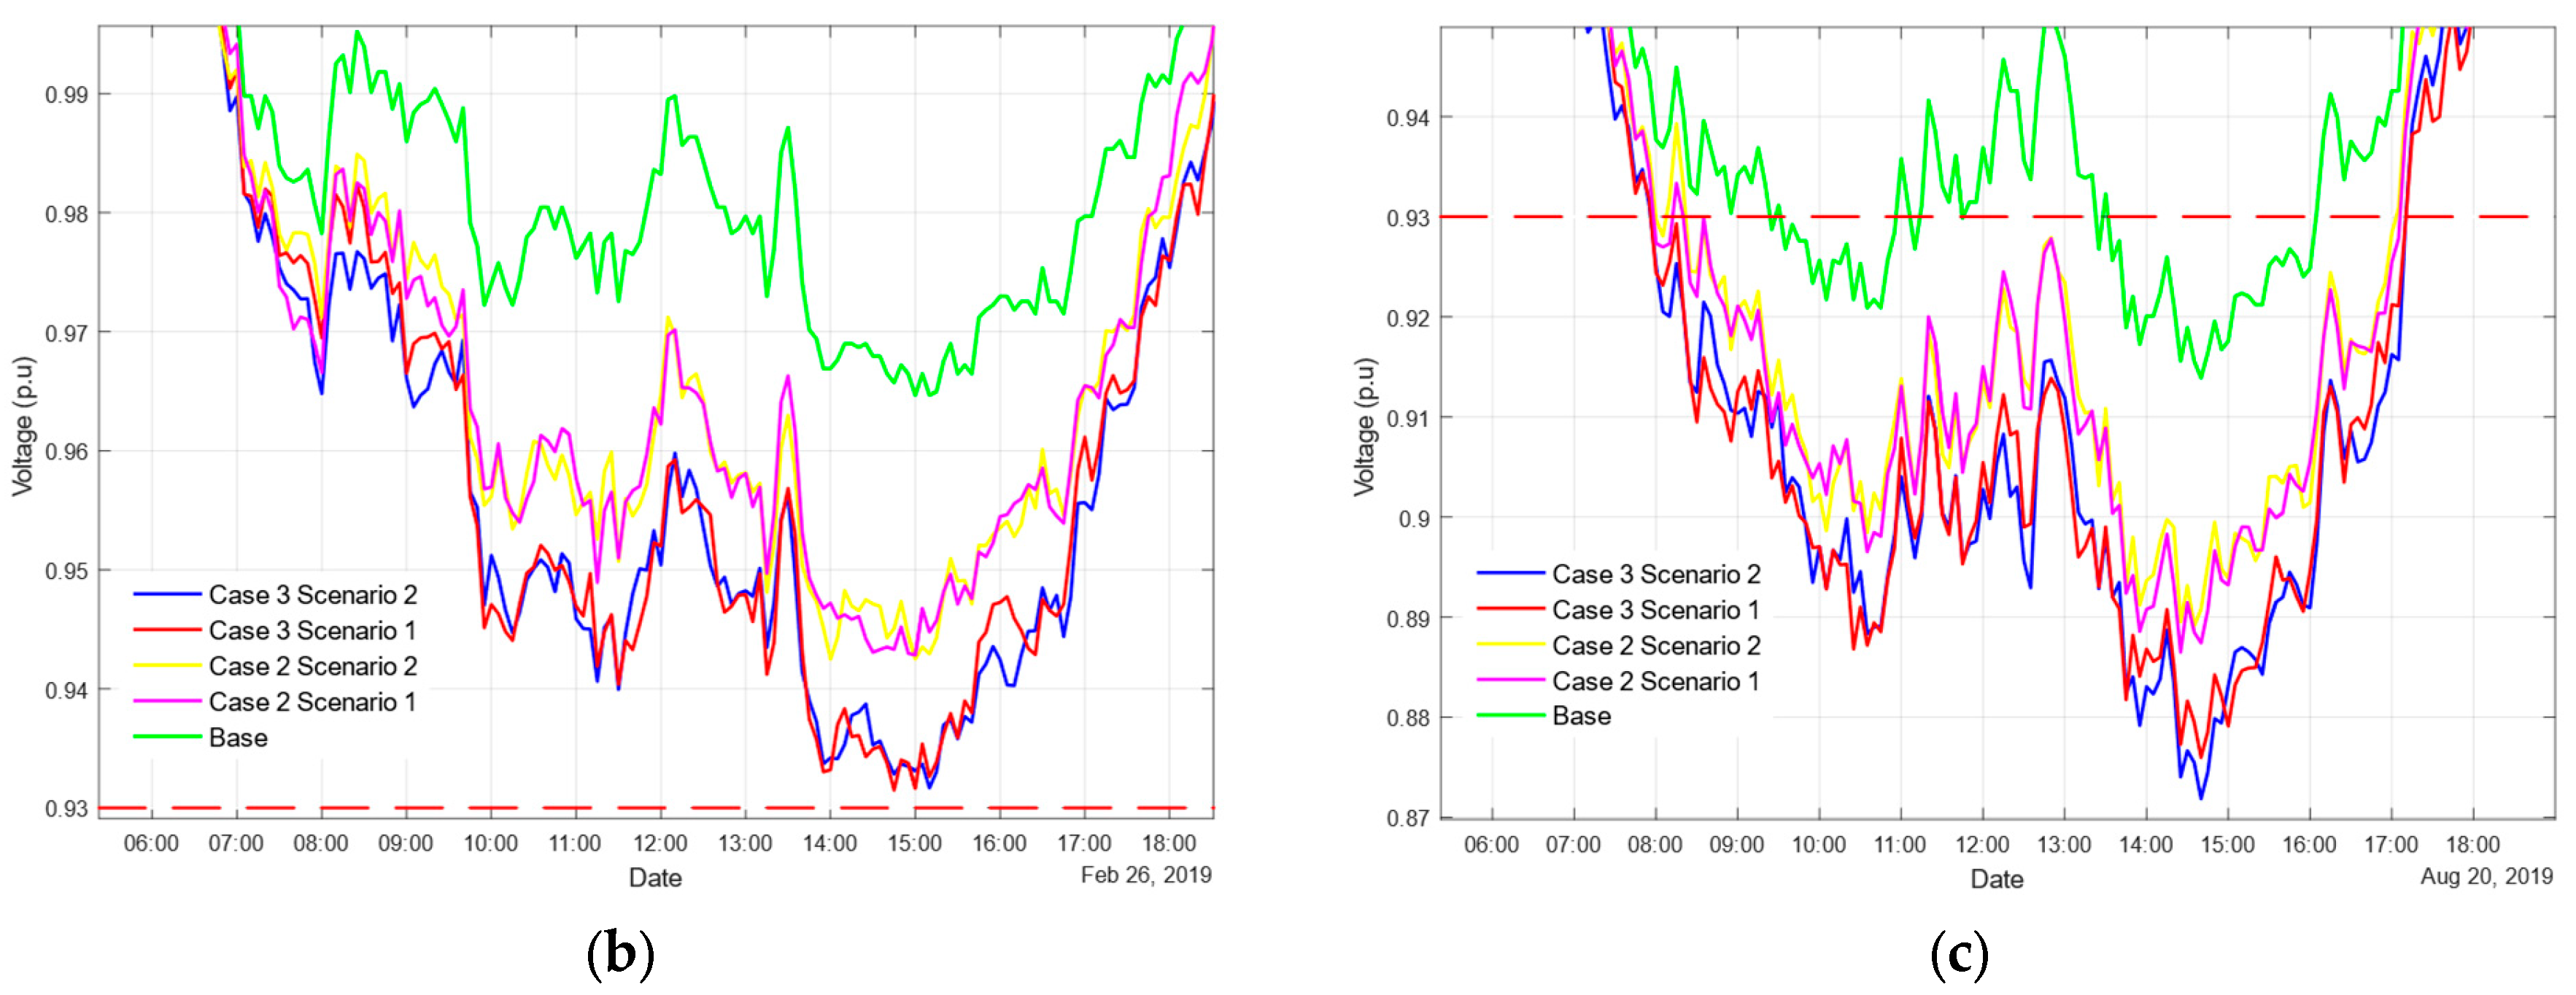
Figure 7a presents the 2019 voltage profile at bus B_389 for the Base Case, as well as Cases 2 and 3 across Scenarios 1 and 2. Throughout the year, there are days when the voltage for all cases remains above the minimum threshold of 0.93 p.u., marked by a red dashed line, indicating no risk of undervoltage violations. Conversely, there are periods when the voltage dips below this threshold, suggesting a non-zero probability of undervoltage violations on those days, as data beneath the red dashed line signify a breach of the undervoltage limit.
A comparison is drawn between two specific days: one in February (Figure 7b), which shows no undervoltage occurrences, and another in August (Figure 7c), where the voltage falls below 0.93 p.u. from approximately 8 a.m. to 5 p.m. Evaluating undervoltage violations based solely on the day in February would yield an underestimated result due to no observed limit breaches. By contrast, an assessment based on the day in August might lead to an overestimation. Hence, it is crucial to conduct yearly evaluations rather than focusing only on months with extreme cases.
Figure 8 shows the voltage magnitude data for a year. The Base Case does not fall below the lower voltage limit from January to March. However, for all months, the voltage magnitude values for Cases 2 and 3 are below 0.93 p.u. The lowest voltage value (approximately 0.87 p.u.) occurs in August for Case 3.

5.2. Assessment of Equipment Overload

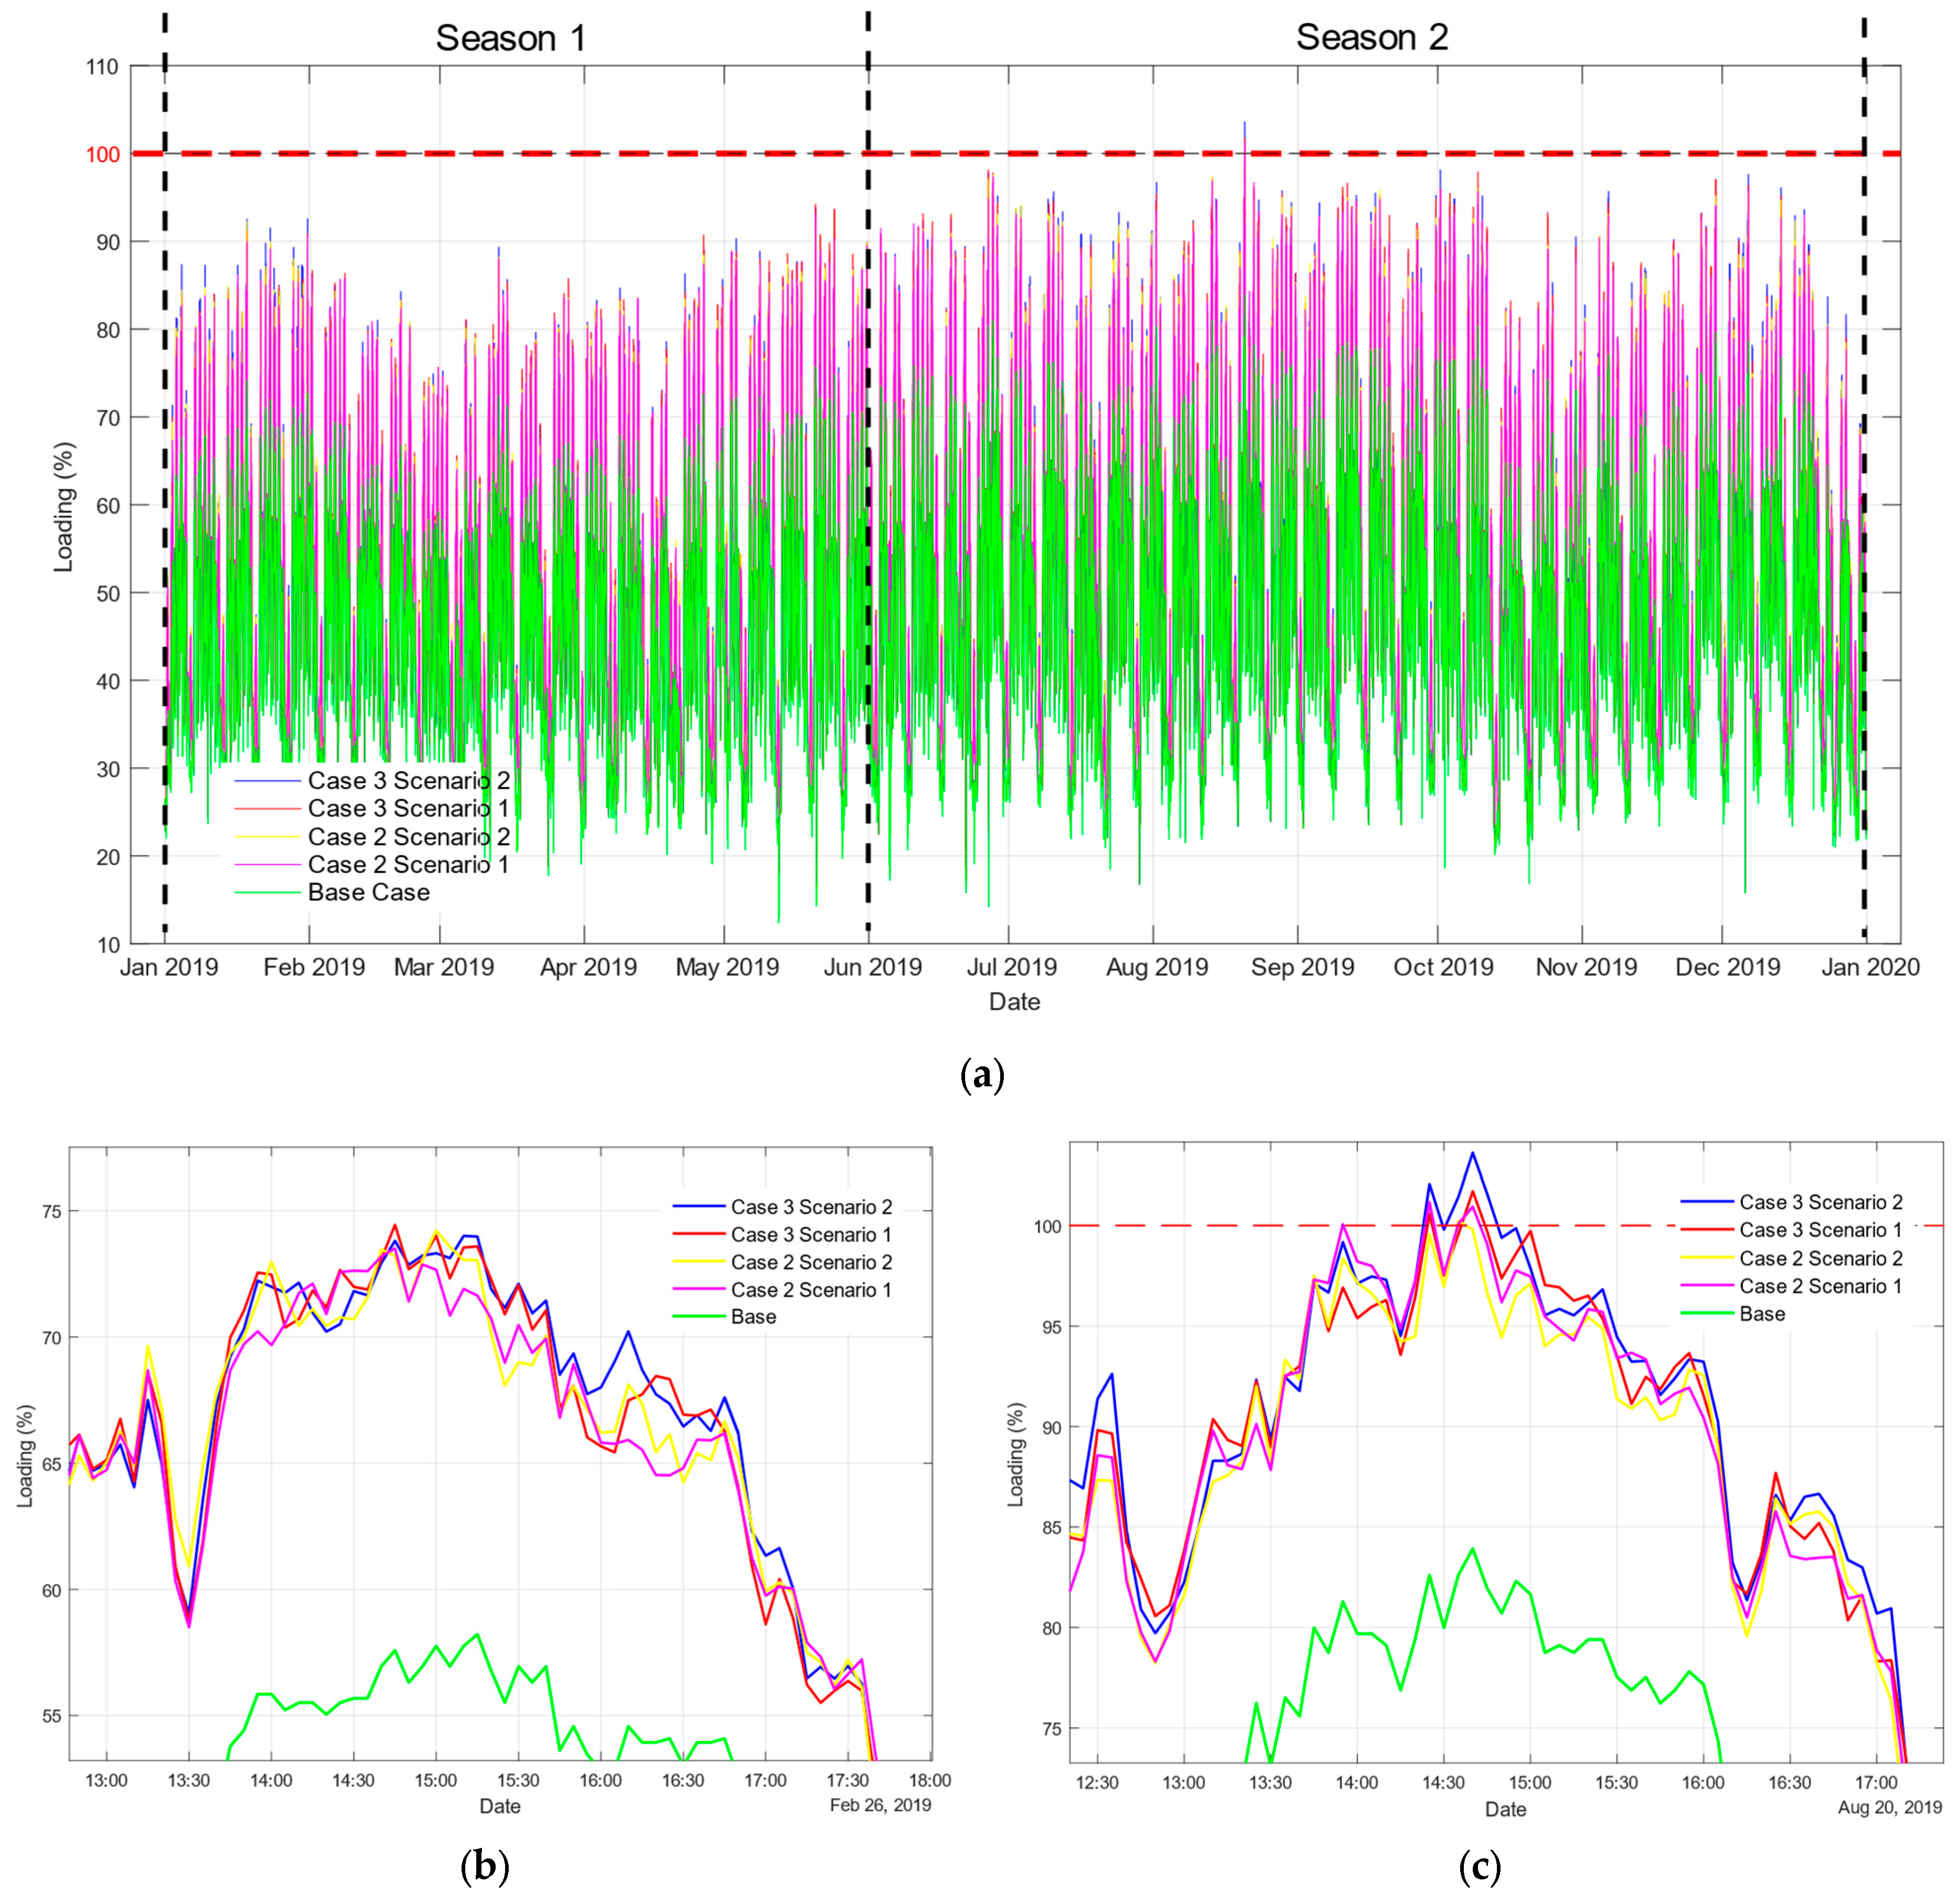
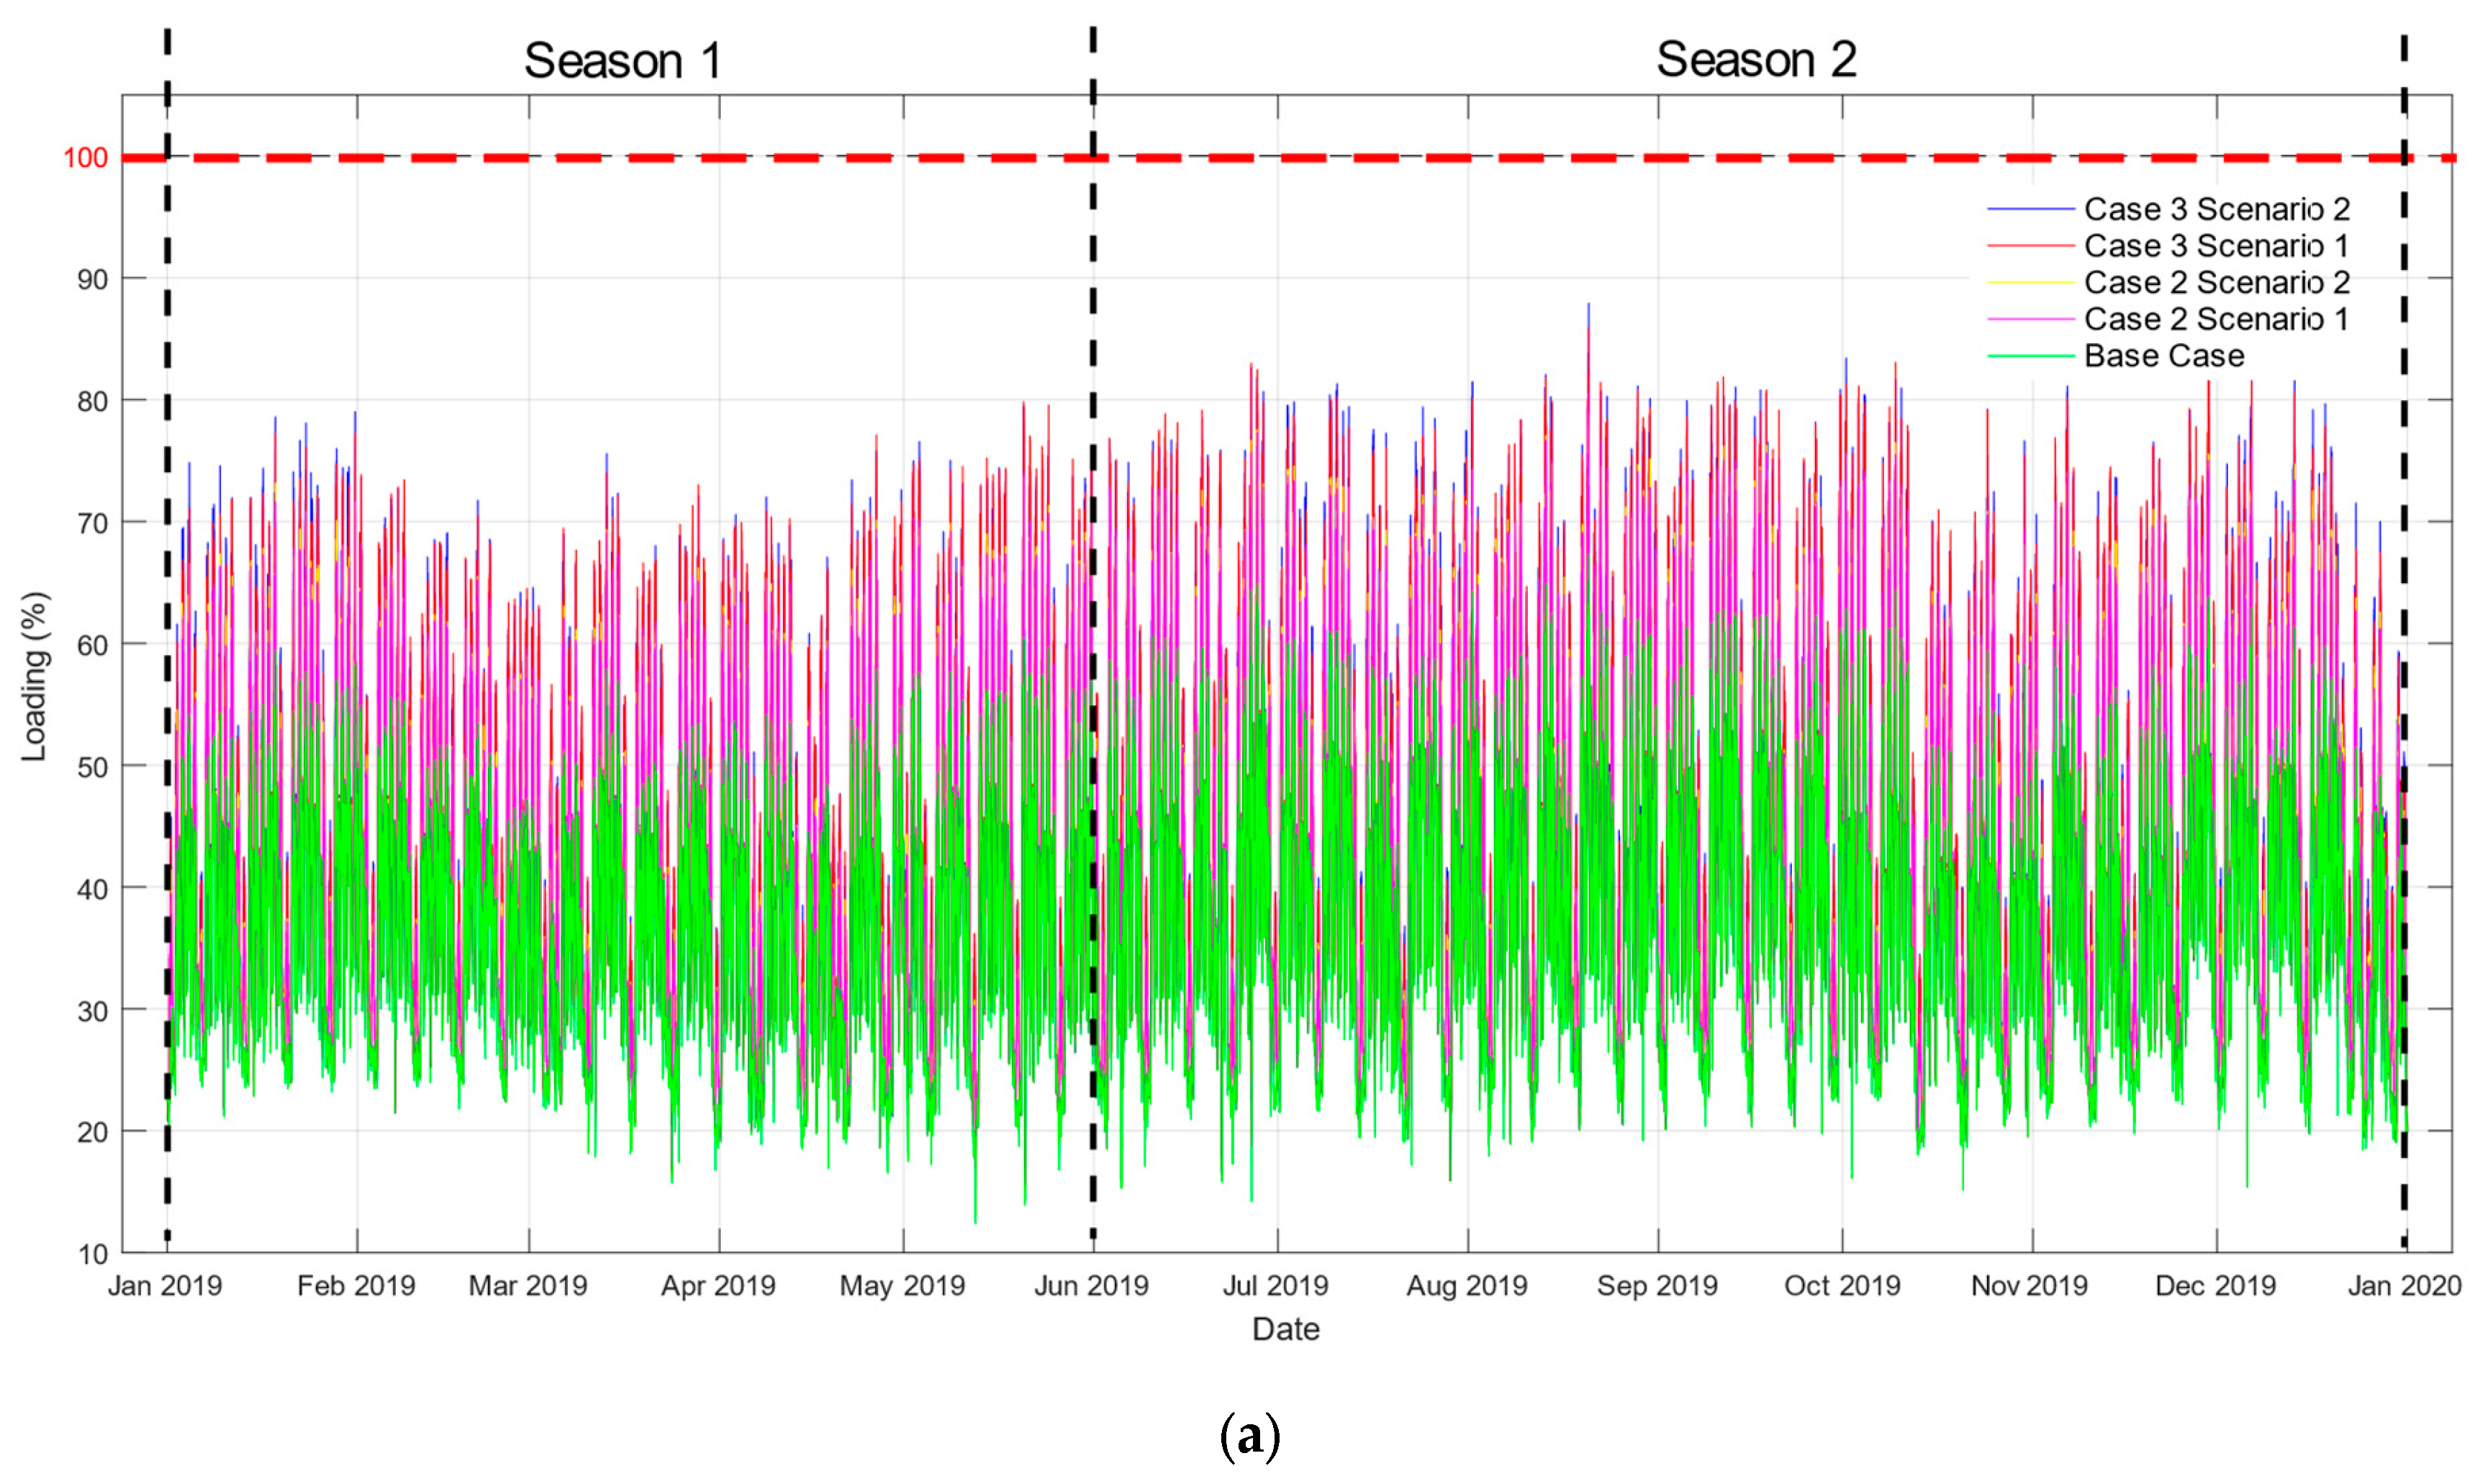
Figure 9a displays the annual feeder load, highlighting that, on 20 August(Figure 9c), there was a brief instance where the load exceeds capacity in Case 3 for both Scenarios 1 and 2, peaking at approximately 103%. Conversely, feeder overload is not an issue for the rest of the year, as exemplified by 26 February (Figure 9b), where no overload occurs. Therefore, the probability of load violations is notably low in August and negligible on other days.
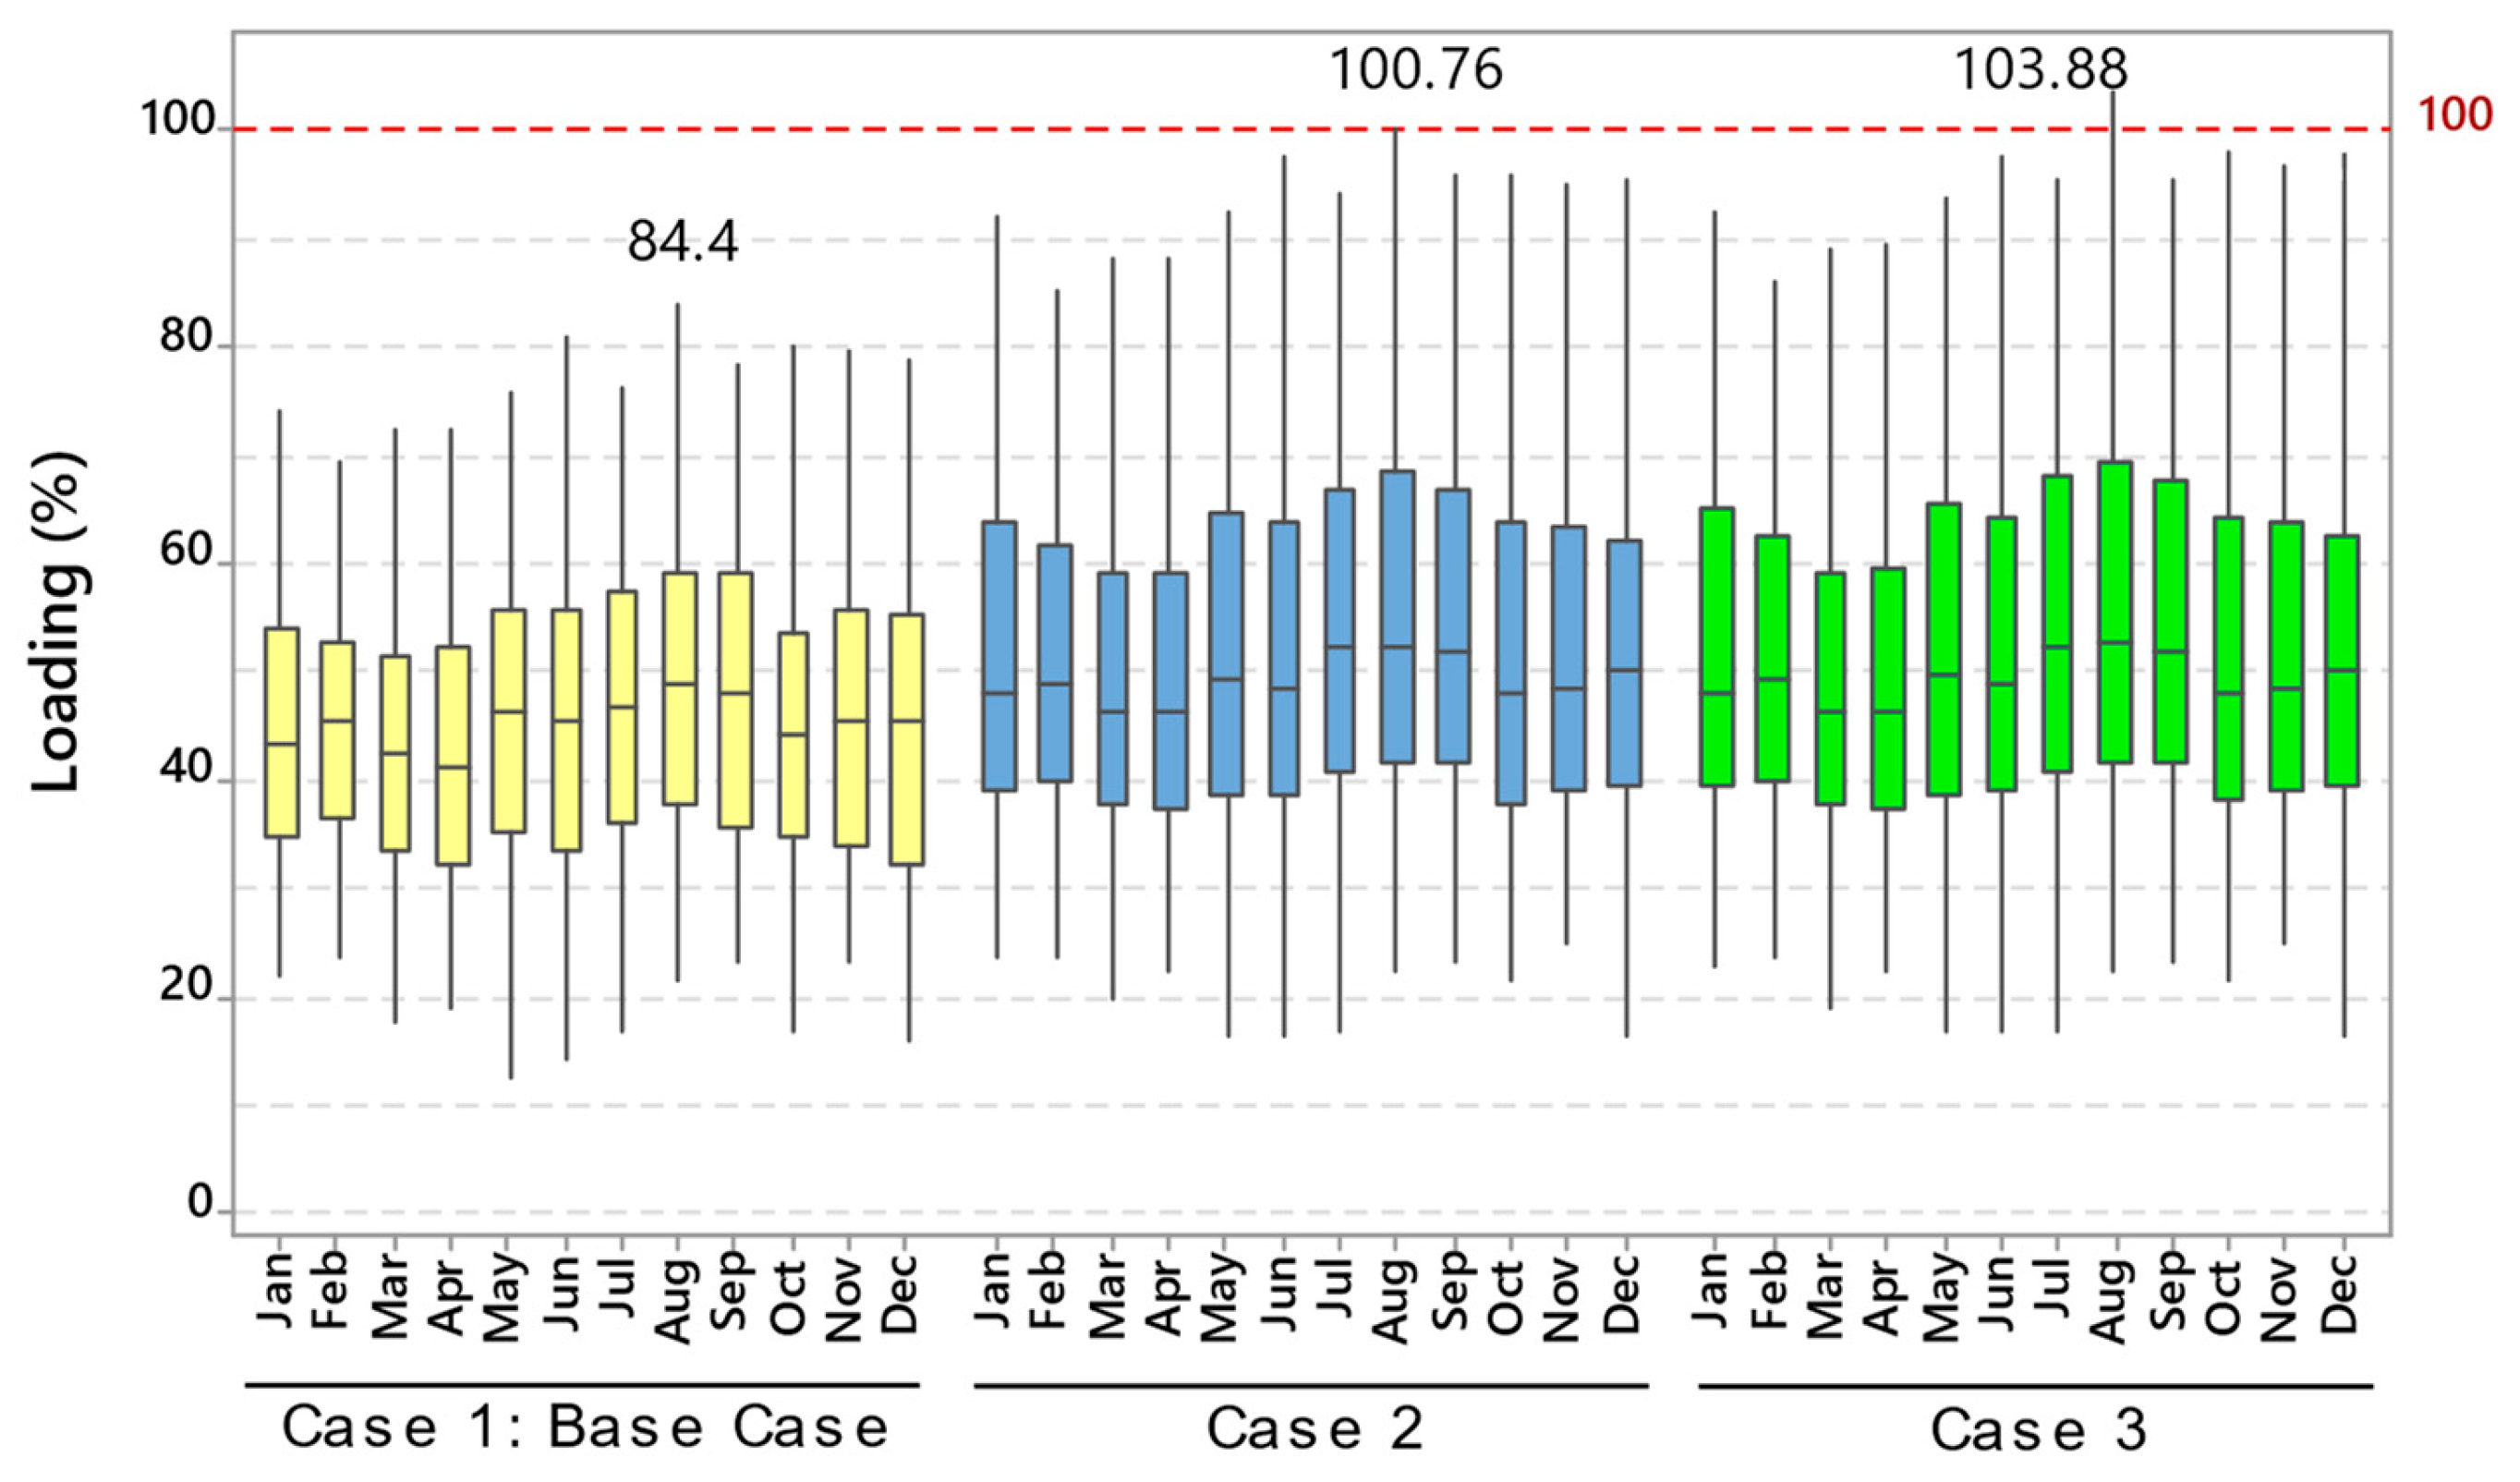
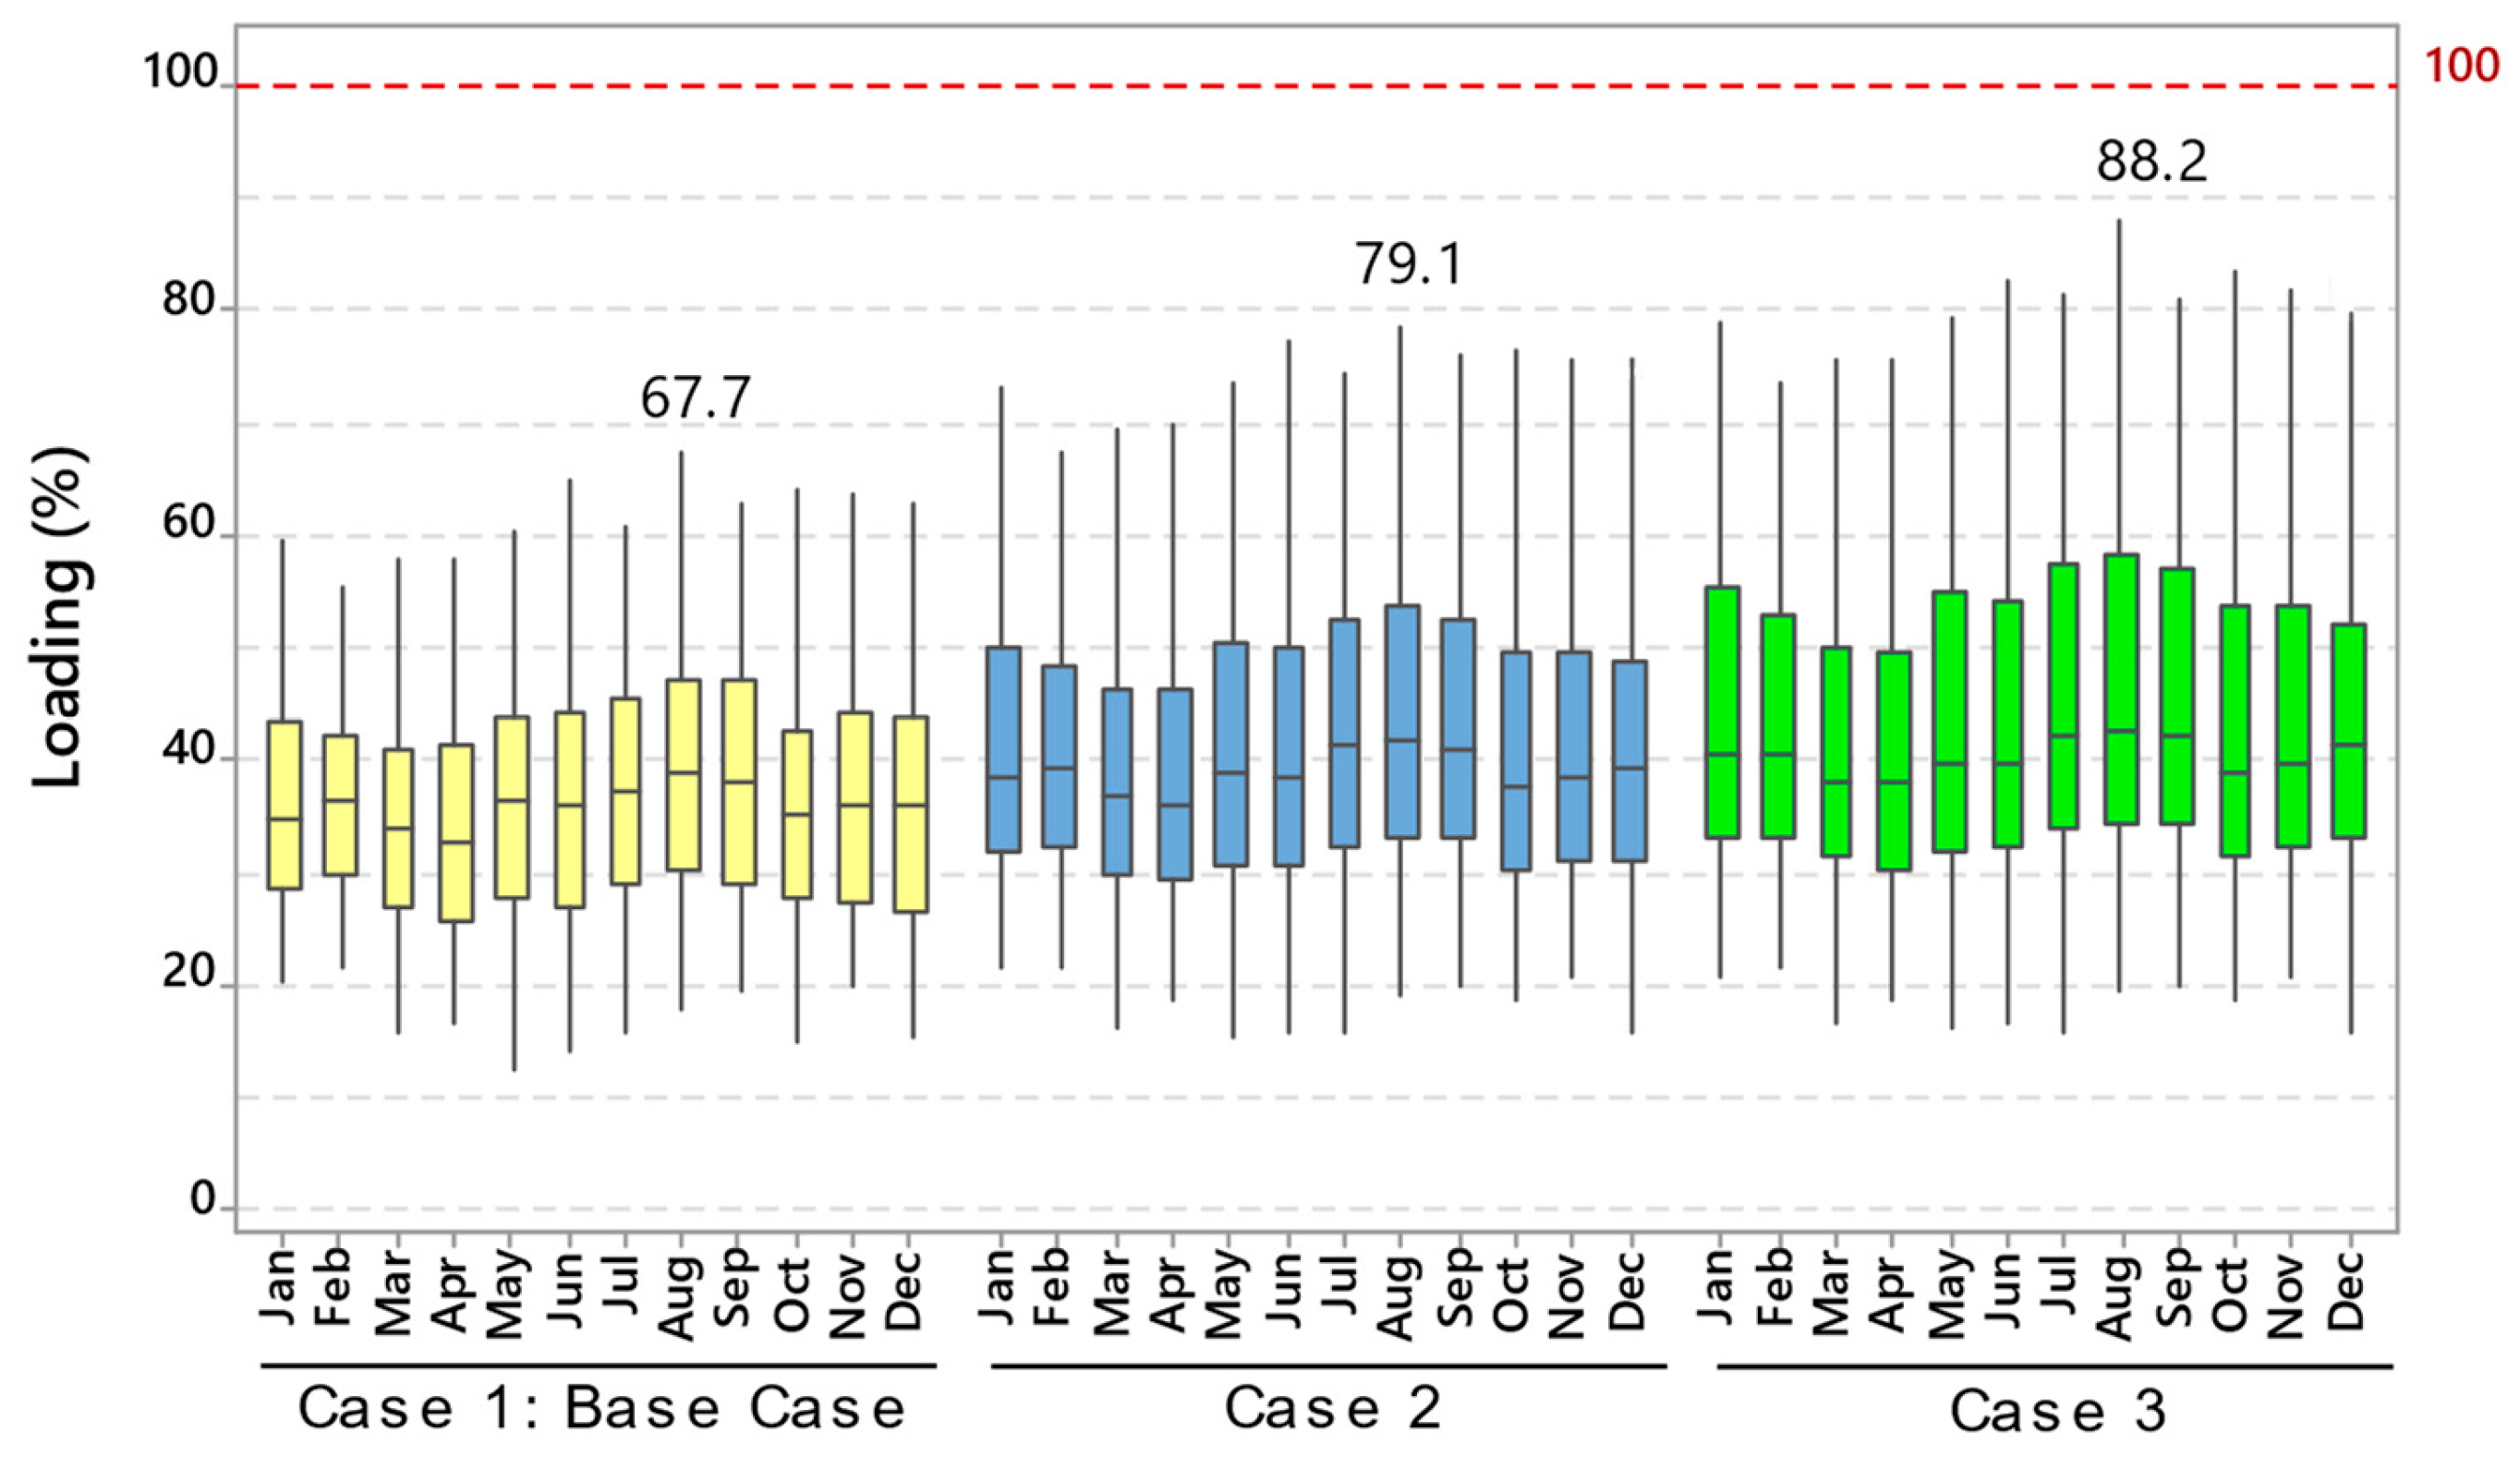
Figure 10 presents a boxplot of the feeder load, with median values between 40% and 55%. The boxplot further indicates load limit breaches in August for Cases 2 and 3, as any data above the red dashed line represent a limit violation.

5.3. Assessment of Step Voltage Regulator Load Violation

Figure 11a illustrates the regulator load over the year, which remains below the overload threshold. Figure 11b,c compare the loads on 26 February and 20 August, respectively. On 26 February, the peak load is nearly 64% in Scenario 1 for Case 3, compared to around 57% for Case 2 and approximately 47% for the Base Case. On 20 August, the highest load reaches about 88% in Scenario 2 for Case 3, with Case 2 at roughly 78% and the Base Case at 67%. The maximum regulator load varies from 55% to 88% throughout the year.
Figure 12 presents the boxplot of the data for step-voltage regulator load. The results show that the medians of Cases 2 and 3 are around 40%, which are about 3% greater than the values for the Base Case each month. Additionally, it is possible to observe that Case 3 has a more significant impact on the load of the step-voltage regulator because 75% of the data have values above 75% of the data in Case 2. The step-voltage regulator does not suffer overload in any of the cases simulated.

5.4. Assessment of Active Power Losses in the Feeder

Figure 13 shows the percentage of active power losses in the MV feeder. Seventy-five percent of the data for August and September, equivalent to the third quartile, are below 4.2% for the Base Case. In Case 2, the fourth quartile is above 5% only in August. In Case 3, 75% of the data in March and April are below 5% of active power losses; for the other months, at least 25% exceeds 5%. The maximum values for Cases 3 and 2 are 8.97% and 7.75%, respectively. Thus, the percentage of active power losses is more significant in Case 3 than in the other cases.

5.5. Probability of Limit Violation of the Investigated Issues

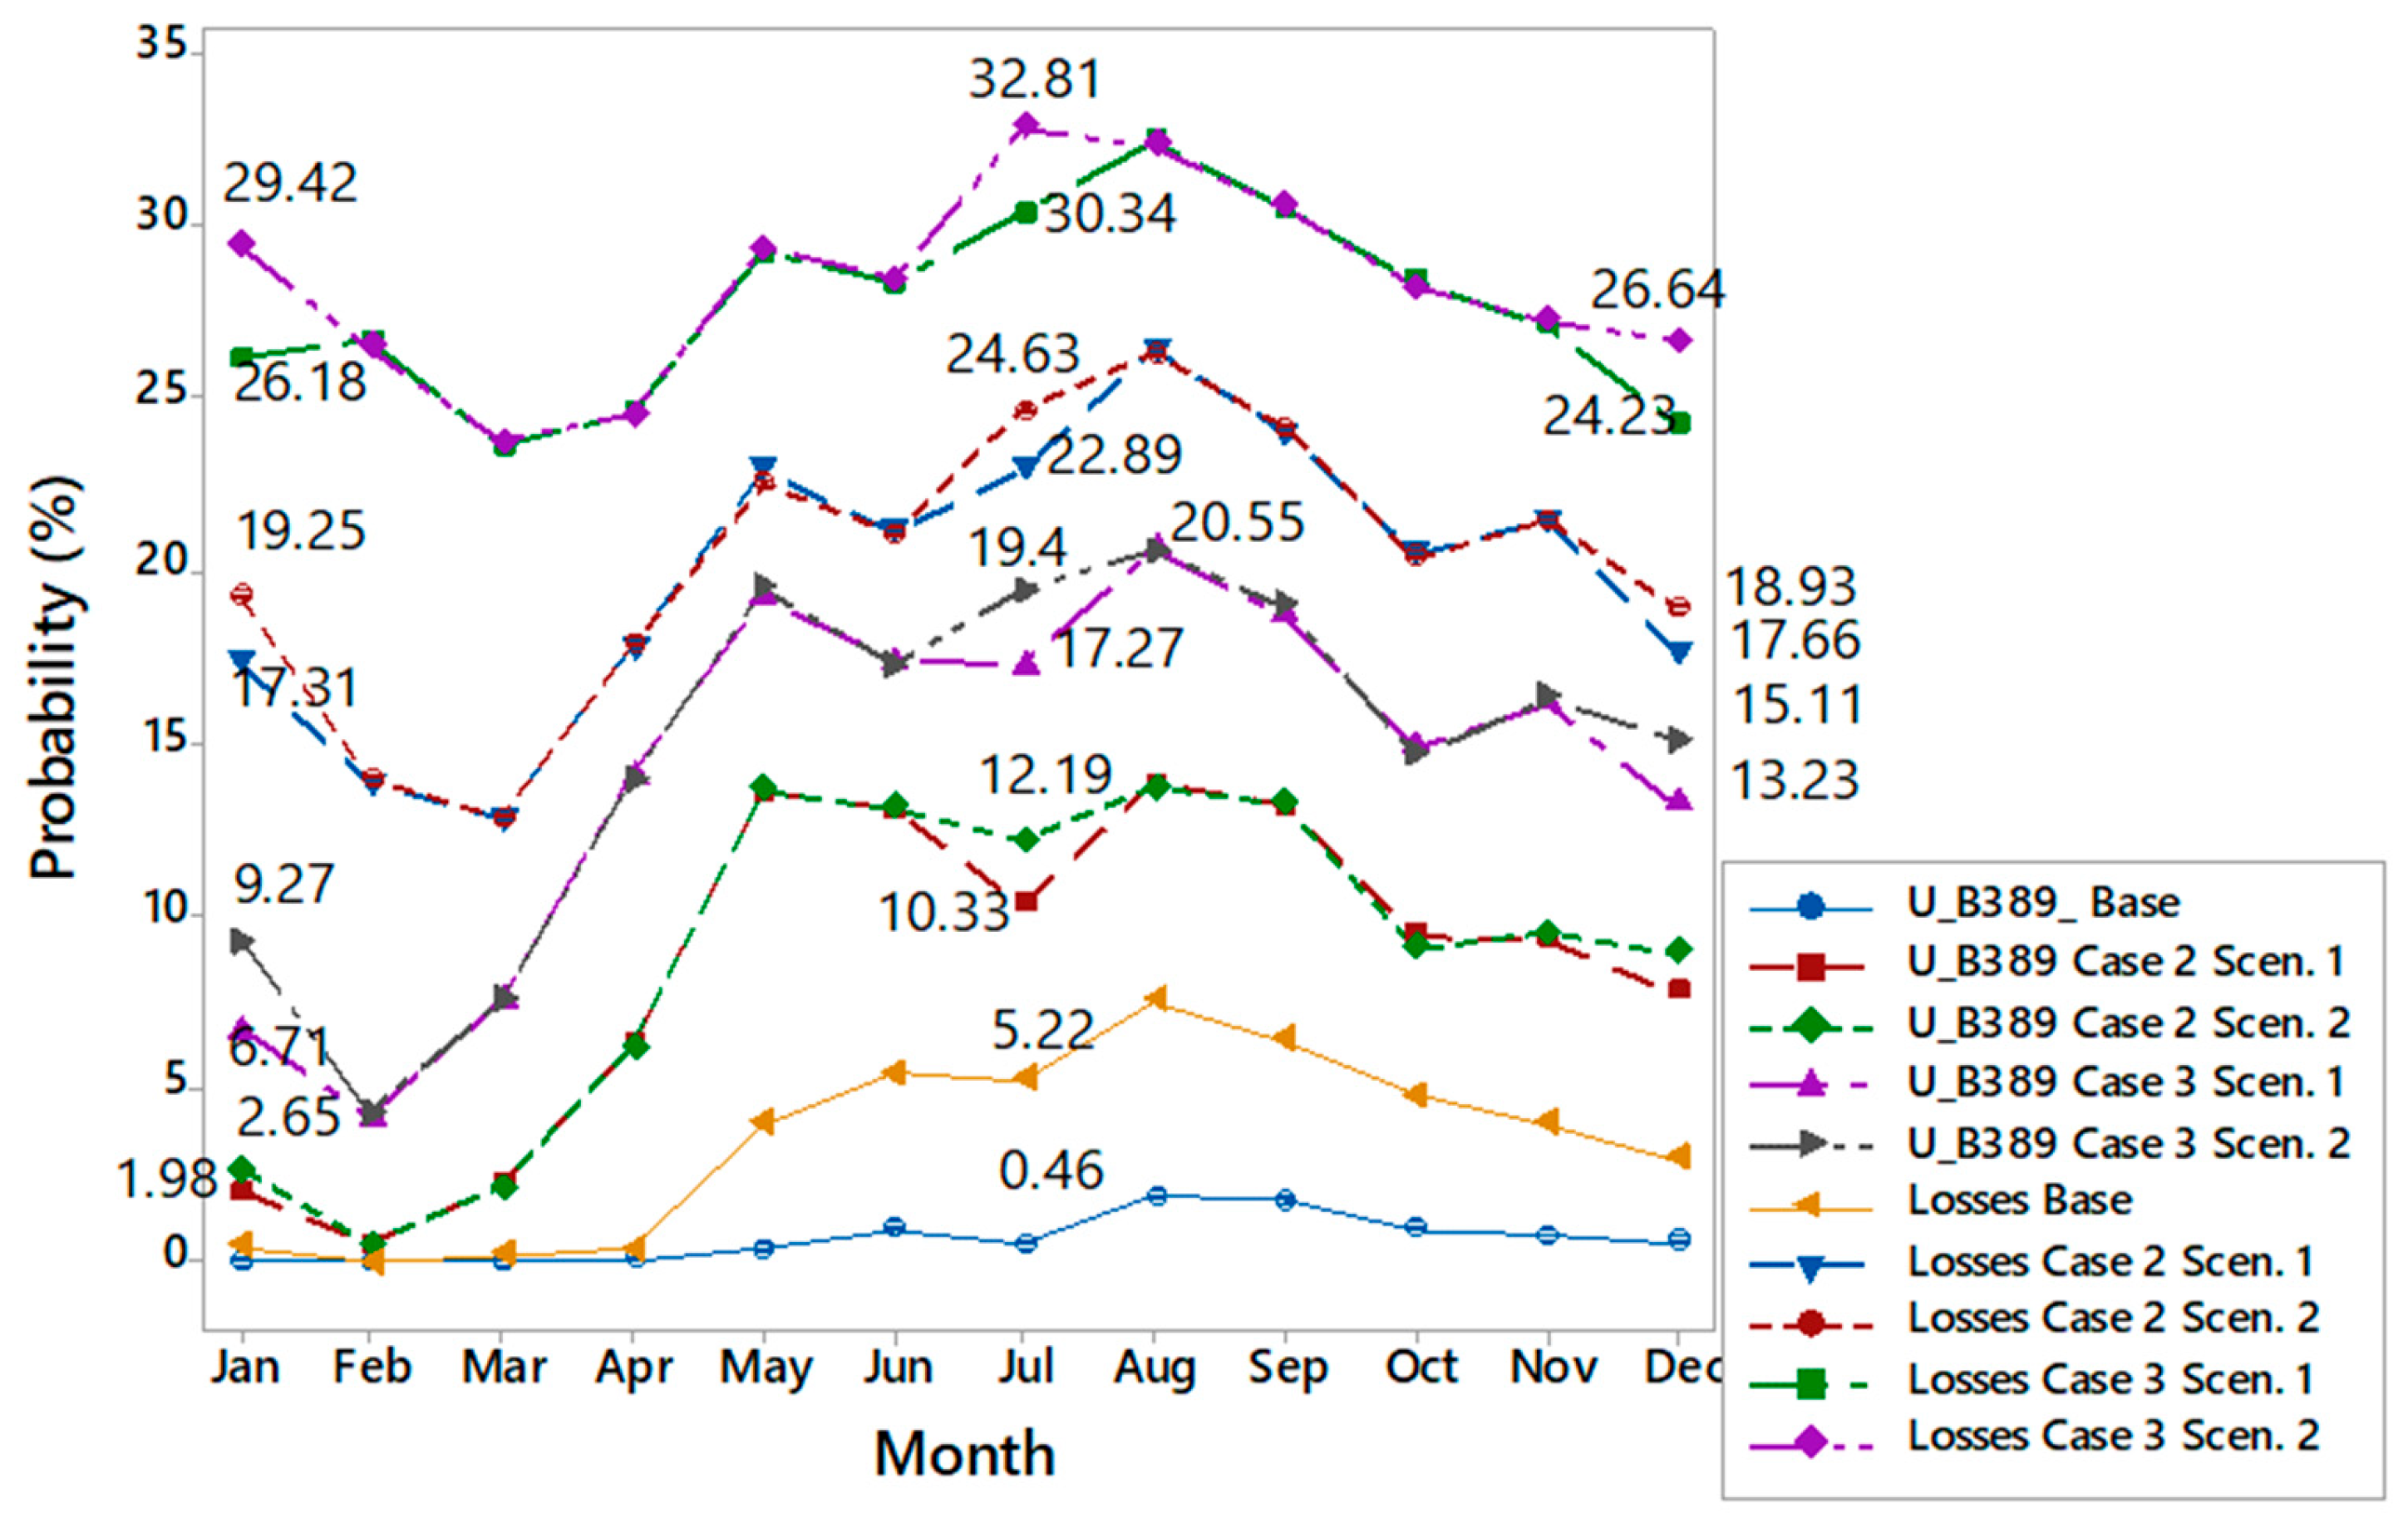
Figure 14 shows the limit violation probabilities for voltages below 0.93 p.u. and active power losses above 5%. The highest limit violation probability for active power losses occurs in July for Case 3 in Scenario 2, reaching 32.81%. On the other hand, for the same Case 3 but in Scenario 1, the probability for active power losses is 30.34%. The difference between both scenarios is 2.47%. The differences between the mentioned scenarios for Case 3 in January and December are 3.24% and 2.41%, respectively.
The most significant increases in the probability of increased active power losses occur in January: compared to the Base Case, they are 29.03% for Case 3 in Scenario 2 and 26.64% for Case 3 in Scenario 1. The lowest probability value is found in March for Case 2, with 12.61% for Scenario 1 and 12.63% for Scenario 2.
Regarding the evaluation of the violation of the undervoltage limit, the highest probability that the voltage on bus B_389 would be less than 0.93 p.u. is about 20.55% for Case 3 in August for both mentioned scenarios. In July, there is a difference between the two scenarios, with the maximum probability value of 19.4% for Scenario 2 in contrast to 17.27% for Scenario 1; the difference between them is 2.13%. In January and December, the differences between the scenarios are 2.56% and 1.88%, respectively.
Concerning feeder overload, the violation probability is between 0.04 and 0.02%. For the regulator load, according to Figure 11a, it is possible to see that the probability is zero because none of the resulting data are above 100%.

5.6. Relationship between Seasonality and the Analyzed Variables

The normality of the data was tested to start a statistical analysis process and compare the monthly results for the analyzed cases and their scenarios, revealing that it consisted of non-parametric data. Consequently, the Mann–Whitney hypothesis test was employed for the analysis. This test compares medians between two independent data groups based on two hypotheses: the null hypothesis posits that the medians of the two groups are equal; by contrast, the alternative hypothesis can be selected to suggest that the median of the first group is greater or lower than the median of the second group. A 95% confidence level (significance level of 0.05) is used. If the p-value from the test is less than 0.05, the null hypothesis is rejected in favor of the alternative hypothesis.
The comparison groups are as follows:
Case 2 Scenario 1 (C2 SC1): FCSs are distributed along the feeder without considering increased mobility during holiday seasons.
Case 2 Scenario 2 (C2 SC2): FCSs are distributed, including the effects of increased mobility.
Case 3 Scenario 1 (C3 SC1): FCSs are concentrated at the end of the feeder without considering increased mobility effects.
Case 3 Scenario 2 (C3 SC2): FCSs are concentrated, including the effects of increased mobility.

5.6.1. Relationship between Seasonality and Bus Voltage

For this analysis, the alternative hypothesis suggests that the median of the first group is greater than the median of the second group. Figure 15 displays the compared groups and the p-values resulting from the Mann–Whitney test across the 12 months of the year for the voltage on bus B_389. p-values less than 0.05 (highlighted in red) reject the null hypothesis, while p-values greater than 0.05 (highlighted in green) accept it.
The test between C2 SC1 and C3 SC1 accepted the alternative hypothesis, indicating that FCSs concentrated at the end of the feeder (without mobility effects) have a more negative impact on bus voltage than FCSs distributed along the feeder.
For January, July, and December, the test between C2 SC1 and C2 SC2 accepted the alternative hypothesis, suggesting that median voltage with distributed stations (without mobility effects) is higher than with increased mobility. Other months accepted the null hypothesis, indicating no statistical difference between the medians.
During vacation months, the test between C3 SC1 and C3 SC2 accepted the alternative hypothesis, implying a more significant impact with FCSs concentrated at the end of the feeder (including increased VE charging mobility effects). For other months, there is no statistically significant variation between the medians of the two compared groups.

5.6.2. Relationship between Seasonality and Feeder Losses

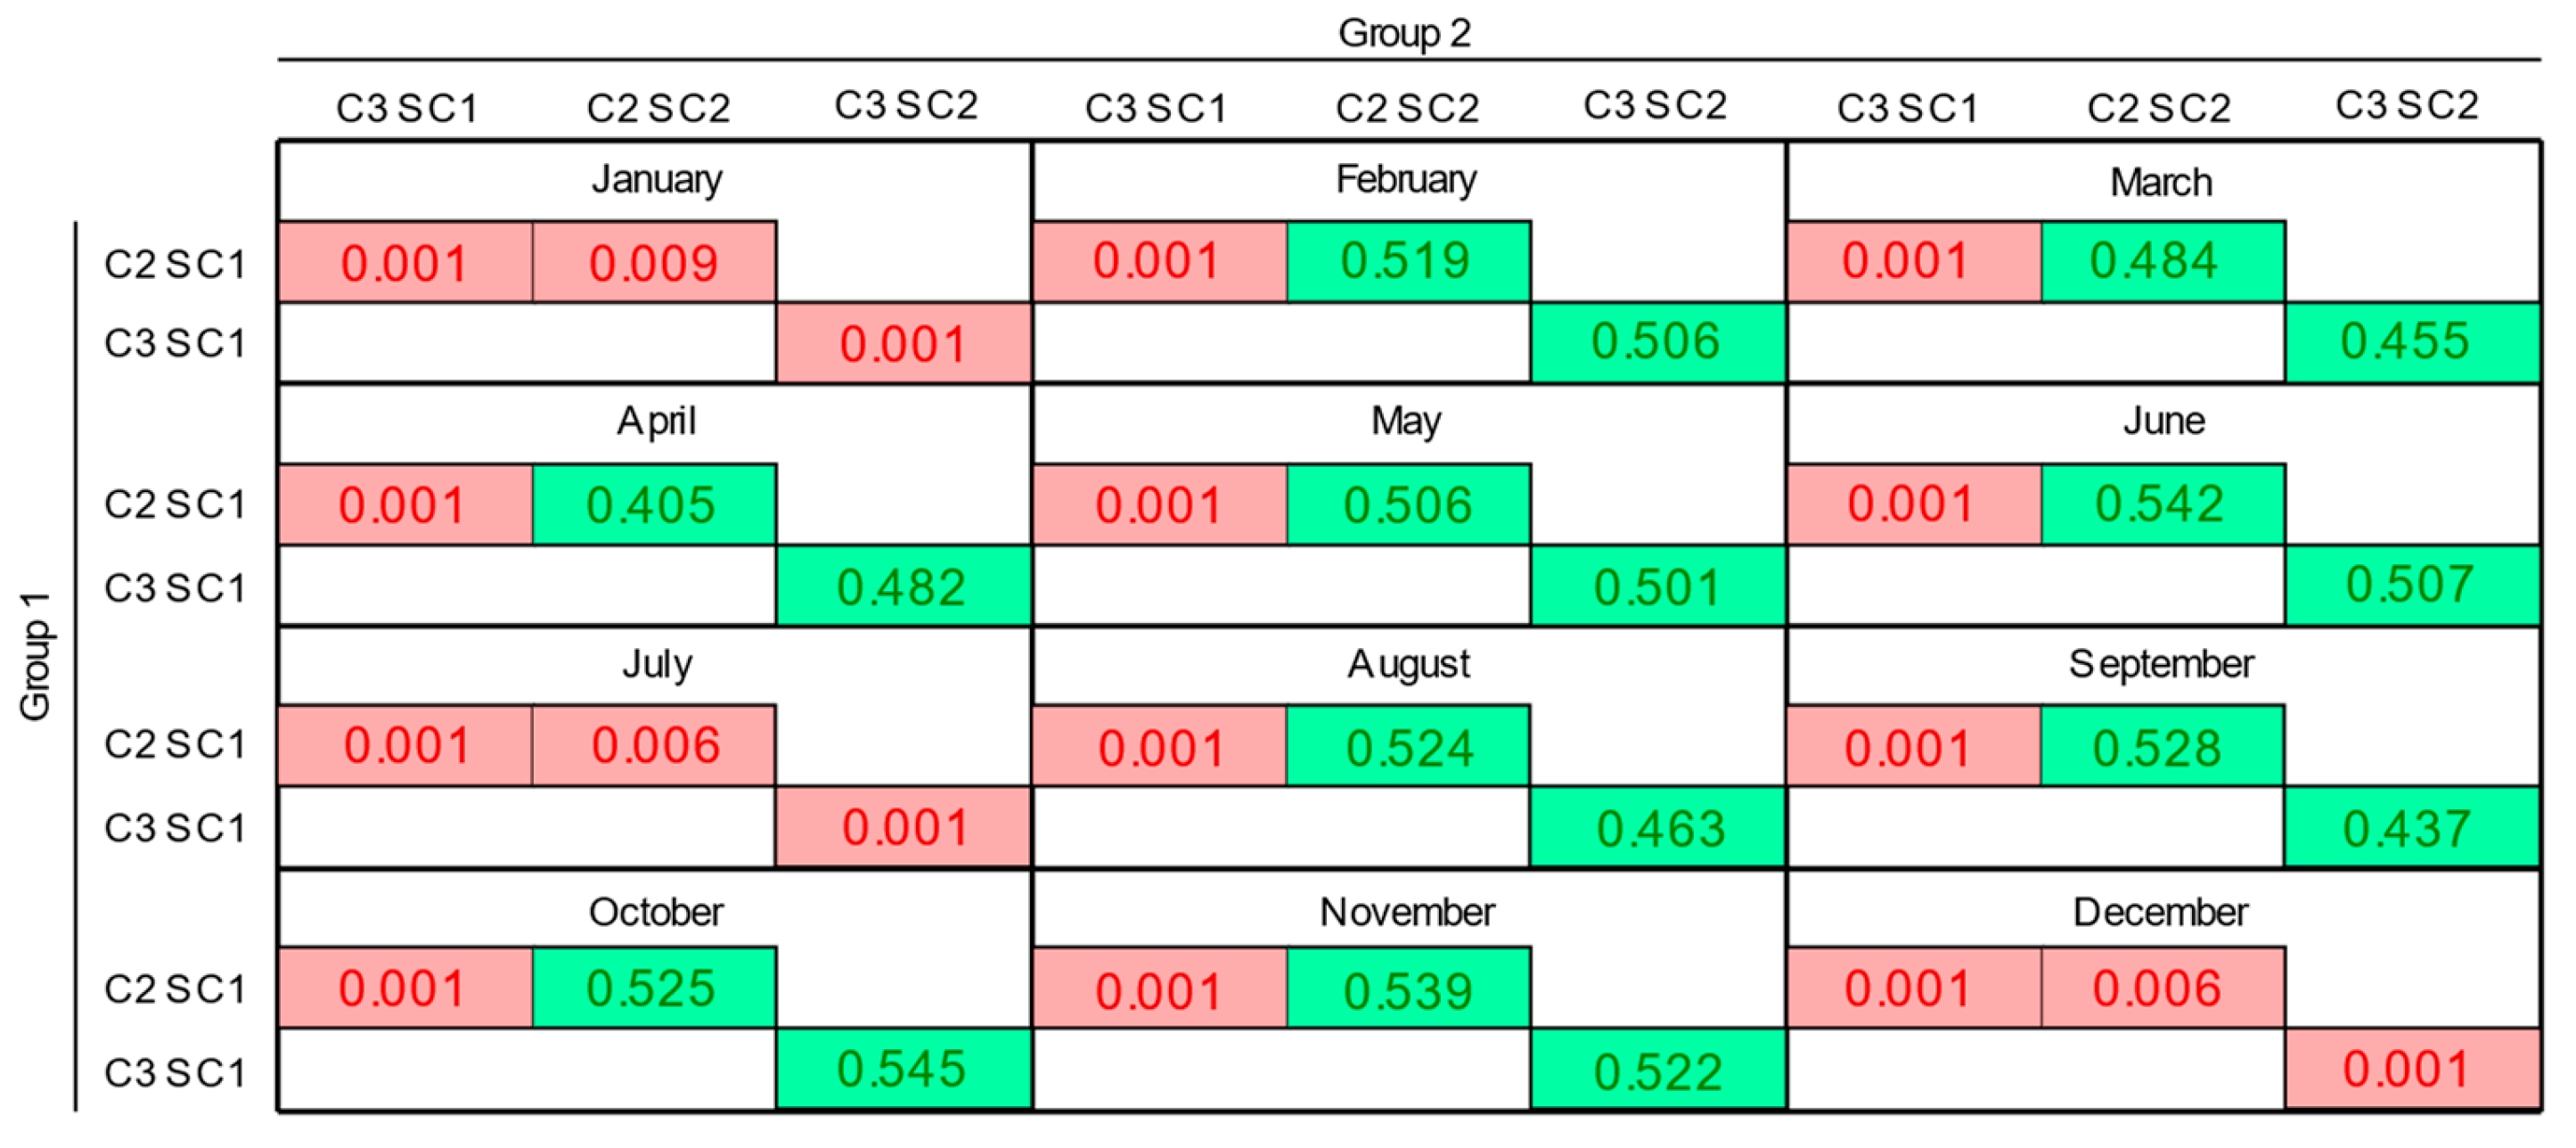
For the losses analysis, the alternative selected hypothesis suggested that the median value of Group 1 is lower than that of Group 2. Figure 16 shows the p-values from the Mann–Whitney test on the monthly feeder loss data. Throughout the year, when there is no increase in EV mobility, losses in the feeder are more significant when FCSs are concentrated compared to their distributed locations.
The null hypothesis was rejected for January, July, and December, which indicated a higher increase in feeder losses when FCSs are concentrated rather than distributed. Additionally, losses escalate with increased EV mobility, whether comparing cases with distributed FCSs or those with stations concentrated at the end of the feeder. However, during months other than the vacation period, there is no statistically significant difference in feeder losses when comparing the concentrated locations of FCSs with or without increased VE mobility.
The research findings allow utility engineers to analyze which months are more likely to experience limit violations related to undervoltage, line overload, and increased losses. These implications have critical significance for decision making in the following areas:
  • Energy Demand: With the expected surge in EV adoption, utility engineers must anticipate a substantial increase in electricity demand. Proper planning for capacity and distribution is essential to meet future energy requirements.
  • Infrastructure: Engineers must carefully assess feeder reinforcement for charging stations. Ensuring the operational security of distribution networks is crucial to handling the growing load.
  • Reactive Power Injection: Engineers should consider utilizing reactive power injection from the FCSs to mitigate undervoltage issues.
These considerations will guide utility engineers in effectively managing the evolving energy landscape.

6. Conclusions

In this paper, we presented a probabilistic method to assess the technical impacts of electric vehicle (EV) fast charging on medium-voltage (MV) distribution networks. This method can help engineers to decide on EV-grid integration studies since it captures the timing of technical impacts, thus facilitating the effective deployment of planning options in the network. The proposed method was applied to an actual MV distribution network in Brazil and considered synthetic annual time-series data for EV fast charging and 5 min resolution in measured time-series profiles for feeder load demand. We examined three study cases and two scenarios using different probability distributions. These variations were essential to address uncertainties related to EV fast charging variables, including arrival time at the station, charging time, battery capacity, initial state of charge, and desired charging level.
We evaluated the monthly impacts using three metrics: voltage magnitude, equipment load, and power losses in the feeder. Our simulations revealed that these metrics varied throughout the year. Specifically, in August, the highest probability of undervoltage limit violations (20.55%) occurred for the case with fast charging stations (FCSs) at the end of the feeder, considering holiday effects. Conversely, in February, the lowest probability of undervoltage limit violations (2.65%) occurred for the same case but without holiday effects. Regarding power losses, the highest probability (32.81%) was observed in July for the case with FCSs at the end of the feeder, including holidays. The lowest probability was in March for the same case but without holiday-related effects.
Our results emphasize that probabilistic assessments should consider the entire year, as single-month analyses can yield overly optimistic or pessimistic outcomes. Furthermore, the case studies confirmed that undervoltage is the most restrictive limit. Additionally, increased power losses in the MV feeder may restrict EV fast charging station connections, impacting network operation costs and potential inclusion in electricity tariffs.
Future research will investigate the impact of EV fast charging variability on step-voltage regulator control, considering daily time-series data with one-second resolution. It will also consider the impact of EV fast charging on distributed optimal energy management.

Author Contributions

Conceptualization, O.M.H.-G. and J.P.A.V.; methodology, O.M.H.-G.; software, O.M.H.-G.; validation, J.P.A.V.; formal analysis, O.M.H.-G.; investigation, O.M.H.-G.; resources, O.M.H.-G. and J.P.A.V.; data curation, O.M.H.-G.; writing—original draft preparation, O.M.H.-G.; writing—review and editing, J.P.A.V.; visualization, O.M.H.-G.; supervision, J.P.A.V.; project administration, J.P.A.V. All authors have read and agreed to the published version of the manuscript.

Funding

Financial support for the publication of the article was provided by the Pro-Rectory of Research and Post-Graduate Studies PROPESP/UFPA within the scope of the Program for Support of Qualified Publications (PAPQ).

Data Availability Statement

The research data can be obtained by written request to the correspondence author.

Acknowledgments

The authors gratefully acknowledge Equatorial Energia—Pará for providing the power consumption data of the feeder, DIgSILENT for the thesis version of the software PowerFactory©, and PAEC for the doctorate scholarship of the main author.

Conflicts of Interest

The authors declare no conflicts of interest. The funders had no role in the design of the study; in the collection, analyses, or interpretation of data; in the writing of the manuscript; or in the decision to publish the results.

References

  1. International Energy Agency. Global Electric Vehicle Outlook 2023 Catching Up with Climate Ambitions. Available online: https://www.iea.org/reports/global-ev-outlook-2023 (accessed on 8 April 2024).
  2. Amer, A.; Azzouz, M.A.; Azab, A.; Awad, A.S.A. Stochastic Planning for Optimal Allocation of Fast Charging Stations and Wind-Based DGs. IEEE Syst. J. 2021, 15, 4589–4599. [Google Scholar] [CrossRef]
  3. Sun, H.; Guo, Q.; Qi, J.; Ajjarapu, V.; Bravo, R.; Chow, J.; Li, Z.; Moghe, R.; Nasr-Azadani, E.; Tamrakar, U.; et al. Review of Challenges and Research Opportunities for Voltage Control in Smart Grids. IEEE Trans. Power Syst. 2019, 34, 2790–2801. [Google Scholar] [CrossRef]
  4. González, L.G.; Siavichay, E.; Espinoza, J.L. Impact of EV Fast Charging Stations on the Power Distribution Network of a Latin American Intermediate City. Renew. Sustain. Energy Rev. 2019, 107, 309–318. [Google Scholar] [CrossRef]
  5. Paudyal, P.; Ghosh, S.; Veda, S.; Tiwari, D.; Desai, J. EV Hosting Capacity Analysis on Distribution Grids. In Proceedings of the 2021 IEEE Power & Energy Society General Meeting (PESGM), Washington, DC, USA, 26–29 July 2021; pp. 1–5. [Google Scholar]
  6. Basta, B.; Morsi, W.G. Probabilistic Assessment of the Impact of Integrating Large-Scale High-Power Fast Charging Stations on the Power Quality in the Distribution Systems. In Proceedings of the 2020 IEEE Electric Power and Energy Conference (EPEC), Edmonton, AB, Canada, 9–10 November 2020; pp. 1–6. [Google Scholar]
  7. Alshareef, S. Voltage Sag Assessment, Detection, and Classification in Distribution Systems Embedded with Fast Charging Stations. IEEE Access 2023, 11, 89864–89880. [Google Scholar] [CrossRef]
  8. Caballero-Peña, J.; Cadena-Zarate, C.; Osma-Pinto, G. Hourly Characterization of the Integration of DER in a Network from Deterministic and Probabilistic Approaches Using Co-Simulation PowerFactory-Python. Alex. Eng. J. 2023, 63, 283–305. [Google Scholar] [CrossRef]
  9. Kenari, M.T.; Ozdemir, A. Probabilistic Models for the Analysis of Electric Vehicle Fast-Charging Station and Photovoltaic Unit Impacts on the Operation of Active Distribution Grids. In Proceedings of the 2023 International Conference on Power, Energy and Innovations (ICPEI), Phrachuap Khirikhan, Thailand, 18–20 October 2023; pp. 27–30. [Google Scholar]
  10. Benavides, D.; Arévalo, P.; Villa-Ávila, E.; Aguado, J.A.; Jurado, F. Predictive Power Fluctuation Mitigation in Grid-Connected PV Systems with Rapid Response to EV Charging Stations. J. Energy Storage 2024, 86, 111230. [Google Scholar] [CrossRef]
  11. Amini, M.H.; Boroojeni, K.G.; Wang, C.J.; Nejadpak, A.; Iyengar, S.S.; Karabasoglu, O. Effect of Electric Vehicle Parking Lots’ Charging Demand as Dispatchable Loads on Power Systems Loss. In Proceedings of the 2016 IEEE International Conference on Electro Information Technology (EIT), Grand Forks, ND, USA, 19–21 May 2016; pp. 499–503. [Google Scholar]
  12. Deb, S.; Tammi, K.; Kalita, K.; Mahanta, P. Impact of Electric Vehicle Charging Station Load on Distribution Network. Energies 2018, 11, 178. [Google Scholar] [CrossRef]
  13. Abdullah, M.F.; Fatah Mochamad, R.; Ehsan, A.; Pambudi, B.A. Probabilistic Assessment of Electric Vehicle Impact on Distribution Network of Surabaya, Indonesia. In Proceedings of the 2021 IEEE Madrid PowerTech, Madrid, Spain, 28 June–2 July 2021; pp. 1–6. [Google Scholar]
  14. Toledo-Orozco, M.; Bravo-Padilla, E.; Álvarez-Bel, C.; Morales-Jadan, D.; Gonzalez-Morales, L. Methodological Evaluation to Integrate Charging Stations for Electric Vehicles in a Tram System Using OpenDSS—A Case Study in Ecuador. Sustainability 2023, 15, 6382. [Google Scholar] [CrossRef]
  15. Roy, P.; Ilka, R.; He, J.; Liao, Y.; Cramer, A.M.; Mccann, J.; Delay, S.; Coley, S.; Geraghty, M.; Dahal, S. Impact of Electric Vehicle Charging on Power Distribution Systems: A Case Study of the Grid in Western Kentucky. IEEE Access 2023, 11, 49002–49023. [Google Scholar] [CrossRef]
  16. Bucarelli, M.A.; Geri, A.; Maccioni, M.; Gatta, F.M.; Bragatto, T.; Paulucci, M. Impact of Ultrafast EV Charging Stations on the Electrical Distribution Grid: A Case Study in Terni. In Proceedings of the 2023 IEEE International Conference on Environment and Electrical Engineering and 2023 IEEE Industrial and Commercial Power Systems Europe (EEEIC/I&CPS Europe), Madrid, Spain, 6–9 June 2023; pp. 1–6. [Google Scholar]
  17. Rahman, M.M.; Al-Ammar, E.A.; Das, H.S.; Ko, W. Comprehensive Impact Analysis of Electric Vehicle Charging Scheduling on Load-Duration Curve. Comput. Electr. Eng. 2020, 85, 106673. [Google Scholar] [CrossRef]
  18. Vopava, J.; Koczwara, C.; Traupmann, A.; Kienberger, T. Investigating the Impact of E-Mobility on the Electrical Power Grid Using a Simplified Grid Modelling Approach. Energies 2020, 13, 39. [Google Scholar] [CrossRef]
  19. Visakh, A.; Selvan, M.P. Seasonal Effects of Electric Vehicle Charging on the Aging of Distribution Transformers. In Proceedings of the 2021 13th IEEE PES Asia Pacific Power & Energy Engineering Conference (APPEEC), Thiruvananthapuram, India, 21–23 November 2021; pp. 1–6. [Google Scholar]
  20. Agência Nacional de Energia Elétrica. ANEEL Procedimentos de Distribuição de Energia Elétrica No Sistema Elétrico Nacional—PRODIST. Módulo 8—Qualidade da Energia Elétrica. Available online: https://www2.aneel.gov.br/cedoc/aren2021956_2_7.pdf (accessed on 28 March 2024).
  21. Gnann, T.; Funke, S.; Jakobsson, N.; Plötz, P.; Sprei, F.; Bennehag, A. Fast Charging Infrastructure for Electric Vehicles: Today’s Situation and Future Needs. Transp. Res. D Transp. Environ. 2018, 62, 314–329. [Google Scholar] [CrossRef]
  22. Xing, Q.; Chen, Z.; Zhang, Z.; Xu, X.; Zhang, T.; Huang, X.; Wang, H. Urban Electric Vehicle Fast-Charging Demand Forecasting Model Based on Data-Driven Approach and Human Decision-Making Behavior. Energies 2020, 13, 1412. [Google Scholar] [CrossRef]
Figure 1. Thematic map of the keyword search.
Energies 17 04624 g001
Figure 2. Flow chart of the proposed probabilistic method.
Energies 17 04624 g002
Figure 3. Interaction between the quasi-dynamic models and network elements.
Energies 17 04624 g003
Figure 4. Weibull’s probability distributions used for SOCini and SOCfin (a) With shape = 3 and scale = 20 for SOCini; (b) With shape = 13 and scale = 80 for SOCfin.
Energies 17 04624 g004
Figure 5. Diagram of the process to generate the load profile of an FCS.
Energies 17 04624 g005
Figure 6. BENBN-01 feeder for Case 2.
Energies 17 04624 g006
Figure 7. (a) Annual voltage profile on bus B_389; (b) Voltage profile on 26 February. (c) Voltage profile on 20 August. The black dashed lines show the interval corresponding to seasons 1 and 2. The red dashed line show the voltage limit.
Energies 17 04624 g007aEnergies 17 04624 g007b
Figure 8. Boxplot of voltage on bus B_389 for Case 1 (yellow), Case 2 (blue), and Case 3 (green).
Energies 17 04624 g008
Figure 9. (a) Annual feeder load profile on bus B_389; (b) Feeder load profile on 26 February; (c) Feeder load profile on 20 August. The black dashed lines show the interval corresponding to seasons 1 and 2. The red dashed line show the loading limit.
Energies 17 04624 g009
Figure 10. Boxplot of feeder load for Case 1 (yellow), Case 2 (blue), and Case 3 (green).
Energies 17 04624 g010
Figure 11. (a) Annual regulator load profile on bus B_389. (b) Regulator load profile on 26 February. (c) Regulator load profile on 20 August. The black dashed lines show the interval corresponding to seasons 1 and 2. Red line show the loading limit.
Energies 17 04624 g011aEnergies 17 04624 g011b
Figure 12. Boxplot of regulator load for Case 1 (yellow), Case 2 (blue), and Case 3 (green).
Energies 17 04624 g012
Figure 13. Boxplot of technical losses percentage for Case 1 (yellow), Case 2 (blue), and Case 3 (green).
Energies 17 04624 g013
Figure 14. Probability of limit violations of technical losses and undervoltage over the year.
Energies 17 04624 g014
Figure 15. p-values of the Mann–Whitney test for Bus B_389 voltage. Red color indicates p-values less than 0.05 while green represents p-values greater than 0.05.
Energies 17 04624 g015
Figure 16. p-values of the Mann–Whitney test for feeder losses. Red color indicates p-values less than 0.05 while green represents p-values greater than 0.05.
Energies 17 04624 g016
Table 1. Comparison of the literature review.
ArticleYearSeasonalityImpact *Actual GridArticleYearSeasonalityImpact *Actual Grid
[4]2019H, LL, V[5]2021TL, V
[6]2020H, V[7]2023V
[8]2023PL, V[9]2023V
[10]2024PQ[11]2016PL
[12]2018V, PL, R[13]2021PL, V
[14]2023PP, PL, V[15]2023OL
[16]2023OL, PC, V[17]2020One day in SummerLP, V, F, H, PL
[18]2020AnnualLP[19]2020Summer and WinterDT
This Work2024AnnualV, OL, PL
* DT: Distribution Transformer, F: Frequency, H: Harmonics, LL: Line Loading, LP: Load Profile, OL: Overload, PC: Power Consumed, PL: Power Losses, PP: Peak Power, PQ: Power Quality, R: Reliability, TL: Thermal Limit, V: Voltage.
Table 2. Parameters of the probability distributions used for the EVs at a charging point.
VariableArrival Time (h)Battery Capacity (kW/h)Charging Time (min)Initial State of Charge (%)Final State of Charge (%)Number of EVs
Parameterμ = 13, σ = 430–6720–40Shape = 3, Scale = 20Shape = 13, Scale = 8020–40
DistributionNormalUniformUniformWeibullWeibullUniform
Disclaimer/Publisher’s Note: The statements, opinions and data contained in all publications are solely those of the individual author(s) and contributor(s) and not of MDPI and/or the editor(s). MDPI and/or the editor(s) disclaim responsibility for any injury to people or property resulting from any ideas, methods, instructions or products referred to in the content.