Abstract
There are many different factors affecting indoor air quality: environmental ones such as temperature, humidity, human activities within the building, smoking, cooking, and cleaning, but also external pollutants such as particulate matter, biological contaminants, and viruses or allergens. This study investigated the indoor air quality (IAQ) of a primary-school classroom in Cracow, Poland, based only on CO2 concentration levels exhaled by occupants. In the 1960s, over a thousand schools were built in Poland using similar technology. Most of them are still in use, and in many cases, modernization works are being carried out to improve their building envelope and the comfort of their use. The analyzed school is one of several hundred similar ones in southern Poland. Therefore, analyzing the possibilities of improving IAQ is an important topic, and the results can be used in the modernization process for many other buildings. Measurements indicated that the CO2 levels significantly exceeded acceptable standards, signaling poor air quality during usage time. This problem was connected mainly with the low efficiency of the natural ventilation system being used in the classroom. It is worth emphasizing that this type of ventilation system is the most commonly used ventilation solution in Polish schools. To address this problem, the classroom environment was simulated using CONTAM software, and the model was validated by comparing the simulated measurement data against the collected measurement data. Next, simulations for the entire heating season in Cracow were conducted, revealing that the IAQ remained consistently poor throughout this period. These findings highlight the persistent problem of inadequate ventilation in the classroom, which can have adverse effects on the health and performance of students and teachers. This article shows the usefulness of CONTAM for modeling not only gravity ventilation but also the window-opening process. The validated CONTAM model will be subsequently utilized to simulate annual IAQ conditions under various ventilation strategies in order to identify the most effective methods for maintaining acceptable IAQ while minimizing energy consumption. In our future analysis, the validated model will be used to test the following systems: demand-controlled ventilation (DCV), exhaust ventilation, and DCV/balanced ventilation with heat recovery.
1. Introduction
Children spend nearly 12% of their lives in classrooms, which is more time than they spend in any building other than their homes [1]. This makes it crucial to ensure good indoor air quality (IAQ) in these spaces. IAQ in schools is a key factor influencing both the health and academic performance of students. Typically, IAQ in classrooms is measured based on the CO2 concentration, which tends to increase with the number of students and decrease with better ventilation. An oxygen concentration that is too low can cause feelings of breathlessness and headaches and consequently reduce students’ concentration and the effectiveness of learning. Such conclusions have been presented in many scientific studies and works in the literature [2,3,4,5,6,7]. The authors of these studies have proven that an increased concentration of carbon dioxide negatively affects the absorption of knowledge; therefore, when designing ventilation, special attention should be paid to controlling this concentration. Various groups of students and pupils were the subjects of these studies. The results obtained in tests (mathematical tests, reading comprehensions, etc.) taken in a classroom with a controlled concentration of carbon dioxide in the range of 600–5000 ppm (depending on the test being taken) were analyzed. All researchers agreed that at concentrations above 2000–3000 ppm, the results obtained by students are significantly worse compared with the results obtained at concentrations below 1000 ppm [2,6]. The authors of [6], on the basis of their own literature review and research, specified the effects of specific concentration levels of carbon dioxide as follows:
- Carbon dioxide at 1000 ppm—maximum hygienic level;
- Carbon dioxide at 5000 ppm—feelings of fatigue, discomfort;
- Carbon dioxide at 15,000 ppm—breathing disorders;
- Carbon dioxide at 30,000 ppm—dizziness, headaches;
- Carbon dioxide at 50,000 ppm—difficulty breathing, visual disturbances;
- Carbon dioxide at 100,000 ppm—unconsciousness.
Taking into account the research on the correlation between test results and the concentration of carbon dioxide and knowing the effects of an increased CO2 concentration, it should be stated that the value of this parameter is very important in educational buildings.
Numerous factors impact indoor air quality [8], including environmental, building-related, and occupant-related elements. Environmental factors encompass climatic conditions and seasonal variations, while building-related factors involve airtightness, school location, classroom and window design, ventilation type and rate, internal temperature, window drafts, and room size. Occupant-related influences include CO2 exhalation rates, occupants’ behavior, system maintenance and operation, operating schedules, the number of occupants, activity levels, and the time spent in the room, as well as occupants’ age and individual thermal comfort preferences [9].
Maintaining healthy indoor air quality is crucial for children’s well-being, as they are particularly sensitive to indoor air pollutants. Consequently, occupant-related factors significantly influence IAQ in primary-school buildings, especially given the potential variability and unpredictability of these factors [8].
There is a significant body of research exploring the impact of classroom conditions on children’s academic performance, driven by the observation that thermal and air quality standards in schools frequently fall below recommended levels. This discrepancy often arises due to limited funding for building maintenance and upgrades, as well as a growing tendency for schools to allow classroom temperatures to exceed the advised winter range of 20–22 °C during warmer periods. Additionally, outdoor air supply rates are often kept low to conserve energy, causing carbon dioxide concentrations to surpass 1000 ppm for extended periods during school hours. These poorly considered energy-saving measures, though cost-free, can negatively affect children’s academic performance by up to 30%. Wargocki provided a comprehensive overview of these studies in [10].
In paper [11], the authors highlight the critical need for on-site measurements of indoor air quality (IAQ) in schools. They point out that children differ from adults in several key aspects, including their higher vulnerability to poor indoor environments. Children not only inhale more air relative to their body weight but are also more sensitive to variations in temperature and humidity, making them more susceptible to adverse conditions that can impede healthy development. A properly maintained educational setting can lower absentee rates, boost test performance, and increase productivity for both students and teachers. This article outlines a roadmap for future improvements in school air quality, advocating for more detailed on-site measurements to better understand the characteristics of contaminants. Additionally, it emphasizes the need for tailored strategies based on the specific locations of schools, such as their proximity to traffic or industrial zones, in order to address region-specific challenges. The socio-economic impacts of children’s health and academic performance should also be considered. Furthermore, there is a pressing need for larger-scale, comprehensive studies that explore the links between environmental health, student outcomes, and indoor comfort.
This paper presents the results of CO2 concentration measurements taken in the classroom of a primary school located in Cracow, Poland. The results of short time measurements proved to be very unfavorable. The authors conducted the simulations using a specific program to analyze the longer heating season [12].
2. Literature Review
2.1. Indoor Air Quality in Schools
Air quality in school buildings is a significant issue worldwide. The measurements of IAQ parameters, such as temperature, humidity, pollutants and CO2 concentrations, has been the focus of numerous researchers. Godwin [6] reported findings from IAQ measurements conducted in 64 elementary and middle school classrooms in Michigan (USA). In each classroom, bioaerosols, VOCs, CO2 levels, relative humidity, and temperature were tracked. Ventilation rates were calculated based on CO2 levels and occupancy data. Many of the classrooms exhibited inadequate ventilation, with CO2 concentrations frequently surpassing 1000 ppm and occasionally reaching as high as 3000 ppm. In another study, Godwin [13] presented air quality monitoring data from 85 classrooms and other areas within eight schools in Minnesota, USA. The results indicated insufficient ventilation in rooms within five of the eight schools, as evidenced by elevated CO2 levels. Paraskevi [14] conducted an analysis of IAQ in nine naturally ventilated primary schools in Athens, Greece, during the spring season. The study examined ventilation rates and pollutant levels during both teaching and non-teaching periods. Average carbon dioxide concentrations across the schools ranged from 893 to 2082 ppm, with most measurements slightly exceeding recommended threshold levels. CO2 levels showed a positive correlation with the number of students and a negative correlation with ventilation rates. Turanjanin [15] analyzed the indoor air quality in five naturally ventilated Serbian schools during the heating season. CO2 concentrations were measured both outdoors and in three classrooms over five working days, with ventilation rates calculated using a trace gas decay method. The results indicated insufficient ventilation, with the mean value of carbon dioxide concentration mostly exceeding 1000 ppm. Chang [16] conducted similar measurements in five Hong Kong schools where the CO2 level were above 1000 ppm for most of the time, reaching a maximum of 5900 ppm when classrooms were fully occupied by students.
Korsavi [17] focused on factors influencing children’s perceptions of IAQ in 29 primary school classrooms in the UK, all naturally ventilated, during non-heating and heating seasons. The study indicated that children’s perceptions of IAQ are influenced by the “at-the-time CO2 level”, which refers to the CO2 measurements taken over the last 5 min, as children typically acclimate to the classroom’s air quality within that time frame. It also emphasized that low CO2 levels alone do not ensure acceptable IAQ if children experience thermal discomfort in the classroom. When the CO2 concentration exceeds 1000 ppm and the temperature is higher than 23 °C, the conditions are considered unacceptable.
Myhrvold [2] presented the results of a Norwegian project called Indoor Environment in Schools. The aim of the project was to investigate the indoor environment in regard to the pupils’ health, social environment and level of performance. The project included field measurements of eight different schools (35 classrooms) with natural ventilation systems and 800 pupils. The CO2 concentrations at those schools in the daytime ranged between 601 and 3827 ppm. The health symptoms such as headache, dizziness, tiredness, difficulties in concentration, unpleasant odor, and throat irritation were analyzed using questionnaires and analyzing the results of computer tests analyzing pupils’ reaction times. The results showed strong correlation between student health, student performance and CO2 concentration.
Simoni [3] described the influence of IAQ on the respiratory health of schoolchildren living in Norway, Sweden, Denmark, France and Italy. The researchers found that many disorders, such as wheezing, dry cough at night and rhinitis, were more prevalent among children in poorly ventilated classrooms. Schoolchildren exposed to CO2 levels exceeding 1000 ppm had a significantly higher risk for dry cough and rhinitis. In the analyzed schools, children were exposed to CO2 levels greater than 1000 ppm 66% of the time. The authors emphasized the poor IAQ in European classrooms; it is related to respiratory disturbances and affects nasal patency. Gennaro [4] focused on the analysis of IAQ in schools as children have greater susceptibility to some environmental pollutants than adults because they breathe higher volumes of air relative to their body weights, and their tissues and organs are actively growing.
Paper [18] presents findings from IAQ assessments conducted in 64 primary school buildings across five Central European countries (Czech Republic, Hungary, Italy, Poland, and Slovenia). Various factors affecting indoor air quality, including concentrations of volatile organic compounds, aldehydes, PM2.5 particles, carbon dioxide, radon, and physical parameters, were measured during the heating season of 2017/2018. The study revealed significant disparities in IAQ parameters between the countries. Median indoor/outdoor ratios varied widely, highlighting the need to evaluate each region individually due to differing environmental conditions. A thorough analysis of IAQ in relation to potential health impacts and comfort was conducted. While most hazard quotient values remained below the threshold of 1, one exception was noted. However, 31% of the schools had hazard index values exceeding 1. The maximum cumulative ratio approach suggested that concerns regarding non-carcinogenic health effects were generally low or driven by multiple substances. Notably, around 80% of the schools failed to meet the recommended carbon dioxide concentration limit of 1000 ppm.
Building energy regulations prioritize improving the efficiency of building structures and energy supply systems. As a result, the overall energy consumption linked to building characteristics is being reduced.
Human behavior significantly impacts a building’s energy usage. Actions such as turning on the heating, opening windows, or switching on lights alter the building’s energy balance, directly influencing overall energy consumption [16]. Duton [19,20] described results of measurements and simulations of indoor air quality conducted in two classrooms in the UK, including the impact of window openings. The simulations were conducted in the Energy Plus program. The authors aimed to enhance the prediction of building performance by gaining a deeper understanding of occupant behavior and the factors that shape it. The simulation model was validated by the measurements conducted by the authors. Opening windows significantly improves the air quality and lowers the CO2 levels; however, due to the low external temperatures or noise levels outside the building, this cannot be considered a suitable solution. Belafi [21] examined the window-opening and closing behavior in two classrooms of a Hungarian school, using surveys and measurements to identify the environmental, contextual, or habitual factors influencing window usage. The study utilized eight-month-long time-series datasets and qualitative interviews with teachers to explore these behaviors. In one classroom, window use was largely driven by habits and time-dependent actions, while in the other, environmental factors played a more significant role. Specifically, indoor temperature emerged as the most reliable predictor for both opening and closing windows. Understanding and assessing such behaviors can help optimize the indoor environment, which is crucial for both energy efficiency and the health of students in school buildings.
Kulis and Muller [22] designed and validated a prototype device aimed at improving indoor air quality by enhancing natural ventilation in buildings. The device, built on a Raspberry Pi single-board computer (SBC) and equipped with optical sensors, utilized a fuzzy logic control algorithm to optimize performance. Its effectiveness in improving indoor air quality was confirmed, suggesting that this device could serve as a viable solution for supporting ventilation systems and enhancing indoor air quality.
IAQ is affected by environmental factors such as temperature, humidity, and air contaminants, as well as human behavior and adaptive approaches to thermal comfort and air quality (Zhang [23]).
Sowa [24] compared the actual state of the environment in classrooms in Poland with accepted requirements and standards, based on indoor environmental measurements in 28 classrooms in Warsaw. Polish regulations on indoor air quality lag behind similar regulations in developed countries; moreover, they are generally not observed. Increasing the ventilation rate would play a key role. Unfortunately, this action requires the use of mechanical ventilation systems to control the air exchange.
Sowa [25,26,27] described the results of simulations of indoor air quality in a school located in Zgierz after conversion of the ventilation system from natural to mechanical ventilation with high-efficiency heat recovery. After the modernization, the ventilation rate increased tenfold (from 3 m3/h per pupil to 30 m3/h per pupil).
2.2. Ventilation of Internal Space
A typical gravitational ventilation system introduces fresh air while removing contaminated, humid air from the indoor spaces. When the air exchange rate is too low, indoor air quality and occupants’ health can be compromised, whereas an excessively high rate can lead to unnecessary energy losses. Ventilation, as a deliberate air exchange process, must be considered in conjunction with infiltration, which occurs naturally due to pressure differences between the indoor and outdoor environments. In gravitational ventilation systems, where usually only exhaust ducts are installed, the fresh air supply is often uncontrolled, entering through infiltration via cracks and leaks in the building’s exterior envelope. The airtightness of this envelope is a crucial factor in determining ventilation intensity and, consequently, indoor air quality. Griffiths [28] examined the impact of trickle ventilators on ventilation rates in classrooms. These ventilators can improve air circulation and reduce CO2 and contaminant concentrations, though they typically do not reduce them to acceptable levels.
The efficiency of air exchange can be evaluated using the gas tracing method, with carbon dioxide being used as the tracer gas. Since CO2 is naturally produced by occupants, it can serve as an effective tracer without the need for artificial gas emitters. This approach simplifies and reduces the cost of testing by utilizing the CO2 already present in the environment. Gas tracing with CO2 allows for the simultaneous evaluation of air quality, ventilation efficiency, and building airtightness. Many researchers, including Sowa [25,26], Bulińska [29], Kersavi [8], and Persily [30], have used this method, utilizing metabolically produced CO2 to evaluate ventilation performance and indoor air quality by analyzing CO2 concentrations within indoor spaces. Zhang [31] and Nowak-Dzieszko [32] applied this technique to dormitories and offices to assess ventilation rates, while Benedettelli [33] and Cichowicz [34] measured ventilation intensity in university facilities. Additionally, Sowa [24,25], Turanjanin [14], Myhrvold [2], and Griffiths [28] employed the method to analyze IAQ in schools. All these studies were conducted using the gas tracer concentration decay method, initially introduced by Sherman [35] and outlined in the ISO standard EN 12569 [36]. This approach is based on measuring the natural decay of tracer gas concentration mixed with indoor air and was also used by the authors to assess the air exchange rate in the studied classroom.
Measuring the increase in CO2 concentration during the occupancy of a building or room allows determination of the quality of indoor air. This approach has been proposed in Persily [30], Bulinska [29], and Zhang [31]. The results of the air quality analyses based on the level of CO2 concentration inside classrooms are described in [29,30]. The authors confirm that in rooms with natural ventilation, the level of CO2 very quickly exceeds the legal limits due to insufficient ventilation exchange.
Lis [37] sought to determine whether natural ventilation could supply enough air to meet the ventilation requirements. The analysis indicated that achieving the minimum ventilation airflow would be impossible without installing additional vents in the rooms or, preferably, implementing mechanical ventilation with heat recovery. The airtightness of the windows alone would not suffice to meet these requirements effectively.
Mijakowski and Narowski [38] compared the energy performance and indoor climate of typical school classrooms using two different ventilation strategies: mechanical balanced ventilation with heat recovery and natural/hybrid ventilation. The primary energy consumption, including heating and electricity for ventilation, in rooms with similar ventilation rates and thermal comfort were analyzed. The study found that while thermal comfort could be maintained with both systems, energy performance and indoor air quality varied significantly between the two strategies. Specifically, classrooms equipped with mechanical ventilation with heat recovery consumed approximately 40% less primary energy for heating and ventilation compared to those with natural/hybrid ventilation. The authors demonstrated that, in a moderate climate such as in Europe and Poland, it is feasible to meet indoor climate requirements and maintain reasonable energy consumption levels with both mechanical ventilation with heat recovery and natural/hybrid ventilation. Additionally, Mijakowski [39] compared the performance of passive stack ventilation and indoor conditions before and after the installation of humidity-sensitive air inlets in a kindergarten building. The analysis revealed that while the humidity-sensitive air inlets did enhance ventilation performance, their effect was insufficient to meet the current Polish and European standards and recommendations.
2.3. Standard Requirements
Polish governmental recommendations do not specify acceptable concentrations of carbon dioxide in rooms intended for permanent occupancy; only permissible concentrations in the working environment are defined, as follows [40]:
- Permissible Exposure Limit (NDS): This is the average concentration level that, when experienced by an employee over an 8-hour workday and an average workweek, should not result in adverse health effects for the employee or their future generations.
- Short-Term Permissible Exposure Limit (NDSCh): This refers to the average concentration level that should not cause harmful effects if present in the work environment for no more than 15 min, and not more than twice during a work shift, with at least a 1-hour interval between exposures.
- Maximum Exposure Limit (NDSP): This is the concentration level that must not be exceeded at any time in the work environment due to potential health or life-threatening risks. According to these regulations, the NDS for carbon dioxide is 5000 ppm (9000 mg/m³), while the NDSCh should not exceed 15,000 ppm (27,000 mg/m³).
Permissible carbon dioxide levels are established by European standards and widely adopted US guidelines, such as ANSI/ASHRAE [41] and ASTM [42]. These regulations specify that CO2 concentrations in spaces occupied by people for extended periods should not exceed 1000 ppm. To maintain this standard, approximately 27 m³/h of fresh air per person must be supplied each hour [41].
According to the PN-B-03430 standard [42], which has been widely used for years in designing ventilation systems for public utility buildings intended for both permanent and temporary occupancy, the required external air volume flow should be at least 20 m3/h per person. However, in the case of rooms in kindergartens and nurseries where children are present, the standard permits a reduction of the air volume flow to 15 m3/h per child. It should be noted that these rooms are also occupied by adults caring for the children, for whom the stream should be calculated as 20 m3/h per person. An overview of ventilation requirements in other countries can also be found in the study [43]. Detailed guidelines adapted to the age of users in educational buildings are included, among others, in the American ASHRAE 61.1 [41] guidelines. These provide specific information on the required outside air flow, which is calculated as the sum of the airflow per person in the room (based on human activity) and the airflow associated with building materials and room equipment, depending on the area. The guidelines for educational rooms are as follows:
- nursery rooms (for children up to 4 years old)—18 m3/h per person
- classes (for children aged 5–8)—18 m3/h per person
- classes (for children from 9 years of age)—18 m3/h per person
- lecture rooms—13.4 m3/h per person
Permissible levels of carbon dioxide in non-residential spaces are regulated by the standard EN 16798-1 [44], which outlines national requirements. This standard defines four acceptable levels of carbon dioxide concentration depending on the selected level of indoor air quality. Table 1 shows the permissible values for the carbon dioxide concentration according to the air quality category.

Table 1.
Permissible values for carbon dioxide concentration depending on the air quality category, acc. to standard EN 16798-1 [44].
In any enclosed space where people reside, the concentration of carbon dioxide rises due to the consumption of oxygen during breathing. The CO2 concentration in exhaled air is approximately 40,000 ppm. However, the exact amount of CO2 produced by the human body can vary based on factors such as body weight and metabolic activity levels [41,42].The exhaled CO2 stream is related to the amount of oxygen consumed. The amount of oxygen consumed by one person, m3/h, can be determined from Equation (1) [9]:
where:
- AD—DuBois surface (surface of human body), [m2]
- M—metabolic rate, [met], (1 met is equal to 58.2 W/m2)
- Rq—a respiratory quotient, [-]
The respiratory quotient can be adjusted based on the intensity of the activity being performed. For an average adult, the DuBois surface area is typically assumed to be 1.8 m². In building design, it is often practical to use standardized average values. According to the European standard EN 16798-1 [44], the indicative CO2 emission rate is set at 20 L per hour per person.
Persily [9] introduces a method for estimating CO2 generation rates from building occupants, which is valuable for indoor air quality and ventilation studies. This approach utilizes concepts from human metabolism and exercise physiology, representing a significant advancement in the analysis of IAQ and ventilation. The method provides a robust framework for applying CO2 data in both practical ventilation applications and simulation models for IAQ research.
3. Methods and Measurements
3.1. Classroom Tested in Cracow
The analyzed classroom is located on the ground floor of a two-story primary school building located on Mackiewicza Street in Cracow, about two kilometers from the old city center (Figure 1a,b). The room can accommodate a maximum of 31 people (30 pupils plus teacher). The room has only one external wall with three large (2.55 m width and 1.8 m height) windows at the west elevation of building. In the room, there is a natural ventilation system with four ventilation ducts measuring 10 cm by 10 cm and located 3.0 m above floor level.
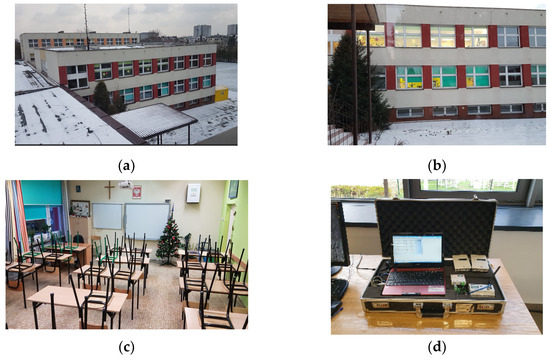
Figure 1.
(a,b) East elevation of analyzed school building. (c) View of the classroom. (d) iBros remote sensor set measuring CO2, temperature and humidity.
The total floor area of the classroom (Figure 1c) is 51.92 m2, and its internal volume is 166.14 m3.The analyzed classroom is free of internal sources of contaminants, including CO2.
All the measurements were conducted using an iBros set of remote sensors allowing continuous measurements and the registration of CO2 concentration, temperature and relative humidity. Data were recorded every 30 s, with CO2 measurement precision of ±50 ppm, temperature precision of ±0.4 °C, and relative humidity precision of ±5% (Figure 1d).
Simultaneous measurements of CO2, temperature, and humidity were carried out using nine detectors placed at various locations within the tested space. This setup enabled an assessment of the spatial distribution of CO2, temperature, and fluctuations in momentary concentrations throughout the area. Details of the sensors’ locations are provided in Table 2. Prior to the testing, all sensors were calibrated according to the manufacturer’s instructions.

Table 2.
Description of sensors’ locations.
3.2. CO2 Concentration
Measurements of internal air quality were conducted over 3 days: 4 January 2019, 11 January 2019, and 1 February 2019, during the morning hours while classes were in session. The detailed analysis focused on one representative day (4 January) to highlight the observed phenomena. The trends in the CO2 and temperature distributions were similar across all days. Figure 2 illustrates the fluctuations in CO2 levels throughout the school day in the classroom on 4 January, showing both increases and decreases in concentration. The number of users were 21 students plus two adults. Sensor #2 was located on the external window sill.
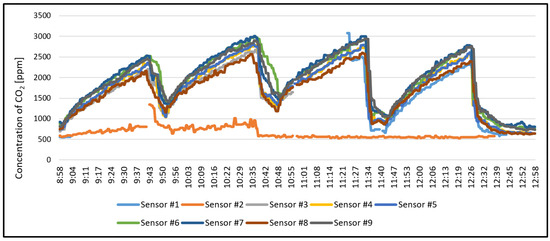
Figure 2.
CO2 concentration in the classroom on 4 January 2019.
Figure 3 presents the shorter time range, covering two lessons with a break between them when the windows were opened (average of data collected from 6 sensors on 1 February).

Figure 3.
Average CO2 concentration in the classroom on 1 February 2019 between 10:50 a.m. and 12:30 a.m., taken from 6 sensors. Two 45 min lessons with a break at 11:30–11:45—windows opened.
Lessons start at 8:55, and children enter the classroom between 8:40 and 08:50. Each lesson lasts 45 min. The first lesson ends at 9:40, followed by a short 10-min break (9:40–9:50 a.m.). According to Figure 2, the mean CO2 concentration rises to 2500 ppm by the time the first break occurs and then decreases to 1250 ppm during the break (a 50% reduction) due to the opening of windows. This reduction of 1250 ppm over the 10-min break equates to 125 ppm/min in the studied classroom. However, the breaks are not long enough to bring CO2 levels below 1000 ppm. After the first break, the children remain in the classroom until the next 10-min break (9:50–10:35). During the second lesson, the peak CO2 concentration exceeds 3000 ppm, as the initial level was already higher. This trend repeats during the following two lessons. The indoor air quality remains poor throughout each lesson, as shown in Table 1.This pattern of fluctuating CO2 levels in the schools under study has been documented in numerous other research studies [8,24,27].
The windows are typically kept closed during lessons due to low outdoor temperatures or noise. This is the typical usage scheme in the classrooms in Poland but also in many other countries. Such high concentrations should not be viewed merely as a comfort issue but rather as a significant health risk to occupants. It is worth emphasizing that this classroom could be occupied by 31 individuals (30 pupils plus teacher), which would further exacerbate the conditions.
3.3. Classroom Modeled in CONTAM
In the first simulation step, the results of measurements were used to adjust and validate the CONTAM model. The classroom was modeled as a single zone, with the air flow paths in the envelope representing the ventilation ducts and four external windows (Figure 4).
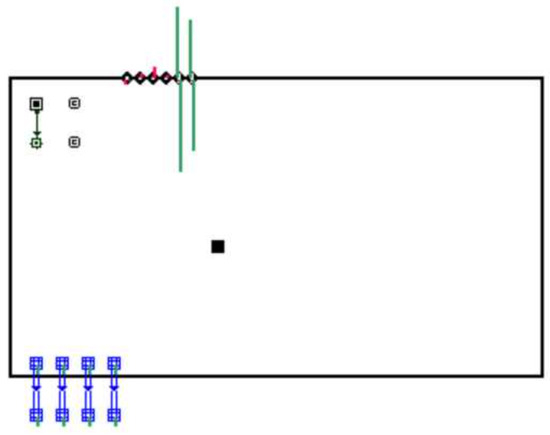
Figure 4.
CONTAM model of the classroom—screen from the program.
The following assumptions were used in modeling:
- The occupancy schedule was based on the observations during measurements and aligned with the timing of lessons and breaks between.
- Cracks were modeled using the power law flow model (V = C × DPn) with C = 3.2 × 10⁻⁴ m3/s/Pan per meter of crack and n = 0.67.
- Open windows were modeled as two-way flow according CONTAM, with specified area and an exponent of 0.5.
- Natural ventilation was modeled as being driven by wind speed and temperature difference.
- Users profiles were adjusted according to [9], presented in Table 3.
 Table 3. User profiles used in the simulations.
Figure 5 presents the model’s calibration against the measurement data. The black line represents the simulation curve, which closely follows the measurement results. The probability distribution and density are presented in Figure 6.
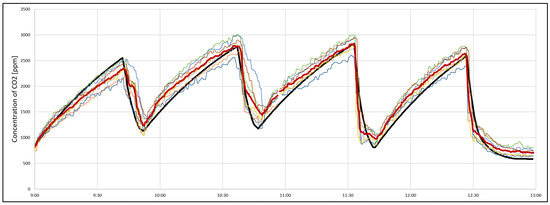
Figure 5.
The adjustment of CO2 concentration in the classroom on 4 January 2021 to the simulation curve from CONTAM program (black line). Color lines represent data from different sensors.

Figure 6.
Density and distribution of probability for indoor CO2 concentration error.
After adjusting the model with measurements, the root mean square error was below 185 ppm, and correlation between measurements and calculation had strong correlation (R2 = 0.93), Figure 7. This calibrated model was then used for simulating the entire winter period.

Figure 7.
Relation of CO2 concentration between measurements and model calculations.
3.4. Air Exchange Rate: Gas Tracing
To measure the air exchange rate in the classroom with all windows closed, a gas tracing decay test was conducted on 5 November 2021. The simultaneous CO2 measurements were conducted using five detectors, which were located at different locations within the tested space. CO2 was generated from a bottle.
When using the gas tracing method to determine the air exchange rate, the concentration of carbon dioxide in the entire tested area should not vary by more than 10% from the mean concentration value [36]. During the analyzed period, this criterion was met by all five sensors. The average concentration decay data obtained were used to calculate the natural airflow rate using the gas tracing method [36]. The specific airflow rate was calculated by means of a two-point decay method, Equation (2).
where:
- N—time-mean specific airflow rate, [1/h]
- t—time (t1: measurement start point, t2: measurement end point), [h].
For the analyzed room, the air exchange rate was determined to be n = 0.27 1/h. However, it is important to note that specific airflow rates are significantly influenced by external climatic conditions, which means there could be substantial differences in values if the tests were conducted under varying environmental conditions. During the analyzed period, the external temperature ranged between 8 °C and 10 °C.
Assuming the total internal volume of the classroom to be 166.14 m3, the average air exchange rate was 44.8 m3/h. With the average of 22 pupils plus teacher (total 23 people) working in the classroom, the air flow per person was 1.95 m3/h. Under maximum occupancy of 31 people (30 pupils plus teacher), this would drop to only 1.44 m3/h. The obtained results do not meet the minimum of 20 m3/h per person required by the standard. The results just confirmed very unfavorable conditions in the analyzed classroom.
Sowa [16,17] applied the same method to calculate airflow rates in 28 classrooms across Warsaw schools. The results showed that most classrooms had an air exchange rate below 1 h⁻¹. When assuming full occupancy (all seats occupied), the airflow rate per person ranged from 1.2 to 9.6 m³.
4. Results—CONTAM Simulations
The aim of the conducted simulations was to analyze the internal CO2 level in the classroom during the heating season, from 1 November to 31 March under Cracow’s climatic conditions (hourly data). The Christmas break and winter vacations were scheduled in the simulations.
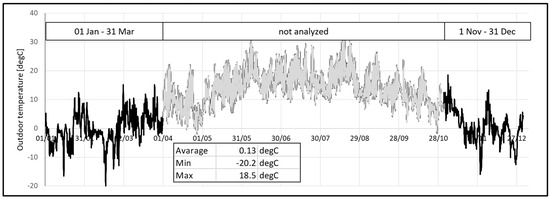
Figure 8.
Outdoor temperature profile for Cracow. Analyzed period of time between 1 November and 31 March.

Figure 9.
Wind speed profile for Cracow. Analyzed period of time between 1 November and 31 March.
CONTAM, developed by the National Institute of Standards and Technology (NIST), is a comprehensive computer program for modeling and analyzing indoor air quality and ventilation. It simulates airflows, including infiltration, exfiltration, and room-to-room movement driven by mechanical systems, wind pressures on the building exterior, and buoyancy effects caused by temperature differences between indoor and outdoor air. Additionally, CONTAM models the dispersal of airborne contaminants, accounting for their transport via these airflows and their transformation through various processes such as chemical reactions, adsorption and desorption with building materials, filtration, and deposition on surfaces [12].
Winter-Time Simulation Results
Since the model accurately reflects real conditions, it was used for the further simulation of CO2 concentration throughout the heating season in Cracow (1 November thru 31 March). Figure 10 and Figure 11c,d show the variations in CO2 concentration over the entire five-month period as well as shorter intervals, including five working days and one particular day. When comparing these diagrams with Figure 2, presenting measurement data, a similar trend in changes can be observed across all weeks. Figure 11b,d present the changes in ventilation airflow for five working days and one particular day. The average, maximum and minimum values for both CO2 concentration level and air flow are listed in Table 4.

Figure 10.
Changes in the indoor CO2 concentration between 1 November and 31 March.
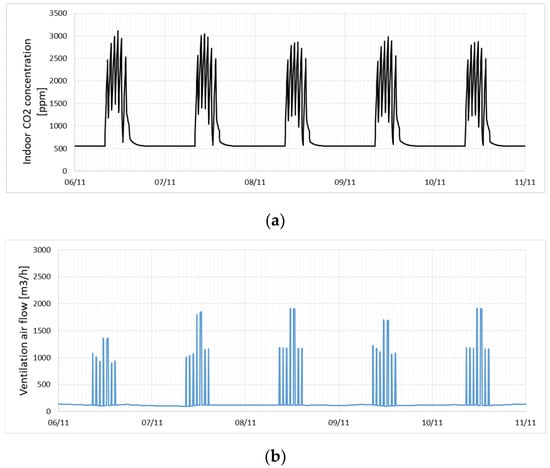

Figure 11.
(a) Changes in the indoor CO2 concentration during five working days; (b) ventilation air flow during five working days; (c) changes in the indoor CO2 concentration during one working day; (d) changes in the ventilation air flow during one working day.

Table 4.
Average, minimum, maximum and standard deviation in the analyzed period of time.
Based on the average value of the CO2 concentration during the occupied hours, the indoor air quality, according to [44], was considered low. The maximum concentration reached nearly double the average, at 3279 ppm.
The correlation shown in Figure 12a illustrates the relationship between air flow and outdoor temperature, which is typical for natural ventilation. The data points form three distinct groups: air flow through cracks (the bottom group), air flow through window slightly open (the middle group) and air flow through window fully open (the top group). These trends are further reflected in Figure 11b–d.

Figure 12.
(a) Ventilation air flow vs. outdoor temperature; (b) indoor CO2 concentration vs. outdoor temperature; (c) ventilation air flow vs. indoor CO2 concentration; (d) air heating power demand vs. outdoor temperature.
The total energy consumption for air heating during the analyzed period of time was 5605 kWh, which gives 33.8 kWh/m2.
Figure 13 illustrates the daily concentration profile, while Figure 14 shows the daily ventilation air flow profile for the working days in the analyzed period. The indoor CO2 concentration, including the minimum values, consistently exceeded 1000ppm, indicating poor indoor air quality.

Figure 13.
Daily profile of concentrations for the working days in the analyzed period of time.
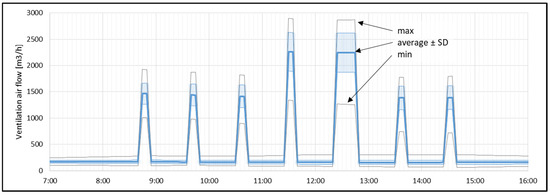
Figure 14.
Daily profile of the ventilation air flows for the working days in the analyzed period of time.
Figure 15 summarizes the CO2 concentration issues in the classroom during the winter period. During occupied hours, the CO2 concentration was below 1000 ppm for only 10% of the time, while concentrations above 1900 ppm (indicating low quality of air according to EN-16798-1 [44]) occurred over more than 40% of the occupied time period.
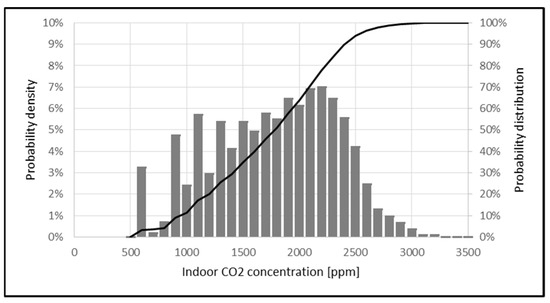
Figure 15.
Density and distribution of probability for indoor CO2 concentration during occupied hours.
5. Conclusions
The measurements conducted in the analyzed classroom confirmed the low indoor air quality linked to high levels of metabolically generated CO2 during occupancy hours. A model developed using the CONTAM software (https://www.nist.gov/services-resources/software/contam, accessed on 29 August 2024) was evaluated against measurement data and is considered a suitable tool for future energy calculations and simulations of various ventilation schedules and systems.
The model was validated with measurement data and used to analyze the internal conditions during the entire heating season in Cracow. The simulations confirmed consistently poor air quality during this period, attributed to the low efficiency of the existing natural ventilation system.
The energy demand of the current inefficient ventilation system is substantial. While implementing mechanical ventilation would enhance indoor air quality, it would also increase energy demand.
Therefore, it is essential to use a mechanical ventilation system with heat recovery to both improve indoor air quality and optimize energy consumption. Future research will incorporate mechanical ventilation into the developed model to conduct annual simulations with different control strategies for mechanical ventilation systems.
Funding
This research received no external funding.
Data Availability Statement
The raw data supporting the conclusions of this article will be made available by the authors on request.
Conflicts of Interest
The authors declare no conflicts of interest.
References
- Grimsrud, D.; Bridges, B.; Schulte, R. Continuous measurements of air quality parameters in schools. Build. Res. Inf. 2006, 34, 447–458. [Google Scholar] [CrossRef]
- Myhrvold, A.N.; Olsen, E.; Lauridsen, O. Indoor environment in schools—Pupils health and performance in regard to CO2 concentrations. Indoor Air 1996, 96, 369–371. [Google Scholar]
- Simoni, M.; Annesi-Maesano, I.; Sigsgaard, T.; Norback, D.; Wieslander, G.; Nystad, W.; Canciani, M.; Sestini, P.; Viegi, G. School air quality related to dry cough, rhinitis and nasal patency in children. Eur. Respir. J. 2010, 35, 742–749. [Google Scholar] [CrossRef] [PubMed]
- Gennaro, G.; Dambruoso, P.; Loiotile, A.D.; Di Gilio, A.; Giungato, P.; Tutino, M.; Marzocca, A.; Mazzone, A.; Palmisani, J.; Porcelli, F. Indoor air quality in schools. Environ. Chem. Lett. 2014, 12, 467–482. [Google Scholar] [CrossRef]
- Ludwiczak, A.; Ratajczak, K. Ventilation of Didactic and Educational Facilities—A Review of Selected Polish and Foreign Requirements for Air Flow and Carbon Dioxide Concentration; Rynek Instalacyjny: Warsaw, Poland, 2018. [Google Scholar]
- Murkowski, A.; Skórska, E. Czy zwiększona Zawartość Dwutlenku Węgla w Powietrzu ma Wpływ na Sprawność Intelektualną Człowieka? Kosm. Probl. Nauk. Biol. 2016, 313, 631–636. [Google Scholar]
- Cohen, A.; Anderson, A.; Ostro, B.; Pandey, K.; Krzyzanowski, M.; Kunzli, N.; Gutschmidt, K.; Pope, A.; Romieu, I.; Samet, J.; et al. The global burden of desease due the outdoor air pollution. J. Toxicol. Environ. Health 2005, 68, 1301–1307. [Google Scholar] [CrossRef]
- Korsavi, S.; Montazami, A.; Mumovic, D. Indoor air quality (IAQ) in naturally-ventilated primary schools in the UK: Occupant-related factors. Build. Environ. 2020, 180, 106992. [Google Scholar] [CrossRef]
- Persily, A.; Jonge, L. Carbon dioxide generation rates for building occupants. Indoor Air. 2017, 27, 868–879. [Google Scholar] [CrossRef]
- Wargocki, P.; Wyon, D.P. Providing better thermal and air quality conditions in school classrooms would be cost-effective. Build. Environ. 2013, 59, 581–589. [Google Scholar] [CrossRef]
- Sadrizadeh, S.; Yao, R.; Yuan, F.; Awbi, H.; Bahnfleth, W.; Bi, Y.; Cao, G.; Croitoru, C.; Dear, R.; Haghighat, F.; et al. Indoor air quality and health in schools: A critical review for developing the roadmap for the future school environment. J. Build. Eng. 2022, 57, 104908. [Google Scholar] [CrossRef]
- Dols, W.S.; Polidoro, B.J. CONTAM User Guide and Program Documentation; Version 3.2, NIST Technical Note 1887; National Institute of Standards and Technology: Gaithersburg, MD, USA, 2015. [Google Scholar] [CrossRef]
- Godwin, C.; Batterman, S. Indoor air quality in Michigan schools. Indoor Air 2007, 17, 109–121. [Google Scholar] [CrossRef] [PubMed]
- Dorizas, P.V.; Assimakopoulos, M.N.; Helmis, C.; Santamouris, M. An integrated evaluation study of the ventilation rate, the exposure and the indoor air quality in naturally ventilated classrooms in the Mediterranean region during spring. Sci. Total Environ. 2015, 502, 557–570. [Google Scholar] [CrossRef]
- Turanjanin, V.; Vučićević, B.; Jovanović, M.; Mirkov, N.; Lazović, I. Indoor CO2 measurements in Serbian schools and ventilation rate calculation. Energy 2014, 77, 290–296. [Google Scholar] [CrossRef]
- Chang, L.S.C. Indoor and outdoor air quality investigation at schools in Hong Kong. Chemosphere 2000, 41, 109–113. [Google Scholar] [CrossRef]
- Korsavi, S.; Montazami, A.; Mumovic, D. Indoor Perceived indoor air quality in naturally ventilated primary schools in the UK: Impact of environ-mental variables and thermal sensation. Indoor Air 2021, 31, 480–501. [Google Scholar] [CrossRef]
- Szabados, M.; Csákó, Z.; Kotlík, B.; Kazmarová, H.; Kozajda, A.; Jutraz, A.; Kukec, A.; Otorepec, P.; Dongiovanni, A.; Di Maggio, A.; et al. Indoor air quality and the associated health risk in primary school buildings in Central Europe—The InAirQ Study. Indoor Air 2021, 31, 989–1003. [Google Scholar] [CrossRef] [PubMed]
- Dutton, S.; Shao, L. Window opening behaviour in a naturally ventilated school. In Proceedings of the Fourth National Conference of IBPSA-USA, New York, NY, USA, 11–13 August 2010. [Google Scholar]
- Dutton, S. Window Opening Behavior and Its Impact on Building Simulation: A Study in the Context of School Design. Ph.D. Thesis, University of Nottingham, Nottingham, UK, 2019. [Google Scholar]
- Belafi, Z.D.; Naspi, F.; Arnesano, M.; Reith, A.; Revel, G.M. Investigation on window opening and closing behavior in schools through measurements and surveys: A case study in Budapest. Build. Environ. 2018, 143, 523–531. [Google Scholar] [CrossRef]
- Kulis, C.; Müller, J. Indoor air quality improvement in natural ventilation using a fuzzy logic controller. Czas. Tech. 2020, 117. [Google Scholar] [CrossRef]
- Lyons, P.; Arasteh, D.; Huizenga, C. Window Performance for Human Thermal Comfort; Report to National Fenestration Rating Council; Center for the Built Environment: Berkeley, CA, USA, November 2005. [Google Scholar]
- Sowa, J. Air quality and ventilation rates in schools in Poland—Requirements, reality and possible improvements. Indoor Air 2002, 23, 68–73. [Google Scholar]
- Sowa, J. Air quality and ventilation rates in schools in Poland—Requirements vs. REALITY. In Proceedings of the 21st AIVC Annual Conference, “Innovations in Ventilation Technology”, The Hague, The Netherlands, 26–29 September 2000; p. 53. [Google Scholar]
- Sowa, J.; Wachenfeldt, B.J.; Panek, A.; Aschehoug, O. Analysis of Technologies for Improving Indoor Air Quality during Sustainable Redevelopment of Polish Schools. In Proceedings of the 8th International Conference Healthy Buildings, Lisboa, Portugal, 4–8 June 2006. [Google Scholar]
- Sowa, J.; Karas, A. Whole year simulation of natural and hybrid ventilation performance and estimation indoor air quality for modernized school building. In Proceedings of the Clima 2007 WellBeing Indoors, Helsinki, Finland, 10–14 June 2007. [Google Scholar]
- Griffithsa, M.; Eftekharib, M. Control of CO2 in a naturally ventilated classroom. Energy Build. 2008, 40, 556–560. [Google Scholar] [CrossRef]
- Bulińska, A. Analysis of the Use of Metabolically Generated Carbon Dioxide as a Tracing Gas for Determination of Indoor Air Exchange. Ph.D. Thesis, Silesian University of Technology in Gliwice, Gliwice, Poland, 2011. (In Polish). [Google Scholar]
- Persily, A.K. Evaluating Building IAQ and ventilation with indoor carbon dioxide. Ashrae Trans. 1997, 103, 1–12. [Google Scholar]
- Zhang, W.; Wang, L.; Ji, Z.; Hui, Y. Test on ventilation Rates of Dormitories and Offices in University by the CO2 Tracer Gas Method. Procedia Eng. 2015, 121, 662–666. [Google Scholar] [CrossRef]
- Nowak, K.; Nowak-Dzieszko, K.; Marcinkowski, A. Analysis of ventilation air exchange rate and indoor air quality in the office room using metabolically generated CO2. In IOP Conference Series: Materials Science and Engineering; IOP Publishing: Bristol, UK, 2018. [Google Scholar]
- Benedettelli, M.; Naticchia, B.; Carbonari, A.; Pascucci, M. Testing of Tracer Gas Based Measurement Procedure to Asses Air Change Rates in Buildings. In Proceedings of the 32nd International Symposium on Automation and Robotics in Construction, Oulu, Finland, 15–18 June 2015. [Google Scholar]
- Cichowicz, R.; Gawron-Skarbek, A.; Godala, M.; Zimna-Walendzik, E.; Sabiniak, H.; Szatko, F. Assesment of carbon dioxide concentration in the air of selected university facilities. Probl. Hig. Epidemiol. 2014, 95, 287–291. [Google Scholar]
- Sherman, M.H. Tracer gas techniques for measuring ventilation in a single zone. Build. Environ. 1990, 25, 365–374. [Google Scholar] [CrossRef]
- EN 12569 ISO/FDIS 12569:2012; Thermal Performance of Buildings and Materials—Determination of Specific Airflow Rate in Buildings—Tracer Gas Dilution Method. ISO: Geneva, Switzerland, 2012.
- Lis, P.; Lis, A. Required amount of ventilation air in the classroom and the possibility of air entering through windows. Energies 2021, 14, 7537. [Google Scholar] [CrossRef]
- Mijakowski, M.; Narowski, P. Indoor Climate and Energy Standard of School Buildings with Different Ventilation Strategy; National Energy Conservation Agency Warsaw: Warsaw, Poland, 2016.
- Mijakowski, M.; Sowa, J. An attempt to improve indoor environment by installing humidity sensitive air inlets in a naturally ventilated kindergarten building. Build. Environ. 2017, 111, 180–191. [Google Scholar] [CrossRef]
- Regulation of the Ministry of Labor and Social Policy of November 29, 2002 Regarding the Highest Allowable Concentrations and Factors Harmful to Health in the Working Environment. Available online: https://isap.sejm.gov.pl/isap.nsf/DocDetails.xsp?id=WDU20022171833 (accessed on 29 August 2024). (In Polish)
- ANSI/ASHRAE Standard 62.1-2019; Ventilation for Acceptable Indoor air Quality. American Society of Heating, Refrigerating and Air-Conditioning Engineers: Peachtree Corners, GA, USA, 2019.
- ASTM Standard D 6245-98; Standard Guide for Using Indoor Carbon Dioxide Concentrations to Evaluate Indoor Air Quality and Ventilation. American Society of Heating, Refrigerating and Air-Conditioning Engineers: Peachtree Corners, GA, USA, 1998.
- PN-83/B-03430; Wentylacja w Budynkach Mieszkalnych, Zamieszkania Zbiorowego i Użyteczności Publicznej. Wymagania. Polski Komitet Normalizacyjny: Warszawa, Poland, 1983.
- EN 16798-1:2017; Ventilation for Non-Residential Buildings—Performance requirements for Ventilation and Room-Conditioning Systems. CEN: Brussels, Belgium, 2017.
Disclaimer/Publisher’s Note: The statements, opinions and data contained in all publications are solely those of the individual author(s) and contributor(s) and not of MDPI and/or the editor(s). MDPI and/or the editor(s) disclaim responsibility for any injury to people or property resulting from any ideas, methods, instructions or products referred to in the content. |
© 2024 by the authors. Licensee MDPI, Basel, Switzerland. This article is an open access article distributed under the terms and conditions of the Creative Commons Attribution (CC BY) license (https://creativecommons.org/licenses/by/4.0/).