Abstract
Launcher efficiency is an important index for evaluating the performance of the electromagnetic launcher, and it reflects the ability of the launcher to convert input electrical energy into kinetic energy of the armature. In this paper, the launcher efficiency is taken as the objective function of bore parameter optimization, and particle swarm optimization is used to optimize the initial parameters of the BP neural network to improve the accuracy of the neural network in predicting launcher efficiency. The results show the following: (1) The predicted efficiency of the launcher shows the same trend as the experimental results. When the ratio of rail separation and rail height is greater than 1.75, the rate of change in the launcher efficiency curve decreases as the rail separation increases. (2) The weight of the influence of each parameter on the launcher efficiency follows the following law: convex arc height > rail separation > rail height > rail thickness. (3) The mean absolute error of the BP neural network prediction is 0.70%; after optimization by PSO, the mean absolute error is reduced to 0.28% and the mean relative accuracy is improved from 0.9774 to 0.9910, which indicates the feasibility of the PSO-BP neural network for the prediction of the launcher efficiency of an electromagnetic launcher.
1. Introduction
The electromagnetic launcher has been widely used in military and civil fields due to its high muzzle velocity, long range and safety [1,2,3]. The schematic diagram is shown in Figure 1. The electromagnetic launcher mainly consists of three parts: pulse power supply, launcher and control system. The launcher is mainly composed of two parallel rails and an armature. When the pulse current is supplied from the rail, the current passes through the armature and the other rail to form a closed loop and the armature moves linearly along the rail under the action of electromagnetic force, achieving a high muzzle velocity and kinetic energy [4,5,6].
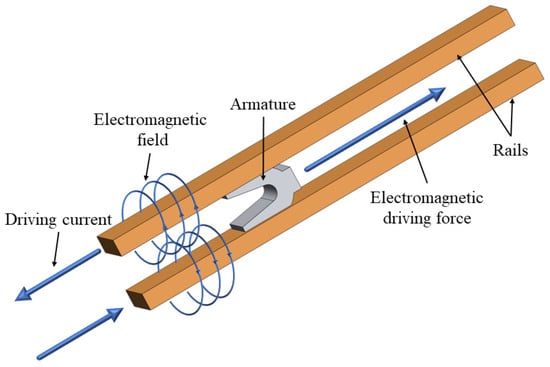
Figure 1.
Electromagnetic launcher schematic diagram.
Research on launcher efficiency and improving launcher efficiency is of great significance for the electromagnetic launcher [7,8,9]. The operating principle is not complex; it is not easy to achieve high launcher efficiency. Therefore, it is important to carry out this investigation on launcher efficiency. The current research mainly focuses on the simulation and theoretical calculations of the launcher efficiency and on the optimization of the pulsed power supply, which mainly includes the optimization of the triggering strategy [10,11], the optimization of the current waveform [12,13] and the structural parameters of the pulsed power supply [7,9,14,15,16,17].
In previous studies, researchers mainly used traditional methods to calculate the launcher efficiency. The traditional methods for obtaining the launcher efficiency of an electromagnetic rail launcher mainly include theoretical calculations, circuit simulation and finite element simulation. The theoretical calculation mainly adopts electromagnetics equations and kinematics equations to simplify the calculation; the driving force of the armature is calculated through the current and inductance gradient; the acceleration, displacement and muzzle velocity of the armature are calculated through the driving force; the breech voltage of the launcher is calculated based on the displacement of the armature, the input current and the resistance of the rail and the armature; and, finally, the launcher efficiency is obtained based on the calculated input energy and the kinetic energy of the armature. In the whole calculation process, friction, armature melting and other damage problems are ignored, and the theoretical calculation can only yield the approximate value of the launcher efficiency, which has a large error compared with the experimental results. Circuit simulation is the use of MATLAB built-in Simulink software to simplify the entire electromagnetic launcher system into a circuit model for calculation using the same formula and theoretical calculations, but, compared to the theoretical calculations, the circuit simulation has a relatively higher accuracy due to the power supply of the whole system being in the part of the topology that is more complex than the launcher. Therefore, circuit simulation is usually used to study the topology of the power supply and the efficiency of the power supply. Finite element simulation software is used to model the whole launcher system through parameter-setting and finite element calculation to obtain the input energy and kinetic energy of the armature and to calculate the launcher efficiency. However, the current finite element calculations are still ideal conditions without considering some current fluctuations and damage in the actual launching process, so the launcher efficiency obtained by the finite element calculations still has a large error compared with the experiment. Finite element simulation is the calculation of the whole launching process, which calculates all the values of each parameter in the launching process, so finite element simulation may have the disadvantages of not being able to converge and having a long calculation time. Therefore, the finite element is often used to study the current distribution, pressure distribution, temperature distribution and other phenomena in the launching process, and this method is seldom used for the calculation of launcher efficiency.
Artificial neural network (ANN) is a kind of computational model constructed by imitating the principle of the biological neural network [18], which can process and analyze data efficiently by simulating the links and information transfer between neurons in the brain. The core advantage of ANN to process and analyze data efficiently lies in its powerful adaptive learning ability, which can automatically adjust and optimize the model parameters inside the network through continuous learning, thus significantly improving the prediction accuracy and generalization ability.
With the rapid progress of computer technologies, ANN shows great application potential in many research fields, and it is widely used in the fields of image recognition, natural language processing, reinforcement learning, and predictive and regression analyses, and has obvious advantages in dealing with large-scale, complex problems. In the field of image recognition, ANN can accurately recognize and understand image content, and face recognition technology is one of its successful applications in security and personal identity verification systems. In natural language processing, ANN demonstrates the ability to understand and generate language, which greatly improves the performance of machine translation and speech recognition systems. In addition, ANN also has a good performance in building predictive models, which can predict future trends by analyzing historical data, such as applications in financial market analysis, weather forecasting, etc. The strong ability of ANN in dealing with large-scale and complex problems, especially its good performance in solving nonlinear and multi-dimensional problems, provides new ideas and solutions for the development of the engineering field [19,20].
In recent years, there have been several researchers who have applied neural network algorithms to the field of the optimization and design of electromagnetic launchers. In 2016, Yufeng Zheng [21] used the Elman dynamic grey neural network to predict the muzzle velocity of an electromagnetic launcher and compared it with the experiments. The results show that the improved Elman dynamic neural network has good accuracy for the prediction of the muzzle velocity. In 2020, Songcheng Li [22] used a grey model algorithm to study the temperature of the electromagnetic launcher and built an experiment platform to verify the accuracy of the results. The results show that the improved model based on Simpson’s formula has a better prediction performance. Xiangping Li [23,24] and others used a genetic algorithm for the design of the wind’s eye of sabot and the NSGA-II algorithm for the optimal design of the overload magnetic field generator. The above studies show the feasibility of using neural network algorithms to guide the application of electromagnetic launchers.
In this paper, the neural network-based launcher efficiency prediction model for the electromagnetic launcher is constructed based on a large amount of data from experiments, and the model is improved by using the particle swarm optimization algorithm to improve the convergence speed and prediction accuracy of the neural network. It provides a reference for the design and optimization of the bore cross-section of the electromagnetic launcher and promotes the application of the electromagnetic launcher.
2. Building Neural Network Models
2.1. Structure and of Principle Neural Network
The back propagation (BP) neural network is a commonly used artificial neural network, proposed by Rumelhart et al. in 1986, which is a multi-layer feed-forward neural network trained in accordance with the output error back propagation algorithm [25]. The BP neural network mainly consists of three layers, input, hidden and output layers, and the number of neurons in the input layer and output layer is the same as that in the input and output parameters, respectively, while the number of neurons in the hidden layer is related to the number of neurons in the input layer [26,27]. The neurons in each layer are connected by weights, thresholds and activation functions. The layers are fully connected, and there is no connection between neurons in the same layer. It has been shown theoretically that a three-layer neural network with a hidden layer can approximate arbitrary nonlinear functions [28]. The typical BP neural network topology is shown in Figure 2.
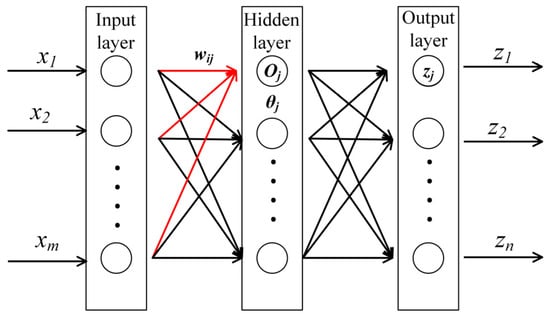
Figure 2.
BP neural network structure.
The input parameters (X,Y) of the neural network are X = (x1, x2, …, xm)T, Y = (y1, y2, …, yn)T, the hidden layer contains 1 units, the output of the hidden layer is O = (o1, o2, …, ol)T, the output layer has n units, the output result is z = (z1, z2, …, zn)T, the input layer to the hidden layer transfer function is f(x) and the hidden layer to the output layer transfer function is g(O). So, it can be concluded that
where w1 is the weight matrix between the input layer and hidden layer neurons, w2 is the weight matrix between the hidden layer and the output layer neurons, θ1 is the threshold matrix of the hidden layer, θ2 is the threshold matrix of the output layer and E is the error between the output result and the expectation.
The basic idea of BP neural network is to train on and learn from a certain number of sample pairs, which can be divided into two information transmission methods, forward propagation and back propagation. The input data in the process of forward propagation will go through a series of weighted calculations and nonlinear transformations, and will be transmitted to the next layer through the activation function of each neuron, and finally obtain the output result of the network. After the output result is calculated by forward propagation, the network will compare the output result with the expected output; if the error does not meet the accuracy requirements, back propagation will be carried out. During the back propagation process, the BP neural network will attribute the error to the inappropriate values of the weights and thresholds, recalculate the weights and thresholds of each neuron according to the error value and the gradient descent method in order from the output to the input layer, and use the new weights and thresholds for the next round of forward propagation. In the training process of BP neural network, forward propagation and back propagation are carried out alternately, and the error between the output of the network and the expected output is reduced by repeatedly adjusting the weights and thresholds in the network so that accurate prediction results can be obtained in the end.
BP neural network is relatively mature in both theory and prediction performance, and its outstanding advantages are its strong nonlinear mapping ability and flexible network structure. However, it has disadvantages such as a slow learning-convergence speed, susceptibility to fall into local minima, and difficulty in determining network structure. And the selection of initial weights and thresholds has a significant impact on the network prediction accuracy, but it cannot be obtained accurately. To solve this problem, particle swarm optimization is proposed optimize the BP neural network. Through particle swarm optimization, the initial weights and thresholds of the BP neural network are obtained, thereby reducing the convergence time of the algorithm and improving the prediction accuracy.
Particle swarm optimization (PSO) is a global stochastic search algorithm proposed by Kennedy, inspired by the foraging behavior of birds [29,30]. The simplest strategy for birds to search for food is to search the area around the bird that is closest to the current food. Each particle in the PSO algorithm represents a potential solution, and the fitness of each particle is determined by the fitness function. The position, velocity and fitness are used to represent the characteristics of the particle, the fitness of the particle is recalculated as the particle position is updated and the optimal individual and population are determined based on the fitness values. The BP neural network input layer to the hidden layer uses the tansig function as the activation function, and the hidden layer to the output layer uses the purelin function as the activation function, and takes the network error of the BP neural network as the fitness value of the PSO algorithm. The flow chart of the particle swarm optimization-improved BP neural network (PSO-BP neural network) is shown in Figure 3:
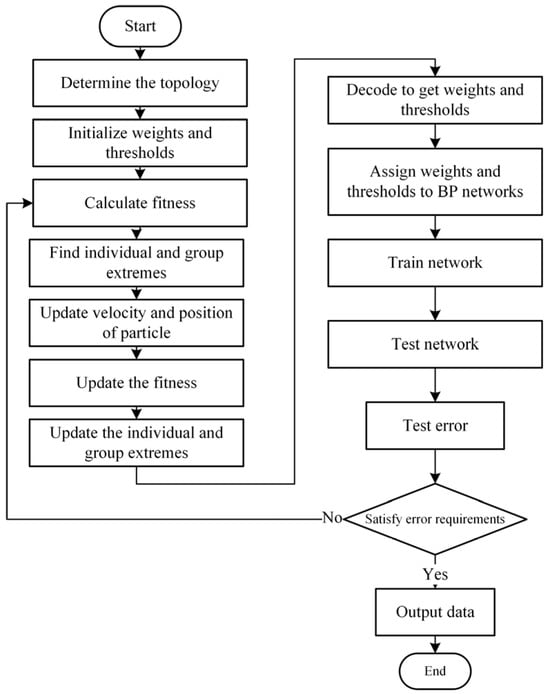
Figure 3.
Flow chart of PSO-BP neural network.
The PSO-BP neural network is mainly divided into BP neural network structure determination, PSO algorithm optimization of weights and thresholds [31,32,33] and BP neural network training and prediction. Firstly, the BP neural network structure is determined based on the number of input and output parameters of the sample, so as to determine the number of parameters optimized by the particle swarm optimization; the weights and thresholds of the BP neural network are usually random numbers in the interval [−0.5, 0.5], which have a great impact on the network training, but cannot be obtained accurately, and the use of the PSO is to optimize the optimal initial weights and thresholds [34,35,36]. When the input and output are determined, the network structure is known, and then the optimal initial weights and thresholds of the BP neural network are obtained by PSO; finally, the BP neural network will use the optimized weights and thresholds for training, calculate the output results that meet the error accuracy requirements and then predict the output results [37].
2.2. Parameters of Algorithm
The launcher efficiency of the electromagnetic launcher mainly depends on the shape and geometry of the bore cross-section, and the bore parameters are shown in Figure 4, which mainly include the rail separation s, the rail height h, the rail thickness w, the convex arc height s3, the chord length hc, the radius of the circular arc R and the angle of the center θ. The experiments were carried out to investigate the influence of the above parameters on the launcher efficiency ηL by varying s, h, w and s3. The experimental parameters are shown in Table 1.
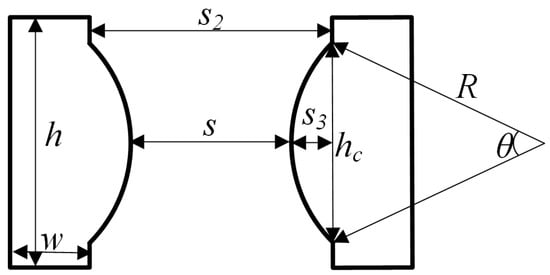
Figure 4.
Electromagnetic launcher bore cross-section structure and parameters.

Table 1.
Parameters of experiments.
The neural network constructed in this paper is a three-layer structure, including 1 input layer, 1 hidden layer and 1 output layer. The number of neurons n2 in the hidden layer and the number of neurons n1 in the input layer satisfy the following relationship:
The number of neurons in the input layer and output layer is equal to the number of experimental input and output parameters, respectively, so the constructed BP neural network includes 4 input layer neurons, 9 hidden layer neurons and 1 output layer neuron, and the structure is shown in Figure 5, and the main parameters of the PSO-BP neural network are shown in Table 2.

Figure 5.
PSO-BP neural network structure.

Table 2.
Parameters of PSO-BP neural network.
3. Neural Network Validation and Discussion
3.1. Results of Prediction
To verify the accuracy of the PSO-BP neural network in this paper for predicting the launcher efficiency of the electromagnetic launcher, the experimental data are used and randomly divided into three parts according to a certain proportion, which are the training set, the validation set and the prediction set. The training set is used to build the model, xi and y from the data are inputted into the model for training and learning and the initial parameters of the model are found through the fitting method, which are the weight matrix w and threshold matrix θ of the BP neural network. The validation set is used to validate the accuracy of the model, and the validation data are compared with the output data through the error function, and the error is essentially a function of w and θ. The back propagation process is essentially to find a set of w and θ that minimizes the network error.
The prediction set is used to evaluate the final generalization ability of the model, and the prediction accuracy of the model is assessed by the regression coefficient, the mean absolute error and the mean relative error. For each independent validation model, the proportion of the data set remains unchanged, and the prediction set is not involved in the model training process and is only used to verify the accuracy of the model prediction results.
The prediction results of BP neural network and PSO-BP neural network are shown in Figure 6 and Figure 7, where Figure 6a and Figure 7a show the prediction results of the launcher efficiency with the change in rail separation when the rail height h = 15~20 mm. When the rail height remains unchanged, the launcher efficiency increases with the increase in the rail separation. When the rail height is 15 mm, the rate of change of the launcher efficiency curve decreases. When the rail separation is greater than 21 mm, at this time, the armature height is 12 mm and ratio of the rail separation and rail height is 1.75; moreover, increasing this ratio will also lead to a risk of unstable motion in the armature in the bore. Therefore, when selecting the rail separation and height, the efficiency and stability of the armature movement should be considered. Figure 6b and Figure 7b are the launcher efficiency with the change in convex arc height when the rail separation is s = 15~17, from which it can be seen that the launcher efficiency increases with the increase in convex arc height when the rail separation is constant; Figure 6c and Figure 7c are the launcher efficiency with the change in rail thickness when the rail separation is s = 16~22, from which it can be seen that when the rail separation is unchanged, the launcher efficiency decreases with the increase in rail thickness. The predicted data and the experimental data are basically the same in trend, which indicates that the neural network has a certain degree of accuracy.
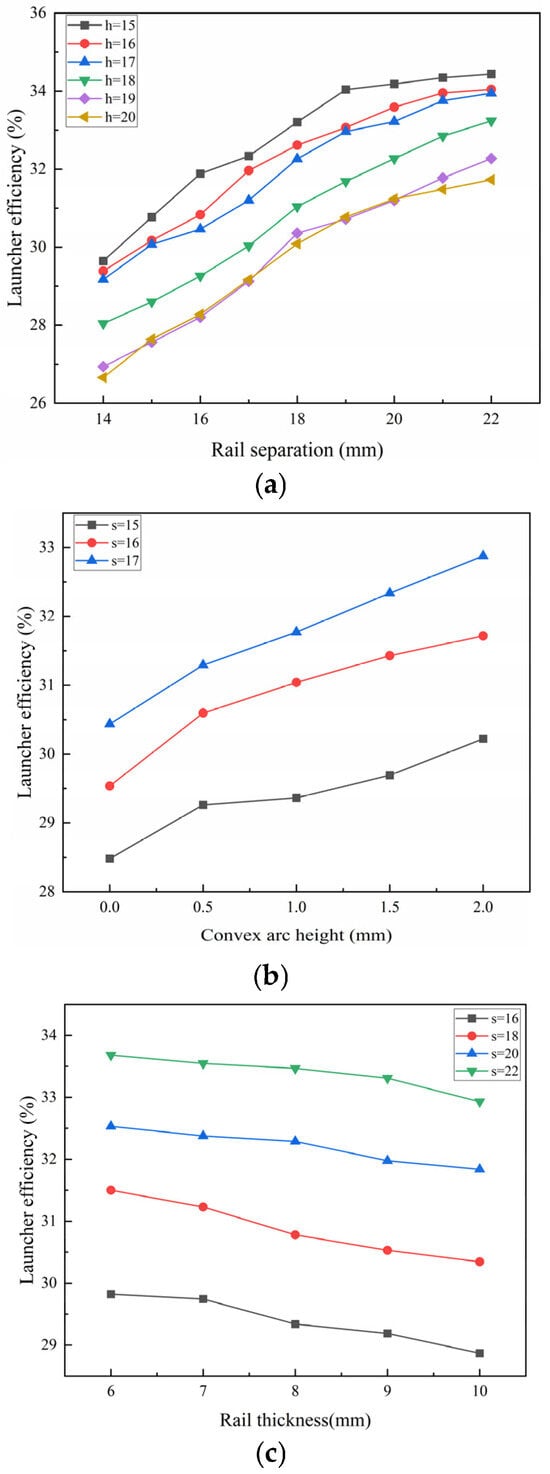
Figure 6.
BP neural network prediction results. (a) Prediction results of launcher efficiency under different rail separations; (b) prediction results of launcher efficiency under different convex arc heights; (c) prediction results of launcher efficiency under different rail thicknesses.
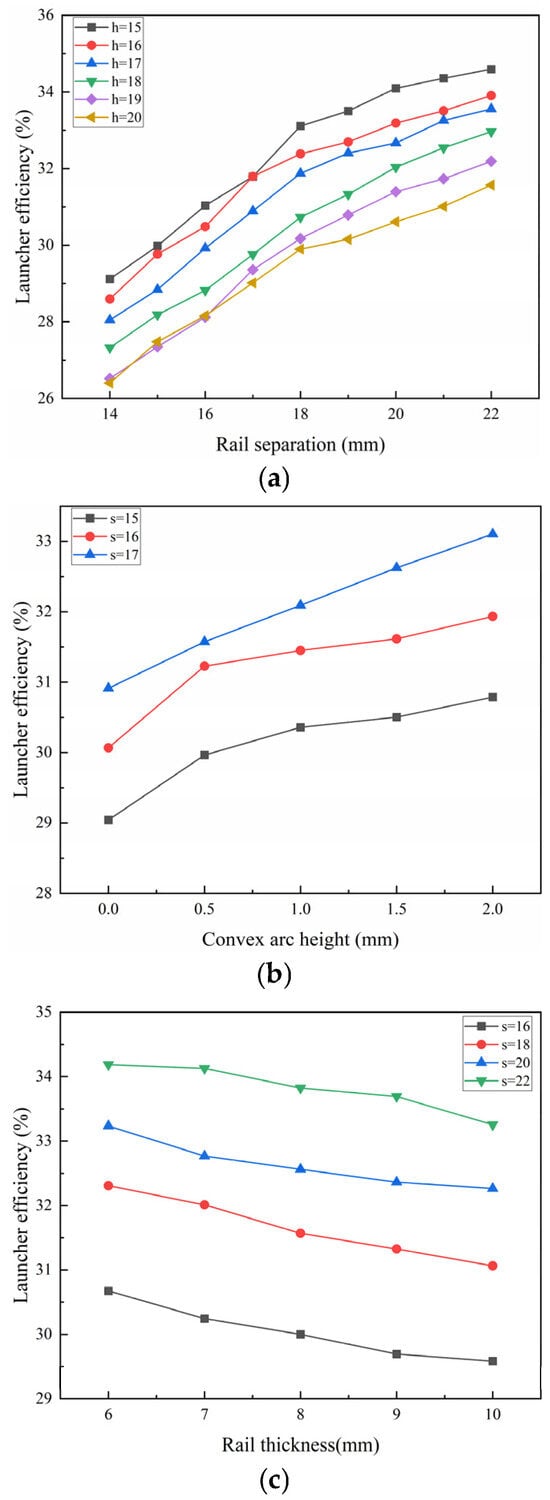
Figure 7.
PSO-BP neural network prediction results. (a) Prediction results of launcher efficiency under different rail separations; (b) prediction results of launcher efficiency under different convex arc heights; (c) prediction results of launcher efficiency under different rail thicknesses.
3.2. Generalization Performance Testing and Analysis
The prediction data and the experimental data are compared and analyzed to further verify the generalization performance of the launcher efficiency prediction model. The prediction performance of the standard BP neural network and the PSO-BP neural network model is shown in Figure 8, which shows that after optimization by PSO, the regression value R of the BP neural network for predicting the launcher efficiency is improved from 0.9620 to 0.9962, which is an increase of 3.55% in the prediction R coefficient compared with that of the standard model.
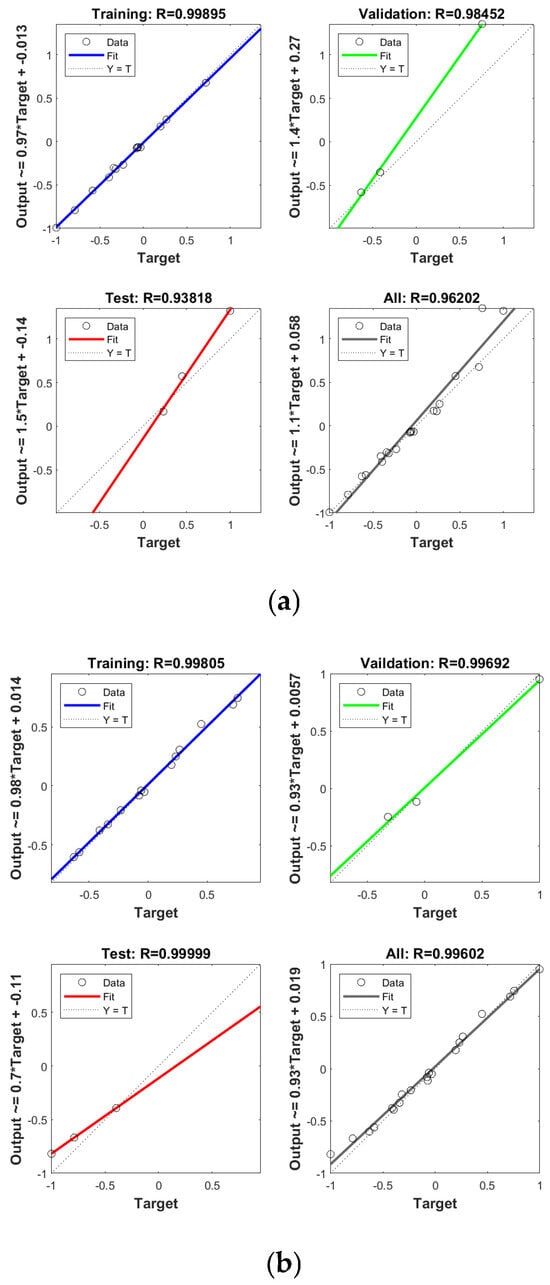
Figure 8.
Neural network prediction of launcher efficiency regression curves. (a) Regression curves of BP neural network; (b) regression curves of PSO-BP neural network.
The experimental data are the launcher efficiencies under different rail separation, rail height, rail thickness, and convex arc height conditions, and 3~5 data sets are selected for each size to avoid the randomness of a single experimental result and improve the accuracy of the model prediction. For each prediction, 20% of the data are randomly selected as the prediction set, and the data in the prediction set are only used for comparison to verify the accuracy and precision of the model, and the prediction data, experimental data and error results are shown in Figure 9, Figure 10 and Figure 11.
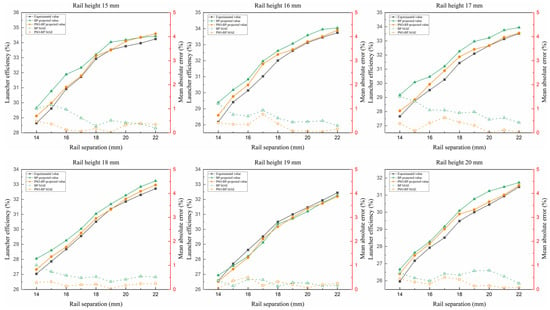
Figure 9.
Prediction result of launcher efficiency results for different rail separations and heights.

Figure 10.
Prediction result of launcher efficiency results for different convex arc heights.
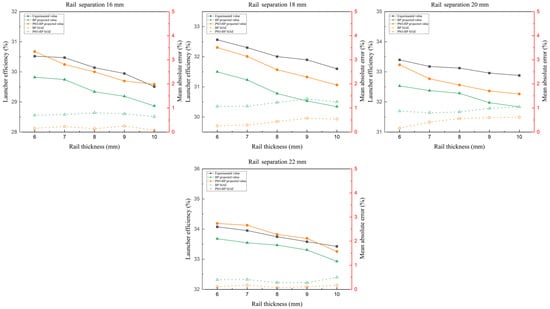
Figure 11.
Prediction result of launcher efficiency for different rail thicknesses and separations.
Figure 9 shows the prediction results of the neural network and the errors of the launcher efficiency with rail separation at different rail heights with experimental values, predicted values and average errors, respectively. In each group of prediction results, the average absolute errors of the predicted and experimental values are kept below 2%, and among the six groups of prediction results, the mean absolute errors (MAEs) of the BP prediction and PSO-BP prediction results are 0.59% and 0.25%, respectively, which indicate that the neural network has good accuracy in predicting the launcher efficiency of the electromagnetic launcher. The error curves fluctuate more in the prediction results of the rail heights of 17 mm and 20 mm, which is due to the larger variance of the launcher efficiency in the experimental data, and the experimental values in the figure are the average results of many experiments, and the larger fluctuation in the data affects the prediction accuracy of the results, while the rest of the experimental data have a smaller variance, so the error volatility of the prediction results is also smaller.
With other conditions constant, when the rail separation is small, for each 1 mm increase in rail separation, the experimental results of the launcher efficiency increase by an average of 1.07% and the predictions of the BP and PSO-BP neural networks increase by an average of 0.83% and 0.93%, respectively. When the rail separation is large, for every 1 mm increase in rail separation, the experimental results and the launcher efficiency predicted by BP and PSO-BP increase by 0.40%, 0.25% and 0.39%. For each 1 mm increase in rail separation, the launcher efficiency increases by 0.71% on average. The comparison of different rail heights shows that for every 1 mm increase in rail height, the launcher efficiency increases by an average of 0.61%. It can be preliminarily concluded that for a small caliber, the effect of rail separation on launcher efficiency is more significant than that of rail height.
Figure 10 shows the neural network prediction results and errors of the launcher efficiency with the change in the convex arc height at different rail separations, and the trend of the curves of the prediction results and the experimental results are basically the same. In the case of constant rail separation, the average increase in the launcher efficiency is about 1.21% when the convex arc height is increased from 0 mm to 0.5 mm, the average increase in the launcher efficiency is 0.98% when the convex arc height is increased from 0.5 mm to 2 mm, and it is calculated that the launcher efficiency is increased by 1.10% for each 1 mm increase in the convex arc height. The MAE of both prediction methods is kept below 2%, and the average MAE values are 0.72% and 0.29%, respectively, compared with the larger error of the predicted results of the launcher efficiency for the change in rail separation, which is due to the fact that three repetitions of this group of experiments were carried out under the same conditions and the change in the rail parameters in this group of experiments was small, so that the total number of experiments was less than that of the previous experiments; therefore, the prediction of the mean absolute error of the results is larger than that of the previous group, but still remains below 2% overall.
Figure 11 shows the predicted results of the relationship between launcher efficiency and rail thickness when the rail separation is certain: the launcher efficiency decreases with the increasing of rail thickness, and the predicted results are basically consistent with the experimental law.
When the rail thickness increases from 6 mm to 10 mm, the launcher efficiency decreases by 0.78% on average, and the launcher efficiency decreases by 0.19% for every 1 mm increase in rail thickness. In the predicted results, the launcher efficiency decreases by 0.22% and 0.26% for each 1 mm increase in rail thickness.
The MAEs of the two neural networks are 0.80% and 0.30%, respectively, which remain below 2%. The prediction error increased compared with the previous two groups, which is due to the relatively small effect of the rail thickness on the launcher efficiency in the experiment, and there is some error in the electromagnetic launch experiment itself. In the experiments, the extreme difference in the launcher efficiency can reach up to 6.5% under the same experimental conditions, and the experimental law is susceptible to experimental random error. The prediction result error is smaller than the experimental random error, which is within the error tolerance.
The mean absolute error (MAE), mean relative error (MRE) and mean relative accuracy (MRA) were used as evaluation indicators to accurately evaluate the performance of the two neural networks. The evaluation indicators were calculated, respectively, and the results are shown in Table 3. After the BP neural network was improved by PSO, the MAE was reduced from 0.70% to 0.28%, and the prediction error was reduced by 59.85%; the MRE was reduced from 0.0226 to 0.0090; and the MRA was improved from 0.9774 to 0.9910. The above parameters show that, compared with the traditional BP neural network, the PSO-BP neural network has a higher accuracy and faster prediction speed in the prediction of electromagnetic launcher efficiency, and has a more excellent prediction performance.

Table 3.
Comparison of prediction accuracy of neural network model.
The average rate of change of launcher efficiency can be calculated from the variation in launcher efficiency, as is shown in Table 4. The average rate of change is defined as the change in the launcher efficiency for each 1 mm increase in input parameters. The average rate of change of different parameters is different, and the launcher efficiency increases by 0.71%, 0.61% and 1.10% for every 1 mm increase in rail separation, rail height and convex arc height, respectively, and decreases by 0.19% for every 1 mm increase in rail thickness, which indicates that the launcher efficiency increases with the increase in rail separation, height and convex arc height, and decreases with the increase in rail thickness. And the weight of the influence of each parameter on the launcher efficiency follows that of the input parameters. And it can be preliminarily concluded that the weight of influence of each parameter on the launcher efficiency follows the law of convex arc height > rail separation > rail height > rail thickness.

Table 4.
Average rate of change of launcher efficiency.
4. Conclusions and Future Work
In this paper, a BP neural network improved by PSO was used to predict the launcher efficiency of an electromagnetic launcher, and the influence of different parameters such as rail separation, rail height, rail thickness and convex arc height on launcher efficiency were investigated, respectively, and the prediction accuracy of the BP and PSO-BP neural networks is compared by prediction errors. The results show the following:
- (1)
- The predicted and experimental results of launcher efficiency have the same trend of change. When the ratio of rail separation and rail height is greater than 1.75, with the increase in rail separation, the launcher efficiency still increases, but the slope of the curve decreases, indicating that the increase in rail separation has a limited effect on the launcher efficiency and that there exists a limiting value of this ratio.
- (2)
- According to the experimental data and the predicted results, the weight of the influence of each parameter on the launcher efficiency follows the following law: convex arc height > rail separation > rail height > rail thickness.
- (3)
- The mean absolute error of the BP neural network for predicting the launcher efficiency is 0.70%, and the mean absolute error of the PSO-BP neural network for predicting the launcher efficiency is 0.28%. Compared with the BP neural network, the prediction accuracy of the PSO-BP neural network was improved from 0.9774 to 0.9910, significantly improving the prediction accuracy of launcher efficiency. This indicates that the PSO-BP neural network constructed in this paper has a good predictive performance for electromagnetic launchers.
In our future work, we will firstly optimize the neural network structure to further improve the convergence speed and prediction accuracy of the whole prediction model, use different kinds of neural networks to improve the BP neural network for the prediction of launcher efficiency and compare the prediction accuracy and convergence speed of the improved BP neural network using different neural networks. Then, the results in Conclusion 1 of the manuscript will be studied in detail, the range of variable parameters in the experiment will be increased, the limit of the influence of each parameter on the launcher efficiency will be investigated, and the influence weights of each parameter on the launcher efficiency will be quantitatively studied by regression analysis. Finally, bore parameter optimization will be carried out to select bore parameters with a high launcher efficiency, long life and high accuracy.
Author Contributions
Conceptualization and validation, N.X.; resources, J.L.; writing—review and editing and supervision, P.Y. All authors have read and agreed to the published version of the manuscript.
Funding
This research received no external funding.
Data Availability Statement
Data are available on request due to privacy and ethical restrictions.
Conflicts of Interest
The authors declare no conflicts of interest.
References
- Li, J.; Yan, P.; Yuan, W. Electromagnetic Gun Technology and Its Development. High Volt. Eng. 2014, 40, 1052–1064. [Google Scholar]
- Marshall, R.A.; Wang, Y. Railguns: Their Science and Technology; China Machine Press: Beijing, China, 2004. [Google Scholar]
- Fair, H.D. Guest Editorial The Past, Present, and Future of Electromagnetic Launch Technology and the IEEE International EML Symposia. IEEE Trans. Plasma Sci. 2015, 43, 1112–1116. [Google Scholar] [CrossRef]
- Ellis, R.L.; Poynor, J.C.; McGlasson, B.T.; Smith, A.N. Influence of bore and rail geometry on an electromagnetic naval railgun system. IEEE Trans. Magn. 2005, 41, 182–187. [Google Scholar] [CrossRef]
- Li, S.; Cao, R.; Zhou, Y.; Li, J. Performance Analysis of Electromagnetic Railgun Launch System Based on Multiple Experimental Data. IEEE Trans. Plasma Sci. 2019, 47, 524–534. [Google Scholar] [CrossRef]
- Zhu, R.; Zhang, Q.; Li, Z.; Jin, L.; Wang, R. Impact physics model and influencing factors of gouging for electromagnetic rail launcher. In Proceedings of the 2014 17th International Symposium on Electromagnetic Launch Technology, San Diego, CA, USA, 7–11 July 2014; pp. 1–6. [Google Scholar]
- Liu, S.; Miao, H.; Liu, M. Investigation of the Armature Contact Efficiency in a Railgun. IEEE Trans. Plasma Sci. 2019, 47, 3315–3319. [Google Scholar] [CrossRef]
- Wen, Y.; Dai, L.; Lin, F. Effect of Geometric Parameters on Equivalent Load and Efficiency in Rectangular Bore Railgun. IEEE Trans. Plasma Sci. 2021, 49, 1428–1433. [Google Scholar] [CrossRef]
- Sung, V.; Odendaal, W.G. The Effect of Changing Launch Package Mass on the Electromechanical Conversion Efficiency of Railguns. IEEE Trans. Plasma Sci. 2019, 47, 2521–2531. [Google Scholar] [CrossRef]
- Chang, X.; Yu, X.; Liu, X.; Li, Z. Armature Velocity Control Strategy and System Efficiency Optimization of Railguns. IEEE Trans. Plasma Sci. 2018, 46, 3634–3639. [Google Scholar] [CrossRef]
- Gong, C.; Yu, X.; Liu, X. Study on the system efficiency of the synchronously-triggered capacitive pulsed-power supply in the electromagnetic railgun system. In Proceedings of the 2014 17th International Symposium on Electromagnetic Launch Technology, San Diego, CA, USA, 7–11 July 2014; pp. 1–6. [Google Scholar]
- Cao, G.; Xiang, H.; Qiao, Z.; Liang, C.; Yuan, X.; Wang, J.; Lei, B. Utilization Optimization of Capacitive Pulsed Power Supply in Railgun. Energies 2022, 15, 5051. [Google Scholar] [CrossRef]
- Liu, X.; Yu, X.; Liu, X. Influences of electric parameters of pulsed power supply on electromagnetic railgun system. IEEE Trans. Plasma Sci. 2016, 43, 3260–3267. [Google Scholar]
- Li, Z.X.; Hao, S.P.; Ma, F.Q.; Li, B.M. Current Situation and Development of Pulsed Power Supply Module Technology for Electric Gun. Acta Armamentarii 2020, 41, 1–7. [Google Scholar]
- Liu, X.; Yu, X.; Li, Z. Inductance calculation and energy density optimization of the tightly coupled inductors used in inductive pulsed power supplies. IEEE Trans. Plasma Sci. 2017, 45, 1026–1031. [Google Scholar] [CrossRef]
- Zhang, P.; Gao, W.; Niu, Q.; Dong, S. Numerical Analysis of Aerodynamic Thermal Properties of Hypersonic Blunt-Nosed Body with Angles of Fire. Energies 2023, 16, 1740. [Google Scholar] [CrossRef]
- Ceylan, D.; Keysan, O. Effect of conducting containment on electromagnetic launcher efficiency. In Proceedings of the 2017 18th International Symposium on Electromagnetic Fields in Mechatronics, Electrical and Electronic Engineering (ISEF) Book of Abstracts, Lodz, Poland, 14–16 September 2017; pp. 1–2. [Google Scholar]
- Zhang, C.; Guo, Y.; Li, M. Review of Development and Application of Artificial Neural Network Models. Comput. Eng. Appl. 2021, 57, 57–69. [Google Scholar]
- Bian, Y. Application of Genetic BP network to discriminating earthquakes and explosions. Acta Seismol. Sin. 2002, 24, 516–524. [Google Scholar] [CrossRef]
- Wu, Y.; Zhu, X.; Wu, M. Application of the Neural Network in Predictive Coding. Syst. Eng. Electron. 2002, 24, 88–91. [Google Scholar]
- Zheng, Y.; Jiang, T.; Jiang, H.; Lu, J.; Li, C. On application of Elman dynamic grey neural network in diagnosis of electromagnetic launch system. J. Nav. Univ. Eng. 2016, 28, 31–35. [Google Scholar]
- Li, S.; Lu, J.; Wu, Y. Research on temperature of electromagnetic rail launcher based on graymodel. J. Natl. Univ. Def. Technol. 2020, 42, 90–97. [Google Scholar]
- Li, X.; Lu, J.; Feng, J. Structure design for wind’s eye of sabot using genetic algorithm. J. Natl. Univ. Def. Technol. 2019, 41, 24–30. [Google Scholar]
- Li, X.; Lu, J.; Zhang, X. Optimization of generator of high overlkoad andstrong magnetic field based on NAGA-I. Trans. China Electrotech. Soc. 2021, 36, 4399–4407. [Google Scholar]
- Wang, Y.; Guo, Q.; Li, W. Predictive Model Based on Improved BP Neural Networks and It’s Application. Comput. Meas. Control 2005, 13, 39–42. [Google Scholar]
- Zhao, J.; Gong, X.; Dai, Z.; Guo, X.; Sheng, X.; Han, Q.; Bian, X. Prediction of Entrained-Flow Puiverized Coal Gasifier Based on BP Neural Networks. Journal of East China University of Science and Technoloy. Nat. Sci. Ed. 2009, 35, 688–692. [Google Scholar]
- Zhu, S. Intrusion detection based on BP neural network and Bagging method. Comput. Eng. Appl. 2009, 45, 123–125+128. [Google Scholar]
- Guo, M.; Xing, H.; Zhang, D.; Zhang, L. Temperature Compensation for Humidity Sensor Based on the AFSA-BP Neural Network. Intstrument Technol. Sens. 2017, 8, 6–10. [Google Scholar]
- Zhang, K.; Gan, X. Network traffic forecasting model based on neural network and POS with simulated annealing. Comput. Eng. Des. 2012, 33, 2013–2016. [Google Scholar]
- Wang, H.J.; Bai, M.; Jia, Z.L.; Qin, L.P. Futures prices forecasting based on PSO neural network. Comput. Eng. Des. 2009, 30, 2428–2430, 2434. [Google Scholar]
- Yang, D.H.; Ma, G.W.; Liu, Q.F.; Tao, C.H.; Guo, X.M. Runoff prediction by BP networks model based on PSO. J. Hydroelectr. Eng. 2006, 25, 65–68. [Google Scholar]
- Li, N.; Li, Y. Electricity price forecast based on PSO-BP neural network. Engineering Journal of Wuhan University. Eng. Ed. 2008, 41, 102–105. [Google Scholar]
- Jiang, C.S.; Li, Y.D.; Wang, Z.D. A Study on Optimization of Automotive Suspension Base on PSO-BP Network Algorithm. Appl. Mech. Mater. 2012, 121, 3760–3764. [Google Scholar] [CrossRef]
- Sun, H.; Xue, Z.; Sun, K.; Wang, S.; Du, Y. Fault Diagnosis Analysis of Power Transformer Based on PSO-BP Algorithm. Adv. Mater. Res. 2012, 466, 789–793. [Google Scholar] [CrossRef]
- Yin, H.; Wang, K.; Zhang, T.; Hua, Q.; Qin, Y.; Guo, J. Fault Prediction Based on PSO-BP Neural Network About Wheel and Axle Box of Bogie in Urban Rail Train. Complex Syst. Complex. Sci. 2015, 12, 97–103. [Google Scholar]
- Deng, C.; Ouyang, B.; Chen, Y. A buliding settlement prediction model based on PSO-BP neural network. Sci. Surv. Mapp. 2018, 43, 27–31, 38. [Google Scholar]
- Zhao, G.; Zhu, F.; Dou, R. SOC estimation of lithium battery for electric vehicle based on PSO-BP neural network. Chin. J. Power Sources 2018, 42, 1318–1320. [Google Scholar]
Disclaimer/Publisher’s Note: The statements, opinions and data contained in all publications are solely those of the individual author(s) and contributor(s) and not of MDPI and/or the editor(s). MDPI and/or the editor(s) disclaim responsibility for any injury to people or property resulting from any ideas, methods, instructions or products referred to in the content. |
© 2024 by the authors. Licensee MDPI, Basel, Switzerland. This article is an open access article distributed under the terms and conditions of the Creative Commons Attribution (CC BY) license (https://creativecommons.org/licenses/by/4.0/).