1. Introduction
Facing the challenges of climate change and energy crises, tidal current energy offers a new option due to its stability and high energy density [
1,
2]. Large-scale utilization of tidal current energy typically involves deploying water energy capture devices in a regular array distribution within flowing tidal currents [
3]. As a component of these arrays, the vertical axis water turbine (VAWT) is an effective water energy utilization device that has gained widespread attention in recent years due to its excellent performance under low flow speeds and varying flow directions [
4]. Compared to traditional horizontal axis water turbines, VAWTs have advantages such as simpler structure, easier maintenance, and lower environmental impact [
5]. However, in practical operation, the wake flow of VAWTs has been a significant factor affecting their efficiency and performance [
6]. In the context of tidal current energy development arrays, wake characteristics impact the energy capture efficiency of downstream devices.
Wake characteristics refer to the velocity distribution and vortex structures formed downstream after fluid passes through a turbine [
7]. Wake velocity decay, which is an important aspect of wake characteristics, is widely observed in tidal current energy development, like fields of wind energy. This characteristic is influenced by various factors, including turbine structural features [
8], the number of turbines [
9], and the surrounding environmental conditions [
10]. Among these, turbulence, as a medium of energy transfer, affects the interaction between wake energy and the surrounding fluid environment, depending on its intensity. Turbulence intensity (
TI) is an important parameter describing velocity fluctuations in fluid flow and is typically defined as the ratio of the root mean square of velocity fluctuations to the mean flow velocity [
11]. In natural water bodies, turbulence intensity varies significantly due to factors including topography, hydrology, meteorological conditions, and human activities [
12,
13]. In the ocean, turbulence intensity, as a crucial parameter in the working environment of turbines, significantly affects their performance efficiency, the diffusion speed of wake vortices, the intensity of vortices, and the recovery distance, thereby influencing the overall performance of the turbine and the optimization of the spacing between multiple turbines [
14,
15]. For VAWTs, the
TI in the working environment not only affects turbine power output and efficiency but also directly relates to the wake characteristics of turbines and impact the surrounding environment and nearby turbines.
Current research on the interaction between turbulence and turbines mainly focuses on horizontal axis water turbines and wind turbines, with relatively few study on VAWTs. Through a combination of experimental and numerical simulations, Wang [
16] quantified the performance variations of a three-dimensional airfoil under different turbulence conditions, providing important insights into the relationship between turbulence and aerodynamic characteristics. Zhang [
17] discussed the quantification of three-dimensional turbulence intensity and the influence of wake anisotropy on the performance of horizontal axis wind turbines. Barnes [
18] analyzed the accuracy and reliability of different turbulence models in simulating the wake of vertical axis wind turbines, focusing on the influence of turbulence models on the wake structure, expansion, and velocity distribution. Talukdar [
19] found that increasing turbulence intensity reduces the energy capture efficiency of VAWTs, mainly due to the increased load fluctuations on the blades caused by turbulence-induced flow instability, making the wake more unstable and complex. Watanabe [
20] showed that the impact of turbulence on horizontal axis water turbines primarily manifests in increased blade load fluctuations and decreased efficiency, with turbulence-induced disturbances increasing the instability of the wake region and the recovery time of the wake. However, most of existing studies on VAWTs were conducted under condition of low turbulence intensity, failing to fully reflect the complex flow characteristics in actual water environments [
21]. These studies tended to qualitatively describe the impact of turbulence on turbine performance and wake characteristics, few of them providing a quantitative depiction of turbulence intensity and its effect on wake velocity.
Quantitatively characterizing the effect of turbulence intensity on wake velocity is usually achieved by establishing theoretical formulas. Most of existing wake theoretical models mostly focus on wind turbines and horizontal axis water turbines [
22,
23,
24], with few study on the wake of VAWTs [
25]. There is no theoretical model has yet been found that describes the relationship between turbulence intensity and the wake velocity of VAWTs. Based on CFD three-dimensional simulation data and using axial momentum theory and Gaussian probability distribution functions, Lam et al. [
25], proposed two equations to predict the axial and lateral mean velocities within the wake of VAWTs. These equations reflect the position and magnitude of the velocity deficit well, but they do not accurately represent the acceleration zones on either side of the velocity deficit. Additionally, the equation only includes the relationship between wake velocity and axial and lateral distances, without considering the impact of turbulence intensity on wake velocity. Therefore, this study aims to the application of a new mathematical method to introduce turbulence intensity into Lam’s equation, improving the formula’s prediction accuracy, expanding its application range, and supplementing the models in the field of wake velocity prediction. As shown in
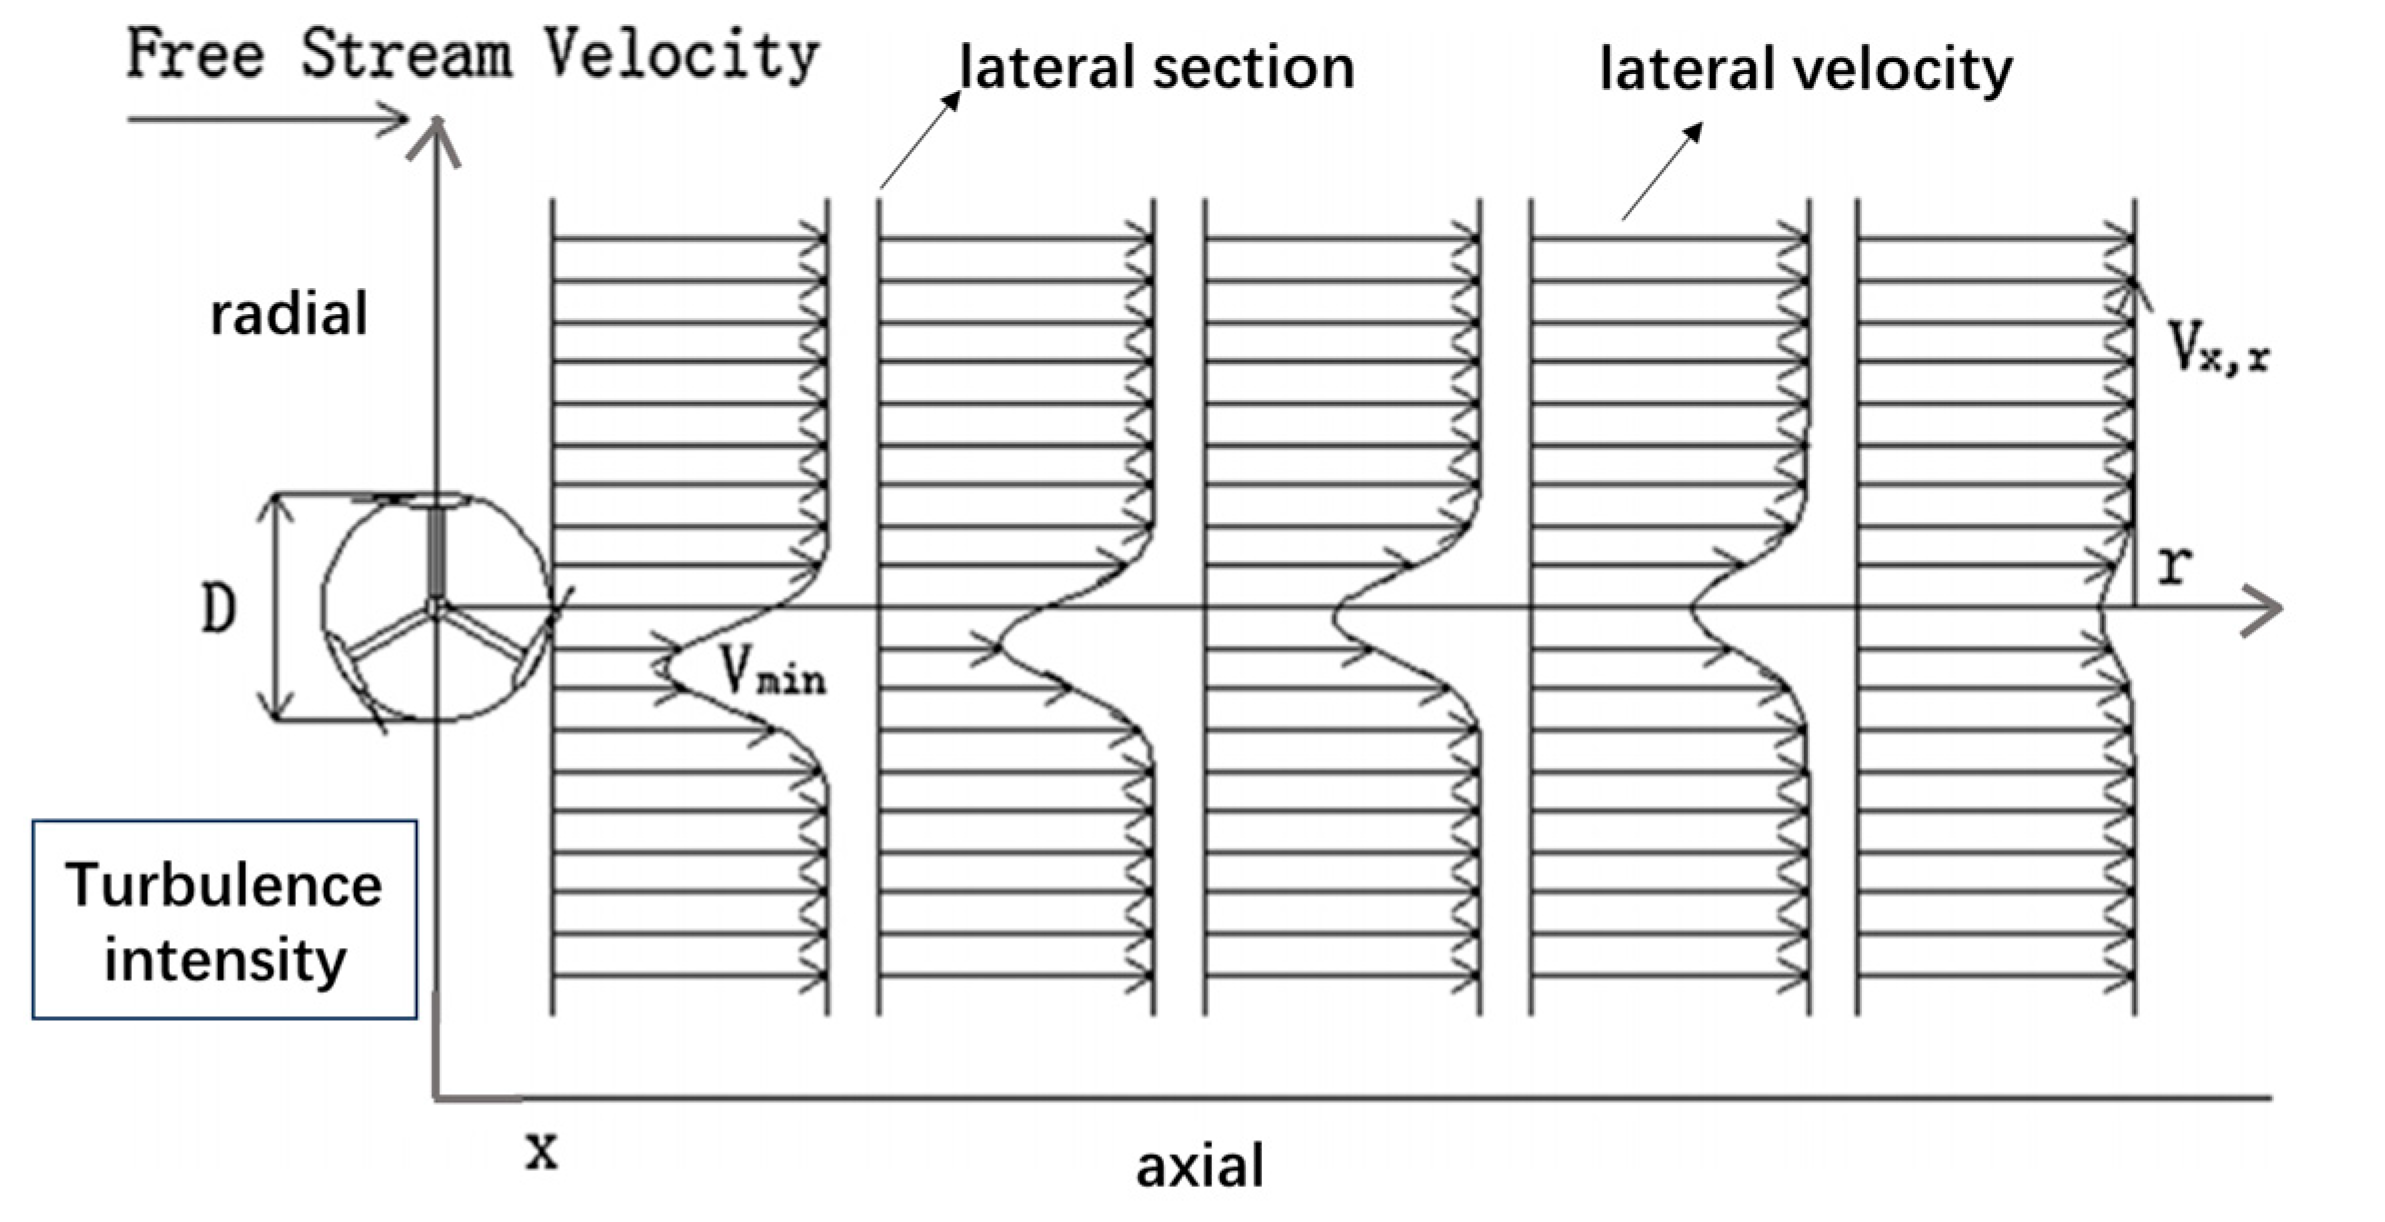
Figure 1 [
25], we abstract the problem by adjusting the inlet turbulence intensity while keeping the incoming flow velocity, turbine radius, and rotational speed constant, to explore the mathematical relationship between the lateral velocity
Vx,r behind the turbine and the axial distance
x and radial distance
r. This mathematical method can also be used to introduce other influencing factors into the formula, with the underlying logic having important theoretical significance. The VAWT wake velocity prediction model derived from this method can predict the lateral velocity at a certain distance behind the turbine under different turbulence intensity conditions. In the field of ocean engineering, this is crucial for evaluating the distance between upstream and downstream turbines in tidal current energy development arrays and optimizing array structure, improving water energy utilization efficiency, and providing a reference for ocean engineers to understand turbine wake velocity distribution.
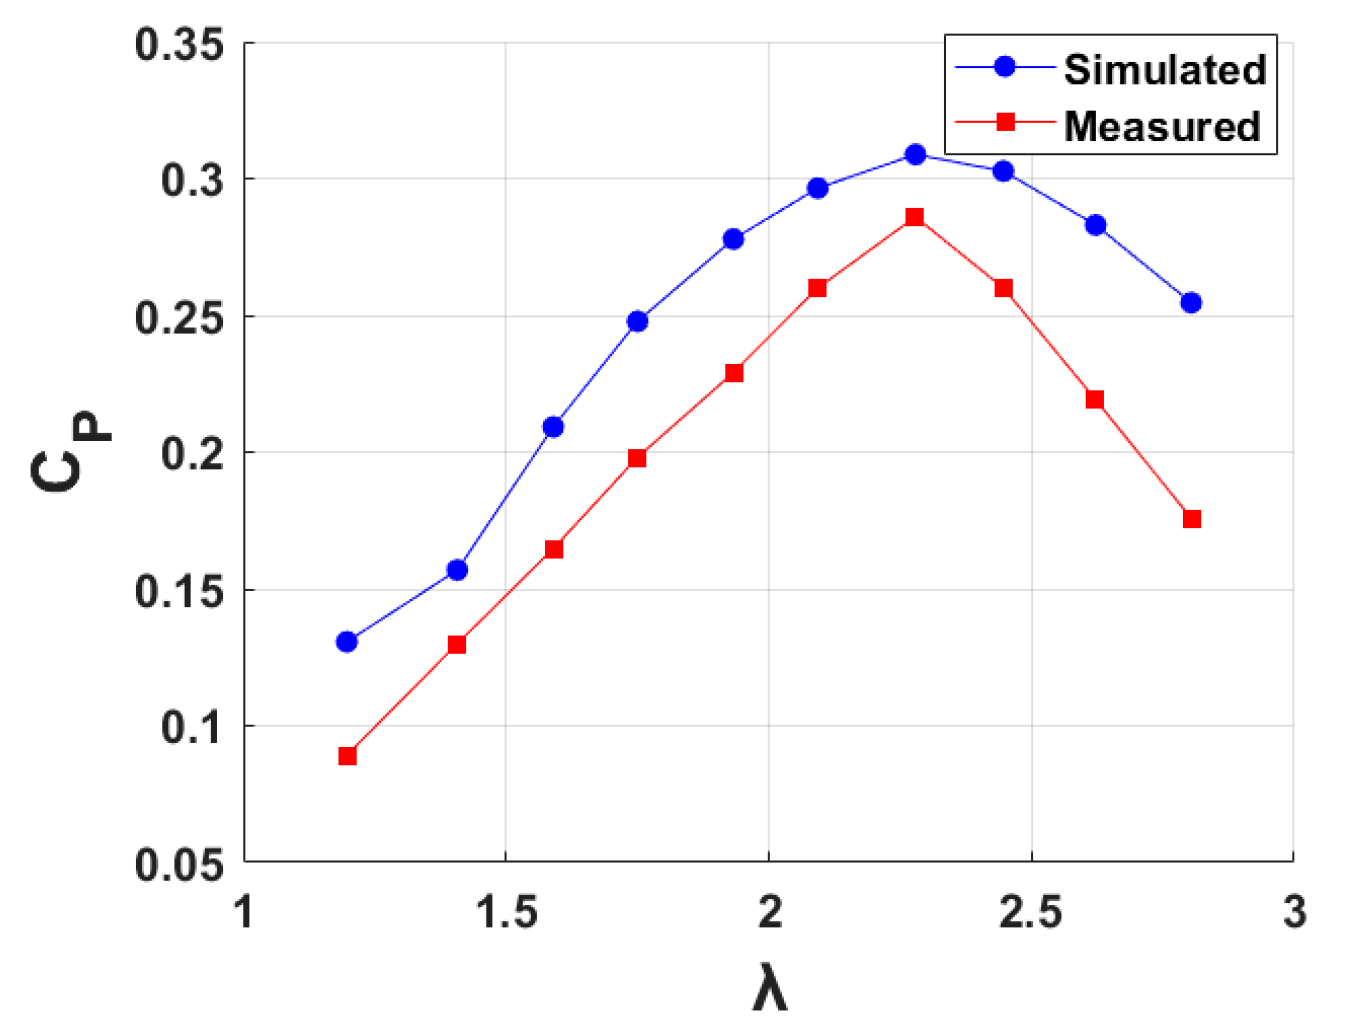
Due to the limited data available for experimental validation, the physical experiment prototype in this paper is based on the water tank experiments of VAWTs conducted by Zhao Guang et al. [
26], and the subsequent numerical models are also based on this. A two-dimensional numerical model was chosen to simulate the wake field of the VAWT because the wake field velocity in Lam’s equation is the vertically averaged velocity, and using a two-dimensional model directly eliminates the need for vertical averaging. Although studies [
27] have shown that three-dimensional models are better than two-dimensional models, the effect is limited. Moreover, other research [
28] has pointed out that when the turbine height exceeds seven times the turbine radius, the three-dimensional effects are not significant. Although the turbine height to radius ratio used in this study is only 5.5, research [
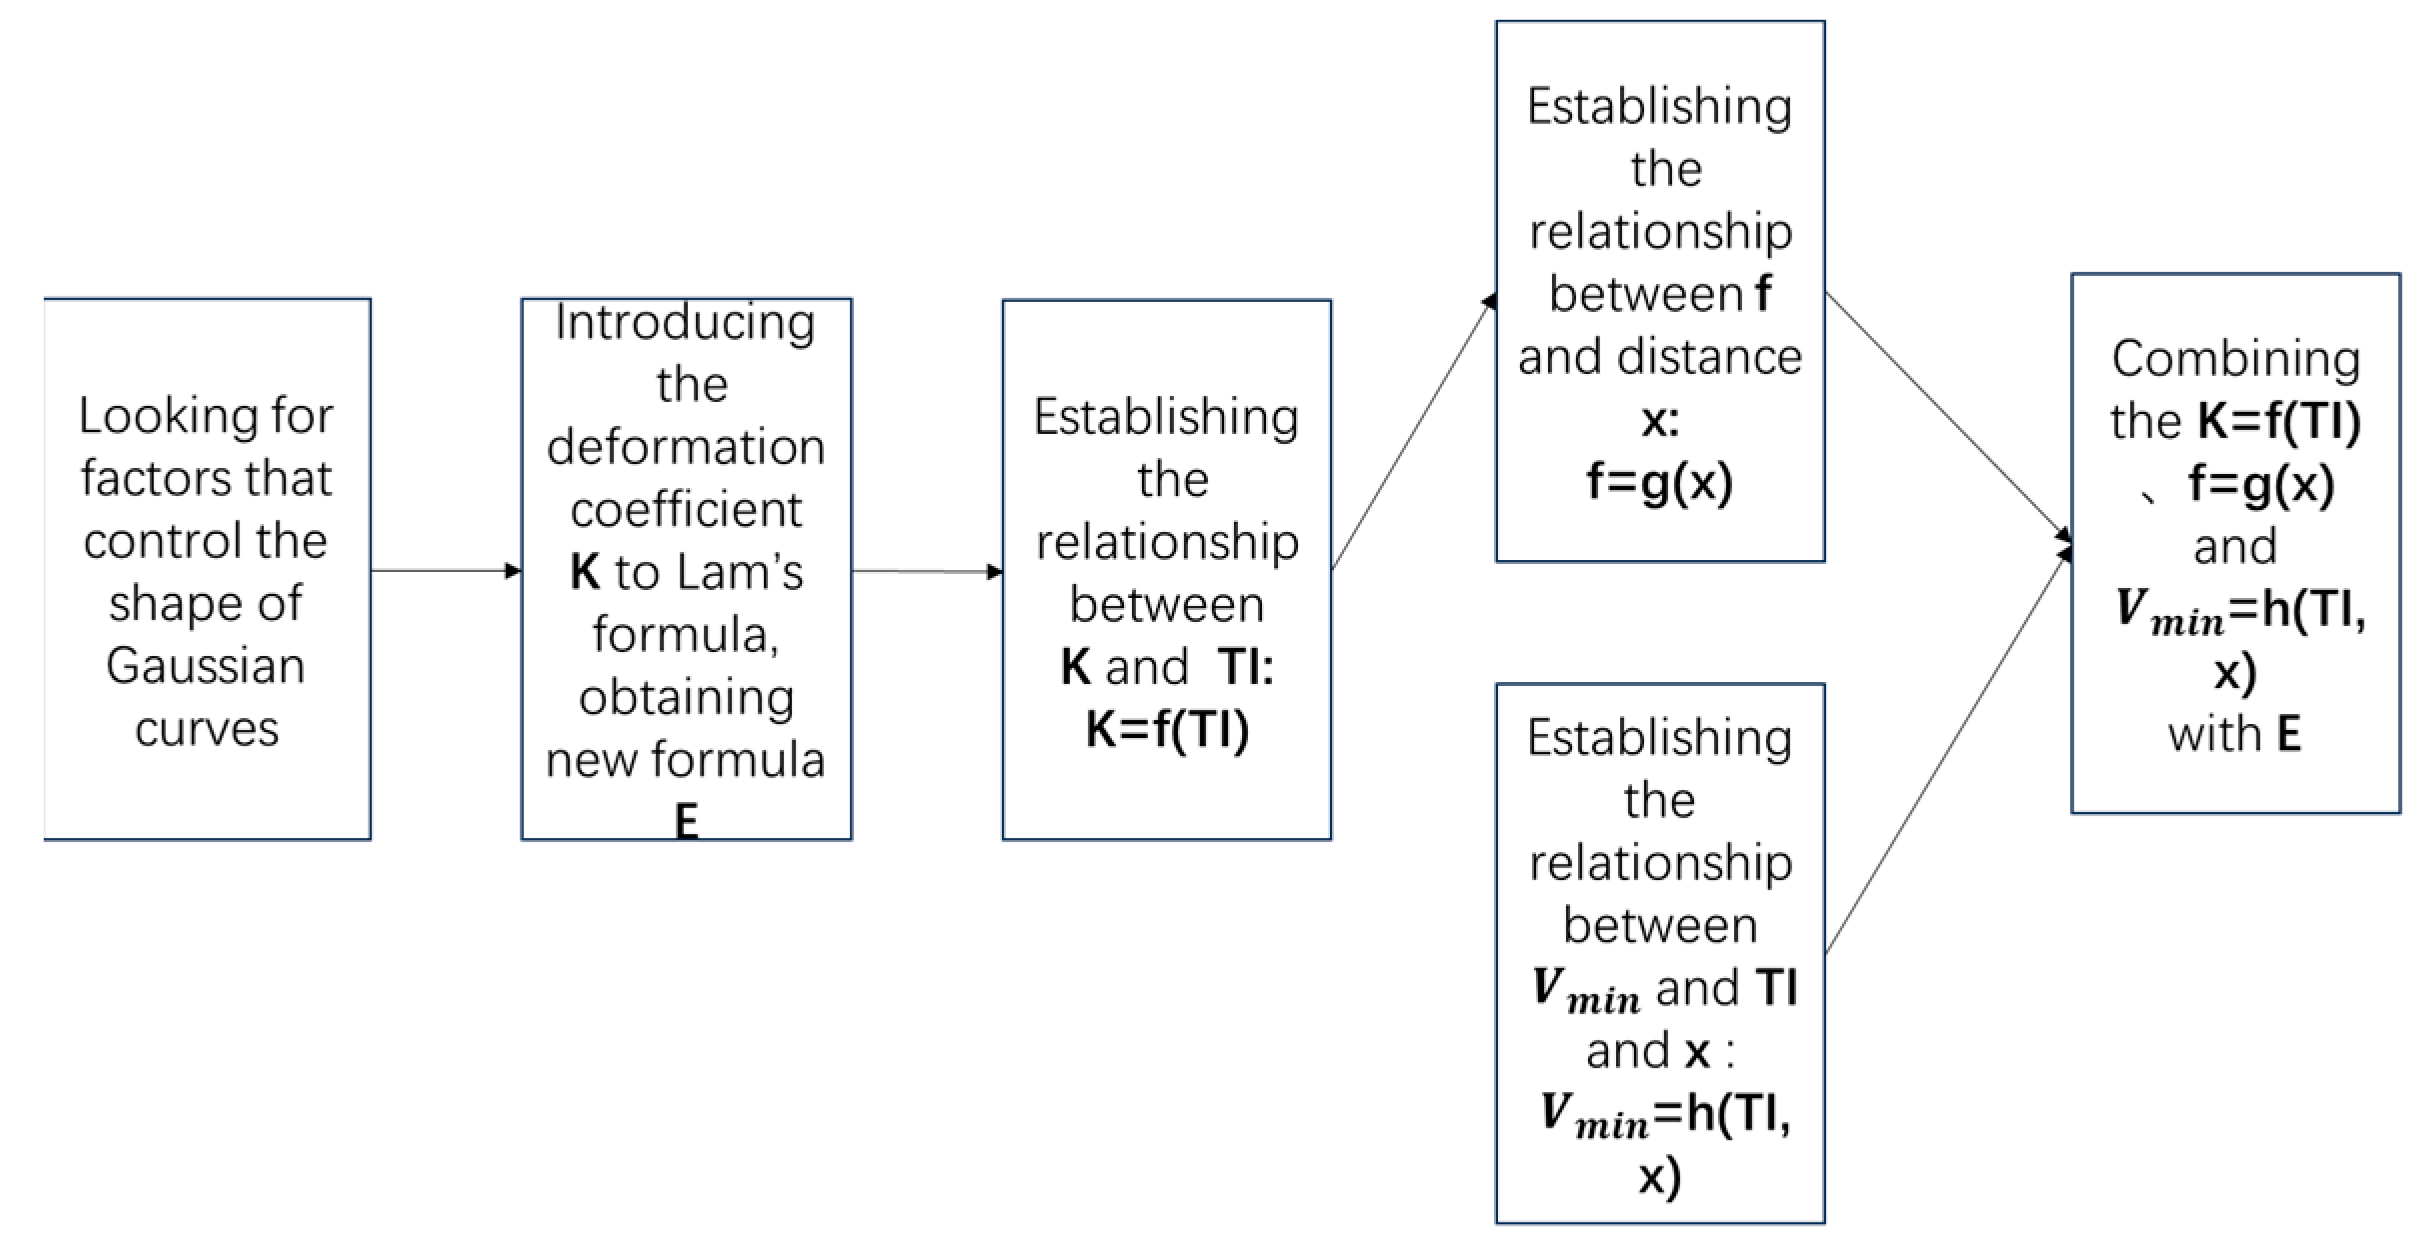
29] has shown that by adjusting the model and using conditions with minimal error, the experimental study can be satisfied, and the two-dimensional model saves computational costs compared to the three-dimensional model. The paper first establishes the numerical model and validates it with experimental data, then applies a new mathematical method to improve Lam’s equation to establish a theoretical model. Next, it systematically explores the wake velocity decay of VAWTs under different turbulence intensity conditions, and finally verifies the predictive effectiveness of the theoretical model. The research plan of this study is shown in
Figure 2.
3. Semi-Empirical Model Establishment
Lam [
25] approximated the relationship between the lateral velocity in the wake of a vertical axis water turbine and the radial distance
r using a Gaussian probability distribution curve, establishing the following formula [
25]:
where [
25] D
t is the diameter of the vertical-axis turbine;
BDt is the deviation of the valley value of velocity at each section on the flow direction;
CDt is the standard deviation of velocity at each section along the flow direction;
Vx,r is the lateral distribution velocity in m/s,
x is the axial distance in meters;
r is the radial distance in meters;
V∞ is the velocity of free stream in m/s; and
Vmin is the minimum velocity of the section in m/s at the lateral section.
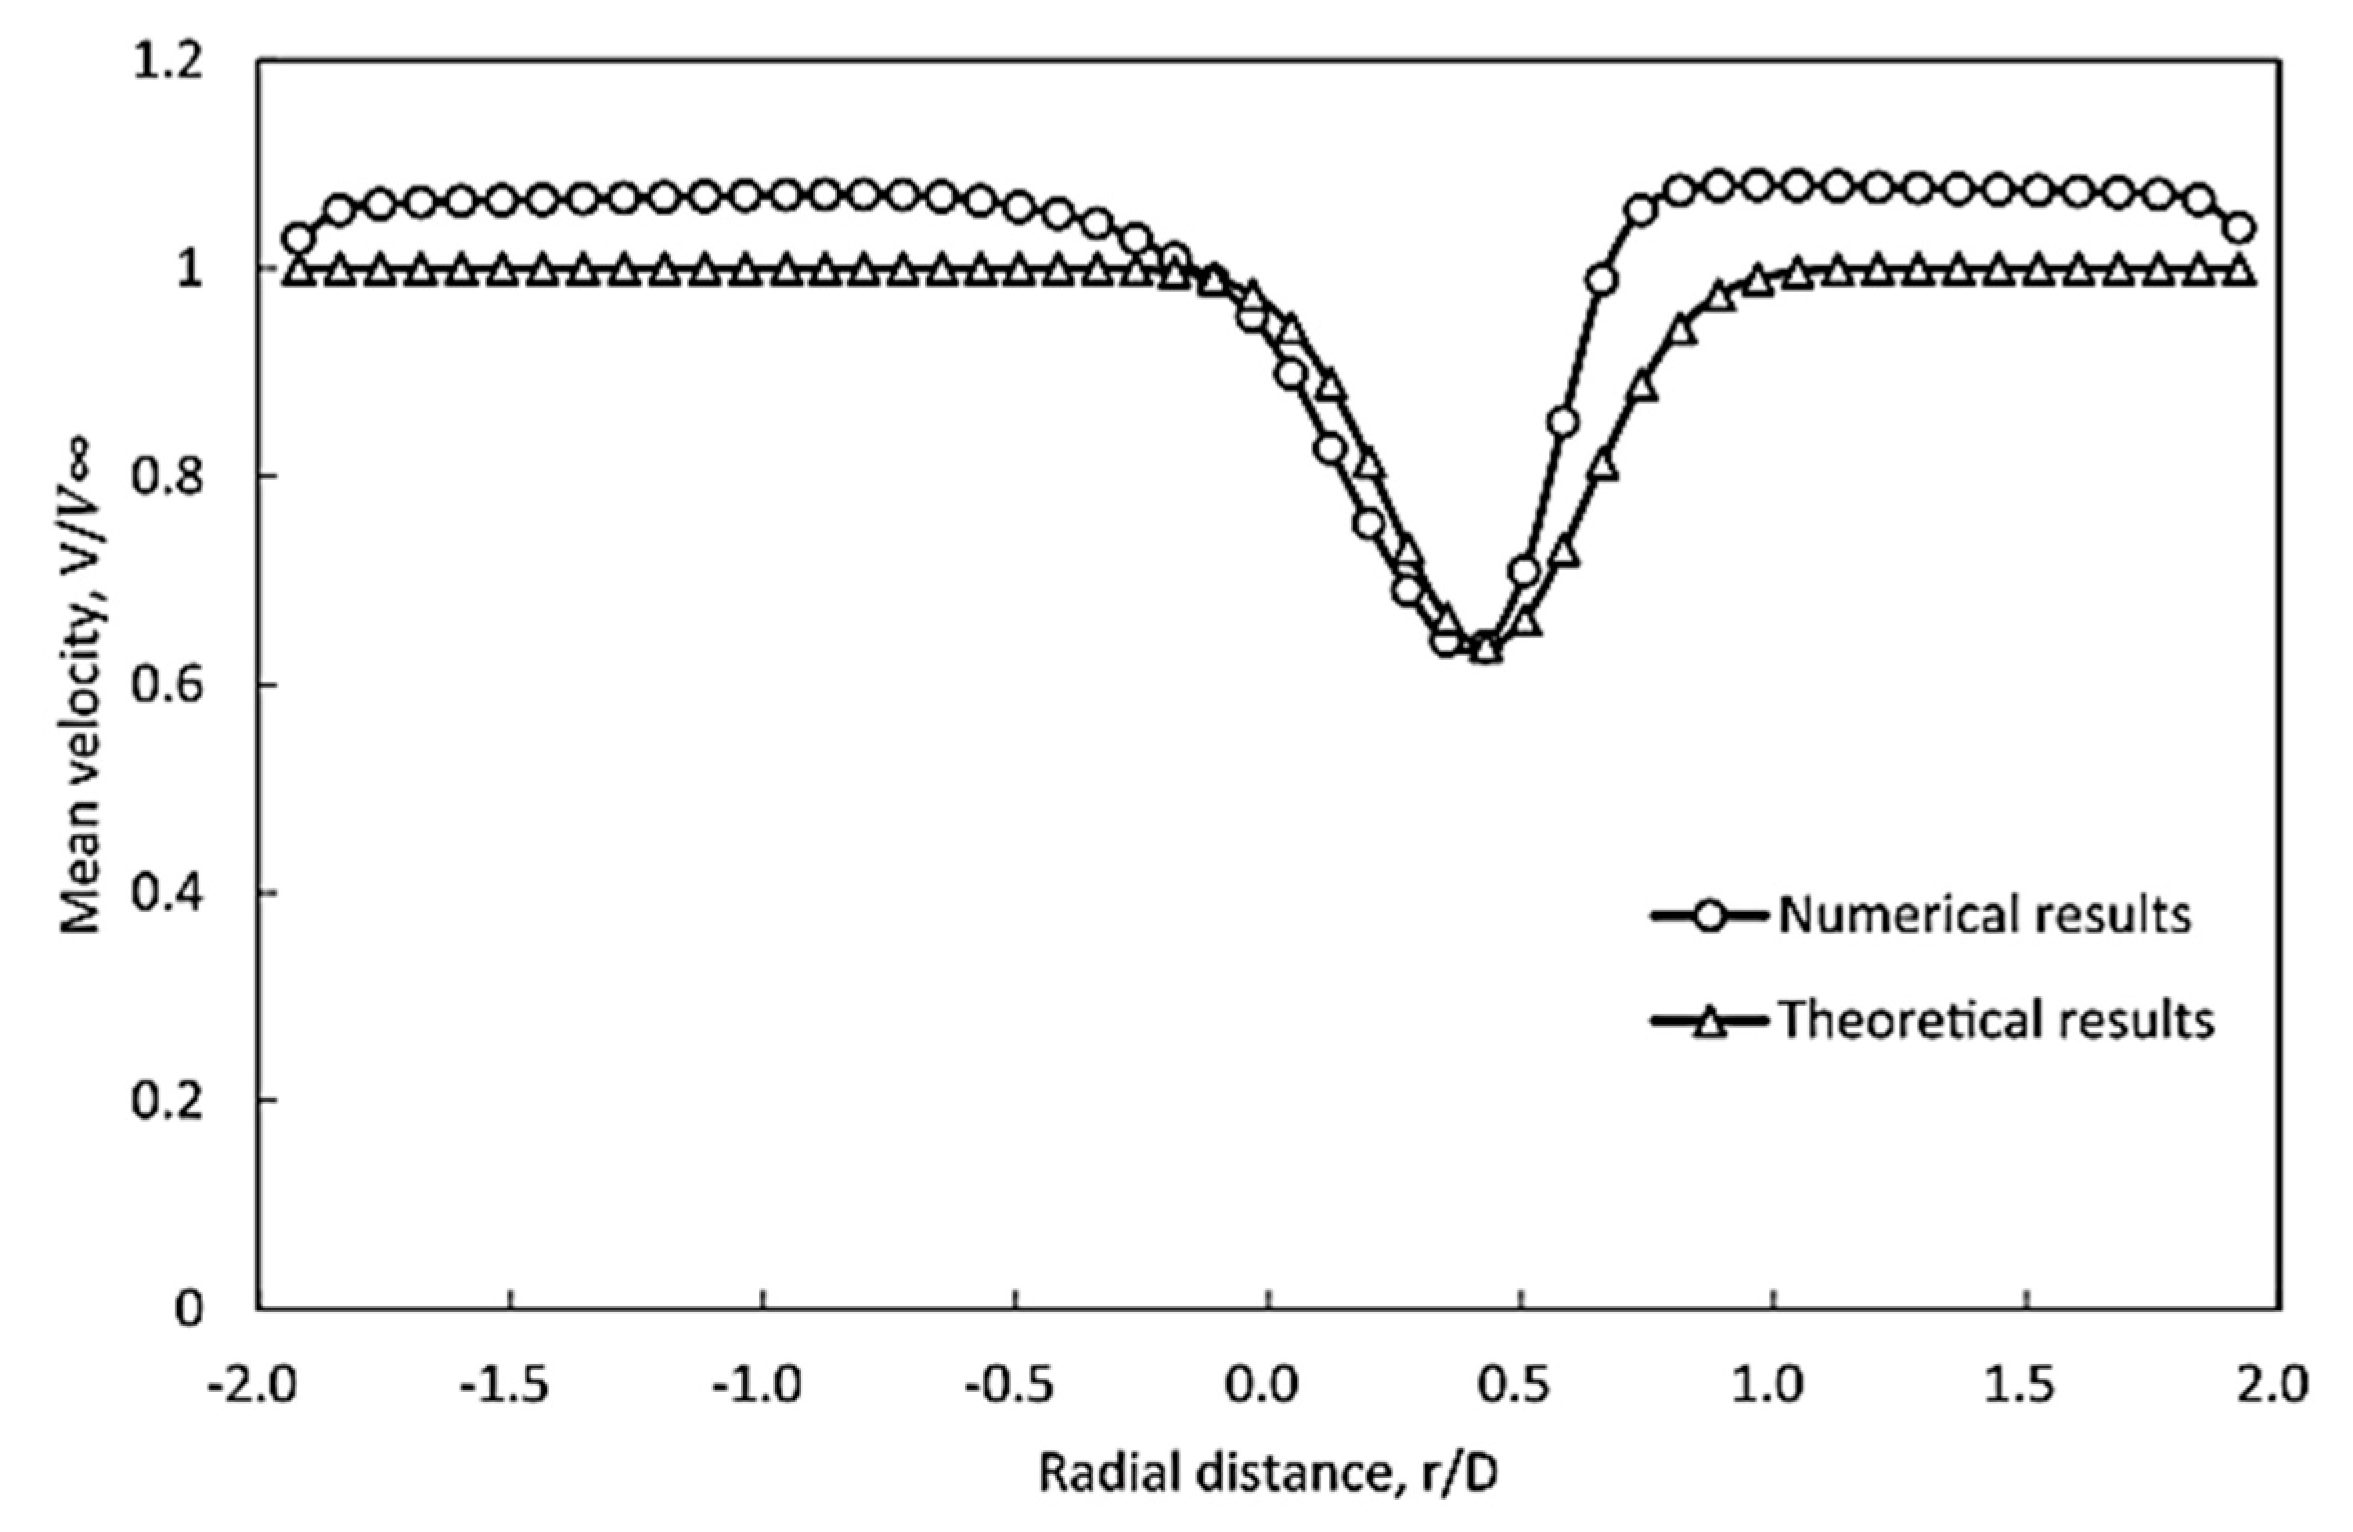
As shown in
Figure 8, a validation result from Lam [
25] indicates that the theoretical predictions for the high-speed regions on both sides are higher than the simulation results, with a significant deviation on the right side of the velocity trough. To better match the predicted results with the simulation, adjustments to the shape of the Gaussian curve, specifically the trough width, trough depth, and the difference between theoretical and simulated values in the high-speed regions on both sides, are needed using the CFTOOL tool in MATLAB. After trials, it was found that, adjustments to the exponential part, (
V∞ −
Vmin) and
V∞ in Formula (6) correspond to changes in trough width, trough depth, and the difference in high-speed regions.
Therefore, three nonconstant Gaussian curve deformation coefficients (
α,
β, and
γ) are introduced into Formula (6), transforming Formula (6) into the following formula:
To avoid the influence of dimensions, the formula is then made dimensionless, as shown below:
In above equations,
is the wake acceleration coefficient. As shown in
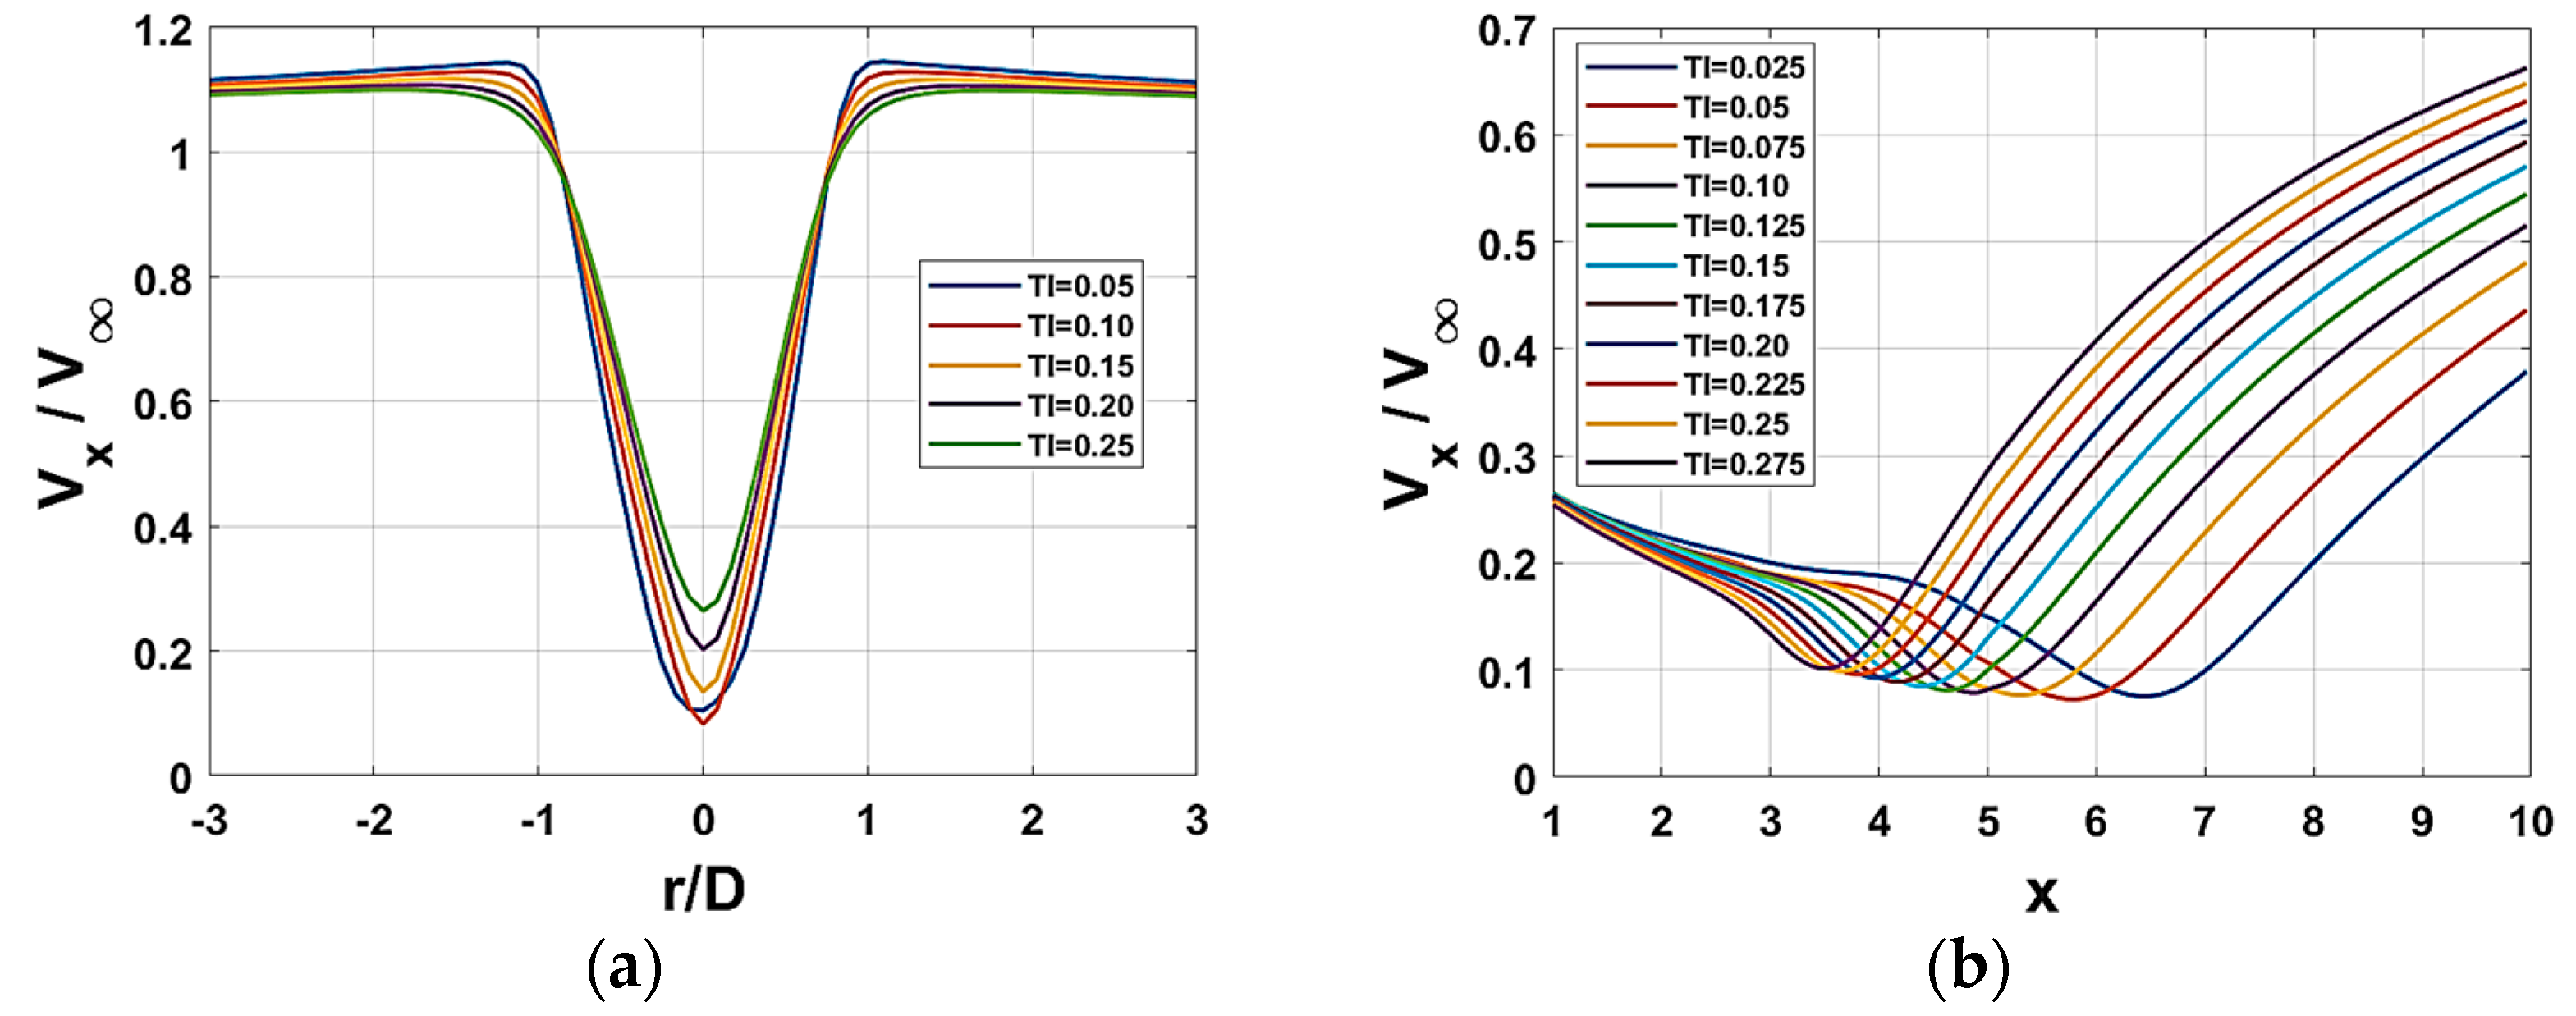
Figure 9a, within the radial distance of 1D to 3D on both sides of the trough, the wake velocity is more than 1 time of the initial velocity
V∞, indicating an acceleration phenomenon in the wake. Thus,
α is a factor regulating the lateral velocity acceleration zone of the wake.
β is the velocity trough recovery coefficient, representing the rate at which the lateral velocity trough recovers to its initial value—the larger the value, the slower the recovery.
γ is the velocity trough width coefficient, indicating the width between the critical points of the acceleration zones on both sides of the velocity trough—the larger the value, the narrower the width.
r is the dimensionless radial distance. For simplicity, the radial distance within 3D on both sides of the turbine center is selected as the study range; beyond 3D, the velocity acceleration phenomenon is consistent with that within 3D and is not considered.
Given that the theoretical model is specifically intended to provide a theoretical basis for the optimized design of vertical axis tidal arrays in practical scenarios [
33] and due to the limitations of experimental conditions, the model is only applicable for predicting lateral velocities at radial sections within a 4D to 10D range downstream of the turbine. Experimental results show that at 4D downstream, the offset of the velocity trough relative to the downstream centerline is minimal, and at 5D, the offset is zero, as seen in
Figure 9a. Therefore, in Equation (7), the offset coefficient
B of the flow section velocity trough is set to zero. Lam [
25] did not specify the calculation method for the flow section velocity deviation coefficient C; considering the similarity of the inflow velocity and turbine parameters in this study to Lam’s experiment, the value of C in Lam’s paper, 0.4, is used.
After introducing the coefficients, the values of
α,
β, and
γ for each lateral section at different turbulence intensities can be calculated using the wake lateral velocity data fitted by the CFTOOL tool. To incorporate turbulence intensity into the formula, the relationship between turbulence intensity
TI and coefficients
α,
β, and
γ needs to be explored. The CFTOOL tool isused to fit the relationship between them again. It found that a linear function can describe the relationship between
α,
β,
γ, and turbulence intensity
TI with a correlation of over 98%:
This provides a way to calculate the shape deformation coefficients of the velocity variation curve for each lateral section. However, new coefficients
a,
b,
c,
d,
e, and
f are introduced, with each turbulence intensity
TI corresponding to a new set of coefficients for each lateral section. Since these coefficients only reflect the specific functional relationship between
α,
β,
γ, and turbulence intensity
TI, there is still a functional relationship between
α,
β,
γ, and the axial distance
x downstream of the turbine. The specific relationship between them can be obtained by fitting the correlation between the new coefficients
a,
b,
c,
d,
e,
f, and the axial distance
x. After trials, the correlation coefficient was found to be the highest (97%) when the new coefficients are calculated using the following formula:
where,
x has been nondimensionalized as the ratio of the axial distance to the turbine diameter
D. In the following text,
x will also be nondimensionalized, 4 ≤
x ≤ 10.
With the above mathematical relationship, wake velocity prediction downstream of the turbine is still not possible without knowing the minimum velocity
Vmin at each lateral section downstream. Lam [
25] extracted the minimum velocity at the downstream lateral sections of vertical axis turbines from numerical results, which is not convenient for practical applications.
Figure 9b shows the minimum velocities
Vmin at different sections along the downstream centerline for different turbulence intensities. It can be seen that
Vmin is only related to the axial distance
x and turbulence intensity
TI. Therefore, we can establish a bivariate function relationship between
Vmin as the dependent variable and
x and
TI as independent variables. Using the analysis from the CFTOOL fitting tool, a bivariate function relationship with a correlation of 99.7% was established between the dimensionless minimum lateral velocity
Vmin/
V∞ and turbulence intensity
TI and axial distance
x in the wake, as shown in Equation (18):
where the coefficient matrix
P and variable matrix
TI and
X are as follows:
The coefficient values in matrix
P are dimensionless, as shown in
Table 3:
Figure 10 illustrates the mathematical modeling process. For simplicity, the above equations were packaged into program code, allowing the prediction of radial sectional lateral velocities within a range of 4D to 10D downstream of the turbine by inputting specific turbulence intensity
TI and axial distance
x. The same mathematical method can be applied to predict velocities between 1D and 4D downstream of the turbine.
4. Results and Discussion
Figure 9b shows the wake recovery along the centerline downstream of the turbine at distances of 1D to 10D under optimal tip speed ratio conditions and different turbulence intensities. It can be seen that the lateral velocity(
Vx) along the centerline first decreases and then increases, which is also evident from
Figure 11a. As turbulence intensity increases, the lateral wake velocity recovery at 10D becomes higher, with a maximum recovery reaching 0.68, but the rate of increase diminishes. Overall, the velocity at each position increases with turbulence intensity. A 1% increase in turbulence intensity results in approximately a 10% improvement in wake velocity recovery at 10D. However, this effect diminishes closer to the turbine, indicating that higher turbulence intensity has a more significant impact on the far-field. The lateral velocity recovery at 1D remains roughly around 0.26, and the velocity trough shifts forward with increasing turbulence intensity. From the minimum to maximum turbulence intensity conditions, the trough position shifts forward by 3D, indicating that higher turbulence intensity accelerates wake recovery. As shown in
Figure 9a, the velocity trough at a specific lateral section (5D) increases with turbulence intensity, further indicating that higher turbulence intensity facilitates wake recovery, consistent with the conclusions of Dhalwala et al. [
15]. However, beyond a 0.8D from the center on both sides, the velocity recovery in the high-speed regions decreases with increasing turbulence intensity, which requires further study. Overall, there is a positive correlation between the magnitude of the lateral velocity at various points and the turbulence intensity.
Next, the physical relationship between turbulence intensity and lateral wake velocity is discussed.
Figure 11 shows the behavior of lateral velocity, turbulence intensity, dynamic viscosity, and turbulence viscosity in the flow field under the same conditions. It can be seen that dynamic viscosity (or kinematic viscosity) remains constant throughout the field. In areas of high turbulence intensity, turbulence viscosity, and lateral wake velocity are also high. It further indicates that turbulence intensity have obvious influence on the energy dissipation. Higher turbulence intensity results in less energy dissipation, which is conducive to lateral wake velocity recovery. Conversely, in the vicinity of the turbine, where turbulence intensity is lower, energy dissipation is higher, and wake recovery is slower. The specific physical mechanisms by which turbulence intensity affects wake velocity recovery merit further investigation.
Figure 12,
Figure 13,
Figure 14,
Figure 15 and
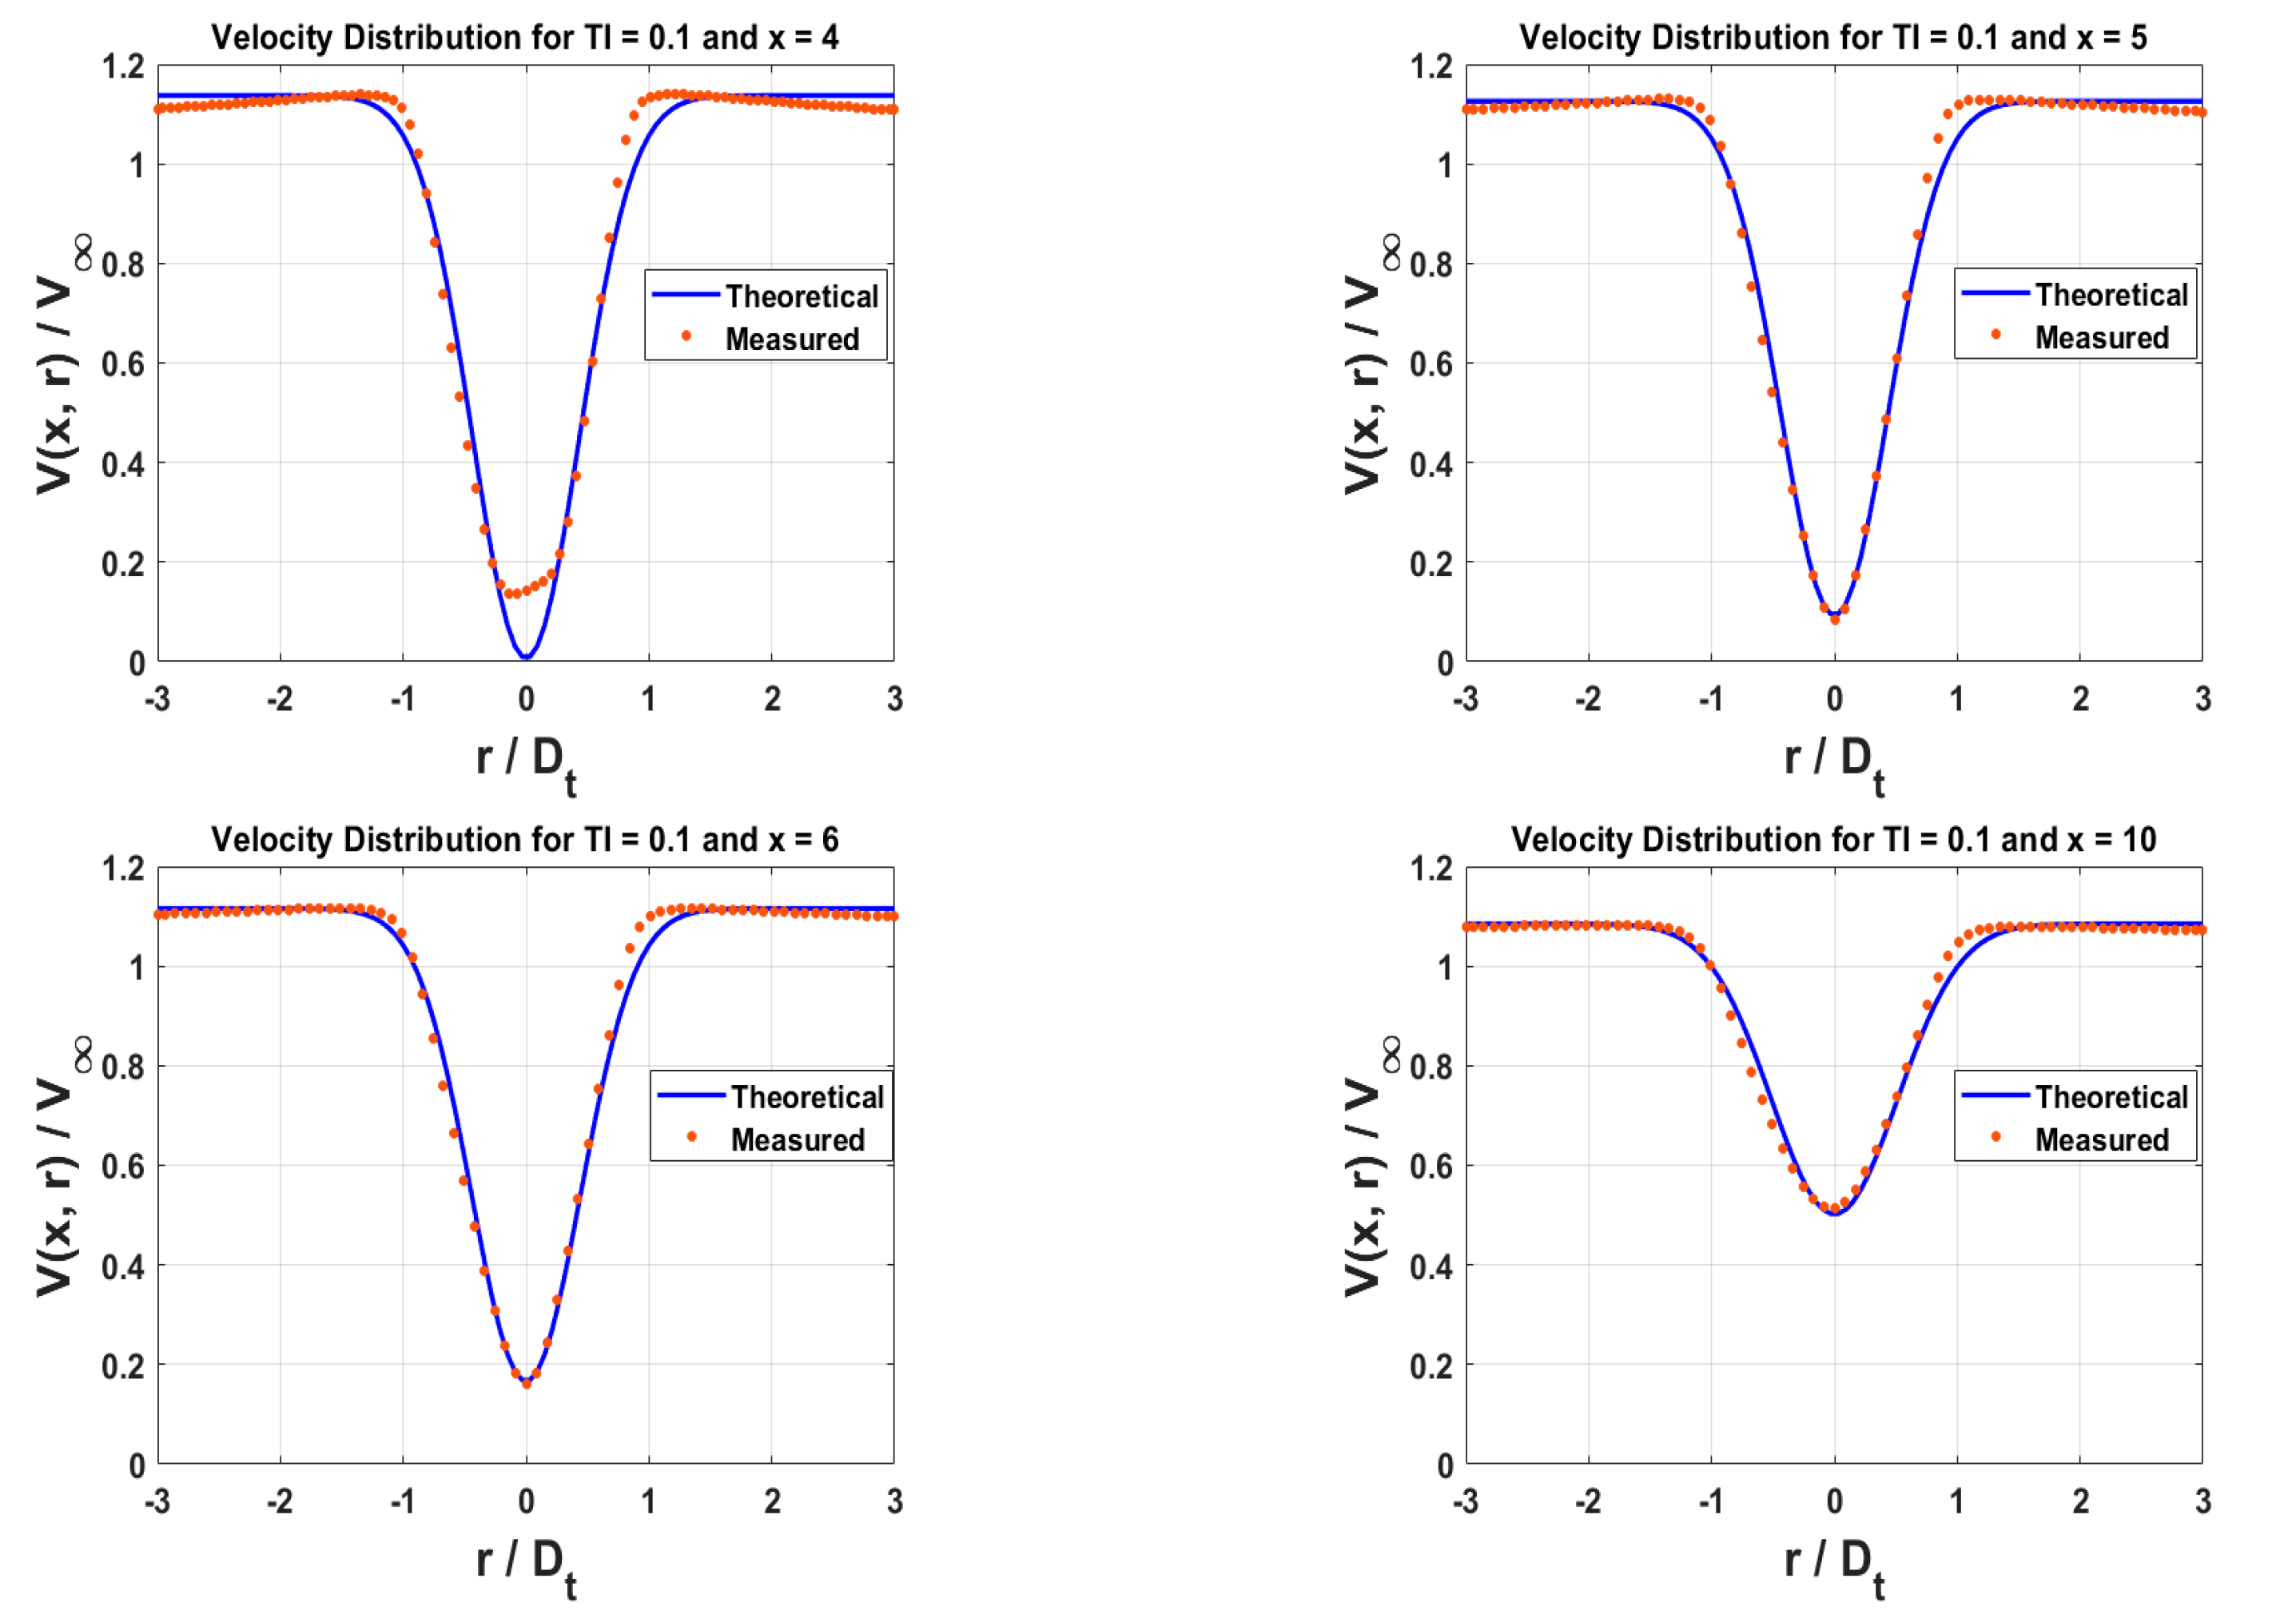
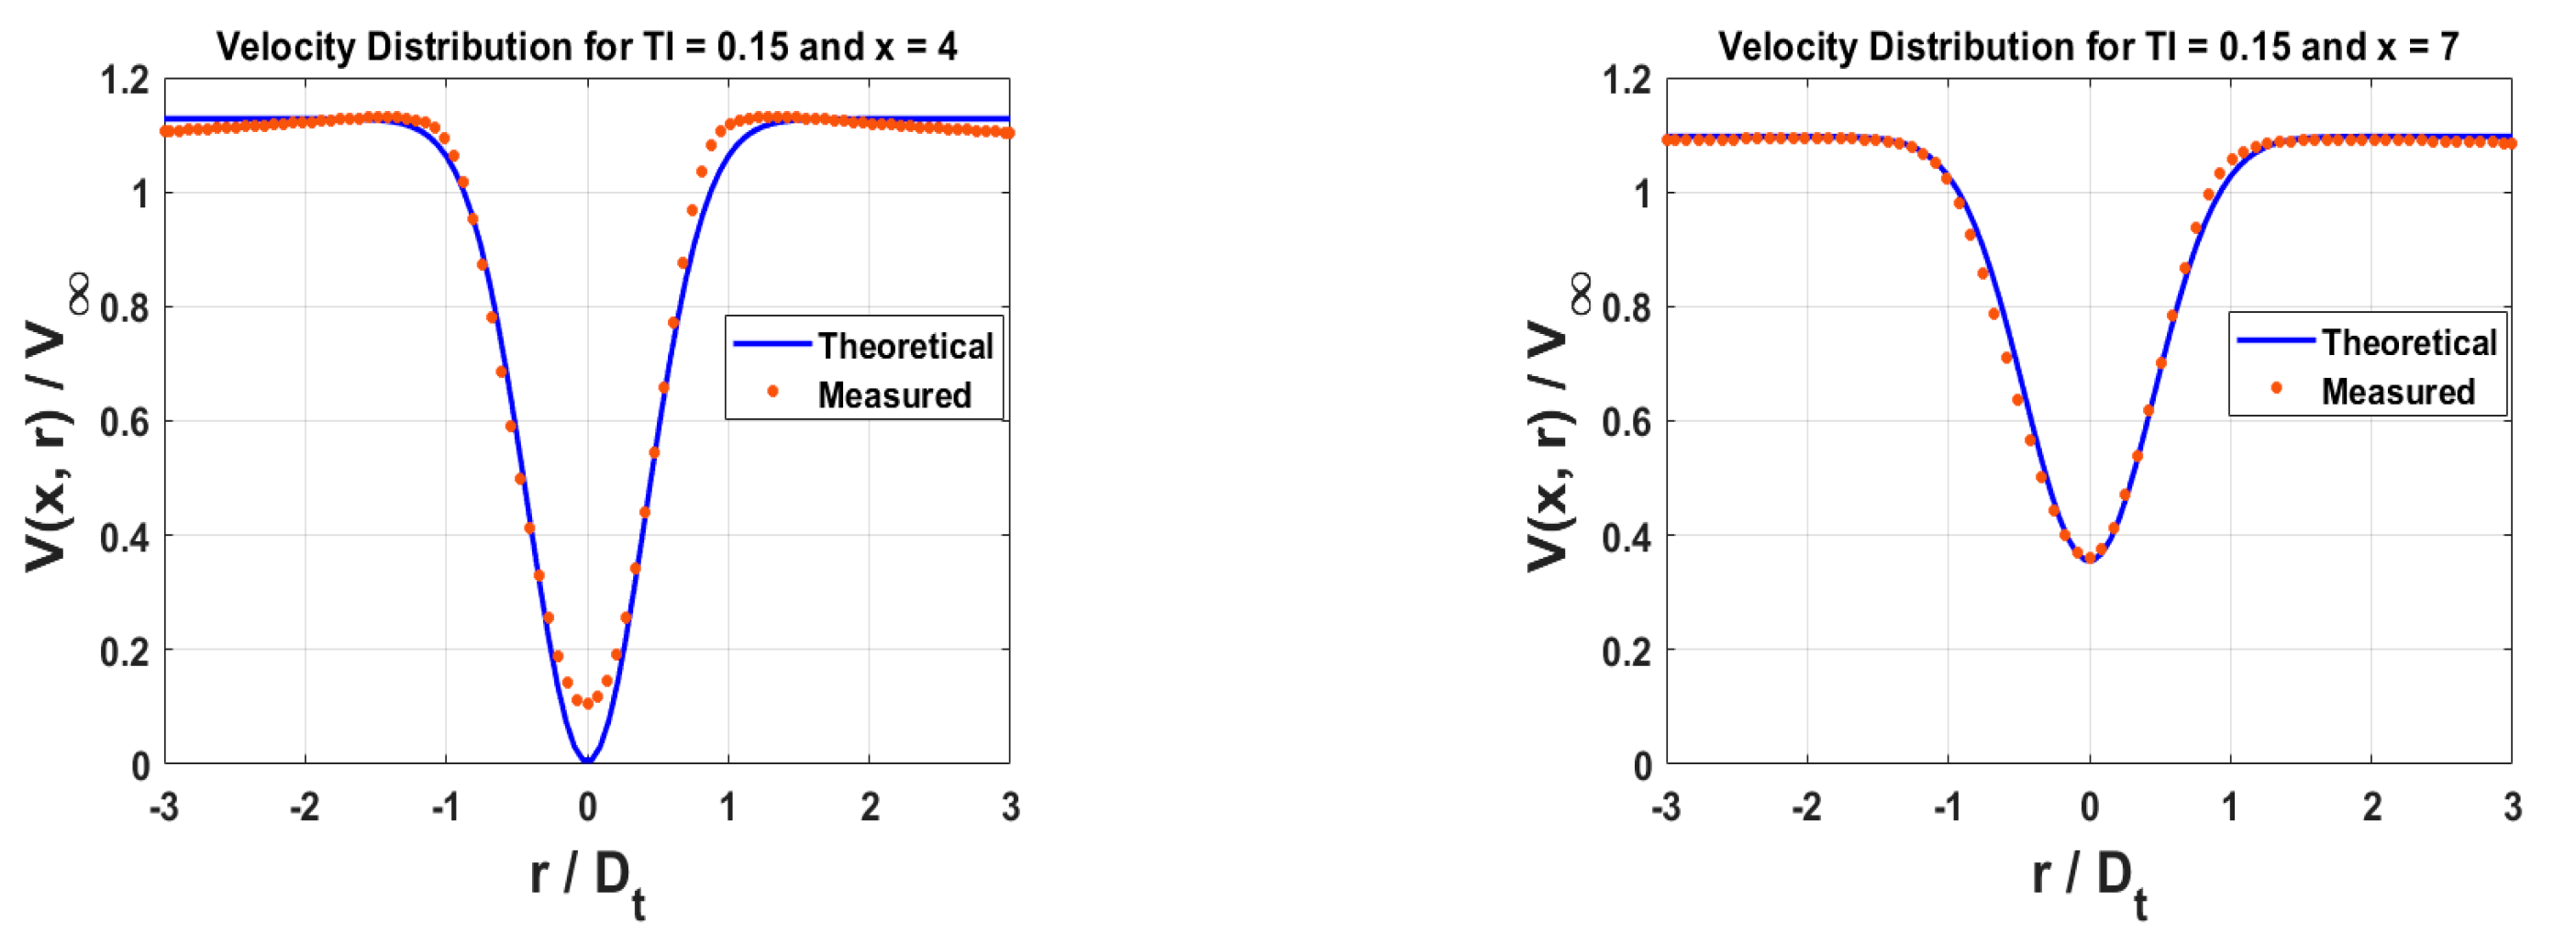
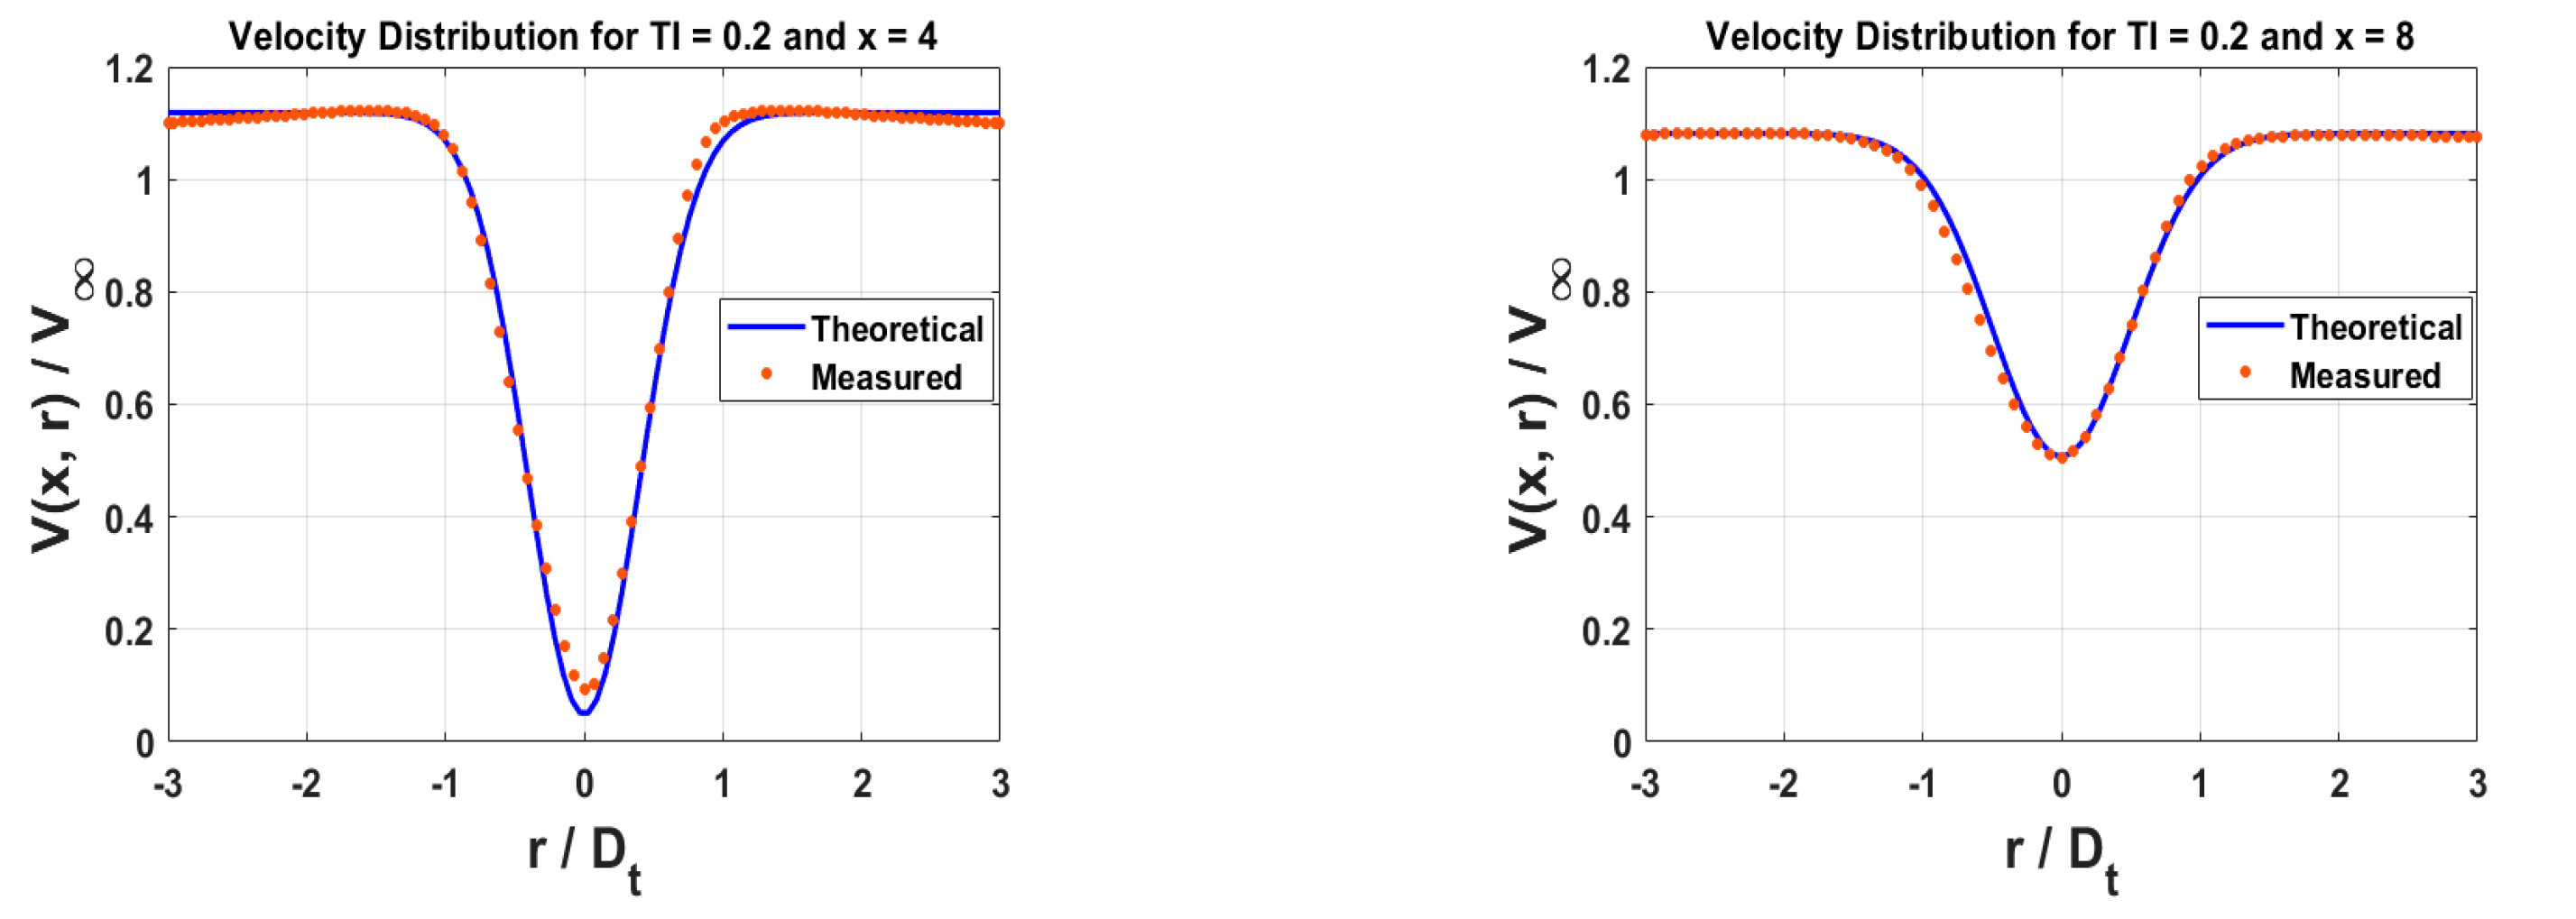
Figure 16 are selected comparison results from five turbulence intensity conditions which show the decay characteristics of the wake field of a vertical axis water turbine under different TI and the velocity distribution between axial distances of 4D to 10D at turbulence intensities of 0.05, 0.1, 0.15, 0.2, and 0.25. The horizontal axis represents the radial distance
r/Dt, and the vertical axis represents the velocity
V(x,r)/V∞. The blue solid line represents the theoretical value calculated using Equations (8) and (18), and the red dots represent the measured values from CFD. To better understand the differences between theoretical and measured values, the root mean square error (
RMSE) and relative error (
R) are calculated using the following formulas:
In
Figure 12, at
TI = 0.05, as the axial distance increases from 4D to 9D, the lateral velocity distribution shows a gradual recovery of the wake center velocity (
Vmin), reaching 38% of the free-stream velocity. The match between theoretical and measured values is relatively high, but there is a slight deviation in the wake center area, especially at 4D and 5D (with the relative error at the minimum point reaching about 58%, although the mean square error between the measured and theoretical values is 0.008, which is nearly zero). At low turbulence intensity, the wake recovery is slower, and the decrease in the wake center velocity is more noticeable.
In
Figure 13, when
TI = 0.1, the wake center velocity recovers more quickly, and the agreement between theoretical and measured values is better (with a mean square error close to zero and a relative error at the minimum point of zero). The velocity distribution from axial distance 4D to 10D indicates that the increase in turbulence intensity promotes wake diffusion and energy recovery. At medium turbulence intensity, the agreement between theoretical values and actual measurements is quite high.
In
Figure 14, at
TI = 0.15, the wake recovery speed further increases, and the wake center velocity at 4D (with a mean square error of 0.002 and a relative error at the minimum point of 98%) has already begun to recover significantly. The agreement between theoretical and measured values remains good, indicating that turbulence intensity continues to promote energy diffusion in the wake. At high turbulence intensity, the velocity distribution in the wake region becomes more uniform, and the theoretical model can better predict actual wake characteristics.
In
Figure 15 (
TI = 0.2) and
Figure 16 (
TI = 0.25), the wake recovery speed is the fastest, and within the axial distance of 4D to 8D, the velocity distribution shows the wake center velocity rapidly recovering to near the free-stream velocity. The agreement between theoretical and measured values at various axial distances is excellent. At the highest turbulence intensity, energy recovery in the wake region is the quickest, and there is almost no significant deviation between theoretical predictions and actual measurements (with both variance and relative error at the minimum point close to zero).
Overall, under all turbulence intensities, the agreement between theoretical and measured values is relatively high, validating the effectiveness of the analytical wake formula proposed in this study. Regardless of changes in turbulence intensity, the wake center velocity shows a trend of gradual recovery. In terms of recovery speed, the higher the turbulence intensity, the faster the wake center velocity recovers. At low turbulence intensity, the wake recovery is slower, while at high turbulence intensity, energy diffusion in the wake is faster, leading to quicker velocity recovery. In terms of correspondence, at low turbulence intensity, there is some deviation between theoretical and measured values in the wake center area, while at high turbulence intensity, the matching effect improves significantly. Additionally, the matching effect gradually changes with the increase in axial distance, with the main mismatch occurring at the wake center at 4D and 5D. This error may originate from the prediction deviation of Vmin at 4D and 5D. By adjusting the prediction accuracy of the Formula (18) at the 4D boundary, the wake velocity at 4D can be better predicted.
Based on the analysis of wake decay characteristics under different TI, it can be seen that the analytical wake formula proposed in this study have capability to well predict wake characteristics under various turbulence intensities. The agreements between theoretical predictions and actual measurements at high turbulence intensity. These findings are of great significance for further optimizing the design and layout of vertical-axis water turbines, helping to improve the energy capture efficiency and operational stability of tidal current energy devices.
Further research directions are suggested based on the study results:
(1) Three-Dimensional Model Exploration
This study used a two-dimensional model, which averaged the vertical variations in the turbine wake. If possible, future research could focus on the wake formula of a three-dimensional model to establish a relationship between wake velocity and radial, axial, and vertical distances.
(2) Exploring Other Influential Factors
In addition to turbulence intensity, other factors (e.g., inlet flow velocity, direction, and turbine rotational speed) may have a more significant impact on the wake shape. Future studies could explore these factors and incorporate them into the wake theoretical model. Additionally, since the current mathematical method only allows for the inclusion of a single factor, exploring ways to simultaneously introduce multiple influencing factors into the model would further improve the vertical axis wake theoretical model.
(3) Extending the Wake Velocity Coverage
Due to the limitations of physical experimental conditions, the formula only covers wake velocities within a certain distance range, with limited wake data. If possible, the computational domain could be expanded, and deep learning methods could be applied to train the wake model using a large amount of data, aiming to establish a more extensive and accurate model, which will be considered in future work.
(4) Investigating the Physical Mechanisms of Turbulence Intensity
This study only explored the improvement of the wake formula in terms of quantitative relationships, without delving into how turbulence intensity affects wake velocity from a physical mechanism perspective. Establishing a wake formula based on physical relationships will be a significant challenge for future research.
5. Conclusions
This study simulated the wake field of a two-dimensional vertical-axis water turbine and validated the model using existing experimental data. A fitting mathematical method was used to improve the Lam formula by introducing turbulence intensity, thereby enhancing the accuracy of the formula’s predictions. The conclusions are as follows:
(1) Accuracy of the Numerical Model
The accuracy of the numerical model in predicting turbulence intensity and wake recovery is crucial for evaluating its effectiveness. Under appropriate conditions of structured grids, boundary conditions, and turbulence models, although there are some differences between the simulation and experimental values, the overall trends are consistent, and considering the limitations of the 2D model, the relative error under conditions from minimum to optimal tip speed ratio (about 20%) is similar to previous studies. Thus, the model can reflect the wake flow field to a certain extent.
(2) Significant Impact of Turbulence Intensity on Wake Characteristics
This study shows that turbulence intensity significantly affects the distribution and characteristics of the wake of vertical axis water turbines. As turbulence intensity increases, the rate of wake diffusion accelerates, the velocity gradient within the wake region decreases, and the impact of turbulence intensity on wake recovery becomes more pronounced with increasing distance from the turbine. Specifically, in the axial direction, a 1% increase in turbulence intensity can result in more than a 10% recovery in velocity at the farthest point. This indicates that higher turbulence intensity allows energy in the wake to recover more quickly.
(3) Applicability and Accuracy of the Mathematical Formula
Through the analysis of Fluent simulation data, a wake mathematical formula incorporating the effects of turbulence intensity was established based on Lam’s formula. In addition, compared to Lam’s formula, a bivariate function is introduced to predict Vmin. This formula can accurately predict the wake lateral velocity distribution under different turbulence intensities within a certain range, aligning well with simulation results, thereby validating the formula’s effectiveness and practicality.
The wake formula proposed in this study can provide velocity data for the wake field of vertical axis water turbines for hydraulic engineers, especially in scenarios where experimental conditions are lacking. A more important application is the potential use of this formula in combination with genetic algorithms for selecting development locations when deploying tidal current energy devices offshore. It can also be used to evaluate the spacing between devices in a tidal current energy array and to design the internal structure of the array to optimize tidal current energy capture. The mathematical method proposed in this study can serve as a reference for future improvements to turbine wake formulas. Using this method, more factors affecting turbine wake velocity can be introduced into the original formula.
