Article

The Time-Varying Characteristics of Relative Permeability in Oil Reservoirs with Gas Injection

1
Shanghai Branch of CNOOC Ltd., Shanghai 200335, China
2
State Key Laboratory of Petroleum Resources and Prospecting, China University of Petroleum (Beijing), Beijing 102249, China
*
Author to whom correspondence should be addressed.
Energies 2024, 17(17), 4512; https://doi.org/10.3390/en17174512
Submission received: 25 June 2024 / Revised: 22 July 2024 / Accepted: 31 July 2024 / Published: 9 September 2024

Abstract

:
Relative permeability is a critical parameter in reservoir numerical simulation and production prediction, intimately associated with reservoir architecture and fluid property. During gas injection development, substantial alterations in reservoir properties and fluid phase behavior induce dynamic changes in relative permeability. Clearly characterizing the time-varying features of relative permeability is very useful for an understanding of how gas injection influences fluid mobility within the reservoir and enhances recovery rates. In this paper, core displacement experiments are firstly conducted to obtain the characteristics of the relative permeability of oil and gas under various development stages and displacement conditions, further delineating the comprehensive shifts in reservoir properties at different gas injection stages. Subsequently, a novel reservoir numerical simulation method is proposed that considers the spatial and temporal segmentation of relative permeability curves in the reservoir simulation. Finally, a practical application is presented to clarify the effects of injection and production parameters on the development performance of gas flooding oil reservoirs. The results show the following: (i) Significant time-varying characteristics of relative permeability occur throughout gas injection development, in the early stages of gas injection, where most of the reservoir is at the gas injection front, and a rightward shift in relative oil and gas permeability indicates that gas injection promotes oil mobility. Conversely, in the later stages of gas injection, as the reservoir reaches the trailing edge of gas injection, the change trend in relative oil and gas permeability reverses, shifting leftward, thereby exacerbating the gas breakout phenomena. (ii) Increasing the rate of gas injection causes relative oil and gas permeability to move leftward, effectively enhancing the gas volume sweep coefficient and microscopic oil displacement efficiency at lower injection speeds while reducing development performance at higher injection speeds. (iii) An increase in gas injection pressure causes relative oil and gas permeability to shift rightward, and although it reduces residual oil saturation and enhances microscopic oil displacement efficiency, it also intensifies gas breakout phenomena and lowers the gas volume sweep coefficient. This paper provides theoretical guidance and technical support for the design of gas injection strategies, optimization of injection and production parameters, and production forecasting.

1. Introduction

Currently, China’s oil consumption continues to rise, and the scale of oil and gas production is also expanding. In the fields of secondary and tertiary oil recovery processes, gas injection has been widely applied due to its effective oil recovery properties. Although gas injection originated abroad, particularly in the United States and Canada, it has rapidly developed domestically [1,2]. At present, gas injection for oil recovery is extensively used in China, especially in oilfields such as Daqing, Changqing, Xinjiang, Shengli, Jiangsu, and Jidong, where CO2 injection has significantly improved recovery rates [3,4,5,6]; gravity drainage using top gas injection in the Tarim and Liaohe oilfields, as well as air foam injection experiments in the Tuha, Changqing, Daqing, and Dagang oilfields, have also demonstrated successful development [7,8].
Long-term gas injection for oil recovery leads to significant changes in reservoir properties and increases reservoir heterogeneity, resulting in uneven gas distribution and unfavorable mobility ratios. These issues can severely impact sweep efficiency, complicate oil displacement, and lead to inefficient oil recovery. Additional challenges include alterations in permeability and porosity due to physical changes in the reservoir, and intensified gas channeling, which can reduce the overall effectiveness of the recovery process [9,10,11,12]. In the later stages of gas injection, flow paths are formed, causing a significant decline in gas injection efficiency and ineffective gas injection conditions [13,14]. Therefore, studying the time-varying characteristics of reservoir property parameters during the gas injection process is crucial for accurately predicting the distribution of residual oil in different gas injection stages [15,16,17]. From a macroscopic perspective, changes in reservoir porosity and permeability are significant in reservoirs with better physical properties [18]. From a microscopic view, changes also occur in the rock framework grains, mineral distribution, and pore throat structures, which change the fluid seepage capacity in the reservoir [16,19,20]; additionally, changes in the wettability of the pore wall surfaces, such as the extraction of light components from crude oil during gas injection, cause asphaltene precipitation, enhancing the oil-wettability of pore–wall surfaces and gas injection for oil recovery [21,22].
Although many studies have confirmed changes in reservoir properties during gas injection [23], changes in reservoir properties and fluid properties that impact the effectiveness of gas injection have not been considered in the design of gas injection schemes [24,25,26]. Particularly in the later stages of gas injection, these changes significantly modify the characteristics of residual oil distribution in the reservoir, thereby affecting the ultimate recovery rate of crude oil [27,28]. Therefore, it is essential to study the patterns of changes in reservoir properties and fluid property during the process of gas injection and to explore their impact on the effectiveness of gas injection in reservoirs.
Accordingly, this paper first introduces the concept of time-varying relative permeability to comprehensively characterize changes in reservoir properties and fluid property during gas injection that affect the fluid seepage capacity in the reservoir. Then, it examines the time-varying characteristics of relative permeability during the gas injection process through experimental research. Finally, it proposes a new method for numerical simulation of gas injection based on time-varying characteristics of relative permeability and discusses the development of technical strategies influenced by these time-varying characteristics, providing theoretical guidance and technical support for efficient gas injection in reservoirs.

2. Gas Drive/Oil Recovery Experiment

2.1. Materials

In this paper, a marine clastic reservoir in Tarim, Xinjiang, China is selected for research, which is located in the fault anticline structural belt in the middle section of the Tabei uplift, which is a stratigraphic unconformity structural belt in the northwest direction and a northwest slope belt and depression in the southeast direction. The structure has the characteristics of large dip angle and large amplitude. The reservoir was developed by water injection at the edge and bottom after trial production in 1990, and the major development test of gravity miscible flooding assisted by natural gas injection was carried out in 2014, with a cumulative gas injection of 9.26 × 10⁸ m3 by 2023. With the continuous advancement of gas injection development, the relative permeability of oil and gas in the reservoir has changed, the gas/oil ratio has gradually increased, the displacement efficiency has gradually decreased, and some wells now have obvious gas-channeling characteristics. In this paper, typical gas injection wells are selected for coring, and experiments are carried out to explore the time-varying characteristics of phase infiltration and its influence on the development effect.

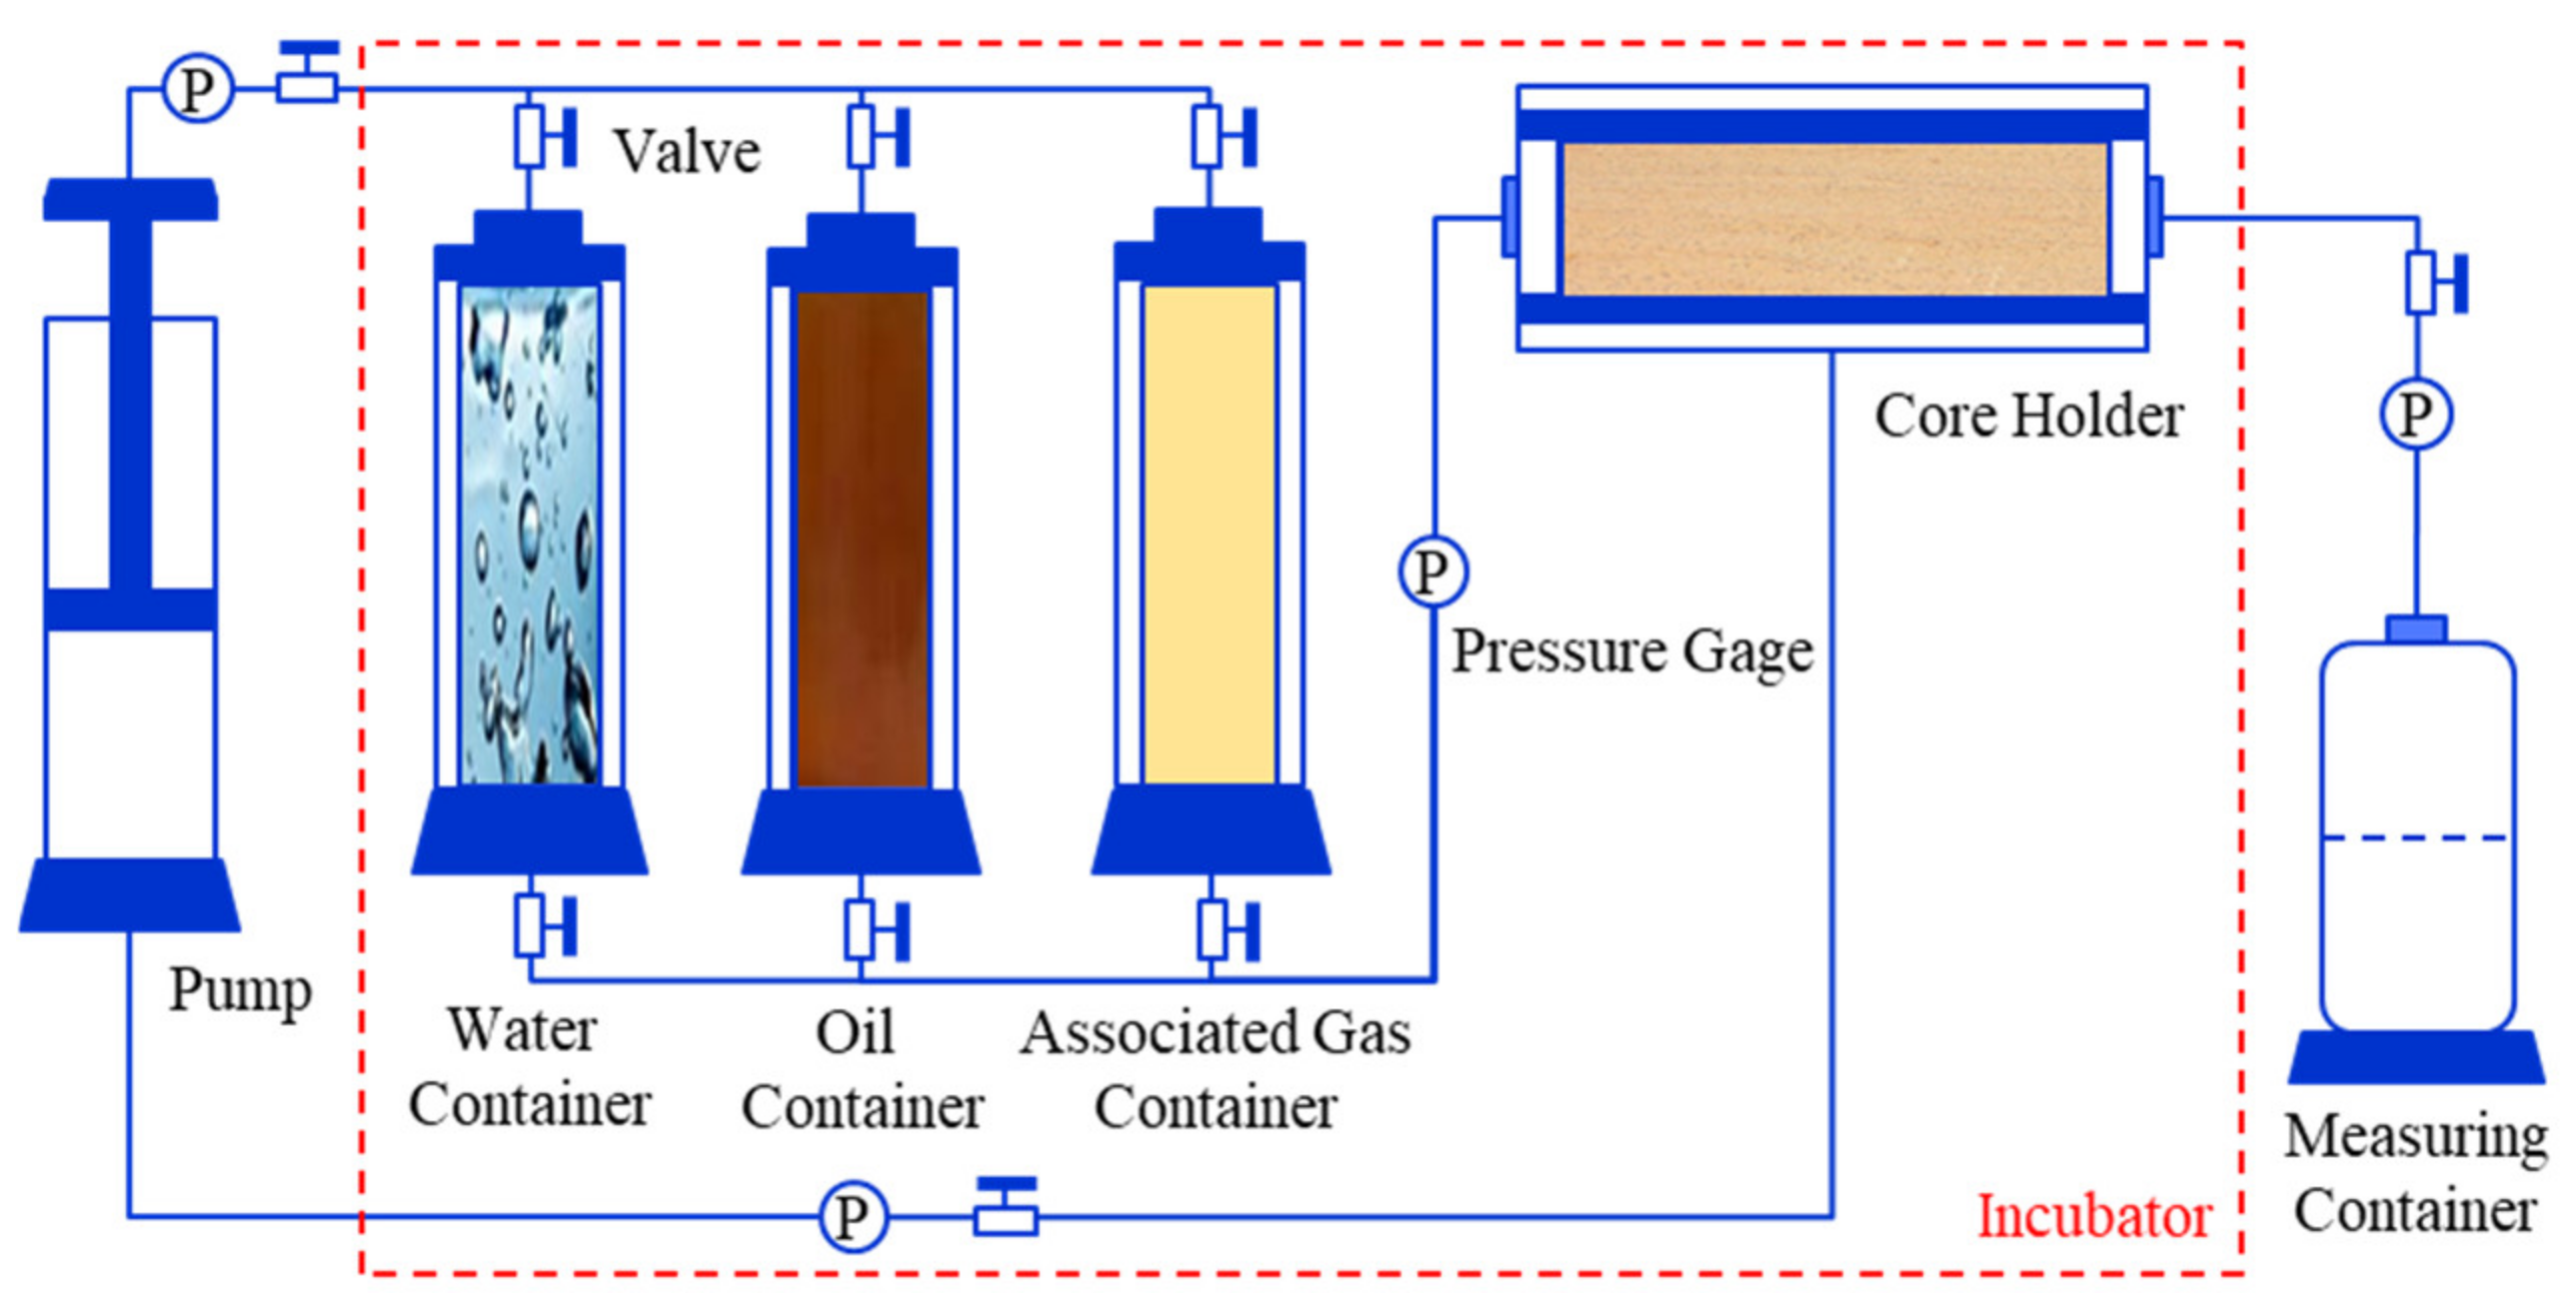
2.2. Experimental Apparatus

The experiment utilizes a transient method to measure the relative permeability of oil and gas, with the experimental setup illustrated in Figure 1. The experiments are conducted at a formation temperature of 140 °C. The primary objective of the experiment is to derive relative permeability curves of oil and gas at various displacement stages. In accordance with the Chinese industry standard “GB/T 28912-2012 Method for Determining Relative Permeability of Two-phase Fluids in Rocks” [29], the experiment collects data such as connate water saturation of the experimental core, gas drive/oil pressure, and flow rate.

2.3. Experimental Procedure

After the core preparation is completed, the core is loaded into a holder and cleaned with alcohol and petroleum ether. It is then dried and vacuumed before proceeding with the following steps:
  • Saturate with formation water, establish a formation temperature of 140 °C and a pressure of 50 MPa, and record the amount of saturated formation water.
  • Equilibrate oil drives water to a connate water state and records the amounts of displaced formation water and connate water.
  • Test the relative permeability of the oil phase under connate water conditions.
  • Equilibrate associated gas drives oil to residual oil saturation, recording the relative permeabilities of the gas and oil phases under various water saturation conditions.
  • Repeat steps 1 to 4, increasing gas drive speed and pressure.

2.4. Experiment on the Effect of Fluid Composition Changes on Relative Permeability

To conduct the relative permeability experiments for gas drive/oil under reservoir temperature and pressure conditions (140 °C and 50 MPa), three core samples from an injection well in the D reservoir were selected at initial, early, and mid–late stages of gas injection. The properties of these core samples are shown in Table 1.
The relative permeability of oil and gas was measured under connate water conditions in oil-saturated core samples using a displacement pressure of 50 MPa. The following experimental fluids were used: (1) Crude oil from each stage was recombined, with the composition and properties of the oil shown in Table 2. (2) Formation water with a salinity of 154,659.5 mg/L and a viscosity of 0.21 mPa·s. (3) The injected gas was associated gas from the reservoir, with a composition of 1.56% CO2, 2.86% N2, 83.18% CH4, and 12.4% C2H4. The viscosity of the injected gas at reservoir temperature and pressure was 0.3 mPa·s.
The core gas drive/oil relative permeability experiment shows the comparison of relative permeability curves in the initial and early stages of gas injection development and in the early and late stages of gas injection development. In the early stage of gas injection development, the oil phase relative permeability curve moves to the right, and oil phase relative permeability increases, as shown in Figure 2a. In the middle and late stages of gas injection development, oil phase relative permeability moves to the left, oil phase relative permeability decreases, and gas phase relative permeability increases, as shown in Figure 2b.

2.5. Experiment on the Effect of Gas Drive/Oil Operation Parameters on Relative Permeability

At the current stage, two typical core samples from the D sandstone reservoir were selected to conduct gas drive/oil relative permeability experiments under reservoir temperature and pressure conditions (140 °C and 50 MPa). The results are shown in Table 3, indicating that the gas drive/oil efficiency ranges between 59.67% and 63.46%, demonstrating good gas drive performance. Higher core quality correlates with lower residual oil saturation and higher gas drive/oil efficiency, as shown in Table 3. To investigate the impact of displacement pressure and displacement rate on the effectiveness of gas injection oil recovery, core gas drive/oil experiments were conducted with increased displacement pressure (55 MPa) and increased displacement rate (0.02 mL/min), as shown in Figure 3. As displacement pressure and velocity increase, the efficacy of gas injection for oil recovery improves, as evidenced by a rise in oil phase relative permeability and a decrease in gas phase relative permeability. The injected gas more effectively mobilizes the crude oil in smaller pores under higher displacement pressure differentials, thereby enhancing the efficiency of gas displacement in oil recovery.

2.6. Brief Summary

The core gas drive/oil relative permeability experiments show that in the early stages of gas injection, the density and viscosity of the crude oil significantly decrease due to the miscible action of the injected gas, and the relative permeability of the oil phase increases accordingly. Changes in the composition of the produced fluid during the early stages of gas injection also confirm an increase in light hydrocarbons and a decrease in heavy hydrocarbons. These physical changes cause the oil phase relative permeability curve to shift to the right, reflecting an increase in oil phase relative permeability, as shown in Figure 2a. In the later stages of gas injection, the proportion of heavy components in the reservoir increases, fluid mobility decreases, and residual oil saturation rises, resulting in the oil phase relative permeability curve shifting to the left and a decrease in oil phase relative permeability. Simultaneously, due to the enhanced continuity of the gas phase and reduced residual gas saturation, the gas phase relative permeability curve also shifts to the left, indicating improved gas phase mobility, as shown in Figure 2b.
The experimental results on the effect of gas flooding parameters on relative permeability indicate that with the increase in displacement pressure and displacement rate, the gas drive/oil efficiency increased by 3.79% and 1.03%, respectively.

3. Factors Influencing the Time-Varying Characteristics of Relative Permeability

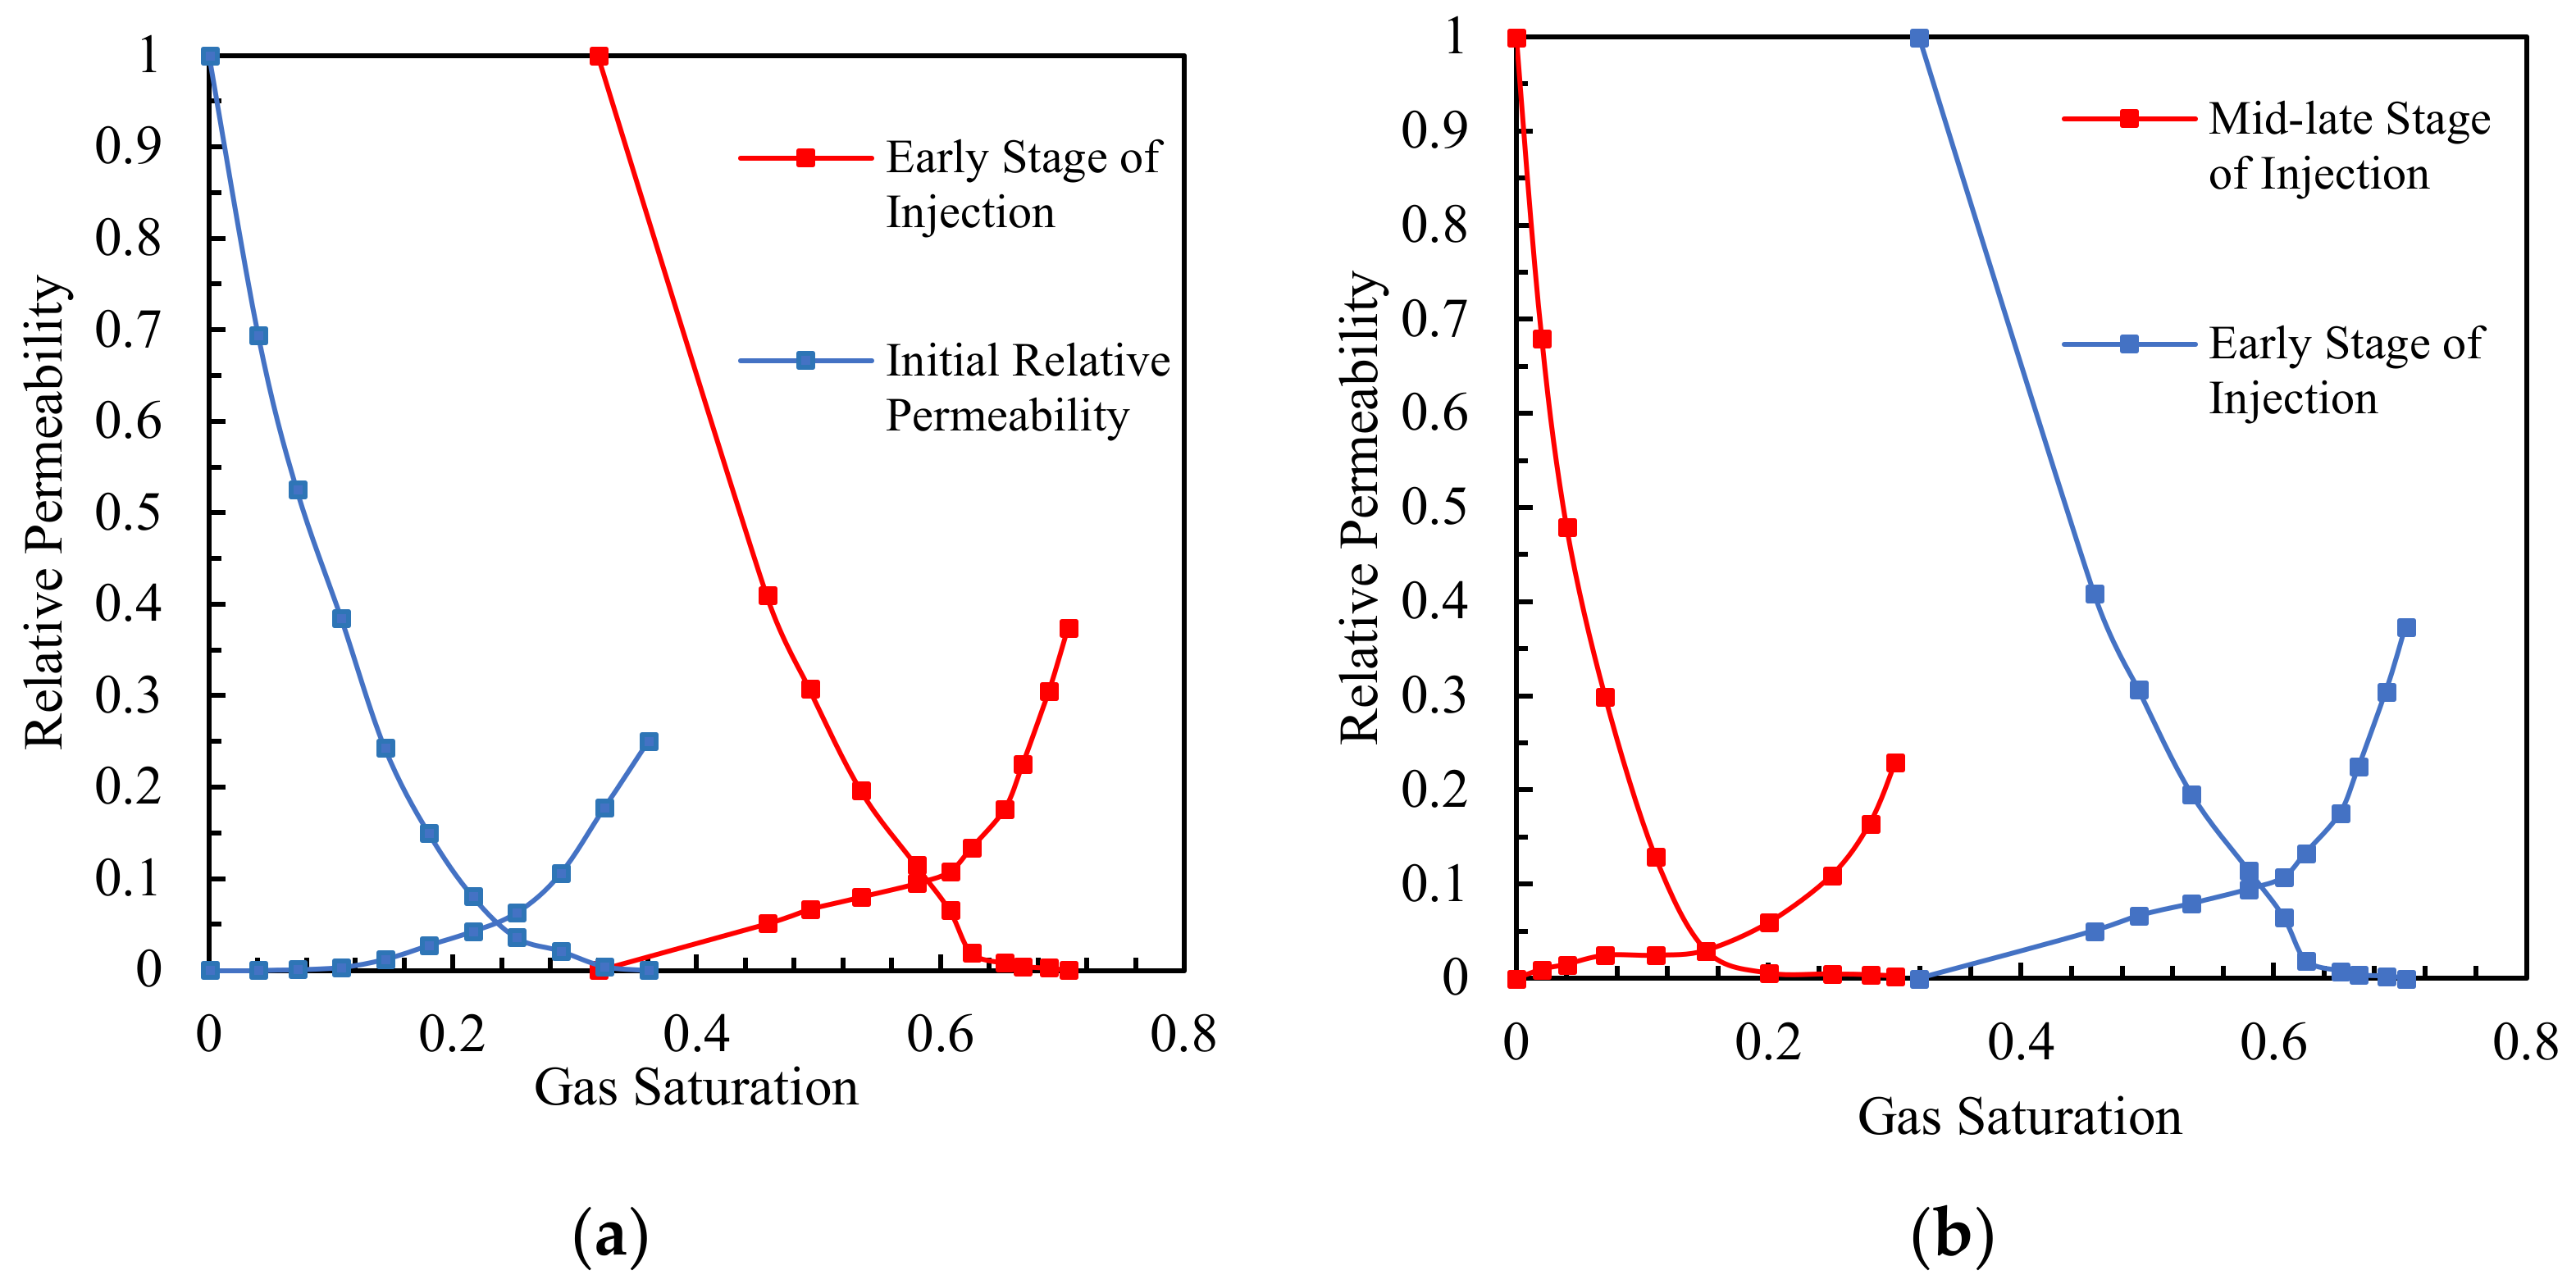
3.1. Effect of Fluid Composition Changes on Relative Permeability

Before gas injection in the reservoir, the composition of formation fluids remains relatively stable. However, significant changes occur in the composition of formation fluids as the injected associated gas comes into contact with the crude oil, and the relative permeability of oil and gas exhibits distinct time-varying characteristics at different stages of gas drive, as shown in Figure 2. In the early stages of gas injection, when the formation pressure (55 MPa) is higher than the minimum miscibility pressure (43.5 MPa), the injected gas and crude oil become miscible. Gas molecules at the gas front dissolve and diffuse into crude oil through a kinetic exchange, increasing the content of light hydrocarbons and reducing the content of heavy hydrocarbons. This expands crude oil and reduces viscosity, enhancing mobility and increasing oil phase relative permeability, as shown in Figure 2a. Concurrently, the residual oil saturation decreases effectively, increasing the utilization of the remaining oil. In the mid–late stages of gas injection, due to prolonged vaporizing miscible gas drive, the light hydrocarbon components in the crude oil are extracted, increasing the proportion of heavy components in the remaining oil within the reservoir. This results in higher residual oil saturation and lower displacement efficiency, as well as a decrease in oil phase relative permeability, as shown in Figure 2b. Meanwhile, fewer intermediates are extracted from crude oil in the reservoir, and gas phase viscosity decreases and forms a continuous phase. Moreover, the residual gas saturation decreases, and the gas phase relative permeability increases, as shown in Figure 2b.

3.2. Effect of Changes in Operating Parameters on Relative Permeability

Gas injection parameters, including the injection pressure and injection rate, influence the relative permeability of oil and gas, as shown in Figure 3b,c. Optimizing these parameters at different gas injection stages is crucial for enhancing crude oil recovery.
Injection pressure is one of the key factors affecting the relative permeability of oil and gas during the gas drive/oil process. When the injection pressure reaches or exceeds the minimum miscibility pressure (MMP), the injected gas molecules can rapidly and uniformly dissolve into the crude oil, fully mixing with it. This significantly reduces the interfacial tension between oil and gas phases, with measurements showing a decrease from 0.31 dynes/cm to 0.17 dynes/cm. Concurrently, it lowers the viscosity of the crude oil from 1/2 centipoise to 1/3.1 centipoise, enhancing its mobility, thereby increasing the relative permeability of the oil phase. A high injection pressure can accelerate the mass transfer process between oil and gas phases, resulting in a significant reduction in crude oil density and viscosity. Additionally, the dissolution of the injected gas causes the crude oil to expand, enhancing its driving force and further increasing oil phase relative permeability. However, excessively injection pressure causes the injected gas to channel too early, quickly advancing along preferential flow paths without adequately contacting and mixing with the crude oil, resulting in a large amount of residual oil being bypassed in the reservoir and reducing oil phase relative permeability. Therefore, in the design of gas injection schemes, it is necessary to optimize the injection pressure to ensure the uniform distribution of the injected gas in the reservoir, thereby improving the gas drive/oil efficiency.
The injection rate also significantly impacts the relative permeability of oil and gas during the gas drive/oil process. A reasonable injection rate can improve the uniform distribution of the injected gas in the reservoir, increasing the contact area between the injected gas and the residual oil, thereby enhancing the gas drive/oil efficiency. However, an excessively high injection rate causes the injected gas to break through along preferential flow paths without adequately contacting the residual oil in the reservoir, resulting in a reduction in oil phase relative permeability and a decrease in the gas drive/oil efficiency. Conversely, an excessively low injection rate leads to an uneven distribution of the injected gas in the reservoir, reducing the miscibility between the injected gas and the crude oil, thereby decreasing the gas drive/oil efficiency. Therefore, reasonably controlling the injection rate can increase oil phase relative permeability and improve the gas drive/oil efficiency.

4. Practical Application

To apply the above research findings to practical gas injection in reservoirs, a typical well group consisting of one injection well and four production wells in the southwestern part of the D reservoir was selected for reservoir numerical simulation studies. The horizontal and vertical distributions of residual oil saturation for this typical injection/production well group are shown in Figure 4.

4.1. Numerical Simulation Method of Reservoirs Considering Time-Varying Relative Permeability

To study the impact of significant changes in fluid composition and operating parameters during gas injection on the effectiveness of gas drive/oil recovery, it is necessary to use temporal partitioning of relative permeability curves in reservoir numerical simulations. This means that different oil and gas relative permeability curves should be used for reservoir numerical simulation research at different stages of gas injection. The partitioning time based on the dynamic trends of the injection/production well group can be determined based on the production dynamic trends of the injection/production well group. The typical injection/production well group began gas injection testing in 2014, and since the expansion of the gas injection scale in 2017, good development results have been achieved. However, starting in 2021, the oil production capacity has significantly declined, and the gas/oil ratio increased sharply, with gas channeling occurring at the bottom of three production wells, indicating the transition to the mid–late stage of gas injection. Therefore, the periods from 2014 to 2021 and from 2021 to 2024 are defined as the early and mid–late stages of gas injection, respectively. Simulations were conducted using tNavigator numerical simulation software (21.1.0.0) to investigate the impact of time-varying relative permeability characteristics on gas drive/oil recovery.
The simulation results considering the time-varying characteristics of the relative permeability of oil and gas better match the actual field conditions. Figure 5a,b show the distribution of oil and gas saturation without considering the time-varying characteristics of relative permeability, while Figure 5c,d show the distribution with these characteristics considered. The comparison reveals that Figure 5c,d exhibit a larger gas drive sweep volume and a wider oil–gas transition zone, which more accurately reflects the distribution characteristics of oil and gas during the actual gas drive/oil process. This is because, in the early stage of gas injection, the injected gas becomes miscible with the remaining oil in the reservoir, enhancing the mobility of the remaining oil, reducing its viscosity, and allowing the injected gas to penetrate deeper and cover a wider area in the reservoir. Simultaneously, in the mid–late stages of gas injection, as the injected gas enters the continuous phase, the relative permeability of the gas increases while that of the oil decreases. This intensifies gas-channeling phenomena and results in a significant increase in the gas-to-oil ratio. Figure 5e,g,i show the daily oil, gas, and water production without considering the time-varying characteristics of relative permeability, while Figure 5f,h,j show these production metrics with the characteristics considered. The comparison shows significant differences in comparison to historical matching results between simulations with and without the consideration of time-varying relative permeability characteristics in the mid–late stages of gas injection. Simulations considering these characteristics yield superior historical matching results that are more consistent with actual production conditions. These findings demonstrate that reservoir numerical simulation models for gas injection that consider the time-varying characteristics of relative permeability are reliable.

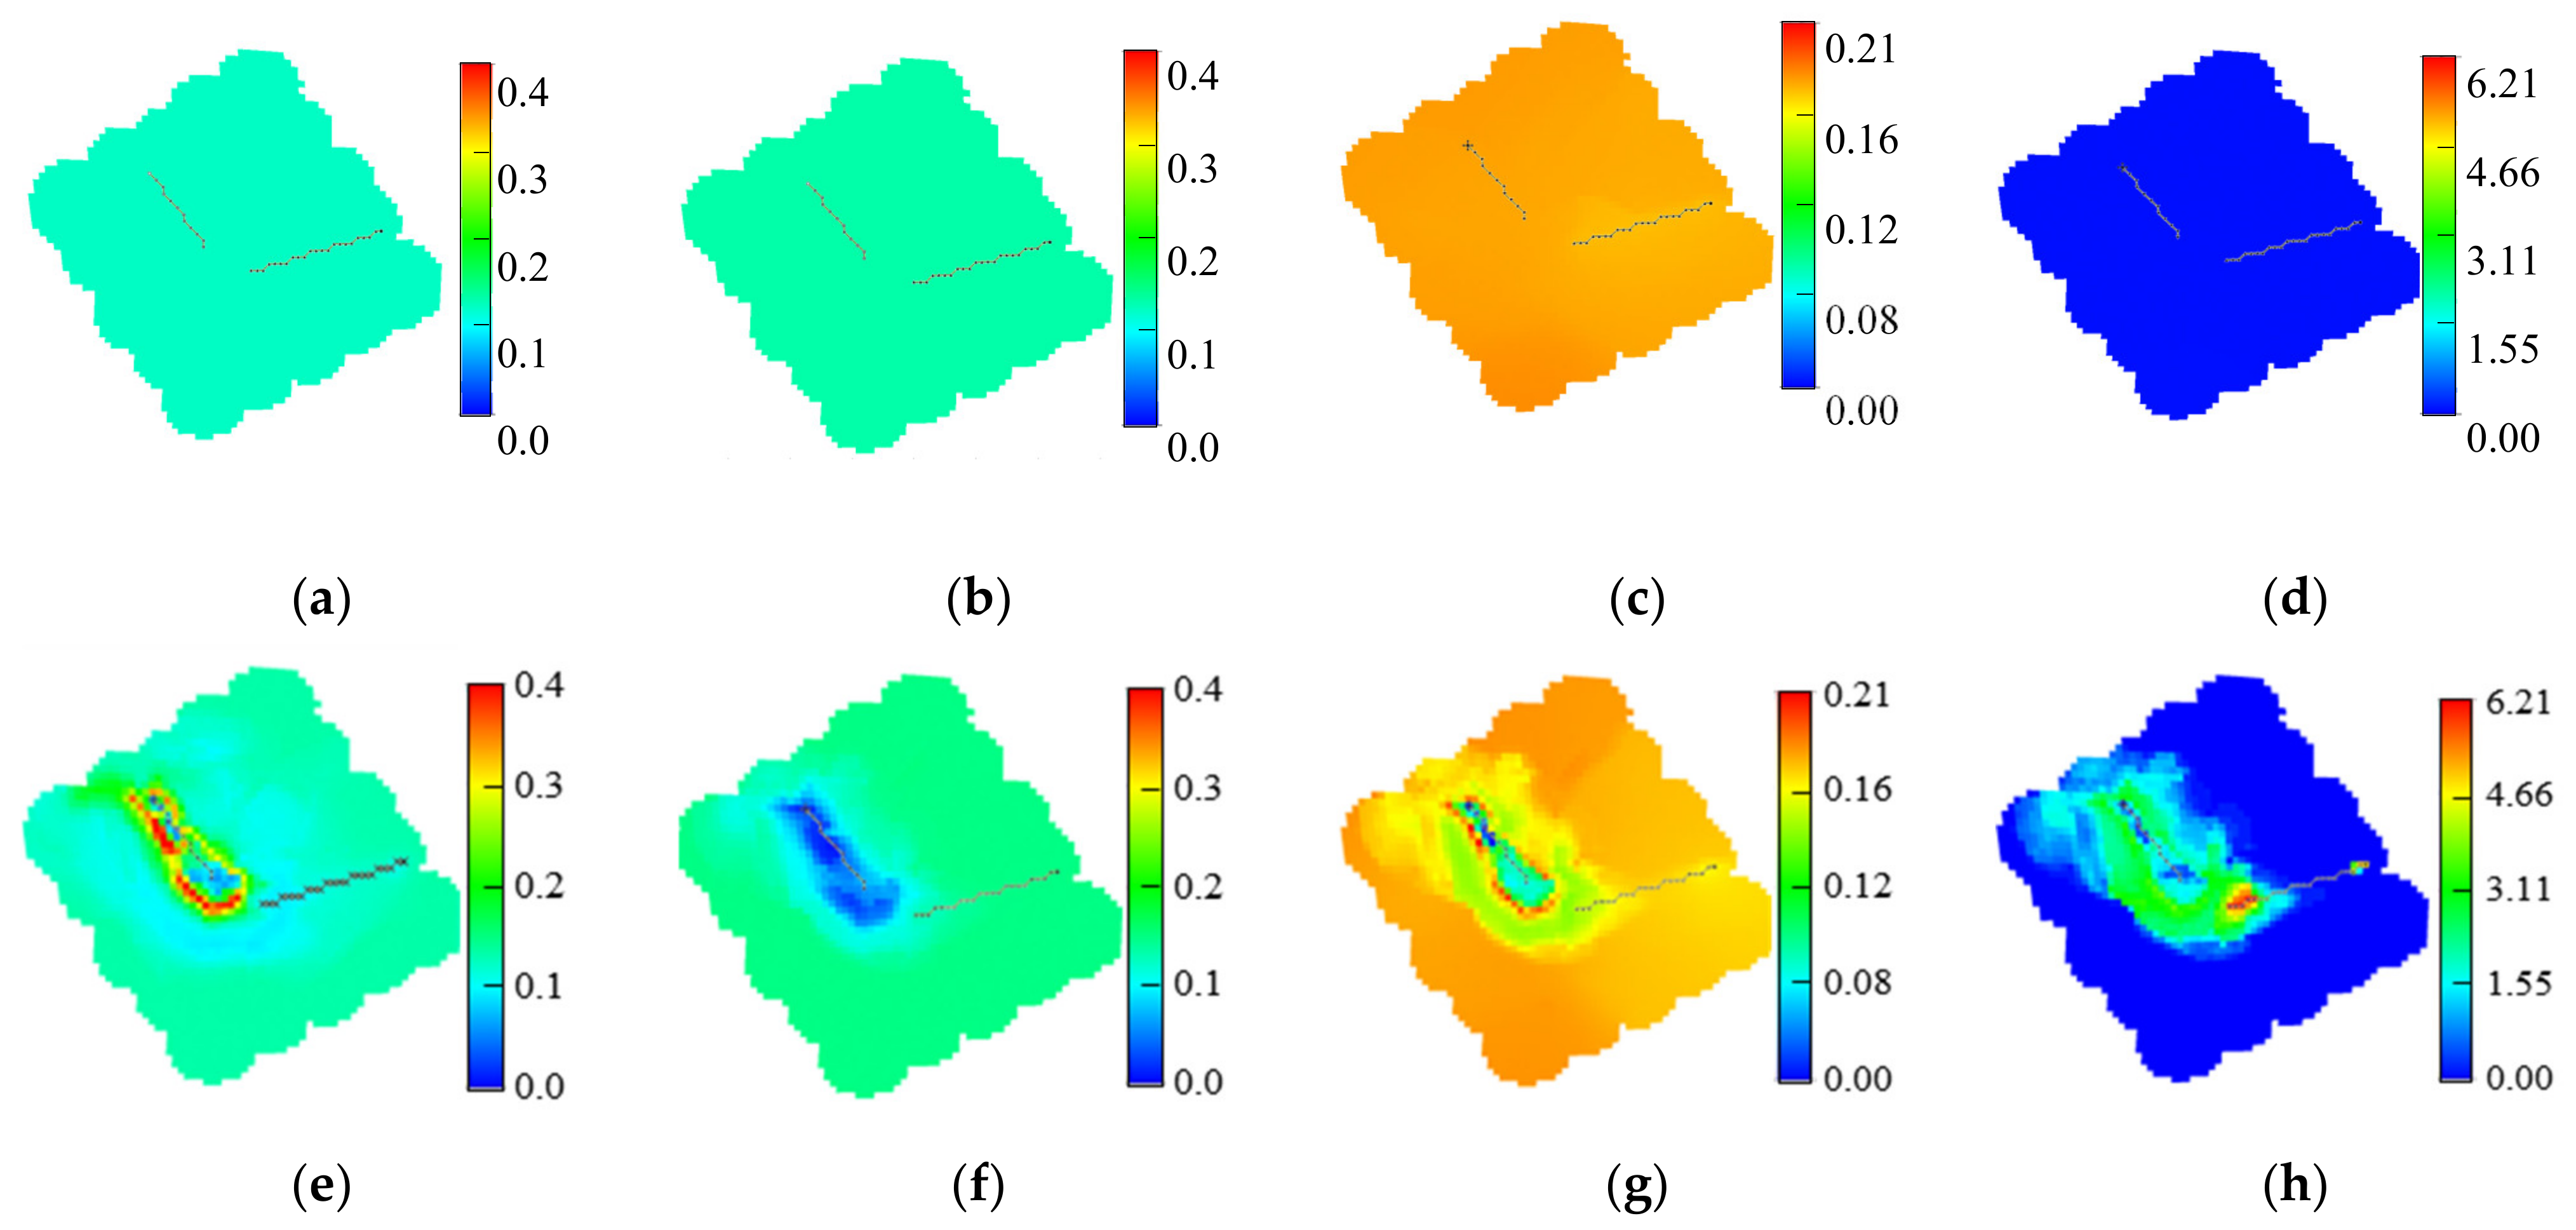
4.2. Reservoir Numerical Simulation Based on Time-Varying Relative Permeability

To gain a deeper understanding of the developmental effectiveness of the typical well group in the D reservoir at different stages of gas injection, a reservoir numerical simulation model based on the time-varying characteristics of the relative permeability of oil and gas was used to reveal the distribution characteristics of fluid components and their properties in the reservoir at different stages of gas injection, as shown in Figure 6. Figure 6 illustrates the initial state distributions: Figure 6a shows the distribution of light components, Figure 6b shows the distribution of heavy components, Figure 6c shows the crude oil viscosity distribution, and Figure 6d shows the surface tension distribution. In the early stages of gas injection, the injected gas becomes miscible with the remaining oil in the reservoir, increasing the proportion of light components in the remaining oil (Figure 6e) and decreasing the proportion of heavy components (Figure 6f). This results in a reduced crude oil viscosity (Figure 6g) and lower oil–gas interfacial tension (Figure 6h), thereby enhancing the mobility of the crude oil. When gas injection enters the mid–late stages, more injected gas accumulates near the wellbore area of the injection well (Figure 6i), where predominantly results in the evaporation of gas drive. The injected gas primarily extracts and removes intermediate to light hydrocarbons from the reservoir, leading to an increase in the content of heavy components in the remaining reservoir oil (Figure 6j). The viscosity of the remaining oil near the wellbore area of the injection well increases (Figure 6k), and the oil–gas interfacial tension increases (Figure 6l), reducing the mobility of the crude oil. The relative permeability of the gas phase increases, making it easier for the reservoir to form preferential gas flow channels, resulting in gas channeling.

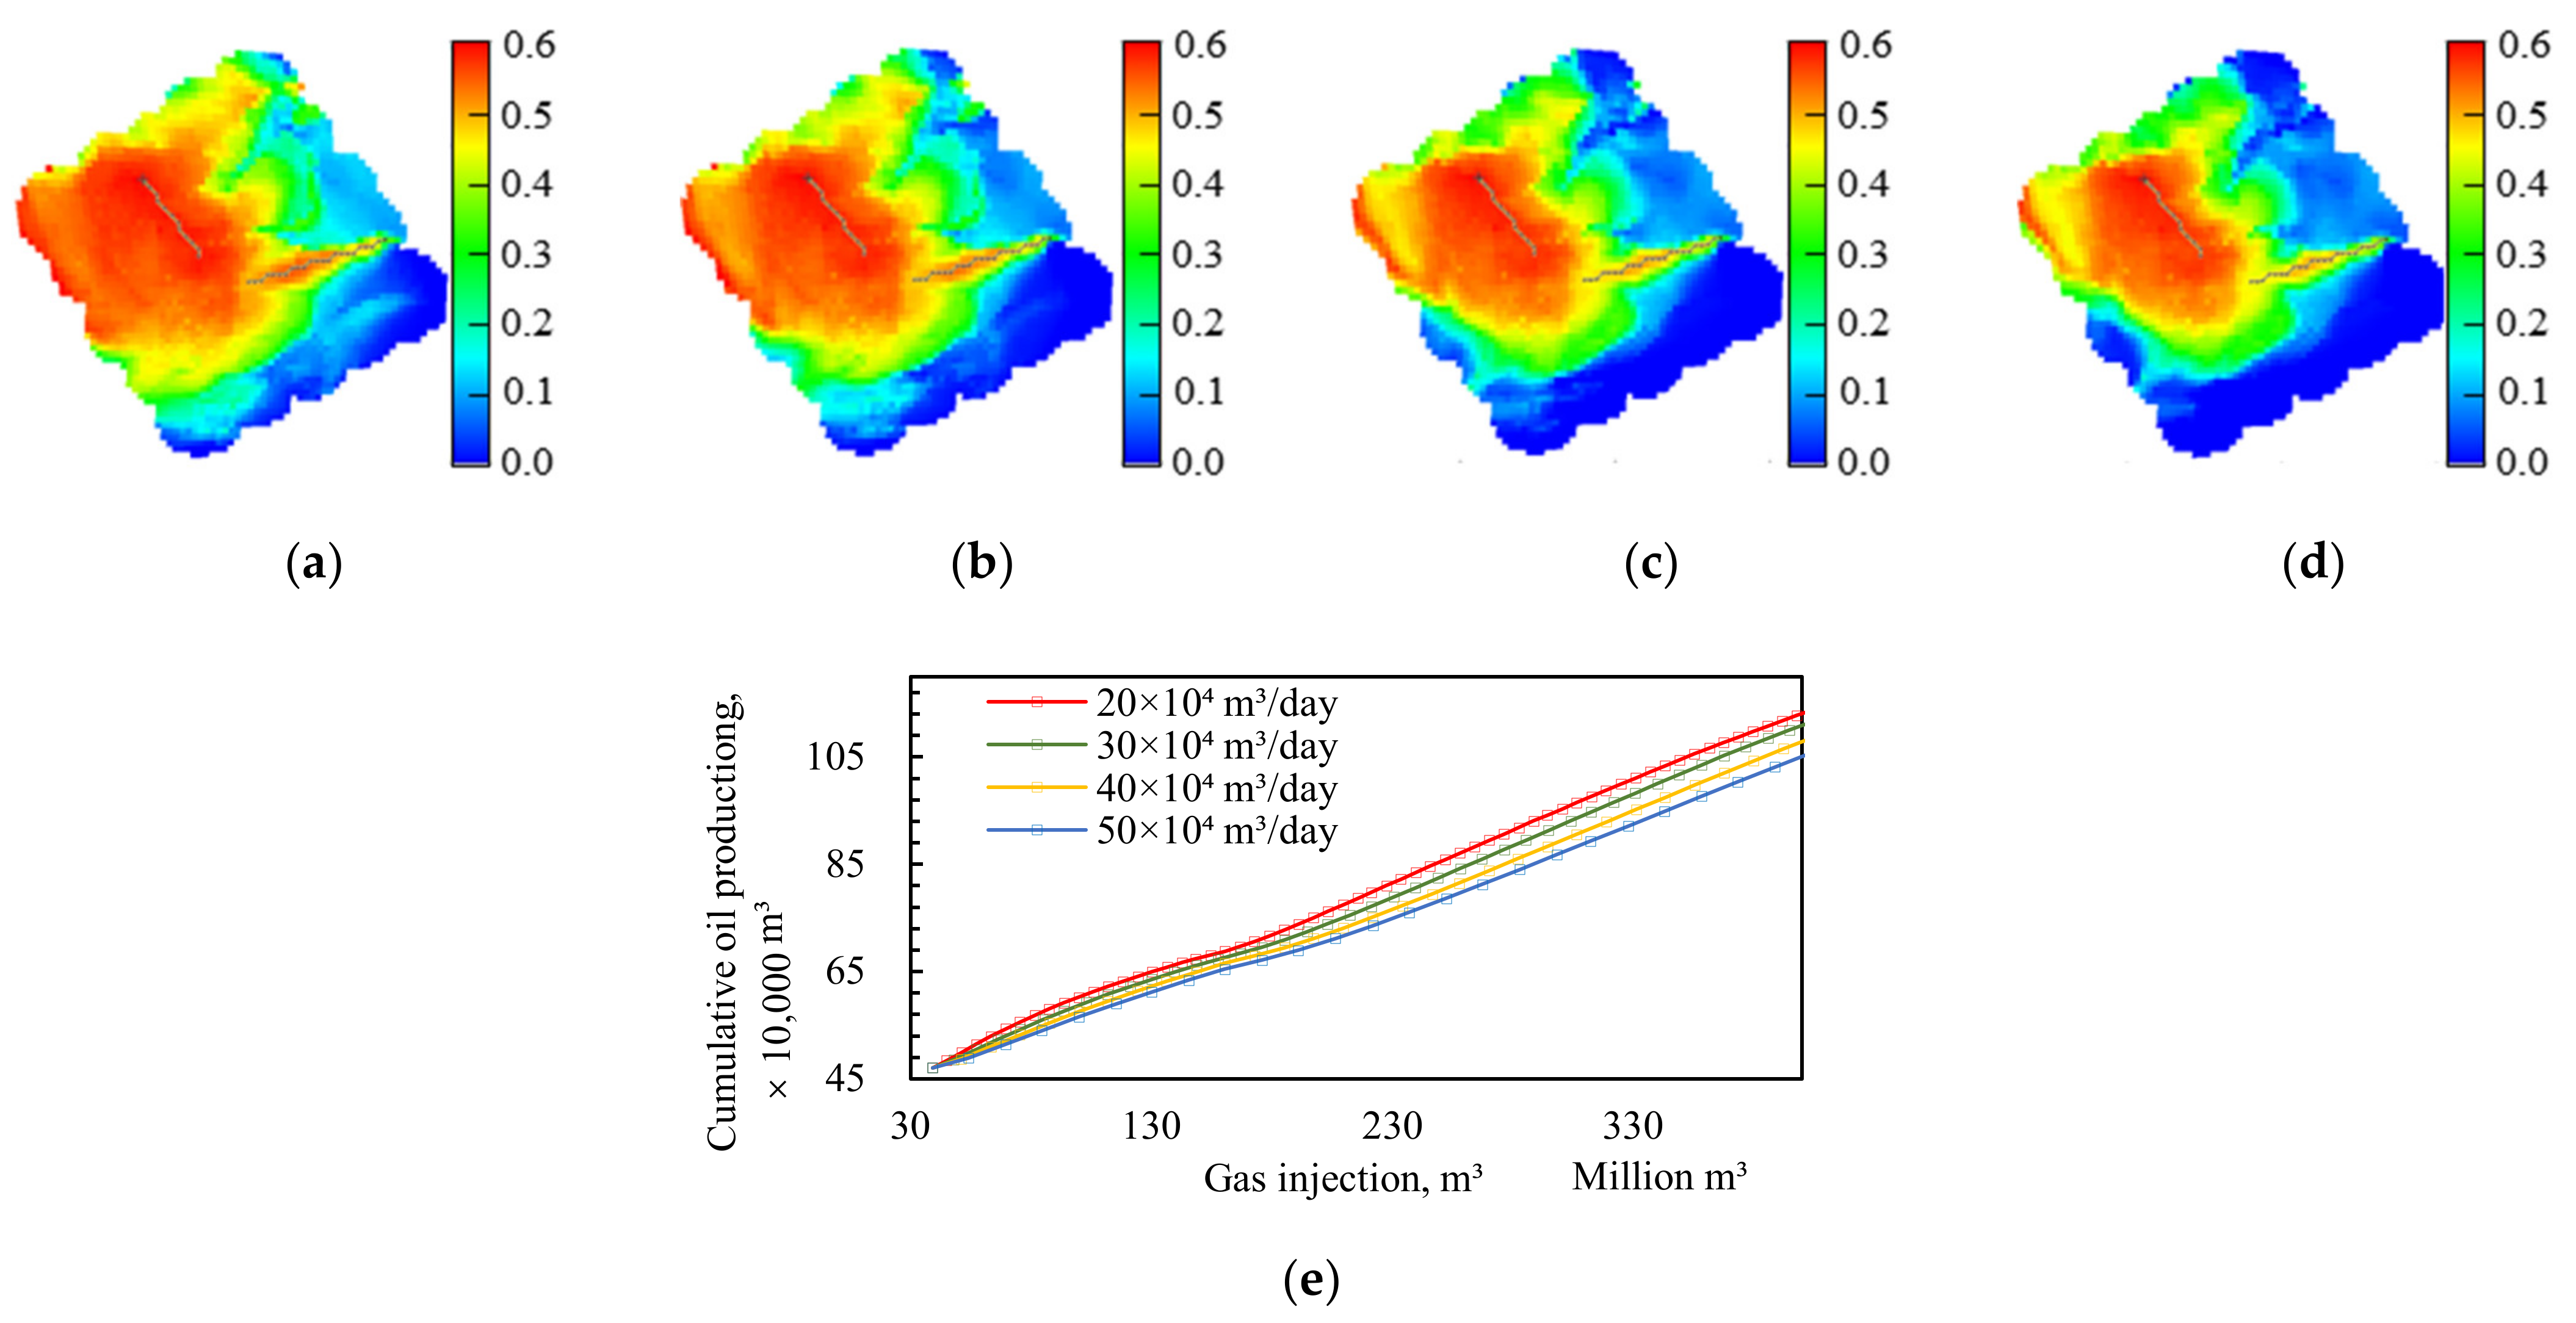
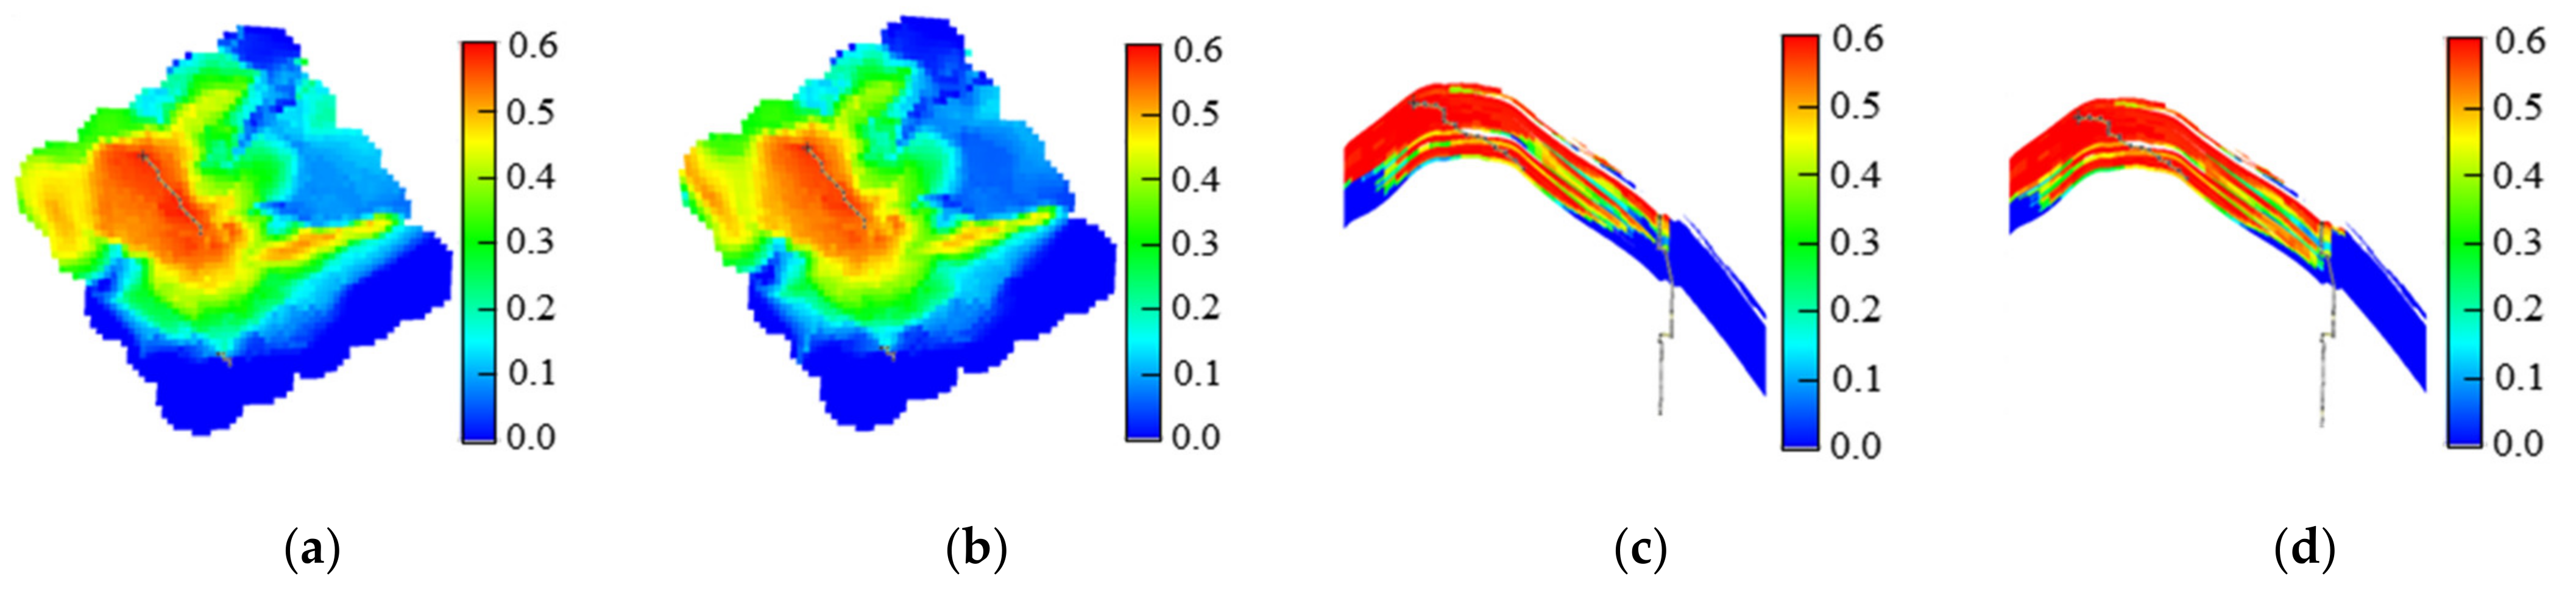
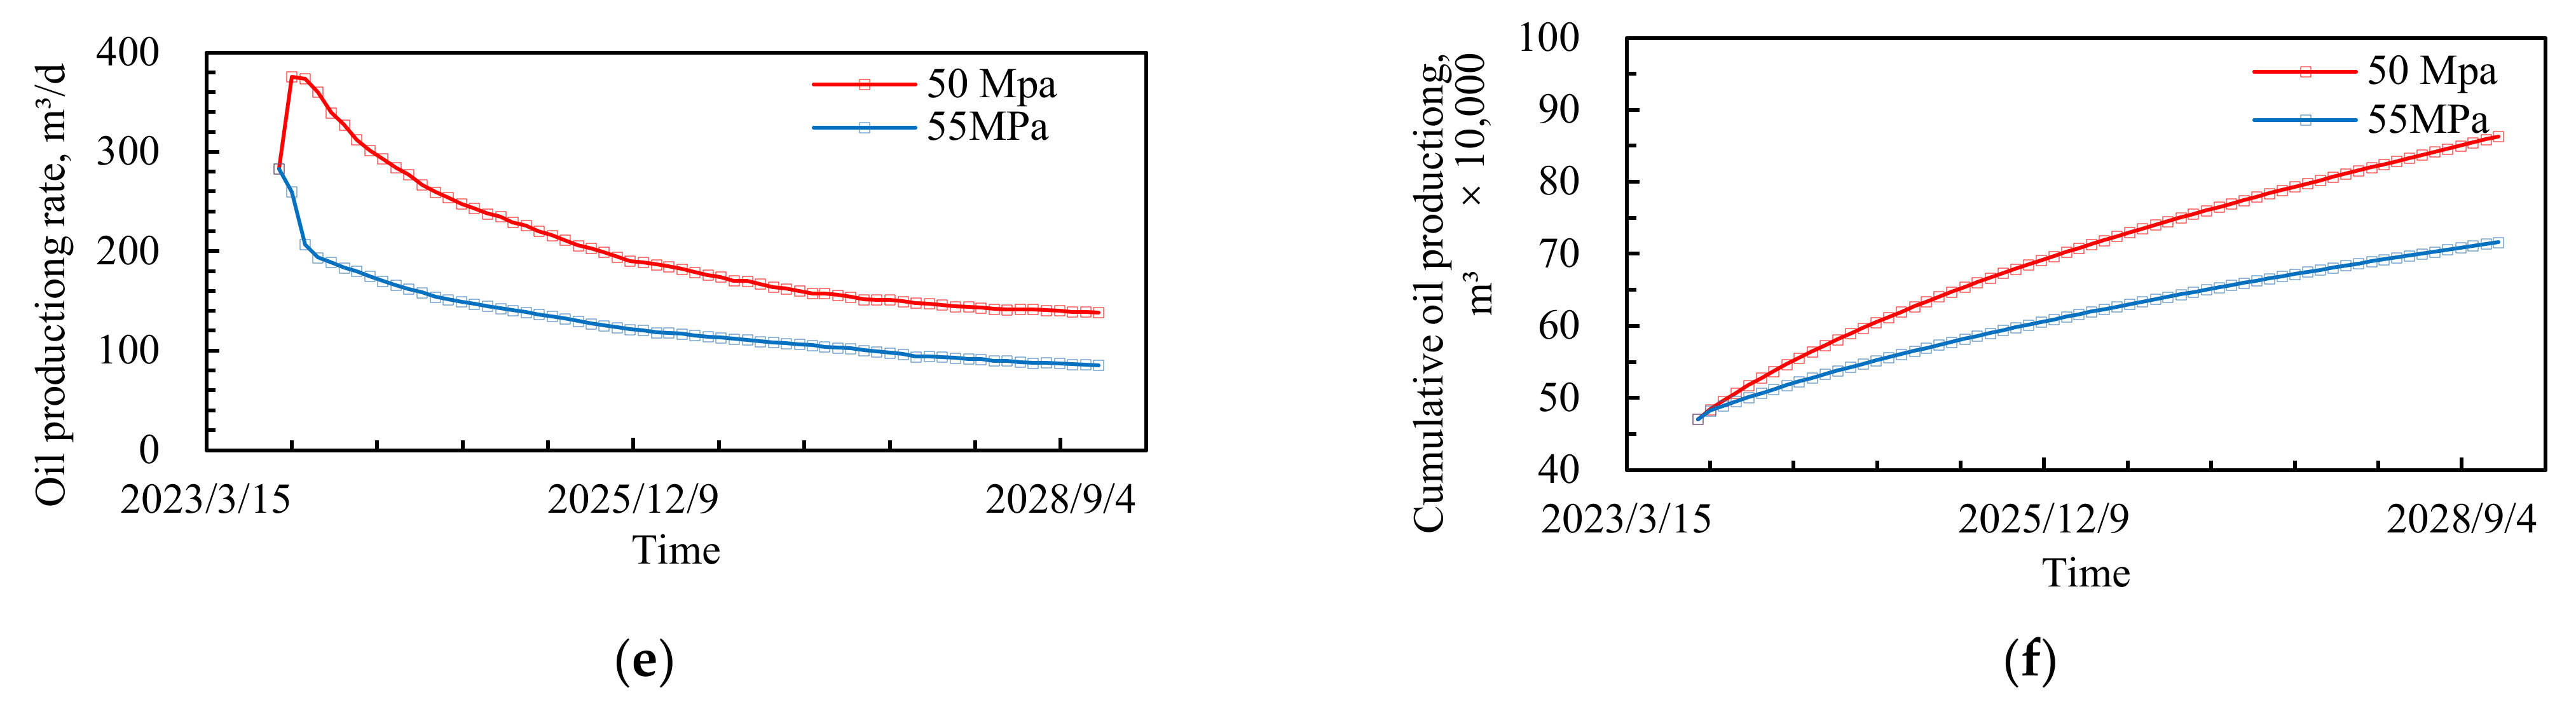
4.3. Effect of Gas Injection Parameters on Development Efficiency Considering Time-Varying Relative Permeability

To improve the effectiveness of gas injection in reservoirs, it is necessary to optimize the gas injection parameters. This section achieves the optimization of gas injection parameters based on a reservoir numerical simulation considering the time-varying characteristics of the relative permeability of oil and gas, primarily discussing the impacts of different gas injection rates and pressures.
Figure 7a,b show the distribution of injected gas at low injection rates, while Figure 7c,d show the distribution of injected gas at higher injection rates. The comparison reveals that the sweep volume is larger at lower injection rates, and as the injection rate increases, the gas drive sweep volume significantly decreases. However, when the injection rate increases to a certain level, the change in sweep volume becomes less apparent. This is because, in the low injection rate range, viscous fingering in gas drive is less pronounced, allowing the injected gas to advance into a larger area of the reservoir, resulting in a larger sweep volume. In the high injection rate range, the gas phase more easily forms a continuous phase within high gas saturation and rapidly advancing through high-speed flow channels toward the production well, thereby reducing the sweep volume and cumulative oil production (Figure 7e). This indicates that for specific reservoir characteristics, optimizing the gas injection rate is essential to maximize the sweep volume, delay early gas channeling in production wells, and improve the reservoir development efficiency.
Figure 8a–d depict the planar and profile distribution of gas saturation in the reservoir under varying injection pressures. Due to reservoir heterogeneity, the gas drive front advances non-uniformly from the injection to the production well. At a low injection pressure, the injected gas struggles to displace oil in low permeability areas (Figure 8a,c). At a high injection pressure, the gas drive front can advance more rapidly towards the production well, reducing the sweep volume (Figure 8b,d). Compared to a low injection pressure, a high injection pressure enhances the dissolution of injected gas into crude oil formation, increasing the degree of oil–gas miscibility and improving the microscopic oil displacement efficiency. However, it also more easily forms gas-channeling passages in highly permeable areas, leading to ineffective gas cycling and significantly reducing the swept volume, thereby resulting in reduced daily and cumulative oil production (Figure 8e,f). This indicates that for specific reservoir characteristics, it is also necessary to optimize the injection pressure to maximize gas drive sweep volume while ensuring a high microscopic oil displacement efficiency, thus enhancing the reservoir development efficiency.

5. Conclusions

  • During the process of gas injection in reservoirs, changes in reservoir properties, fluid composition, and operating parameters cause the relative permeability of oil and gas to exhibit significant time-varying characteristics. In the early stages of gas injection, most of the reservoir is at the gas injection front, resulting in a leftward shift in the relative permeability of oil and gas. In the mid–late stages of gas injection, the reservoir is at the trailing edge of gas injection, resulting in a leftward shift in the relative permeability of oil and gas.
  • A reservoir numerical simulation model considering time-varying the relative permeability of oil and gas better matches production conditions and can more accurately reflect the distribution characteristics of oil and gas and the dynamic changes in production.
  • During reservoir gas injection, it is necessary to optimize the injection rate and injection pressure to improve the development efficiency. Excessively high injection rates and pressures may increase the microscopic oil displacement efficiency but can also cause premature gas channeling, reducing the sweep efficiency and negatively impacting reservoir development.
This study has revealed the time-varying characteristics of the relative permeability of oil and gas and their profound impacts on reservoir development effectiveness. Thus, this study particularly underscores how injection parameters at different stages affect the mobility of oil and gas and ultimately the efficiency of recovery. In our future research, we will continue to explore the changes in relative permeability under various reservoir conditions and their specific impacts on oil and gas production. Furthermore, developing more advanced simulation technologies to predict and manage these changes will be crucial for enhancing the effectiveness of oil and gas development strategies.

Author Contributions

Conceptualization, H.L. and X.L.; methodology, X.H.; software, K.L.; validation, H.L. and Y.L.; formal analysis, Z.J. and X.L.; investigation, H.L.; resources, K.W.; writing—original draft preparation, X.L.; writing—review and editing, K.W. All authors have read and agreed to the published version of the manuscript.

Funding

This research was supported by a grant from “Research on seepage mechanism and capacity evaluation of complex condensate gas reservoirs in Xihu Depression” (E-Y423RY02.05) of the Shanghai Branch of China National Offshore Oil Corporation (CNOOC).

Data Availability Statement

The original data used in this study are included in this article. Further inquiries can be directed to the corresponding author.

Conflicts of Interest

Authors Hengjie Liao, Xianke He, Yuansheng Li and Zhehao Jiang were employed by the company Shanghai Branch of CNOOC Ltd. The remaining authors declare that the research was conducted in the absence of any commercial or financial relationships that could be construed as a potential conflict of interest. The authors declare that this study received funding from CNOOC. The funder was not involved in the study design, collection, analysis, interpretation of data, the writing of this article or the decision to submit it for publication.

References

  1. Ding, Y.; Duan, H.; Tang, X.; Ren, K.; Yang, Z.; Lan, Z.; Liu, S. Exploring China’s oil consumption pathways toward 2060 under different climate targets. Environ. Impact Assess. Rev. 2023, 103, 107233. [Google Scholar] [CrossRef]
  2. Pan, X.; Wang, L.; Dai, J.; Zhang, Q.; Peng, T.; Chen, W. Analysis of China’s oil and gas consumption under different scenarios toward 2050: An integrated modeling. Energy 2020, 195, 116991. [Google Scholar] [CrossRef]
  3. Wang, L.; Zhang, Y.; Zou, R.; Zou, R.; Huang, L.; Liu, Y.; Meng, Z.; Wang, Z.; Lei, H. A systematic review of CO2 injection for enhanced oil recovery and carbon storage in shale reservoirs. Int. J. Hydrogen Energy 2023, 48, 37134–37165. [Google Scholar] [CrossRef]
  4. Bai, J.; Feng, Q.; Yang, G.; Ai, X.; Cheng, S.; Pan, Y.; Lu, Y. Research Progress of Friendly Carbon Dioxide Expansion Flooding: A Review. Chem. Technol. Fuels Oils 2024, 60, 119–131. [Google Scholar] [CrossRef]
  5. Kang, W.-L.; Zhou, B.-B.; Issakhov, M.; Gabdullin, M. Advances in enhanced oil recovery technologies for low permeability reservoirs. Pet. Sci. 2022, 19, 1622–1640. [Google Scholar] [CrossRef]
  6. Alvarado, V.; Manrique, E. Enhanced Oil Recovery: An Update Review. Energies 2010, 3, 1529–1575. [Google Scholar] [CrossRef]
  7. Liu, Y.; Wang, S.; Zhao, W.; Yan, H.; Guo, P.; Zhang, J.; Bai, Z.; Wang, Z.; Ou, L. Multi-dimensional Experimental Study of Hydrocarbon Gas-Assisted Gravity Drainage. Arab. J. Sci. Eng. 2023, 48, 17031–17048. [Google Scholar] [CrossRef]
  8. Zhang, J.; Zhang, H.X.; Ma, L.Y.; Liu, Y.; Zhang, L. Performance evaluation and mechanism with different CO2 flooding modes in tight oil reservoir with fractures. J. Pet. Sci. Eng. 2020, 188, 106950. [Google Scholar] [CrossRef]
  9. Pu, W.; Fan, H.; Du, D.; Zhao, S.; Liu, Z.; Li, Y.; Jin, F. High pressure air injection in ultra-low permeability reservoirs: Effects of physical and chemical reactions on oil recovery. Chem. Eng. Res. Des. 2023, 195, 323–331. [Google Scholar] [CrossRef]
  10. Seyyedi, M.; Mahmud, H.K.B.; Verrall, M.; Giwelli, A.; Esteban, L.; Ghasemiziarani, M.; Clennell, B. Pore structure changes occur during CO2 injection into carbonate reservoirs. Sci. Rep. 2020, 10, 3624. [Google Scholar] [CrossRef]
  11. Xiong, R.; Guo, J.; Kiyingi, W.; Luo, H.; Li, S. Asphaltene deposition under different injection gases and reservoir conditions. Chem. Eng. Res. Des. 2023, 194, 87–94. [Google Scholar] [CrossRef]
  12. Zhou, W.; Niu, M.-y.; Luo, W.-j.; Liu, X.-t. Research Progress on Enhanced Oil Recovery by CO2 Flooding in Low Permeability Reservoirs. In Proceedings of the International Field Exploration and Development Conference, Wuhan, China, 20–22 September 2023; pp. 343–366. [Google Scholar]
  13. Zheng, Z.-g.; Wang, Y.-h.; Xiong, W.-l.; Gou, C.-b.; Wang, J.-h.; Zhan, J. Research on Gas Channeling Identification Technology for CO2 Flooding in Ultra-low Permeability Reservoirs. In Proceedings of the International Field Exploration and Development Conference, Qingdao, China, 20–22 October 2021; pp. 2653–2663. [Google Scholar]
  14. Yang, J.; Hou, J. Experimental study on gas channeling characteristics of nitrogen and foam flooding in 2-D visualized fractured-vuggy model. J. Pet. Sci. Eng. 2020, 192, 107334. [Google Scholar] [CrossRef]
  15. Wang, J.; Sun, L. The Time-Varying Regulation of Reservoir Physical Properties and the Study of Core Numerical Simulation. In Proceedings of the International Field Exploration and Development Conference 2020, Chengdu, China, 23–25 September 2020; pp. 3296–3304. [Google Scholar]
  16. Jie, J.; Zijun, H.; Ruxiang, G.; Jibo, R.; Gaoming, Y.; Yu, Z. Time-varying Numerical Simulation Of Reservoir Physical Properties Based On Surface Flux. J. Phys. Conf. Ser. 2021, 1894, 012077. [Google Scholar] [CrossRef]
  17. Jiang, R.; Zhang, W.; Zhao, P.; Jiang, Y.; Cai, M.; Tao, Z.; Zhao, M.; Ni, T.; Xu, J.; Cui, Y.; et al. Characterization of the reservoir property time-variation based on ‘surface flux’ and simulator development. Fuel 2018, 234, 924–933. [Google Scholar] [CrossRef]
  18. Okhovat, M.R.; Hassani, K.; Rostami, B.; Khosravi, M. Experimental studies of CO2-brine-rock interaction effects on permeability alteration during CO2-EOR. J. Pet. Explor. Prod. Technol. 2020, 10, 2293–2301. [Google Scholar] [CrossRef]
  19. Yang, Y.-B.; Xiao, W.-L.; Zheng, L.-L.; Lei, Q.-H.; Qin, C.-Z.; He, Y.-A.; Liu, S.-S.; Li, M.; Li, Y.-M.; Zhao, J.-Z.; et al. Pore throat structure heterogeneity and its effect on gas-phase seepage capacity in tight sandstone reservoirs: A case study from the Triassic Yanchang Formation, Ordos Basin. Pet. Sci. 2023, 20, 2892–2907. [Google Scholar] [CrossRef]
  20. Pan, H.; Jiang, Y.; Guo, G.; Yang, C.; Deng, H.; Zhu, X.; Zeng, Q.; Song, L.; Cao, J.; Wang, Z.; et al. Pore-throat structure characteristics and fluid mobility analysis of tight sandstone reservoirs in Shaximiao Formation, Central Sichuan. Geol. J. 2023, 58, 4243–4256. [Google Scholar] [CrossRef]
  21. Huang, X.; Zhang, Y.; He, M.; Li, X.; Yang, W.; Lu, J. Asphaltene precipitation and reservoir damage characteristics of CO2 flooding in different microscopic structure types in tight light oil reservoirs. Fuel 2022, 312, 122943. [Google Scholar] [CrossRef]
  22. Yang, Y.; Yao, J.; van Dijke, M.I. Effect of reservoir rock wettability on microcosmic distribution of residual oil after gas displacement. Shiyou Xuebao/Acta Pet. Sin. 2010, 31, 467–470. [Google Scholar]
  23. Liu, Q.; Wu, K.; Li, X.; Tu, B.; Zhao, W.; He, M.; Zhang, Q.; Xie, Y. Effect of displacement pressure on oil–water relative permeability for extra-low-permeability reservoirs. ACS Omega 2021, 6, 2749–2758. [Google Scholar] [CrossRef]
  24. Eydinov, D.; Gao, G.; Li, G.; Reynolds, A. Simultaneous estimation of relative permeability and porosity/permeability fields by history matching production data. J. Can. Pet. Technol. 2009, 48, 13–25. [Google Scholar] [CrossRef]
  25. Zhang, N.; Yao, J.; Huang, Z.; Wang, Y. Accurate multiscale finite element method for numerical simulation of two-phase flow in fractured media using discrete-fracture model. J. Comput. Phys. 2013, 242, 420–438. [Google Scholar] [CrossRef]
  26. Fang, T.; Wang, M.; Gao, Y.; Zhang, Y.; Yan, Y.; Zhang, J. Enhanced oil recovery with CO2/N2 slug in low permeability reservoir: Molecular dynamics simulation. Chem. Eng. Sci. 2019, 197, 204–211. [Google Scholar] [CrossRef]
  27. Lin, B.; Wei, Y.; Gao, S.; Ye, L.; Liu, H.; Zhu, W.; Zhang, J.; Han, D. Current Progress and Development Trend of Gas Injection to Enhance Gas Recovery in Gas Reservoirs. Energies 2024, 17, 1595. [Google Scholar] [CrossRef]
  28. Shafiei, M.; Kazemzadeh, Y.; Escrochi, M.; Cortés, F.B.; Franco, C.A.; Riazi, M. A comprehensive review direct methods to overcome the limitations of gas injection during the EOR process. Sci. Rep. 2024, 14, 7468. [Google Scholar] [CrossRef] [PubMed]
  29. GB/T 28912-2012; Test method for two phase relative permeability in rock. General Administration of Quality Supervision, Inspection and Quarantine of the People’s Republic of China, Standardization Administration of the People’s Republic of China: Beijing, China, 2012.
Figure 1. Apparatus for measuring relative permeability curves.
Energies 17 04512 g001
Figure 2. Time-varying characteristics of relative permeability curves at different stages of gas displacement development. (a) Initial and early stages of gas displacement; (b) early and mid–late stages of gas displacement.
Energies 17 04512 g002
Figure 3. Relative permeability curves of oil and gas for different core properties and displacement parameters. (a) Core samples with different permeabilities; (b) permeabilities increased displacement pressure; (c) permeabilities increased displacement rate.
Energies 17 04512 g003
Figure 4. Planar and vertical distributions of residual oil saturation in the typical injection/production well group of the D reservoir.
Energies 17 04512 g004
Figure 5. Distribution of oil and gas saturation and historical matching curves of production indicators during gas drive/oil process. (a) Oil saturation (not considered), (b) gas saturation (not considered), (c) oil saturation (considered), (d) gas saturation (considered), (e) daily oil production (not considered), (f) daily oil production (considered), (g) daily gas production (not considered), (h) daily gas production (considered), (i) daily water production (not considered), and (j) daily water production (considered).
Energies 17 04512 g005
Figure 6. Distribution of fluid components and their properties at different development stages. (a) Light components (initial stage), (b) heavy components (initial stage), (c) crude oil viscosity, cp (initial stage), (d) interfacial tension, mn/m (initial stage), (e) light components (early stage), (f) heavy components (early stage), (g) crude oil viscosity, cp (early stage), (h) interfacial tension, mn/m (early stage), (i) light components (mid–late stage), (j) heavy components (mid–late stage), (k) crude oil viscosity, cp (mid–late stage), and (l) interfacial tension, mn/m (mid–late stage).
Energies 17 04512 g006aEnergies 17 04512 g006b
Figure 7. Effect of injection rate on development efficiency. (a) Gas saturation (20 × 104 m3/d), (b) gas saturation (30 × 104 m3/d), (c) gas saturation (40 × 104 m3/d), (d) gas saturation (50 × 104 m3/d), and (e) variation in cumulative oil production with cumulative gas injection at different injection rates.
Energies 17 04512 g007
Figure 8. Effect of injection pressure on development efficiency. (a) Planar distribution of gas saturation (50 mpa), (b) planar distribution of gas saturation (55 mpa), (c) profile distribution of gas saturation (50 mpa), (d) profile distribution of gas saturation (55 mpa), (e) variation in daily oil production with production time under different injection pressures, and (f) variation in cumulative oil production with production time under different injection pressures.
Energies 17 04512 g008aEnergies 17 04512 g008b
Table 1. Parameters of gas drive/oil experiments for core samples at various displacement stages.
PropertyVarious Displacement Stages
Initial Gas InjectionEarly Gas InjectionMid–Late Gas Injection
Displacement Rate (mL/min)0.010.010.01
Displacement Pressure (MPa)505050
Length (cm)4.936.086.08
Diameter (cm)2.462.452.45
Porosity (%)18.9420.6220.62
Permeability (mD)54.4754.3854.38
Minimum Gas Saturation (%)031.8828.94
Residual Oil Saturation (%)64.0029.5869.86
Table 2. Composition changes of well stream components at various gas injection stages.
Fluid PropertiesVarious Gas Injection Stages
November 2014November 2021November 2023
Well Stream Composition (%)C1 + N210.1869.1482.61
C2–C6 + CO269.1411.8619
C7+82.612.8314.56
Injected Gas CompositionNitrogen gasAssociated gasAssociated gas
Viscosity (mPa·s)2.200.631.41
Table 3. Parameters and test results of core gas drive/oil experiments.
Core SampleBaseline CoreHigh-Permeability CoreIncreased Pressure DisplacementIncreased Rate Displacement
Displacement Rate (mL/min)0.010.010.010.02
Displacement Pressure (MPa)50505550
Length (cm)6.086.856.086.08
Diameter (cm)2.452.452.452.45
Porosity (%)20.6221.1620.6220.62
Permeability (mD)54.38126.8554.3854.38
Connate Water Saturation (%)28.2428.628.3928.65
Residual Oil Saturation (%)28.9427.4526.1728.04
Gas drive/oil Efficiency (%)59.6761.5563.4660.70
Disclaimer/Publisher’s Note: The statements, opinions and data contained in all publications are solely those of the individual author(s) and contributor(s) and not of MDPI and/or the editor(s). MDPI and/or the editor(s) disclaim responsibility for any injury to people or property resulting from any ideas, methods, instructions or products referred to in the content.

