1. Introduction
A major challenge facing humans in the 21st century is how to strike a balance between the mitigation of environmental degradation and the achievement of sustainable economic growth [
1]. On one hand, creating and using sustainable energy solutions is increasingly being recognized as the greatest issue of our time [
2]. On the other hand, transportation is one of the main industries for energy consumption and carbon emissions, and the largest short-term energy savings are envisioned in transportation (25%) according to Holmberg and Erdemir’s research [
3]. The transformation of the transportation industry has become a hot topic.
New-energy vehicles (NEVs) play multiple vital roles in energy saving and emission reduction and are becoming the main direction for the global automotive industry’s transformation, upgrading, and green development [
4]. In response, the global automotive industry has proposed corresponding plans. In August 2021, the White House announced an order from President Biden that by 2030, sales of new-energy vehicles would account for half of the national car sales. On 28 March 2023, EU member states officially approved an agreement to ban the sale of new fossil-fuel vehicles by 2035. In 2022, the State Council of China released the 12th Five Year Plan for the Development of National Strategic Emerging Industries, which listed the new-energy vehicle industry as one of the seven strategic emerging industries in China.
Compared to the development history of fossil-fuel vehicles (FVs), NEVs are a completely new track, and there is still a long way to go in their development. Zhang Xiyong, General Manager of BAIC Group, divided the development of new-energy vehicles in China into four stages, covering a period of 30 years from 1992 to 2022 at the China EV100 Forum 2023 [
5], as shown in
Table 1.
However, some problems were encountered during the marketization stage of new-energy vehicles, including “mileage anxiety”, “insufficient charging facilities”, “slow charging speed”, “battery technology bottleneck”, “higher cost”, “lack of unified standards”, “consumer awareness and acceptance”, “limited performance in winter”, “immature second-hand car market”, “electrical power system pressure”, and “safety concerns” [
6,
7,
8,
9]. Various issues have led to a relatively low market penetration rate for new-energy vehicles, sourced from Global NEVS [
10], an expert in data service for the automotive industry.
Figure 1 shows the number of vehicles in the Chinese passenger car market.
As an emerging force in the automotive industry, NEVs, despite having many advantages and enormous development potential, are still in the early stages of development. This means that considering the market decisions of traditional FVs is crucial at the stage of NEV market diffusion. Traditional FVs have undergone years of development, with relatively strong market competition and a relatively stable and mature price system. If the pricing of NEVs is unreasonable, consumers may be more inclined to choose traditional FVs due to their existing consumption habits. Therefore, when pricing NEVs, it is necessary to comprehensively consider their own costs, market competition situation, and consumer-related factors. On the basis of comparing with and weighing against traditional FVs, a reasonable price that can ensure enterprise profitability, attract consumers, and promote market expansion should be found. Only in this way can NEVs gradually stand firm in competition with traditional FVs and achieve sustainable development.
As far as we know, the current research about NEV diffusion mainly focuses on policies, competition, and cooperation with FVs, as well as consumer-related factors, in which consumers are generally assumed as rational, which is inconsistent with the prospect theory. Moreover, the Stackelberg game method is often used to study the competition between manufacturers, retailers, and different channels, where one player is in a leading position and the others are followers. These Stackelberg game models also almost neglect irrational factors. Therefore, it is necessary to take into account the irrational factors of consumers and further analyze their impact on market decisions for NEVs and FVs.
The remainder of this paper is organized as follows.
Section 2 reviews the literature on NEV diffusion from different perspectives and identifies the research gap, which is the lack of research on introducing irrational factors into the game between NEVs and FVs.
Section 3 describes the research problem and constructs a pricing game model based on consumer loss aversion, which innovatively considers the factor of consumer loss aversion.
Section 4 solves and analyzes the proposed model, in which the backward induction method is used to solve the optimal decision strategy of each party in the game.
Section 5 presents the findings using a numerical example, in which the Python Sympy library is employed for calculation, simulation, and visualization.
Section 6 presents the results and discussions.
Section 7 concludes with implications for management and directions for future research.
2. Literature Review
In the first place, many studies have taken a policy perspective, and examined the impact of different policies on the NEV and FV markets.
On one hand, due to the high production cost and limited cruising range, the development of the NEV industry relies heavily on governments’ cash subsidy (CS) programs. At the same time, policymakers in several countries, including the United States (California) and China, have introduced carbon regulation (CR) to re-energize the NEV market. Zhu et al. [
11] found that CS and CR had different impacts on the consumer and production sides. Yang et al. [
12] found that consumer subsidies could produce a higher level of social welfare for the subsidy object than manufacturer subsidies. However, the related financial pressure faced by governments and brought by subsidies has also received attention. Since January 2017, China has begun to implement a subsidy back-slope, and the production and sales of NEVs have fallen sharply, down 69.1 and 74.4%, respectively compared with the same period the year before. Unfortunately, the development of the NEV industry was hit hard [
13]. Nevertheless, with an evolutionary game analysis on local governments and manufacturers’ behavioral strategies, Ji et al. [
14] studied the impact of phasing out subsidies for new-energy vehicles, finding that subsidy policy phase-outs could help to develop the NEV industry.
On the other hand, China’s dual-credit policy (DCP) has received a lot of attention. The DCP refers to “The Passenger Cars Corporate Average Fuel Consumption and New Energy Vehicle Credit Regulation” first issued in 2017, which restricts manufacturers’ production strategy by changing the cost composition of producing FVs and NEVs. For passenger car manufacturers with low average fuel consumption and a high proportion of new-energy vehicles, they achieve better point performance. The annual tally of positive points of enterprises can be transferred or traded according to certain rules in the “Fuel Consumption and New Energy Vehicle Points Management Platform” established by the Ministry of Industry and Information Technology, in order to obtain profits. The existence of credit cooperation relationship can effectively improve the diffusion of NEVs, especially when implementing a cooperative strategy that prioritizes helping manufacturers with low sale profits [
15]. Cheng and Fan [
16] formulated a Cournot competition production strategy as a benchmark competition model and three cooperation models (a unified production strategy, an FV priority production strategy, and an NEV priority production strategy) to investigate the strategic choices in production between competition and cooperation for a fuel vehicle (FV) automaker and a rival new-energy vehicle (NEV) automaker under the dual-credit policy, finding that cooperation in credit trading rather than competition in production proved to be the optimal strategy in any scenario for coping with risk in an unstable credit market.
Secondly, some studies explore the competitive and cooperative relationships between NEVs and FVs.
Tang and Liang [
17] considered the NEVs and FVs’ manufacturing as a simultaneous competitive game in big cities and analyzed the manufacturers’ production and pricing strategies under government intervention. Wang and Li [
18] constructed a three-stage Stackelberg game, in which the welfare-maximizing social planner acted as the leader to set the per unit subsidy or production regulation standard to maximize social welfare. Then, depending on the subsidy or the regulation standard, the manufacturer decided the optimal retail price to maximize their profits. Finally, consumers chose to buy the NEV/FV or to remain inactive. Ma et al. [
19] constructed a Nash bargaining game model based on an alliance negotiation strategy to demonstrate the coordination of the NEV supply chain, showing that the alliance between manufacturers was not to increase profits but to enhance their product advantages.
In addition to competition models, cooperation models are also under consideration to analyze the production decisions for NEV and FV manufacturing [
16]. Yu et al. [
15] established a double-layer complex network to depict the asymmetric competition and cooperation structure, and developed an evolution game model on network, to reveal the diffusion rule and trend of NEVs among manufacturers, indicating that the existence of credit cooperation relationship could effectively improve the diffusion of NEVs, especially when implementing a cooperative strategy that prioritized helping manufacturers with low sale profits.
Thirdly, consumer factors are also important for NEV diffusion.
Consumers’ low-carbon preference would affect their willingness to pay different prices for NEVs and FVs. By establishing pricing game models, Gong et al. [
20] found that consumers’ low-carbon preferences and the ratio of green consumers increased with the ex-factory and selling prices of NEVs. Zhang et al. [
21] identified the purchase motivations of potential NEV consumers and found that financial benefits, performance attributes, environmental awareness, and psychological needs were the four most important factors influencing consumers’ acceptance of NEVs. Afterwards, based on the 4C marketing theory, Wei et al. [
22] revealed through a questionnaire survey that various factors, including the price and environmental performance of NEVs, non-fiscal policies, vehicle performance, and consumer attributes such as education level and environmental awareness, influenced consumers’ willingness to purchase NEVs. The impact of consumers’ mileage anxiety on the diffusion and pricing of NEVs has also been mentioned in some studies [
6]. Moreover, there are close links and interactions among consumers’ attitudes, the construction of charging infrastructure, and the diffusion NEVs [
23].
In general, the current research mainly focuses on three aspects—policies, competition and cooperation, as well as consumers. Research on consumer-related factors mainly focuses on the study of their purchase intention or willingness and generally assumes that consumers are rational. However, Kahneman and Tversky [
24] empirically found that people tend to be loss-averse when making decisions, hence the prospect theory, where the value function is concave for gains, convex for losses, and steeper for losses than for gains. Thus, this paper takes consumer loss aversion into consideration in market decisions for NEVs and FVs, in order to explore the impact of consumer loss aversion on the pricing decisions and profits of both.
3. Problem Description and Model Construction
First of all, the methodology of this study is shown in
Figure 2.
Next, we describe the problem. Many global leading car companies, such as Porsche AG, Volvo, Mercedes Benz, General Motors, and Toyota, have set realistic decarbonization targets throughout their entire lifecycle, and producing both FVs and NEVs has become the current situation for many car companies. Therefore, our loss-averse pricing model describes the situation where the manufacturer can produce both NEVs and FVs. The manufacturer wholesales to retailers at prices
and
, respectively, where
is the production cost of NEVs, and
is the production cost of FVs. Due to different costs, NEV retailers and FV retailers then sell to consumers at different prices
and
as well (See
Figure 3).
The manufacturer is responsible for producing NEVs and FVs and determines the wholesale prices and that retailers need to pay. The retailers are responsible for selling NEVs and FVs and determine the retail prices and that consumers need to pay. Although the production cost of NEVs is currently higher than FVs, resulting in NEVs with the same performance being priced higher than FVs, with the development of technology, this phenomenon is expected to be broken. For now, compared to the development history of FVs, NEVs are still in an early stage of development. This means that in the early stage of NEVs, FVs dominate the automotive market, and NEV retailers have to make reasonable responses based on FV retailers’ market decisions. In other words, this is an FV retailer-led Stackelberg game under decentralized decision-making, where the FV retailers are the leader, and the NEV retailers are the followers and compete with each other.
Then, we use the product value to describe consumer utility, and we refer to the model proposed by Kahneman and Tversky [
24]. The proposed S-shaped value function is (i) defined on deviations from the reference point; (ii) generally concave for gains and commonly convex for losses; (iii) steeper for losses than for gains. A value function which satisfies these properties is displayed in
Figure 4.
3.1. Parameters and Symbol Definitions
Table 2 shows the parameters involved in this study.
3.2. Demand Calculation Based on Consumer Loss Aversion and the Hotelling Model
3.2.1. Utility Calculation Based on Consumer Loss Aversion
Given that consumers have more uncertainty when facing NEVs, we hypothesized that consumers were more susceptible to loss aversion in the NEV retail channel. On that basis, we developed a loss-averse consumer utility model.
Figure 5 shows the loss-aversion utility of the NEV product.
Since loss aversion is reference-dependent, we set the consumer’s reference position to
. When utility is greater than
, there is a loss. When loss-averse consumers want to avoid losses rather than achieve gains, we give a lower weight to utilities above the reference point. Therefore, the cumulative utility distribution is bent at an angle
,
. The higher the
k, the higher the degree of loss aversion. The utility function of NEV under consumer’s loss aversion is shown in Equation (
1):
3.2.2. Demand Calculation Based on the Hotelling Model
The Hotelling model is a linear (linear segment) market duopoly location model proposed by Harold Hotelling in 1929 from different space locations. It is one of the important models to solve the problem of site selection. At present, the Hotelling model has been applied to various spatial-position competition problems. In this study, consumers’ evaluations for NEVs and FVs were set in a linear space from 0 to 1, and then the corresponding market share could be calculated based on the Hotelling model by calculating the position of consumers without evaluation difference.
Assume that consumers’ evaluations of NEVs and FVs in the market are uniformly distributed, with 0 representing the highest evaluation of NEVs and 1 representing the highest evaluation of FVs, as shown in
Figure 6.
x or
is a marginal consumer under different conditions.
Consumers choosing products that do not match their preferences incur mismatch costs. This paper used
T to represent the unit mismatch cost. Thus, the overall consumer utility is shown in Equation (
2):
Next, we calculate market share under two different conditions. (i) If
, let
, that is,
; the following results can be calculated as:
The overall market demand is
Q, so the demand functions for the two types of vehicle are given by Equation (
3):
(ii) If
, let
, that is
, the following results can be calculated:
The overall market demand is
Q, so the demand functions for the two types of vehicle are given by Equation (
4):
4. FV-NEV Game Model under Consumers’ Loss Aversion
Compared to the development history of traditional FVs, although NEVs have many advantages and huge development potential, they are still in the early stages of development. In order to enter the existing vehicle market, the pricing of NEVs must be reasonably set based on the pricing of traditional FVs, so this is an FV retailers-led Stackelberg game under decentralized decision-making, where the FV retailers are the leaders, and the NEV retailers are the followers and compete with each other. If NEVs occupy more market share in the later stage and exceed a certain critical point, NEV retailers can also become the leaders while traditional FV retailers will become the followers.
In this FV retailers-led Stackelberg game, the manufacturer first decides on the supply prices for both. Then, the FV retailers are in the dominant position and make the pricing decision for FVs. Then, the NEV retailers make the corresponding decisions based on the FV retailers’ actions. That is, the manufacturer firstly decides the different prices and that the retailers need to pay. The FV retailers then set their own prices that the consumers need to pay. The NEV retailers then set their own prices based on . Next, based on the previously obtained demand for the FV and NEV channels, shown in Equations (3) and (4), the profits of the two channels can be further calculated.
(i) If
, this decision model can be described by the following optimization problem:
According to Equation (
3), this decision model can be described by Equation (
5):
(ii) If
, this decision model can be described by the following optimization problem:
According to Equation (
4), this decision model can be described by Equation (
6):
4.1. Model Solving
We used backward induction to solve the optimal decision strategy of each party in the game. Python’s Sympy library (the algebraic symbol computing library) was employed for the calculation.
(i) If
, by calculating the first and second derivatives of Equation (
5) concerning
and
, we obtain:
This is a convex function with a maximum value;
is obtained by the following equation:
Thus,
and bringing it back into Equation (
5),
Bringing Equation (
7) back into Equation (
5), we obtain:
Bringing Equations (7) and (8) back into Equation (
5), we obtain:
Bringing Equations (7) and (8) back into Equation (
3), we obtain:
(ii) If
, similarly to (i), we obtain:
4.2. Model Analysis
Through analysis, the following two propositions can be proven:
Proposition 1. When , the NEV price and the FV price are positively correlated with the unit mismatch cost T.
Proposition 2. When , the NEV price and demand are positively correlated with λ, while the FV price and demand are negatively correlated with λ.
5. Numerical Analysis
We used a numerical example to study the effects of different coefficients including the unit mismatch cost and loss-aversion coefficients on the equilibrium price, demand, and profit of each party in this two-channel decentralized game model. Python was used to analyze the sensitivity of the relevant parameters.
We used data from the Chinese government website (
https://www.gov.cn/) and the project report for cost benefit evaluation of electric vehicles in China (2020–2035) (
https://www.theicct.org.cn/publication/), accessed on 22 June 2024. The former provides production and sales data for 2023, while the latter provides cost data for different vehicles in 2019. We assumed that the costs in 2023 and 2019 remained basically unchanged and used this as a substitute for the cost data in 2023 for the subsequent simulation.
The total demand for vehicles in China in 2023 was , the cost of FV or the wholesale price of FV from the upstream manufacture was , the cost of NEV or the wholesale price of NEV from the upstream manufacture was . We further assumed that the value of the product (FV) was , the value of the product (NEV) was . We conducted simulations as described in the following subsections.
5.1. Effect of Loss-Aversion Coefficients on Price
To investigate the impact of the unit mismatch cost
T on price, we first set the values of the other parameters. Let the loss-aversion reference point be
and the loss aversion degree be
.
Figure 7 shows the effect of
T on price in an equilibrium state.
Figure 7 shows that the price of NEV and FV would increase as the unit mismatch cost
T increases. The reason for this result is that the increase in mismatch costs means that when consumers do not purchase products that match their preferences, the manufacturer and retailers need to pay more costs to make up for this mistake. For example, when consumers have a strong preference for NEVs but ultimately purchase FVs, this can lead to a deterioration in product reviews and word-of-mouth. In order to repair this deteriorating reputation, the manufacturer and retailers may have to invest more costs to make the situation better. In fact, they may have taken some measures before sales to reduce the probability of such mismatches, which could lead to an increase in product prices.
To investigate the impact of the loss-aversion reference point
on price, we first set the values of the other parameters. Let the loss aversion degree be
and the unit mismatch cost be
.
Figure 8 shows the effect of
on price in an equilibrium state.
Figure 8 shows that as the loss-aversion reference point
increases, the NEV price increases while the FV price decreases. When the reference point is very low, just above a very low point, consumers are affected by loss aversion, which hinders consumers from making purchasing decisions. In order to promote consumer purchasing, the NEV retailers will also set the price of NEVs at a relatively low point. While for the FV market, due to long-term development, its consumers are not affected by loss aversion, so the price can be set at a relatively high point. As the reference point moves up, the range within which consumers are affected by loss aversion also moves up, while the range that is not affected by loss aversion becomes larger. Therefore, the NEV retailers can set prices at relatively high levels to increase profits without considering the problems caused by loss aversion, while for FVs, a higher reference point means that NEVs have a greater market advantage, so the price is set at a lower point.
To investigate the impact of the loss-aversion degree
k on price, we first set the values of the other parameters. Let the unit mismatch cost be
and the loss-aversion reference point be
.
Figure 9 shows the effect of
k on price in and equilibrium state.
Figure 9 shows that as consumer loss aversion intensifies, the NEV price decreases while the FV price increases. Under the influence of consumer loss aversion in the NEV market, its impact is affected by
k. With the increase in
k, consumers’ final utility decreases more, which may eventually lead to consumers’ giving up buying because they cannot obtain enough utility. Therefore, with the increase in
k, the price of NEVs correspondingly decreases to make up for the utility loss of consumers, so as to attract consumers to make purchase decisions. On the other hand, the larger the
k, the more negative the impact the NEV consumers will suffer from loss aversion. However, this is an advantage for the FV market, so a higher FV price can be set.
5.2. Effect of Loss-Aversion Coefficient on Demand
To investigate the impact of the unit mismatch cost
T on demand, we first set the values of the other parameters. Let the loss-aversion reference point be
and the loss aversion degree be
.
Figure 10 shows the effect of
T on demand in an equilibrium state.
Figure 10 shows that when the unit mismatch cost
T is lower than 2000, with the increase in
T, the demand for NEVs decreases, but the demand for FVs increases. However, when the unit mismatch cost
T is greater than 2000, with the increase in
T, the demand for NEVs and FVs become stable, with only very small changes. This result is because in a relatively small range of
T, the final consumer utility of NEVs and FVs decreases with the increase in
T, but the utility loss of FVs is less, causing the margin of the FV market to expand, and on the contrary, the market margin of NEVs to narrow. However, when the unit mismatch cost
T continues to increase, the final consumer utility of NEVs and FVs is reduced too much, resulting in the difference between the two trends tending to be stable, that is, the demand for NEVs and FVs tends to be stable on the basis of the original trend.
To investigate the impact of the loss-aversion reference point
on demand, we first set the values of the other parameters. Let the loss aversion degree be
and the unit mismatch cost be
.
Figure 11 shows the effect of
on demand in an equilibrium state.
Figure 11 shows that as the loss-aversion reference point
increases, the demand for NEVs increases while the demand for FVs decreases. When the reference point is very low, just above a very low point, consumers are more cautious, reducing their willingness to purchase NEVs, which in turn affects the demand, which decreases. As the reference point moves up, the range within which consumers are affected by loss aversion also moves up, which means NEV consumers are less affected by loss aversion, resulting in increased demand. When the total market demand is fixed, the increase in NEV demand leads to the decrease in FV demand, that is, the trend shown in the figure.
To investigate the impact of the loss-aversion degree
k on demand, we first set the values of the other parameters. Let the unit mismatch cost be
and the loss-aversion reference point be
.
Figure 12 shows the effect of
k on demand in an equilibrium state.
Figure 12 shows that as consumer loss aversion intensifies, the demand for NEVs decreases while the demand for FVs increases. Under the influence of consumer loss aversion in the NEV market, its impact is affected by
k. With the increase in
k, the utility loss of consumers increases, which leads consumers to reduce their purchases because they cannot obtain enough utility, and it ultimately leads to the decline in demand. On the other hand, the larger the
k, the greater the negative impact of loss aversion on NEV consumers, which in turn increases the likelihood of consumers choosing FVs, ultimately leading to an increase in demand for FVs.
5.3. Effect of Loss-Aversion Coefficient on Profit
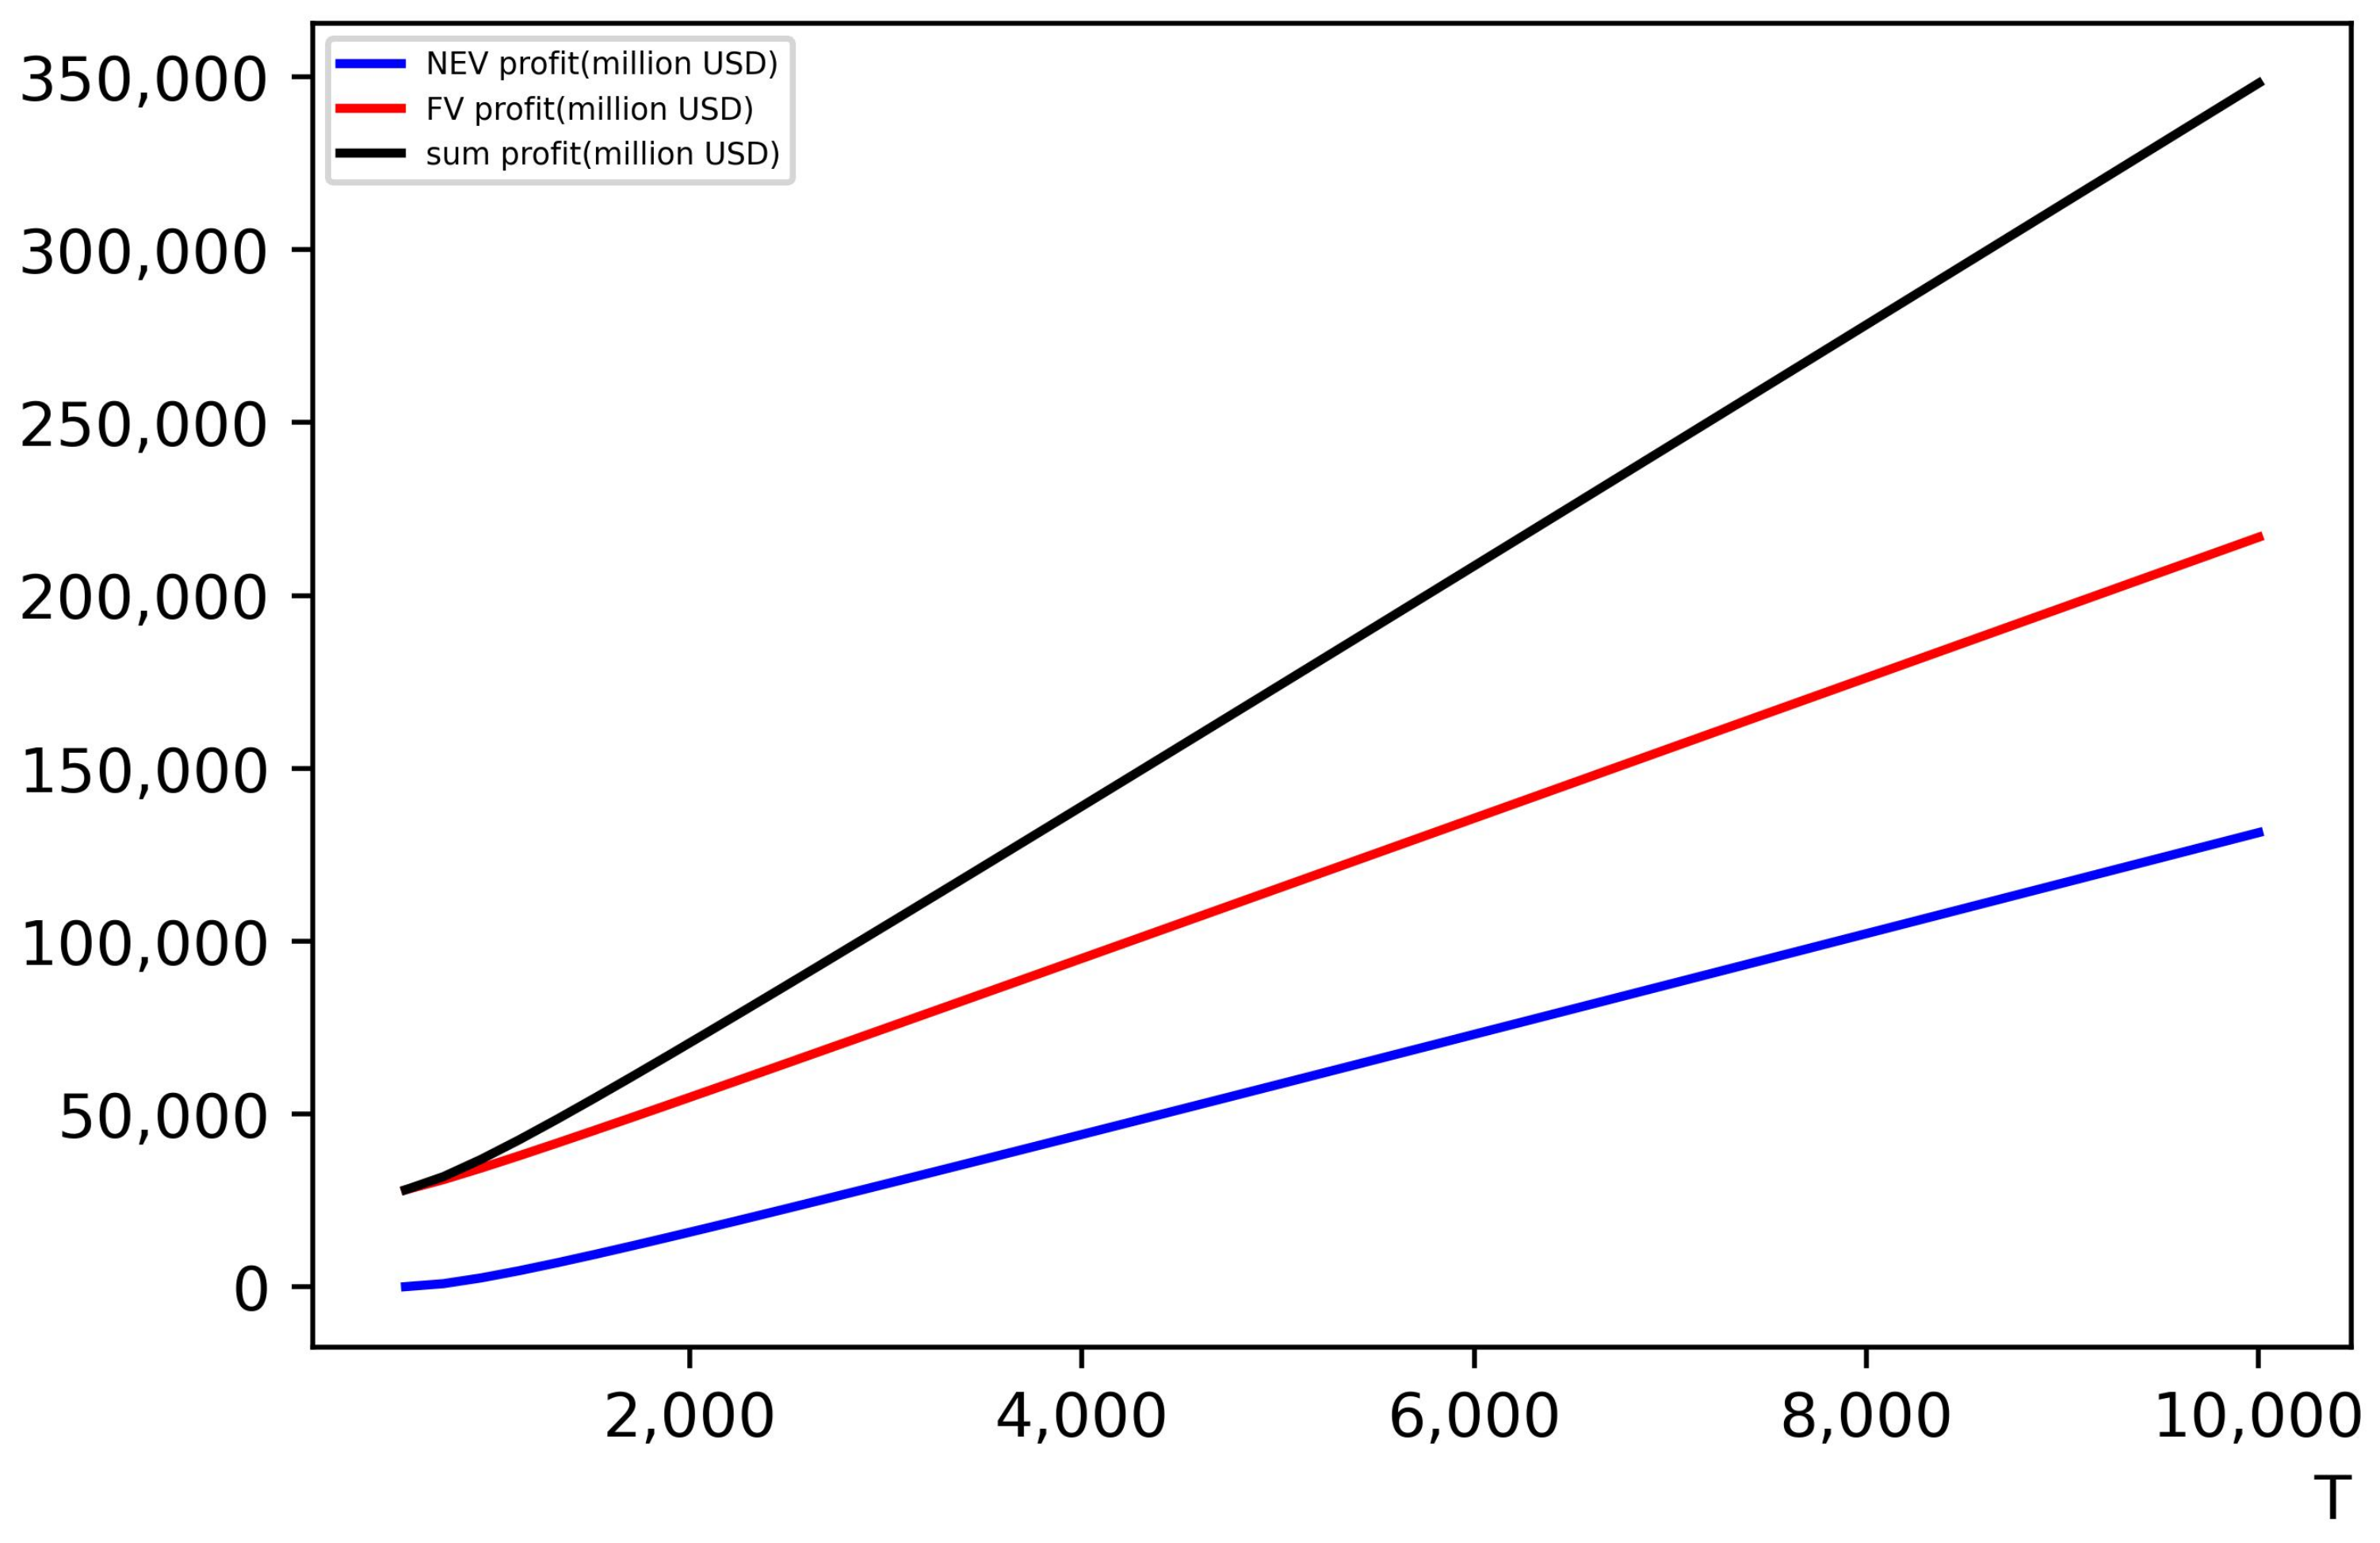
To investigate the impact of the unit mismatch cost
T on profit, we first set the values of the other parameters. Let the loss-aversion reference point be
and the loss aversion degree be
.
Figure 13 shows the effect of
T on profit in an equilibrium state.
To investigate the impact of the loss-aversion reference point
on profit, we first set the values of the other parameters. Let the loss aversion degree be
and the unit mismatch cost be
.
Figure 14 shows the effect of
on profit in an equilibrium state.
To investigate the impact of the loss-aversion degree
k on profit, we first set the values of the other parameters. Let the unit mismatch cost be
and the loss-aversion reference point be
.
Figure 15 shows the effect of
k on profit in an equilibrium state.
5.4. Validation of Results
Although the loss-aversion reference point
and
k theoretically exist, it is difficult to obtain specific quantitative data, so we cannot reproduce this result in reality based on all the set parameters. However, we can see this qualitative trend from recent sales data and explain it with the conclusions of this study.
Figure 16 shows another realistic sales data from different channels, sourced from a data platform for the automotive industry (
https://www.syhuaguan.com), accessed on 27 August 2024.
It can be seen that at the beginning, consumers’ lack of understanding of NEVs may lead to a relatively low level of loss aversion, that is, the parameter is relatively low, corresponding to a relatively low sales volume of NEVs. With the implementation of relevant policies and consumers’ more comprehensive understanding of NEVs, gradually increased, and the sales of NEVs also increased. Although the sales volume of FVs also increased, the growth rate of NEVs was generally higher than that of FVs, meaning that NEVs were constantly expanding and penetrating the automotive market. From January 2023 to January 2024, there was a process of continuous increase in and the penetration rate of NEVs, which is consistent with the results of the impact of on the market in this study. However, as we entered 2024, factors such as NEVs’ overcapacity, technological breakthroughs of batteries, some safety accidents, and the amplification effect of media news made consumers more averse to losses of NEVs in the market at that time, resulting in a sudden increase in k. It can be seen that in January and February of 2024, the growth rates of NEVs rapidly declined, both lower than those of FVs. According to our research, if NEV manufacturers and retailers had not adopted some strategies at that time, more consumers may have chosen FVs because they were concerned about the utility losses caused by these risks, which was a very unfavorable factor for NEVs at that time. Therefore, they actively launched a price war of exchanging price for quantity to compensate for the utility loss of consumers caused by these risks. The result was that although the sales of NEVs increased and the growth rate once again exceeded that of FVs, some costs were also paid. Some manufacturers with insufficient strength are currently struggling to survive, which will lead to a reshuffle in the automotive market. Small manufacturers will be eroded and unable to sustain until the end of the price war, while those top companies can recover their strength by continuously reducing k and increasing to expand the market again after the price war ends.
6. Results and Discussion
In recent years, the new-energy vehicle market has shown a rapid growth trend, but due to immature technology and industry development, its market share is far smaller than that of fuel vehicles. The market performance of NEVs has received attention from the industry and academia, both focusing more on the impact of policies. In research of the game between new-energy vehicle manufacturers and fuel-vehicle manufacturers, as well as decision-making models involving consumers, consumers and other game participants are almost always assumed to be rational. However, this is inconsistent with the prospect theory. This study aimed to explore the impact of irrational consumer factors on the diffusion of NEVs. Through literature review, the factor of loss aversion was selected.
Next, this study considered the manufacturers that could produce both NEVs and FVs simultaneously, as shown in
Figure 3. These manufacturers are becoming increasingly common globally, and China’s dual-credit policy for automakers was launched in this context to encourage them to produce more NEVs. Due to the different production costs of NEVs and FVs, these manufacturers wholesale to retailers at different wholesale prices
and
, and finally the retailers sell to consumers at different retail prices
and
.
Furthermore, referring to the Hoteling model, the market shares of NEVs and FVs were calculated. Subsequently, by introducing a loss-aversion factor into consumer utility calculations, the FV retailers-led Stackelberg game model was built.
Through model solving, we found the following:
(1) When , the NEV price and the FV price were positively correlated with the unit mismatch cost T.
(2) When , the NEV price and demand were positively correlated with , while the FV price and demand were negatively correlated with .
Additionally, we conducted numerical simulations on the model and found the following:
(1) Combining
Figure 13 with
Figure 7 and
Figure 10, it can be seen that as the unit mismatch cost
T increased, the price of NEVs and FVS increased, the demand for them decreased, and ultimately, their profits increased. The final utility obtained by consumers through purchasing NEVs or FVs was affected by mismatch costs. The higher the cost of mismatch, the greater the utility loss for consumers in the case of preference and product mismatch. The manufacturers and retailers would take reasonable measures to avoid such situations, thereby setting sales targets in a smaller and more matching market, so that each consumer group would obtain the utility of the preferred new products without being affected by mismatch costs. The increase in profits can be explained as the higher the unit mismatch cost
T, the more efforts the manufacturers and retailers make to avoid mismatches, thereby allowing products to exert positive externalities and ultimately gain more profits through better-matching markets and higher prices.
(2) Combining
Figure 14 with
Figure 8 and
Figure 11, it can be seen that as the loss-aversion reference point
increased, the price, demand, and profit of NEVs increased, while the price, demand, and profit of FVs decreased, and their sum profit also showed a downward trend. With the increase in
, the range of consumers affected by loss aversion became smaller, more consumers could overcome the utility loss caused by loss aversion, and the market demand of NEVs expanded, which then pushed the price of NEVs up through the change in the supply and demand relationship, and finally, this led to an increase in the profit. However, for FVs, this was a process of market erosion and profit loss. Interestingly, we found that with the increase in
, the total profits of NEVs and FVs would decrease. This may be because at the initial stage of NEVs entering the vehicle market, the FV market would remain the main market and occupy a leading position. The process of NEVs competing for the market would bring instability and risks to the vehicle market, resulting in a temporary decline in overall profits. With the gradual maturity and stability of the market, the overall profit would likely increase again.
(3) Combining
Figure 15 with
Figure 9 and
Figure 12, it can be seen that as the loss-aversion degree
k increased, the price, demand, and profit of NEVs decreased, while the price, demand, and profit of FVs increased, and their sum profit also showed an upward trend. Under the influence of consumer loss aversion, the degree of consumer utility loss was affected by
k. With the increase in
k, the utility loss of NEV consumers increased, which caused consumers to reduce their purchases due to insufficient utility, resulting in a reduction in market demand, price, and profit of NEVs, which was not conducive to NEV market competition. On the other hand, the greater the
k, the greater the negative impact of loss aversion on NEV consumers, which on the contrary was conducive to the stability and expansion of the FV market and ultimately led to an increase in the price, demand, and profits. Further, we found that with the increase in
k, the total profits of NEVs and FVs would increase. This may be because at the initial stage of NEVs entering the vehicle market, the FV market would remain the main market and occupy a leading position. The process of NEVs competing for the market would bring instability and risks to the vehicle market. With the increase in
k, the adverse situation in the NEV market would be more serious, while the existing vehicle market would become more stable, which would be conducive to the increase in total profits.
Overall, when consumers are not affected by the loss-aversion factor, the unit mismatch cost affects the market game between NEVs and FVs, while when consumers are affected by the loss-aversion factor, the reference point and loss-averse degree k affect this game in different ways.
7. Conclusions
7.1. Main Findings
NEVs represent a new force that cannot be ignored in the global automotive market. More and more traditional FV manufacturers are embracing such market changes and starting to produce NEVs and FVs at the same time. Compared with the development process of traditional FVs, although NEVs have many advantages and huge development potential, they are still in the early stage of development, forming a Stackelberg game under decentralized decision-making, in which FV retailers are the leaders and NEV retailers are followers, competing with each other. However, there is still the problem that consumers have more uncertainty when facing NEVs, resulting in consumers being more susceptible to loss aversion in the NEV retail channel. To solve this problem, we introduced the loss-aversion coefficient and constructed a loss-averse dual-channel pricing model based on the Hotelling demand model and the Stackelberg game led by the FV retailers. We found the following:
(1) When
, the NEV price
and the FV price
were positively correlated with the unit mismatch cost
T. Combining
Figure 12 with
Figure 6 and
Figure 9, we saw that as the unit mismatch cost
T increased, the demand for NEVs and FVs decreased, and ultimately, their profits increased.
(2) When
, the NEV price
and demand
were positively correlated with
, while the FV price
and demand
were negatively correlated with
. Combining
Figure 13 with
Figure 7 and
Figure 10, we saw that as the loss-aversion reference point
increased, the price, demand, and profit of NEVs increased, while the price, demand, and profit of FVs decreased, and their sum profit also showed a downward trend.
(3) Combining
Figure 14 with
Figure 8 and
Figure 11, we saw that as the loss-aversion degree
k increased, the price, demand, and profit of NEVs decreased, while the price, demand, and profit of FVs increased, and their sum profit also showed an upward trend.
Through the process of model solving and proof, we saw that the unit mismatch cost T and loss-aversion reference point were positively or negatively correlated with the prices and demand in the game’s equilibrium state. Furthermore, through numerical simulation, we saw more trend information including the effect of parameter k. Finally, we tried to use the research results to explain the sales data of the automotive market from January 2023 to 2024 and found that the trend in the real data was consistent with the conclusions of this study.
7.2. Limitations
This study has some limitations that highlight directions for further research.
(1) This study assumed that consumers’ evaluations of the product were uniformly distributed. Since advertising can affect consumers’ evaluations of products, it is necessary to further consider the effect of advertising or other factors on the distribution of consumers’ evaluations of products and thus on the results of pricing decisions.
(2) The proposed Stackelberg game model led by FV retailers assumed that this was the initial stage for NEVs to enter the market, and the total market demand was fixed. In fact, the market demand may expand or shrink due to other factors, and it is necessary to further consider the impact of total demand changes on these results.
7.3. Implications
We provide some suggestions from different perspectives.
On the one hand, when NEV consumers are not affected by loss aversion and the utility loss of the mismatch between consumer preferences and purchased products is large, both NEV and FV retailers should adjust their sales strategies to smaller markets and higher prices and provide better services to help consumers buy products that match their preferences to increase profits.
On the other hand, when NEV consumers are affected by loss aversion, moving up the reference point of consumer loss aversion and reducing the degree of loss aversion can help NEVs obtain a larger market share and increase profits. Therefore, NEV retailers should improve consumers’ understanding of their products through publicity and other means and eliminate some risk concerns of consumers about their products, so as to reduce the impact scope and intensity of consumers’ loss aversion. However, for FV retailers, this will lead to the erosion of their previously occupied market, so they should take reverse measures to maintain market stability in order to maintain profits.


